
Article

Soil Quality Assessment in Reclaimed Coastal Paddy Fields: A Case Study from Eastern China
1
Instrumental Analysis Center, Wenzhou Academy of Agricultural Sciences, Wenzhou 325006, China
2
Zhejiang Key Laboratory of Soil Remediation and Quality Improvement, Zhejiang A&F University, Hangzhou 311300, China
3
Agricultural and Rural Service Center, Liushi Town People’s Government, Wenzhou 325604, China
*
Authors to whom correspondence should be addressed.
Soil Syst. 2026, 10(9), 99; https://doi.org/10.3390/soilsystems10090099
Submission received: 11 July 2026 / Revised: 8 August 2026 / Accepted: 19 August 2026 / Published: 24 August 2026

Abstract

Assessing the soil quality of coastal reclamation areas is fundamental to alleviating land resource scarcity in coastal cities and ensuring food security. However, it remains unclear how to evaluate soil quality in reclaimed areas and identify factors driving its variation. In this study, paddy soils from four typical reclaimed coastal areas in China (Yueqing, YQ; Longgang, LG; Rui’an, RA; Longwan, LW) were investigated to construct a minimum data set via principal component analysis and to calculate soil quality indices (SQIs). YQ had higher contents of soil organic carbon (SOC: 22.82 g kg−1), total nitrogen (TN: 0.14 g kg−1), total water-soluble salts (TWS: 3.09 g kg−1), cation exchange capacity (CEC: 21.77 cmol(+) kg−1), and available Fe (44.23 mg kg−1), Mn (36.63 mg kg−1), Cu (30.31 mg kg−1), and Zn (8.79 mg kg−1) than the other sites. RA exhibited significantly higher activities of β-glucosidase (BG: 32.79 nmol g−1 h−1), xylanase (XYL: 5.88 nmol g−1 h−1), N-acetyl-β-D-glucosaminidase (NAG: 18.00 nmol g−1 h−1), leucine aminopeptidase (LAP: 27.01 nmol g−1 h−1), and acid phosphatase (PHOS: 54.50 nmol g−1 h−1) than the other sites (p < 0.05). LW had the greatest bacterial and fungal abundances, whereas LW displayed the highest fungal diversity. RA showed the highest SQI (SQIw: 0.49; SQIa: 0.48), followed by LW (SQIw: 0.47; SQIa: 0.47), LG (SQIw: 0.43; SQIa: 0.41), and YQ (SQIw: 0.38; SQIa: 0.41). Random forest analysis indicated that soil enzyme activities (XYL, NAG, BG, CB, PHOS), nutrients (TN, SOC, AN), fungal abundance and diversity, and TWS were key SQI predictors (Welch ANOVA p = 0.016), with XYL being the strongest predictor (p < 0.05). Collectively, soil quality in coastal reclamation areas is co-regulated by microbial metabolic activity, nutrients, and salinity, with soil enzyme activity serving as an important indicator for its assessment, thereby deepening the understanding of soil quality dynamics within these areas and enabling their sustainable management. However, the microbial mechanisms underlying these patterns across broader environmental gradients remain to be explored.

1. Introduction

Coastal land reclamation serves as a crucial strategy for advancing the development and use of coastal resources in many regions and countries worldwide, while ensuring food security in China [1] Between 1950 and 2008, approximately 13,380 km2 of coastal wetlands were reclaimed, and an additional 2470 km2 were planned or implemented between 2012 and 2020 [2,3,4] Reclaimed areas in coastal provinces, such as Zhejiang, Jiangsu, and Fujian, have become important bases for rice production [5]. Soils in coastal reclaimed areas worldwide are predominantly derived from silty marine sediments, characterized by chloride-dominated salinity. Regionally, Dutch polders are underlain mainly by marine mud, South Korean tidal flats by silty sediments, and Chinese coastal reclamations by saline coastal soils and saline tidal flat soils [6]. In the World Reference Base (WRB) for Soil Resources, these soils correspond largely to Solonchaks, while in the USDA Soil Taxonomy they are classified as Salids and Fluvisols [7]. The soils in Zhejiang Province are hydragric Anthrosols that developed from saline coastal soils after long-term desalination and cultivation, aligning with this global classification framework. However, soils in these areas are characterized by short formation times, complex parent materials, high salinity, and unstable physicochemical properties [1,4] These unfavorable conditions have could contribute to a limited comprehension of the regulatory mechanisms that affect soil quality, and the ecological functions of the microbial communities in these nascent soils remain poorly characterized. This significantly restricts rice yield and scientific land management in these regions [8]. A comprehensive assessment of soil quality that integrates both physicochemical and biological indicators is therefore urgently needed to guide rational land use and ensure food security in these ecologically fragile coastal zones. Therefore, a systematic assessment of soil quality in reclaimed coastal paddy fields and the identification of its important indicators are of great significance for guiding rational land use and ensuring food security in these areas.
Soil quality is defined as the ability of the soil to sustain productivity, maintain environmental quality, and support biological health across natural and managed ecosystems [9]. In this study, we adopted this concept and set the typical high-yield paddy fields that have undergone long-term desalination and cultivation as the reference benchmark for soil quality evaluation in reclamation. The physical and chemical properties of soil related to soil quality in reclaimed coastal areas have been systematically investigated [3,10,11] Reclamation has been demonstrated to substantially reduce soil water content and enhance soil porosity, thereby transforming the soil environment from anaerobic to aerobic [12]. This transition accelerates the mineralization of soil organic carbon (SOC) and consequently diminishes its content [13]. Fertilization and desalination measures implemented after reclamation favor SOC accumulation [10,14]. With increasing reclamation age, prolonged oxygen exposure enhances microbial metabolism, leading to a decrease in SOC content and easily oxidizable organic carbon contents. This results in increasing dissolved organic carbon and microbial biomass carbon content [4]. In addition, soil nitrogen and phosphorus levels also increase rapidly after reclamation [11,12]. Meanwhile, soil salinity and pH decrease rapidly, whereas soil redox potential increases significantly [15]. Collectively, these findings offer important support for understanding of the physical and chemical properties of reclaimed areas [4,16]. However, a soil quality evaluation system that integrates these dispersed indicators is still lacking. A comprehensive soil quality evaluation system is essential for formulating specific soil management strategies and ensuring soil health and crop productivity in these regions.
Soil microorganisms have the capacity for rapid perception and response to environmental fluctuations. Changes in their community structure, abundance, and diversity directly regulate soil ecological functions, such as the transformation and supply of soil nutrients, including carbon, nitrogen, and phosphorus [9,17,18,19]; Among soil microbiota, bacteria and fungi are the two dominant groups that play fundamental roles in regulating soil functions [20,21] Bacteria and fungi can decompose organic matter to release nutrients, produce organic acids to dissolve minerals, and secrete extracellular polysaccharides that bind to soil particles [20,21,22]. Soil enzyme activity reflects microbial function at the metabolic level, serving as a direct manifestation of soil microbial activity [22]. Soil microbial indicators have been widely applied in soil quality evaluations of farmland, forest, and grassland ecosystems [23]. In long-term fertilization experiments, soil enzyme activities and crop yields change rapidly, indicating their sensitivity to different management practices, and further reflecting the effects of these practices on soil quality and multifunctionality in continuous cropping systems [24]. In the assessment of heavy metal-contaminated soils, microbial diversity has been used as a core indicator of soil ecological risk [25]. During cropland restoration, shifts in fungal community composition drive improvements in the soil quality index [26]. However, soil microbial indicators and ecological functions have received little attention in studies on soil quality in reclaimed coastal areas [4,14], which severely constrains our understanding of soil quality evolution and leaves these regions without an effective early warning system. High salinity and low fertility in reclaimed coastal soils necessitate the use of sensitive biological indicators that can provide early warning of degradation, supporting policy-driven needs for sustainable soil management.
In this study, all soil samples were collected from four typical reclaimed coastal areas in China: Yueqing (YQ), Longgang (LG), Rui’an (RA), and Longwan (LW). A total of 24 soil physical, chemical, and microbiological properties were measured in this study. Subsequently, a minimum dataset (MDS) was established using principal component analysis (PCA), and soil quality indices (SQIs) were calculated. Random forest modeling was applied to show the importance of predictors for SQIs. This study aimed to construct a soil quality assessment system for paddy fields in coastal reclamation areas and to identify the variables associated with soil quality changes. We hypothesized that (1) soil quality is governed by the integrated effects of soil microbial metabolic activity, salinity, soil nutrients, showing significant spatial heterogeneity among different reclaimed coastal paddy fields; and (2) soil microbial indicators would be more sensitive predictors of soil quality in reclaimed coastal paddy fields than soil physicochemical properties. We acknowledge that our study was based on a single sampling and a limited number of sites, which may restrict how widely the findings can be applied across different locations. Nonetheless, this study offers new insights by establishing soil microbial indicators as key predictors for soil quality assessment in reclaimed coastal areas.

2. Materials and Methods

2.1. Study Site and Soil Sampling

Surface paddy soil samples were collected from coastal reclamation areas in YQ (28°07′ N, 120°57′ E), LW (28°01′ N, 120°42′ E), LG (27°30′ N, 120°23′ E), and RA (27°40′ N, 120°10′ E), Zhejiang Province, China (Figure 1). YQ, LW, LG and RA have a temperate humid subtropical climate with mean annual temperatures of 17.7 °C, 19.9 °C, 17.4 °C and 19.9 °C, and precipitation of 1507 mm, 1501 mm, 1804 mm and 1568 mm, respectively. The mean annual evaporation ranges from 860 to 995 mm [27]. The study areas consist of an alluvial plain, alluvial–proluvial valley plain and marine deposition plain with an elevation of 2–5 m above mean sea level (Tables S1 and S2). The groundwater in the study areas is formed of unconsolidated rock pore phreatic water and confined water, with depths of 0.4–2.5 m and 3–12 m, respectively [28]. According to the WRB 2022 classification, the soils in this study have evolved from Fluvic Gleyic Solonchaks (Hypersalic, Sodic), typical of marine tidal flat sediments, into Eutric Hydragric Anthrosols (Protosalic, Fluvic, Gleyic) after approximately 5–8 years of desalinization and paddy rice cultivation [6]. Before reclamation, the soil profile exhibited an A–C horizon sequence with a distinct absence of the B horizon, indicating an early stage of pedogenesis dominated by sedimentary accumulation with limited horizon differentiation and low overall development. Following reclamation, the profile transformed into an A–Ap–B–C sequence with the neo-formation of both Ap and B horizons, reflecting substantially accelerated pedogenesis under anthropogenic intervention and a markedly enhanced degree of soil development (Figure S1). Organic–inorganic combined fertilization was applied at all sampling sites. In YQ, a basal fertilizer for early rice was applied in mid-April each year, and for late rice in mid-July. Each application consisted of 375 kg ha−1 of compound fertilizer (nitrogen: phosphorus: potassium = 15:15:15) and 1500 kg ha−1 of commercial organic fertilizer. Topdressing was applied as urea at 225 kg ha−1 20 days after transplanting. In LG, the same basal timing was followed, with compound fertilizer at 350 kg ha−1 and organic fertilizers at 1500 kg ha−1. Topdressing with urea was applied at 200 kg ha−1. In RA, a basal fertilizer for early rice was applied in late April and for late rice in late July, with compound fertilizer applied at 400 kg ha−1 and commercial organic fertilizer at 1800 kg ha−1. Topdressing with urea was applied at 250 kg ha−1. In LW, a basal fertilizer for early rice was applied in mid-April and for late rice in mid-July, with compound fertilizer applied at 375 kg ha−1 and commercial organic fertilizer at 1500 kg ha−1. Topdressing with urea was applied at 225 kg ha−1. The commercial organic fertilizers contained on average 370 g kg−1 total organic carbon, 2.01 g kg−1 total nitrogen, 2.31 g kg−1 total phosphorus, and 1.21 g kg−1 total potassium (Table S5). The fertilizer was commercially obtained from an organic fertilizer manufacturer and was primarily composed of agricultural wastes (i.e., cattle manure, chicken manure, cottonseed hulls, and crop straw) that had undergone microbial fermentation and controlled decomposition. Irrigation and drainage followed the typical rice-paddy practice in the region (flooding during the growing season with mid-season drainage, and open-ditch discharge through tidal sluices), with pest control implemented through integrated pest management (IPM) strategies. Soil samples were collected after the late rice harvest in November 2024. In each study area, 9, 18, 9, and 13 sampling sites were randomly selected in YQ, LW, LG and RA based on the consistency of reclamation history and land use patterns, respectively. For each land use type, independent sampling plots (50 m × 50 m) were randomly established with a minimum distance of at least 100 m between plots to ensure spatial independence. With each replicate plot, five quadrats (2 m × 2 m) were positioned at the four corners and the center point using a five-point sampling method design. Soil cores (0–20 cm) were collected from each quadrat and mixed to form one composite sample per plot. Therefore, the experimental design yielded 9, 18, 9, and 13 true replicate samples (n = 9, 18, 9, 13) for the four land use types. A total of 49 soil samples were collected. Soil samples were placed into sterile self-sealing bags. After being transported to the laboratory in an icebox, samples were stored at 4 °C. Samples were sieved through a 2 mm mesh with stones and plant roots removed. Each sample was then parted into three portions: one portion was stored at 4 °C for enzyme activity analysis; the second portion was air-dried for physicochemical property analysis; the third portion was stored at −80 °C for microbial DNA extraction.
Therefore, the findings reveal spatial variability in soil quality and its correlations with environmental factors, rather than causal relationships between reclamation practices and soil quality changes. The evolution of soil quality following reclamation is a long-term process, and future studies incorporating temporal monitoring or a chronosequence of reclamation ages are needed to validate the observed trends. Nevertheless, this study provides a baseline assessment of soil quality in coastal reclamation areas and identifies key indicators closely associated with soil quality variation.

2.2. Analysis of Soil Physical, Chemical, and Biological Indicators

Soil bulk density (BD) was determined by the cutting ring method. Soil pH was determined using distilled water (soil/water 1:2.5) with a combined electrode. SOC was analyzed using potassium dichromate oxidation followed the NY/T 1121.6-2006 standard [29], and quality control procedures were implemented accordingly. Total nitrogen (TN) was assessed following the Kjeldahl method. Available nitrogen (AN) was determined by the alkaline diffusion method. Available phosphorus (AP) was determined by the Olsen method based on the results of pH testing (all samples > 7.5). Available potassium (AK) was extracted using ammonium acetate (NH4OAc) and quantified by flame photometer. Cation exchange capacity (CEC) was measured by the hexaamminecobalt (III) chloride extraction spectrophotometric method. Total water-soluble salts (TWSs) were determined gravimetrically. Available iron (Fe), available manganese (Mn), available copper (Cu) and available zinc (Zn) were extracted by diethylene triamine pentaacetic acid (0.005 mol L−1) and analyzed by flame atomic absorption spectroscopy [30].
Enzyme activities were determined following the method reported by Saiya-Cork [31]. The enzymes assayed included four carbon-degrading enzymes (α-glucosidase, AG; β-glucosidase, BG; β-D-cellobiosidase, CB; β-xylosidase, XYL), two nitrogen-degrading enzymes (β-N-acetylglucosaminidase, NAG; leucine aminopeptidase, LAP), and one phosphorus-degrading enzyme (acid phosphatase, PHOS). Enzyme activities were quantified using substrates labeled with 4-methylumbelliferyl (MUB) and 7-amino-4-methylcoumarin (MUC). All enzyme activities were expressed as nmol h−1 g−1 of dry soil [32].

2.3. DNA Extraction and High-Throughput Sequencing

Microbial DNA was extracted from a 0.3 g soil sample using a PowerSoil DNA isolation kit (MoBio Laboratories Inc., Carlsbad, CA, USA), following the manufacturer’s protocol. The extracted DNA was further purified by an OMEGADNA kit (Omega Bio-Tek, Inc., Norcross, GA, USA). DNA concentration and purity were determined by NanoDrop ND-1000 spectrometry (Thermo Fisher Scientific, Wilmington, DE, USA). The abundances of bacteria and fungi were quantified by quantitative polymerase chain reaction (qPCR) targeting the bacterial 16S rRNA gene and the fungal internal transcribed spacer (ITS) region with the primer sets 515F/806R [33] and ITS1/ITS2 [34,35], respectively. Each 25 μL qPCR reaction mixture contained 1–10 ng of template DNA, 0.2 μL of each primer, and 12.5 μL of SYBR Premix Ex Taq™ (Takara Bio Inc., Ostu, Shiga, Japan), Amplification was performed on a CFX 96™Real-Time System (Bio-Rad Laboratories, Inc., Hercules, CA, USA). The amplified products of quantitative qPCR were recovered by agarose gel electrophoresis, ligated into the pEASY-T3 vector, and then transformed into Escherichia coli DH5α competent cells. Positive clones were screened on ampicillin-containing plates using blue-white colony screening, and selected positive clones were sequenced. The confirmed positive clones were cultivated for plasmid DNA extraction, and the concentration and purity (OD260/OD280) were determined using a microspectrophotometer. The recombinant plasmids were serially diluted to concentrations ranging from 10−2 to 10−7 ng μL−1 and used as standards for qPCR targeting the 16S rRNA genes andITS1 regions. A single peak in the melting curve confirmed that the qPCR conditions met the required standards and that the primer specificity was satisfactory. The qPCR amplification efficiencies for the 16S rRNA genes and the ITS1 regions were determined to be 96.6% and 98.9%, respectively, with a standard curve correlation coefficient greater than 0.995.
The bacterial and fungal community diversity was analyzed by Illumina MiSeq sequencing (Illumina Inc., San Diego, CA, USA). The biodiversity of both domains was quantified using the Shannon index. The V4 region of bacterial 16s rRNA and fungal ITS1 were amplified with primer sets 515F/806R [33] and ITS1/ITS2 [35,36], respectively. PCR was performed in triplicate for each sample in a 25 μL reaction volume, containing 10 ng template DNA, 2.5 μL of PCR buffer, 1 μM of each primer, and 0.5 U TaKaRa-ExTaq (TaKaRa Bio Inc., Otsu, Shiga, Japan). PCR products were verified on 1.5% agarose gel, purified, and mixed in equimolar amounts. Samples were then sequenced on an Illumina MiSeq PE250 platform using paired-end reads (2 × 250 bp). Raw sequencing data were processed using QIIME2 [33]. Sequences of less than 50 bp, an average quality score below 30, or mismatches within barcodes or primers were discarded. Remaining paired-end reads were merged using FLASH requiring a minimum overlap of 10 bp and a mismatch rate below 5%. Chimeric sequences were identified and removed with USEARCH during clustering [37]. High-quality sequences were clustered into operational taxonomic units (OTUs) at a 97% similarity threshold using the UPARSE algorithm. Based on the OTU table, the Shannon index was calculated for both soil bacterial and fungal communities within the QIIME2 (version 2024.2). The raw sequence data of bacterial and fungal genes have been deposited in the NCBI Sequence Read Archive (SRA) under accession numbers PRJNA1463562 and PRJNA1463964, respectively.

2.4. Soil Quality Evaluation

2.4.1. Indicator Scoring and Weighting

PCA and Pearson correlation analysis were used to construct the minimum dataset (MDS), wherein MDS is a representative set of parameters reflecting soil quality. Pairwise comparisons were conducted using Tukey’s HSD test when Levene’s test indicated equal variances; otherwise, post hoc test was employed. In this study, principal components (PCs) with eigenvalue ≥ 1 were selected. For each selected PC, soil variables whose absolute factor loading was within 10% of the highest factor loading were retained [23,38]. For variables loading on the same PC, pairwise Pearson correlation coefficients were examined. If all pairwise correlations were below 0.6, all such variables were retained for MDS; otherwise, only the variable with the highest factor loading were kept.
To eliminate the effects of differing scales, all the data were normalized. Subsequently, membership functions were established based on different indicators: indicators positively correlated with soil health were assigned S-type (ascending) membership function (Equation (1)), including SOC, TN, AN, AP, AK, CEC, AG, BG, CB, XYL, LAP, NAG, PHOS, bacterial abundance, fungi abundance, bacterial Shannon index and fungal Shannon index; indicators with negative correlations with soil quality were reverse-S (descending) membership functions (Equation (2)), including TWS. Fe, Mn, Cu, Zn, BD and pH followed parabolic functions (Equation (3)). The Technical Specifications for Cultivated Land Fertility Survey and Classification of Standard Farmland in Zhejiang Province summarize the threshold values for parabolic function, with L1/U1/U2/L2 defined as the lower limit, optimum range, and upper limit, respectively (Table S6).
f x = 0.1 , x < L 0.1 + 0.9 × x L U L , L x U 1.0 , x > U
f x = 1.0 , x < L 0.1 + 0.9 × U x U L , L x U 0.1 , x > U
f x = 0.1 , x < L 1 , x > U 2 0.1 + 0.9 × x L 1 U 1 L 1 , L 1 x U 1 , 1.0 , U 1 x L 2 , 0.1 + 0.9 × U 2 x U 2 L 2 , L 2 x U 2 .
Given the differential impacts of soil variables on soil quality assessment, it is essential to assign appropriate weights to each variable to accurately reflect its importance. The communality (ranging from 0 to 1) represents the proportion of its variance explained by the retained PCs. These communalities were then used as the basis for calculating the weights of MDS. Weights were calculated as
W i = C i / i = 1 n C i
where Wi represents the indicator weight, Ci represents the commonality of the indicator, and n represents the number of indicators in the MDS indicators.

2.4.2. Calculations of SQI

SQI is an extensive indicator of soil quality. High levels of SQIs reflect superior soil quality. SQI values ≥ 0.70 are considered very high, 0.70–0.55 medium, <0.55 low based on the classification criteria by Marzaioli [39].
The calculated indicator scores were integrated into an index through additive (SQIa) and weighted (SQIw) methods according to Equations (5) and (6), respectively [38,40].
S Q I a = i = 1 n U i /   n
S Q I w = i = 1 n W i × U i
where SQI is the soil quality index, Wi is the weight assigned to each variable, Ui is the transformed score for each indicator, and n is the number of variables in the MDS.

2.5. Statistical Analysis

One-way analysis of variance (ANOVA) was employed to examine differences in soil physical, chemical and biological properties and overall soil quality across the four sampling sites. Prior to one-way ANOVA, all variables were standardized. Levene’s test was performed to assess the homogeneity of variances. When significant heteroscedasticity was detected (p < 0.05), Welch’s ANOVA was applied as a robust alternative, with Tamhane’s T2 post hoc test for multiple comparisons. For indicators satisfying the homogeneity assumption, standard ANOVA with Tukey’s HSD post hoc test was used (Table 1 and Table 2). Pearson correlation analysis was performed to examine the relationships among soil quality indicators. Random forest (RF) was carried out in R to assess the importance of indicators in SQIs [41]. Higher percentage increases in mean squared error (%IncMSE) indicate a strong influence on the SQI. The overall significance of the RF model was evaluated using the A3 package with 5000 permutations [42]. The significance of predictor variables was assessed using the rfPermute package (version 2.5.1) in R (version 4.3.1) [43]. Pearson correlation, PCA, and multiple regression were performed using SPSS 21.0. All bivariate correlations reported in this study were treated as exploratory. No correction for multiple testing was applied, and the presented p-values are unadjusted. These analyses were intended to reveal broad patterns and generate hypotheses regarding relationships among soil properties and the soil quality index components. No confirmatory conclusions are drawn solely from the correlation results.

3. Results

3.1. Soil Physical and Chemical Indicators

Physical and chemical indicators differed significantly among the four sampling sites. YQ had the highest SOC, Fe, Mn, Cu and Zn. Compared to LG, RA and LW, the contents of Cu and Zn were 77.86%, 45.51%, 36.85% and 62.05% higher, respectively (Table 3). AK was the highest in LG compared to YQ, RA and LW. Conversely, the contents of SOC, TN, Cu, and Zn in LG were lower than those at the other sites. CEC, Fe and Mn in RA were lower than YQ, LG and LW. AK and TWS in LW were lower than YQ, LG and RA. There were no significant differences between pH, AN, AP, and BD at the four sites.

3.2. Soil Biological Indicators

YQ had the lowest bacterial abundance, fungal abundance, content of BG, XYL, NAG and PHOS among all sampling sites. LG showed the lowest bacterial diversity and activities of AG and CB. RA had the lowest fungal diversity, while LW displayed the lowest LAP activity. In contrast, YQ showed the highest activities of AG and CB. The highest activities of BG, XYL, NAG, LAP, and PHOS were observed in RA. LW had the highest bacterial abundance, fungal abundance, bacterial diversity and fungal diversity (Table 4).

3.3. Minimum Data Set

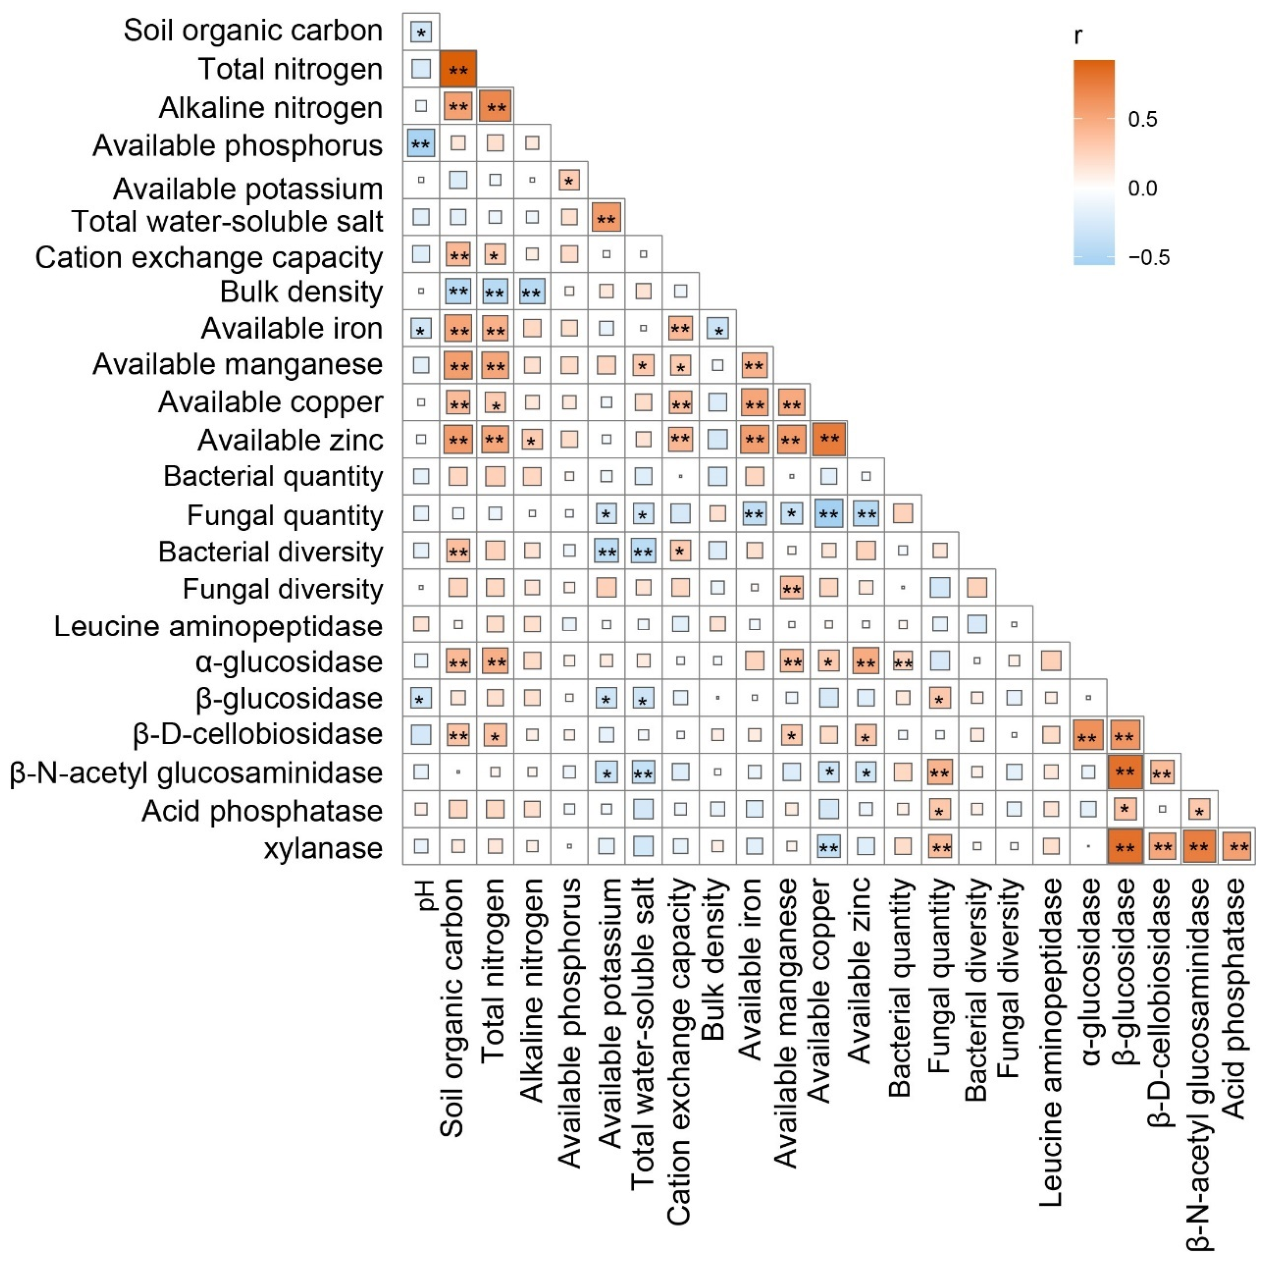
PCA extracted seven PCs with eigenvalues > 1, together explaining 74.54% of the total variance. Within each PC, variables within 10% factor loading were retained for the MDS (Table 5). The PC1 explained 22.28% of the total variance and comprised three indicators with high factor loadings, namely SOC, TN and Zn. Zn had the highest factor loading among the three and showed low correlations with the other two indicators (r < 0.6) (Figure 2). SOC, TN and Zn were selected as the representative variables for PC1 to enter the MDS. The PC2 explained 17.98% of the total variance and comprised three indicators with high factor loadings, namely BG, NAG, and XYL. BG had the highest factor loading among the three and was highly correlated with the other two indicators (r > 0.8). Therefore, BG was selected as the representative variable for PC2 to enter the MDS. The PC3 explained 9.59% of the variance and included four high-loading indicators, i.e., AK, TWS, bacterial diversity, and CB. Bacterial diversity exhibited the highest factor loading but was weakly correlated with the other three indicators (r < 0.6). Thus, all four indicators were chosen as representative variables for PC3 in the MDS. The PC 4 accounted for 7.62% of the variance, with pH being the only high-loading variable and therefore directly entering the MDS. The PC5 explained 7.07% of the total variance. AN, AK, and CB were the three high-loading indicators on PC5 and were weakly correlated with one another (r < 0.6). Thus, all three were retained as representative variables for PC5 in the MDS. The PC 6 explained 5.73% of the total variance. Bacterial quantity and fungal diversity were high factor loadings with weak correlations (r < 0.6), so both were included. The PC 7 explained 4.27% of the variance. Fungal diversity had the highest factor loading on PC7 and was chosen as its representative variable for inclusion in the MDS. The final MDS consisted of pH, SOC, TN, AK, TWS, AN, available Zn, bacterial quantity, bacterial diversity, fungal diversity, BG, and CB.

3.4. Calculation of Soil Quality Indices

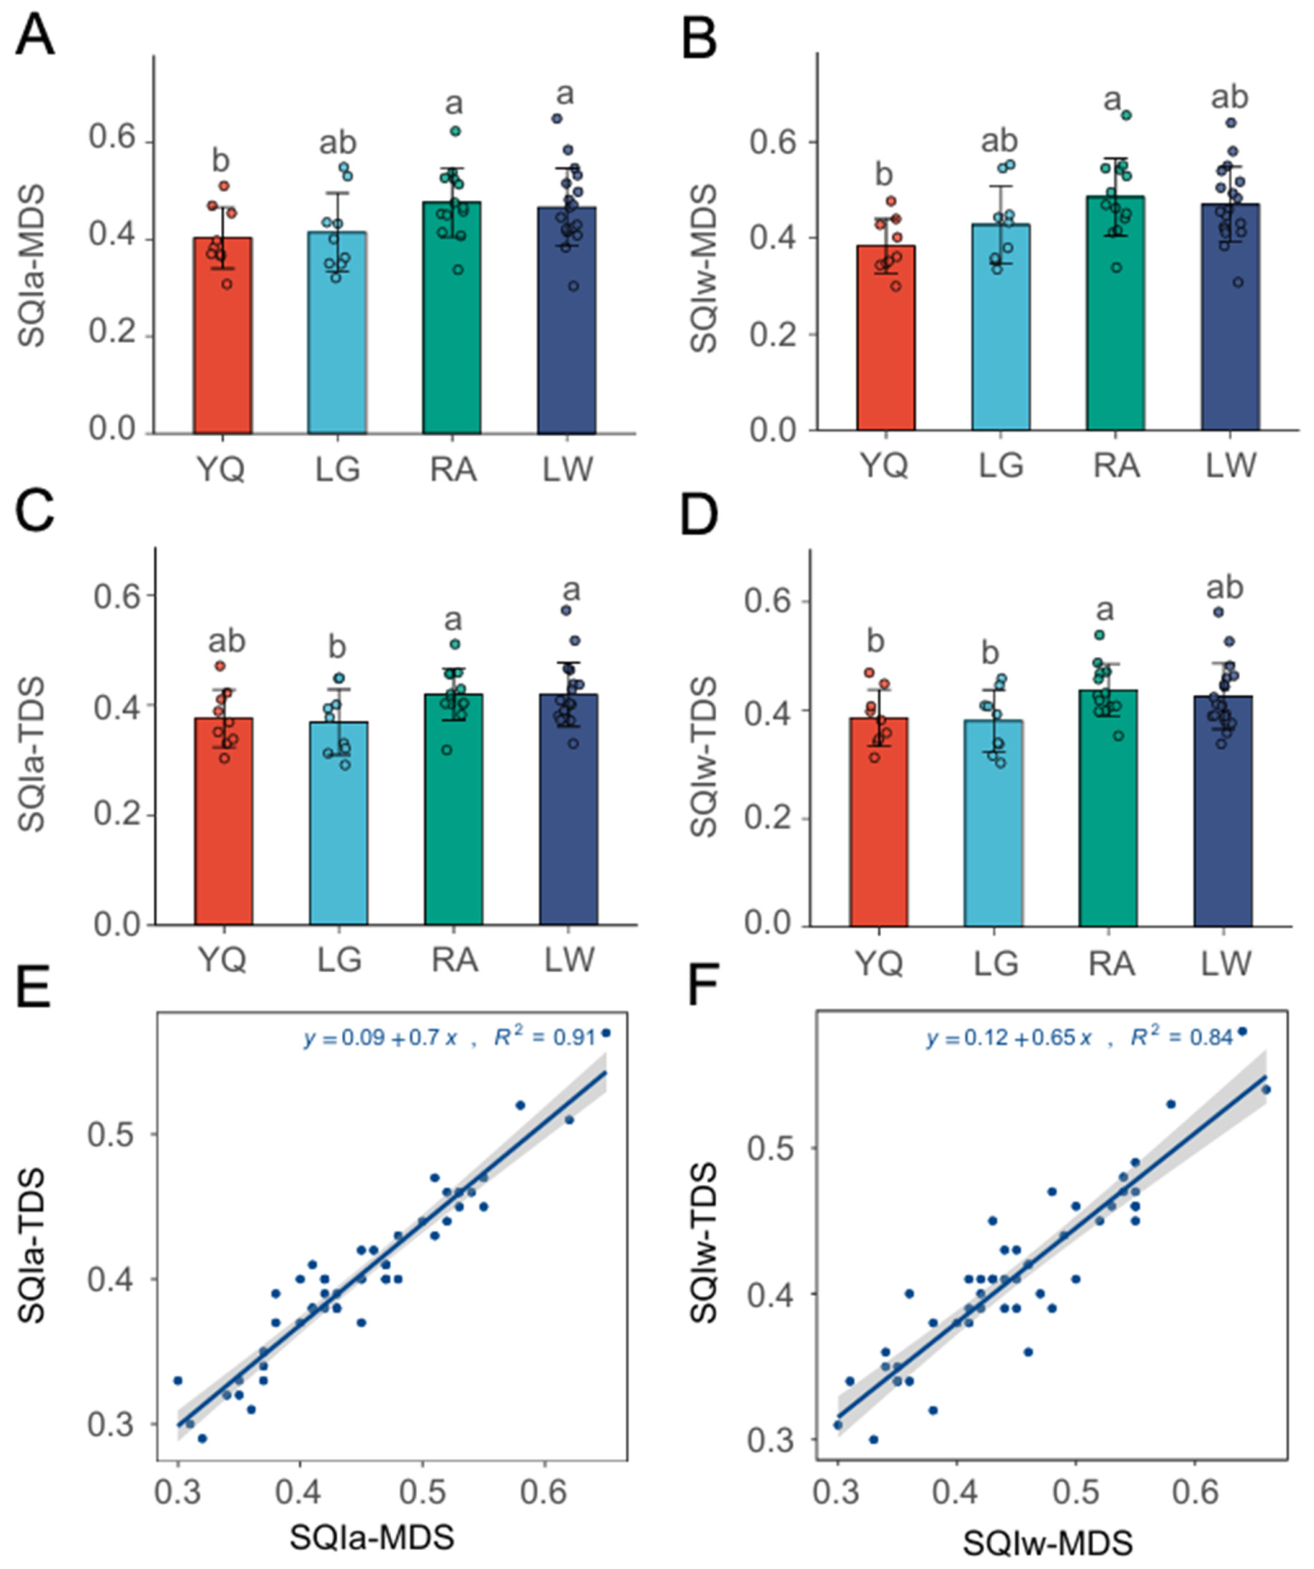
Indicator weights for the MDS variables were calculated as 0.10 (pH), 0.05 (SOC), 0.06 (TN), 0.06 (AN), 0.09 (AK), 0.06 (TWS), 0.05 (AZn), 0.11 (bacterial quantity), 0.11 (bacterial diversity), 0.16 (fungal diversity), 0.06 (BG) and 0.09 (CB) (Table 6). RA showed higher soil quality (SQIa: mean 0.48; SQIw: mean 0.49) than LW (SQIa: mean 0.47; SQIw: mean 0.47), LG (SQIa: mean 0.41; SQIw: mean 0.43), and YQ (SQIa: mean 0.40; SQIw: mean 0.38), with no significant difference between RA and LW (Figure 3). The SQI in YQ was the lowest among all sampling sites (Figure 3A–D). Linear regression analysis demonstrated a significant positive correlation between SQIa-MDS and SQIa-TDS (R2 0.91), as well as between SQIw-MDS and SQIw-TDS (R2 0.84) (Figure 3E,F).
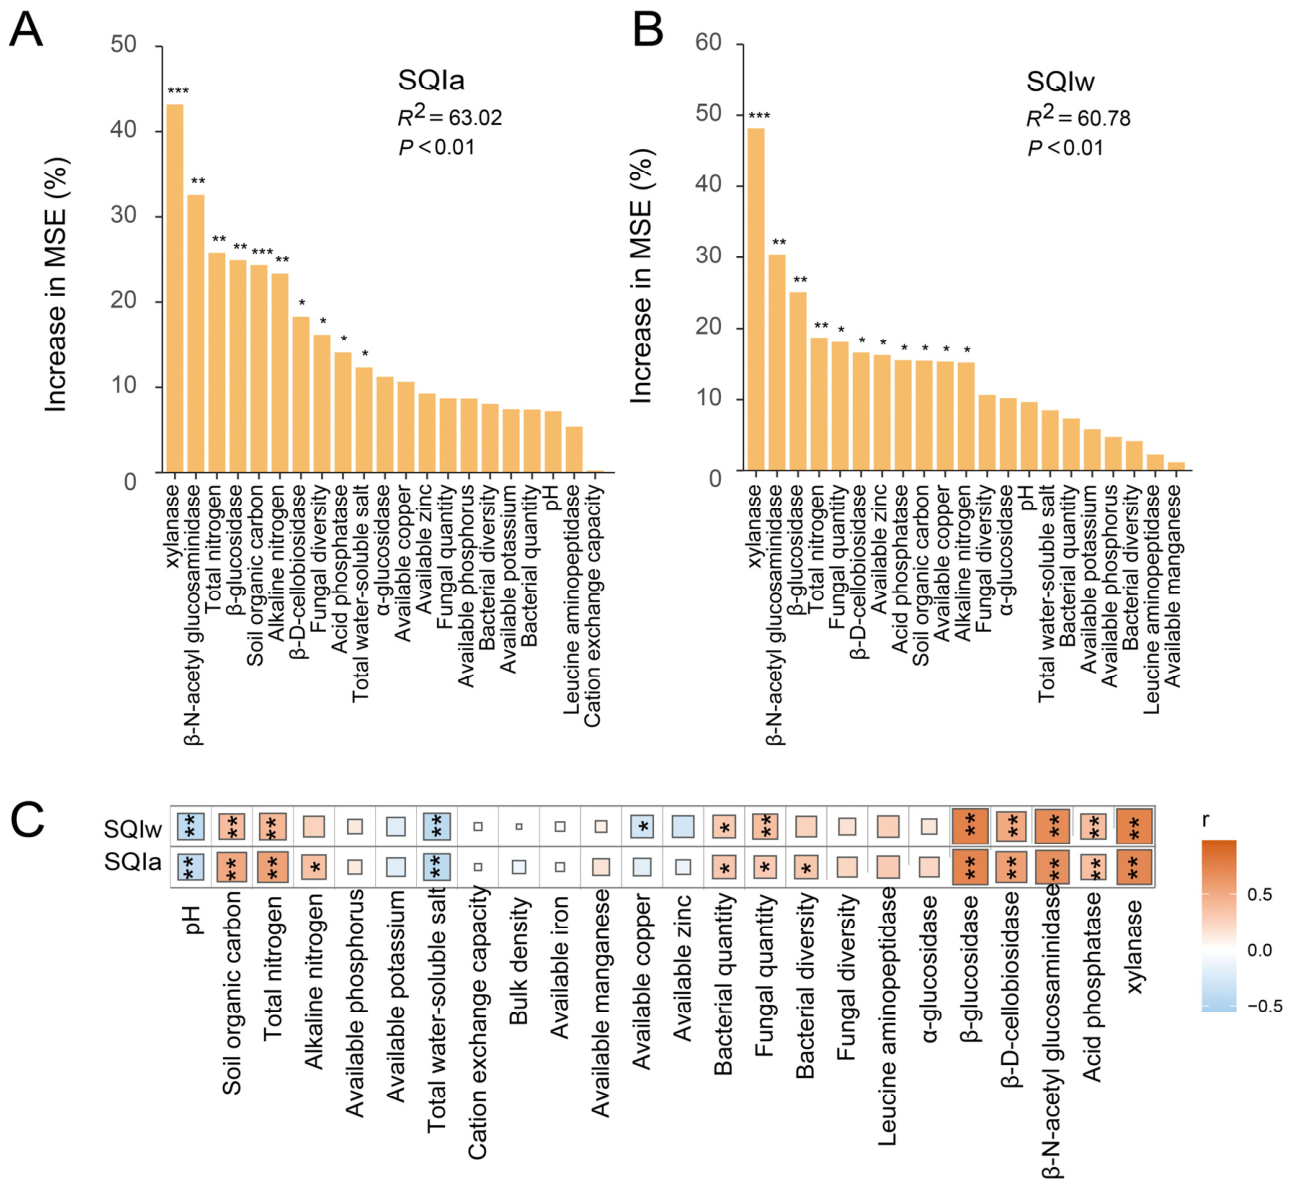
Correlation analysis revealed that SQIw and SQIa were significantly positively correlated with SOC, TN, bacterial quantity, fungal quantity, BG, CB, NAG, PHOS, and XYL, whereas significant negative correlations were observed with pH and TWS (p < 0.05). Furthermore, SQIw demonstrated a significant negative correlation with Zn (p < 0.05). Random forest analysis revealed that the measured variables explained 63.02% of the variance in SQIa. Soil enzyme activities (XYL, NAG, BG, CB, PHOS), soil nutrient indices (TN, SOC, AN), fungal diversity, and TWS significantly influenced SQI variation (p < 0.05). For SQIw, the measured variables explained 60.78% of the variance, with soil enzyme activities (XYL, NAG, BG, CB, PHOS), soil nutrients (AN and TN), fungal abundance, Zn, and Cu significantly influencing SQIw variation (p < 0.05). Collectively, both SQIa and SQIw were jointly governed by soil enzyme activities (XYL, NAG, BG, CB, PHOS), TN, and AN (Figure 4).

4. Discussion

4.1. Changes in Soil Physical and Chemical Properties in Reclaimed Coastal Land

The contents of SOC and TN varied markedly among different sampling sites (Table 3). The content of AK in LG was obviously higher than that at the other sampling sites (Table 3). Studies have shown that soil environments with higher salinity and cations favor the accumulation of AK [44]. In this study, TWS content in the LG reclaimed coastal area was higher than that in RA, LW, and YQ (Table 3), and TWS showed a significant positive correlation with AK (Figure 2). LW had the lowest TWS content (Table 3), resulting in a lack of Na+, Ca2+, and Mg2+ for exchange with K+, which contributed to lower AK content [45,46]. These findings confirm the key role of high-salinity environments in maintaining soil K availability [47]. In contrast, AN and AP showed no significant differences among the four sampling sites. This may be attributed to the widespread application of N and P fertilizers in large-scale rice cultivation, contributing to the gradual convergence of AN and AP contents in the surface soil. The highest concentrations of Fe, Mn, Cu, and Zn were observed in YQ (Table 3). These results may be associated with YQ’s historical role as a hub for electrical equipment production in China [25]. Electroplating in the electrical industry uses Cu, Zn, and Fe, and wastewater and exhaust emissions may have accumulated into coastal sediments via sewage irrigation and atmospheric deposition [48]. High salinity not only directly inhibits plant growth but also creates a high-alkalinity environment that alters nutrient forms, acting as a persistent geochemical barrier. For instance, under high pH, phosphorus readily precipitates with calcium and magnesium as insoluble phosphates, keeping available phosphorus persistently low [49]. Consequently, even after long-term desalination and cultivation, soils with high initial salinity still show pronounced aftereffects. These effects cause the response patterns of soil quality indicators in reclaimed coastal lands to differ markedly from those in ordinary agricultural soils, complicating variable selection for MDS construction [50]. Interpreting the soil quality indices in this study therefore requires careful consideration of this initial salinity–alkalinity background. Future studies should incorporate dynamic salinity monitoring to better quantify the impact of these aftereffects on soil quality evolution. Moreover, it is essential to point out that salinity and heavy metals may exert synergistic inhibitory effects on soil enzyme activities in coastal reclaimed soils, as salinity can enhance heavy metal mobilization such as by promoting the exchangeable and reducible fractions [51,52]. While the heavy metal concentrations in YQ were all below the GB 15618-2018 [53] risk screening values, the coexistence of these two stressors makes it difficult to unequivocally isolate their individual contributions to the lowest SQIs observed in YQ (Table S3). Future studies employing controlled experiments are needed to figure out the specific mechanisms through which salinity and heavy metals jointly affect enzyme activities in these reclaimed agroecosystems.

4.2. Changes in Soil Biological Properties in Reclaimed Coastal Land

Soil microbial abundance, diversity, and metabolic activity respond more rapidly to environmental changes than soil physicochemical properties [3,18,54]. LW exhibited the highest soil bacterial and fungal abundances, whereas YQ showed the lowest (Table 4). Reclaimed coastal areas are located at the land–sea interface [13]. Although the soil undergoes freshwater salt leaching after reclamation, soil salinity is still widely recognized as a key environmental indicator, exerting a significant impact on microbial quantity, diversity, and function [4,55,56]. The lower TWS content in the LW alleviated the osmotic stress of salinity on microorganisms, creating favorable conditions for substantial microbial proliferation [57,58]. Conversely, the high salinity in YQ induces cellular dehydration via osmotic effects, suppressing microbial proliferation [57,58]. The fungal quantity negatively correlated with Cu, Zn and Fe, suggesting potential heavy metal threats to microbes in reclaimed paddy soils [55]. Notably, LW showed contrasting patterns of microbial diversity, with fungal diversity being the highest and bacterial diversity the lowest across the four sites (Table 4). This may be attributed to the structural advantages of fungal cell walls, antioxidant enzyme regulation, and more adaptable osmoregulatory strategies of fungi, allowing them to sustain growth under salt stress and potentially dominate competitive ecological niches [59,60,61]. Studies have shown that even in low-salinity soils, the loss of bacterial biomass may be accelerated for species with poor resistance to salt stress [62]. However, other studies have demonstrated that inoculation with bacterial species (e.g., such as Azospirillum, Pseudomonas, Burkholderia, Bacillus) can enhance plant tolerance to soil salinity and promote plant growth [45,63]. These findings suggest that despite the generally superior ability of fungi to tolerate osmotic stress, the response patterns of both bacterial and fungal communities to salinization are characterized by habitat-specific [62,64].
The content of soil extracellular enzyme directly represents metabolic function of microbes [21]. The generally higher enzyme activities observed in RA and LW compared to YQ and LG (Table 4) suggest enhanced microbial metabolic activity, coupled with accelerated soil organic matter decomposition and nutrient transformation processes in these two sites. This finding closely associated with the low salinity and the high level of metabolic substrate (e.g., SOC, TN) in RA and LW [54,65]. Additionally, fungal abundance was positively correlated with BG, XYL, NAG, and PHOS in this study (Figure 2), demonstrating that fungi may also play an important role in enhancing soil extracellular enzyme activities. First, fungi are the primary producers of fungi-derived enzymes (e.g., NAG, BG, XYL) [66]. A higher fungal abundance leads to a greater density of enzyme-secreting cells and hyphae per unit of soil [67,68]. Meanwhile, enzyme secretion occurs primarily at hyphal tips (growth points) and along hyphal surfaces, and the dense fungal hyphae also increase the number of enzyme secretion sites [69,70]. Second, fungal enzymes decompose cellulose, hemicellulose, and chitin into small molecules, such as monosaccharides, oligosaccharides, and amino acids, which provide high-quality carbon and nitrogen sources for bacteria [61]. This can promote rapid bacterial proliferation and consequently enhance overall soil extracellular enzyme activities. It should be noted that the Shannon index primarily reflects species evenness and may not fully capture richness-related changes in community composition. Future studies incorporating complementary diversity metrics (e.g., Chao1, ACE, Simpson) would provide a more comprehensive understanding of microbial community dynamics in relation to soil quality.

4.3. Changes in Soil Quality Index and Its Influencing Factors in Reclaimed Coastal Land

Significant heterogeneity in soil quality was observed among the four coastal reclaimed sampling areas, which supports the first hypothesis of this study. Soil organic matter (SOM) serves as the foundation of soil quality [4,71]. Significant positive correlations were observed between the SQI and the contents of SOC and TN in this study (Figure 2). Although YQ had a high SOC content, its soil quality was lower than that of LW and RA (Figure 3), indicating that a high organic matter content alone does not equate to high soil quality. Instead, the availability of organic matter and the associated microbial metabolic capacity are the critical indicators. Studies have shown that SOM content in coastal saline–alkali soils is not consistently low [72], However, long-term exposure to anaerobic and high-salinity stress conditions may limit organic matter mineralization and nutrient release, thereby reducing soil quality [54]. In line with these observations, the present study revealed a significant negative correlation between TWS and SQI (Figure 2). High-salinity environments may promote the binding of organic matter to mineral colloids, thereby increasing the recalcitrant SOC fraction and reducing the accessibility of SOC to microorganisms [54,73]. Additionally, salt stress imposes selective pressure on cellulose-degrading and hemicellulose-degrading microorganisms, leading to a decrease in decomposition rates of organic matter [74,75]. Soil extracellular enzyme activity is a sensitive biological indicator for assessing soil quality, directly reflecting soil nutrient cycling capacity and microbial metabolic function [23,76]. In this study, SQI was positively correlated with carbon-cycling enzymes (BG, CB, XYL) and nitrogen-cycling enzymes (NAG and LAP) (Figure 4), with RA exhibiting the highest enzyme activities and consequently the highest SQI (Figure 3). Enzyme activities (i.e., XYL, NAG, BG, CB, PHOS) were the most important contributors to SQI variation in coastal reclamation areas, supporting the second hypothesis of this study (Figure 4). These findings demonstrate that enhancing soil quality is fundamentally dependent on stimulating soil nutrient cycling and boosting soil microbial metabolic activity [35,77,78]. Collectively, the MDS developed for soil quality assessment in reclaimed coastal paddy fields encompasses not only soil pH, nutrients (SOC, TN, AN, AK), salinity, and Zn, but also bacterial abundance, bacterial diversity, fungal diversity, and enzyme activities (LAP, BG, CB, NAG, XYL) in the study. This confirms that incorporating biological indicators is essential for comprehensively reflecting soil quality in coastal reclamation areas, which is consistent with soil quality assessment frameworks established in forest and agricultural ecosystems [23,79].
It is important to note that the SQI classification thresholds (SQI < 0.55, poor; 0.55 ≤ SQI ≤ 0.70, moderate; SQI > 0.70, good) adopted in this study were originally developed by Marzaioli et al. [39] for Mediterranean ecosystems. These thresholds may not be directly transferable to coastal reclaimed paddy soils in eastern China, as they were not calibrated against local soil conditions, climate, or crop productivity (Table S4). In this observational study, the land use types are inherently confounded with site-specific environmental factors and management practices. Thus, the SQI classes reported in this study should be interpreted as relative rankings and integrated outcomes among the four study sites rather than absolute quality designations. Future research should establish region-specific SQI threshold values through correlation analyses with crop yields or other soil functions to improve the practical applicability of soil quality assessments in coastal reclamation areas. Unless otherwise stated, all correlations discussed in this section are based on the descriptive correlation matrix (Figure 2) and should be interpreted as associations rather than causal relationships. Moreover, cross-regional comparisons would be required to isolate the effect of reclamation time.
Soil quality in the four coastal reclaimed sampling areas ranges from low to moderate levels. RA showed the highest SQI, followed by LW, LG and YQ. The primary constraints limiting soil quality were high salinity (YQ, LG), low SOC (LG, LW), and limited microbial metabolic activity (YQ, LG). Given the heterogeneity of soil quality and biochemical properties across these areas, site-specific improvement measures should focus on reducing salinity, increasing SOC, and enhancing microbial metabolic activity. In high-salinity areas, improved drainage and bio-desalination with salt-tolerant green manure crops may be beneficial. For SOC-deficient sites, bio-organic fertilizers and bio-desalination are recommended to improve soil fertility. Conservation tillage and balanced organic amendments should be maintained to sustain microbial diversity and activity, while the irrigation and drainage management is needed to prevent salt re-accumulation. However, several limitations of this study should be acknowledged. First, the indicator system was constructed exclusively from soil natural properties (physicochemical, biological, and biochemical indicators), without incorporating site-specific characteristics such as reclamation age, land use history, and management practices as part of the MDS. As a result, we were unable to quantitatively assess the contribution of these site-level factors to the observed variation in soil quality. Second, due to the cross-sectional nature of our sampling design, this study only captured the spatial variability of soil quality at a single time point. Long-term temporal changes in soil quality indicators and their cumulative effects on soil quality remain unknown. Future studies should integrate both site-specific characteristics and time-series monitoring data to develop a more comprehensive and robust MDS framework for coastal reclamation areas.
We acknowledge that this study employed a single sampling event (November 2024, post harvest), which may not fully reflect the temporal dynamics of soil biological properties. Microbial communities, fungal diversity, and enzyme activities are known to fluctuate with seasonal changes, temperature, and particularly water management in rice paddies, which alternate between flooding and drying phases. Nevertheless, post-harvest sampling may provide a useful baseline for soil quality assessment in this context. First, the post-harvest period corresponds to a relatively stable phase in the rice cropping cycle, when short-term disturbances such as fertilization and flooding–drying alternations have largely subsided. Second, the consistent sampling timing across all sites helps reduce seasonal confounding and allows for spatial comparisons. Third, the biological indicators included in our MDS showed interpretable associations with soil physicochemical properties and were identified as important SQI predictors in random forest analysis, suggesting that they captured meaningful site-specific variation rather than predominantly reflecting random temporal fluctuations. That said, a single sampling event is unlikely to fully capture the temporal dynamics of soil quality. The SQI developed here should therefore be viewed as a snapshot assessment rather than a long-term average. Future studies with multi-season or multi-year monitoring would be valuable to test the temporal stability of the SQI and to better understand the seasonal sensitivity of biological indicators in reclaimed coastal paddy systems.

5. Conclusions

YQ had higher contents of SOC, TN, TWS, CEC, Fe, Mn, Cu, and Zn than LG, RA, and LW, while RA demonstrated higher BG, XYL, NAG, LAP, and PHOS activities. Among the four land use types investigated, RA had the highest soil quality, followed by LW, LG, and YQ. Based on the scoring functions and weighting scheme adopted in this study, the overall soil quality of coastal reclaimed paddy fields ranged from moderate to low. The soil enzyme activity (BG, CB), fungal diversity and abundance, nutrients (TN, SOC, AN), and TWS markedly influenced the SQI in these reclaimed coastal paddy fields, demonstrating that the spatial heterogeneity of soil quality was governed by the integrated effects of soil microbial metabolic activity, salinity, and nutrients. Consistent with our hypothesis, the selected enzyme activities were identified as sensitive biological indicators in reclaimed saline soils. To improve soil quality, site-specific land management practices should be adopted to balance soil fertility and crop yield, while vigilance is required regarding the environmental risks posed by soil heavy metal accumulation. Future research needs to systematically investigate the microbial driving mechanisms of soil quality formation in coastal reclamation areas across broader environmental gradients.

Supplementary Materials

The following supporting information can be downloaded at: https://www.mdpi.com/article/10.3390/soilsystems10090099/s1, Figure S1. Soil profiles of sampling sites. Table S1. Geographic information, reclamation history of the sampling sites in the four coastal reclamation areas of Wenzhou Plain, Zhejiang Province, China. Table S2. Cropping systems, grain yields, and soil parent materials of the sampling sites in the four coastal reclamation areas of Wenzhou Plain, Zhejiang Province, China. Table S3. Heavy metal concentrations of sediments in YQ. Table S4. Correlation between rice yield and SQIs. Table S5 Fertilization and crop season of four sites. Table S6 The threshold values for parabolic function.

Author Contributions

C.L. (Caixia Liu): Conceptualization, methodology, software, validation, formal analysis, investigation, writing—original draft preparation, and funding acquisition; C.L. (Chenfei Liang): Investigation, supervision and formal analysis; H.Z.: Conceptualization, methodology, software, and validation; J.Y.: Investigation; L.L.: Supervision; J.C.: Visualization; Y.W.: Software, validation, and formal analysis; Q.G.: Software, data curation, and writing—original draft preparation; L.W.: Supervision, Project administration, and Funding acquisition. All authors have read and agreed to the published version of the manuscript.

Funding

This research was funded by Major Scientific and Technological Innovation Research and Development Projects grant number [ZN2023006] and Zhejiang Key Laboratory of Soil Remediation and Quality Improvement grant number [2026SRQI08].

Institutional Review Board Statement

Not applicable.

Data Availability Statement

The raw data supporting the conclusions of this article will be made available by the authors on request.

Acknowledgments

We thank all the members in Instrumental Analysis Center, Wenzhou Academy of Agricultural Sciences and Zhejiang Key Laboratory of Soil Remediation and Quality Improvement, Zhejiang A&F University. We wish to express our appreciation to Agricultural and Rural Service Center, Liushi Town People’s Government for their assistance. We also thank the anonymous reviewers and the editor for their suggestions, which substantially improved the manuscript.

Conflicts of Interest

The authors declare no conflicts of interest.

References

  1. Li, J.; Wang, S.; Tang, Y.; Du, Y.; Xu, L.; Hu, J.; Zhu, C. Coastal reclamation alters soil organic carbon dynamics: A meta-analysis in China. Catena 2024, 240, 107975. [Google Scholar] [CrossRef] [Scilit]
  2. Lu, J.; Lv, X.; Shi, H. Spatio-temporal heterogeneity and cumulative ecological impacts of coastal reclamation in coastal waters. Remote Sens. 2023, 15, 1495. [Google Scholar] [CrossRef] [Scilit]
  3. Wang, W.; Liu, H.; Li, Y.; Su, J. Development and management of land reclamation in China. Ocean Coast. Manag. 2014, 102, 415–425. [Google Scholar] [CrossRef] [Scilit]
  4. Zhang, L.; Liu, C.; Li, P.; Li, L.; Li, R.; Zhou, N.; Liu, C.; Cui, M. Meta-analysis indicated a higher loss of soil active organic carbon fractions in inland wetlands than in coastal wetlands after reclamation in China. Land Degrad. Dev. 2026, 37, 612–624. [Google Scholar] [CrossRef]
  5. Chen, W.; Yang, H.; Zhang, F. The effect of Ca2+/Mg2+ on the aggregation process of soil colloids with different alkalization degrees. J. Dispers. Sci. Technol. 2025, 46, 273–279. [Google Scholar] [CrossRef] [Scilit]
  6. IUSS Working Group WRB. World Reference Base for Soil Resources. In Ternational Soil Classification System for Naming Soils and Creating Legends for Soil Maps, 4th ed.; International Union of Soil Sciences (IUSS): Vienna, Austria, 2022. [Google Scholar]
  7. Michéli, E.; Deckers, J.; M. Fuchs, F.O. Nachtergaele, 2025: WRB Documentation Centre Solonchaks-Lecture Notes. IUSS WRB Working Group webpage and KU-Leuven Soil Monolith Webpage. Available online: https://ees.kuleuven.be/soil-monoliths/wrb-documentation-centre/wrb-reference-soil-groups/SOLONCHAKS-Lecture-notes.pdf (accessed on 7 August 2026).
  8. Wei, L.; Li, Y.; Zhu, Z.; Wang, F.; Liu, X.; Zhang, W.; Xiao, M.; Li, G.; Ding, J.; Chen, J.; et al. Soil health evaluation approaches along a reclamation consequence in Hangzhou Bay, China. Agric. Ecosyst. Environ. 2022, 337, 108045. [Google Scholar] [CrossRef] [Scilit]
  9. Fan, Y.N.; Zhang, C.; Hu, W.; Khan, K.S.; Zhao, Y.; Huang, B. Development of soil quality assessment framework: A comprehensive review of indicators, functions, and approaches. Ecol. Indic. 2025, 172, 113272. [Google Scholar] [CrossRef] [Scilit]
  10. Hou, X.; Yang, J.; Zhao, M. Effects of Tillage on Soil Organic Carbon and Stability of Soil Aggregates in Costal Saline Soil Region. Soils 2015, 47, 781–789. [Google Scholar] [CrossRef]
  11. Li, X.Y.; Pu, L.J.; Xu, Y.; Xu, C.X.; Zhu, M.; Xu, C.Y.; Xie, X.F. Spatiotemporal heterogeneity of soil organic carbon in reclamation areas of tidal flat in north Jiangsu province. Soils 2020, 52, 365–371. [Google Scholar] [CrossRef]
  12. Ruis, S.J.; Blanco-Canqui, H.; Jasa, P.J.; Jin, V.L. No-till farming and greenhouse gas fluxes: Insights from literature and experimental data. Soil Tillage Res. 2022, 220, 105359. [Google Scholar] [CrossRef] [Scilit]
  13. Li, J.; Pu, L.; Zhu, M.; Zhang, J.; Li, P.; Dai, X.; Xu, Y.; Liu, L. Evolution of soil properties following reclamation in coastal areas: A review. Geoderma 2014, 226, 130–139. [Google Scholar] [CrossRef] [Scilit]
  14. Ge, B.M.; Yang, R.P.; Yang, L.; Jiang, S.H.; Tang, B.P. Changes in soil macrofaunal communities along soil age gradient under centuries of cultivation after coastal reclamation. Catena 2021, 200, 105170. [Google Scholar] [CrossRef] [Scilit]
  15. Alongi, D.M. Carbon Cycling and Storage in Mangrove Forests. In Annual Review of and Applications; Academic Press, Inc.: San Diego, CA, USA, 2014; Volume 6, pp. 195–219. [Google Scholar]
  16. Zhou, X.; Qing, S.; Zhou, H.; Cheng, H.; Chen, Z.; Wang, Y.; Wang, Y. Efficient nitrogen removal performance and mechanism of a novel salt-tolerant bacterium Vreelandella sp. J1-11. J. Environ. Manag. 2026, 399, 128642. [Google Scholar] [CrossRef] [Scilit] [PubMed]
  17. de Sosa, L.L.; Carpio, M.J.; Gil-Martínez, M.; Thevenot, M.; Mathieu, O.; Madejón, E.; Panettieri, M. Soil microbial community structure and carbon dynamics in response to compost and livestock management in grassland soils. Agric. Ecosyst. Environ. 2026, 400, 110261. [Google Scholar] [CrossRef] [Scilit]
  18. Ducousso-Détrez, A.; Fontaine, J.; Lounès-Hadj Sahraoui, A.; Hijri, M. Diversity of phosphate chemical forms in soils and their contributions on soil microbial community structure changes. Microorganisms 2022, 10, 609. [Google Scholar] [CrossRef] [Scilit] [PubMed]
  19. Wang, X.; Feng, J.; Ao, G.; Qin, W.; Han, M.; Shen, Y.; Liu, M.; Chen, Y.; Zhu, B. Globally nitrogen addition alters soil microbial community structure, but has minor effects on soil microbial diversity and richness. Soil Biol. Biochem. 2023, 179, 108982. [Google Scholar] [CrossRef] [Scilit]
  20. Duan, P.; Fu, R.; Nottingham, A.T.; Domeignoz-Horta, L.A.; Yang, X.; Du, H.; Wang, K.; Li, D. Tree species diversity increases soil microbial carbon use efficiency in a subtropical forest. Glob. Change Biol. 2023, 29, 7131–7144. [Google Scholar] [CrossRef] [Scilit] [PubMed]
  21. Williams, G.; Miller, R.; Deng, S. Dynamic relationships between microbial community, enzyme activity, and soil properties across global ecosystems. Appl. Soil Ecol. 2025, 206, 105843. [Google Scholar] [CrossRef] [Scilit]
  22. Chen, S.; Fan, W.; Wu, H.; Cheng, S.; Liu, J.; Fan, Z.; Liang, Y.; Cai, H. Deep tillage with straw retention increased organic carbon sequestration and enhanced homogenization of microbial communities and functions across soil depths. Agric. Ecosyst. Environ. 2026, 395, 109949. [Google Scholar] [CrossRef] [Scilit]
  23. Gao, M.; Hu, W.; Li, M.; Wang, S.; Chu, L. Network analysis was effective in establishing the soil quality index and differentiated among changes in land-use type. Soil Tillage Res. 2025, 246, 106352. [Google Scholar] [CrossRef] [Scilit]
  24. Zheng, X.; Wei, L.; Lv, W.; Zhang, H.; Zhang, Y.; Zhang, H.; Zhang, H.; Zhu, Z.; Ge, T.; Zhang, W. Long-term bioorganic and organic fertilization improved soil quality and multifunctionality under continuous cropping in watermelon. Agric. Ecosyst. Environ. 2024, 359, 108721. [Google Scholar] [CrossRef] [Scilit]
  25. Liu, C.; Gao, Q.; Zhang, S.; Liao, L.; Chen, J.; Wang, L. Investigation of soil physical, chemical and biological indicators in industrial towns: A case study in a chinese town. Environ. Geochem. Health 2025, 47, 248. [Google Scholar] [CrossRef] [Scilit] [PubMed]
  26. Wan, P.; Zhou, Z.; Yuan, Z.; Wei, H.; Huang, F.; Li, Z.; Li, F.; Zhang, F. Fungal community composition changes and reduced bacterial diversity drive improvements in the soil quality index during arable land restoration. Environ. Res. 2024, 244, 117931. [Google Scholar] [CrossRef] [Scilit] [PubMed]
  27. Chen, C.M.; Wang, Y.T.; Chen, L.J.; Lin, T. Wenzhou Hydrology and Water Resources; China Water & Power Press: Beijing, China, 2015. [Google Scholar]
  28. Zhang, Y.; Liu, J.; Zhou, S.; Liu, C.; Yang, M.; Zhang, Y. Characteristics, controlling factors and effects on human health of groundwater chemical evolution in Wenzhou Plain, lower Oujiang River catchment. Geol. China 2024, 51, 1059–1073. [Google Scholar]
  29. NY/T 1121.6-2006; Soil Testing-Part6: Method for Determination of Soil Organic Matter. Ministry of Agriculture of the People’s Republic of China: Beijing, China, 2006.
  30. Bao, S. Soil and Agricultural Chemistry Analysis, 2nd ed.; China Agriculture Press Co., Ltd: Beijing, China, 2000; pp. 355–356. [Google Scholar]
  31. Saiya-Cork, K.R.; Sinsabaugh, R.L.; Zak, D.R. The effects of long term nitrogen deposition on extracellular enzyme activity in an Acer saccharum forest soil. Soil Biol. Biochem. 2002, 34, 1309–1315. [Google Scholar] [CrossRef] [Scilit]
  32. Chen, J.; Wu, Q.; Li, S.; Ge, J.; Fuhrmann, J.J. Diversity and function of soil bacterial communities in response to long-term intensive management in a subtropical bamboo forest. Geoderma 2019, 354, 113894. [Google Scholar] [CrossRef] [Scilit]
  33. Caporaso, J.G.; Lauber, C.L.; Walters, W.A.; Berg-Lyons, D.; Lozupone, C.A.; Turnbaugh, P.J.; Fierer, N.; Knight, R. Global patterns of 16S rRNA diversity at a depth of millions of sequences per sample. Proc. Natl. Acad. Sci. USA 2011, 108, 4516–4522. [Google Scholar] [CrossRef] [Scilit] [PubMed]
  34. Gardes, M.; Bruns, T.D. ITS primers with enhanced specifcity for basidiomycetesapplication to the identifcation of mycorrhizae and rusts. Mol. Ecol. 1993, 2, 113–118. [Google Scholar] [CrossRef] [Scilit] [PubMed]
  35. Wen, Y.; Yao, W.; Yu, T.; Cheng, L.; Zhang, Q.; Yang, J.; Lin, F.; Zhu, H.; Gunina, A.; Yang, Y.; et al. Long-term organic farming improves the red soil quality and microbial diversity in subtropics. Agric. Ecosyst. Environ. 2025, 381, 109410. [Google Scholar] [CrossRef] [Scilit]
  36. White, T.J.; Bruns, T.; Lee, S.J.W.T.; Taylor, J. Amplification and direct sequencing of fungal riboSOCal RNA genes for phylogenetics. PCR Protoc. Guide Methods Appl. 1990, 18, 315–322. [Google Scholar] [CrossRef] [Scilit]
  37. Edgar, R.C. Search and clustering orders of magnitude faster than BLAST. Bioinformatics 2010, 26, 2460–2461. [Google Scholar] [CrossRef] [Scilit] [PubMed]
  38. Li, P.; Shi, K.; Wang, Y.; Kong, D.; Liu, T.; Jiao, J.; Liu, M.; Li, H.; Hu, F. Soil quality assessment of wheat maize cropping system with different productivities in China: Establishing a minimum data set. Soil Tillage Res. 2019, 190, 31–40. [Google Scholar] [CrossRef] [Scilit]
  39. Marzaioli, R.; D’Ascoli, R.; De Pascale, R.A.; Rutigliano, F.A. Soil quality in a Mediterranean area of Southern Italy as related to different land use types. Appl. Soil Ecol. 2010, 44, 205–212. [Google Scholar] [CrossRef] [Scilit]
  40. Huang, W.; Zong, M.; Fan, Z.; Feng, Y.; Li, S.; Duan, C.; Li, H. Determining the impacts of deforestation and corn cultivation on soil quality in tropical acidic red soils using a soil quality index. Ecol. Indic. 2021, 125, 107580. [Google Scholar] [CrossRef] [Scilit]
  41. Biau, G.; Scornet, E. A random forest guided tour. Test 2016, 25, 197–227. [Google Scholar] [CrossRef] [Scilit]
  42. Fortmann-Roe, S. Consistent and clear reporting of results from diverse modeling techniques: The A3 method. J. Stat. Softw. 2015, 66, 1–23. [Google Scholar] [CrossRef] [Scilit]
  43. Jiao, S.; Du, N.; Zai, X.; Gao, X.; Chen, W.; Wei, G. Temporal dynamics of soil bacterial communities and multifunctionality are more sensitive to introduced plants than to microbial additions in a multicontaminated soil. Land Degrad. Dev. 2019, 30, 852–865. [Google Scholar] [CrossRef] [Scilit]
  44. Basak, N.; Rai, A.K.; Krishnamurthy, S.L.; Singh, R.K.; Sundha, P.; Patel, S.; Bedwal, S.; Sharma, P.C. Nutrients availability in salt-affected soils varies with the ionic composition of solid and solution phases of inland and coastal agroecosystems of India. Environ. Earth Sci. 2023, 82, 489. [Google Scholar] [CrossRef] [Scilit]
  45. Alemayehu, B.; Teshome, H. Soil colloids, types and their properties: A review. Open J. Bioinform. Biostat. 2021, 5, 008–013. [Google Scholar] [CrossRef] [Scilit]
  46. Chen, G.; Xiao, L.; Yue, K.; Wang, Y.; Wang, S.; Zhu, Y.; Kai, L. Optimizing phosphate application to improve soil quality and reduce phosphorus loss in rice-wheat rotation. Agric. Ecosyst. Environ. 2025, 378, 109310. [Google Scholar] [CrossRef] [Scilit]
  47. Wang, N.; Ai, Z.; Zhang, Q.; Leng, P.; Qiao, Y.; Li, Z.; Tian, C.; Cheng, H.; Chen, G.; Li, F. Influence of long-term inorganic fertilization and straw incorporation on soil organic carbon: Roles of enzyme activity, labile organic carbon fractions, soil aggregates, and microbial traits. Agric. Ecosyst. Environ. 2025, 392, 109758. [Google Scholar] [CrossRef] [Scilit]
  48. Monib, A.W.; Niazi, P.; Azizi, A.; Sediqi, S.; Baseer, A.Q. Heavy metal contamination in urban soils: Health impacts on humans and plants: A review. Eur. J. Theor. Appl. Sci. 2024, 2, 546–565. [Google Scholar] [CrossRef] [Scilit] [PubMed]
  49. Mucsi, M.; Borsodi, A.K.; Megyes, M.; Szili-Kovács, T. Response of the metabolic activity and taxonomic composition of bacterial communities to mosaically varying soil salinity and alkalinity. Sci. Rep. 2024, 14, 7460. [Google Scholar] [CrossRef] [Scilit] [PubMed]
  50. Borsodi, A.K.; Mucsi, M.; Krett, G.; Szabó, A.; Felföldi, T.; Szili-Kovács, T. Variation in sodic soil bacterial communities associated with different alkali vegetation types. Microorganisms 2021, 9, 1673. [Google Scholar] [CrossRef] [Scilit] [PubMed]
  51. Raiesi, F. Interactive effect of salinity and cadmium toxicity on soil microbial properties and enzyme activities. Ecotoxicol. Environ. Saf. 2019, 168, 221–229. [Google Scholar] [CrossRef] [Scilit] [PubMed]
  52. Zheng, L.; Zhang, M.; Xiao, R.; Chen, J.; Yu, F. Impact of salinity and Pb on enzyme activities of a saline soil from the Yellow River delta: A microcosm study. Phys. Chem. Earth Parts A/B/C 2017, 97, 77–87. [Google Scholar] [CrossRef] [Scilit]
  53. GB 15618-2018; Soil Environment Quality Risk Control Standard for Soilcontamination of Agriculture Land. Ministry of Ecology and Environment of the People’s Republic of China: Beijing, China, 2018.
  54. Dong, Y.; Chen, R.; Petropoulos, E.; Yu, B.; Zhang, J.; Lin, X.; Gao, M.; Feng, Y. Interactive effects of salinity and SOC on the ecoenzymatic activities across coastal soils subjected to a saline gradient. Geoderma 2022, 406, 115519. [Google Scholar] [CrossRef] [Scilit]
  55. Mei, Y.; Kayoumu, M.; He, T.; Cui, X.; Duan, G. Enhancing salt tolerance and growth of Oryza sativa L. through biochar-bacteria composite amendment for potential application in coastal saline soil reclamation. Environ. Technol. Innov. 2025, 41, 104667. [Google Scholar] [CrossRef] [Scilit]
  56. Zhang, G.; Bai, J.; Tebbe, C.C.; Zhao, Q.; Jia, J.; Wang, W.; Wang, X.; Yu, L. Salinity controls soil microbial community structure and function in coastal estuarine wetlands. Environ. Microbiol. 2021, 23, 1020–1037. [Google Scholar] [CrossRef] [Scilit] [PubMed]
  57. Salma Santhosh, S.; Meena, S.; Baskar, M.; Karthikeyan, S.; Vanniarajan, C.; Ramesh, T. Transformative strategies for saline soil restoration: Harnessing halotolerant microorganisms and advanced technologies. World J. Microbiol. Biotechnol. 2025, 41, 140. [Google Scholar] [CrossRef] [Scilit] [PubMed]
  58. Shao, T.; Gu, X.; Zhu, T.; Pan, X.; Zhu, Y.; Long, X.; Shao, H.; Liu, M.; Rengel, Z. Industrial crop Jerusalem artichoke restored coastal saline soil quality by reducing salt and increasing diversity of bacterial community. Appl. Soil Ecol. 2019, 138, 195–206. [Google Scholar] [CrossRef] [Scilit]
  59. Nie, T.; Wang, L.; Liu, Y.; Fu, S.; Wang, J.; Cui, K.; Wang, L. A halophilic bacterium for bioremediation of saline–alkali land: The triadic and synergetic response mechanism of Oceanobacillus picturae DY09 to salt stress. Microorganisms 2025, 13, 1474. [Google Scholar] [CrossRef] [Scilit] [PubMed]
  60. Rath, K.M.; Murphy, D.N.; Rousk, J. The microbial community size, structure, and process rates along natural gradients of soil salinity. Soil Biol. Biochem. 2019, 138, 107607. [Google Scholar] [CrossRef] [Scilit]
  61. Yovchevska, L.; Miteva-Staleva, J.; Dishliyska, V.; Stoyancheva, G.; Gocheva, Y.; Abrashev, R.; Spasova, B.; Angelova, M.; Krumova, E. Response to salt stress of the halotolerant filamentous fungi Penicillium chrysogenum P13. Molecules 2025, 30, 1196. [Google Scholar] [CrossRef] [Scilit] [PubMed]
  62. Wang, C.; Kuzyakov, Y. Mechanisms and implications of bacterial-fungal competition for soil resources. ISME J. 2024, 18, wrae073. [Google Scholar] [CrossRef] [Scilit] [PubMed]
  63. Akbar, A.; Han, B.; Khan, A.H.; Feng, C.; Ullah, A.; Khan, A.S.; He, L.; Yang, X. A transcriptomic study reveals salt stress alleviation in cotton plants upon salt tolerant PGPR inoculation. Environ. Exp. Bot. 2022, 200, 104928. [Google Scholar] [CrossRef] [Scilit]
  64. Keneally, C.; Gaget, V.; Chilton, D.; Dornan, T.N.; Hensel, J.; Keneally, A.E.; Kidd, S.P.; Brookes, J.D. Extreme salinity change governs microbial community assembly and interactions. Environ. Microbiol. Rep. 2026, 18, e70301. [Google Scholar] [CrossRef] [Scilit] [PubMed]
  65. Yang, C.; Lv, D.; Jiang, S.; Lin, H.; Sun, J.; Li, K.; Sun, J. Soil salinity regulation of soil microbial carbon metabolic function in the Yellow River Delta, China. Sci. Total Environ. 2021, 790, 148258. [Google Scholar] [CrossRef] [Scilit] [PubMed]
  66. Crowther, T.W.; Boddy, L.; Hefin Jones, T. Functional and ecological consequences of saprotrophic fungus–grazer interactions. Isme J. 2012, 6, 1992–2001. [Google Scholar] [CrossRef] [Scilit] [PubMed]
  67. Romaní, A.M.; Fischer, H.; Mille-Lindblom, C.; Tranvik, L.J. Interactions of bacteria and fungi on decomposing litter: Differential extracellular enzyme activities. Ecology 2006, 87, 2559–2569. [Google Scholar] [CrossRef] [Scilit]
  68. Wang, L.; Gao, H.; Fu, S.; Li, H.; Xu, L.; Zhang, L.; Li, H.; You, C.; Liu, S.; Xu, H.; et al. Ectomycorrhizal exploration types shape soil enzyme activity, decomposition, and nitrogen dynamics in subalpine forests. Plant Soil 2026, 518, 1643–1663. [Google Scholar] [CrossRef] [Scilit]
  69. Lai, Z.Q.; Wong, C.K.F.; Ismail, N.I.B.M.; Vadamalai, G. Effect of Mycovirus Infection on the Hydrolytic Enzymes Activity of Fusarium oxysporum f. sp. cubense Tropical Race 4, the Causal Agent of Banana Fusarium Wilt. Baghdad Sci. J. 2026, 23, 165–176. [Google Scholar] [CrossRef] [Scilit]
  70. Riquelme, M.; Bredeweg, E.L.; Callejas-Negrete, O.; Roberson, R.W.; Ludwig, S.; Beltrán-Aguilar, A.; Seiler, S.; Novick, P.; Freitag, M. The Neurospora crassa exocyst complex tethers Spitzenkörper vesicles to the apical plasma membrane during polarized growth. Mol. Biol. Cell 2014, 25, 1312–1326. [Google Scholar] [CrossRef] [Scilit] [PubMed]
  71. Büunemann, E.K.; Bongiorno, G.; Bai, Z.G.; Creamer, R.E.; De Deyn, G.; de Goede, R.; Fleskens, L.; Geissen, V.; Kuyper, T.W.; Mader, P.; et al. Soil quality—A critical review. Soil Biol. Biochem. 2018, 120, 105–125. [Google Scholar] [CrossRef] [Scilit]
  72. Chambers, L.G.; Osborne, T.Z.; Reddy, K.R. Effect of salinity-altering pulsing events on soil organic carbon loss along an intertidal wetland gradient: A laboratory experiment. Biogeochemistry 2013, 115, 363–383. [Google Scholar] [CrossRef] [Scilit]
  73. Song, W.; Qi, R.; Liu, X.; Wang, N.; Chen, L.; Guo, H. Distinct linkages of microbial communities and enzymatic activities with labile and recalcitrant soil organic carbon in urban wetlands. Appl. Soil Ecol. 2026, 218, 106742. [Google Scholar] [CrossRef] [Scilit]
  74. Balla, A.; Silini, A.; Cherif-Silini, H.; Bouket, A.C.; Boudechicha, A.; Luptakova, L.; Alenezi, F.N.; Belbahri, L. Screening of cellulolytic bacteria from various ecosystems and their cellulases production under multi-stress conditions. Catalysts 2022, 12, 769. [Google Scholar] [CrossRef] [Scilit]
  75. He, P.; Wang, J.; Wang, X.; Ma, T.; Ling, N. Distinct successional strategies and assembly dynamics of soil microbial community utilizing carbon derived from plant shoot versus root residues. Soil Biol. Biochem. 2026, 216, 110122. [Google Scholar] [CrossRef] [Scilit]
  76. Hu, W.; Huang, L.; He, Y.; Liu, Y.; Liu, Y.; Kong, Z.; Wu, L.; Ge, G. Soil bacterial and fungal communities and associated nutrient cycling in relation to rice cultivation history after reclamation of natural wetland. Land Degrad. Dev. 2021, 32, 1287–1300. [Google Scholar] [CrossRef] [Scilit]
  77. Mei, J.; Jia, J.; Bi, C.; Liu, J.; Zeng, Y.; Chen, Z. Effects of human enclosure and farming activities on heavy metals in sediments/soils of the coastal reclamation areas in the Yangtze Estuary. J. Soils Sediments 2022, 22, 2435–2447. [Google Scholar] [CrossRef] [Scilit]
  78. Shao, W.; Wang, Q.; Guan, Q.; Zhang, J.; Yang, X.; Liu, Z. Environmental sensitivity assessment of land desertification in the Hexi Corridor, China. Catena 2023, 220, 106728. [Google Scholar] [CrossRef] [Scilit]
  79. Yu, P.; Liu, J.; Tang, H.; Sun, X.; Liu, S.; Tang, X.; Ding, Z.; Ma, M.; Ci, E. Establishing a soil quality index to evaluate soil quality after afforestation in a karst region of Southwest China. Catena 2023, 230, 107237. [Google Scholar] [CrossRef] [Scilit]
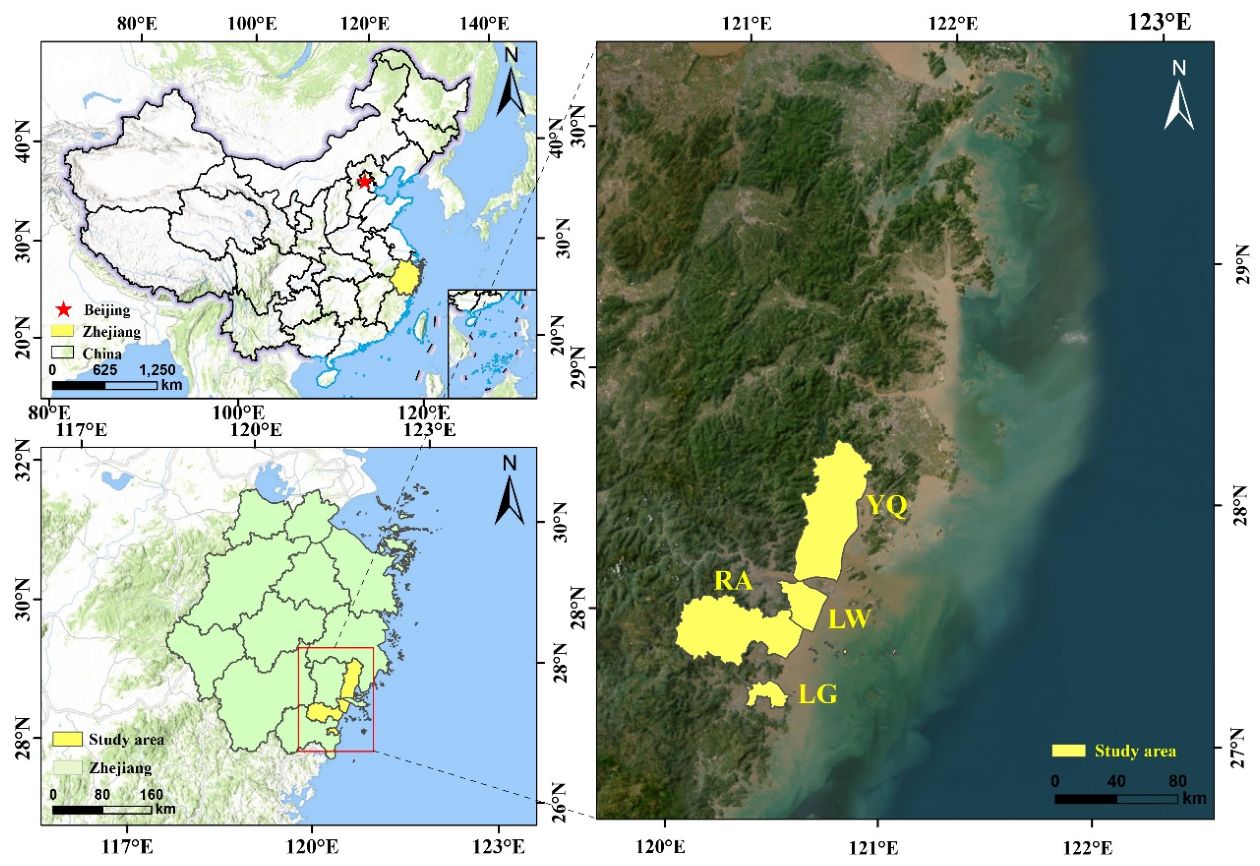
Figure 1. Location of the sampling sites. YQ, Yueqing; LG, Longgang; RA, Ruian; LW, Longwan.
Soilsystems 10 00099 g001
Figure 2. Pearson correlation coefficient between soil indicators. ** Significant at p < 0.01; * Significant at p < 0.05. All correlations are exploratory and are displayed with unadjusted p-values for descriptive purposes only. They should not be interpreted as confirmatory.
Soilsystems 10 00099 g002
Figure 3. Soil quality indices (SQIs) of the four sampling sites based on (A) the minimum data set (MDS) using additive (SQIa) and (B) MDS using weighted (SQIw) methods; (C) the total data set (TDS) using additive (SQIa) and (D) TDS using weighted (SQIw) methods; Scatter plots (E,F) present linear regression relationships between SQIa and SQIw for the MDS and TDS. Red: YQ, Yueqing; Light Blue: LG, Longgang; Green: RA, Ruian; Dark Blue: LW, Longwan. Different lowercase letters above the bars indicate significant differences among sampling sites within each subfigure (p < 0.05).
Soilsystems 10 00099 g003
Figure 4. Random forest analysis showing the importance of predictors for soil quality indices (SQI) (A) using additive (SQIa) and (B) weighted (SQIw) methods, and (C) Pearson correlation coefficients suggesting the relationships between SQIs and soil properties. *, p < 0.05; **, p < 0.01; ***, p < 0.001.
Soilsystems 10 00099 g004
Table 1. Levene’s test for homogeneity of variances of the candidate soil indicators across indicators. SOC, soil organic carbon; TN, total nitrogen; AN, available nitrogen; AP, available phosphorus; AK, available potassium; TWS, total water-soluble salts; CEC, cation exchange capacity; BD, bulk density; LAP, leucine aminopeptidase; AG, α-glucosidase; BG, β-glucosidase; CB, β-D-cellobiosidase; NAG, β-N-acetyl glucosaminidase; PHOS, acid phosphatase; XYL, xylosidase. “×” indicates the variable is heterogeneous.
Levene Statisticdf1df2SignificanceHomogeneity
pH0.1883450.904
SOC0.5903450.625
TN0.6023450.617
AN 0.7113450.551
AP4.7743450.006×heterogeneous
AK1.7103450.178
TWS6.3653450.001×heterogeneous
CEC2.0003450.127
BD 1.1363450.345
Available iron 8.1743450.000×heterogeneous
Available manganese 2.3273450.087
Available copper38.2563450.000×heterogeneous
Available zinc1.8813450.146
Bacterial quantity2.1583450.106
Fungal quantity3.3023450.029×heterogeneous
Bacterial diversity2.7313450.055
Fungal diversity1.3473450.271
LAP0.8613450.468
AG28.0393450.000×heterogeneous
BG1.7773450.165
CB3.1123450.036×heterogeneous
NAG1.4083450.253
PHOS0.9693450.416
XYL0.6713450.574
Table 2. Comparison of conventional ANOVA and Welch’s ANOVA results for replaced MDS indicators. Total water-soluble salts, TWS; β-D-cellobiosidase, CB.
MDS IndicatorConventional ANOVA F-ValueConventional ANOVA p-ValueReplaced Welch F-StatisticReplaced Welch p-Value Change in Significance
TWS6.1940.0014.4190.016Remained significant (p < 0.05)
CB1.9660.1333.3940.038Changed from non-significant to significant
Table 3. Differences in soil physical and chemical indicators across the four sampling sites. YQ, Yueqing; LG, Longgang; RA, Ruian; LW, Longwan. BD, bulk density; SOC, soil organic carbon; TN, total nitrogen; AN, available nitrogen; AP, available phosphorus; AK, available potassium; CEC, cation exchange capacity; TWS, total water-soluble salts. Different letters in the same line indicate significant differences at the 0.05 level. Values are means ± SD. Sample size for each area (YQ: 9, LW: 18, LG: 9, RA: 13).
YQLGRALW
pH8.08 ± 0.16 a8.09 ± 0.27 a8.13 ± 0.22 a8.02 ± 0.25 a
SOC (g kg−1)22.82 ± 5.66 a15.62 ± 3.03 b19.12 ± 3.66 b21.07 ± 4.15 a
TN (g 100g−1)0.14 ± 0.03 a0.10 ± 0.02 b0.13 ± 0.02 a0.13 ± 0.03 a
AN (mg kg−1)68.89 ± 25.78 a41.22 ± 18.72 a76.38 ± 65.43 a61.67 ± 25.86 a
AP (mg kg−1)40.63 ± 15.11 a43.13 ± 65.21 a25.89 ± 8.46 a34.53 ± 16.96 a
AK (mg kg−1)483.67 ± 156.06 b623.78 ± 108.23 a414.00 ± 66.44 b410.39 ± 117.38 b
TWS (g kg−1)3.09 ± 1.27 a3.13 ± 1.07 a2.29 ± 0.39 b1.94 ± 0.66 b
CEC (cmol(+) kg−1)21.77 ± 4.27 a19.32 ± 1.54 bc18.09 ± 1.55 c20.46 ± 1.54 ab
BD (g cm−3)1.22 ± 0.08 a1.29 ± 0.14 a1.26 ± 0.12 a1.23 ± 0.14 a
Available iron (mg kg−1)44.23 ± 10.78 a28.98 ± 7.04 bc25.25 ± 4.42 c36.02 ± 14.14 ab
Available manganese (mg kg−1)36.63 ± 7.63 a28.68 ± 4.82 b27.86 ± 3.15 b29.21 ± 7.56 b
Available copper (mg kg−1)30.31 ± 14.15 a3.45 ± 0.84 b5.46 ± 1.39 b6.47 ± 1.99 b
Available zinc (mg kg−1)8.79 ± 1.87 a1.22 ± 0.55 c2.43 ± 1.19 c3.75 ± 1.82 b
Table 4. Differences in soil extracellular enzyme activities across the four sampling sites. YQ, Yueqing; LG, Longgang; RA, Ruian; LW, Longwan. AG, α-glucosidase; BG, β-glucosidase; CB, β-D-cellobiosidase; XYL, xylosidase; LAP, leucine aminopeptidase; NAG, β-N-acetyl glucosaminidase; PHOS, acid phosphatase. Different letters in the same line indicate the significant differences at the 0.05 level. Values are means ± SD. Sample size for each area (YQ: 9, LW: 18, LG: 9, RA: 13).
YQLGRALW
Bacterial quantity2.58 ± 0.77 b3.18 ± 1.28 b7.3 ± 2.22 ab9.17 ± 1.89 a
Fungal quantity0.79 ± 0.11 c2.06 ± 0.96 b2.13 ± 0.82 a3.42 ± 0.98 a
Bacterial diversity6.63 ± 0.29 ab6.23 ± 0.49 c6.42 ± 0.34 bc6.75 ± 0.26 a
Fungal diversity4.09 ± 0.35 a4.12 ± 0.28 a3.73 ± 0.40 b3.89 ± 0.44 ab
AG (nmol g−1 h−1)9.41 ± 8.39 a3.62 ± 1.21 b4.32 ± 2.20 b4.03 ± 2.98 b
BG (nmol g−1 h−1)14.59 ± 9.62 b21.71 ± 12.57 ab32.79 ± 25.18 a31.25 ± 14.3 a
CB (nmol g−1 h−1)3.77 ± 1.52 a2.28 ± 0.70 b3.10 ± 1.91 ab3.06 ± 0.78 ab
XYL (nmol g−1 h−1)2.38 ± 0.89 b4.20 ± 1.44 ab5.88 ± 3.12 a5.23 ± 3.05 a
NAG (nmol g−1 h−1)7.51 ± 5.62 c10.92 ± 5.78 bc18.00 ± 9.06 a15.12 ± 5.16 ab
LAP (nmol g−1 h−1)19.73 ± 8.60 b17.71 ± 5.09 b27.01 ± 8.23 a13.76 ± 5.48 b
PHOS (nmol g−1 h−1)12.43 ± 10.34 b26.68 ± 11.85 ab54.50 ± 43.86 a40.18 ± 35.01 ab
Table 5. Principal component analysis (PCA) of soil indicators. BD, bulk density; SOC, soil organic carbon; TN, total nitrogen; AP, available phosphorus; AK, available potassium; CEC, cation exchange capacity; TWS, total water-soluble salts; AG, α-glucosidase; BG, β-glucosidase; CB, β-D-cellobiosidase; XYL, β-xylosidase; LAP, leucine aminopeptidase; NAG, β-N-acetyl glucosaminidase; PHOS, acid phosphatase.
PC 1PC 2PC 3PC 4PC 5PC 6PC 7
pH−0.12−0.11−0.180.530.090.17−0.05
SOC0.350.19−0.10−0.010.100.040.00
TN0.340.20−0.010.050.23−0.010.02
AN0.210.16−0.080.080.38−0.040.02
AP0.12−0.020.22−0.460.08−0.07−0.14
AK0.01−0.230.34−0.120.360.170.05
TWS0.06−0.270.36−0.130.110.05−0.08
CEC0.22−0.05−0.18−0.24−0.120.17−0.13
BD−0.18−0.080.31−0.05−0.270.100.07
Available iron0.300.00−0.10−0.10−0.11−0.27−0.21
Available manganese0.31−0.020.20−0.010.050.26−0.12
Available copper0.31−0.14−0.020.12−0.260.02−0.15
Available zinc0.36−0.06−0.010.09−0.170.00−0.15
Bacterial quantity0.050.17−0.05−0.080.33−0.460.24
Fungal quantity−0.210.25−0.09−0.220.08−0.060.12
Bacterial diversity0.120.14−0.37−0.12−0.230.270.34
Fungal diversity0.15−0.080.01−0.040.160.460.57
LAP0.010.090.220.460.10−0.07−0.05
AG0.240.040.290.24−0.05−0.280.35
BG−0.040.410.17−0.08−0.140.05−0.08
CB0.150.250.350.12−0.350.020.14
NAG−0.120.390.07−0.02−0.100.01−0.03
PHOS−0.040.26−0.040.080.280.33−0.42
XYL−0.070.390.22−0.020.000.23−0.07
Eigenvalue5.354.322.301.831.701.371.02
Variance contribution rate %22.28%17.98%9.59%7.62%7.07%5.73%4.27%
Cumulative contribution rate %22.28%40.26%49.86%57.47%64.54%70.27%74.54%
Table 6. Communality and weight of soil quality indicators in the minimum data set. SOC, soil organic carbon; TN, total nitrogen; AN, available nitrogen; AK, available potassium; TWS, total water-soluble salts; BG, β-glucosidase; CB, β-D-cellobiosidase.
CommunalityWeight
pH0.380.10
SOC0.180.05
TN0.210.06
AN0.230.06
AK0.350.09
TWS0.240.06
Available zinc0.200.05
Bacterial quantity0.410.11
Bacterial diversity0.420.11
Fungal diversity0.600.16
BG0.230.06
CB0.360.09
Disclaimer/Publisher’s Note: The statements, opinions and data contained in all publications are solely those of the individual author(s) and contributor(s) and not of MDPI and/or the editor(s). MDPI and/or the editor(s) disclaim responsibility for any injury to people or property resulting from any ideas, methods, instructions or products referred to in the content.