
Article

Soil Characteristics Rather than Starter Phosphorus Control Active Carbon Pools and Enzyme Activities in High-Legacy-Phosphorus Soils

1
Agassiz Research and Development Centre, Agriculture and Agri-Food Canada, 6947 Highway 7, P.O. Box 1000, Agassiz, BC V0M 1A0, Canada
2
Department of Soils and Agri-Food Engineering, Paul Comtois Bldg., Laval University, Quebec, QC G1K 7P4, Canada
3
Faculty of Land and Food Systems, The University of British Columbia, 202-2357, Main Hall, Vancouver, BC V6T 1Z4, Canada
4
Department of Environmental Engineering, Faculty of Engineering, Chiang Mai University, Chiang Mai 50200, Thailand
5
Office of Research Administration, Chiang Mai University, Chiang Mai 50200, Thailand
*
Author to whom correspondence should be addressed.
Soil Syst. 2026, 10(7), 84; https://doi.org/10.3390/soilsystems10070084
Submission received: 10 June 2026 / Revised: 14 July 2026 / Accepted: 19 July 2026 / Published: 22 July 2026
(This article belongs to the Special Issue Land Use and Management on Soil Properties and Processes: 2nd Edition)

Abstract

This study aimed to disentangle the relative influence of inherent soil properties and annual starter P fertilization on active carbon (C) pools and C-, nitrogen (N)-, and phosphorus (P)-cycling enzyme activities in silage corn production systems with high-legacy P. Six fields with Mehlich-3 P ranging from 53.5 to 332 mg kg−1 were investigated in 2020 and 2021 in the Fraser Valley, Canada. The experiments at each site consisted of five starter P rates (0, 5, 10, 15, and 20 kg P ha−1 as triple super phosphate) arranged in a randomized complete block design with four replicates. Soil samples were collected at the V3 and V6 stages of silage corn and analyzed for active C, soil enzyme activities, and chemical properties. N-acetyl-β-glucosaminidase varied significantly across the six sites, suggesting substantial differences in the rate of C and N cycling. For instance, in 2020, N-acetyl-β-glucosaminidase was similar at Sites 1 and 2 at V6 and was approximately three times (514.51 pmol MUF g−1 soil h−1) higher than at Site 3 (170.29 pmol MUF g−1 soil h−1). Similarly, in 2021, a 2.8-fold higher MBC observed at Site 4 at V6, compared with the averages of Sites 5 and 6, further confirms an active C pool. Meanwhile, sites with the lowest MBC concentrations were linked to acidic soils (pH 5.3), and a negative correlation between inherent site–year characteristics and enzyme activities confirm enzymes repression. Acid phosphatase at Site 4 was 3-fold higher than at Site 5 and Site 6, while alkaline phosphatase was detected only at Site 4. We conclude that long-term soil conditions are the main factors influencing biological functionality, thereby overshadowing transient fertilization. This indicates that Fraser Valley farmers can prioritize long-term soil health management and safely reduce starter P applications in these high-legacy systems.

1. Introduction

Soil is an intricate ecosystem characterized by complex interactions between biotic and abiotic components that govern processes such as nutrient cycling and the maintenance of soil fertility [1]. As the largest terrestrial carbon (C) reservoir, the soil organic C (SOC) pool plays a pivotal role in sustaining soil health [2,3]. However, conventional agricultural practices, especially excessive use of mineral fertilizers, can adversely affect soil structure, fertility, and microbial function, thereby limiting crucial soil processes [4,5,6]. Effective nutrient management and resource efficiency require elucidating the dual role of microorganisms in C cycling, acting both as decomposers of organic matter and contributors to stable microbial C accumulation [2,7]. Meanwhile, soil enzyme activity serves as a proxy for microbial activity and is a crucial indicator of soil health. These extracellular enzymes act as catalysts that enhance the breakdown of complex organic substrates, supplying C, nitrogen (N), and phosphorus (P) needed for microbial assimilation and plant uptake [8,9,10]. Thus, sustainable agricultural strategies, such as integrating manure or crop rotation, are essential for improving soil fertility and enhancing overall soil ecosystem functioning [11,12].
In coastal British Columbia (BC), Canada, agricultural practices have led to widespread high-legacy soil P, particularly in the intensive peri-urban agricultural sector of the Fraser Valley [13,14,15]. The continual application of dairy and poultry manures, alongside chemical fertilizers, contributes substantial annual P inputs that often exceed crop needs, leading to excessive soil P concentrations [16,17]. The dominant agricultural system in this region, i.e., silage corn and forage grass rotation, historically involves an annual P surplus, contributing to the persistent legacy P problem [18]. A series of field experiments in the Fraser Valley indicated that local starter P recommendations are excessive, demonstrating that critical starter P rates can be significantly reduced without affecting final silage corn yield, especially in soils that already have high P concentrations [13,14,15]. This suggests that the large pool of legacy soil P and animal manure, which is usually applied annually at ploughing, can often supply sufficient phosphates throughout the growing season, overriding the perceived need for high initial starter fertilizer P inputs [13,14]. While these yield-based studies provide practical management thresholds, a significant knowledge gap persists regarding the underlying biological mechanisms and nutrient cycling dynamics that support this resilience [13,14]. Specifically, it remains poorly understood whether transient, annual nutrient inputs like starter P exert any meaningful influence on active C pools and the activities of enzymes responsible for C, N, and P cycling when compared with the persistent influence of long-term inherent soil properties [5]. Furthermore, existing research presents conflicting evidence on how mineral fertilization affects microbial biomass, highlighting the need to disentangle the relative impact of immediate fertilization from historical soil management legacies in intensive agricultural environments [8,9,10].
Understanding how to sustainably manage these high-P systems requires insight into the underlying mechanisms controlling soil biological activity, especially those involved in nutrient cycling. For instance, Feng et al. [5] observed that applying N fertilizer continuously for six years increased microbial biomass C (MBC) due to its strong association with increased soil C, as it disturbed the mineral protection of organic matter. In contrast, Kamran et al. [19] showed that long-term application of mineral fertilizers actually accelerates C loss, which was also linked to a reduced aggregate stability. Existing research suggests a profound disconnect between short-term fertilizer inputs and the fundamental drivers of soil health, particularly those related to nutrient cycling and C sequestration. Studies show that minor and transient inputs, such as starter P, do not significantly alter short-term active C pools [2,7,20,21,22]. Instead, long-term inherent site characteristics, including SOC, total N, clay content, and pH, are the main factors driving the activities of active C pools and the key enzyme activities related to C, N, and P cycling [2,21,22]. Moreover, microbial communities often repress the production of P-acquiring enzymes to conserve energy in high-legacy P soils [23,24,25,26]. This confirms that microbial metabolic investment is governed by overall resource sufficiency, as dictated by long-term management and legacy status, overshadowing the acute effects of minor fertilizer inputs.
Therefore, a comprehensive assessment is critical to fully integrate these biological constraints into the refinement of P management for agricultural sustainability in P-sensitive regions. This study aimed to disentangle the relative influence of inherent soil properties and annual starter P fertilization on active C pools and C-, N-, and P-cycling enzyme activities in silage corn production systems with high legacy P. We hypothesized that inherent soil characteristics exert a dominant influence on soil biochemical function relative to annual starter P applications in high-legacy P soil environments.

2. Materials and Methods

2.1. Site Description

Three field trials in 2020 and another three in 2021 were conducted in Agassiz, Chilliwack, and Rosedale in the Fraser Valley, BC, Canada. Soils in these sites belong to the subgroups of Orthic Humic Gleysols (Site 1), Rego Gleysols (Site 2), Luvic Gleysol (Site 3), Rego Humic Gleysols (Site 4), Eluviated Eutric Brunisol (Site 5), and Dark Gray Luvisol (Site 6) [27]. As described by Nyamaizi et al. [14,15], five sites (Sites 1, 2, 3, 4, and 5) had a loam texture and one site (Site 6) had a sandy loam texture. The minimum and maximum initial soil properties across the sites were: total C 1.30–3.49%; total N 0.10–0.32%; C:N ratio 9.4–13.7; PM3 53.5–332 mg kg−1; KM3 97.5–280 mg kg−1; MgM3 114–315 mg kg−1; CaM3 660–1485 mg kg−1; AlM3 791–2065 mg kg−1; FeM3 37–386 mg kg−1; pH 5.3–6.3; and cation exchange capacity (CEC) 9.7–14.2 meq(+)/100 g (Table 1). Detailed information about the studied sites can be found in Nyamaizi et al. [14,15].
The climate in the region is moderate oceanic with relatively cool, dry summers and warm, rainy winters. Annual rainfall ranges from 1483 to 1689 mm, with a peak of 280–350 mm in November. The normal temperature range is from 3.4 °C in January to 18.7 °C in August (Agassiz Climate Daily Almanac—Agassiz CDA station). On average, the 2021 soil temperatures were warmer than in the 2020 growing season. A detailed description of weather conditions over the two years of the study period can be found in the study by Nyamaizi et al. [14,15].

2.2. Experimental Design and Treatments

The six trials consisted of five treatments of starter P rates (0, 5, 10, 15, and 20 kg P ha−1). The treatments were set in a randomized complete block design with four replicates for a total of 20 experimental plots (10 m × 5 m). Starter fertilizer P treatments were applied as a single application as triple super phosphate (0-46-0) by hand, 5 cm from the seeding row of silage corn, and buried to a depth of 5 cm in the soil to mimic mechanized applications at planting. All fields were sprayed in the spring with Roundup [glyphosate(N)-phosphonomethyl glycine at 1000 g ha−1] to eradicate weeds. The fields were conventionally tilled in late spring to a 30 cm depth using a moldboard plough, and dairy manure (applied at 50 kg P ha−1) was mechanically incorporated, followed by harrowing and disking to a depth of 10 cm. No manure was applied to Site 5 because it was established in a manure-restricted location. Site 5 was under grass for the past five years prior to this study. Nitrogen was applied as urea (46% N) at provincially recommended rates of 150 kg N ha−1. Starter fertilizer N at 30 kg N ha−1 was band-applied at seeding using a disk opener, and a supplement of N fertilizer was side-dressed at the V6 stage. Glyphosate-tolerant silage corn was seeded in late May to early June at 86 × 103 plants ha−1 with a 75 cm row spacing and six rows per plot. After emergence, Roundup (1000 g ha−1) was applied twice between the V3 and V6 stages, in accordance with provincial recommendations. Details on the chemical properties of dairy manure and field activities, including planting, harvesting, and sampling dates, are presented in Nyamaizi et al. [14,15].

2.3. Rhizosphere and Plant Sample Collection and Analysis

Two corn plants were randomly selected from the innermost rows of each plot at the V3 and V6 stages. Briefly, the plants were uprooted using a shovel and separated at the collar with scissors. The shovel and scissors were cleaned with alcohol after use between plots to mitigate microbial contamination. The plant stumps were placed in a plastic bag and kept in a portable cooler on ice during fieldwork. The above-ground parts were placed in cryobags and kept in a different box. All harvested materials collected from each field were transported to the lab at Agassiz RDC. In the lab, the plant stumps were removed from the plastic bags, placed in a tray, and shaken off by hand to remove the loose soil. The soil that remained firmly attached to the roots after intensive agitation was considered the rhizosphere [28]. The rhizosphere soil was carefully removed from the roots of the two stumps with a spatula (avoiding inclusion of root fragments), mixed, and divided into two portions. One part of the rhizosphere soil was placed in a plastic bag and kept frozen at −20 °C prior to microbial and enzyme assay analyses. The second part was air-dried and sieved to 2 mm prior to other chemical analyses. At the V6 stage, only three of the four blocks were sampled due to the heavy workload of enzyme analysis.
The potential soil enzyme activities of β-glucosidase (C cycling), N-acetyl-β-glucosaminidase (C and N cycling), acid and alkaline phosphatase activities (P cycling), and arylsulphatase (sulfur cycling) were measured using a microplate fluorimetric assay method [29]. The reagent used for the assays included (i) modified universal buffer (MUB) (pH 5.5 for assessment of N-acetyl-β-glucosaminidase, pH 6.0 for β-glucosidase and acid phosphatase, and pH 8.5 for alkaline phosphatase) stored at 4 °C; (ii) 1 mM methylumbelliferyl (MUF) substrates including MUF β-D-glucoside (M3633, Sigma-Aldrich Chemical, St. Louis, MO, USA), MUF N-acetyl-β-glucosaminidase (M2133, Sigma-Aldrich Chemical), and MUF phosphate (M8883, Sigma-Aldrich Chemical) stored at 4 °C; (iii) p-nitrophenyl sulphate buffered at pH 6.0 for arylsuphatase; (iv) 0.5 M NaOH used to terminate the enzymatic reaction; and (v) methylumbelliferyl working standards (MUF working standards): 0, 5, 10, 20, and 30 µM MUF standards stored in the dark at 4 °C.
Frozen soil was thawed at room temperature. Then, 1.0 g of soil was mixed with 120 mL of deionized water in a beaker for 30 min at 600 rpm on a stir plate. To analyze the first four enzymes, four black microplates were prepared by adding 50 µL of each MUB reagent and 50 µL of MUF to each well. Then, 100 µL of the stirred suspension was pipetted into each well with a multichannel pipette. The microplates were shaken up and down 10 times to thoroughly mix the solutions. The microplates with the mixtures were covered with parafilm and incubated at 37 °C for 1 h in the dark. To terminate the enzymatic reaction and increase the fluorescence signal and detection, 50 µL of 0.5 M NaOH was added to each well. Deng et al. [30] showed that the relative signal remains stable under the stated conditions for several hours. The same procedure was used to prepare calibration curves, but MUF substrates were replaced by the MUF working standard. Controls were also prepared using the same procedure, but the substrate was added following the addition of 0.5 M NaOH. The autohydrolysis during the incubation period was performed using deionized water instead of the soil suspension. Immediately after the end of the enzyme reaction, fluorescence was quantified using a fluorescence plate reader (TwinkleTM Fluorescent Reader, Berthold Technologies USA, Oak Ridge, TN, USA) with 355 nm excitation and 460 nm emission. Then, we used a bench-scale assay to measure arylsulphatase activity. In brief, 1 g of soil was incubated with p-nitrophenyl sulphate in a buffered medium at pH 6.0 and 37 °C. The p-nitrophenol produced by the enzyme was quantified by colorimetric analysis using a microplate reader (Synergy HTX multi-mode reader, Biotek, Santa Clara, CA, USA) at 420 nm [31].
Soil MBC was estimated using the substrate respiration method described by Horwath and Paul [32]. Briefly, a solution containing 300 mg of glucose, prepared in 4.5 to 6.0 mL of water, was added to 50 g of air-dried soil to achieve 50% water-holding capacity. The amount of water added was determined based on the soil’s water content and water-holding capacity. The soil was mixed by stirring and incubated for 3 h at 22 °C in a 1 L jar. Analyses of the CO2 accumulated in the headspace were performed using gas chromatography (Model 3800, Varian Inc., Walnut Creek, CA, USA) equipped with a flame ionization detector. The active C or permanganate oxidizable C (POXC) was determined as described by Weil et al. [33]. Briefly, 2.50 g of air-dried soil was mixed with 18.0 mL of deionized water and 2.0 mL of 0.2 M KMnO4 solution in a dark 50 mL centrifuge tube. The tube was shaken at 180 rpm for 2 min and allowed to settle for 10 min. The supernatant was analyzed by colorimetry using a microplate reader (Synergy HTX multi-mode reader, Biotek) at 550 nm.

2.4. Statistical Analyses

All the data were analyzed using the lmer4 package in R version 4.3.1 [34]. Prior to analysis, the data were tested for the normality assumption of the residuals using the Shapiro–Wilk test and homogeneity of variance using Bartlett’s test. Where these assumptions were violated, appropriate transformations were applied to satisfy statistical requirements; however, the majority of the parameters met these criteria in their original form. Two-way analysis of variance (ANOVA) was performed with starter fertilizer P, with site and two-way interaction as fixed effects, while blocks were treated as a random effect at the V3 and V6 stages for each year independently. For variables where ANOVA F-tests were significant, mean comparisons were performed to compare the different starter P rates and sites using least square means (LSMs) and the Tukey multiple comparison procedure in the emmeans package. The statistical significance level, p = 0.05, was considered for all analyses. A principal component analysis (PCA) with contribution arrows was conducted using Factominer. Euclidean vectors were developed using the function prcomp() and fviz_pca_biplot() in the “factoextra” package (version.1.07) to determine the relationship between soil enzyme activities, corn DM weight at the V3 and V6 stages, plant P concentrations, and soil chemical properties obtained from Nyamaizi et al. [14,15]. We performed a Pearson correlation analysis using the corrplot and cor.mtest packages to assess linear relationships between variables.

3. Results

3.1. Active Carbon and Soil Microbial Biomass Carbon

In 2020, POXC and MBC were not affected by starter P applications at both V3 and V6 stages of silage corn (Table 2). In contrast, POXC varied significantly among the three sites during the two growth stages (Table 2). At V3, POXC was markedly higher at Site 2 (637.0 mg kg−1), followed by Site 3 (538.3 mg kg−1) and Site 1 (429.0 mg kg−1) (Table 2). At V6, POXC was markedly higher at Site 1 and Site 2, with an average concentration of 601.75 mg kg−1 compared with Site 3 (460.8 mg kg−1) (Table 2). Meanwhile, MBC did not differ significantly among the three sites at V3 (Table 2). However, at V6, distinct variations appeared, with Site 1 and Site 2 showing comparable MBC concentrations of 683.09 mg MBC kg−1 of soil, roughly twofold the level at Site 3 (362.4 mg kg−1; Table 2).
In 2021, POXC and MBC were not affected by starter P applications, while site differences were observed at both V3 and V6 stages of silage corn. This result is similar to what was observed in 2020 above. At V3, POXC was markedly higher at Site 4 (842.7 mg kg−1), followed by Site 5 (580.2 mg kg−1) and Site 6 (369.2 mg kg−1) (Table 3). A similar trend was observed at V6: Site 4 (881.7 mg kg−1) > Site 5 (608.9 mg kg−1) > Site 6 (461.3) mg kg−1) (Table 3). Similarly, MBC concentration was markedly higher at Site 4 (950.6 mg kg−1), followed by Site 5 (558.8 mg kg−1) and Site 6 (285.5 mg kg−1) at the V3 stage (Table 3). This disparity became particularly pronounced by the V6 stage, where MBC at Site 4 with 943.0 mg kg−1 was 2.8 times higher than the levels obtained at both Site 5 and Site 6 with an average of 325.76 mg kg−1 (Table 3).

3.2. Starter P Effects on Soil Enzyme Activity

3.2.1. β-Glucosidase, N-Acetyl-β-Glucosaminidase, and Arylsulphatase

In 2020 and 2021, the activities of β-glucosidase, N-acetyl-β-glucosaminidase, and arylsulphatase were not affected by starter P applications at V3 and V6 stages of silage corn. In contrast, the activity of the three enzymes varied significantly among the sites during the two growth stages across both years (Table 2). In 2020, a general pattern emerged where Site 1 and Site 2 exhibited higher enzyme activities compared with Site 3. Specifically, β-glucosidase was on average 795.62 pmol MUF g−1 soil h−1 across Site 1 and Site 2, which is 1.5 times higher than Site 3 with 522.2 pmol MUF g−1 soil h−1 at the V3 stage (Table 2). This trend carried over to V6, with Site 1 and Site 2 exhibiting β-glucosidase levels 1.83 times higher than at Site 3 (Table 2). N-acetyl-β-glucosaminidase was significantly higher at Site 2 with 391.1 pmol MUF g−1 soil h−1 than at Site 1 and Site 3, with an average activity of 256.86 pmol MUF g−1 soil h−1 at the V3 stage (Table 2). This trend did not carry over to V6, as Site 1 and Site 2 had significantly higher N-acetyl-β-glucosaminidase levels than Site 3 (Table 2). Arylsulphatase was significantly higher at Site 2, with activity of 212.9 mg p-nitrophenyl kg−1 h−1, followed by Site 1 with activity of 129.4 mg p-nitrophenyl kg−1 h−1 and Site 3 with 80.7 mg p-nitrophenyl kg−1 h−1 at the V3 stage. A slight discrepancy among the three sites was obtained at V6 relative to V3, with Site 1 and Site 2 exhibiting activities 2.3 times higher than at Site 3.
In 2021, the activity of the three enzymes varied significantly among the three sites during the two growth stages (Table 2). Site 4 emerged as the most active site among the three enzymes. Specifically, β-glucosidase at Site 4 was roughly 3- and 5-fold higher than at Site 5 and Site 6, respectively, across V3 and V6 stages (Table 3). N-acetyl-β-glucosaminidase at Site 4 (976.7 pmol MUF g−1 soil h−1) was 6 times higher than at Site 5 and Site 6 (155.93 pmol MUF g−1 soil h−1) across V3 and V6 stages (Table 3). Arylsulphatase was significantly higher at Site 4 with activity of 277.7 mg p-nitrophenyl kg−1 h−1, followed by Site 5 with activity of 128.4 mg p-nitrophenyl kg−1 h−1 and, finally, Site 6 with 79.7 mg p-nitrophenyl kg−1 h−1 across V3 and V6 stages (Table 3). This stable ranking suggests that soil factors inherent to these sites had a persistent impact on enzyme dynamics as silage corn grew from V3 to V6.

3.2.2. Acid and Alkaline Phosphatases

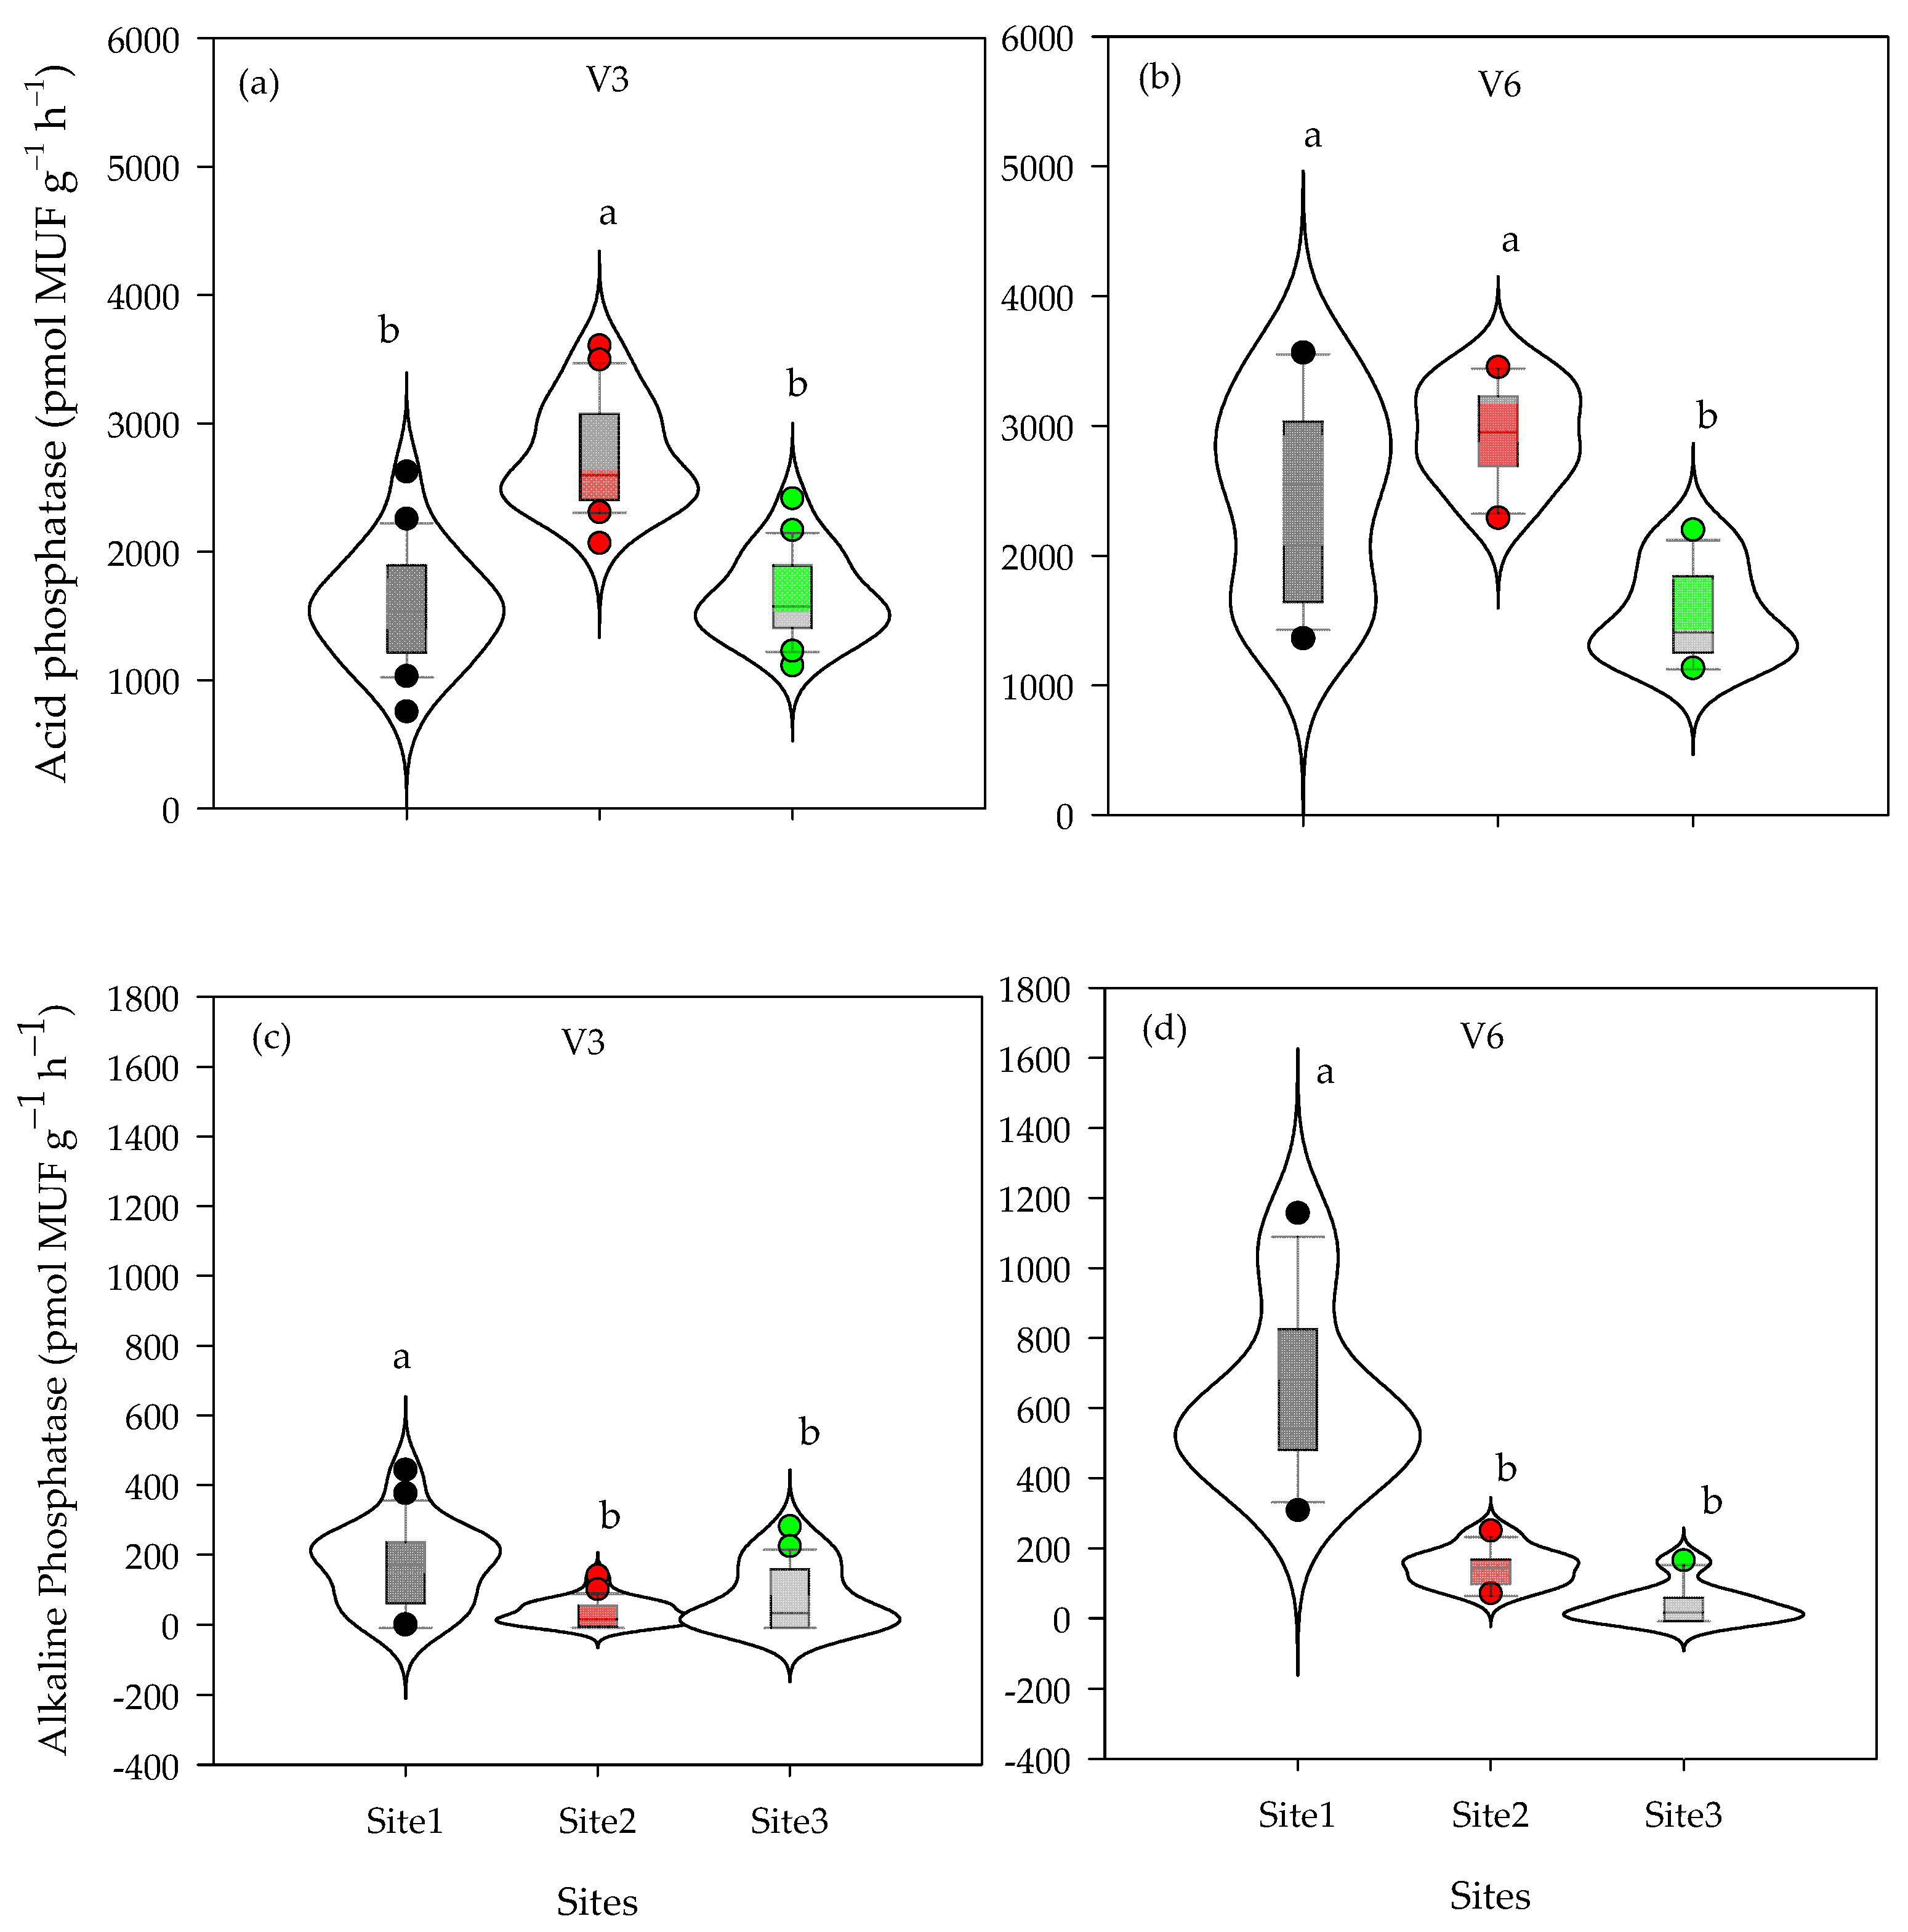
In 2020 and 2021, acid and alkaline phosphatases were unaffected by starter P applications at the V3 and V6 stages of silage corn. In contrast, the two enzymes varied significantly among the sites during the two growth stages across both years. In 2020, the activity of acid phosphatases was markedly higher at Site 2 with 2756 pmol MUF g−1 soil h−1, but averaged 1609.55 pmol MUF g−1 soil h−1 at Site 1 and Site 3 at the V3 stage (Figure 1a). Site 2 and Site 1 had similar activities, averaging 2698.85 pmol MUF g−1 soil h−1, which is 1.7 times higher than at Site 3 with 1557.49 pmol MUF g−1 soil h−1 at the V6 stage (Figure 1b). The activity of alkaline phosphatases at Site 1 was 172.62 pmol MUF g−1 soil h−1, which is 2.8 times that of Site 2 and Site 3 with 61.61 pmol MUF g−1 soil h−1 at the V3 stage (Figure 1c). However, by the V6 stage, the activity of alkaline phosphatases at Site 1 was 9.8 times higher than at Site 2 and Site 3 (Figure 1d).
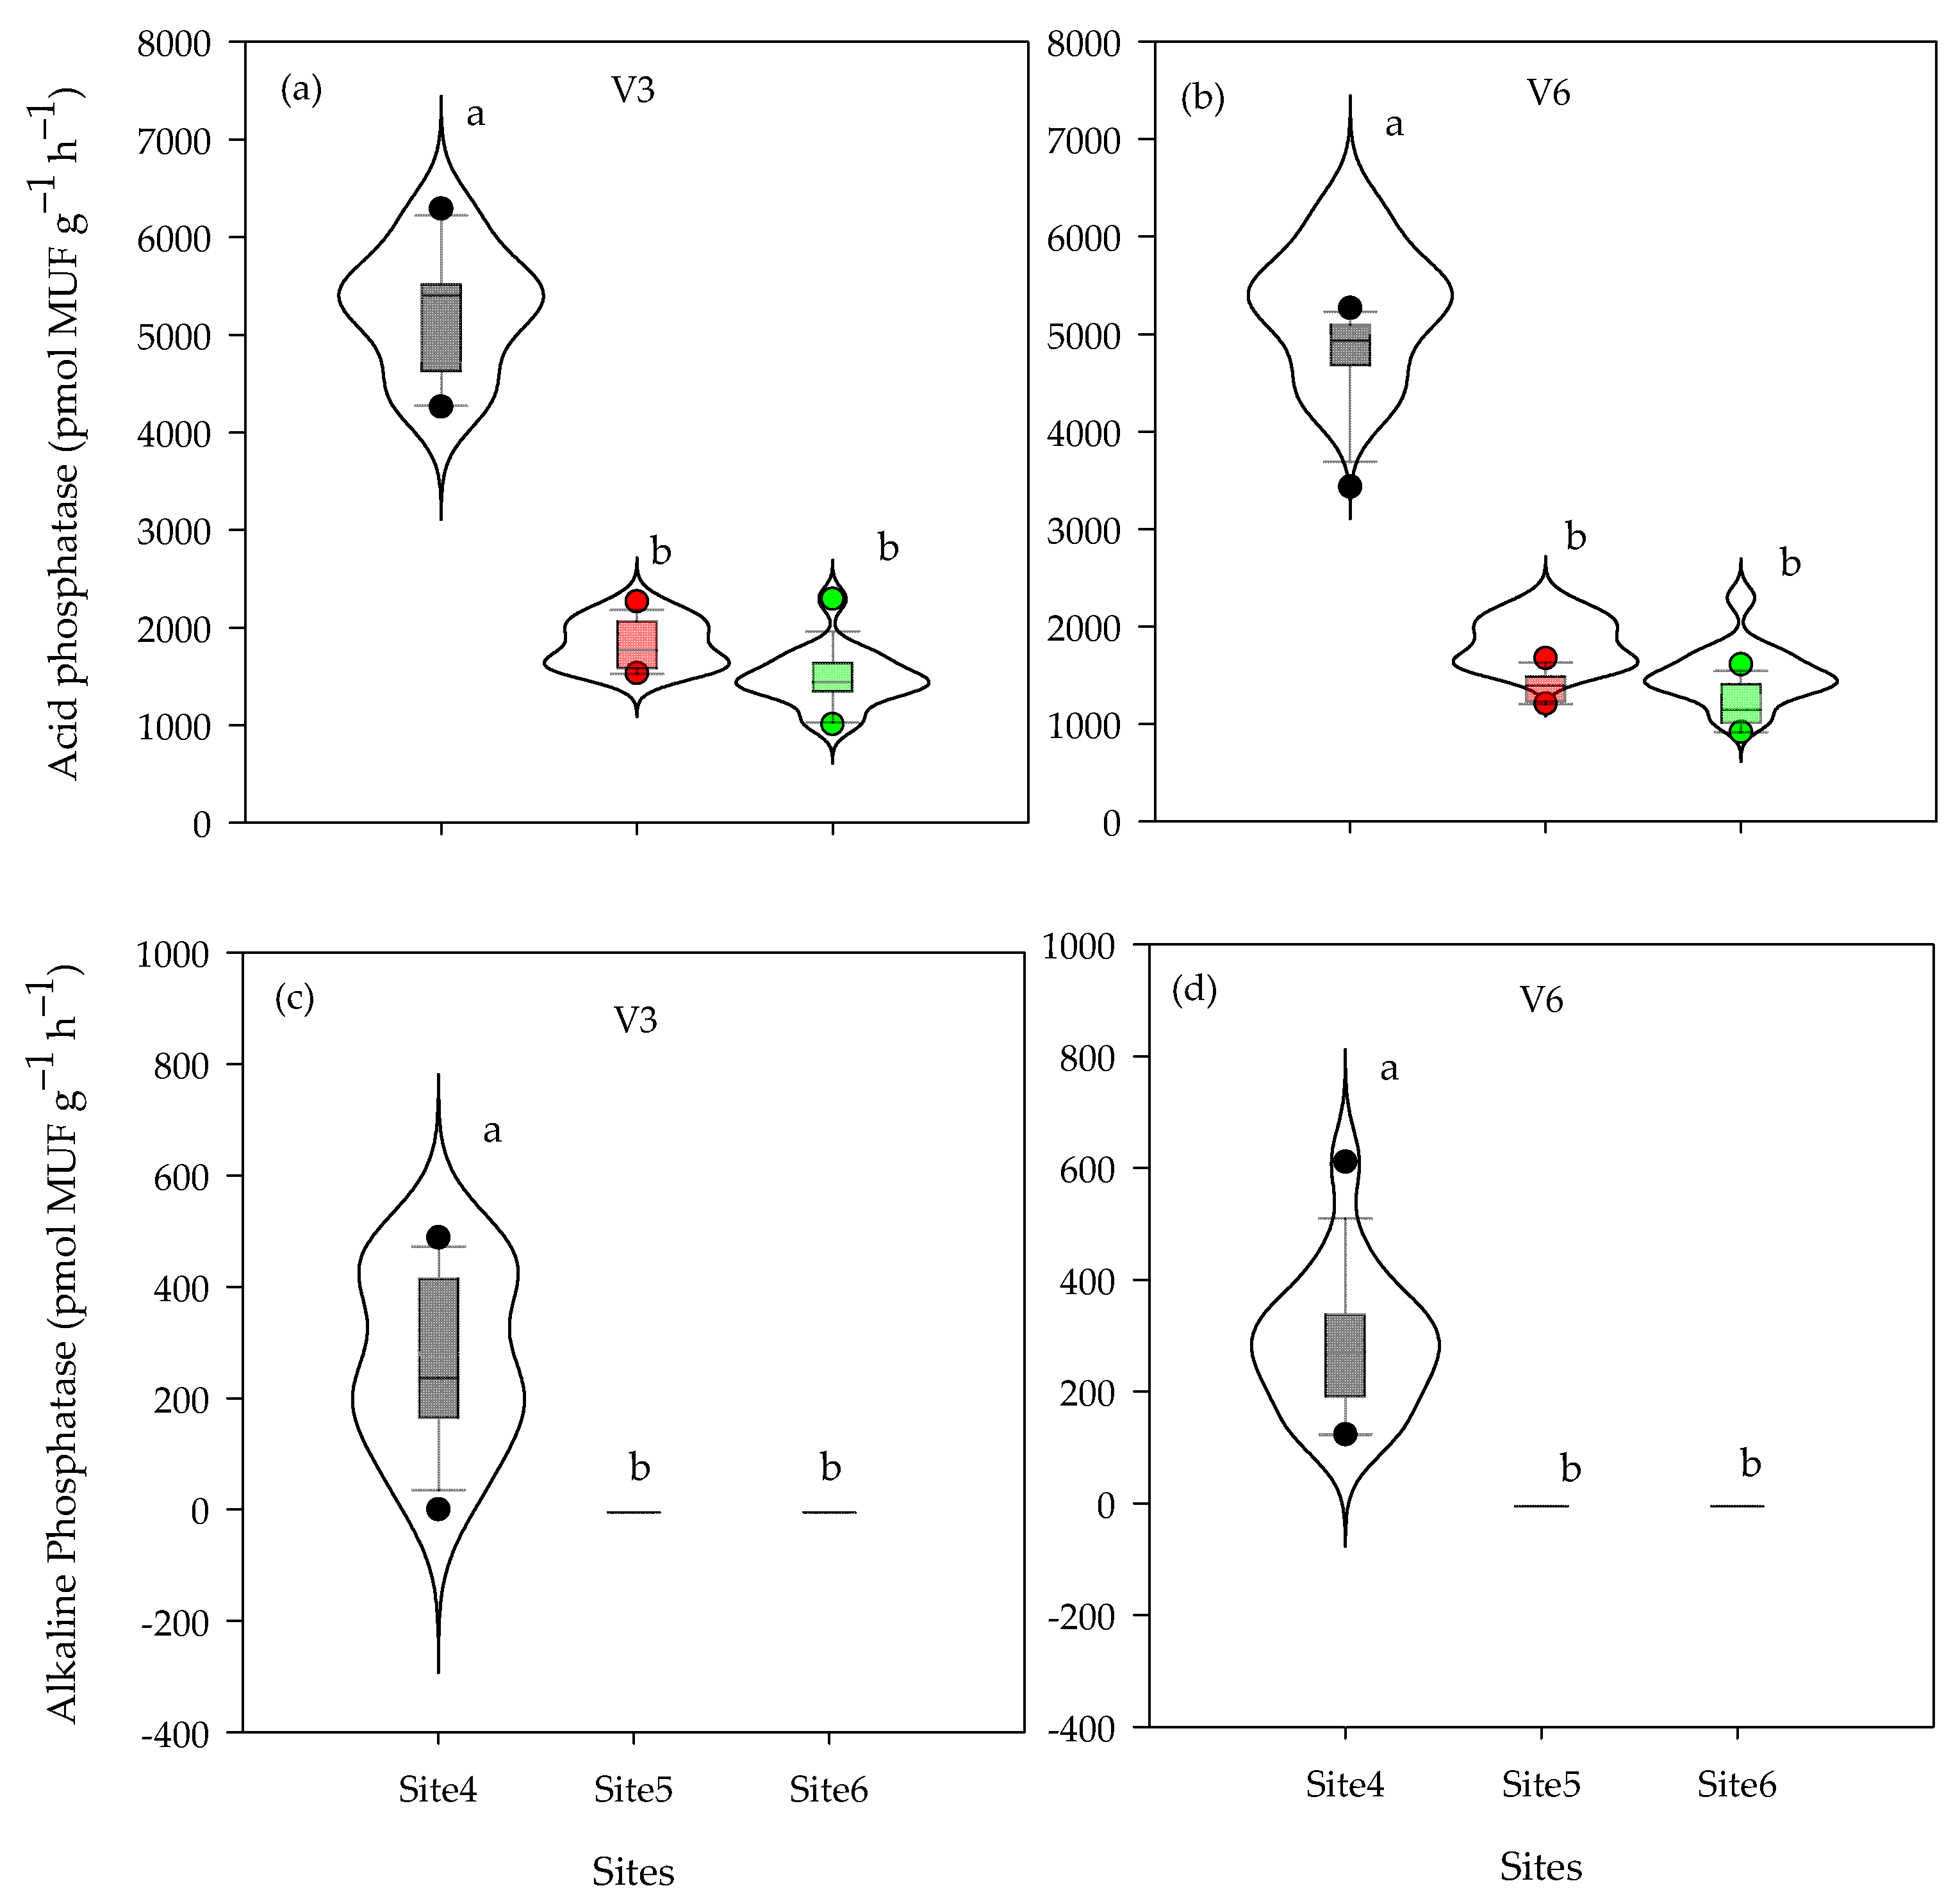
In 2021, Site 4 exhibited an activity of acid phosphatases of 5353.35 pmol MUF g−1 soil h−1, which is 3-fold higher than the average activity obtained at Site 5 and Site 6 with 1661.61 pmol MUF g−1 soil h−1 at the V3 stage (Figure 2a). The activity of acid phosphatases remained consistent towards the V6 stage, with Site 4 exhibiting levels 3.6 times higher than at Site 5 and Site 6 (Figure 2b). Among the three sites, the activity of alkaline phosphatases was observed only at Site 4 with 272.21 pmol MUF g−1 soil h−1 at V3 (Figure 2c) and 287.69 pmol MUF g−1 soil h−1 at V6 (Figure 2d); it was 0.0 pmol MUF g−1 soil h−1 at Site 5 and Site 6 (Figure 2c,d).

3.3. Relationships Between Soil Enzyme Activity, Plant P Concentrations, Corn DM Weight, and Soil Chemical Properties

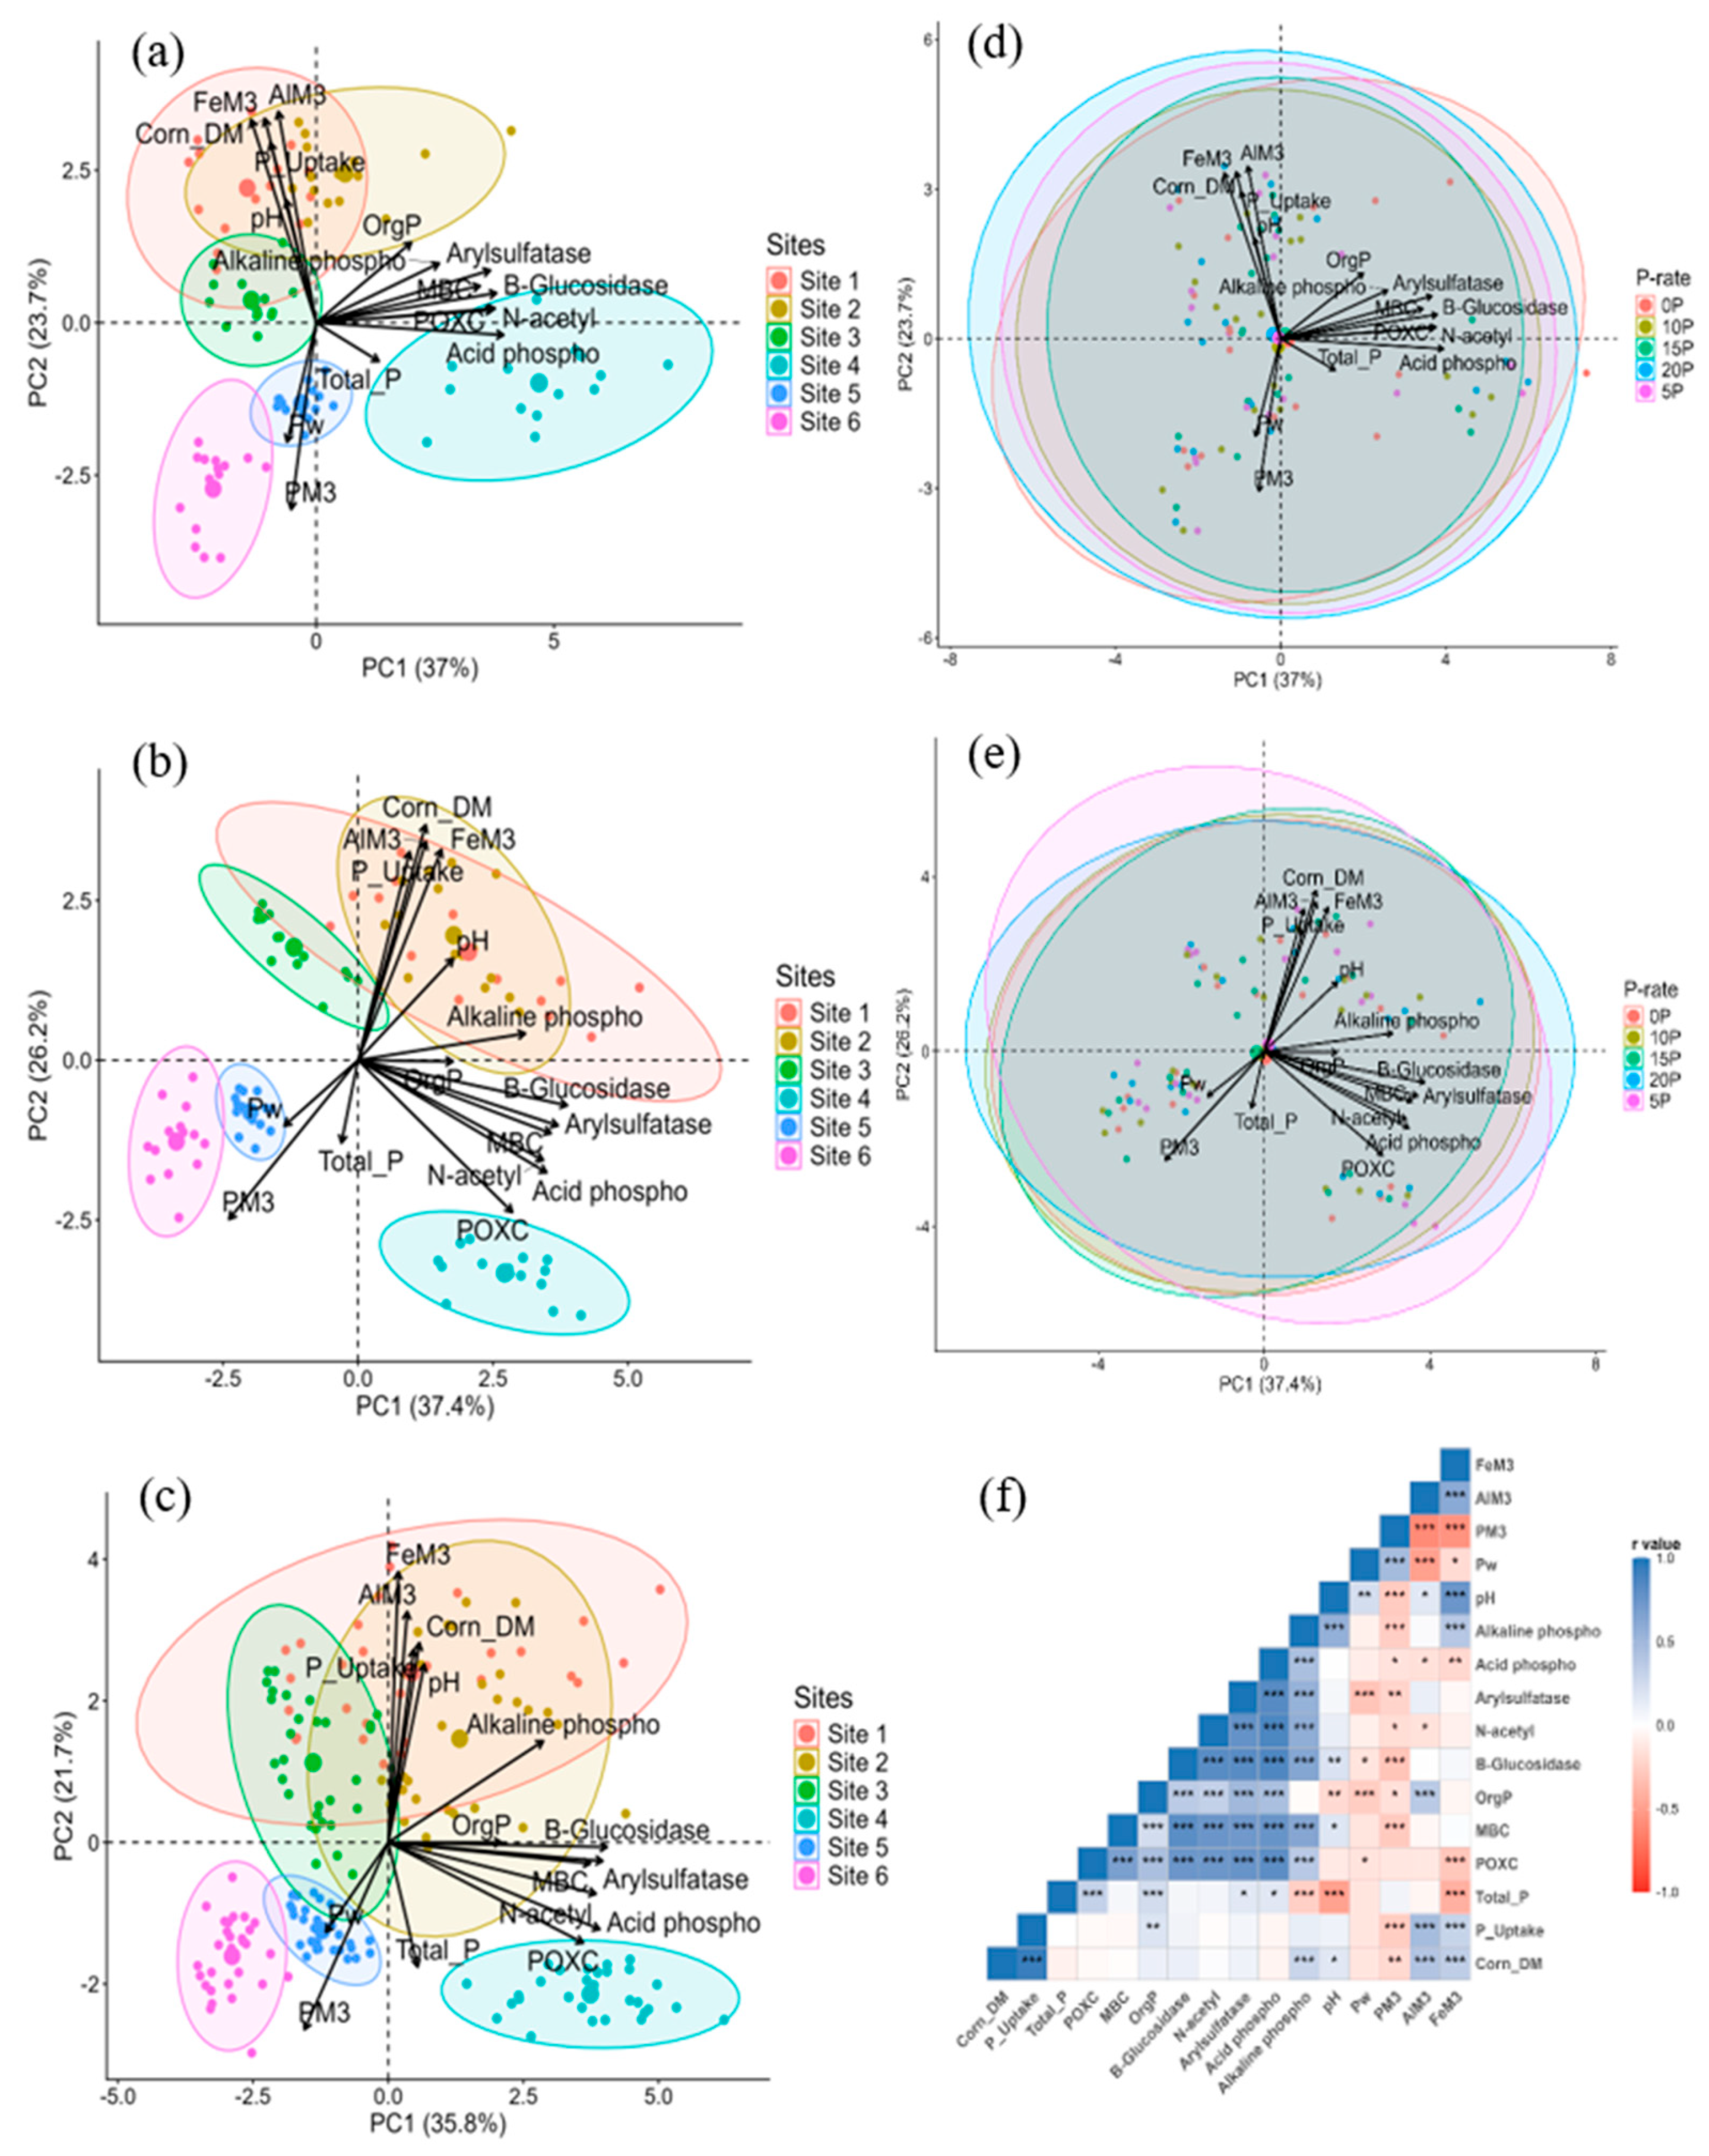
The results, visualized through PCA biplots (Figure 3a–e) and a correlation matrix (Figure 3f), describe the relationships among measured soil chemical properties, soil biological activity indicators, and crop production metrics in the topsoil (0–15 cm depth). The PCA consistently revealed that the first principal component (PC1) accounted for the largest portion of the variance (35.8% to 37.4%) across the analyses. Active C pools (POXC and MBC) and nearly all measured enzyme activities, except alkaline phosphatases, clustered strongly together and projected along the positive axis of PC1. This demonstrates significant positive correlations. Measures of readily available P, specifically PM3 and Pw, projected strongly along the negative axis of PC1. This opposition of vectors demonstrates a pronounced negative correlation between PM3 and Pw, and the entire cluster of biological activity indicators and active C pools. Total P is also projected close to PM3 and Pw, supporting this trend.
The second principal component (PC2), which explained 21.7% to 26.2% of the variance, clustered crop production metrics and aluminum and iron. Corn DM and corn P uptake clustered and projected along the positive axis of PC2 alongside AlM3 and FeM3. The vectors for corn DM and corn P Uptake generally opposed the vectors for PM3 and Pw in the biplots, reinforcing the finding of a negative correlation between high corn yield and P uptake and readily available P levels.
When samples were grouped by site (Figure 3a–c), distinct spatial separation was observed. Site 4 was consistently associated with higher positive PC1 scores, aligning with elevated biological activity indicators. Conversely, Site 6 aligned strongly with negative PC1 scores, associated with higher PM3 and Pw concentrations. In contrast, when grouped by starter P rates (Figure 3d,e), the ellipses representing the different P treatments (0P to 20P) showed extensive overlap, indicating that starter P rate did not drive the primary separation of variables as site differences.
The correlation matrix (Figure 3f) explained the relationships observed in the PCA. Highly significant positive correlations (r > 0.5) were confirmed among all enzyme activities and active C pools (POXC and MBC) (Figure 3f). PM3 and Pw exhibited highly significant negative correlations with nearly all biological activity indicators (r < −0.5), except alkaline phosphatases (Figure 3f). Corn DM and P uptake were strongly and positively correlated (r > 0.5). Corn DM and P uptake also showed strong positive correlation with AlM3 and FeM3 (r > 0.5), but significant negative correlations with Pw and PM3 (r < −0.5). pH was positively correlated with alkaline phosphatases (r > 0.5) and negatively correlated with acid phosphatases (r < −0.5).

4. Discussion

4.1. POXC and MBC Activity

The analysis of soil C indicators over the two years revealed distinct patterns in how starter P application and inherent site characteristics influence active soil C pools. Our findings suggested that starter P did not significantly affect short-term active C pools, whereas inherent site characteristics were the main factor controlling the activities of POXC (chemical oxidation proxy) and MBC (biological proxy) during the early growth of silage corn (Table 2 and Table 3). This disparity suggests that the mechanisms controlling short-term C dynamics in these silage corn production systems are decoupled from minor or transient nutrient inputs and instead governed by long-term environmental and management legacies. POXC reflects the chemically labile C pool sensitive to management practices, while MBC represents the biologically active C immobilized in microbial biomass; together, they capture complementary chemical and biological dimensions of active soil C dynamics. POXC and MBC are recognized as critical indicators of active soil C fractions and microbial activity, reflecting the portion of soil C most readily available for microbial metabolism [2,21,22]. The observation that starter P application, regardless of the early growth stage (V3 or V6), did not significantly alter POXC or MBC suggests that soil P availability was not the dominant short-term constraint limiting microbial activity and the turnover of labile C pools under the tested conditions (Table 1). Indeed, according to local recommendations, PM3 concentrations were in the very high class, varying between 136.5 mg kg−1 and 332.9 mg kg−1, except at Site 5 with PM3 of 53.5 mg kg−1, considered to be in the low-to-medium class (Table 1). Site 5 was located in a manure-restricted area, and a previous study showed that corn DM yield at this site was low and likely caused by limited P availability [14].
The limited response of POXC and MBC to starter P applications is consistent with findings regarding mineral fertilization in nutrient cycling studies. It is well known that the conversion of absorbed C into biomass C in soils is influenced by abiotic factors and regulated by nutrient availability [35,36]. However, applications of mineral fertilizers, including starter P, often result in little accrual of soil C and minor effects on C cycling mechanisms compared to organic amendments like manure [7]. Manure application, which supplies both C and essential nutrients, is known to significantly enhance the conversion of absorbed C into biomass C in soils and enhance microbial growth rates [37,38,39]. Conversely, mineral-only fertilization, by failing to supply C, forces microbes to rely on native SOC. Thus, the tested starter P rates were likely insufficient or applied too transiently to overcome site-specific C or other resource limitations associated with the active C pool dynamics.
The marked variability observed in active C pools among the studied sites (e.g., Site 4 exhibited POXC and MBC 2.8 times greater than Sites 5 and 6 at the V6 stage) strongly suggests that inherent soil health and long-term management history contribute to the C dynamics in these systems (Table 2 and Table 3). The magnitude of active C differences across sites was directly mirrored by the long-term accumulated TC in the soil profile, confirming the role of soil legacy (Table 1). In 2020, Site 2, which had higher POXC and MBC concentrations than Site 3 at the V6 stage, also had higher TC (2.77% at Site 2 vs. 1.55% at Site 3) and TN (0.23% vs. 0.11%). This strong covariance demonstrates that the pool sizes of POXC and MBC are fundamentally constrained by the total amount of stabilized SOC present in the system, reflecting decades of management and initial soil composition. In 2021, a pronounced hierarchy of active C pools was observed, with Site 4 exhibiting the highest POXC and MBC values, followed by Site 5 and Site 6 (Table 3). This biological pattern directly tracked the concentration of TC. Indeed, Site 4 had the highest TC (3.49%), followed by Site 5 (2.31%), and Site 6 had the lowest TC (1.30%) (Table 1).
Sites with lower active C pools often displayed less favorable physical characteristics. For example, Site 6 (with the lowest POXC/MBC in 2021) had the lowest clay content (10.5%) and the highest sand content (59.5%). SOC stability is significantly influenced by physical protection mechanisms, notably within soil aggregates, which are often stabilized by fine particles such as clay and mineral–organic complexes [12,40,41]. Conversely, Site 4, which supported the highest active C pools, had the highest clay content in 2021 (20.5%) (Table 1). Clay content facilitates the formation of organo-mineral complexes, which physically protect SOC from rapid decomposition and enhance microbial stability [42]. The low clay content at Site 6 would suggest a limited capacity for aggregation and C stabilization, resulting in lower microbial C and activity.
The lowest MBC concentrations in 2021 were found at Sites 5 and 6, which were also the most acidic sites (pH 5.3 for both) (Table 1). Acidity can severely restrict microbial activity by imposing metabolic stress and increasing maintenance respiration costs, potentially leading to lower overall microbial biomass [7,43,44]. The fact that MBC at Site 4 (pH 5.8) was 2.8 times greater than the average of Sites 5 and 6, despite similar C:N ratios across these three sites (10.8, 10.7, and 9.4, respectively), underscores the critical, complex role of underlying soil properties, including initial C stock and pH, in determining the biological health and active C potential of the agricultural environment.

4.2. Soil Enzymes

Site-specific intrinsic properties, particularly SOC status and nutrient availability, exerted a dominant influence on soil enzyme activities (Table 1); conversely, the application of starter P had minimal effect (Table 2 and Table 3). This is evidenced by the consistent finding across both 2020 and 2021 that the activities of β-glucosidase, N-acetyl-β-glucosaminidase, arylsulphatase, and both acid and alkaline phosphatases varied significantly among the different sites but were generally unaffected by starter P at the V3 and V6 stages of silage corn (Table 2 and Table 3; Figure 1 and Figure 2). The observed lack of response to starter P suggests that mineral P inputs did not constitute a limiting factor sufficient to drive immediate changes in microbial P-acquisition strategies. Soil enzyme activities often reflect the resource demands of the soil microbial community, where microbes typically increase the production of specific enzymes (such as phosphatases) when the corresponding nutrient (P) is scarce [7,20]. However, the initial site characteristics (Table 1) indicate medium-to-high concentrations of available P (PM3: 53.5 to 332.9 mg kg−1) across all six sites. In environments where P resources are already substantial, the addition of small amounts of starter P fertilizer is unlikely to significantly alter overall P limitation status or microbial metabolic investment, thereby suppressing the enzyme response [45,46]. Prior research indicates that soil P-cycling microorganisms exhibit more pronounced enzymatic responses in low-P soil than in high-P soil [45,47,48,49]. Since the studied soils likely contain substantial legacy P, this high background P status may have saturated microbial demand, overriding any potential short-term enzymatic signal from the applied starter fertilizer P [23,24,25,26].
The pronounced and consistent differences in enzyme activities across sites highlight the importance of site-specific soil properties, such as SOC content, TN, and overall soil health, in regulating biogeochemical cycling rates. In 2021, Site 4 exhibited significantly higher activity for β-glucosidase (1586.9 pmol MUF g soil h−1) and N-acetyl-β-glucosaminidase (976.7 pmol MUF g soil h−1) at the V3 stage compared to Sites 5 and 6 (Table 3). This high enzymatic activity correlates directly with the high TC (3.49%) and TN (0.32%) of Site 4 (Table 1). β-glucosidase is crucial for the degradation of cellulose, a primary component of plant residues, reflecting C cycling capability, while N-acetyl-β-glucosaminidase breaks down chitin and contributes significantly to N mineralization by transforming organic N into mineralizable N [50]. The increased activity of these enzymes at Site 4 is likely influenced by its high SOC content. In particular, the elevated labile SOC pools, as indicated by higher POXC and MBC, may have supplied readily available substrates that stimulate microbial growth and enzyme production, thereby enhancing these enzyme activities. Manure application studies suggest that ample C input supports a higher overall microbial biomass and metabolic activity, enhancing the capacity for organic matter turnover [7,37]. Conversely, Site 6, which showed the lowest β-glucosidase and N-acetyl-β-glucosaminidase activities in 2021, also presented the lowest TC (1.30%) and clay content (10.5%), illustrating the role of organic resource availability and reduced physical protection of SOC in low-clay soils, which may accelerate C loss and constrain sustained microbial activity and enzyme production [44,51].
Site variability significantly affected phosphatases, enzymes critical for hydrolyzing phosphomonoesters and releasing plant-available P. In 2021, Site 4 displayed over three times the acid phosphatase activity (5353.35 pmol MUF g soil h) compared to the average of Site 5 and Site 6. Site 4 was also the only site where alkaline phosphatase activity was detected (Figure 2c,d). This indicates an enhanced capacity for organic P mineralization at Site 4, potentially improving plant P acquisition. While acid phosphatase activity is expected in acidic soils (Site 4 pH 5.8), the simultaneous presence of alkaline phosphatase activity, often associated with alkaline environments, indicates the heterogeneous nature of the soil microenvironment shaped by high organic inputs [47]. Such inputs can locally buffer microsite pH through organic ligand complexation and microbial turnover, allowing enzymes with contrasting pH optima to coexist. Furthermore, Site 4 had the lowest aluminum content (AlM3: 49.8 mg kg−1) compared to other sites with high enzyme activity, such as Site 2 (AlM3: 386.8 mg kg−1) (Table 1). High concentrations of exchangeable aluminum (Al3+) in acidic soils can impose stress on microbial communities, leading to increased maintenance respiration costs and potentially suppressing enzyme activity [37,44,52]. Consistent with this mechanism, the lower Al3+ stress at Site 4 aligns with its higher MBC, indicating greater microbial biomass and metabolic efficiency supporting elevated enzyme activity. The relatively low stress at Site 4, combined with its high C and N contents, likely enables enhanced microbial metabolic efficiency and superior enzymatic potential, reinforcing its role as a highly functional site. Overall, the site differences underscore that long-term soil conditions, mediated primarily by C and nutrient cycling capacity and the chemical stress environment (e.g., Al3+ levels), are the main factors influencing soil enzyme activity, overshadowing the short-term influence of starter P fertilizer applications. This supports findings that soil biochemical properties are key drivers of overall ecosystem multifunctionality by enhancing soil quality and enzyme activities related to C, N, and P acquisition [53].
Although the study design confounded specific sites with years, the consistent overriding influence of inherent soil properties over annual fertilization across both 2020 and 2021 indicates that long-term site characteristics are the primary drivers of biological functionality. Climatic variations, particularly the warmer soil temperatures recorded during the 2021 growing season, likely interacted with site-specific attributes such as TC and clay content to amplify the magnitude of microbial biomass and enzyme activities in sites like Site 4 compared to those studied in 2020 (Table 1, Table 2 and Table 3). Despite these inter-annual temperature differences, the relationships between biological indicators and soil legacies remained stable, confirming that site–year characteristics are the main factors driving these high-legacy-P agroecosystems (Figure 3a–f).

4.3. Soil Biological Activity and C, N, and P Cycling Linkages

The PCA biplots and the correlation matrix provide a coherent and robust framework for understanding the controls on soil biochemical function, crop metrics, and nutrient dynamics, particularly in high-legacy-P environments (Figure 3a–f). Our results consistently emphasize that inherent site characteristics and long-term management practices control ecosystem functionality, overshadowing the transient effects of annual starter P fertilization. The PCA biplots, when grouped by site, reveal a substantial separation of variables along the first principal component (PC1), which explains 35.8% to 37.4% of the total variance (Figure 3a–c). In contrast, grouping by starter P rates (0P to 20P) resulted in a large overlap of treatment ellipses (Figure 3d,e). This multivariate pattern provides strong confirmation of the univariate analyses, demonstrating that starter P rates did not exert a measurable influence on key biological indicators. This reinforces the conclusion that in these systems, annual starter fertilizer P applications are insufficient or too transient to overcome site-specific C or other resource limitations that control the dynamics of the active C pool and associated enzyme activities.
The positioning of variables along the PCA axes further clarifies the key drivers of function. POXC, MBC, and enzymes are grouped strongly along the positive axis of PC1, indicating significant positive correlations (Figure 3a–c). This interconnectedness highlights the strong coupling between microbial biomass, available labile C, and the enzymes responsible for nutrient acquisition. The positive association emphasizes that robust microbial communities capable of degrading complex organic matter thrive where labile C resources are abundant [35,36]. Importantly, this coordinated response supports the use of POXC as a sensitive and integrative indicator of soil biological function, as it closely tracks microbial biomass and enzyme activity across sites. Conversely, PM3 and Pw pointed to the direction of the negative axis of PC1 (Figure 3a–c). This pronounced opposition of vectors indicates significant negative correlations between readily available P and nearly all biological activity indicators. The inverse relationship between PM3 and Pw and P-acquiring enzymes (acid and alkaline phosphatases) and P strongly supports the concept of enzyme repression in soils with high background P status [46,50]. When P availability is substantial due to legacy concentrations, microbial communities conserve energy by suppressing the production of P-acquiring enzymes [7]. The high background status likely saturated microbial demand, overriding any potential short-term enzymatic signal from the small starter fertilizer P applications [45,46]. The PM3 and Pw, and variables of biological activity, were also projected near total P, further suggesting that legacy soil P, rather than the acute fertilizer application, influences P-cycling enzyme activity [48,49]. The significant negative correlation between available P and enzyme activities may reflect indirect relationships where sites with lower P levels also possess higher TC and clay content, which are the primary drivers of microbial enzyme production (Figure 3a–f). Furthermore, the apparent suppression could be influenced by co-variate abiotic factors such as pH or Al that independently regulate microbial metabolic efficiency and enzyme stability [4,7,43]. Consequently, these correlations likely represent an integral response to long-term soil health legacies rather than a simple biochemical inhibition by P alone [46,50]. The clustering of samples by site demonstrates that inherent soil properties were the true controllers of functionality. Site 4, which had the highest TC and TN (Table 1), consistently showed high positive PC1 scores, consistent with elevated biological activity indicators [50]. The activities of ß-glucosidase (C cycling [40,44]) and N-acetyl-ß-glucosaminidase (C and N cycling [7]) were closely associated with POXC and MBC. This pattern reflects that the overall capacity for C and N cycling, necessary to support microbial metabolism, is controlled by the magnitude of the underlying enzymes and resource pools maintained by decades of management [54].
Furthermore, the influence of unfavorable abiotic constraints is visible through the positioning of other sites. The lowest MBC concentrations occurred at the most acidic sites (Sites 5 and 6). Acidity severely restricts microbial metabolic efficiency [7,43]. However, Site 4 maintained high activity despite its moderate acidity. This potential resilience is supported by the relative lack of AlM3 or FeM3 co-toxicity, which can suppress enzyme activity by imposing severe stress on microbial communities [7,43]. Site 6, which aligned with low biological activity (negative PC1 scores), also had the lowest clay content and highest sand content (Table 1). This suggests that low clay limited aggregation and C stabilization, resulting in lower microbial activity [12,40,41]. Conversely, Site 4, with the highest biological activity, also had the highest clay content (20.5%), which favors organo-mineral complex formation, protecting SOC and enhancing microbial stability.
The PCA also defined the relationship between soil properties and crop productivity. Corn DM and P uptake clustered together, strongly projecting along the positive axis of PC2, alongside the metal cations AlM3 and FeM3. Crucially, the vectors for Corn DM and P uptake opposed those for PM3 and Pw. This spatial arrangement confirms the significant negative correlation observed in the matrix between crop yield and readily available P. This suggests that high yield and P uptake were not dependent on the highest levels of readily available P, aligning with findings that local starter recommendations may be excessive in high-legacy environments [11,14,15].
Although the current analysis identifies site-specific drivers, a primary limitation is the confounding of field sites with the study years, which may restrict the isolation of inter-annual climatic influences (Figure 3a–f). Additionally, while the multivariate approach is comprehensive, future research could employ regression or mixed-model methodologies to more precisely quantify the relationship between continuous soil variables and biological functionality (Figure 3f).

5. Conclusions

We clearly established that inherent site–year characteristics influence C dynamics and enzyme activities in highly manured P soils during the early growth stages of silage corn. This dominant effect stems from a strong covariance between active C pools, including POXC and MBC, and long-term accumulated SOC, reflecting decades of management. Sites with high TC and higher clay content exhibited larger active C pools, suggesting a crucial role for physical protection mechanisms in stabilizing SOC and supporting microbial stability. Additionally, soil acidity was a critical abiotic constraint, as the lowest MBC concentrations were observed at the most acidic sites (pH 5.3), highlighting the impact of metabolic stress from lower pH on microbial health. The negligible response of C, N, and P acquisition enzymes (e.g., β-glucosidase, N-acetyl-β-glucosaminidase, and phosphatases) to starter fertilizer P inputs confirms that inherent soil properties controlled microbial metabolism. Moreover, variations in enzyme activity across sites were strongly linked to intrinsic soil health, with sites possessing high SOC, high TN, and lower Al levels exhibiting enhanced enzymatic potential for SOM turnover. Consequently, long-term soil environmental conditions, rather than transient fertilization adjustments, are the critical determinants of C dynamics and overall biological functionality in these agroecosystems early in the growing season.

Author Contributions

A.J.M. and S.N.: Writing—original draft, Conceptualization. A.J.M. and S.N.: Methodology, Data curation. B.K., T.R., N.L.P. and S.M.A.: Writing—review & editing. All authors have read and agreed to the published version of the manuscript.

Funding

We thank Agriculture and Agri-Food Canada for funding this work through an A-Base program (project ID: J-002266—Solutions for carryover of legacy P in the Fraser Valley and Hullcar Valley; project ID: J-003116, Improving phosphorus management in Canadian Agroecosystems).

Data Availability Statement

The datasets generated for this study are available upon request to the corresponding author.

Acknowledgments

We are grateful to Fraser Valley dairy farmers for allowing us to sample their corn fields and for providing support when needed.

Conflicts of Interest

The authors declare no conflicts of interest.

References

  1. Ying, D.; Chen, X.L.; Hou, J.F.; Zhao, F.C.; Li, P. Soil properties and microbial functional attributes drive the response of soil multifunctionality to long-term fertilization management. Appl. Soil Ecol. 2023, 192, 105095. [Google Scholar] [CrossRef]
  2. Liang, C.; Schimel, J.P.; Jastrow, J.D. The importance of anabolism in microbial control over soil carbon storage. Nat. Microbiol. 2017, 2, 17105. [Google Scholar] [CrossRef] [PubMed]
  3. Georgiou, K.; Jackson, R.B.; Vinduskova, O.; Abramoff, R.Z.; Ahlstrom, A.; Feng, W.; Harden, J.W.; Pellegrini, A.F.A.; Polley, H.W.; Soong, J.L.; et al. Global stocks and capacity of mineral-associated soil organic carbon. Nat. Commun. 2022, 13, 3797. [Google Scholar] [CrossRef] [PubMed]
  4. Chemnitz, C.; Weigelt, J. Soil Atlas. Facts and Figures About Earth, Land and Fields; Heinrich-Boll Stiftung: Berlin, Germany; Institute for Advanced Sustainability Studies (IASS): Potsdam, Germany, 2015. [Google Scholar]
  5. Feng, X.; Qin, S.; Zhang, D.; Chen, P.; Hu, J.; Wang, G.; Liu, Y.; Wei, B.; Li, Q.; Yang, Y.; et al. Nitrogen input enhances microbial carbon use efficiency by altering plant–microbe–mineral interactions. Glob. Change Biol. 2022, 28, 4845–4860. [Google Scholar] [CrossRef]
  6. Pu, Q.; Zhao, L.-X.; Li, Y.-T.; Su, J.-Q. Manure fertilization increase antibiotic resistance in soils from typical greenhouse vegetable production bases, China. J. Hazard Mater. 2020, 391, 122267. [Google Scholar] [CrossRef] [PubMed]
  7. Sun, X.; Zhang, C.; Liu, K.; Xu, M.; Cai, A. Long-term manure application enhances carbon use efficiency in soil aggregates by regulating microbial communities in cropland. Soil Biol. Biochem. 2025, 210, 109945. [Google Scholar] [CrossRef]
  8. Xu, S.; Geng, W.; Sayer, E.J.; Zhou, G.; Zhou, P.; Liu, C. Soil microbial biomass and community responses to experimental precipitation change: A meta-analysis. Soil Ecol. Lett. 2020, 2, 93–103. [Google Scholar] [CrossRef]
  9. Gunina, A.; Dippold, M.; Glaser, B.; Kuzyakov, Y. Turnover of microbial groups and cell components in soil: 13C analysis of cellular biomarkers. Biogeosciences 2017, 14, 271–283. [Google Scholar] [CrossRef]
  10. Utobo, E.; Tewari, L. Soil enzymes as bioindicators of soil ecosystem status. Appl. Ecol. Environ. Res. 2015, 13, 147–169. [Google Scholar] [CrossRef]
  11. Ma, W.; Jiang, W.; Li, L.; Liu, H.; Zhang, M.; Wang, D.; Guo, R.; Wang, Y.; Li, X. Effects of manure application and tetracycline contamination on soil enzyme activity and tetracycline resistance genes in soils: Effects of vegetation. Environ. Technol. Innov. 2020, 39, 104246. [Google Scholar]
  12. Yasuno, H.; Lyu, H.; Tanaka, H.; Sugihara, S. Historical manure application affects accumulation pattern of residue-derived carbon via promoting macro-aggregation in Andosols, Japan. Geoderma Reg. 2026, 44, e01037. [Google Scholar] [CrossRef]
  13. Messiga, A.J.; Lam, C.; Li, Y.; Kidd, S.; Yu, S.; Bineng, C. Combined starter phosphorus and manure applications on silage corn yield and phosphorus uptake in southern BC. Front. Earth Sci. 2020, 8, 88. [Google Scholar] [CrossRef]
  14. Nyamaizi, S.; Messiga, A.J.; Cornelis, J.-T.; Smukler, S.M.; Cade-Menun, B.J. Mineral phosphorus fertilization for silage corn in manured soils in the Fraser Valley, Canada. Agron. J. 2023, 116, 362–379. [Google Scholar] [CrossRef]
  15. Nyamaizi, S.; Messiga, A.J.; Cade-Menun, B.; Cornelis, J.-T.; Smukler, S.M. Environmental phosphorus risk classes for silage corn productions in the Fraser Valley, Canada. Agric. Ecosyst. Environ. 2025, 381, 109423. [Google Scholar] [CrossRef]
  16. van Bochove, E.; Theriault, G.; Denault, J.T.; Dechmi, F.; Allaire, E.S.; Rousseau, N.R. Risk of phosphorus desorption from Canadian agricultural land: 25 year temporal trend. J. Environ. Qual. 2012, 41, 1402–1412. [Google Scholar] [CrossRef] [PubMed]
  17. Reid, K.; Schneider, K.D. Phosphorus accumulation in Canadian agricultural soils over 30 yr. Can. J. Soil Sci. 2019, 99, 520–532. [Google Scholar] [CrossRef]
  18. Messiga, A.J.; Rupngam, T. Phosphorus leaching in high-P soils under maize silage and interseeding cover crop system. Agric. Ecosyst. Environ. 2025, 379, 109381. [Google Scholar] [CrossRef]
  19. Kamran, M.; Huang, L.; Nie, J.; Geng, M.; Lu, Y.; Liao, Y.; Zhou, F.; Xu, Y. Effect of reduced mineral fertilization (NPK) combined with green manure on aggregate stability and soil organic carbon fractions in a fluvo-aquic paddy soil. Soil Till. Res. 2021, 211, 105005. [Google Scholar] [CrossRef]
  20. Jia, R.; Zhou, J.; Chu, J.C.; Shahbaz, M.; Yang, Y.D.; Jones, D.L.; Zang, H.D.; Razavi, B.S.; Zeng, Z.H. Insights into the associations between soil quality and ecosystem multifunctionality driven by fertilization management: A case study from the North China Plain. J. Clean. Prod. 2022, 362, 132265. [Google Scholar] [CrossRef]
  21. Chen, J.K.; Shen, C.R.; Yeh, C.H.; Fang, B.-S.; Huang, T.-L.; Liu, C.-L. N-Acetyl Glucosamine Obtained from Chitin by Chitin Degrading Factors in Chitinbacter tainanesis. Int. J. Mol. Sci. 2011, 12, 1187–1195. [Google Scholar] [CrossRef] [PubMed]
  22. Li, S.; Zhou, G.; Zhou, G.; Nie, J.; Zhang, J.; Gao, S.; Cao, W. Rice straw returning under winter green manuring enhances soil carbon pool via stoichiometric regulation of extracellular enzymes. Soil Till. Res. 2025, 252, 106617. [Google Scholar] [CrossRef]
  23. Sánchez-Rodríguez, A.R.; del Campillo, M.C.; Torrent, J.; Cooledge, E.C.; Chadwick, D.R.; Jones, D.L. Phosphorus fertilization promotes carbon cycling and negatively affects microbial carbon use efficiency in agricultural soils: Laboratory incubation experiments. Geoderma 2024, 450, 117038. [Google Scholar] [CrossRef]
  24. Hallama, M.; Pekrun, C.; Pilz, S.; Jarosch, K.A.; Frac, M.; Uksa, M.; Marhan, S.; Kandeler, E. Interactions between cover crops and soil microorganisms increase phosphorus availability in conservation agriculture. Plant Soil 2021, 463, 307–328. [Google Scholar] [CrossRef]
  25. Wang, Y.J.; Huang, Q.Q.; Gao, H.; Zhang, R.Q.; Yang, L.; Guo, Y.R.; Li, H.K.; Awasthi, M.K.; Li, G.C. Long-term cover crops improved soil phosphorus availability in a rain-fed apple orchard. Chemosphere 2021, 275, 130093. [Google Scholar] [CrossRef] [PubMed]
  26. Ablimit, R.; Li, W.K.; Zhang, J.D.; Gao, H.N.; Zhao, Y.M.; Cheng, M.M.; Meng, X.Q.; An, L.Z.; Chen, Y. Altering microbial community for improving soil properties and agricultural sustainability during a 10-year maize-green manure intercropping in Northwest China. J. Environ. Manag. 2022, 321, 115859. [Google Scholar] [CrossRef]
  27. Soil Classification Working Group. The Canadian System of Soil Classification, 3rd ed.; Agriculture and Agri-Food Canada Publication; No. 1646; NRC Research Press: Ottawa, ON, Canada, 1998; p. 187. [Google Scholar]
  28. Lupwayi, N.Z.; Zhanga, Y.; Hao, X.; Thomas, B.W.; Eastmand, A.H.; Schwinghamer, T.D. Linking soil microbial biomass and enzyme activities to long-term manure applications and their nonlinear legacy. Pedobiol.–J. Soil Ecol. 2019, 74, 34–42. [Google Scholar] [CrossRef]
  29. Deng, S.; Kang, H.; Freeman, C. Microplate fluorimetric assay of soil enzymes. Meth. Enzymol. 2011, 9, 311–318. [Google Scholar] [CrossRef]
  30. Deng, S.; Popova, I.E.; Dick, L.; Dick, R. Bench scale and microplate format assay of soil enzyme activities using spectroscopic and fluorometric approaches. Appl. Soil Ecol. 2013, 64, 84–90. [Google Scholar] [CrossRef]
  31. Dick, R.P.; Breakwell, D.P.; Turco, R.F. Soil enzyme activities and biodiversity measurements as integrative microbiological indicators. In Methods for Assessing Soil Quality; Doran, J.W., Jones, A.J., Eds.; Soil Science Society of America Special Publication Number 49; Soil Science Society of America Inc.: Madison, WI, USA, 1996; pp. 247–271. [Google Scholar]
  32. Horwath, W.R.; Paul, E.A. Microbial biomass. In Methods of Soil Analysis. Part 2. Microbiological and Biochemical Properties; Weaver, R.W., Angle, S., Bottomly, P., Bezdicek, D., Smith, S., Tabatabai, A., Wollum, A., Eds.; Soil Science Society of America: Madison, WI, USA, 1994; pp. 753–773. [Google Scholar]
  33. Weil, R.R.; Islam, K.R.; Stine, M.A.; Gruver, J.B.; Samson-Liebig, S.E. Estimating active carbon for soil quality assessment: A simplified method for laboratory and field use. Am. J. Altern. Agric. 2003, 18, 3–17. [Google Scholar] [CrossRef]
  34. Core Team, R. A Language and Environment for Statistical Computing; R Foundation for Statistical Computing: Vienna, Austria, 2023; Available online: https://R-project.org/ (accessed on 20 February 2026).
  35. Duan, P.; Fu, R.; Nottingham, A.T.; Domeignoz-Horta, L.A.; Yang, X.; Du, H.; Wang, K.; Li, D. Tree species diversity increases soil microbial carbon use efficiency in a subtropical forest. Glob. Change Biol. 2023, 29, 7131–7144. [Google Scholar] [CrossRef]
  36. Hartman, W.H.; Ye, R.; Horwath, W.R.; Tringe, S.G. A genomic perspective on stoichiometric regulation of soil carbon cycling. ISME J. 2017, 11, 2652–2665. [Google Scholar] [CrossRef] [PubMed]
  37. Zhou, Y.; Zhang, J.; Xu, L.; Nadeem, M.Y.; Li, W.; Jiang, Y.; Ding, Y.; Liu, Z.; Li, G. Long-term fertilizer postponing promotes soil organic carbon sequestration in paddy soils by accelerating lignin degradation and increasing microbial necromass. Soil Biol. Biochem. 2022, 175, 108839. [Google Scholar] [CrossRef]
  38. Song, J.; Song, J.; Xu, W.; Gao, G.; Bai, J.; Zhang, Z.; Yu, Q.; Hao, J.; Yang, G.; Ren, G.; et al. Straw return with fertilizer improves soil CO2 emissions by mitigating microbial nitrogen limitation during the winter wheat season. Catena 2024, 241, 108050. [Google Scholar] [CrossRef]
  39. Cruz-Paredes, C.; Rousk, J. Controls of microbial carbon use efficiency along a latitudinal gradient across Europe. Soil Biol. Biochem. 2024, 193, 109394. [Google Scholar] [CrossRef]
  40. Li, J.; Niu, X.; Wang, P.; Yang, J.; Liu, J.; Wu, D.; Guan, P. Soil degradation regulates the effects of litter decomposition on soil microbial nutrient limitation: Evidence from soil enzymatic activity and stoichiometry. Front. Plant Sci. 2023, 13, 1090954. [Google Scholar] [CrossRef] [PubMed]
  41. Liu, Y.Q.; Chen, X.; Leng, Y.F.; Wang, S.C.; Liu, H.R.; Zhang, W.; Li, W.; Li, N.; Ning, Z.Y.; Gao, W.L.; et al. Molecular-level insight into the effect of fertilization regimes on the chemodiversity of dissolved organic matter in tropical cropland. Environ. Res. 2024, 262, 119903. [Google Scholar] [CrossRef] [PubMed]
  42. Arai, M.; Ikazaki, K.; Anzai, T.; Celestial, V.P.; Tumbay, J.V.; Santillana, I.S.; Wagai, R. Protective role of reactive aluminum phases to stabilize soil organic matter against long-term cultivation in the humid tropics under volcanic influence. Soil Sci. Plant Nutr. 2025, 71, 27–37. [Google Scholar]
  43. Jones, D.L.; Cooledge, E.C.; Hoyle, F.C.; Griffiths, R.I.; Murphy, D.V. pH and exchangeable aluminum are major regulators of microbial energy flow and carbon use efficiency in soil microbial communities. Soil Biol. Biochem. 2019, 138, 107584. [Google Scholar] [CrossRef]
  44. Yu, Y.; Hu, Y.; Wang, H.; Liu, Y.; Xu, X.; Liu, L.; Zhang, Y.; Wu, C.; Hu, D.; Zhang, L. Legume-gramineous green manures mitigate soil acidification and enhance carbon sequestration via increased enzymatic activities in intensive agroecosystems. Agric. Ecosyst. Environ. 2026, 397, 110080. [Google Scholar] [CrossRef]
  45. Wei, X.M.; Hu, Y.J.; Razavi, B.S.; Zhou, J.; Shen, J.L.; Nannipieri, P.; Wu, J.S.; Ge, T.D. Rare taxa of alkaline hosphomonoesterase-harboring microorganisms mediate soil phosphorus mineralization. Soil Biol. Biochem. 2019, 131, 62–70. [Google Scholar] [CrossRef]
  46. Zhang, J.; Huang, J.; Wen, J.; Peng, Z.; Zhang, N.; Wang, Y.; Zhang, Y.; Su, S.; Zeng, X. Phosphorus fractions and their transformation in coupling with organic carbon cycling after seven-year manure application in subtropical soil. Soil Till. Res. 2025, 251, 106535. [Google Scholar] [CrossRef]
  47. Wei, X.M.; Hu, Y.J.; Cai, G.; Yao, H.Y.; Ye, J.; Sun, Q.; Veresoglou, S.D.; Li, Y.Y.; Zhu, Z.K.; Guggenberger, G.; et al. Organic phosphorus availability shapes the diversity of phoD-harboring bacteria in agricultural soil. Soil Biol. Biochem. 2021, 161, 108364. [Google Scholar] [CrossRef]
  48. Chen, X.; Yan, X.; Wang, M.; Cai, Y.; Weng, X.; Su, D.; Guo, J.; Wang, W.; Hou, Y.; Ye, D.; et al. Long-term excessive phosphorus fertilization alters soil phosphorus fractions in the acidic soil of pomelo orchards. Soil. Till. Res. 2022, 215, 105214. [Google Scholar] [CrossRef]
  49. Zou, H.; Lu, C.; Zhang, L.; Xu, M.; Duan, Y.; Hale, L. Long-term manure fertilization enhances red soil organic carbon storage. Appl. Soil Ecol. 2026, 217, 106644. [Google Scholar] [CrossRef]
  50. Rupngam, T.; Messiga, A.J.; Karam, A. Soil enzyme activity in heavily manured and waterlogged soil cultivated with ryegrass (Lolium multiflorum). Can. J. Soil Sci. 2024, 104, 146–155. [Google Scholar] [CrossRef]
  51. Nguyen, P.V.; Condron, L.M.; Simpson, Z.P.; McDowell, R.W. Inclusion of leguminous green manures enhances crop biomass, nutrient uptake, soil phosphorus dynamics and bioavailability. J. Sust. Agric. Environ. 2024, 3, e70035. [Google Scholar] [CrossRef]
  52. Malik, A.A.; Martiny, J.B.H.; Brodie, E.L.; Martiny, A.C.; Treseder, K.K.; Allison, S.D. Defining trait-based microbial strategies with consequences for soil carbon cycling under climate change. ISME J. 2020, 14, 1–9. [Google Scholar] [PubMed]
  53. Jia, L.; Zhang, H.; Lu, J.; Liang, Y.; Li, Y.; Xu, L.; Ye, J.; Yang, R.; Li, P.; Jiao, J.; et al. Green manuring with balanced fertilization improves soil ecosystem multifunctionality by enhancing soil quality and enzyme activities in a smooth vetch-maize rotation system. Agric. Ecosyst. Environ. 2025, 387, 109632. [Google Scholar] [CrossRef]
  54. Liu, M.; Zheng, S.; Pendall, E.; Smith, P.; Liu, J.; Li, J.; Fang, C.; Li, B.; Nie, M. Unprotected carbon dominates decadal soil carbon increase. Nat. Commun. 2025, 16, 2008. [Google Scholar] [CrossRef] [PubMed]
Figure 1. Violin plots of the activity of (a,b) acid phosphatase and (c,d) alkaline phosphatase at 3-leaf and 6-leaf stage of silage corn across three sites in the Fraser Valley, BC, Canada, during the 2020 growing season. Different lowercase letters denote significant differences among Sites (p < 0.05 after Tukey’s HSD test).
Soilsystems 10 00084 g001
Figure 2. Violin plots of the activity of (a,b) acid phosphatase and (c,d) alkaline phosphatase at 3-leaf and 6-leaf stages of silage corn across three sites in the Fraser Valley, BC, Canada, during the 2021 growing season. Different lowercase letters denote significant differences among Sites (p < 0.05 after Tukey’s HSD test).
Soilsystems 10 00084 g002
Figure 3. Principal components analysis (PCA) biplot [variables were grouped according to the sites ((a) V3, (b) V6, and (c) V3 + V6), starter P rates ((d) V3 and (e) V6)] and (f) correlation matrix demonstrate the projection of the variables obtained from topsoil (0–30 cm depth). Variables include clusters of measured soil chemical properties (pH, Pw, PM3, AlM3, FeM3, total P, organic P), active carbon pools (POXC and MBC), enzyme activities (β-glucosidase, N-acetyl-β-glucosaminidase (N-acetyl), arylsulfatase, acid phosphatase [acid phospho]), alkaline phosphatase [alkaline phospho]), and crop production metrics (corn DM and corn P uptake). The color of the squares (f) in the correlation matrix represents the strength of the correlation between pairs of variables (blue indicates positive correlation and red indicates negative correlation). Significant codes: *** = p < 0.001, ** = 0.001 < p < 0.01, * = 0.01 < p < 0.05.
Soilsystems 10 00084 g003
Table 1. Average general properties of soils (0–30 cm) at six studied sites in 2020 (three sites) and 2021 (three sites) in the Fraser Valley of British Columbia, Canada (n = 4).
Total C
(%)
Total N (%)C:NOlsen P (mg kg−1)PM3 (mg kg−1)KM3
(mg kg−1)
MgM3
(mg kg−1)
CaM3
(mg kg−1)
AlM3
(mg kg−1)
FeM3
(mg kg−1)
pH(H20)CEC
(meq(+) 100 g−1)
Clay
(%)
Sand
(%)
Site 11.380.1013.735.4142.4180.0314.812781279386.86.311.218.043.5
Site 22.770.2312.360.3268.4131.518514132065281.65.914.212.051.5
Site 31.550.1113.557.4332.9197.2269.210601085259.05.89.715.047.0
Site 43.490.3210.844.5136.5280.0238.5148579149.85.811.520.551.5
Site 52.310.2210.725.553.597.5203.5103081436.75.311.420.040.0
Site 61.300.149.450.0164.5155.0113.56601606N.D5.311.910.559.5
ND, not determined; KM3, MgM3, CaM3, AlM3, and FeM3 measured in Mehlich-3 extractions; CEC, cation exchange capacity; particle size analyses determined using hydrometer method and soil pH [14,15].
Table 2. Starter P effects on active carbon, microbial biomass carbon, and enzyme activity in silage corn rhizosphere during the 2020 early growing season for selected sites in the Fraser Valley of British Columbia, Canada.
3-Leaf Stage6-Leaf Stage
POXC
(mg kg−1)
MBC
(mg kg−1)
G
(pmol MUF g−1 h−1)
NAGase (pmol MUF g−1 h−1)AS-N
(mg p-nitrophenyl kg−1 h−1)
POXC
(mg kg−1)
MBC
(mg kg−1)
G
(pmol MUF g−1 h−1)
NAGase
(pmol MUF g−1 h−1)
AS-N
(mg p-nitrophenyl kg−1 h−1)
Starter P
0P537.5 ± 79.64 a528.2 ± 102.90 a783.3 ± 217.25 a366.4 ± 125.15 a152.8 ± 47.75 a566.3 ± 57.39 a608.4 ± 142.43 a963.3 ± 236.47 a397.8 ± 120.59 a191.5 ± 41.32 a
5P508.9 ± 43.75 a543.1 ± 104.95 a638.0 ± 144.28 a286.0 ± 76.24 a138.1 ± 39.19 a503.3 ± 56.00 a536.4 ± 143.95 a733.3 ± 175.75 a443.3 ± 171.92 a154.4 ± 38.55 a
10P542.8 ± 54.82 a550.8 ± 70.44 a704.2 ± 116.28 a248.1 ± 45.10 a130.1 ± 25.65 a605.0 ± 78.39 a620.5 ± 172.39 a975.5 ± 228.27 a290.0 ± 75.16 a158.9 ± 35.13 a
15P557.3 ± 57.68 a516.7 ± 62.88 a659.6 ± 136.18 a367.1 ± 120.13 a145.9 ± 30.22 a540.5 ± 50.91 a538.7 ± 91.54 a870.8 ± 131.02 a429.4 ± 143.24 a184.0 ± 42.33 a
20P527.4 ± 53.14 a487.8 ± 95.86 a737.3 ± 213.12 a240.3 ± 68.86 a137.9 ± 30.88 a558.7 ± 62.25 a576.9 ± 145.54 a1063.2 ± 308.39 a438.4 ± 178.82 a182.1 ± 45.43 a
Sites
Site 1429.0 ± 35.22 C566.6 ± 95.92 A707.2 ± 182.93 A251.5 ± 85.20 B129.4 ± 21.67 B565.7 ± 62.37 A757.8 ± 134.37 A1123.3 ± 241.58 A589.6 ± 142.79 A203.4 ± 39.70 A
Site 2637.0 ± 36.20 A555.8 ± 96.13 A884.1 ± 164.10 A391.1 ± 87.70 A212.9 ± 28.26 A637.8 ± 40.60 A608.3 ± 75.07 A1047.5 ± 203.76 A439.4 ± 115.52 A226.3 ± 22.64 A
Site 3538.3 ± 45.20 B453.6 ± 53.86 A522.2 ± 187.34 B262.2 ± 94.90 B80.7 ± 9.77 C460.8 ± 44.58 B362.4 ± 115.00 B592.8 ± 98.18 B170.3 ± 55.99 B92.8 ± 9.54 B
Anova
P rate (P)nsnsnsnsnsnsnsnsnsns
Site (S)<0.001ns0.0030.025<0.001<0.001<0.0010.001<0.001<0.001
P × Snsnsnsnsnsnsnsnsnsns
POXC, permanganate oxidizable carbon; MBC, microbial biomass carbon; G, β-glucosidase activity; NAGase, N-acetyl-β-glucosaminidase activity; AS-N, arylsulphatase activity; ns, no significant differences. Different uppercase letters denote significant differences between sites and different lowercase letters denote significant differences between starter P rates (p < 0.05 after Tukey’s HSD test).
Table 3. Starter P effects on active carbon, microbial biomass carbon, and enzyme activity in silage corn rhizosphere during the 2021 early growing season for selected sites in the Fraser Valley of British Columbia, Canada.
3-Leaf Stage6-Leaf Stage
POXC
(mg kg−1)
MBC
(mg kg−1)
G
(pmol MUF g−1 h−1)
NAGase (pmol MUF g−1 h−1)AS-N
(mg p-nitrophenyl kg−1 h−1)
POXC
(mg kg−1)
MBC
(mg kg−1)
G
(pmol MUF g−1 h−1)
NAGase (pmol MUF g−1 h−1)AS-N
(mg p-nitrophenyl/kg/h)
Starter P
0P596.9 ± 114.89 a565.0 ± 182.66 a758.3 ± 281.96 a492.7 ± 265.36 a142.7 ± 41.30 a682.1 ± 98.71 a531.4 ± 177.59 a650.5 ± 286.51 a355.8 ± 199.44 a152.5 ± 48.05 a
5P595.6 ± 101.75 a645.3 ± 145.80 a864.5 ± 303.80 a380.8 ± 189.21 a179.6 ± 60.34 a653.8 ± 95.24 a626.6 ± 195.14 a804.6 ± 341.36 a537.4 ± 314.74 a172.3 ± 58.65 a
10P582.0 ± 108.32 a679.7 ± 181.47 a761.9 ± 306.0 a370.9 ± 200.26 a164.2 ± 49.14 a639.4 ± 95.54 a520.3 ± 156.20 a658.0 ± 288.84 a454.8 ± 299.92 a148.9 ± 45.24 a
15P603.8 ± 92.28 a532.9 ± 162.83 a869.7 ± 384.20 a436.1 ± 209.74 a142.1 ± 34.98 a634.2 ± 104.89 a459.4 ± 121.12 a656.9 ± 250.53 a424.7 ± 218.44 a159.9 ± 51.01 a
20P608.5 ± 111.64 a568.6 ± 166.28 a789.6 ± 310.49 a467.0 ± 249.12 a181.2 ± 58.35 a643.6 ± 105.75 a519.7 ± 189.00 a693.5 ± 302.50 a399.7 ± 202.37 a157.2 ± 49.98 a
Sites
Site 4842.7 ± 39.08 A950.6 ± 108.72 A1586.9 ± 182.19 A976.7 ± 145.71 A277.7 ± 37.23 A881.7 ± 40.56 A943.0 ± 112.90 A1442.0 ± 110.80 A1069.3 ± 141.14 A281.6 ± 27.04 A
Site 5580.2 ± 15.46 B558.8 ± 99.00 B534.3 ± 52.33 B209.9 ± 47.19 B128.4 ± 12.64 B608.9 ± 27.97 B365.0 ± 34.98 B421.0 ± 55.88 B154.4 ± 34.12 B123.8 ± 10.17 B
Site 6369.2 ± 17.43 C285.5 ± 43.84 C305.4 ± 82.87 C102.0 ± 26.86 B79.7 ± 7.92 C461.3 ± 45.62 C286.5 ± 45.09 B215.0 ± 73.00 C79.7 ± 24.82 B69.0 ± 10.75 C
Anova
P rate (P)nsnsnsnsnsnsnsnsnsns
Site (S)<0.001<0.001<0.001<0.001<0.001<0.001<0.001<0.001<0.001<0.001
P × Snsnsnsnsnsnsnsns0.051ns
POXC, permanganate oxidizable carbon; MBC, microbial biomass carbon; G, β-glucosidase activity; NAGase, N-acetyl-β-glucosaminidase activity; AS-N, arylsulphatase activity; ns, no significant differences. Different uppercase letters denote significant differences between sites and different lowercase letters denote significant differences between starter P rates (p < 0.05 after Tukey’s HSD test).
Disclaimer/Publisher’s Note: The statements, opinions and data contained in all publications are solely those of the individual author(s) and contributor(s) and not of MDPI and/or the editor(s). MDPI and/or the editor(s) disclaim responsibility for any injury to people or property resulting from any ideas, methods, instructions or products referred to in the content.