Article

Short-Term Effects of Biochar on Soil Fluxes of Methane, Carbon Dioxide, and Water Vapour in a Tea Agroforestry System


1
Institute of Forestry and Conservation, John H. Daniels Faculty of Architecture Landscape and Design, University of Toronto, 33 Willcocks St., Toronto, ON M5S 3B3, Canada
2
CredoSense Inc., B114-3600 Steeles Ave. E, Markham, ON L3R 9Z7, Canada
*
Authors to whom correspondence should be addressed.
Soil Syst. 2026, 10(2), 21; https://doi.org/10.3390/soilsystems10020021

Submission received: 2 October 2025 / Revised: 21 January 2026 / Accepted: 21 January 2026 / Published: 24 January 2026

Abstract

Tea (Camellia sinensis) cultivation is a major global industry that faces sustainability challenges due to soil degradation and greenhouse gas (GHG) emissions from intensive management. Biochar—charcoal designed and used as a soil amendment—has emerged as a potential tool to improve soil health, enhance carbon sequestration, and mitigate GHG fluxes in agroecosystems. However, field-scale evidence of its effects on GHG dynamics in woody crops like tea remains limited, particularly regarding methane (CH4). Here, we present, to our knowledge, the first field assessment of biochar impacts on CO2, CH4, and H2O vapour fluxes in a subtropical tea agroforestry system with and without shade trees in northeastern Bangladesh. Using a closed dynamic chamber and real-time gas analysis, we found that biochar application (at 7.5 t·ha−1) significantly enhanced average soil methane (CH4) uptake by 84%, while soil respiration (CO2 efflux) rose modestly (+18%) and water-vapour fluxes showed a marginal increase. Canopy conditions modulated these effects: biochar strongly enhanced CH4 uptake under both shaded and open canopies, whereas biochar effects on water-vapour flux were detectable only when biochar was combined with a shade-tree canopy. Structural equation modelling suggests that CH4 flux was primarily governed by biochar-induced changes in soil pH, moisture, nutrient status, and temperature, while CO2 and H2O fluxes were shaped by organic matter availability, temperature, and phosphorus dynamics. These findings demonstrate that biochar can promote CH4 uptake and alter soil carbon–water interactions during the dry season in tea plantation systems and support operational biochar use in combination with shade-tree agroforestry.

1. Introduction

As one of the world’s most consumed beverages, tea (Camellia sinensis) is a globally significant crop cultivated across 5.7 million hectares, underpinning rural economies and livelihoods throughout Asia, Africa, and Latin America [1,2,3]. Globally, the tea trade is valued at over USD 9 billion annually, making its sustainability a priority in international agricultural policy [1]. However, the environmental footprint of tea production poses a substantial challenge to its long-term viability. Intensive cultivation, characterized by heavy nitrogenous fertilizer application, frequently leads to soil degradation, including acidification and nutrient depletion, which compromises soil fertility [4,5]. Consequently, tea plantations have become notable sources of soil greenhouse gas (GHG) emissions, particularly nitrous oxide (N2O) and carbon dioxide (CO2) [6]. Addressing these interconnected challenges is now critical as the global community strives to meet sustainability targets for carbon neutrality and land restoration [7,8,9]. This creates a critical tension necessitating innovative management practices that can align tea production with global climate and land restoration goals.
Two primary approaches to enhancing the sustainability of tea plantations have been the implementation of agroforestry practices and the addition of organic soil amendments. Shade-tree tea agroforestry—a management system integrating tea bushes with an overstory of diverse trees—provides a structural framework that enhances carbon sequestration, optimizes nutrient cycling and soil fertility, moderates the soil microclimate, and influences the microbial processes that drive GHG fluxes [10,11,12,13]. Organic soil amendments may also be used to enhance tea plantation sustainability by acting as both a direct source of nutrients and by enhancing soil physicochemical properties, including the capacity of the soil to retain water and nutrients. The primary organic soil amendments used in this context have been manures (e.g., [14,15]), composts [16], mulches [17], and bacterial inoculants [18]. Together, shade trees and organic inputs form an integrated management strategy in many estates, yet their combined effects on soil GHG and water-vapour fluxes remain poorly quantified.
Biochar has recently emerged as a key soil amendment for climate-smart agriculture [19]. Produced from the pyrolysis of biomass, biochar is a stable, carbon-rich material whose unique properties—including a highly porous structure, large specific surface area, and chemical recalcitrance—distinguish it from rapidly decomposing organic amendments like composts or manures [20,21]. Its application has been shown to influence soil processes through three main pathways: (i) physical changes in soil structure and aeration; (ii) chemical effects on pH, sorption, and nutrient availability; and (iii) shifts in microbial habitat and community composition [3,22,23,24,25].
The intensive management required for tea production often leads to a cascade of soil health issues, including degradation from high nutrient demand, soil acidification, and compaction, which in turn drive inefficient water use and elevate emissions of GHGs [4,6]. Biochar application potentially offers a multifaceted approach to address these interconnected challenges. In tea gardens, biochar applications have been shown to ameliorate soil acidity, improve soil aggregate stability, and increase soil organic carbon stocks over multiple years [23,26,27]. Beyond these direct soil health benefits, biochar is increasingly recognized for its potential to mitigate climate change by altering the biogeochemical pathways governing GHG fluxes. For instance, several studies in tea plantations have documented significant reductions in N2O emissions following biochar application [28,29]. By contrast, almost all biochar studies in tea have focused on soil physicochemical properties, N2O emissions, and yield responses, with little or no direct measurement of CH4 or soil water-vapour fluxes. These combined characteristics establish biochar as a promising tool for sustainable soil management, yet its specific impacts on GHG fluxes, particularly CH4, CO2, and water-vapour flux within tea agroecosystems, remain poorly understood.
CH4 fluxes in tea agroecosystems have often been considered negligible due to the general notion that tea soils are typically well-drained and aerobic [30], and integrated analyses have not considered CH4 [6]. This perspective, however, may overlook the effects of common management practices, such as soil compaction from human traffic or heavy machinery and altered soil chemistry from agrochemical inputs, which can create conditions favourable to methanogenesis. Biochar applications can alter these conditions. By increasing soil porosity and aeration, biochar may enhance the activity of methanotrophic bacteria, thereby increasing the soil’s capacity to act as a CH4 sink. Conversely, certain biochars can release phenolic compounds that inhibit methane oxidation [31] or create anaerobic microsites within aggregates that could potentially support methanogenesis. Laboratory incubations of acidic tea soils have shown inconsistent results, with some studies reporting no significant effect of biochar on CH4 fluxes [32]. The interactive effects of biochar with shade-tree canopies, which alter soil temperature and moisture, remain entirely unexplored, leaving a critical gap in predicting field-scale CH4 dynamics.
The impact of biochar on soil respiration (CO2 flux) in tea plantations is equally unresolved. While the primary benefit of biochar is the addition of recalcitrant carbon for long-term sequestration, its immediate effect on native soil organic carbon (SOC) mineralization is debated. The addition of labile carbon from fresh biochar can trigger a positive priming effect, stimulate microbial activity, and temporarily increase CO2 emissions [29,33]. In contrast, other studies suggest biochar can stabilize native SOC within newly formed aggregates, leading to a negative priming effect and reduced overall respiration [26]. Field studies in tea gardens have yielded conflicting results: for instance, Wang et al. [32] observed a decrease in CO2 emissions from an acidic tea garden soil amended with biochar, whereas Han et al. [34] found that manure application stimulated respiration far more than biochar did.
Potential interactions between biochar, GHG fluxes, and soil moisture dynamics have been almost entirely overlooked. Biochar is widely recognized for its ability to improve soil water retention [24]. Studies have also generally found that biochar reduces soil evaporation [35,36]. However, prior studies have focused on agricultural systems, and field measurements of soil water-vapour (H2O) flux in response to biochar application in woody crops appear to be non-existent. Soil moisture is a key variable that controls the redox conditions governing CH4 cycling and modulates microbial and root respiration, directly influencing CO2 emissions [37]. Understanding how biochar-induced changes in soil water flux interact with the microclimate modifications from shade trees is essential for assessing impacts on water-use efficiency and the coupled C and water cycles.
The present study provides the first field assessment of biochar’s effects on soil CO2, CH4, and H2O fluxes within a subtropical tea agroforestry system, utilizing a high-resolution, closed-dynamic chamber system and real-time gas analysis for flux measurements. The primary objectives were to: (1) quantify how biochar treatment influences the fluxes of soil CH4, CO2, and H2O vapour; (2) determine the extent to which soil physicochemical properties, such as pH, bulk density, moisture content, temperature, organic matter, and macronutrient concentrations (N, P, and K), mediate these flux responses; (3) assess whether shade trees interact with biochar treatment to modulate soil CH4, CO2, and H2O vapour fluxes; and (4) evaluate the relative contributions of drivers (e.g., edaphic factors and the presence of shade trees) in shaping flux patterns. We hypothesized that biochar application would significantly reduce net CH4 emissions (increase net CH4 sink) by improving soil aeration while having a negligible effect on total soil respiration (CO2), reduce H2O vapour fluxes, and that the presence of shade trees would modulate these responses by creating cooler, moister soil conditions conducive to CH4 oxidation and by reducing soil respiration and evaporation.

2. Materials and Methods

2.1. Study Sites

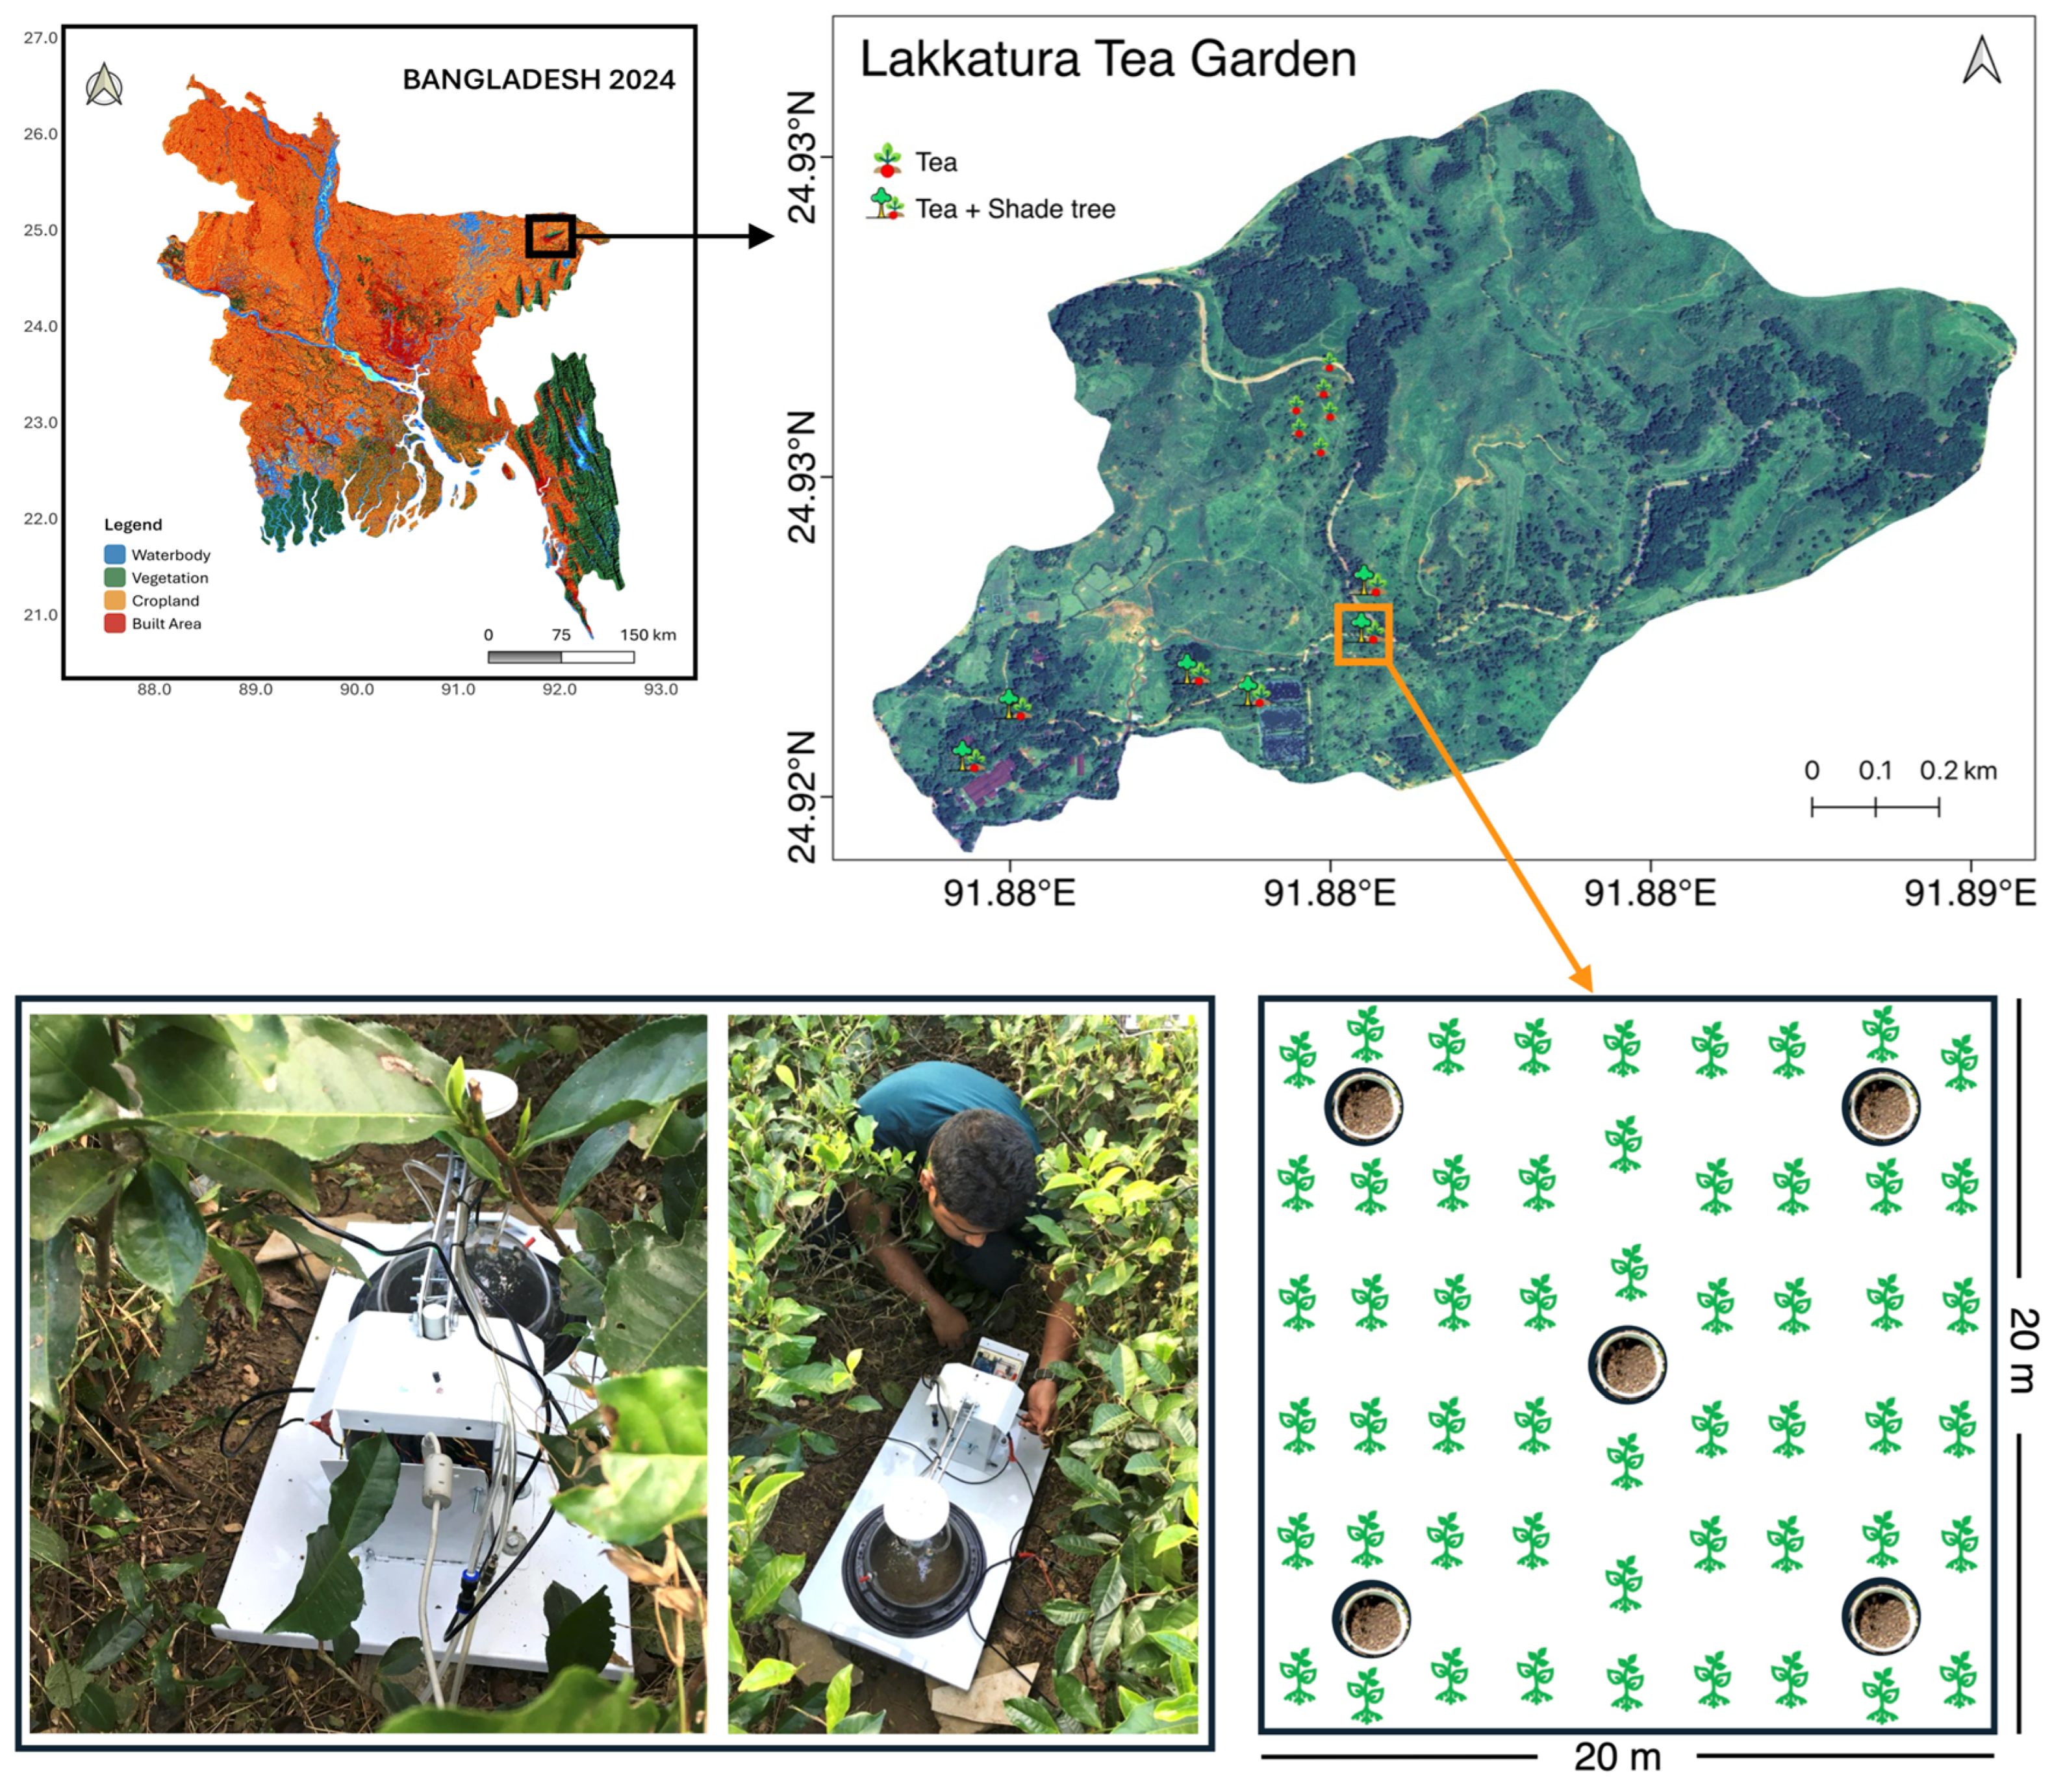
The field experiment was carried out in the Lakkatura Tea Garden (24.90° N, 91.905° E; hereafter “LTG”), on the outskirts of Sylhet, northeastern Bangladesh. LTG is one of the largest estates administered by the Bangladesh National Tea Board and covers approximately 1293 ha of undulating, low-elevation terrain (Figure 1). Monoculture stands of tea (Camellia sinensis) dominate the estate. Permanent shade is provided mainly by Albizia odoratissima (L.f.) Benth. (Leguminosae) and Melia azedarach L. (Meliaceae) planted between tea rows at ~100 trees ha−1; leguminous Albizia also enriches soil N through litter and root turnover [38]. In this study, ‘agroforestry’ (tea + shade-tree) plots were located in tea rows with this established shade-tree overstorey, whereas ‘agricultural’ (tea only) plots were located in adjacent tea-only rows lacking shade trees, so that the presence or absence of the shade-tree canopy constituted one factor in the experimental design. The shade-tree system was installed in 2007–2008, and in May 2016, 20 m × 20 m “agricultural” and “agroforestry” plots were replicated for the present study, nine years after co-planting.
LTG lies on the eastern Surma-Kushiyara floodplain (Agro-ecological Zone 20) [39]. Parent material is Holocene alluvium deposited by the Surma River system; the resulting soils are young Entisols and weakly developed Inceptisols that are typically sandy-to-silty loams. Profiles are strongly acidic (field pH ~5.5) and low in organic matter, reflecting intense leaching and decades of ammonium fertilizer use in tea gardens [23,38]. Nutrient status is therefore heterogeneous and closely linked to land-use history and topographic position. These strongly acidic, low-organic-matter, sandy-to-silty loam soils are typical of intensively managed tea estates in the region and provide conditions under which relatively small changes in aeration and moisture—such as those induced by biochar addition and shade-tree canopies—can have disproportionate effects on GHG fluxes.
The estate experiences a humid subtropical monsoon climate. Mean daily maxima reach 31–32 °C in late summer (August), while mean minima fall to ~13–15 °C in January (source: https://weatherspark.com). Long-term records indicate 4100 ± 300 mm of rain per year, with 75–80% falling during the southwest monsoon (May–September) when orographic uplift against the Meghalaya Plateau intensifies convection. The cool, comparatively dry season extends from December to early February, providing a brief respite from perennial humidity.

2.2. Sampling Design

Twelve square plots (20 m × 20 m; 400 m2 each) were established on level ground at Lakkatura Tea Garden in May 2016. A full two-factor randomized complete-block design was employed, with land-use system (tea monoculture versus tea + shade-tree agroforestry) crossed with biochar dose (0 t·ha−1 control versus 7.5 t·ha−1). This 7.5 t·ha−1 rate was selected as a conservative, field-realistic dose at the lower end of rates commonly used in agricultural biochar trials and shown to elicit measurable soil and crop responses in field studies, and it corresponded to the maximum amount that could be realistically produced on-site and uniformly applied across the experimental area without disrupting estate operations. Each of the four treatment combinations was replicated three times, giving 12 plots in total. Plots were spatially dispersed across the garden to the extent possible to minimize treatment carryover and edge effects. Biochar was broadcast evenly across the soil surface and incorporated to a depth of ~2 cm during routine cultivation immediately after application.

2.3. Biochar Production and Characterization of Physicochemical Properties

Biochar was prepared exactly as described by Karim et al. [23]. Air-dried mill offcuts from the commonly planted tree Acacia auriculiformis A. Cunn. ex Benth. were pyrolyzed for 3.5 h in a locally fabricated open “flame-curtain” kiln of the Kon-Tiki design [40]. Kiln-wall thermocouples recorded an average pyrolysis temperature of about 450 °C, with brief peaks up to 550 °C. As soon as the flame front collapsed, the incandescent char was quenched with water for 30 min to remove condensable volatiles [41], drained thoroughly, and sun-dried for three days before field application.
Biochar physicochemical characterization followed the same protocols as Karim et al. [23]. Total carbon and nitrogen were measured with a LECO TruSpec 628 CN analyzer (St. Joseph, MI, USA), whereas trace elements were determined after four-acid digestion by inductively coupled plasma mass spectrometry (ICP-MS) at Activation Laboratories (Ancaster, ON, Canada). Volatile matter and ash were quantified by proximate analysis (ASTM D1762-84). Assessments of volatile matter, ash content, pH, electrical conductivity, and bulk density were conducted in accordance with the standard methods previously described [23]. Detailed physicochemical properties of the biochar are provided in Table A1.

2.4. Greenhouse Gas Flux and Microenvironmental Variable Measurements

Five PVC collars (internal diameter = 20 cm; height ≈ 10 cm) were installed at equal distances from plot edges and treatment boundaries in each of the 12 plots at least seven days before the first sampling campaign. Collars were pushed ~5 cm into the soil to minimize leakage [42] and laid out to capture within-plot flux heterogeneity; any plants rooted inside a collar were clipped flush with the surface at installation to ensure soil-only flux measurements. Fluxes were measured twice—once in mid-December 2016 and again in late January 2017 (7–8 months following biochar additions). These two campaigns were intentionally scheduled during the cool, dry winter, a period with minimal field-operation disturbance, to capture treatment effects on soil–atmosphere exchange under stable dry-season conditions.
Carbon dioxide, methane, and water-vapour mole fractions were measured with an ultraportable greenhouse-gas analyzer (Los Gatos Research model 915-0011, San Jose, CA, USA; off-axis integrated cavity ring-down spectroscopy). A transparent, custom respiration chamber (radius = 10 cm, volume = 2450 cm3; early prototype of CS-RC10, CredoSense Inc., Toronto, ON, Canada) was placed on each collar and connected to the gas analyzer in a closed dynamic configuration. Three consecutive runs of ~2.5 min were logged at 1 Hz. No precipitation occurred during either campaign, precluding “Birch-effect” post-precipitation increases in gas fluxes [43].
To minimize potential artefacts associated with transparent chambers (radiative heating and pressure disequilibrium), the chamber was equipped with a Venturi vent to maintain near-ambient pressure and limit heat accumulation during closure. Fluxes were estimated from a short, high-quality fitting window after excluding the initial “dead band” (see flux-processing procedure below), which constrains any transient greenhouse warming during the fitted interval. Chamber air temperature remained stable during measurements (typically within ±0.5 °C). Gas temperature and pressure were recorded continuously by the analyzer and were explicitly incorporated into the ideal-gas conversion used to compute fluxes.
Immediately after each flux measurement, volumetric soil-water content and temperature in the upper 10 cm were recorded within 50 cm of the collar using a CS-SM2 probe (±2.5% VWC, ±0.5 °C; CredoSense Inc., Toronto, ON, Canada). Within-plot soil pH was measured on pooled cores with a handheld meter (HI98100, Hanna Instruments, Woonsocket, RI, USA).
Raw mole-fraction time series of CO2, CH4, and H2O vapour were processed with the algorithm of Halim et al. [44], designed to accommodate both linear (low) and nonlinear (high) flux regimes. After excluding the “dead band,” the first 20–30 s of the gas concentration measurement [45,46], the routine searched the first 90 s for the window (~50 s) whose CO2 concentration–time slope showed the highest Pearson correlation (r). This same window was then used to calculate the slope of CH4 and H2O vapour concentrations. For calculating concentration-time slope, if a polynomial test detected significant nonlinearity, data were fit to the following equation:
C t = C x + C 0 C x e { a   x ( t t 0 ) }
where C t is the instantaneous H2O vapour or water-corrected CH4 or CO2 mole fraction at the time t; C 0 is the value of C t at t = 0; C x is an asymptote parameter; a is a curvature parameter; and t0 is the time when the chamber is closed [45]. The initial slope for non-linear concentrations was then calculated as
d c d t = a   ( C x C t )
where d c d t = change in gas concentration with time (ppm·s−1; interpreted as µmol·mol−1·s−1), and other parameters are as defined above. In the case of a linear concentration, the slope of the linear model was used as d c d t . In either case, the gas flux rate was then determined as
F = P   V R   T   A × d c d t
where F = CO2, CH4, or H2O vapour flux, P = air pressure (1.01325 MPa); V = effective volume of chamber (m3); R = ideal gas constant (8.31 Pa·m3·K−1·mol−1); T = gas temperature (K); A = chamber surface area (0.0346 m2), and d c d t is the slope of CO2 or CH4 or H2O vapour concentrations with time, as determined above.
The effective chamber volume (m3) for each measurement was calculated as the sum of the chamber volume, the collar volume protruding above the soil surface, and the connecting tube plus analyzer cavity volume. Collar volume above the ground was determined from the mean collar height measured at four cardinal points inside each collar.

2.5. Determination of Soil Physicochemical Properties

Soil samples were collected during the final gas-flux campaign from the soils directly within each collar. Physicochemical properties were analyzed following the methods described by Karim et al. [23]. Gravimetric soil moisture content (%) was determined by oven-drying samples at 60 °C for 48 h. Bulk density (g·cm−3) was calculated by dividing the dry mass of soil (105 °C for 24 h) by the sample volume (π × r2 × h = 196.35 cm3). Soil organic matter content (%) was assessed using the loss-on-ignition method, with samples combusted at 600 °C for six hours [47]. Total nitrogen (N) was determined by the semi-micro Kjeldahl method [48], while available phosphorus (P, µg·g−1) was extracted using Bray and Kurtz-1 for acidic soils and quantified colorimetrically at 882 nm [49]. Available potassium (K, meq·100 g−1) was measured using ammonium acetate extraction and flame photometry at 766.5–769.5 nm [50].

2.6. Statistical Analysis

All statistical analyses were carried out in R 4.5.1 [51]. For every collar, the three consecutive flux runs were averaged, so each plot and sampling date provided five collar means. A preliminary linear mixed-effects model that treated sampling “campaign” (mid-December 2016 versus late January 2017) as a fixed effect revealed neither a main nor an interactive influence of date on any response variable (all p > 0.20). Data from the two campaigns were therefore pooled, yielding 60 collar-level means used in the statistical analyses.
Treatment effects on CH4, CO2, and H2O vapour fluxes were evaluated with a hierarchical mixed-effects model of the form Y ~ land-use system × biochar + (1|plot/collar), in which tea monoculture versus tea-plus-shade-tree agroforestry constituted the land-use factor and biochar dose was control (0 t·ha−1) or 7.5 t·ha−1. Random intercepts were assigned to collars nested within plots to partition collar- and plot-level variance. Models were fitted with lme4::lmer, and Satterthwaite-adjusted denominator degrees of freedom were supplied by lmerTest [52]. When the land-use × biochar interaction was significant at α = 0.05, pairwise contrasts were performed with Tukey’s honestly significant difference test implemented in multcomp, and compact letter displays were generated with multcompView [53].
Bivariate relationships between individual gas fluxes and soil properties—bulk density, pH, organic-matter content, Bray-1 phosphorus, exchangeable potassium, and total nitrogen—were explored with ordinary least-squares regression using stats::lm. Model coefficients, R2 values, and p-values were extracted, and fitted lines with 95% confidence envelopes were visualized with ggplot2 [54].
Finally, a covariance-based structural-equation model (SEM) was constructed in the R package “lavaan” and plotted with “semPlot” to disentangle direct and indirect controls on each gas flux [55]. Exogenous nodes comprised biochar application, shade-tree presence, and the eight soil variables; endogenous nodes were the three fluxes. Models were fitted by maximum likelihood with robust (Huber–White) standard errors, and the final path diagram retained only links with p ≤ 0.10. Standardized coefficients are reported to facilitate comparison of pathway strengths.

3. Results

Measurements indicated moderate rates of soil CO2 efflux in the tea agroecosystem, with values ranging from 1.33 to 4.41 µmol·m−2·s−1 (overall mean [±SE] 2.63 ± 0.06 µmol·m−2·s−1). Soil evaporation rates were low to moderate, ranging from 10.2 to 276.4 µmol·m−2·s−1 (overall mean 84.1 ± 3.2 µmol·m−2·s−1), consistent with relatively low to moderate soil water content characteristic of the dry-season. Net CH4 uptake was observed for all measurements, with values ranging from –3.55 to –0.19 nmol·m−2·s−1 (overall mean –1.92 ± 0.07 nmol·m−2·s−1).

3.1. Biochar Effects on Soil CH4, CO2, and H2O Fluxes

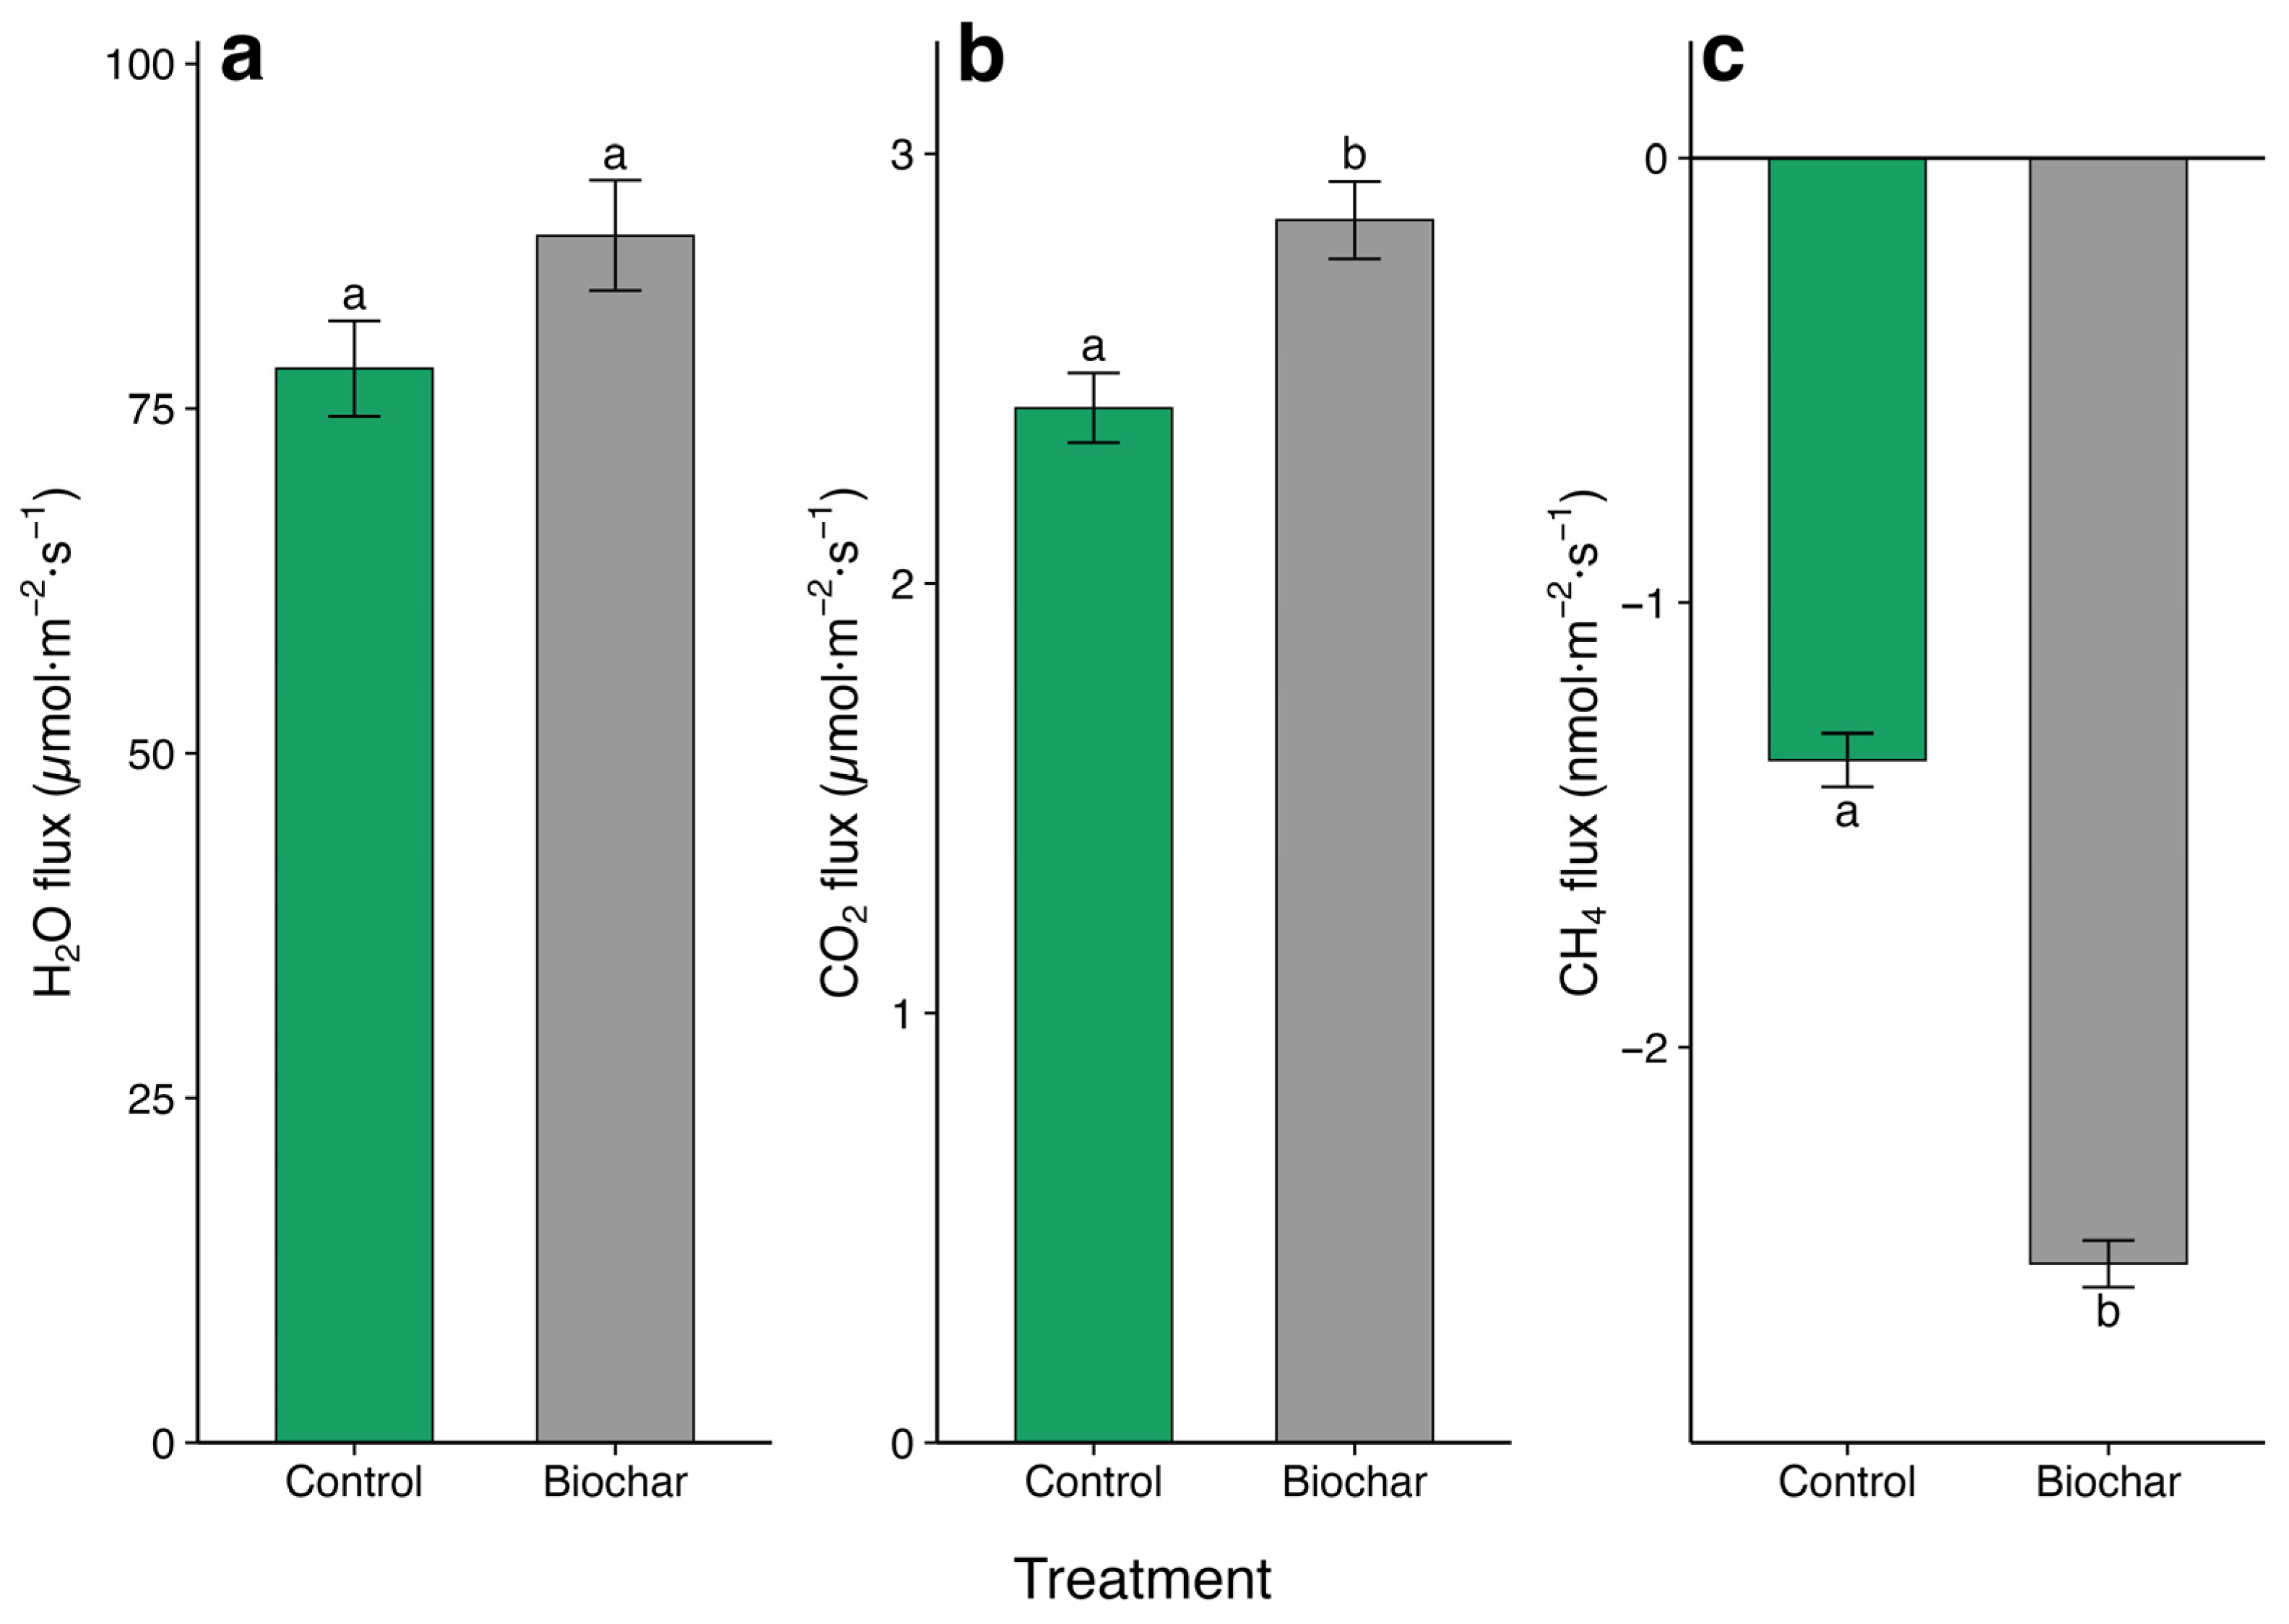
Biochar addition (7.5 t·ha−1) significantly altered soil GHG exchange relative to the unamended control (Figure 2). Mean CH4 uptake shifted from −1.35 ± 0.06 nmol·m−2·s−1 in control soils to −2.49 ± 0.05 nmol·m−2·s−1 under the biochar addition treatment, an 84% increase in net uptake (p < 0.001) (Figure 2c). Carbon-dioxide effluxes rose, from 2.41 ± 0.08 to 2.84 ± 0.09 µmol·m−2·s−1—an 18% enhancement (p < 0.001) (Figure 2b). Water-vapour flux exhibited only a marginally significant 12% rise (77.9 ± 3.47 vs. 87.5 ± 4.00 µmol·m−2·s−1; p = 0.07) (Figure 2a).

3.2. Interactive Effects of Biochar and Shade Trees on Soil GHG Exchange

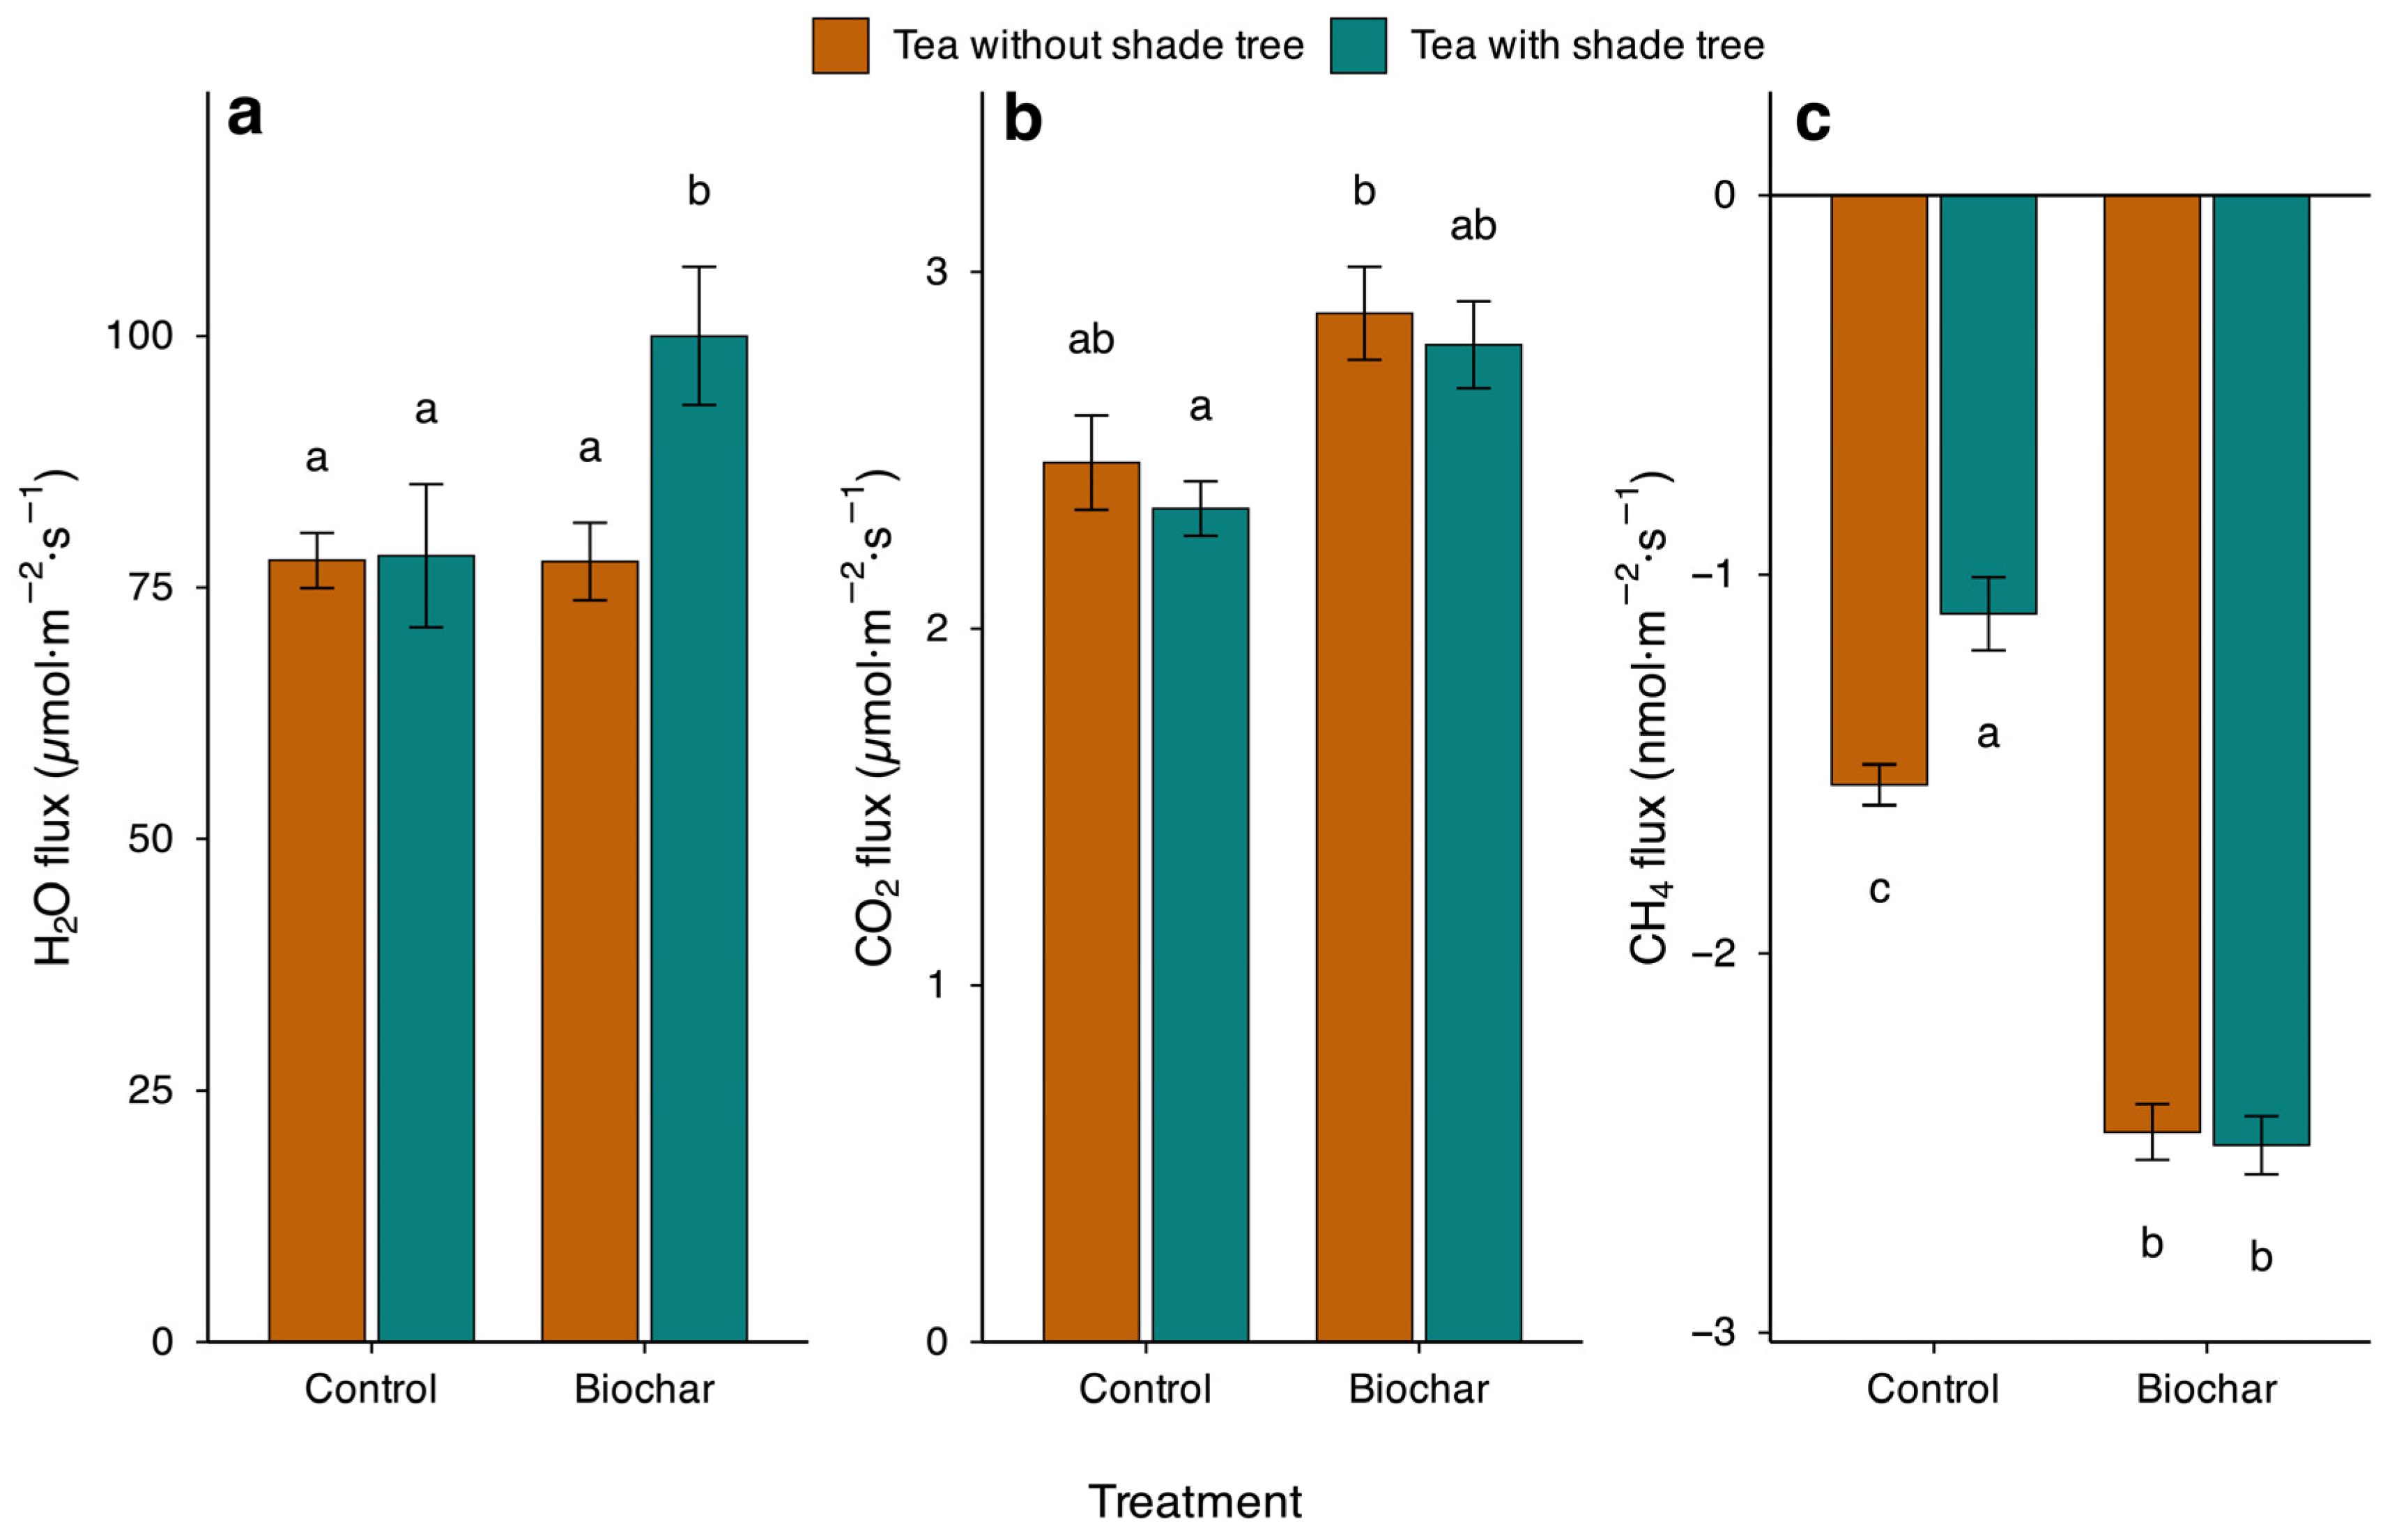
A significant biochar × shade-tree interaction was detected overall for all three gases (mixed-effects model, p < 0.01), driven primarily by CH4 and H2O; for CO2, post hoc comparisons indicated an additive pattern (i.e., shade lowered baseline flux but did not alter the biochar effect size) (Figure 3).
Net CH4 uptake (Figure 3c) was somewhat higher in the control treatment without shade trees (–1.55 ± 0.05 nmol·m−2·s−1) than in the corresponding plots with shade trees (−1.10 ± 0.10 nmol·m−2·s−1). Soils under both canopy conditions showed marked increases in CH4 uptake in response to biochar additions, exhibiting similar flux rates (−2.51 ± 0.08 and −2.47 ± 0.07 nmol·m−2·s−1), corresponding to increases of 62% and 125%, respectively.
Biochar addition increased CO2 efflux (Figure 3b) under both canopy conditions, and shade did not modify the biochar effect size. Mean fluxes were highest in unshaded biochar plots (2.88 ± 0.13 µmol·m−2·s−1), followed by shaded biochar plots (2.80 ± 0.12), unshaded controls (2.47 ± 0.13), and shaded controls (2.34 ± 0.08). Post hoc tests showed that both biochar treatments had significantly higher CO2 efflux than the shaded control (p < 0.05), whereas the difference between the two biochar treatments was not significant (p > 0.2). The shaded control remained the only treatment significantly lower than the others, indicating an additive–not synergistic-effect of shade and biochar.
Shade modified the direction of the biochar effect on H2O vapour flux (Figure 3a). Shaded biochar plots exhibited the highest H2O flux (100 ± 6.9 µmol·m−2·s−1), significantly exceeding unshaded biochar plots (77.6 ± 3.9; p = 0.014) and both control treatments (78.1 ± 7.1 and 77.7 ± 2.8; both p < 0.03). No significant differences were detected among unshaded biochar and the two control treatments (p > 0.8), indicating that shade enhanced biochar-induced moisture loss, contrary to the initially assumed pattern.
Together, these patterns indicate that biochar consistently enhances CH4 uptake across canopy conditions, increases CO2 efflux in an additive manner, and elevates H2O vapour flux only when combined with shade, underscoring the role of canopy microclimate in mediating soil–biochar interactions.

3.3. Relations Among CH4, CO2 and H2O Fluxes

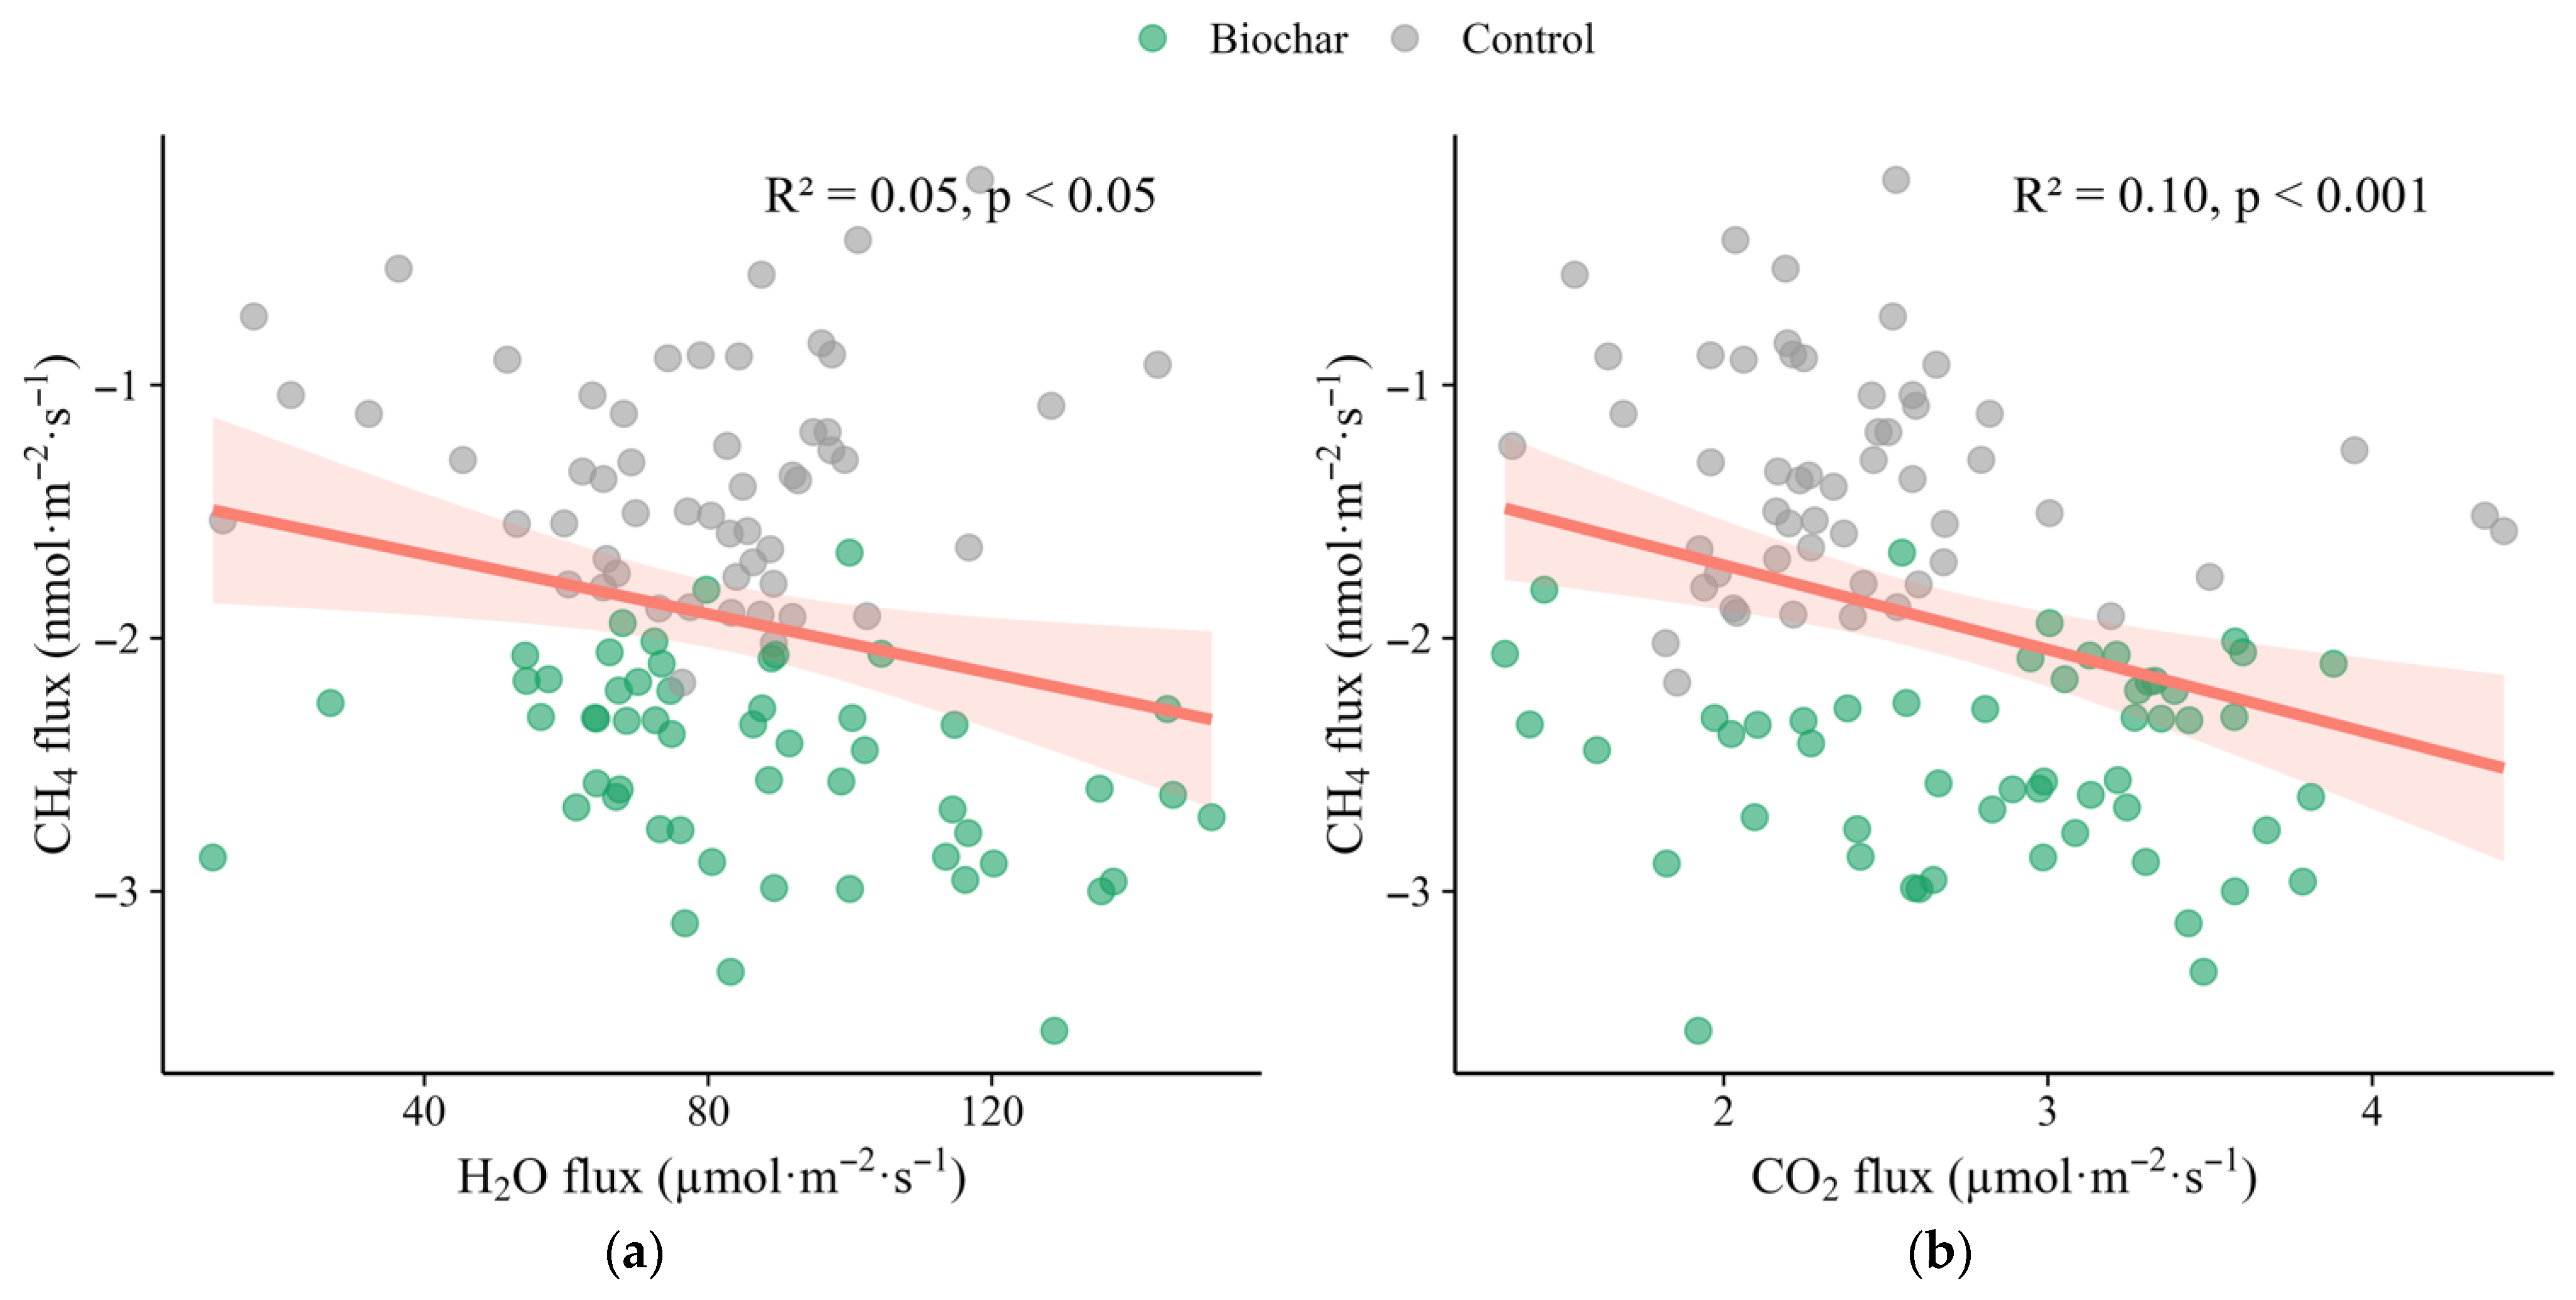
Bivariate analyses showed that methane uptake was weakly but significantly coupled to the exchange of both H2O vapour and CO2 (Figure 4). Across all collars and treatments, CH4 flux became more negative (i.e., uptake increased) as H2O flux rose (slope = −0.006 nmol CH4·m−2·s−1 per µmol H2O·m−2·s−1, R2 = 0.05, p = 0.03, Figure 4a). A steeper inverse relationship was detected between CH4 and CO2 (slope = −0.333 nmol CH4·m−2·s−1 per µmol CO2·m−2·s−1, R2 = 0.10, p < 0.001; Figure 4b). Neither the slopes nor the intercepts differed between the biochar and control datasets (interaction terms, p > 0.1), so a single pooled regression is reported. These patterns suggest that conditions that stimulate soil respiration and water vapour loss—likely higher diffusivity and greater microbial activity—also favour methanotrophic CH4 oxidation, reinforcing the fact that CH4 dynamics are functionally integrated with broader carbon and moisture exchanges in this subtropical tea soil.

3.4. Soil Drivers and Mechanistic Pathways Governing Gas Exchange

The multivariate picture that emerged from the combined regression and structural equation modelling (SEM) analyses (Figure 5 and Figure 6) shows that each gas responds to a distinct but partially overlapping suite of soil and management factors.
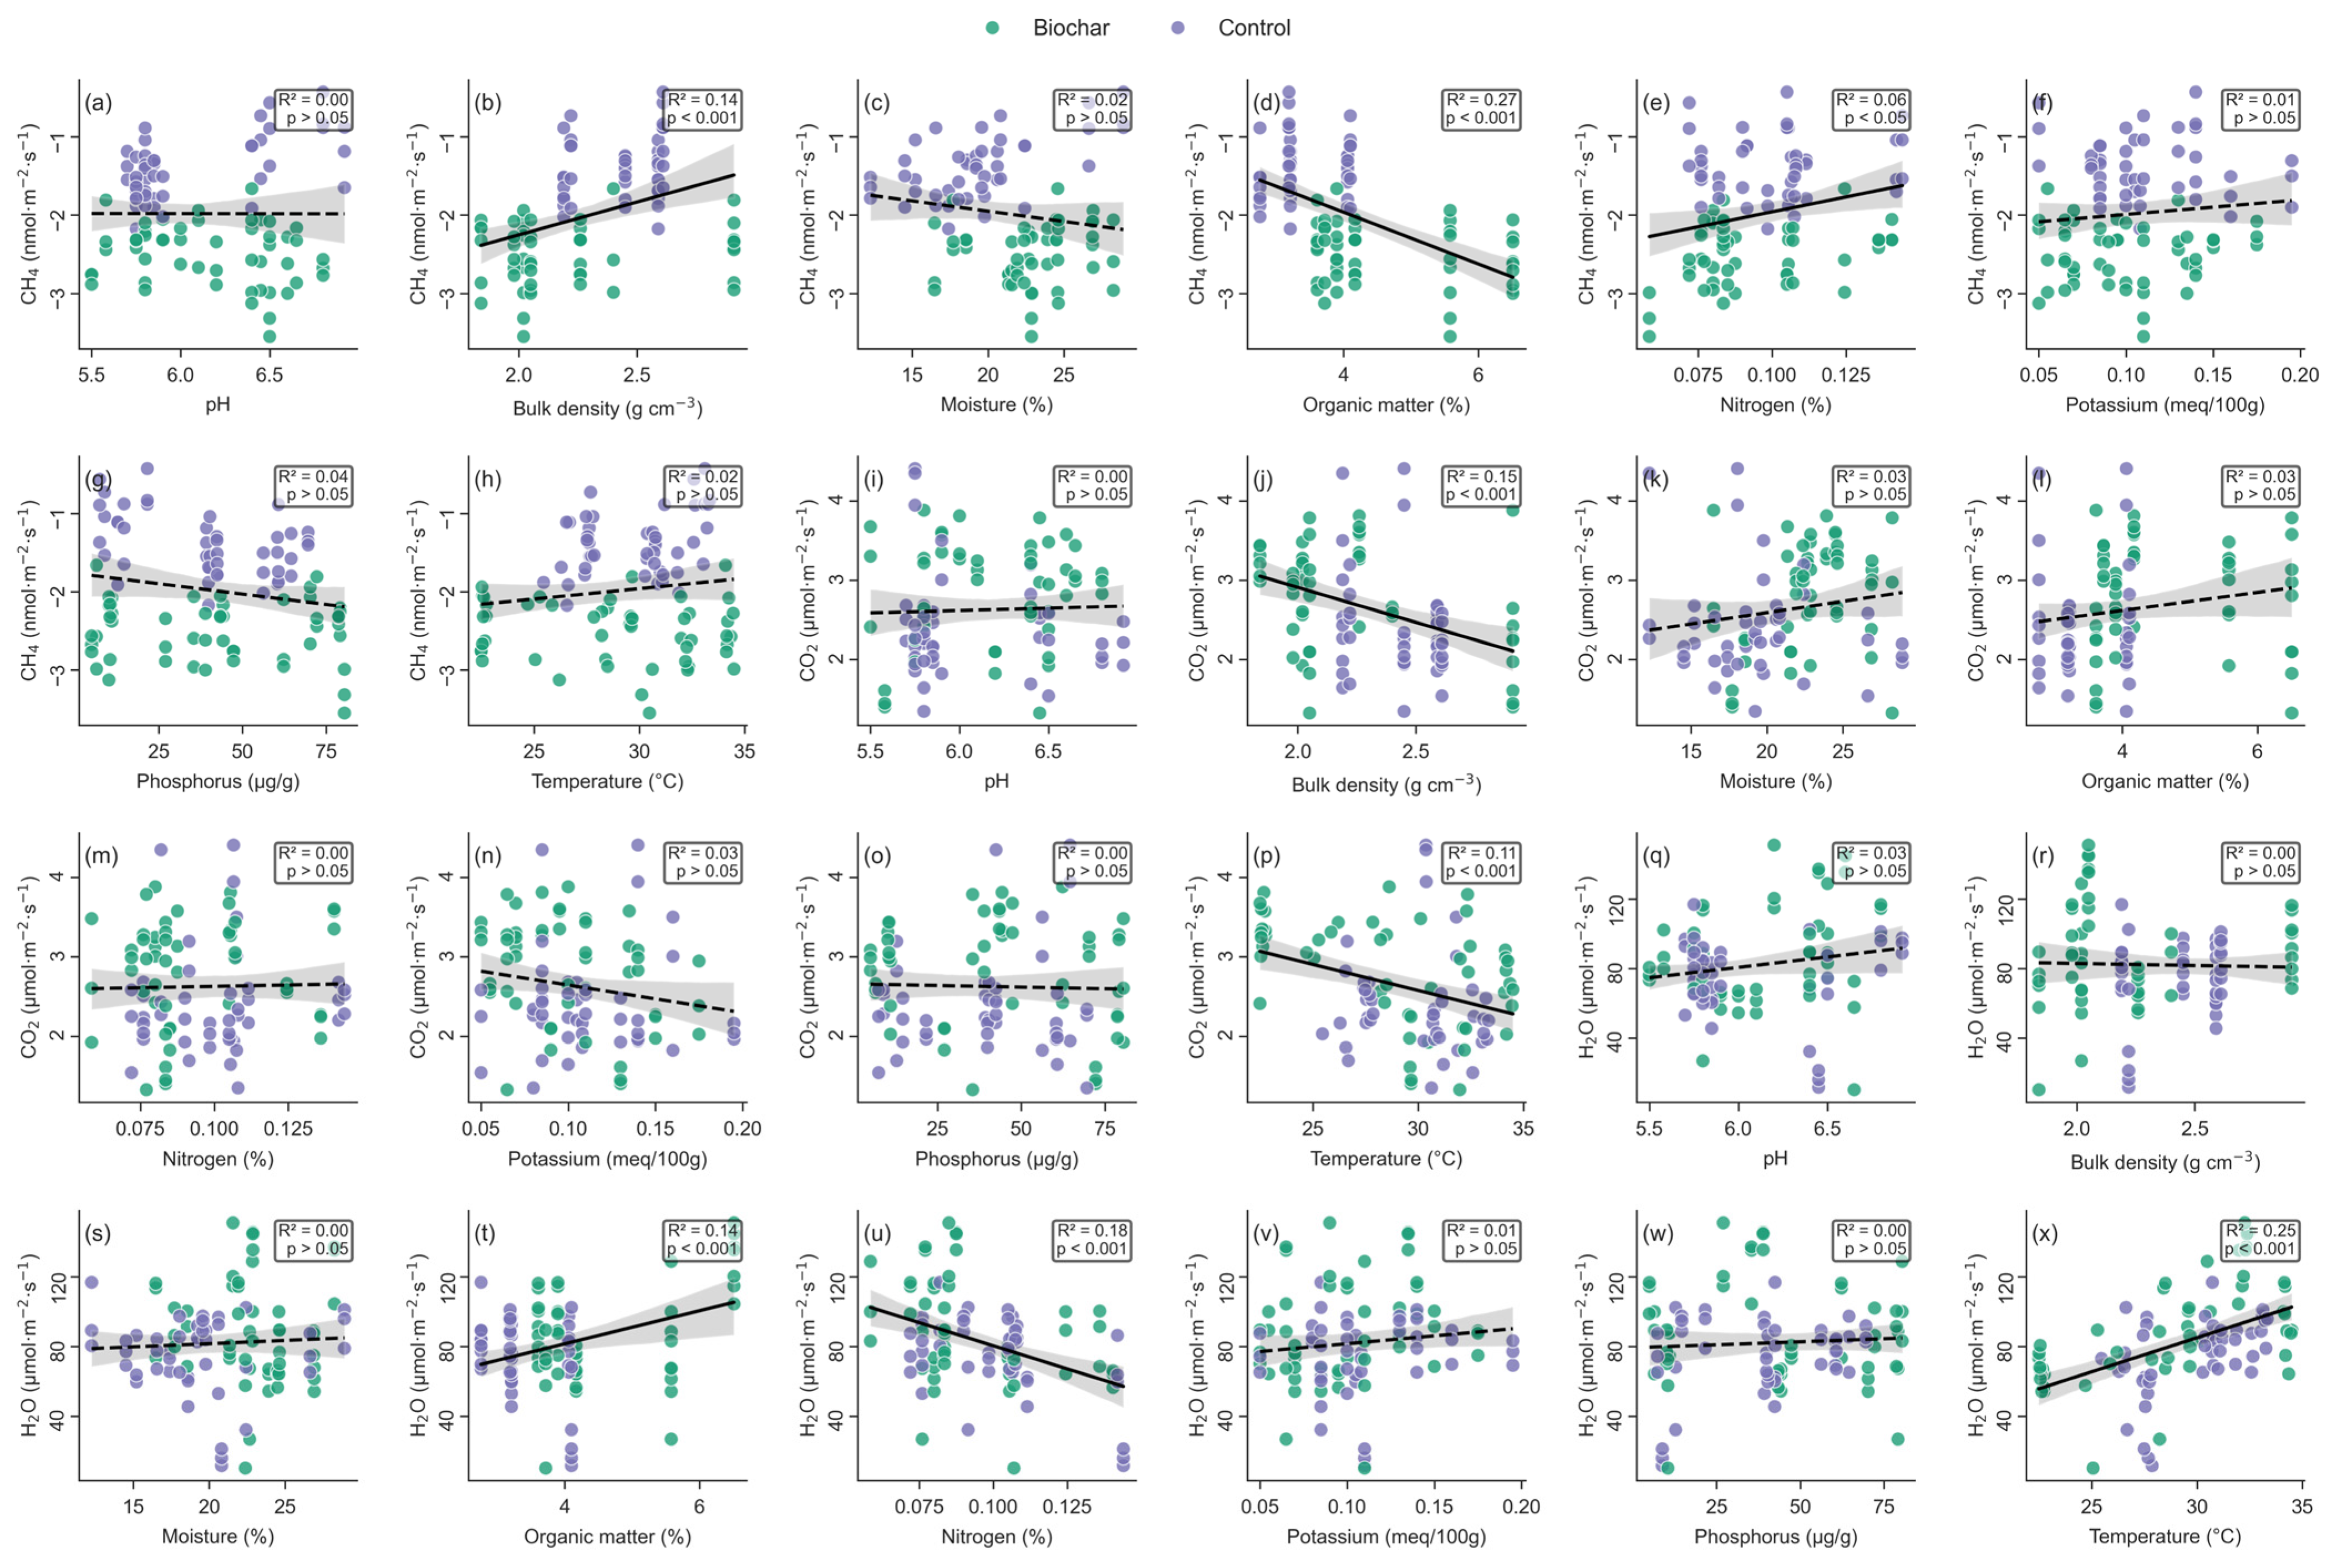
For CH4 flux, the bivariate regressions indicated consistent associations with key soil properties. CH4 uptake weakened as bulk density increased (R2 = 0.09, p = 0.004; Figure 5b) and showed positive relationships with organic-matter content (R2 = 0.21, p < 0.001; Figure 5d) and total nitrogen (R2 = 0.06 and p = 0.02; Figure 5e), indicating that higher organic matter and nitrogen contents were associated with weaker net CH4 uptake (negative fluxes closer to zero).
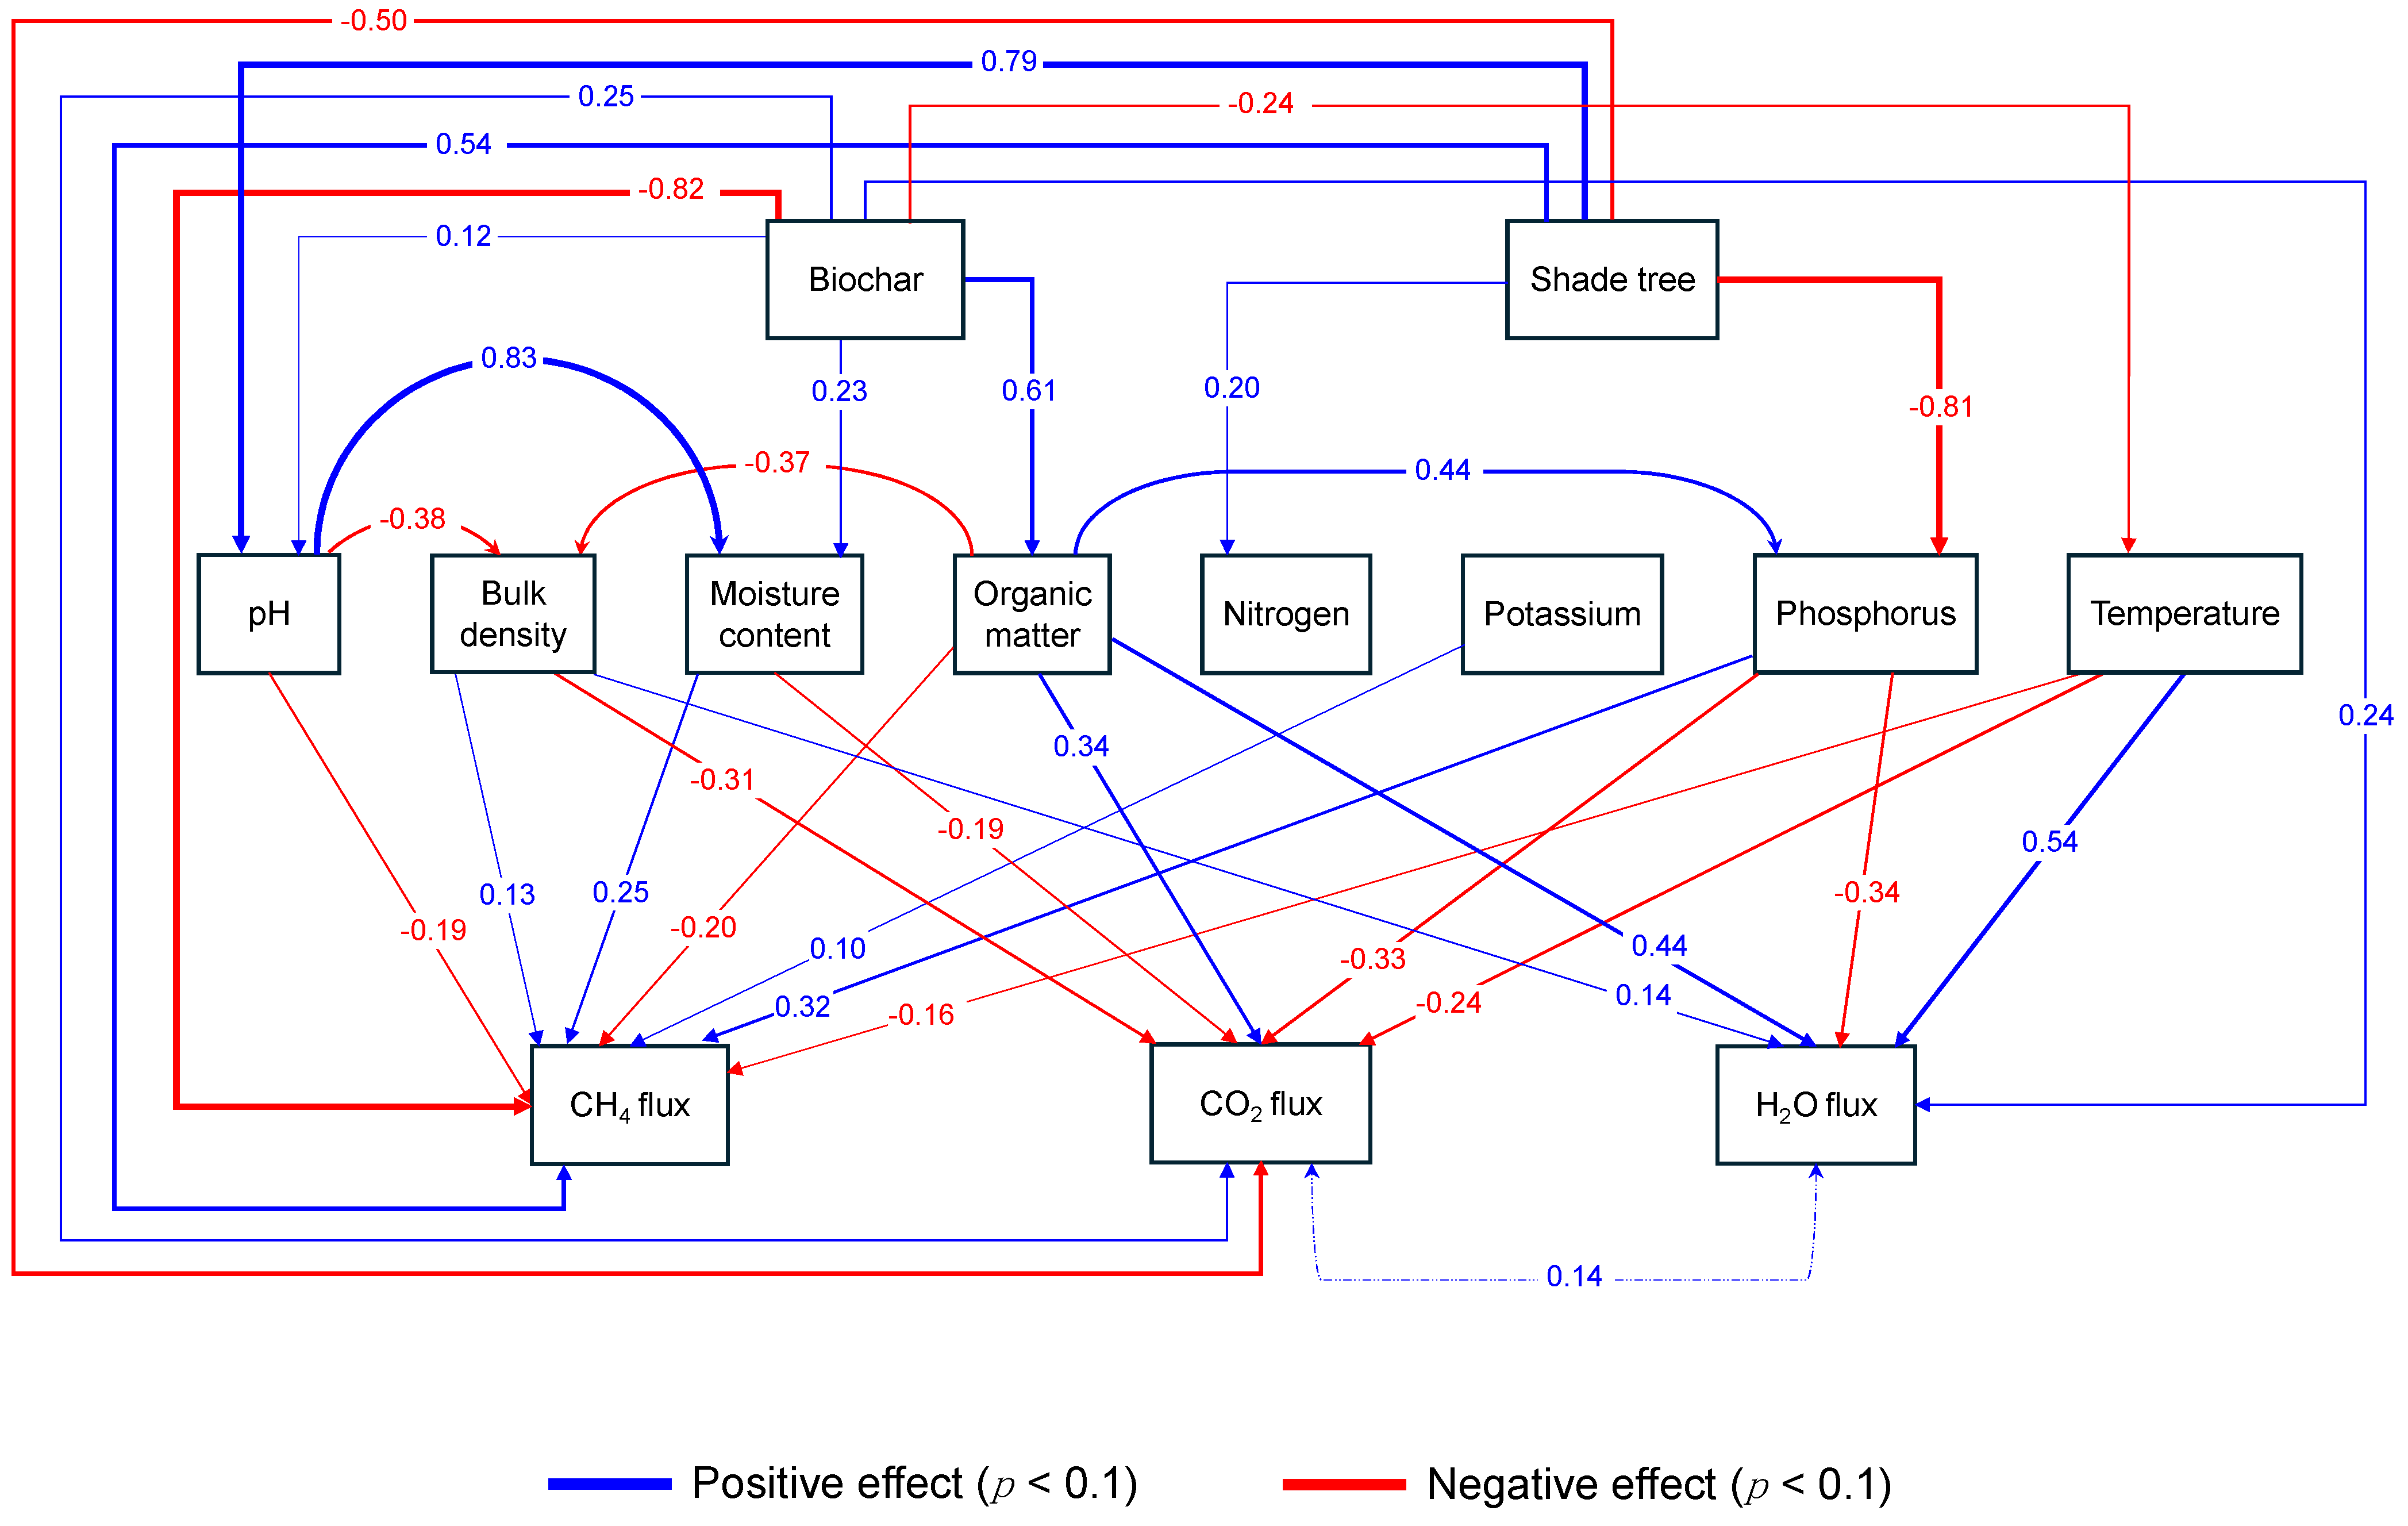
In the SEM (Figure 6), which explained 74.0% of the variance in CH4 flux (R2 = 0.74), biochar treatment emerged as the strongest single predictor (β = −0.82, p < 0.001), indicating a large enhancement of CH4 uptake (more negative fluxes) in biochar-amended plots.
Positive paths from shade-tree presence (β = 0.54 and p < 0.001), bulk density (β = 0.13 and p = 0.055), gravimetric moisture (β = 0.25 and p = 0.005), exchangeable K (β = 0.10 and p = 0.010), and Bray-1 P (β = 0.32 and p = 0.025) indicate that higher values of these variables are associated with weaker net CH4 uptake (i.e., negative flux closer to zero). In contrast, organic matter exerted a negative effect (β = −0.20 and p = 0.023), as did soil pH (β = −0.19 and p = 0.081) and temperature (β = −0.16 and p = 0.061), consistent with slightly stronger uptake at higher values of these variables. Taken together, these pathways indicate that biochar alters CH4 flux both directly and via changes in soil structure, moisture, and nutrient status, with some co-varying soil properties (e.g., greater moisture, K, and P) partially offsetting the strong direct enhancement of the CH4 sink.
The controls on CO2 efflux were more diffuse. In the bivariate analysis, CO2 declined with bulk density (R2 = 0.10 and p = 0.004; Figure 5j), decreased slightly with temperature (R2 = 0.12 and p < 0.001; Figure 5p), and showed only a marginal tendency to fall with K (R2 = 0.03 and p = 0.08; Figure 5n). The SEM, which explained 31.5% of the variance (R2 = 0.315), clarified these relationships and indicated that shade-tree presence (β = −0.50 and p = 0.003) and bulk density (β = −0.31 and p = 0.008) exerted the strongest suppressive effects. Bray-1 P (β = −0.33 and p = 0.014), temperature (β = −0.24 and p = 0.039), and gravimetric moisture (β = −0.19 and p = 0.042) also contributed negatively. In contrast, biochar (β = 0.25 and p = 0.038) and organic matter (β = 0.34 and p = 0.025) exerted a direct positive effect on soil CO2 flux. Overall, these results indicate that CO2 efflux reflects a balance between physical structure, microclimatic conditions, and increases in soil organic content.
For water-vapour flux, the collar-level regressions suggested a positive link with organic matter (R2 = 0.11 and p = 0.006; Figure 5t) and a pronounced negative link with total N (R2 = 0.18 and p < 0.001; Figure 5u). In the SEM, temperature was the dominant driver (β = 0.54 and p < 0.001), followed by organic matter (β = 0.44 and p < 0.001). Bulk density showed a marginally positive effect (β = 0.14 and p = 0.053), while biochar (β = 0.24 and p = 0.015) had a significant direct influence on vapour fluxes. The model accounted for 34.7% of the variance, indicating that, during the dry-season campaigns, temperature and organic matter outweighed amendment-induced physical changes in controlling vapour exchange.
Overall, our statistical analyses provide the basis for the mechanistic interpretation developed below, namely that biochar-related changes in soil structure and associated nutrient pools are most closely linked to CH4 flux, that CO2 efflux co-varies with substrate availability and diffusional constraints imposed by canopy cover and soil compaction, and that H2O flux appears more strongly associated with temperature and organic matter than with the amendment’s physical legacy.

4. Discussion

Our study provides, to our knowledge, the first field assessment of biochar’s effects on concurrent soil fluxes of methane, carbon dioxide, and water vapour within a tea agroforestry system, revealing a complex suite of responses. Taken together, CH4 uptake, CO2 efflux, and H2O vapour efflux represent linked expressions of how biochar and shade trees reshape the soil–atmosphere interface by altering soil structure, moisture availability, and surface energy balance. The most pronounced effect was an average 84% enhancement of soil methane uptake following a 7.5 t·ha−1 biochar application. Concurrently, we observed a modest but significant average 18% increase in soil respiration (CO2 efflux) and a marginal 12% rise in water-vapour flux. Crucially, the presence of a shade-tree canopy modulated these outcomes, with a significant biochar × shade-tree interaction detected for all three gases. While responses for CH4 and CO2 were qualitatively similar across canopy conditions, the increase in water-vapour flux occurred only in shaded conditions. These findings offer partial support for our initial hypotheses: although the prediction of enhanced methane uptake was confirmed, the observed increases in CO2 and water-vapour fluxes contradict our expectation that biochar would have negligible or suppressive effects on these emissions.

4.1. Biochar Drives a Major Methane Sink Capacity via Competing Physical and Chemical Pathways

The average 84% increase in soil CH4 uptake stands out as the most significant biogeochemical response to biochar application in this study, transforming the tea garden soil into a substantially stronger CH4 sink. This finding is particularly noteworthy given that such well-drained upland tropical soils are not typically considered major players in the methane cycle. Our structural equation model (SEM), which explained 74.0% of the variance in CH4 flux, provides strong evidence that this effect is complex, driven by both direct and indirect mechanisms.
The primary driver was the direct effect of the biochar application itself (path coefficient β = −0.82), indicating that the inherent physical properties of biochar were paramount. The high porosity and large surface area typical of wood-derived biochars produced at similar temperatures likely improved soil aeration and gas diffusivity, creating optimal conditions for methanotrophic bacteria to oxidize atmospheric CH4. This aligns with findings from other managed temperate and boreal forests where biochar application has been shown to increase CH4 uptake [56,57,58]. A comprehensive review by Li et al. [37] confirms that enhanced aeration is the most commonly cited mechanism for increased CH4 consumption in forest soils amended with biochar. Consistent with this, our findings indicate that biochar treatment exerts the strongest negative effect on CH4 flux (β = −0.82), thereby enhancing CH4 uptake.
However, our data also reveal a critical trade-off. Biochar’s direct positive effect on moisture content (β = 0.23) had a suppressive effect (β = 0.25) on CH4 uptake. This suggests that while the bulk soil becomes better aerated, the fine biochar particles can fill pore spaces and hold water, creating anaerobic microsites that may inhibit the activity of aerobic methanotrophs. Furthermore, the weak but significant relationships between CH4 uptake and soil organic matter suggest that the addition of nutrient-rich biochar may alter microbial competition in ways that slightly temper the overall CH4 sink strength. A similar weak relationship was also observed with temperature, likely because temperatures notably suppress methanotrophic activity in upland soils, possibly due to the inhibition of mesophilic methanotrophs [59]. However, since we did not directly measure methanotroph communities or CH4 oxidation directly, this trade-off should be viewed only as a plausible mechanistic interpretation of the flux data. Taken together, these patterns indicate that soil structure, near-surface moisture, and associated organic matter and nutrient pools are the main soil properties through which biochar and shade trees regulate CH4 uptake in this system.
This result contrasts sharply with other studies in acidic tea soils and tropical plantations where biochar had negligible or inconsistent effects on CH4 fluxes [29,60], highlighting that the net impact is highly dependent on biochar properties, soil type, and ecosystem context. The powerful, multifaceted response observed in our study underscores that biochar’s role in the CH4 cycle is not simply a matter of adding porous material, but rather a complex interplay between enhanced gas exchange and the creation of inhibitory, water-saturated, and/or nutrient-rich microsites. At the bulk scale, reduced soil compaction and increased macroporosity expand the volume of well-aerated pore space, improving oxygen supply and diffusion pathways for methanotrophs, thereby tending to strengthen net CH4 uptake. Superimposed on this are localized zones adjacent to biochar particles where high water-holding capacity and nutrient enrichment promote more reduced, heterotroph-dominated microsites that locally suppress methanotrophic activity. Our SEM results and flux patterns suggest that in this upland, well-drained tea soil, the structural gains in aeration more than compensate, at the plot scale, for these inhibitory microsites, yielding a net increase in CH4 uptake even though some portions of the pore network become less favourable for methanotrophy.

4.2. Increased Soil Respiration Driven by an Indirect Substrate Priming Effect

The observed 18% increase in soil respiration (CO2 efflux) following biochar application, while seemingly counterintuitive to the goal of carbon sequestration, is best explained as a short-term, indirect “positive priming effect”. The freshly pyrolyzed biochar, produced from Acacia auriculiformis offcuts, likely contained a fraction of labile organic compounds such as volatile fatty acids [61] that served as a readily available energy source for soil microbes. This infusion of new substrate can stimulate the microbial community, leading to accelerated decomposition of not only the labile biochar components but also of native soil organic matter [29,33].
Our SEM results support this interpretation, showing that CO2 flux was strongly predicted by biochar treatment and organic matter content. This highlights soil organic matter as the key mediating property for CO2 efflux, consistent with the idea that biochar chiefly influences respiration via changes in substrate availability rather than through direct physical alteration of gas diffusivity. Moreover, the SEM revealed another strong direct path from biochar to organic matter, implying biochar’s direct influence on soil respiration is primarily controlled through its effect on the soil microbial community. While some studies have reported reduced CO2 emissions with biochar through SOC stabilization [26], our findings align with others that show a transient increase in respiration due to substrate effects [34].
We interpret this as a short-term positive priming effect of labile biochar components on microbial activity. We cannot rule out contributions from increased root respiration and shifts in microbial biomass, and our short-term dry-season measurements do not resolve how long this elevation in CO2 efflux persists. From a carbon management perspective, this initial pulse of CO2 represents a short-term carbon cost. However, this is expected to be far outweighed by the long-term climate benefit derived from the much larger recalcitrant carbon pool within the biochar that will remain stable in the soil for centuries. In addition, increased microbial activity is expected to be associated with increased nutrient mineralization that can increase net primary productivity. Nevertheless, this priming effect must be considered in full life-cycle assessments of biochar as a climate mitigation tool.

4.3. Biochar’s Contradictory Effect on Water-Vapour Flux: A Thermal Trade-Off

Our finding that biochar increased soil water-vapour flux by up to 12%, with the strongest and statistically significant increase occurring in shaded plots, is notable because it contrasts with the commonly reported pattern that biochar reduces soil evaporation [35,36]. Most reports of reduced evaporation come from annual row-crop systems where biochar is incorporated into the tilled layer, whereas our result reflects surface-applied biochar in a woody perennial agroforestry system, a context for which field data on H2O fluxes are almost non-existent.
Our results strongly suggest that this unexpected outcome reflects an interaction between soil temperature, surface energy balance, and near-surface water availability rather than a purely hydraulic response. The structural equation model (SEM) identified soil temperature as one of the significant predictors of H2O flux (β = 0.54), followed by organic matter and a direct positive path from biochar. We interpret this as evidence that the dark, surface-applied biochar layer likely altered the surface energy balance by absorbing more solar irradiation, modifying near-surface moisture storage and soil surface temperature [62], thereby accelerating evaporation. These SEM results therefore indicate that soil temperature and near-surface organic matter are the dominant soil properties through which biochar influences H2O vapour flux in this tea agroforestry system, mainly via changes in surface energy balance and shallow moisture storage.
In our dry-season campaigns, that combination of warm surface conditions and higher near-surface moisture appears to have been most strongly expressed under the shade-tree canopy, where moderated microclimate and litter inputs likely maintained greater water availability close to the surface. This helps explain why the biochar-induced increase in water-vapour flux was statistically detectable only in shaded plots, whereas unshaded biochar plots—despite higher incident radiation—showed no increase relative to controls, presumably because rapid drying constrained vapour loss. This highlights a critical, context-dependent trade-off: while biochar is well known for improving water retention within the soil profile [36], our findings indicate that when applied at the surface in perennial systems, its thermal properties can enhance surface evaporation under certain canopy configurations. The net effect on water-use efficiency may therefore depend strongly on biochar placement (e.g., surface vs. incorporated) and on how canopy structure shapes microclimates and soil moisture regimes within the agroecosystem.

4.4. An Integrated Strategy: Combining Agroforestry and Biochar for Optimal Climate and Soil Benefits

The most significant insight from this study is the powerful synergy created by combining biochar with shade-tree agroforestry, revealing an integrated and highly effective path toward climate-smart tea production. Our findings demonstrate that an agroforestry system does not just coexist with biochar application but fundamentally improves its performance by mitigating its undesirable effects while locking in its key climate benefits. This highlights that the full potential of a soil amendment like biochar is only realized when it is deployed within a resilient, well-managed ecological system.
While biochar application alone successfully transformed the soil into a potent methane sink, it also came with the costs of increased carbon dioxide and, in some canopy contexts, higher water vapour emissions. However, the presence of shade trees acted as a critical environmental buffer. Under shade, biochar-treated plots exhibited the highest H2O vapour fluxes, consistent with our inference that moderated microclimate and greater near-surface moisture interacted with the darker, warmer biochar surface to sustain evaporation during the measurement campaigns. At the same time, shade trees had a strong suppressive effect on soil respiration (β = −0.50), partially offsetting the temporary increase in CO2 caused by biochar. Crucially, these microclimatic effects did not compromise methane mitigation: CH4 uptake in shaded biochar plots remained high and, in proportional terms, the biochar-induced enhancement of CH4 uptake was at least as strong under shade as in open plots.
From a land management perspective, this integrated approach is a near-optimal strategy. Biochar additions maximize the net greenhouse gas benefit by sustaining high methane uptake and supporting broader soil health by enhancing carbon cycling while improving water retention within the soil profile, even where surface evaporation is locally enhanced, thus aligning with global goals for carbon neutrality and land restoration. By leveraging a biological solution (shade trees) to refine and enhance a technological one (biochar), this combined system provides a robust and actionable framework for building more sustainable and climate-resilient perennial cropping systems worldwide. In practical terms for tea estates, our results suggest that modest, surface-applied rates of biochar produced from on-site pruning are most effective when implemented in existing shade-tree blocks, where they can simultaneously strengthen the CH4 sink and support soil moisture conservation during the dry season. At a policy level, the combination of enhanced CH4 uptake demonstrated here and previously reported reductions in N2O emissions [63] indicates that shaded tea plantations could be priority candidates for biochar-based climate-mitigation and soil-restoration initiatives, although full life-cycle and multi-season GHG budgets are still needed before formal accounting. Our results are consistent with, and add to, emerging evidence for strong benefits of biochar use in multi-species agroforestry systems [64,65].
All measurements were conducted during the cool, dry season; thus, while the dataset captures dry-season responses in an established tea agroforestry system, the results should not be interpreted as annual greenhouse-gas balances or definitive climate-mitigation estimates. Seasonal variation, biochar ageing, and N2O fluxes—critical elements of a complete GHG budget—were not assessed, restricting our inferences to short-term, dry-season conditions. Long-term, multi-season trials that incorporate N2O dynamics, biochar placement depth, and tea yield-quality metrics are essential to validate durability and agronomic viability. Future work should examine whether the strong dry-season enhancement of the CH4 sink we observed persists across wetter periods and inter-annual climate variability. It should also test deeper incorporation versus surface application of biochar—including sub-surface or mulched placements that decouple evaporation from soil warming—to determine whether similar synergies arise in other perennial crops (e.g., coffee, cocoa, rubber) across tropical and subtropical regions.

Author Contributions

Conceptualization, M.A.H., N.V.G. and S.C.T.; methodology, M.A.H., M.R.K., N.V.G. and S.C.T.; software, M.A.H. and M.R.K.; formal analysis, M.A.H. and M.R.K.; investigation, M.A.H., M.R.K. and N.V.G.; data curation, M.A.H. and M.R.K.; writing—original draft preparation, M.A.H.; writing—review and editing, M.A.H., M.R.K. and S.C.T.; supervision, S.C.T.; funding acquisition, M.A.H., N.V.G. and S.C.T. All authors have read and agreed to the published version of the manuscript.

Funding

This research was funded by the Centre for Global Change Science, University of Toronto, Canada, with additional generous support from 48 backers through Experiment.com, a crowdfunding platform for science (https://experiment.com/projects/combating-climate-change-with-biochar-in-beautiful-bangladesh?s=search (accessed on 1 October 2025)).

Data Availability Statement

The data supporting the findings of this study are available from the corresponding author (abdul.halim@mail.utoronto.ca) upon reasonable request.

Acknowledgments

We gratefully acknowledge the support of the managing team of the Lakkatura Tea Garden. We also thank the Department of Forestry and Environmental Science, Shahjalal University of Science and Technology, Sylhet-3114, Bangladesh, in particular Narayan Saha and Romel Ahmed, for their valuable assistance. Additional thanks are extended to Md Abuzar Gifari, Mahabud Rana Tarun, and several other students from Shahjalal University for their help during the study.

Conflicts of Interest

Author Md Abdul Halim is an employee of CredoSense Inc. The remaining authors declare that the research was conducted in the absence of any commercial or financial relationships that could be construed as a potential conflict of interest.

Appendix A

Table A1. Physicochemical properties of the kiln-derived Acacia auriculiformis wood biochar used in this experiment. Previously characterized in Karim et al. [23].
PropertiesUnitMean ± SE (n = 3)
Al%0.083 ± 0.003
Asppm1.000 ± 0.000
Bappm17.667 ± 0.333
Total C%72.1 ± 0.073
Ca%1.820 ± 0.031
Cdppm0.150 ± 0.041
Ceppm1.000 ± 0.000
Coppm0.467 ± 0.033
Crppm11.000 ± 2.517
Cuppm16.200 ± 0.208
Fe%0.900 ± 0.015
K%2.060 ± 0.038
Lappm0.533 ± 0.033
Lippm0.433 ± 0.033
Total N%1.8 ± 0.014
Na%0.051 ± 0.002
Nbppm1.067 ± 0.033
Nippm4.333 ± 0.133
P%0.235 ± 0.002
Rbppm25.000 ± 0.404
Pbppm3.167 ± 0.067
Mg%0.120 ± 0.000
Mnppm131.667 ± 2.728
Moppm1.767 ± 0.033
Sbppm0.100 ± 0.000
Snppm1.467 ± 0.088
Srppm70.333 ± 1.453
Thppm0.133 ± 0.033
Tlppm<0.05
Wppm0.200 ± 0.000
Yppm0.333 ± 0.033
Znppm799.667 ± 35.751
Zrppm2.233 ± 0.393
Volatile matter%70.2 ± 0.89
Ash content%7.9 ± 0.12
pH7.6 ± 0.11
ECμS·cm−1532.3 ± 17.6
Bulk densityg·cm−30.141 ± 0.005

References

  1. FAO. FAOSTAT; Statistics Division, Food and Agriculture Organization of the United Nations: Rome, Italy, 2023. [Google Scholar]
  2. Illukpitiya, P.; Shanmugaratnam, N.; Kjosavik, D.J. Tea Agroecosystems in the Uva Highlands of Sri Lanka: An Evaluation of Land Management Activities. Mt. Res. Dev. 2004, 24, 52–59. [Google Scholar] [CrossRef]
  3. Li, J.; Zhou, Y.; Zhou, B.; Tang, H.; Chen, Y.; Qiao, X.; Tang, J. Habitat Management as a Safe and Effective Approach for Improving Yield and Quality of Tea (Camellia sinensis) Leaves. Sci. Rep. 2019, 9, 433. [Google Scholar] [CrossRef] [PubMed]
  4. Mahmood, H.; Hassan, M.S.; Meraj, G.; Furqan, M. Agriculture’s Role in Environmental Sustainability: A Comprehensive Review of Challenges and Solutions. Chall. Sustain. 2024, 12, 178–189. [Google Scholar] [CrossRef]
  5. Upendra, M.S.; Ghimire, R.; Pradhan, G.P. Nitrogen Fertilization I: Impact on Crop, Soil, and Environment. In Nitrogen Fixation; IntechOpen: London, UK, 2020; ISBN 9781789846485. [Google Scholar]
  6. Liang, L.; Ridoutt, B.G.; Wang, L.; Xie, B.; Li, M.; Li, Z. China’s Tea Industry: Net Greenhouse Gas Emissions and Mitigation Potential. Agriculture 2021, 11, 363. [Google Scholar] [CrossRef]
  7. Bera, R.; Datta, A.; Bose, S.; Barik, A.K.; Asthana, A.; Seal, A. Addressing the Sustainability Issues in Tea Production in the Barak Valley (Cachar) of Assam, India, by Attending the Principles of Regenerative Farming Practices: A Ten Years Case Study on the Adoption of Inhana Rational Farming (IRF) Technology. Asian J. Environ. Ecol. 2024, 23, 130–153. [Google Scholar] [CrossRef]
  8. Devi, P.I. Ecosystem Service-Based Approaches in Agricultural Policy Making. Indian J. Agric. Econ. 2024, 79, 94–126. [Google Scholar] [CrossRef]
  9. Singh, R.; Singh, G.S. Traditional Agriculture: A Climate-Smart Approach for Sustainable Food Production. Energy Ecol. Environ. 2017, 2, 296–316. [Google Scholar] [CrossRef]
  10. Chettri, V.; Ghosh, C. Tea Gardens, A Potential Carbon-Sink for Climate Change Mitigation. Curr. Agric. Res. J. 2024, 11, 695–704. [Google Scholar] [CrossRef]
  11. Ghosh, A.; Nag, A.; Acharyya, S.; Saha, S.; Majumder, S.; Chakraborty, S.; Bhattacharya, M. Tea Plantation Shade Tree Leaf Influences the Susceptibility of Rhizosphere Microbial Consortium: A Comprehensive Study on Their Leaf Extract Cross Tolerance. Eurasian J. Soil Sci. 2024, 13, 234–246. [Google Scholar] [CrossRef]
  12. Kamakaula, Y. Ethnoecological Perspectives on Agroforestry Practices for Climate Change Mitigation and Adaptation. West Sci. Interdiscip. Stud. 2024, 2, 737–742. [Google Scholar] [CrossRef]
  13. Zhang, W.; Yao, Z.; Zheng, X.; Liu, C.; Wang, R.; Wang, K.; Li, S.; Han, S.; Zuo, Q.; Shi, J. Effects of Fertilization and Stand Age on N2O and NO Emissions from Tea Plantations: A Site-Scale Study in a Subtropical Region Using a Modified Biogeochemical Model. Atmos. Chem. Phys. 2020, 20, 6903–6919. [Google Scholar] [CrossRef]
  14. Sultana, J.; Siddique, M.; Kamaruzzaman, M. Conventional to Ecological: Tea Plantation Soil Management in the Panchagarh District of Bangladesh. J. Sci. Technol. Environ. Inform. 2014, 1, 27–35. [Google Scholar] [CrossRef]
  15. Ye, J.; Wang, Y.; Kang, J.; Chen, Y.; Hong, L.; Li, M.; Jia, Y.; Wang, Y.; Jia, X.; Wu, Z.; et al. Effects of Long-Term Use of Organic Fertilizer with Different Dosages on Soil Improvement, Nitrogen Transformation, Tea Yield and Quality in Acidified Tea Plantations. Plants 2022, 12, 122. [Google Scholar] [CrossRef]
  16. Fu, H.; Song, D.; Wang, K.; Fang, F.; Han, S.; Yang, F.; Ding, S. Application of Wheat Straw Compost Mixed with Chemical Fertilizer Regulates Soil Bacterial Community Diversity in Tea (Camellia sinensis) Plantation. Diversity 2023, 15, 580. [Google Scholar] [CrossRef]
  17. Zhang, S.; Wang, Y.; Sun, L.; Qiu, C.; Ding, Y.; Gu, H.; Wang, L.; Wang, Z.; Ding, Z. Organic Mulching Positively Regulates the Soil Microbial Communities and Ecosystem Functions in Tea Plantation. BMC Microbiol. 2020, 20, 103. [Google Scholar] [CrossRef]
  18. Tennakoon, P.L.K.; Rajapaksha, R.M.C.P.; Hettiarachchi, L.S.K. Tea Yield Maintained in PGPR Inoculated Field Plants despite Significant Reduction in Fertilizer Application. Rhizosphere 2019, 10, 100146. [Google Scholar] [CrossRef]
  19. O’Laughlin, J.; McElligott, K. Biochar for Environmental Management: Science and Technology; Lehmann, J., Joseph, S., Eds.; Earthscan: London, UK; Sterling, VA, USA, 2009; ISBN 9781844076581. [Google Scholar]
  20. Hagemann, N.; Joseph, S.; Schmidt, H.-P.; Kammann, C.I.; Harter, J.; Borch, T.; Young, R.B.; Varga, K.; Taherymoosavi, S.; Elliott, K.W.; et al. Organic Coating on Biochar Explains Its Nutrient Retention and Stimulation of Soil Fertility. Nat. Commun. 2017, 8, 1089. [Google Scholar] [CrossRef]
  21. Hossain, M.Z.; Bahar, M.M.; Sarkar, B.; Donne, S.W.; Ok, Y.S.; Palansooriya, K.N.; Kirkham, M.B.; Chowdhury, S.; Bolan, N. Biochar and Its Importance on Nutrient Dynamics in Soil and Plant. Biochar 2020, 2, 379–420. [Google Scholar] [CrossRef]
  22. Harris, C. Effect of Biochar Application on Soil Microbial Communities in Degraded Lands in Australia. Int. J. Biol. 2024, 4, 1–12. [Google Scholar] [CrossRef]
  23. Karim, M.R.; Halim, M.A.; Gale, N.V.; Thomas, S.C. Biochar Effects on Soil Physiochemical Properties in Degraded Managed Ecosystems in Northeastern Bangladesh. Soil Syst. 2020, 4, 69. [Google Scholar] [CrossRef]
  24. Carvalho, M.L.; Tuzzin de Moraes, M.; Cerri, C.E.P.; Cherubin, M.R. Biochar Amendment Enhances Water Retention in a Tropical Sandy Soil. Agriculture 2020, 10, 62. [Google Scholar] [CrossRef]
  25. Zhao, Y.; Li, X.; Li, Y.; Bao, H.; Xing, J.; Zhu, Y.; Nan, J.; Xu, G. Biochar Acts as an Emerging Soil Amendment and Its Potential Ecological Risks: A Review. Energies 2022, 16, 410. [Google Scholar] [CrossRef]
  26. Li, Q.; Zhang, J.; Ye, J.; Liu, Y.; Lin, Y.; Yi, Z.; Wang, Y. Biochar Affects Organic Carbon Composition and Stability in Highly Acidic Tea Plantation Soil. J. Environ. Manag. 2024, 370, 122803. [Google Scholar] [CrossRef] [PubMed]
  27. Wu, Y.; Li, Y.; Wang, H.; Wang, Z.; Fu, X.; Shen, J.; Wang, Y.; Liu, X.; Meng, L.; Wu, J. Response of N2O Emissions to Biochar Amendment on a Tea Field Soil in Subtropical Central China: A Three-Year Field Experiment. Agric. Ecosyst. Environ. 2021, 318, 107473. [Google Scholar] [CrossRef]
  28. Ji, C.; Li, S.; Geng, Y.; Yuan, Y.; Zhi, J.; Yu, K.; Han, Z.; Wu, S.; Liu, S.; Zou, J. Decreased N2O and NO Emissions Associated with Stimulated Denitrification Following Biochar Amendment in Subtropical Tea Plantations. Geoderma 2020, 365, 114223. [Google Scholar] [CrossRef]
  29. Oo, A.Z.; Sudo, S.; Akiyama, H.; Win, K.T.; Shibata, A.; Yamamoto, A.; Sano, T.; Hirono, Y. Effect of Dolomite and Biochar Addition on N2O and CO2 Emissions from Acidic Tea Field Soil. PLoS ONE 2018, 13, e0192235. [Google Scholar] [CrossRef]
  30. Lin, S.; Zhang, S.; Shen, G.; Shaaban, M.; Ju, W.; Cui, Y.; Duan, C.; Fang, L. Effects of Inorganic and Organic Fertilizers on CO2 and CH4 Fluxes from Tea Plantation Soil. Elementa Sci. Anthr. 2021, 9, 90. [Google Scholar] [CrossRef]
  31. Criscuoli, I.; Ventura, M.; Sperotto, A.; Panzacchi, P.; Tonon, G. Effect of Woodchips Biochar on Sensitivity to Temperature of Soil Greenhouse Gases Emissions. Forests 2019, 10, 594. [Google Scholar] [CrossRef]
  32. Wang, H.; Yi, H.; Zhang, X.; Su, W.; Li, X.; Zhang, Y.; Gao, X. Biochar Mitigates Greenhouse Gas Emissions from an Acidic Tea Soil. Pol. J. Environ. Stud. 2020, 29, 323–330. [Google Scholar] [CrossRef]
  33. Yan, Z.; Tang, S.; He, Z.; Cheng, H.; Twagirayezu, G.; Zhao, J.; Xiang, R.; Hu, R.; Lin, S. Biochar Addition under Straw Return Reduces Carbon Dioxide and Nitrous Oxide Emissions in Acidic Tea Field Soil. J. Environ. Manag. 2024, 370, 122498. [Google Scholar] [CrossRef] [PubMed]
  34. Han, Z.; Xu, P.; Li, Z.; Guo, S.; Li, S.; Liu, S.; Wu, S.; Wang, J.; Zou, J. Divergent Effects of Biochar Amendment and Replacing Mineral Fertilizer with Manure on Soil Respiration in a Subtropical Tea Plantation. Biochar 2023, 5, 73. [Google Scholar] [CrossRef]
  35. Wang, T.; Stewart, C.E.; Sun, C.; Wang, Y.; Zheng, J. Effects of Biochar Addition on Evaporation in the Five Typical Loess Plateau Soils. Catena 2018, 162, 29–39. [Google Scholar] [CrossRef]
  36. Feng, W.; Wang, T.; Yang, F.; Cen, R.; Liao, H.; Qu, Z. Effects of Biochar on Soil Evaporation and Moisture Content and the Associated Mechanisms. Environ. Sci. Eur. 2023, 35, 66. [Google Scholar] [CrossRef]
  37. Li, Y.; Hu, S.; Chen, J.; Müller, K.; Li, Y.; Fu, W.; Lin, Z.; Wang, H. Effects of Biochar Application in Forest Ecosystems on Soil Properties and Greenhouse Gas Emissions: A Review. J. Soils Sediments 2018, 18, 546–563. [Google Scholar] [CrossRef]
  38. Rahman, M.A.; Moni, Z.R.; Rahman, M.A.; Nasreen, S. Investigation of Shade Tree Species Used in Tea Garden in Bangladesh. SAARC J. Agric. 2020, 18, 219–237. [Google Scholar] [CrossRef]
  39. Islam, M.M.R.; Afroz, H.; Khatun, R.; Islam, M.; Hoque, M. Phosphorus Fractionation in Acid Soil of Lakkatura Tea Garden, Sylhet, Bangladesh. J. Soil Nat. 2014, 7, 1–6. [Google Scholar]
  40. Cornelissen, G.; Pandit, N.R.; Taylor, P.; Pandit, B.H.; Sparrevik, M.; Schmidt, H.P. Emissions and Char Quality of Flame-Curtain “Kon Tiki” Kilns for Farmer-Scale Charcoal/Biochar Production. PLoS ONE 2016, 11, e0154617. [Google Scholar] [CrossRef]
  41. Gale, N.V.; Sackett, T.E.; Thomas, S.C. Thermal Treatment and Leaching of Biochar Alleviates Plant Growth Inhibition from Mobile Organic Compounds. PeerJ 2016, 4, e2385. [Google Scholar] [CrossRef] [PubMed]
  42. Heinemeyer, A.; Di Bene, C.; Lloyd, A.R.; Tortorella, D.; Baxter, R.; Huntley, B.; Gelsomino, A.; Ineson, P. Soil Respiration: Implications of the Plant-soil Continuum and Respiration Chamber Collar-insertion Depth on Measurement and Modelling of Soil CO2 Efflux Rates in Three Ecosystems. Eur. J. Soil Sci. 2011, 62, 82–94. [Google Scholar] [CrossRef]
  43. Birch, H.F. The Effect of Soil Drying on Humus Decomposition and Nitrogen Availability. Plant Soil 1958, 10, 9–31. [Google Scholar] [CrossRef]
  44. Halim, M.A. Forest Disturbances and Climate Feedbacks in a Mixedwood Boreal Forest; University of Toronto: Toronto, ON, Canada, 2020. [Google Scholar]
  45. Halim, M.A.; Bieser, J.M.H.; Thomas, S.C. Large, Sustained Soil CO2 Efflux but Rapid Recovery of CH4 Oxidation in Post-Harvest and Post-Fire Stands in a Mixedwood Boreal Forest. Sci. Total Environ. 2024, 930, 172666. [Google Scholar] [CrossRef]
  46. Hoffmann, M.; Schulz-Hanke, M.; Garcia Alba, J.; Jurisch, N.; Hagemann, U.; Sachs, T.; Sommer, M.; Augustin, J. A Simple Calculation Algorithm to Separate High-Resolution CH4 Flux Measurements into Ebullition- and Diffusion-Derived Components. Atmos. Meas. Tech. 2017, 10, 109–118. [Google Scholar] [CrossRef]
  47. Hoogsteen, M.J.J.; Lantinga, E.A.; Bakker, E.J.; Groot, J.C.J.; Tittonell, P.A. Estimating Soil Organic Carbon through Loss on Ignition: Effects of Ignition Conditions and Structural Water Loss: Refining the Loss on Ignition Method. Eur. J. Soil Sci. 2015, 66, 320–328. [Google Scholar] [CrossRef]
  48. Bremner, J.M. Nitrogen-Total. In Methods of Soil Analysis: Part 3 Chemical Methods, 5.3; Sparks, D., Page, A., Helmke, P., Loeppert, R., Soltanpour, P.N., Tabatabai, M.A., Johnston, C.T., Sumner, M.E., Eds.; SSSA Book Series; Wiley & Sons: Madison, WI, USA, 1996; pp. 1085–1121. ISBN 9780891188667. [Google Scholar]
  49. Bray, R.H.; Kurtz, L.T. Determination of Total, Organic, and Available Forms of Phosphorus in Soils. Soil Sci. 1945, 59, 39–46. [Google Scholar] [CrossRef]
  50. Pratt, P.F. Potassium. In Methods of Soil Analysis: Part 2 Chemical and Microbiological Properties, 9.2; Norman, A.G., Ed.; Agronomy Monographs; Wiley & Sons: Madison, WI, USA, 1965; pp. 1022–1030. ISBN 9780891182047. [Google Scholar]
  51. R Core Team. R: A Language and Environment for Statistical Computing; R Foundation for Statistical Computing: Vienna, Austria, 2025. [Google Scholar]
  52. Bates, D.; Mächler, M.; Bolker, B.; Walker, S. Fitting Linear Mixed-Effects Models Using Lme4. J. Stat. Softw. 2015, 67, 1–48. [Google Scholar] [CrossRef]
  53. Hothorn, T.; Bretz, F.; Westfall, P. Simultaneous Inference in General Parametric Models. Biom. J. 2008, 50, 346–363. [Google Scholar] [CrossRef]
  54. Wickham, H. ggplot2: Elegant Graphics for Data Analysis; Springer: New York, NY, USA, 2016; ISBN 9783319242774. [Google Scholar]
  55. Rosseel, Y. Lavaan: AnRPackage for Structural Equation Modeling. J. Stat. Softw. 2012, 48, 1–36. [Google Scholar] [CrossRef]
  56. Sackett, T.E.; Basiliko, N.; Noyce, G.L.; Winsborough, C.; Schurman, J.; Ikeda, C.; Thomas, S.C. Soil and Greenhouse Gas Responses to Biochar Additions in a Temperate Hardwood Forest. GCB Bioenergy 2015, 7, 1062–1074. [Google Scholar] [CrossRef]
  57. Grau-Andrés, R.; Pingree, M.R.A.; Öquist, M.G.; Wardle, D.A.; Nilsson, M.-C.; Gundale, M.J. Biochar Increases Tree Biomass in a Managed Boreal Forest, but Does Not Alter N2O, CH4, and CO2 Emissions. GCB Bioenergy 2021, 13, 1329–1342. [Google Scholar] [CrossRef]
  58. Sarauer, J.L.; Page-Dumroese, D.S.; Coleman, M.D. Soil Greenhouse Gas, Carbon Content, and Tree Growth Response to Biochar Amendment in Western United States Forests. GCB Bioenergy 2019, 11, 660–671. [Google Scholar] [CrossRef]
  59. Castro, M.S.; Steudler, P.A.; Melillo, J.M.; Aber, J.D.; Bowden, R.D. Factors Controlling Atmospheric Methane Consumption by Temperate Forest Soils. Glob. Biogeochem. Cycles 1995, 9, 1–10. [Google Scholar] [CrossRef]
  60. Muhammad, D.; Ngatijo, N.; Prabasari, I.G.; Mardhotillah, B. The Effects of Biochar Incorporation on the CO2, N2O, and CH4 Emissions from the Soils of Stallholder Palm Oil Plantations, Jambi Province Indonesia. J. Appl. Agric. Sci. Technol. 2023, 7, 300–313. [Google Scholar] [CrossRef]
  61. Thomas, S.C.; Ruan, R.; Gale, N.V.; Gezahegn, S. Phytotoxicity and Hormesis in Common Mobile Organic Compounds in Leachates of Wood-Derived Biochars. Biochar 2024, 6, 51. [Google Scholar] [CrossRef]
  62. Genesio, L.; Miglietta, F.; Lugato, E.; Baronti, S.; Pieri, M.; Vaccari, F.P. Surface Albedo Following Biochar Application in Durum Wheat. Environ. Res. Lett. 2012, 7, 014025. [Google Scholar] [CrossRef]
  63. Kaur, N.; Kieffer, C.; Ren, W.; Hui, D. How much is soil nitrous oxide emission reduced with biochar application? An evaluation of meta-analyses. Glob. Change Biol. Bioenergy 2023, 15, 24–37. [Google Scholar] [CrossRef]
  64. Stavi, I.; Lal, R. Agroforestry and Biochar to Offset Climate Change: A Review. Agron. Sustain. Dev. 2013, 33, 81–96. [Google Scholar] [CrossRef]
  65. Thomas, S.C.; Halim, M.A.; Gale, N.V.; Sujeeun, L. Biochar Enhancement of Facilitation Effects in Agroforestry: Early Growth and Physiological Responses in a Maize-Leucaena Model System. Agrofor. Syst. 2018, 93, 2213–2225. [Google Scholar] [CrossRef]
Figure 1. Location of Lakkatura Tea Garden (Sylhet, northeastern Bangladesh) and layout of the two experimental land-use systems. Monoculture tea plots (Camellia sinensis) and tea-based agroforestry plots (tea interplanted with Albizia odoratissima and Melia azedarach) that each received 7.5 t·ha−1 biochar are delineated.
Soilsystems 10 00021 g001
Figure 2. Effect of biochar addition (7.5 t·ha−1) on soil GHG fluxes in a tea garden ecosystem. Bars show treatment means ± SE calculated from 30 collar measurements per treatment (5 collars × 3 plots × two campaigns) for (a) water vapour and (b) CO2 fluxes expressed in µmol·m−2·s−1, and (c) CH4 flux expressed in nmol·m−2·s−1. Positive values indicate net emission; negative values indicate net uptake. Columns sharing the same lowercase letter do not differ significantly (Tukey HSD, α = 0.05).
Soilsystems 10 00021 g002
Figure 3. Interactive effect of biochar and shade-tree overstory on soil–atmosphere gas exchange. Bars show means ± SE for (a) H2O vapour and (b) CO2 fluxes (µmol·m−2·s−1) and (c) CH4 flux (nmol·m−2·s−1) in tea monoculture (brown) and tea + shade-tree agroforestry (teal) plots receiving either 0 t·ha−1 (control) or 7.5 t·ha−1 (biochar) amendments. Each mean is based on 30 collar measurements per treatment combination (five collars × three plots × two campaigns). Positive values denote net emission; negative values denote net uptake. Columns that share a lowercase letter do not differ significantly (mixed-effects model followed by Tukey HSD, α = 0.05).
Soilsystems 10 00021 g003
Figure 4. Bivariate relationships between methane uptake and co-emitted gases. (a) Relation between CH4 flux (nmol·m−2·s−1) and water-vapour flux (µmol·m−2·s−1); and (b) relation between CH4 and CO2 flux (µmol·m−2·s−1). Grey symbols = control; green symbols = biochar (7.5 t·ha−1). Each point is the mean of the three consecutive fluxes from a single collar (n = 60 per panel; average across campaigns per collar). The solid red line is the ordinary least-squares regression fitted to the pooled data; the shaded band is the 95% confidence envelope. Regression statistics (R2, p) refer to this overall fit. Negative CH4 values denote net soil uptake.
Soilsystems 10 00021 g004
Figure 5. Bivariate relations between soil properties and gas fluxes in biochar-amended (green) and control (purple) tea plots. Columns show, from left to right, soil pH, bulk density (g·cm−3), gravimetric moisture (%), organic-matter content (%), total nitrogen (%), exchangeable potassium (meq·100 g−1), Bray-1 phosphorus (μg·g−1), and soil temperature (°C). Rows give (ah) CH4 flux (nmol·m−2·s−1; negative values = net uptake), (ip) CO2 flux (µmol·m−2·s−1), and (qx) H2O-vapour flux (µmol·m−2·s−1). Each symbol is the collar-level mean of three consecutive flux values (n = 60; average across campaigns per collar). Ordinary least-squares regressions were fitted to the pooled data; solid black lines indicate significant relationships (p < 0.05), and dashed lines denote non-significant trends. Shaded bands are 95% confidence envelopes, and inset boxes report model R2 and two-tailed p values for each panel.
Soilsystems 10 00021 g005
Figure 6. Covariance-based structural-equation model of controls on soil GHG exchange. Rectangles represent measured variables: biochar treatment, shade-tree presence, and eight soil properties (pH, bulk density, gravimetric moisture, organic matter, total N, exchangeable K, Bray-1 P, and soil temperature) are exogenous predictors; CH4, CO2, and H2O-vapour fluxes are endogenous responses. Solid lines depict direct effects retained in the final model (standardized path coefficients printed alongside the arrows), whereas dashed lines indicate significant covariances between predictors. Blue arrows denote positive effects, and red arrows denote negative effects; only paths with p ≤ 0.10 are shown. The model was based on 60 collar-level observations and provided an acceptable fit (χ2 = 0.28, p = 0.60; CFI = 1.0; RMSEA < 0.001; and SRMR = 0.004).
Soilsystems 10 00021 g006
Disclaimer/Publisher’s Note: The statements, opinions and data contained in all publications are solely those of the individual author(s) and contributor(s) and not of MDPI and/or the editor(s). MDPI and/or the editor(s) disclaim responsibility for any injury to people or property resulting from any ideas, methods, instructions or products referred to in the content.