Abstract
We argue for a continuous (dynamical) kinetic freeze-out of observed at midrapidity in collisions of Au(1.23 A GeV) + Au. The simulations, by means of a transport model of Boltzmann-Ühling-Uhlenbeck (BUU) type, point to time independent transverse momentum slope parameters after 20 fm/c. The complex interplay of expansion dynamics and strangeness production/exchange/absorption as well as elastic scatterings involved in the reaction network does not support the previous interpretation of a late freeze-out of due to larger cross sections.
1. Introduction
The KaoS (Kaon Spectrometer) Collaboration [1] parameterized the transverse momentum spectra of , measured in collisions of Au(1.5 A GeV) + Au at midrapidity, by means of Jüttner type phase space distributions. Ignoring the flow, the distributions become Boltzmann-like, depending essentially on a slope parameter which is often called the “kinetic freeze-out temperature”, T. The experimental fact of has been interpreted in [1] as evidence for an expanding and cooling fireball with antikaons () decoupling at a later, thus cooler, stage due to their significantly larger cross section. The kaons () decouple at an earlier, thus hotter, stage.
An alternative interpretation has been put forward by the HADES (High Acceptance Di-Electron Spectrometer) Collaboration [2] for the reaction Au(1.23 A GeV) + Au: and can decouple under the same circumstances, i.e., at the same fireball temperature, thus at kinetic decoupling where the elastic interactions cease. However, the unexpectedly large yield of changes the late spectra due to the decays . Since the multiplicities hold , the impact of decays on is minor. As observed in simulations [3], is approximately for distributions with prior to decays. As a result of the contribution of from decays, the observed final slope parameters in fact obey . In order to cope with the experimental results, a sufficiently large yield of is a prerequisite for such an interpretation [2]. (For an early assessment of relating and yields, see [4], and for the first data-based quantitative analysis of feed-down, cf. [5]. For a comprehensive survey on strangeness production in near-threshold heavy-ion and proton-nucleus collisions, cf. [6], and for new simulation tools, see [7,8,9,10].)
Inspired by the controversy of the KaoS and HADES interpretations, we performed kinetic theory simulations of the collisions Au(1.23 A GeV) + Au and studied the time evolution of the slope parameters . Our findings can be summarized as follows: . (It should be stressed that the slope parameters refer to transverse momentum spectra at midrapidity of all respective hadron species and ; they are not related to a local or global fireball temperatures steered overwhelmingly by nucleons and their excitations). We interpret such a behavior as dynamic freeze-out. The energy dependence of the various inelastic and elastic cross sections combined with the proper dilution upon expansion of the fireball give rise to the conspiracy of . There is neither the need nor the possibility to define in an unambiguous manner the freeze-out temperature at a certain instant of time within such a kinetic theory approach.
The dynamical freeze-out phenomenon has been familiar for some time for its role in primordial nucleosynthesis in the early universe, where it refers to the abundances of light isotopes. As a result of the energy dependence of cross sections, which translate into a temperature dependence of reaction rates, combined with the temporal temperature dependence due to cosmic expansion, the isotopic abundances stay constant after about a thousand seconds world age: . While the starting values are determined by statistical nuclear equilibrium [11], the final values are non-Markovian, i.e., they depend on intermediate stages, and are very specific for cross sections (and some other parameters of the system). In particular, the multitude of final (late) abundances cannot be related to chemical equilibrium values at a certain common temperature.
A prototypical freeze-out model is provided in paragraph 5.2 in [11], see Figure 5.1 therein. On the basis of the momentum-integrated Boltzmann equation, the normalized abundance of a massive-particle species is seen to follow for some time the fiducial equilibrium abundance but levels off at certain point and stays constant afterwards, never reaching the ever-dropping equilibrium value. The leveling off is determined by a combination of the expansion (cooling) rate and the reaction rate based on a thermally averaged cross section. That is, at and after freeze-out, the expansion rate exceeds the reaction rate.
From such a perspective, it is astonishing that the various hadron abundances in heavy-ion collisions can be described by chemical equilibrium values at a common (albeit beam-energy dependent) temperature modulo a normalization volume. At LHC (Large Hadron Collider) energies, no other parameters are needed to uncover the hadron and isotopic (including antinuclei) yields over nine orders of magnitudes [12]; at lower beam energies, the baryo-chemical potential becomes important, which is also beam-energy dependent, to describe a multitude of hadron yields, cf. [13,14] for examples.
Besides the chemical freeze-out, related to abundances, the kinetic freeze-out, related to the momentum distributions of hadrons, is also of interest as a signature of the “hadronic life”, e.g., after the hadronization of deconfined strong-interaction matter at LHC energies. This freeze-out dynamics may be flavor dependent and may be different for ground state hadrons and short-living resonances [15]. In the fragmentation region, large net-baryon densities are expected in ultrarelativistic heavy-ion collisions [16]—quite similar to conditions achieved in relativistic heavy-ions. Using rare (i.e., strange and charm) probes of strongly compressed baryon matter is a central part of the research program of the CBM collaboration [17,18]. These facets of ultrarelativistic heavy-ion collisions in turn are linked to medium-energy (relativistic) heavy-ion collisions, where one gains complementary important information on hadronic many-body dynamics.
After this digression on freeze-out phenomena, let us return to the primary goal of our study—the time evolution of slope parameters in a kinetic theory simulation of Boltzmann-Ühling-Uhlenbeck (BUU) type for the reaction Au(1.23 A GeV) + Au. The BUU model is briefly described in Section 2, and its numerical results are presented in Section 3. Since we employ a code version which has been successfully utilized in [19] for the reaction Ar(1.75 A GeV) + KCl, we present analog results of the time evolution of in Appendix A for comparison. Section 4 summarizes the paper.
2. BUU Code
Here, we employ the same BUU code as utilized in [19] for collisions Ar(1.75 A GeV) + KCl. Only the beam energy, system size, proton-to-neutron ratio, and impact parameter range are adapted; all other parameters are frozen, see Table 1. (In [6], you can find an extended discussion on scalar and vector contributions to the effective in-medium masses (cf. Equation (60) for the implementation in IQMD (Isospin-dependent Quantum Molecular Dynamics), or Equations (20) and (21) for the derivation from a chiral Lagrangian) and the related issue of spectral functions (cf., e.g., [20,21]). In this respect, the often used parameterization is rather schematic). The code was compared in [22] with other transport codes and some peculiarities have been identified. Nevertheless, as shown in [19], the BUU code copes successfully with the data from [23]. The decisive difference of the reactions Au(1.23 A GeV) + Au and Ar(1.75 A GeV) + KCl are the significantly lower beam energy and the significantly larger system size of the former. This leads us to expect a larger sensitivity to many-body effects, in particular in-medium effects, since the reactions with strange mesons are deeper below the respective thresholds. Figure 1, left panel, exhibits a survey on the thresholds and experiments performed up to now in the threshold region.

Table 1.
Several input parameters for the simulations of collisions of Au + Au and Ar + KCl.
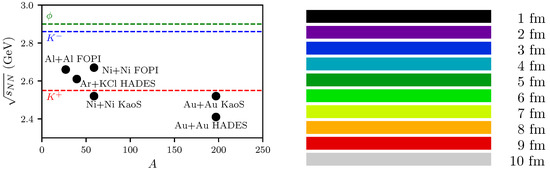
Figure 1.
Left panel: Overview of the center-of-mass energies for various experiments [1,2,23,24,25] (bullets) and the free threshold energies of and mesons (dashed lines). Right panel: Color code used for the various impact parameters.
3. Numerical Results for Au(1.23 A GeV) + Au
3.1. Impact Parameter Dependence
It happened that transverse momenta spectra and rapidity distributions of the Ar(1.75 A GeV) + KCl data [23] could be described very well by the impact parameter fm, see Appendix A. Following such a strategy for Au(1.23 A GeV) + Au, we see that an optimum description of the data [2] for the centrality class 0–40% is accomplished by fm for and fm for , see Figure 2, Figure 3 and Figure 4. As a compromise, we henceforth use fm to avoid subtleties of certain impact parameter averaging procedures according to weighting . In fact, Table II in [26] attributes the 0–40% centrality class to the impact parameter interval b = 0–9.3 fm with a mean of 6.2 fm. The upper panel in Figure 8 of [26] indicates that an impact parameter range 7–11 fm centered at 9 fm corresponds to the centrality class 30–40%. (Table II in [26] quotes a mean impact parameter of 8.71 fm for that centrality class). Therefore, the selection of one “representative impact parameter” must be considered with caution. To get some feeling on the impact parameter dependence, we exhibit in the following, the sequence of b = 1–10 fm in steps of 1 fm with the color code displayed in the right panel of Figure 1.
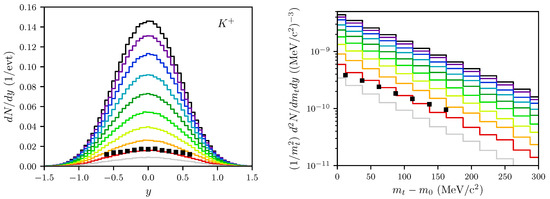
Figure 2.
Left panel: Rapidity spectra of mesons in the center-of-mass system for impact parameters fm (top to bottom). Right panel: Transverse mass spectra within the rapidity interval for the same impact parameter range as in the left panel. The black symbols represent the experimental data from [2] (centrality 20–40%). The color code for the impact parameters is depicted in the right panel of Figure 1.
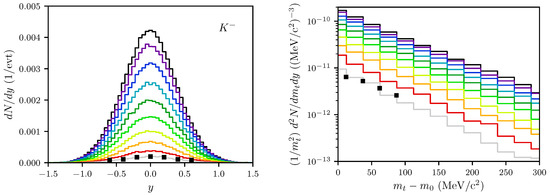
Figure 3.
The same as Figure 2, but for mesons.
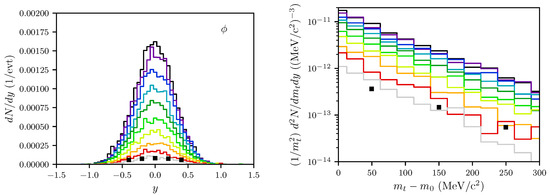
Figure 4.
The same as Figure 2, but for mesons.
The transverse momentum spectra unravel some deficits of our model: are somewhat too low (note that the first data point is at the lower edge of the histogram, while the last data point is at the upper edge of the histogram in Figure 2 and Figure 3), and is much too low as evidenced by the much flatter distribution in Figure 4). These facts are quantified by the slope parameters, see Figure 5 below. For , these deficits cannot be cured by some impact parameter averaging since we fail to meet the experimental values of for all values of b. On the other hand, [2] quotes slope parameters of about 91 MeV (, centrality class 30–40%) and MeV (, centrality class 20–40%), which are not too small in comparison with our results, as quantified in Figure 5 below. As in the experiment in [2], we define the slope parameters by
at midrapidity in the rapidity interval . In addition, a normalization factor C is attributed separately to each species. The transverse mass is defined by with rest masses of the considered species. Henceforth, we denote which is again specific for each species.
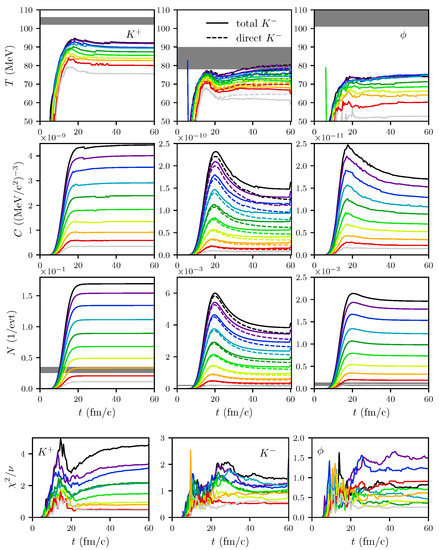
Figure 5.
Top figure: Slope parameter T parameterizing the transverse momentum spectra (top row), normalization C (middle row), and multiplicity N (bottom row) of (left column), (middle column) and mesons (right column) as functions of time for impact parameters fm. The experimental data [2] for the centrality class 0–40% are represented as gray bars. “Total ” means inclusion of from decays, while “direct ” is without that contribution. Bottom figure: Corresponding reduced values to the fit parameters T and C.
3.2. Nucleon Density Evolution
We refrain here completely from determining any local temperature. Instead, to visualize the time evolution of the system by the nucleon density in the reaction plane, we exhibit in Figure 6 several snapshots for the representative impact parameter fm. The maximum nucleon density is about (or for fm) at fm/c in the central cell of volume 1 fm3. The high-density stage with is for fm/c, see Figure 7.
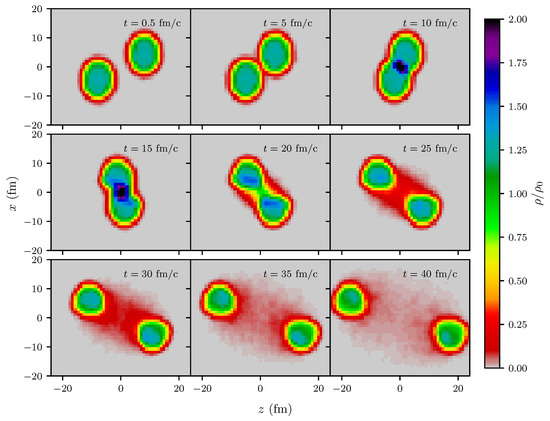
Figure 6.
Snapshots of the projection of the normalized nucleon density in the reaction plane for the collision Au(1.23 A GeV) + Au for the impact parameter fm at times depicted in the legends.
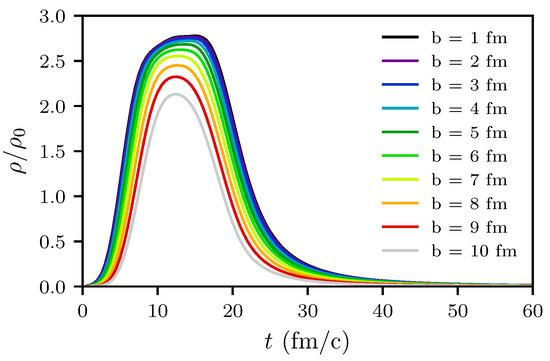
Figure 7.
Normalized nucleon density in the central cell of volume as a function of time for the impact parameters fm.
3.3. Time Evolution of Rates
Production rates of as well as as a function of time (left panel) are displayed in Figure 8. The analog elastic collision rates of with nucleons and the absorption rates are exhibited in Figure 9. Concerning the production rates, one sees some delay of relative to . For brevity, denotes all . Focusing still on the evolution, one cannot see a later decoupling of ; instead, the last elastic interactions of seem to go on for a somewhat longer time, see Figure 10. These investigations are aimed at elucidating whether there is a clear time ordering of production and freeze-out of and .
Figure 8.
Normalized production rates of and mesons as well as and hyperons as functions of time (left) and local nucleon density (right) for fm. The normalization was performed over the respective total multiplicities of productions up to final run time of 60 fm/c.
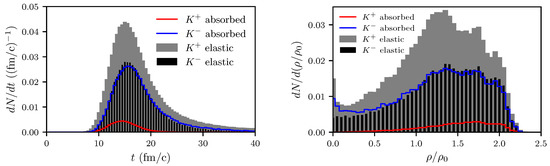
Figure 9.
Normalized collision rates of mesons with nuclear matter as functions of time (left) and local nucleon density (right) for fm. Normalization as in Figure 8.
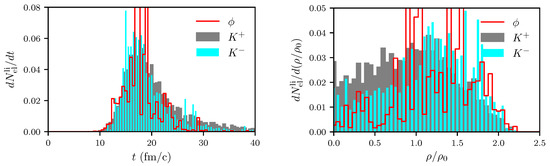
Figure 10.
Normalized rates of last elastic interactions of and mesons with nuclear matter as functions of time (left) and local nuclear density (right) for fm. Normalization as in Figure 8.
Since the in-medium masses of are strikingly different (see Table 1), it has been argued that production/rescattering/absorption/last elastic interaction probe different densities. In fact, production happens at somewhat larger densities (see right panel of Figure 8); nevertheless, the production rates peak at about . Elastic rescatterings peak at () and (), respectively, while the absorptions acquire maxima at () and (), see right panel in Figure 9. The maximum of last interaction rates is at (), though with more last interactions of at lower densities, , see right panel in Figure 10. This seems to be in contrast to the above-mentioned time and density ordering of and collisions.
3.4. Time Evolution of
The time evolution of the parameters and defined in Equation (1) is exhibited in Figure 5 together with the multiplicities. The most striking point is for fm/c and all impact parameters; even increases slightly after 20 fm/c for the most central collisions. This invalidates the expectation that the slope parameter T can be related to a local medium temperature. Rather, the interaction rates (see Figure 9 and Figure 10) drop to zero at fm/c, meaning the dynamic freeze-out in the same spirit as in big-bang nucleosynthesis. Prior to 40 fm/c, but after 20 fm/c, the intricate network of production, absorption, and elastic reactions on top of the overall expansion (see Figure 6 and Figure 7) result in .
A completely different picture emerges when considering the parameters in the central cell: after 15 fm/c () or 17 fm/c (), the values of rapidly drop and become MeV for fm/c, see Figure 11. Of course, such a correlation of momentum space and position space is experimentally hardly accessible. We emphasize in this context the importance of cross sections. For instance, scaling up the total cross section by a factor of ten increases the maximum of by 15 MeV; switching off the absorption channels lets the maximum of further increase towards 100 MeV, see Figure 12. Switching off the absorption for our standard setting of cross sections (see Appendix A in [27]) also increases the maximum of by about 15 MeV.
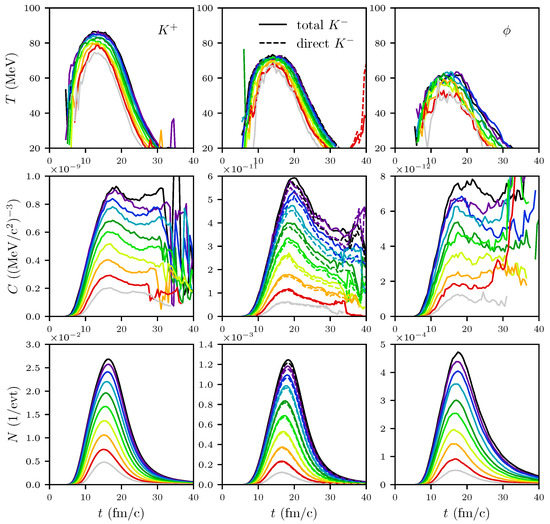
Figure 11.
The same as Figure 5, but for mesons within the central cell of volume . Top figure: Slope parameter T parameterizing the transverse momentum spectra (top row), normalization C (middle row), and multiplicity N (bottom row) of (left column), (middle column) and mesons (right column) as functions of time for impact parameters fm. “Total ” means inclusion of from decays, while “direct ” is without that contribution.
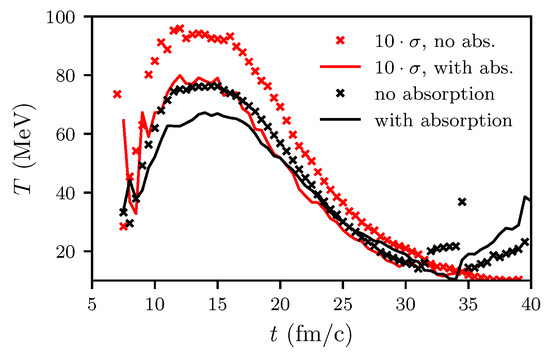
Figure 12.
Influence of absorption as well as up-scaling of the total cross section by a factor of 10 on the time dependence of the slope parameter, . For fm, central cell.
A quantity, which can serve as a proxy of the temperature in a local off-equilibrium situation, is the mean kinetic energy. We define in the center-of-mass system. The effective in-medium mass is defined by with values of listed in Table 1. Interestingly, we observe at fm/c, see Figure 13—left panel. The pronounced dropping of at fm/c can be attributed to the change in the effective in-medium mass with dropping nucleon density. In fact, by switching off the effective in-medium masses, i.e., , the dropping of ceases, see the dashed green curve in right panel of Figure 13. Since the in-medium modifications of and are minor, there is no noticeable impact on vs. t. The solid green curves in Figure 13 include the from decays. The “cooling” of the spectrum is due to the above-mentioned fact that the mean kinetic energies of decay- are less than the mean kinetic energies of in a medium with a temperature scale MeV.
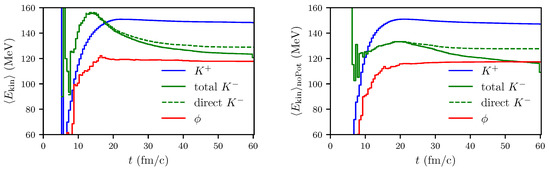
Figure 13.
Mean kinetic energy with (left) and without potential (right) of and mesons as functions of time for fm.
4. Discussion and Summary
Contrary to the interpretations [1,2] of in relativistic heavy-ion collisions at subthreshold beam energy, the use of a BUU transport simulation points to a more complex picture. Figure 5 suggests that from the very beginning of the fireball expansion, the relation is established and does not change in the subsequent evolution. That is, the complicated interplay of various reaction channels involved in strangeness production, exchange, and absorption up to elastic scatterings cause flatter transverse momentum spectra at midrapidity. We emphasize that the slope parameters are used to parameterize these transverse momentum spectra. Enforcing a correlation to position space, e.g., by considering only mesons in the central cell, substantially changes the behavior of . Instead of staying approximately constant (as for all mesons in the fireball), it rapidly drops after achieving a maximum. The picture becomes more obscured by analyzing the mean kinetic energies of . The coupling of the effective in-medium mass to the nucleon density causes a significant reduction in the kinetic energy below the kinetic energy, while without in-medium effects, the kinetic energy is below the kinetic energy, both being roughly constant in time.
Irrespectively of the temporal aspects, we also tried to check the hypothesis that at the production instant, the have lower kinetic energies due to peculiarities of the production channels. However, subsequent absorption and scattering/transfer reactions make such a hypothesis unconvincing.
Our interpretation is hampered in some details since we fail to accurately reproduce the multiplicity and the slope parameters in the analyzed reaction Au(1.23 A GeV) + Au. The same code, however, describes well the available data of the reaction Ar(1.756 A GeV) + KCl (see Appendix A). It happens that the weights of various channels are fairly different, see the panels in Figure 14 (the channel is special according to [28] (Figure 2): it increases towards small energies in the entrance channel. As a consequence, the relative weight of this channel is larger at smaller beam energies. Analogous, at small energies in the entrance channel, the cross sections obey , according to [28], while at larger entrance energies dominates. These trends manifest themselves in the smaller contribution of the channel at the lower beam energy. Furthermore, the decays of heavy baryon resonances with a in the exit channel (cf. [10,29]) are not included).
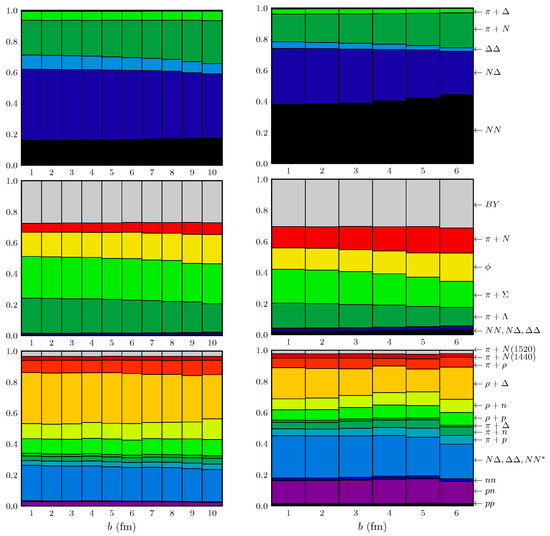
Figure 14.
Relative contributions of various production channels to (upper row), (middle row), and multiplicity (lower row) at final run time fm/c for various impact parameters for collisions Au(1.23 A GeV) + Au (left) and Ar(1.756 A GeV) + KCl (right). See Appendix A of [27] for details of the reaction channels and cross sections.
This means that one needs to investigate different system sizes and different beam energies for benchmarking both the many microscopic input data and their processing in simulation codes by a limited number of observables. The herein presented results can serve as a useful reference of analyses of strangeness dynamics of the planned experiments of CBM (Compressed Baryonic Matter).
In summary, we put forward arguments in favor of a dynamical (i.e., continuous) kinetic freeze-out of strangeness carrying mesons in subthreshold heavy-ion collisions. The in-depth exploration of strangeness dynamics in near-threshold heavy-ion collisions at SIS18 (SchwerIonenSynchrotron) is a valuable prerequisite to the investigation of multi-strange hadron phenomena at higher beam energies, e.g., at SIS100, NICA (Nuclotron-based Ion Collider fAcility), JPARC (Japan Proton Accelerator Research Complex), etc. The insights gained in the strangeness sector pave the way for future analog studies of charm degrees of freedom as probes of compressed baryon matter.
Author Contributions
Conceptualization, B.K.; methodology, B.K.; software, B.R.; validation, B.R.; formal analysis, B.R.; investigation, B.R.; data curation, B.R.; writing—original draft preparation, B.K.; writing—review and editing, B.K. and B.R.; visualization, B.R.; supervision, B.K.
Funding
This research received no external funding.
Acknowledgments
The authors gratefully acknowledge the collaboration with and within HADES and CBM, in particular with R. Kotte, J. Stroth, T. Galatyuk, and M. Lorenz.
Conflicts of Interest
The authors declare no conflict of interest.
Appendix A. Ar(1.756 A GeV) + KCl
To enable an easy one-to-one comparison of the results presented in section III, we recollect some analog results for collisions Ar(1.756 A GeV) + KCl in Figure A1, Figure A2, Figure A3, Figure A4, Figure A5, Figure A6, Figure A7, Figure A8, Figure A9, Figure A10, Figure A11. Further details can be found in [19].
Instead of scanning through impact parameters, as done in Figure 2, Figure 3 and Figure 4, we compare in Figure A1 and Figure A2 the rapidity and transverse momentum spectra with data for one optimized impact parameter, fm. The latter value corresponds to the mean impact parameter enforced by the trigger setting LVL1 in the experiment [23]. Note that the LVL1 trigger condition enforces a mean impact parameter fm, cf. [19]. In general, the weighting attributes a higher representativity to larger impact parameters. Moreover, one could argue on a scaling which can be disturbed by the centrality class selection in Au(1.23 A GeV) + Au vs. LVL1 selection in Ar(1.756 A GeV) + KCl (here we use the estimate for and yielding the radii 7 fm and 4.1 fm). We emphasize the quite accurate agreement of data and simulations for . The slope parameter is acceptable (see the right panel in Figure A3), but the yield, to be extracted from the rapidity distribution (the left panel in Figure A3), is only marginally consistent with the data.

Figure A1.
Left panel: Rapidity spectrum of mesons in the center-of-mass system for impact parameter fm. Right panel: Transverse mass spectra for fm for the six rapidity intervals to (bottom to top) with respective scaling factors to . The black symbols represent the corresponding experimental data from [23] under the LVL1 trigger setting.

Figure A2.
The same as Figure A1, but for mesons.

Figure A3.
Left panel: The same as Figure A1, left panel, but for mesons. Right panel: Transverse mass spectrum for fm for the rapidity interval and corresponding experimental data from [23] as black symbols.
The high-density stage is much shorter for Ar(1.756 A GeV) + KCl (see Figure A4 and Figure A5) than for Au(1.23 A GeV) + Au (see Figure 6 and Figure 7). Correspondingly, the various rates of production/absorption/elastic scattering/last elastic scattering of , are concentrated in shorter time intervals, see the left panels of Figure A6, Figure A7, Figure A8 and compare them with Figure 8, Figure 9 and Figure 10. The same rates, however, as a function of local density, look very similar for the production channels (compare the right panels of Figure A6 with Figure 8), while the elastic and absorption rates of peak at somewhat higher local densities, with the exception of absorption (compare the right panels in Figure A7 with Figure 9). The last elastic scatterings are fairly smoothly distributed over all densities (see the right panel in Figure A8), while for Au(1.23 A GeV) + Au, an apparent peaking at occurs (see the right panel in Figure 10). Such considerations have the motivation to elucidate whether the strangeness-carrying probes are specific for certain density ranges.

Figure A4.
The same as Figure 6, but for Ar(1.756 A GeV) + KCl and for the impact parameter fm.

Figure A5.
The same as Figure 7, but for Ar(1.756 A GeV) + KCl and for the impact parameters fm.

Figure A6.
The same as Figure 8, but for Ar(1.756 A GeV) + KCl and for fm.

Figure A7.
The same as Figure 9, but for Ar(1.756 A GeV) + KCl and for fm.

Figure A8.
The same as Figure 10, but for Ar(1.756 A GeV) + KCl and for fm. Note our restriction to the last elastic interaction. In contrast, Figure 10 in [19] is based on a counting scheme of all last interactions. As a result of the partially perturbative treatment [19] of absorption in dilute nuclear matter, the apparently late interaction is overestimated.
The patterns of the time dependence of slope parameters and normalizations of Ar(1.756 A GeV)+ KCl look very similar to the case of Au(1.23 A GeV) + Au, where the experimental values of the former are nicely reproduced, see Figure A9 and compare it with Figure 5. An analog statement holds for the slope parameters and normalizations in the central cell—again within shorter time intervals for Ar(1.756 A GeV) + KCl (see Figure A9 and compare it with Figure 11).

Figure A9.
The same as Figure 5, but for Ar(1.756 A GeV) + KCl and for impact parameters fm. Top figure: Slope parameter T parameterizing the transverse momentum spectra (top row), normalization C (middle row), and multiplicity N (bottom row) of (left column), (middle column) and mesons (right column) as functions of time for impact parameters fm. The experimental data [23] are represented as gray bars. “Total ” means inclusion of from decays, while “direct ” is without that contribution. Bottom figure: Corresponding reduced values to the fit parameters T and C.
Comparing the time evolution of the mean kinetic energies of with and without potentials, one observes analog patterns in both collision systems, see Figure 13 and Figure A11. However, the local maximum for and the onset of the flat sections for and are achieved earlier for Ar(1.756 A GeV) + KCl, and the different beam energies reflect themselves in higher values. The sharp drops in the mean kinetic momentum (green curves) at fm/c are due to the component from decay added at the end of the simulation run time. This is the “cooling of the spectra” by decay [2].

Figure A10.
The same as Figure 11, but for Ar(1.756 A GeV) + KCl and for impact parameters fm. Top figure: Slope parameter T parameterizing the transverse momentum spectra (top row), normalization C (middle row), and multiplicity N (bottom row) of (left column), (middle column) and mesons (right column) as functions of time for impact parameters fm. “Total ” means inclusion of from decays, while “direct ” is without that contribution.

Figure A11.
The same as Figure 13, but for Ar(1.756 A GeV) + KCl and for fm.
References
- Foerster, A.; Uhlig, F.; Boettcher, I.; Debowski, M.; Dohrmann, F.; Grosse, E.; Koczon, P.; Kohlmeyer, B.; Laue, F.; Menzel, M.; et al. First evidence for different freezeout conditions for kaons and anti-kaons observed in heavy ion collisions. Phys. Rev. Lett. 2003, 91, 152301. [Google Scholar] [CrossRef] [PubMed]
- Adamczewski-Musch, J.; Arnold, O.; Behnke, C.; Belounnas, A.; Belyaev, A.; Berger-Chen, J.C.; Biernat, J.; Blanco, A.; Blume, C.; Böhmer, M.; et al. Deep sub-threshold ϕ production in Au+Au collisions. Phys. Lett. B 2018, 778, 403. [Google Scholar] [CrossRef]
- Kotte, R.; Kämpfer, B. Acceptance and Count Rate Estimates for Experiments on Sub-Threshold phi Meson Production in Central Collisions of C + C at 2 a GeV; FZR-339; Forschungszentrum Rossendorj (FZR): Dresden, Germany, 14 January 2002. [Google Scholar]
- Kampfer, B.; Kotte, R.; Hartnack, C.; Aichelin, J. Phi puzzle in heavy ion collisions at 2/A-GeV: How many K- from phi decays? J. Phys. G 2002, 28, 2035. [Google Scholar]
- Lorenz, M. Investigating dense nuclear matter with rare hadronic probes. PoS BORMIO 2010, 2010, 038. [Google Scholar]
- Hartnack, C.; Oeschler, H.; Leifels, Y.; Bratkovskaya, E.L.; Aichelin, J. Strangeness Production close to Threshold in Proton-Nucleus and Heavy-Ion Collisions. Phys. Rep. 2012, 510, 119. [Google Scholar] [CrossRef]
- Steinberg, V.; Staudenmaier, J.; Oliinychenko, D.; Li, F.; Erkiner, Ö.; Elfner, H. Strangeness production via resonances in heavy-ion collisions at energies available at the GSI Schwerionensynchrotron. Phys. Rev. C 2019, 99, 064908. [Google Scholar] [CrossRef]
- Weil, J.; Steinberg, V.; Staudenmaier, J.; Pang, L.G.; Oliinychenko, D.; Mohs, J.; Kretz, M.; Kehrenberg, T.; Goldschmidt, A.; Bäuchle, B.; et al. Particle production and equilibrium properties within a new hadron transport approach for heavy-ion collisions. Phys. Rev. C 2016, 94, 054905. [Google Scholar] [CrossRef]
- Inghirami, G.; Hillmann, P.; Tomášik, B.; Bleicher, M. Temperatures and chemical potentials at kinetic freeze-out in relativistic heavy ion collisions from coarse grained transport simulations. arXiv 2019, arXiv:1909.00643. [Google Scholar] [CrossRef]
- Steinheimer, J.; Bleicher, M. Sub-threshold ϕ and Ξ− production by high mass resonances with UrQMD. J. Phys. G 2016, 43, 015104. [Google Scholar] [CrossRef]
- Kolb, E.W.; Turner, M.S. The Early Universe. Front. Phys. 1990, 69, 1. [Google Scholar]
- Andronic, A.; Braun-Munzinger, P.; Redlich, K.; Stachel, J. Decoding the phase structure of QCD via particle production at high energy. Nature 2018, 561, 321. [Google Scholar] [CrossRef] [PubMed]
- Agakishiev, G.; Arnold, O.; Balanda, A.; Belver, D.; Belyaev, A.; Berger-Chen, J.C.; Blanco, A.; Böhmer, M.; Boyard, J.L.; Cabanelas, P.; et al. Statistical model analysis of hadron yields in proton-nucleus and heavy-ion collisions at SIS 18 energies. Eur. Phys. J. A 2016, 52, 178. [Google Scholar] [CrossRef]
- Agakishiev, G.; Balanda, A.; Bannier, B.; Bassini, R.; Belver, D.; Belyaev, A.; Blanco, A.; Böhmer, M.; Boyard, J.L.; Cabanelas, P.; et al. Hyperon production in Ar+KCl collisions at 1.76 A GeV. Eur. Phys. J. A 2011, 47, 21. [Google Scholar] [CrossRef]
- Motornenko, A.; Vovchenko, V.; Greiner, C.; Stoecker, H. Kinetic freeze-out temperature from yields of short-lived resonances. arXiv 2019, arXiv:1908.11730. [Google Scholar]
- Kapusta, J.I.; Li, M. High Baryon Densities Achieveable at RHIC and LHC. Nucl. Phys. A 2019, 982, 903. [Google Scholar] [CrossRef]
- Friman, B.; Hohne, C.; Knoll, J.; Leupold, S.; Randrup, J.; Rapp, R.; Senger, P. The CBM physics book: Compressed baryonic matter in laboratory experiments. Lect. Notes Phys. 2011, 814, 1. [Google Scholar]
- Ablyazimov, T.; Abuhoza, A.; Adak, R.P.; Adamczyk, M.; Agarwal, K.; Aggarwal, M.M.; Ahammed, Z.; Ahmad, F.; Ahmad, N.; Ahmad, S.; et al. Challenges in QCD matter physics—The scientific programme of the Compressed Baryonic Matter experiment at FAIR. Eur. Phys. J. A 2017, 53, 60. [Google Scholar] [CrossRef]
- Schade, H.; Wolf, G.; Kampfer, B. Role of phi decays for K- yields in relativistic heavy-ion collisions. Phys. Rev. C 2010, 81, 034902. [Google Scholar] [CrossRef]
- Lutz, M.F.M.; Korpa, C.L.; Moller, M. Antikaons and hyperons in nuclear matter with saturation. Nucl. Phys. A 2008, 808, 124. [Google Scholar] [CrossRef][Green Version]
- Tolos, L.; Cabrera, D.; Ramos, A. Strange mesons in nuclear matter at finite temperature. Phys. Rev. C 2008, 78, 045205. [Google Scholar] [CrossRef]
- Kolomeitsev, E.E.; Hartnack, C.; Barz, H.W.; Bleicher, M.; Bratkovskaya, E.; Cassing, W.; Chen, L.W.; Danielewicz, P.; Fuchs, C.; Gaitanos, T.; et al. Transport theories for heavy ion collisions in the 1-A-GeV regime. J. Phys. G 2005, 31, S741. [Google Scholar] [CrossRef]
- Agakishiev, G.; Balanda, A.; Bannier, B.; Bassini, R.; Belver, D.; Belyaev, A.V.; Blanco, A.; Boehmer, M.; Boyard, J.L.; Braun-Munzinger, P.; et al. Phi decay: A Relevant source for K-production at SIS energies? Phys. Rev. C 2009, 80, 025209. [Google Scholar] [CrossRef]
- Gasik, P.; Piasecki, K.; Herrmann, N.; Leifels, Y.; Matulewicz, T.; Andronic, A.; Averbeck, R.; Barret, V.; Basrak, Z.; Bastid, N.; et al. Strange meson production in Al+Al collisions at 1.9 A GeV. Eur. Phys. J. A 2016, 52, 177. [Google Scholar] [CrossRef]
- Piasecki, K.; Herrmann, N.; Averbeck, R.; Andronic, A.; Barret, V.; Basrak, Z.; Bastid, N.; Benabderrahmane, M.L.; Berger, M.; Buehler, P.; et al. Wide acceptance measurement of the K−/K+ ratio from Ni+Ni collisions at 1.91A GeV. Phys. Rev. C 2019, 99, 014904. [Google Scholar] [CrossRef]
- Adamczewski-Musch, J.; Arnold, O.; Behnke, C.; Belounnas, A.; Belyaev, A.; Chernenko, S.; Chlad, L.; Deveaux, C.; Dreyer, J.; Dybczak, A.; et al. Centrality determination of Au + Au collisions at 1.23A GeV with HADES. Eur. Phys. J. A 2018, 54, 85. [Google Scholar] [CrossRef]
- Rabe, B. Untersuchung der Ausfrier-Dynamik von Kaonen in Relativistischen Schwerionenkollisionen. Master’s Thesis, Technische Universität, Dresden, Germany, May 2019. [Google Scholar]
- Barz, H.W.; Zetenyi, M.; Wolf, G.; Kampfer, B. Subthreshold phi meson production in heavy ion collisions. Nucl. Phys. A 2002, 705, 223. [Google Scholar] [CrossRef][Green Version]
- Steinheimer, J.; Bleicher, M. Sub-threshold strangeness and charm production in UrQMD. J. Phys. Conf. Ser. 2017, 779, 012017. [Google Scholar] [CrossRef]
© 2019 by the authors. Licensee MDPI, Basel, Switzerland. This article is an open access article distributed under the terms and conditions of the Creative Commons Attribution (CC BY) license (http://creativecommons.org/licenses/by/4.0/).