Article

Action Potential Firing Induces Sodium Transients in Macroglial Cells of the Mouse Corpus Callosum

Institute of Neurobiology, Faculty of Mathematics and Natural Sciences, Heinrich Heine University Düsseldorf, Universitätsstrasse 1, D-40225 Düsseldorf, Germany
*
Author to whom correspondence should be addressed.
Neuroglia 2018, 1(1), 106-125; https://doi.org/10.3390/neuroglia1010009
Submission received: 14 June 2018 / Revised: 26 June 2018 / Accepted: 27 June 2018 / Published: 3 July 2018

Abstract

:
Recent work has established that glutamatergic synaptic activity induces transient sodium elevations in grey matter astrocytes by stimulating glutamate transporter 1 (GLT-1) and glutamate-aspartate transporter (GLAST). Glial sodium transients have diverse functional consequences but are largely unexplored in white matter. Here, we employed ratiometric imaging to analyse sodium signalling in macroglial cells of mouse corpus callosum. Electrical stimulation resulted in robust sodium transients in astrocytes, oligodendrocytes and NG2 glia, which were blocked by tetrodotoxin, demonstrating their dependence on axonal action potentials (APs). Action potential-induced sodium increases were strongly reduced by combined inhibition of ionotropic glutamate receptors and glutamate transporters, indicating that they are related to release of glutamate. While AMPA receptors were involved in sodium influx into all cell types, oligodendrocytes and NG2 glia showed an additional contribution of NMDA receptors. The transporter subtypes GLT-1 and GLAST were detected at the protein level and contributed to glutamate-induced glial sodium signals, indicating that both are functionally relevant for glutamate clearance in corpus callosum. In summary, our results demonstrate that white matter macroglial cells experience sodium influx through ionotropic glutamate receptors and glutamate uptake upon AP generation. Activity-induced glial sodium signalling may thus contribute to the communication between active axons and macroglial cells.

1. Introduction

In the grey matter of the vertebrate brain, astrocytes can be subject to transient activity-related increases in their sodium concentration, which can either be local or global depending on neuronal activity patterns [1,2]. A major pathway for the generation of these astrocyte sodium transients is the activation of sodium-dependent glutamate uptake in response to synaptic release of glutamate [3,4,5,6,7]. Glutamate uptake by grey matter astrocytes is realized by two transporter subtypes, namely glutamate transporter 1 (GLT-1) and glutamate-aspartate transporter (GLAST) [8,9].
Activity-related astrocyte sodium transients have been suggested to serve important functional roles in the interaction between neurons and astrocytes. Sodium increases caused by glutamate transport activate the astrocytic Na+/K+-ATPase, leading to the consumption of cellular ATP and thereby stimulating glial metabolism and lactate production, a key step in the so-called astrocyte-neuron lactate shuttle [10,11]. Moreover, sodium influx into astrocytes changes the driving force for sodium-dependent secondary active transporters. For example, this may result in the reversal of the plasma membrane Na+/Ca2+-exchanger (NCX), which then switches from a calcium exporter to an importer for calcium, contributing to intracellular calcium increases under both physiological and pathophysiological conditions [12,13,14,15].
In contrast to grey matter, the properties of sodium signalling in white matter glia are largely unexplored. While white matter tracts do not feature classical chemical synapses between neurons, axons can release glutamate in an activity-dependent manner (e.g., [16,17,18,19]). It is also established that white matter macroglia express sodium-dependent glutamate transporters, which are especially important to protect the tissue from glutamate-induced excitotoxicity [20,21,22,23,24]. In line with this, we could recently demonstrate that application of glutamate results in sodium transients in astrocytes and cells of the oligodendroglial lineage (representing mature oligodendrocytes as well as NG2 cells) in tissue slices of corpus callosum of the mouse, which were strongly dampened upon pharmacological inhibition of glutamate uptake in both groups [25]. Furthermore, we found that sodium not only propagated intercellularly between gap-junction coupled astrocytes, but also from astrocytes to oligodendrocytes and NG2 cells. This indicates that the different macroglia cell types in this white matter area are directly functionally coupled [25].
In addition to glutamate transporters, white matter macroglia express a large repertoire of receptors for different transmitters [26,27]. Their activation upon action potential (AP) propagation triggers calcium signals in astrocytes in the optic nerve and corpus callosum, involving both glutamate and purine receptors [19,28,29,30]. Axonal AP propagation and glutamate release moreover activate α-amino-3-hydroxy-5-methyl-4-isoxazolepropionic acid (AMPA) and N-methyl-D-aspartate (NMDA) receptors expressed on the myelin sheath, inducing intracellular calcium signals in the myelin compartment and stimulating oligodendrocyte glycolysis [27]. In NG2 cells, calcium signals are generated upon opening of AMPA receptors [17,19,31,32,33].
While it is thus established that glial cells in white matter can undergo calcium signalling in response to axonal AP firing [26,27], it is not known, if axonal activity does induce detectable increases in the sodium concentration of surrounding macroglial cells. In the present study, we addressed this question by performing quantitative ratiometric imaging with the fluorescent sodium indicator sodium-binding benzofurane isophthalate (SBFI) in acute tissue slices of the juvenile mouse corpus callosum. Using pharmacological tools, different genetically-modified mice, immunohistochemistry, and immunoblotting, we investigated the cellular pathways of sodium influx into the main macroglial cell types, namely astrocytes, oligodendrocytes, and NG2 glia.

2. Materials and Methods

2.1. Animals, Tissue Preparation, and Salines

The present study was carried out in strict accordance with the institutional guidelines of the Heinrich Heine University Düsseldorf and the European Community Council Directive (86/609/EEC). All experiments were communicated to and approved by the Animal Welfare Office at the Animal Care and Use Facility of the Heinrich Heine University Düsseldorf (institutional act number: O50/05) in accordance with the recommendations of the European Commission [34]. In accordance with the German Animal Welfare Act (Tierschutzgesetz, Articles 4 and 7), no formal additional approval for the post-mortem removal of brain tissue was necessary.
Coronal tissue slices (250 µm) were prepared from mouse corpus callosum (Mus musculus, Balb/C; postnatal days (P) 15-20; both sexes). Moreover, the following transgenic animals were used (P15-20; both sexes): NG2/EYFP knock-in mice, in which enhanced yellow fluorescent protein (EYFP) is expressed under the control of the NG2 promoter [35]; connexin knock-out (Cx-k.o.) mice that display astrocyte-directed conditional deletion of connexin43 as well as additional, unrestricted deletion of connexin30 [36]; and GLAST-k.o. mice that feature inactivation of the gene for GLAST [37]. In accordance with the recommendations of the European Commission (published in “Euthanasia of experimental animals,” Luxembourg: Office for Official Publications of the European Communities, 1997; ISBN 92-827-9694-9), mice were anaesthetized with CO2 before the animals were quickly decapitated for slice preparation.
For imaging experiments, corpus callosum slices were prepared in ice-cold saline composed of (in mM): 125 NaCl, 2.5 KCl, 2 CaCl2, 1 MgCl2, 1.25 NaH2PO4, 26 NaHCO3, and 20 glucose, bubbled with 95% O2 and 5% CO2, resulting in a pH of 7.4. After slice preparation, the tissue was kept at 34 °C for 20 min in saline containing 0.5–1 µM sulforhodamine 101 (SR101) for specific labelling of astrocytes [38]. Afterwards, slices were incubated in SR101-free saline and kept at room temperature (20–22 °C). Experiments were performed at room temperature as well.

2.2. Sodium Imaging and Electrophysiology

For intracellular sodium imaging, sodium-binding benzofuran isophthalate-acetoxymethyl ester (SBFI-AM) (TEFLabs Inc., Austin, TX, USA), the membrane-permeant form of SBFI, was injected into the corpus callosum, following a procedure reported before [39]. Ratiometric wide-field sodium imaging was performed as described earlier in detail [4] using a variable scan digital imaging system (Nikon NIS-Elements v4.3, Nikon GmbH Europe, Düsseldorf, Germany) attached to an upright microscope (Nikon Eclipse FN-PT, Nikon GmbH Europe, Düsseldorf, Germany) equipped with 40×/N.A. 0.8 LUMPlanFI water immersion objective (Olympus Deutschland GmbH, Hamburg, Germany) and an orca FLASH V2 camera (Hamamatsu Photonics Deutschland GmbH, Herrsching, Germany).
Excitation light was generated by a PolychromeV monochromator (TILL Photonics, Martinsried, Germany). SBFI was alternately excited at 340 and 380 nm at 5 Hz and resulting emission was collected >440 nm. Fluorescence was evaluated in regions of interest (ROI) positioned around SBFI-labelled cell bodies. Signals were background-corrected as described before [4,40] and analysed using OriginPro Software (OriginLab Corporation, Northampton, MA, USA). The fluorescence ratio was calculated from the emission at single wavelengths (F340/F380). SBFI fluorescence was calibrated in situ as described earlier [4,39].
Corpus callosum axons were electrically stimulated using a saline-filled glass pipette with a tip diameter of around 1 µM connected to an isolated stimulator (A-M systems, Model 2100, Sequim, WA, USA). A train of rectangular electrical pulses (250 µsec/50–80 V) was delivered at 50 Hz for 0.5 s to evoke APs. Local field potentials were recorded using a glass electrode (1-3 MΩ resistance) connected to a HEKA EPC10 patch amplifier and analysed with Patchmaster software (HEKA electronics, Lambrecht, Germany).
In several sets of experiments, glutamate (1 mM) was focally ejected into the corpus callosum through a fine glass micropipette attached to a pressure application device (PDES-02D, NPI Electronic GmbH, Tamm, Germany). All other substances were applied with the bath perfusion. The following blockers were used: tetrodotoxin, TTX (Biotrend, Köln, Germany); (3S)-3-[[3-[[4-(Trifluoromethyl)benzoyl]amino]phenyl]methoxy]-l-aspartic acid, TFB-TBOA (Tocris, Bristol, UK), 2-amino-5-phosphonopentanoic acid, AP5 (Cayman chemical, Hamburg, Germany); 2,3-Dihydroxy-6-nitro-7-sulfamoyl-benzo(F) quinoxaline, NBQX (Biotrend, Köln, Germany); dihydrokainate, DHK (Tocris, Bristol, UK).

2.3. Immunohistochemistry

Balb/C mouse brains of both sexes (P15-17) were fixed in 0.1 M PBS (phosphate buffered saline) containing 4% PFA (paraformaldehyde) at 4 °C for 24 h. Then, 30 µm coronal slices of the corpus callosum were prepared with a vibratome. For indirect immunostainings, sections were first incubated in blocking solution comprised of normal goat serum (Gibco/Life Technologies, Darmstadt, Germany; 5% in PBS, 1 h) and TritonX-100 (Sigma-Aldrich Chemical, Munich, Germany, 0.4%). Afterwards, sections were incubated in blocking solution (overnight, 4 °C) containing primary antibodies guinea pig anti-GLT1 (Merck Millipore, Darmstadt, Germany, 1:1000), mouse anti-GLAST (Miltenyi, Bergisch Gladbach, Germany, 1:100), rabbit anti-GLAST (Tocris, Bristol, UK, 1:1000), rabbit anti-glial fibrillary acidic protein (GFAP) (DAKO, Santa Clara, CA, USA, 1:1000), and mouse anti-CC1 (GeneTex, Irvine, CA, USA, 1:250). Mouse anti-NG2 (Merck Millipore, Darmstadt, Germany, 1:100) was incubated for 19 h at room temperature.
Finally, sections were incubated in secondary antibody solution (PBS with 0.4% TritonX-100, 1 h) containing goat anti-mouse Alexa 488 or 594 (1:500), goat anti-rabbit Alexa 488 or 594 (1:500) and goat anti-guinea pig Alexa 488 (1:500). In control sections, the primary antibodies were omitted from the protocol. The sections were coverslipped in Mowiol (Calbiochem, Fluka, distributed by Sigma-Aldrich Chemical, Munich, Germany).
Image z-stacks (10–20 optical sections, 0.3–0.5 µm each) were captured using a motorized confocal laser scanning microscope (Nikon Eclipse C1, Nikon Instruments, Düsseldorf, Germany), equipped with a Nikon 60×/1.4 oil objective. Adequate excitation was realized through argon (488 nm) and helium-neon (543 nm) and 407 nm lasers. The parameters of image acquisition and processing were identical for all stacks.

2.4. SDS-PAGE and Western Blot

For Western blotting, parts of the corpus callosum were excised from mouse brains of different postnatal stages (P5, P10, P15, P25) and homogenized in radioimmunoprecipitation assay (RIPA) buffer (pH 7.4) containing 1% deoxycholic acid (NP-40), 0.25% sodium deoxycholate, protease inhibitors (CompleteMini, Roche, Germany), 150 mM NaCl and 50 mM Tris-HCL. The homogenate was centrifuged at 13,200 g at 4 °C for 30 min and the supernatant was supplemented with 4× Laemmli sample buffer (5% sodium dodecyl sulfate (SDS), 43.5% glycerol, 100 mM dl-dithiothreitol (DTT), 0.002% bromphenol blue, 20% 2-mercaptoethanol, 125 mM Tris-HCl). Proteins were then separated on 5% (stacking) and 10% (separation) gels by sodium dodecyl sulfate polyacrylamide gel electrophoresis (SDS-PAGE), with a voltage of 60 V for 45 min and 120 V for 90 min, respectively. Proteins were then transferred to polyvinylidenfluorid (PVDF)-membranes (Roth830.1, pore size 0.45 µm) for 70 min using the semi-dry western blot procedure [41,42] with a constant current of 54 mA (one gel) or 108 mA (two gels).
Membranes were then incubated in a blocking solution comprised of PBS, 0.1% (v/v) tween and 5% (w/v) milk powder for 1 h. Blocking solution containing primary antibodies guinea pig anti-GLT1 (Merck Millipore, Darmstadt, Germany, 1:5000), rabbit anti-GLAST (Abcam, Cambridge, UK, 1:1000) and rabbit anti-actin (Sigma-Aldrich Chemical, Munich, Germany, 1:2000) was added overnight at 4 °C. Afterwards, membranes were incubated with a solution containing horseradish peroxidase (HRP)-conjugated secondary antibodies goat anti-rabbit (Invitrogen, Carlsbad, CA, USA, 1:5000) and rabbit anti-guinea pig (Sigma-Aldrich Chemical, Munich, Germany, 1:5000) for 30 min at room temperature.
Immunoreactive protein bands were visualized using the enhanced chemiluminescence technique (ECL-kit, Amersham, Germany). Densitometric analysis was performed at a luminescent image analyser ImageQuant LAS-4000 (Fujifilm Europe, Düsseldorf, Germany). Background corrected grey values of the respective proteins were divided by the grey values of α-actin and normalized to the P25 bands of the separate blots.

2.5. Data Analysis and Presentation

Unless differently specified, data are presented as mean values ± standard error of mean (SEM) and, depending on the experimental setup, analysed by Wilcoxon paired test or student’s t-test. p represents error probability, * 0.01 ≤ p < 0.05, ** 0.001 ≤ p < 0.01, *** p < 0.001. “n” represents the number of individual cells analysed, while “N” represents the number of individual experiments/slice preparations. Each set of experiments was obtained from slices of at least three different animals. Images were edited in ImageJ (NIH Image, Bethesda, MD, USA), and figures were prepared using Adobe Illustrator (Adobe Systems Incorporated, San Jose, CA, USA).

3. Results

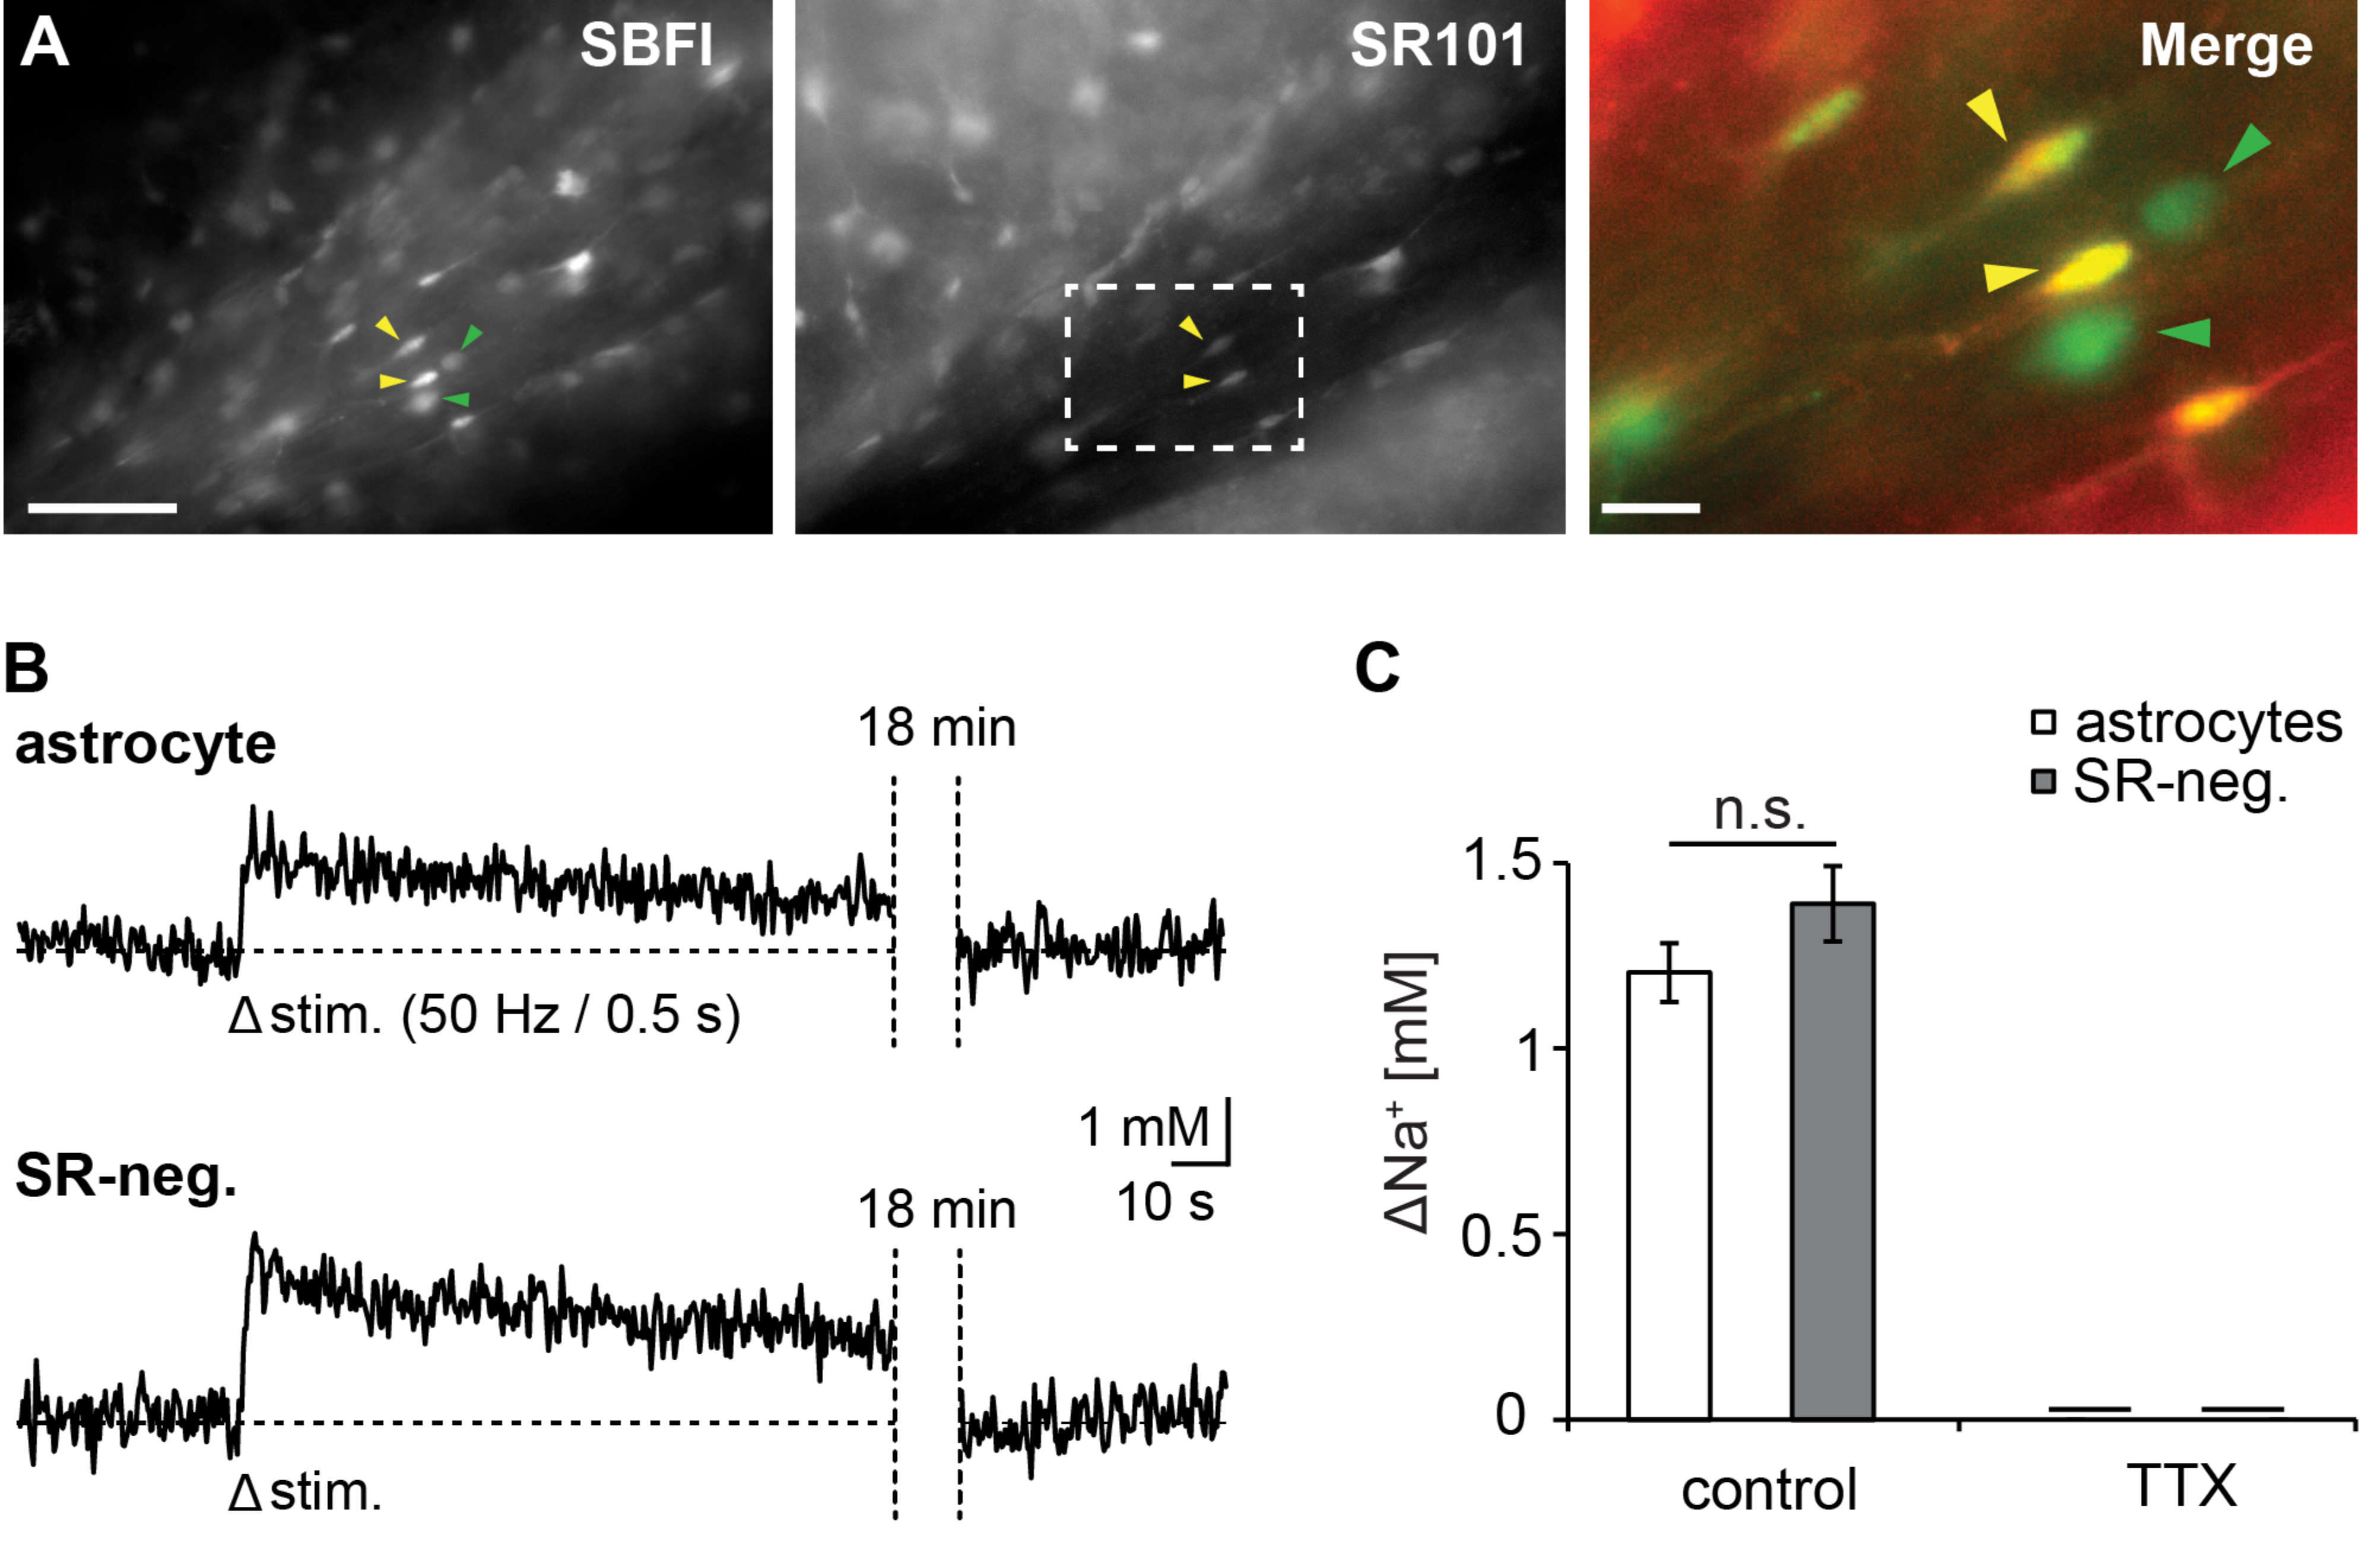
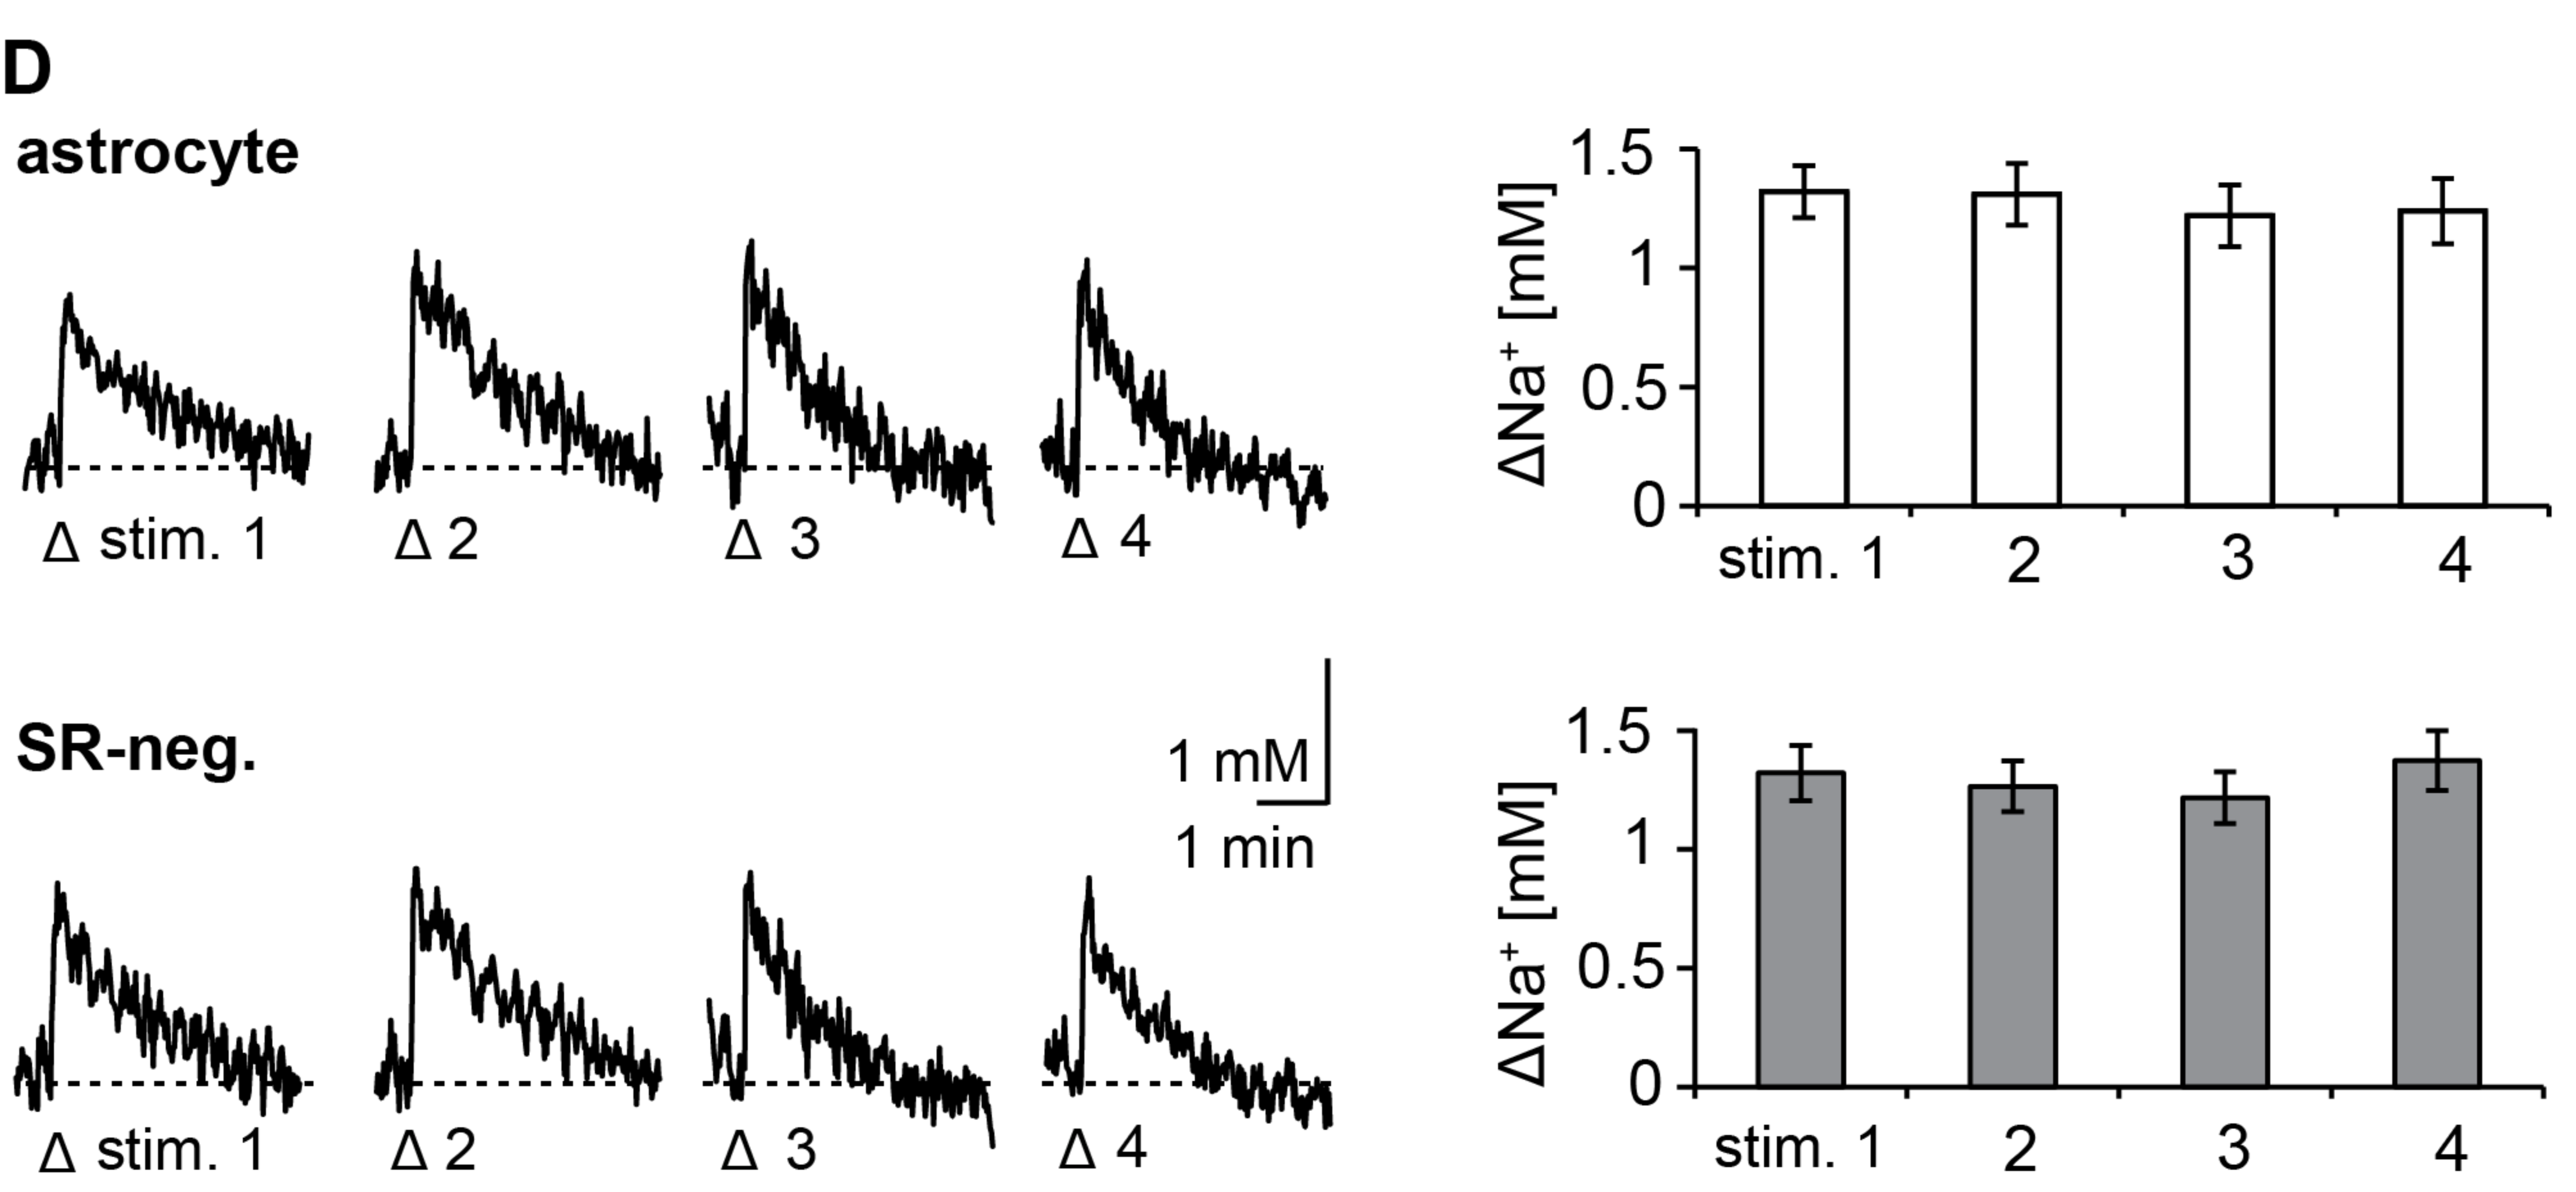
3.1. Action Potentials Evoke Sodium Transients in Macroglial Cells of the Corpus Callosum

For imaging activity-related glial sodium transients in the corpus callosum, we first stained tissue slices with the vital fluorescence marker SR101 to identify astrocytes (Figure 1A). Upon additional bolus-loading of the membrane-permeant form of the sodium indicator SBFI, cell bodies of (SR101-positive) astrocytes and SR101-negative cells could be distinguished (Figure 1A). In a recent study [25], we found that SBFI-AM stains virtually the entire macroglial cell population, confirming that microglia do not take up the dye [30]. SR101-negative, SBFI-loaded cells thus most likely represent oligodendrocytes and NG2 cells. No obvious differences in the baseline ratio levels were observed between the different types of macroglial cells, indicating that their resting sodium concentrations are similar.
To evoke AP’s, a glass electrode was positioned in the fibre tract and axons were electrically stimulated for 0.5 s at 50 Hz. The electrical stimulation induced a transient increase in the sodium concentration of astrocytes and SR101-negative cells (N = 19) (Figure 1B). The average peak amplitude of these sodium transients was similar in both cell types, amounting to 1.2 ± 0.1 mM in astrocytes (n = 94) and to 1.4 ± 0.1 mM in SR101-negative cells (n = 171) (Figure 1C). Notably, recovery from sodium transients was rather slow, and full recovery typically took several minutes (Figure 1B,C). Sodium transients evoked by electrical stimulation were completely suppressed after perfusion of slices with 0.5 µM TTX (n = 34 astrocytes and n = 66 SR101-negative cells; N = 5) (Figure 1C), indicating that they were indeed related to axonal AP generation.
To test if AP-related sodium transients could be evoked repetitively, we performed experiments, in which the electrical stimulation was repeated after 20 min (N = 4). Figure 1D illustrates that sodium signals in astrocytes (n = 12) and SR101-negative cells (n = 29) exhibited similar amplitudes and kinetics with four consecutive stimulations. Similarly, extracellular compound APs (CAPs) were stable with three subsequent stimulations (N = 5; not shown). Perfusion with 0.5 µM TTX completely suppressed CAPs (N = 3, not shown).
Taken together, our data show that electrical stimulation results in well-detectable transient sodium increases in astrocytes as well as SR101-negative glial cells of the corpus callosum. These increases are completely blocked during perfusion with TTX, showing that they are dependent on the opening of voltage-gated sodium channels and the generation of APs, respectively.

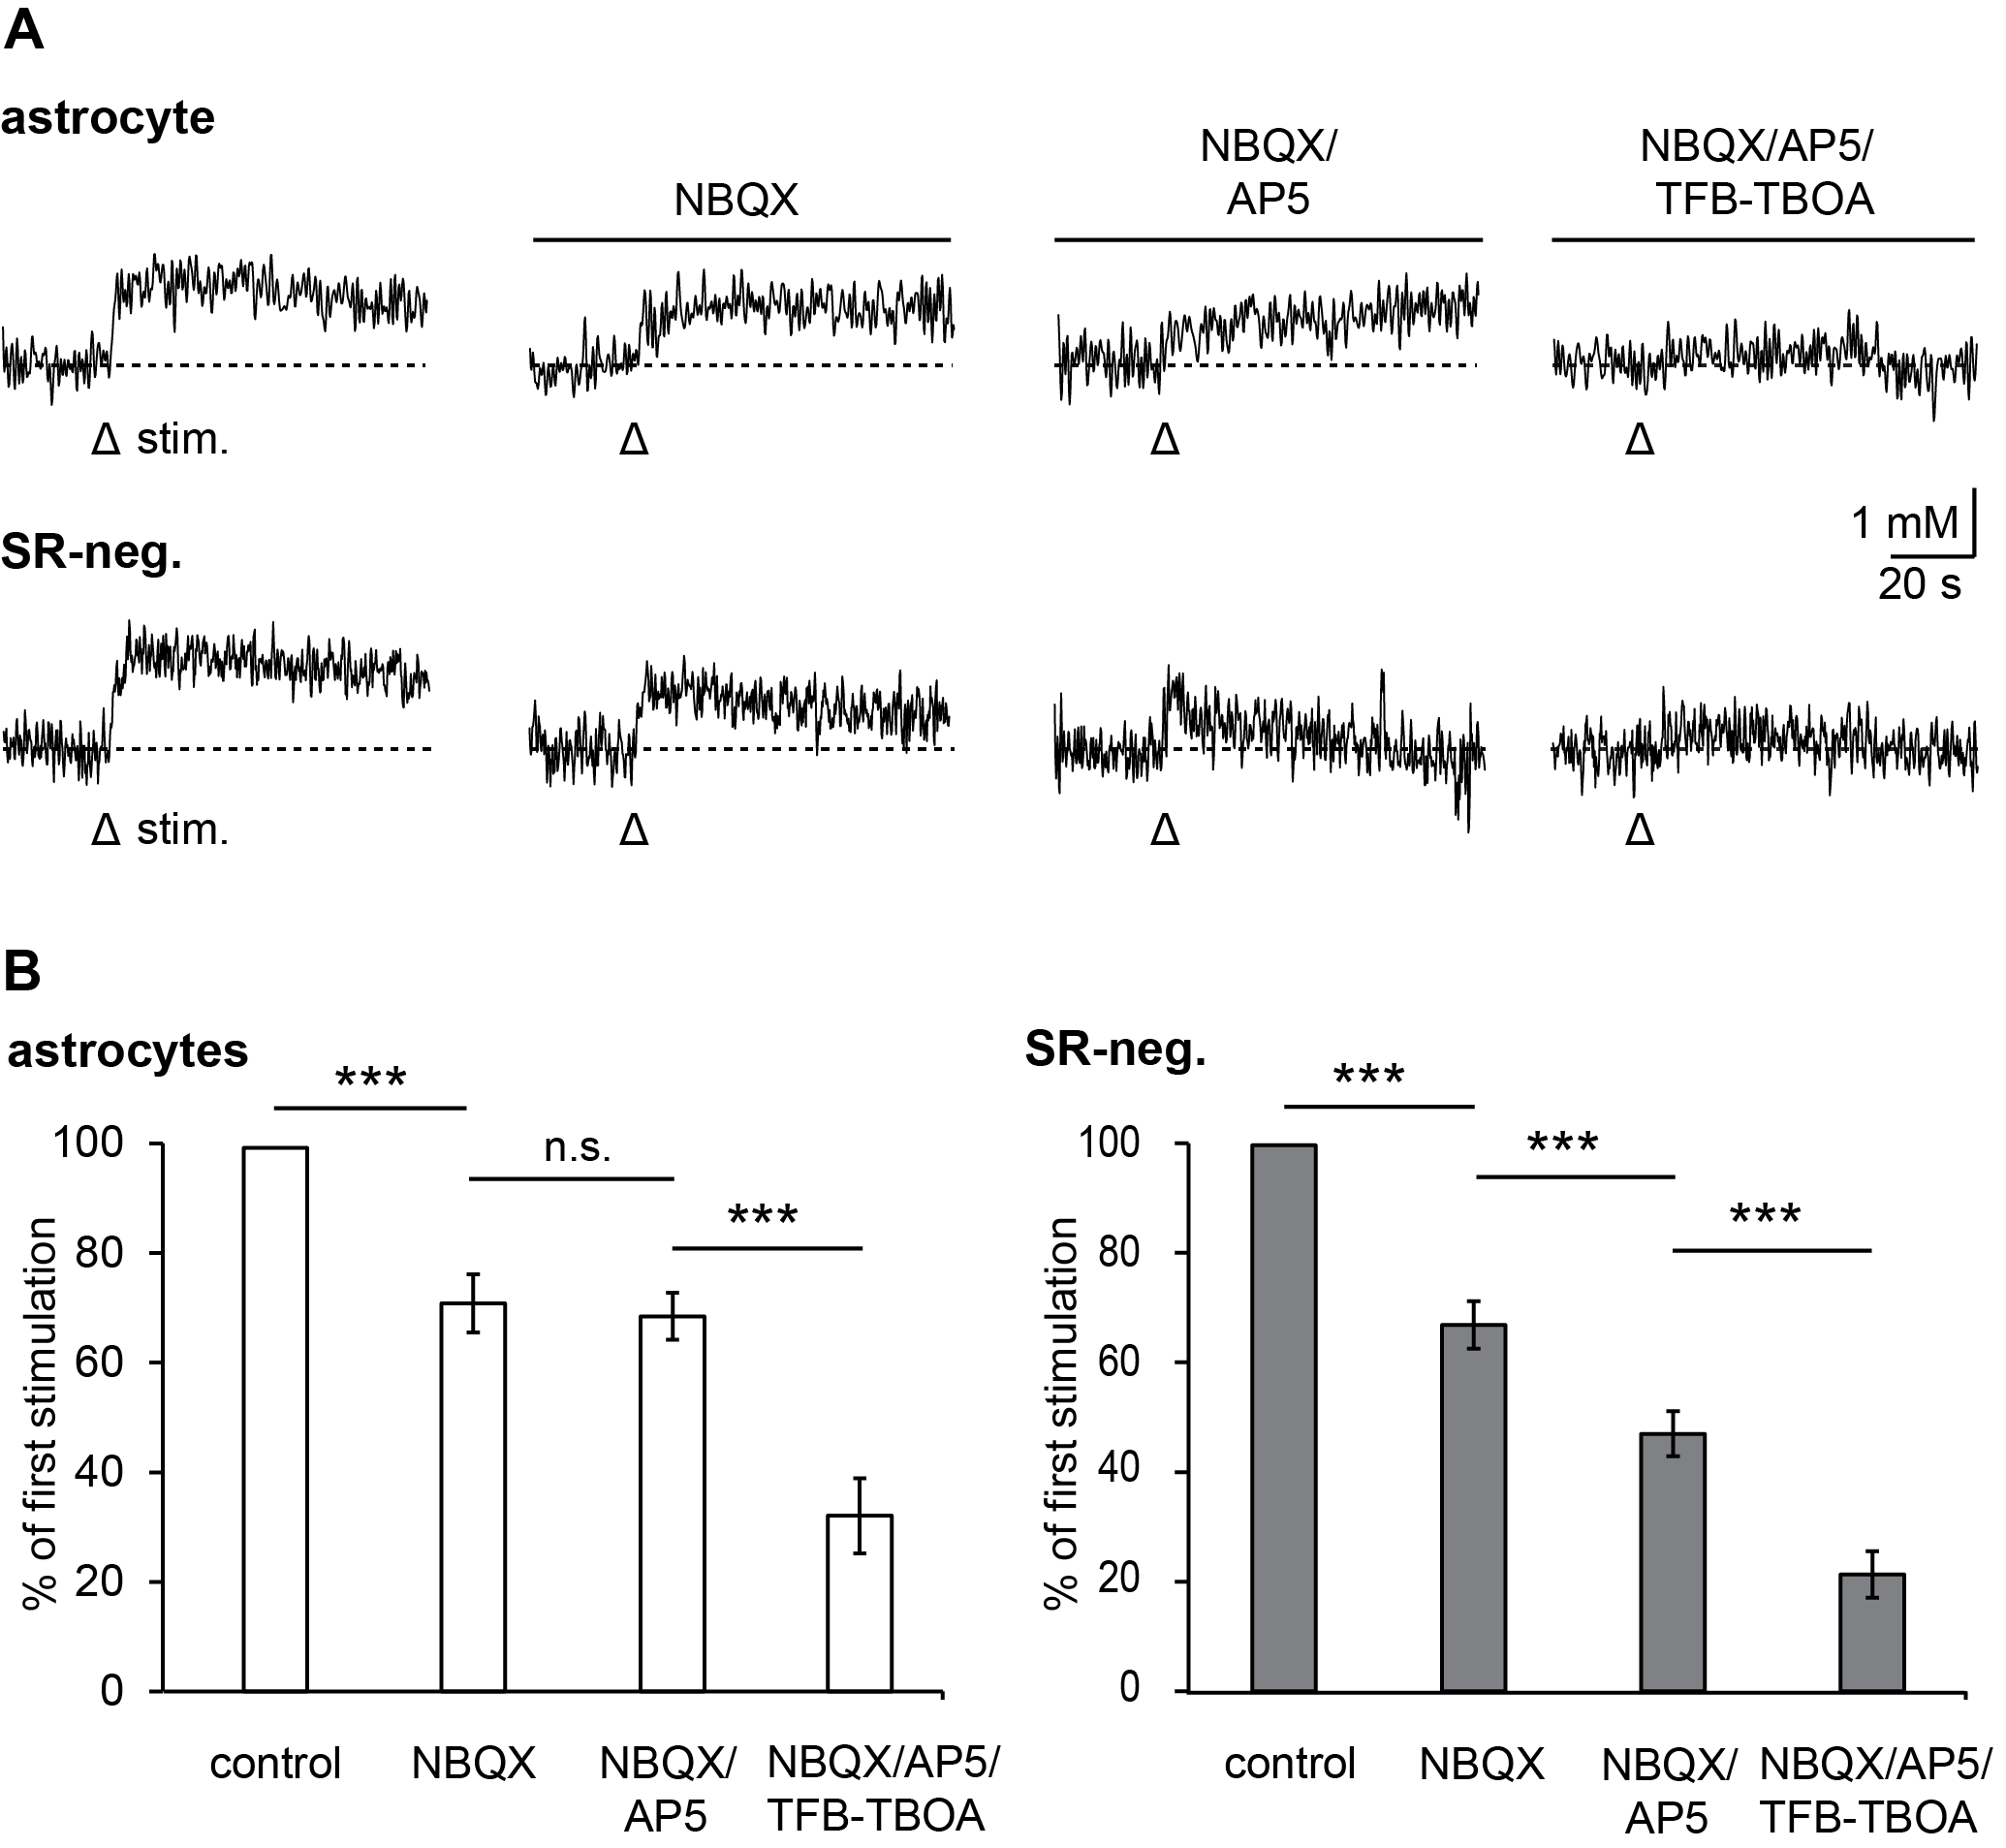
3.2. Pharmacology of Action Potential-Induced Sodium Transients in Macroglial Cells

In grey matter astrocytes of the mouse hippocampus, activity-related sodium transients are mainly due to activation of glutamate transport [4], while in cerebellar Bergman glial cells, an additional contribution of AMPA receptors was described [6]. To study the relevance of glutamate transporter versus glutamate receptor-mediated sodium influx into macroglial cells of the corpus callosum, we performed experiments in which axons were stimulated repetitively while different blockers were added successively (N = 12).
Addition of NBQX (10 μM) to block AMPA receptors reduced the peak amplitude of sodium transients significantly to 70.8 ± 5.3% of control stimulation in astrocytes (n = 29) and to 66.8 ± 4.3% in SR101-negative cells (n = 43) (Figure 2A,B). Subsequent addition of AP5 (50 μM) to additionally block NMDA receptors did not alter the amplitude of sodium signals in astrocytes, while significantly reducing them in SR101-negative cells to 47 ± 4.1% of control. Finally, addition of TFB-TBOA (1 μM), which blocks high-affinity glutamate transporters, significantly reduced amplitudes to 32.1 ± 6.8% in astrocytes and to 21.3 ± 4.2% in SR101-negative cells (Figure 2A,B).
SBFI-loaded, SR101-negative cells in corpus callosum slices mainly represent oligodendrocytes and NG2 cells [25]. To further distinguish between these two cell types, we used tissue slices from transgenic NG2/EYFP-reporter mice [35], in which NG2 cells can be identified based on their expression of EYFP (and absence of SR101-staining), while oligodendrocytes are both SR101 and EYFP-negative (Figure 3A).
Electrical fibre stimulation triggered intracellular sodium transients in both NG2 cells and oligodendrocytes (N = 7) (Figure 3B). The peak amplitude of these sodium transients was not significantly different between the two cell types (NG2-cells: 1.7 ± 0.2 mM, n = 37; oligodendrocytes: 1.5 ± 0.1 mM, n = 68; not shown). Moreover, the pharmacological profiles were similar in both cell types, essentially recapitulating the results obtained before with “SR101-negative” cells (see Figure 2). As compared to controls in the absence of blockers, NBQX reduced peak amplitudes to 57.4 ± 5.3% in NG2 cells (n = 37) and to 63.2 ± 6.1% in oligodendrocytes (n = 68). AP5 additionally reduced amplitudes to 45.6 ± 5.4% (NG2 cells) and 41.3 ± 4.4% (oligodendrocytes), while TFB-TBOA caused a reduction to 22.1 ± 4.8% (NG2 cells) and 20 ± 2.5% (oligodendrocytes) (Figure 3C).
In summary, these experiments show that axonal AP generation induces transient sodium signals in all three classes of macroglial cells of the corpus callosum, namely astrocytes, oligodendrocytes, and NG2 glia. Action potential-induced sodium increases are strongly reduced by combined inhibition of glutamate receptors and glutamate transport, indicating that they are largely related to axonal release of glutamate. The exact pharmacological profile, however, slightly differs between the different cell types. While high-affinity glutamate transport and opening of AMPA receptors contribute to AP-related sodium influx into all three macroglia cell types, only oligodendrocytes and NG2 glia (but not astrocytes) show an additional contribution of NMDA receptors.

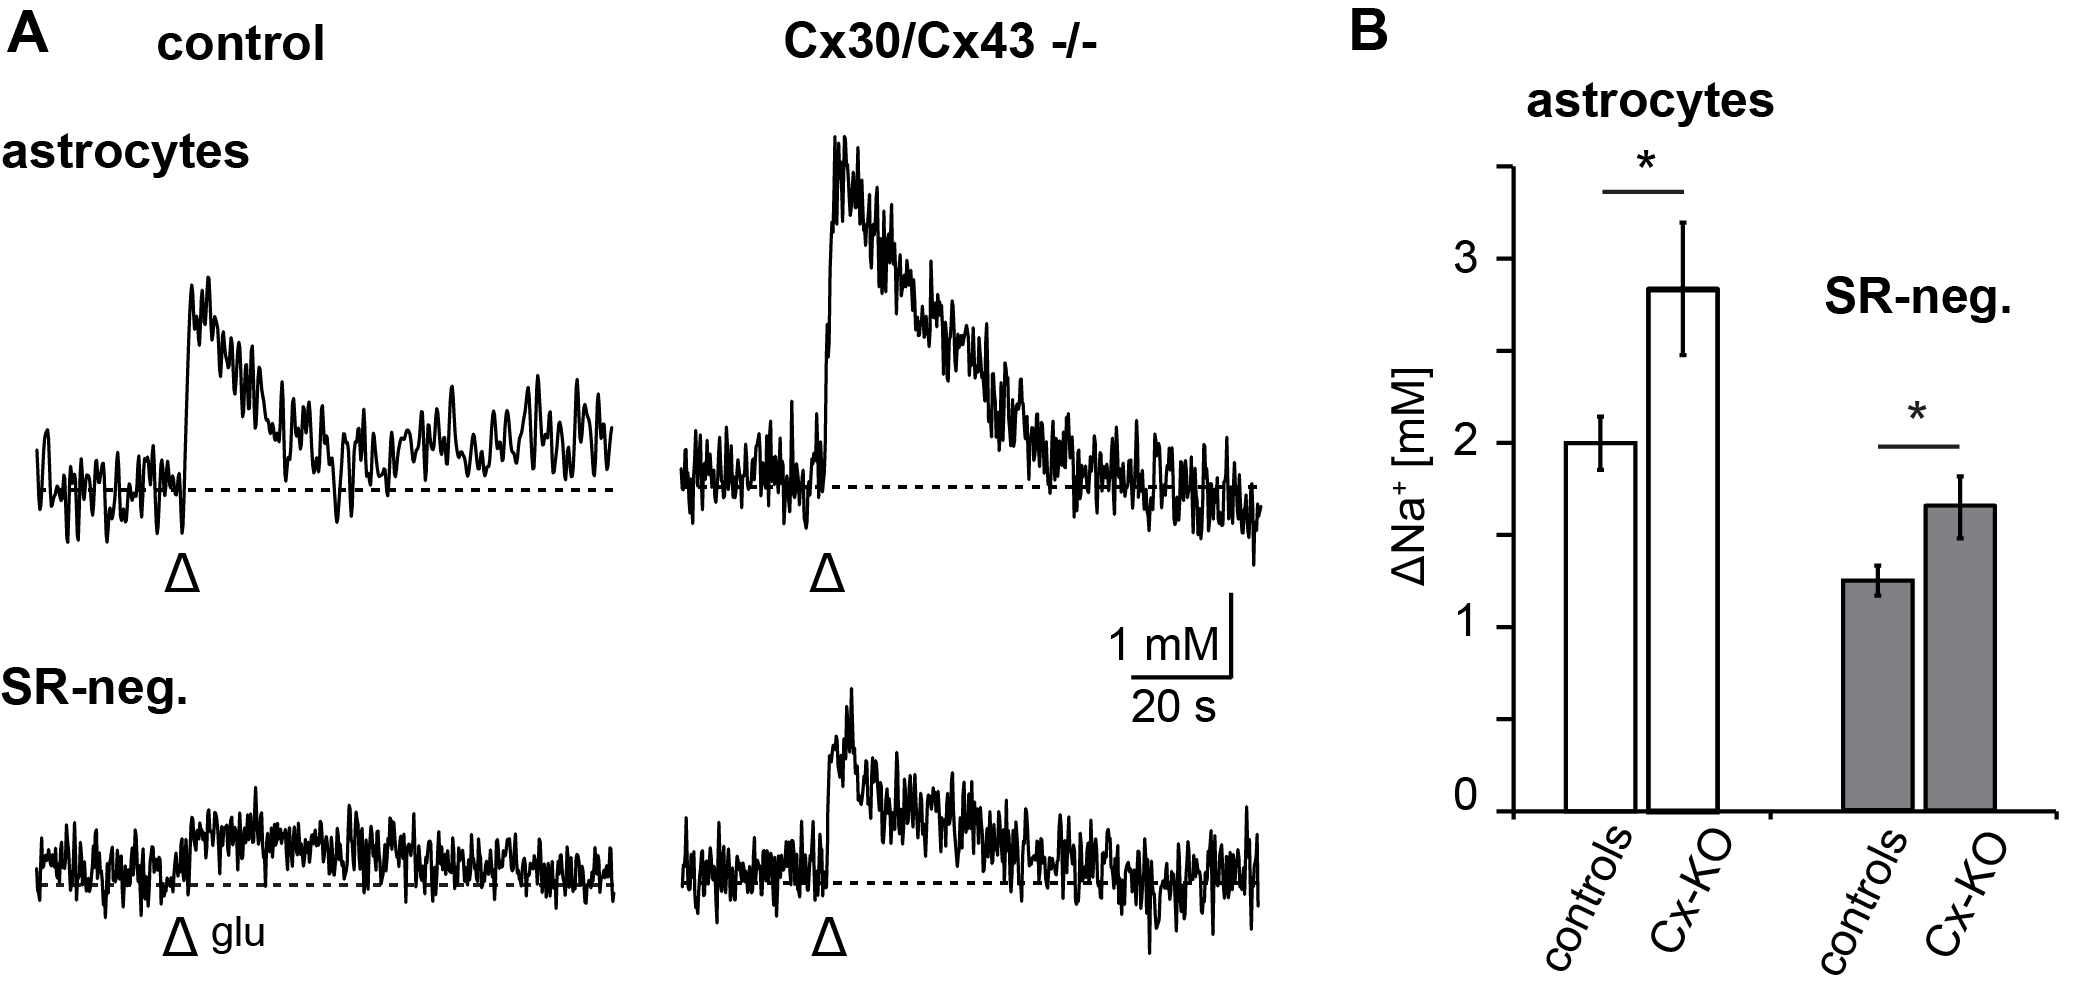
3.3. Relevance of Gap Junctional Coupling

The results presented so far show that electrical stimulation of axons and AP generation are accompanied by transient elevations in the sodium concentration of astrocytes, oligodendrocytes, as well as NG2 cells of the corpus callosum and that these signals are largely related to activation of glutamate receptors and transporters. We have reported previously that sodium signals can spread through gap junctions among astrocytes and from astrocytes to oligodendrocytes and NG2 cells in the corpus callosum [25], suggesting that glutamate may not act directly on all macroglial cells. To analyse the involvement of sodium spread through gap junctions in the generation of glutamate-related sodium transients, we prepared tissue slices from animals, which exhibit a conditional (cre-recombinase-dependent) deletion of connexin43 in astrocytes as well as an unrestricted deletion of connexin30 [36] (“Cx-k.o. mice”). Cre-recombinase-negative mice, featuring undisturbed gap junctional coupling, were used as controls.
Focal pressure application of glutamate (1 mM/250 ms) induced sodium transients in the majority of astrocytes and SR101-negative cells in the field of view in control animals as well as in Cx-k.o. mice (N = 5) (Figure 4A). In control, these amounted to 2.0 ± 0.1 mM in astrocytes (n = 51) and to 1.2 ± 0.1 mM in SR101-negative cells (n = 54) (Figure 4B). In Cx-k.o. mice, glutamate-evoked sodium increases were significantly larger as compared to controls in both astrocytes (2.8 ± 0.4 mM; n = 40) and SR101-negative cells (1.7 ± 0.2 mM; n = 64) (Figure 4A,B).
These experiments thus show that sodium signals induced by direct application of glutamate in astrocytes and SR101-negative cells are augmented in animals lacking connexins 30 and 43 in astrocytes. This indicates that sodium signals in the latter group are caused by direct action of glutamate onto individual cells and not primarily caused by an intercellular spread of sodium from astrocytes to SR101-negative cells through gap junctions.

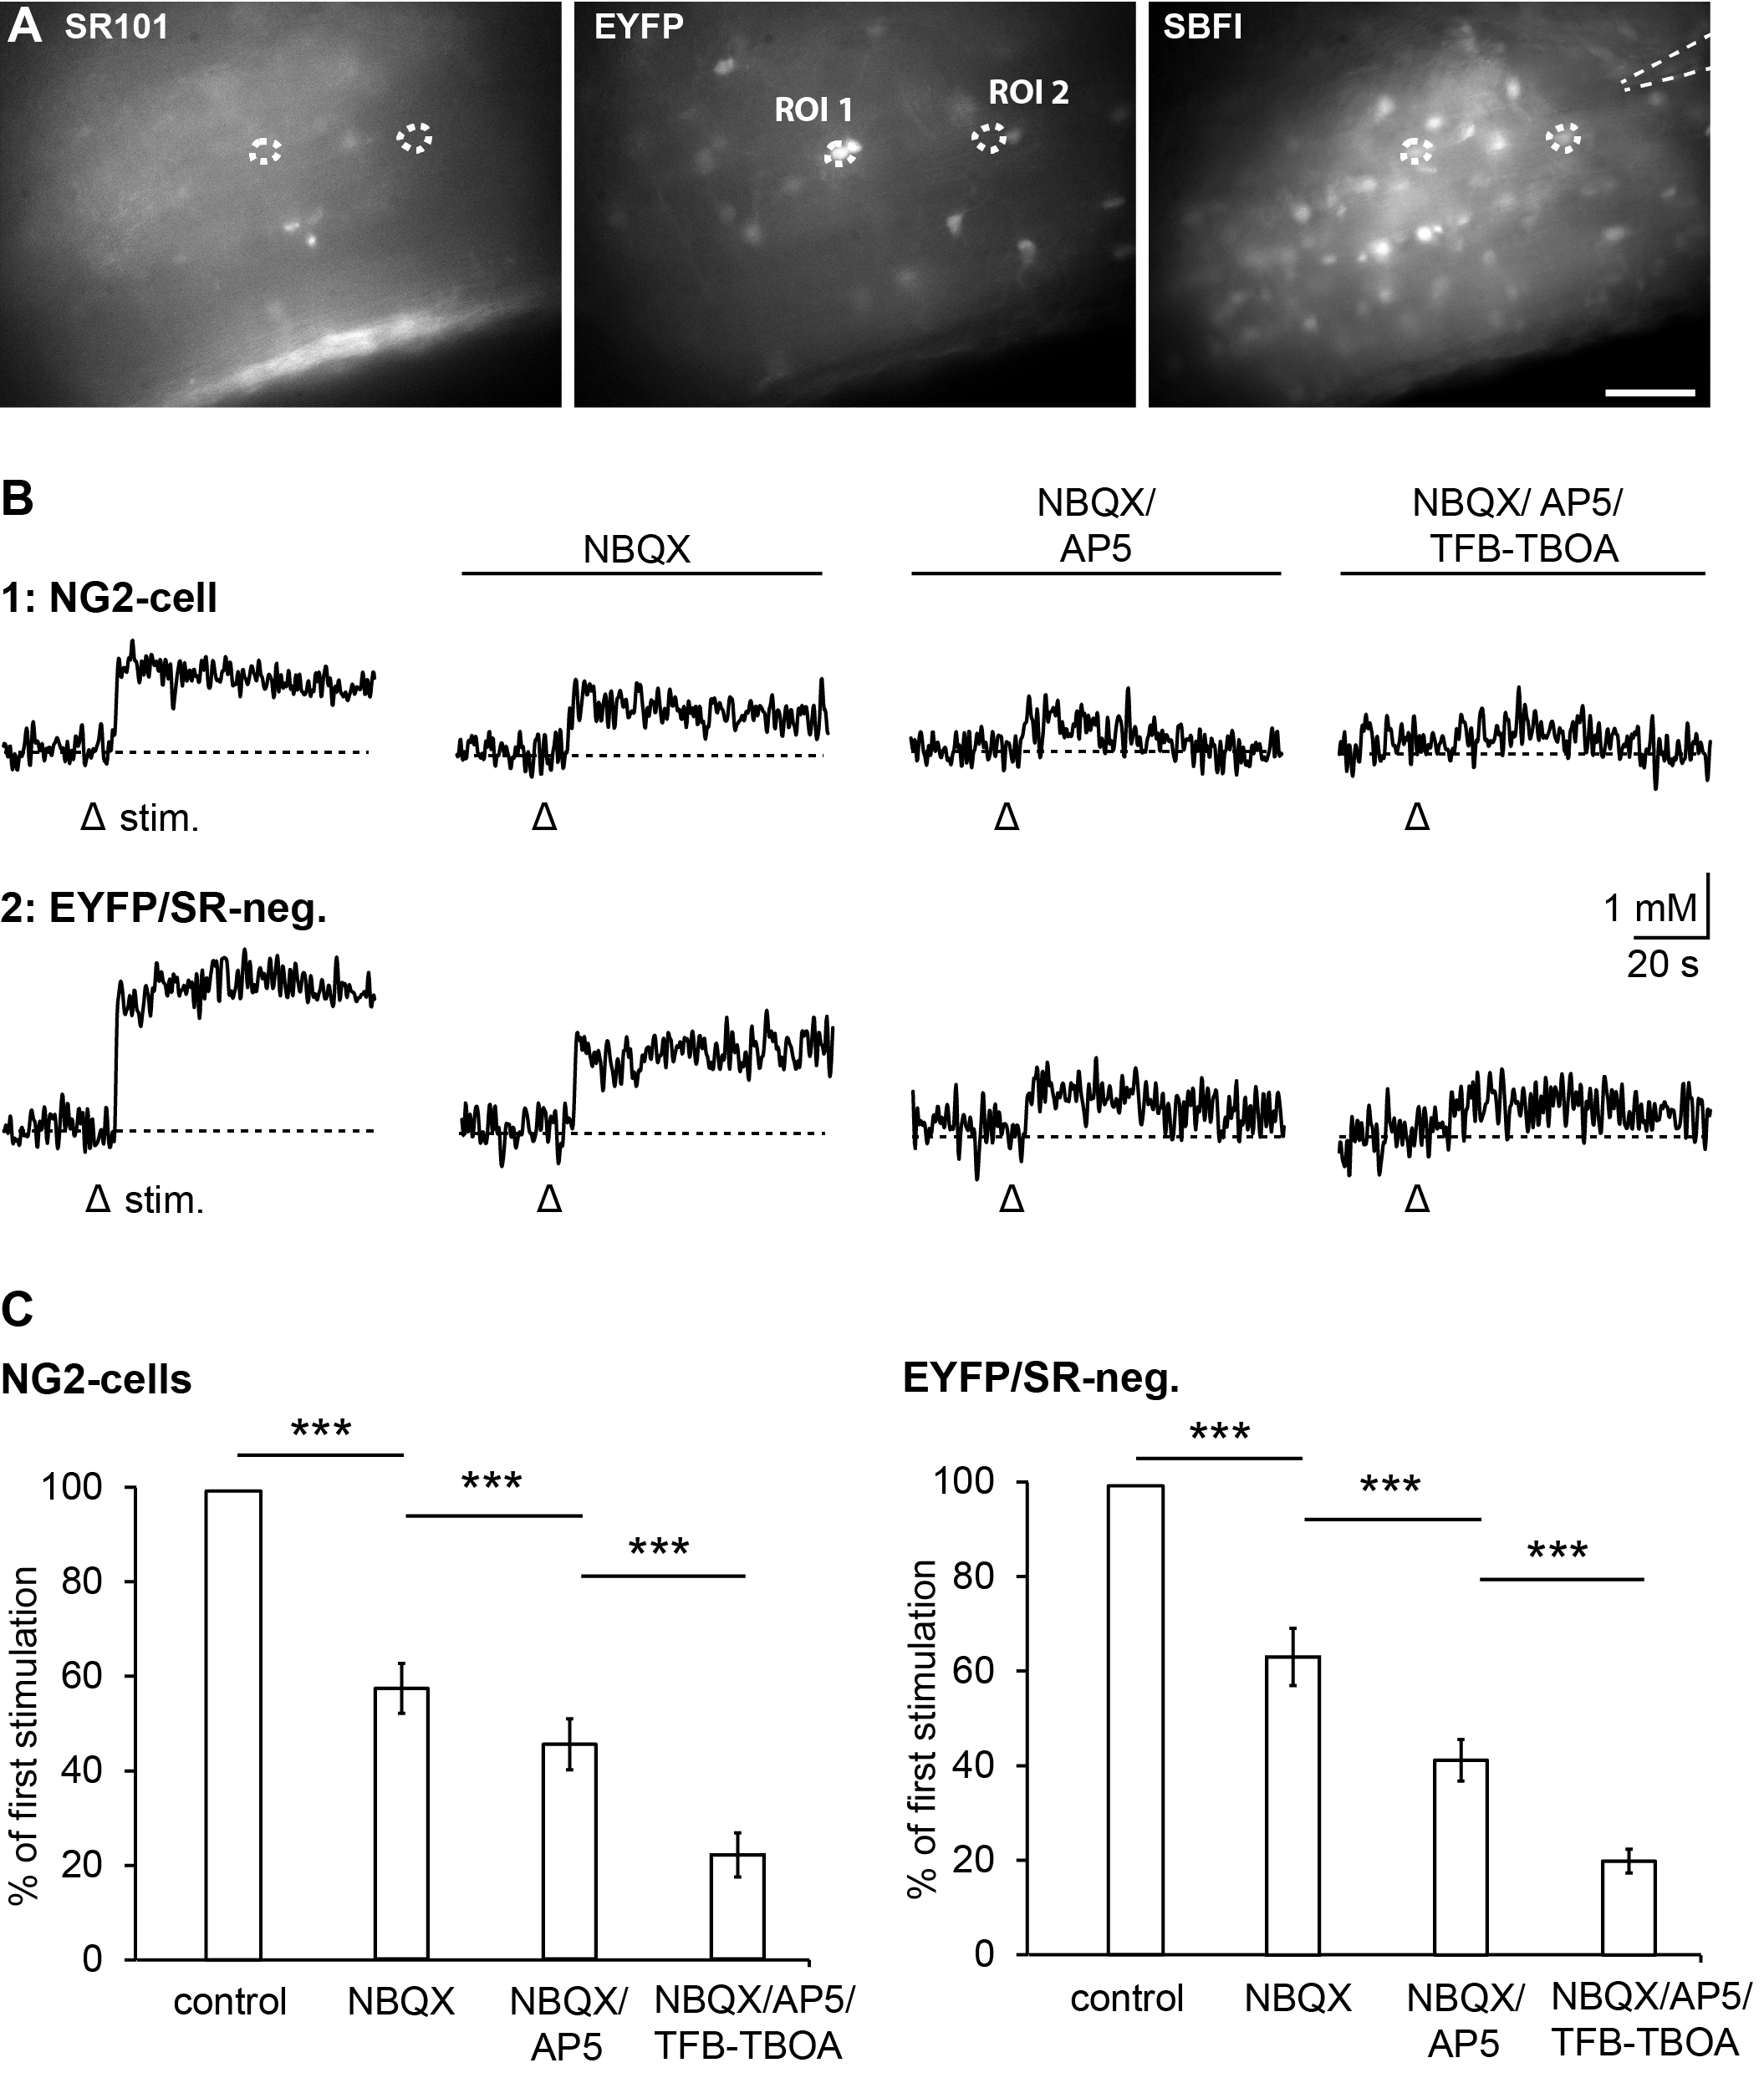
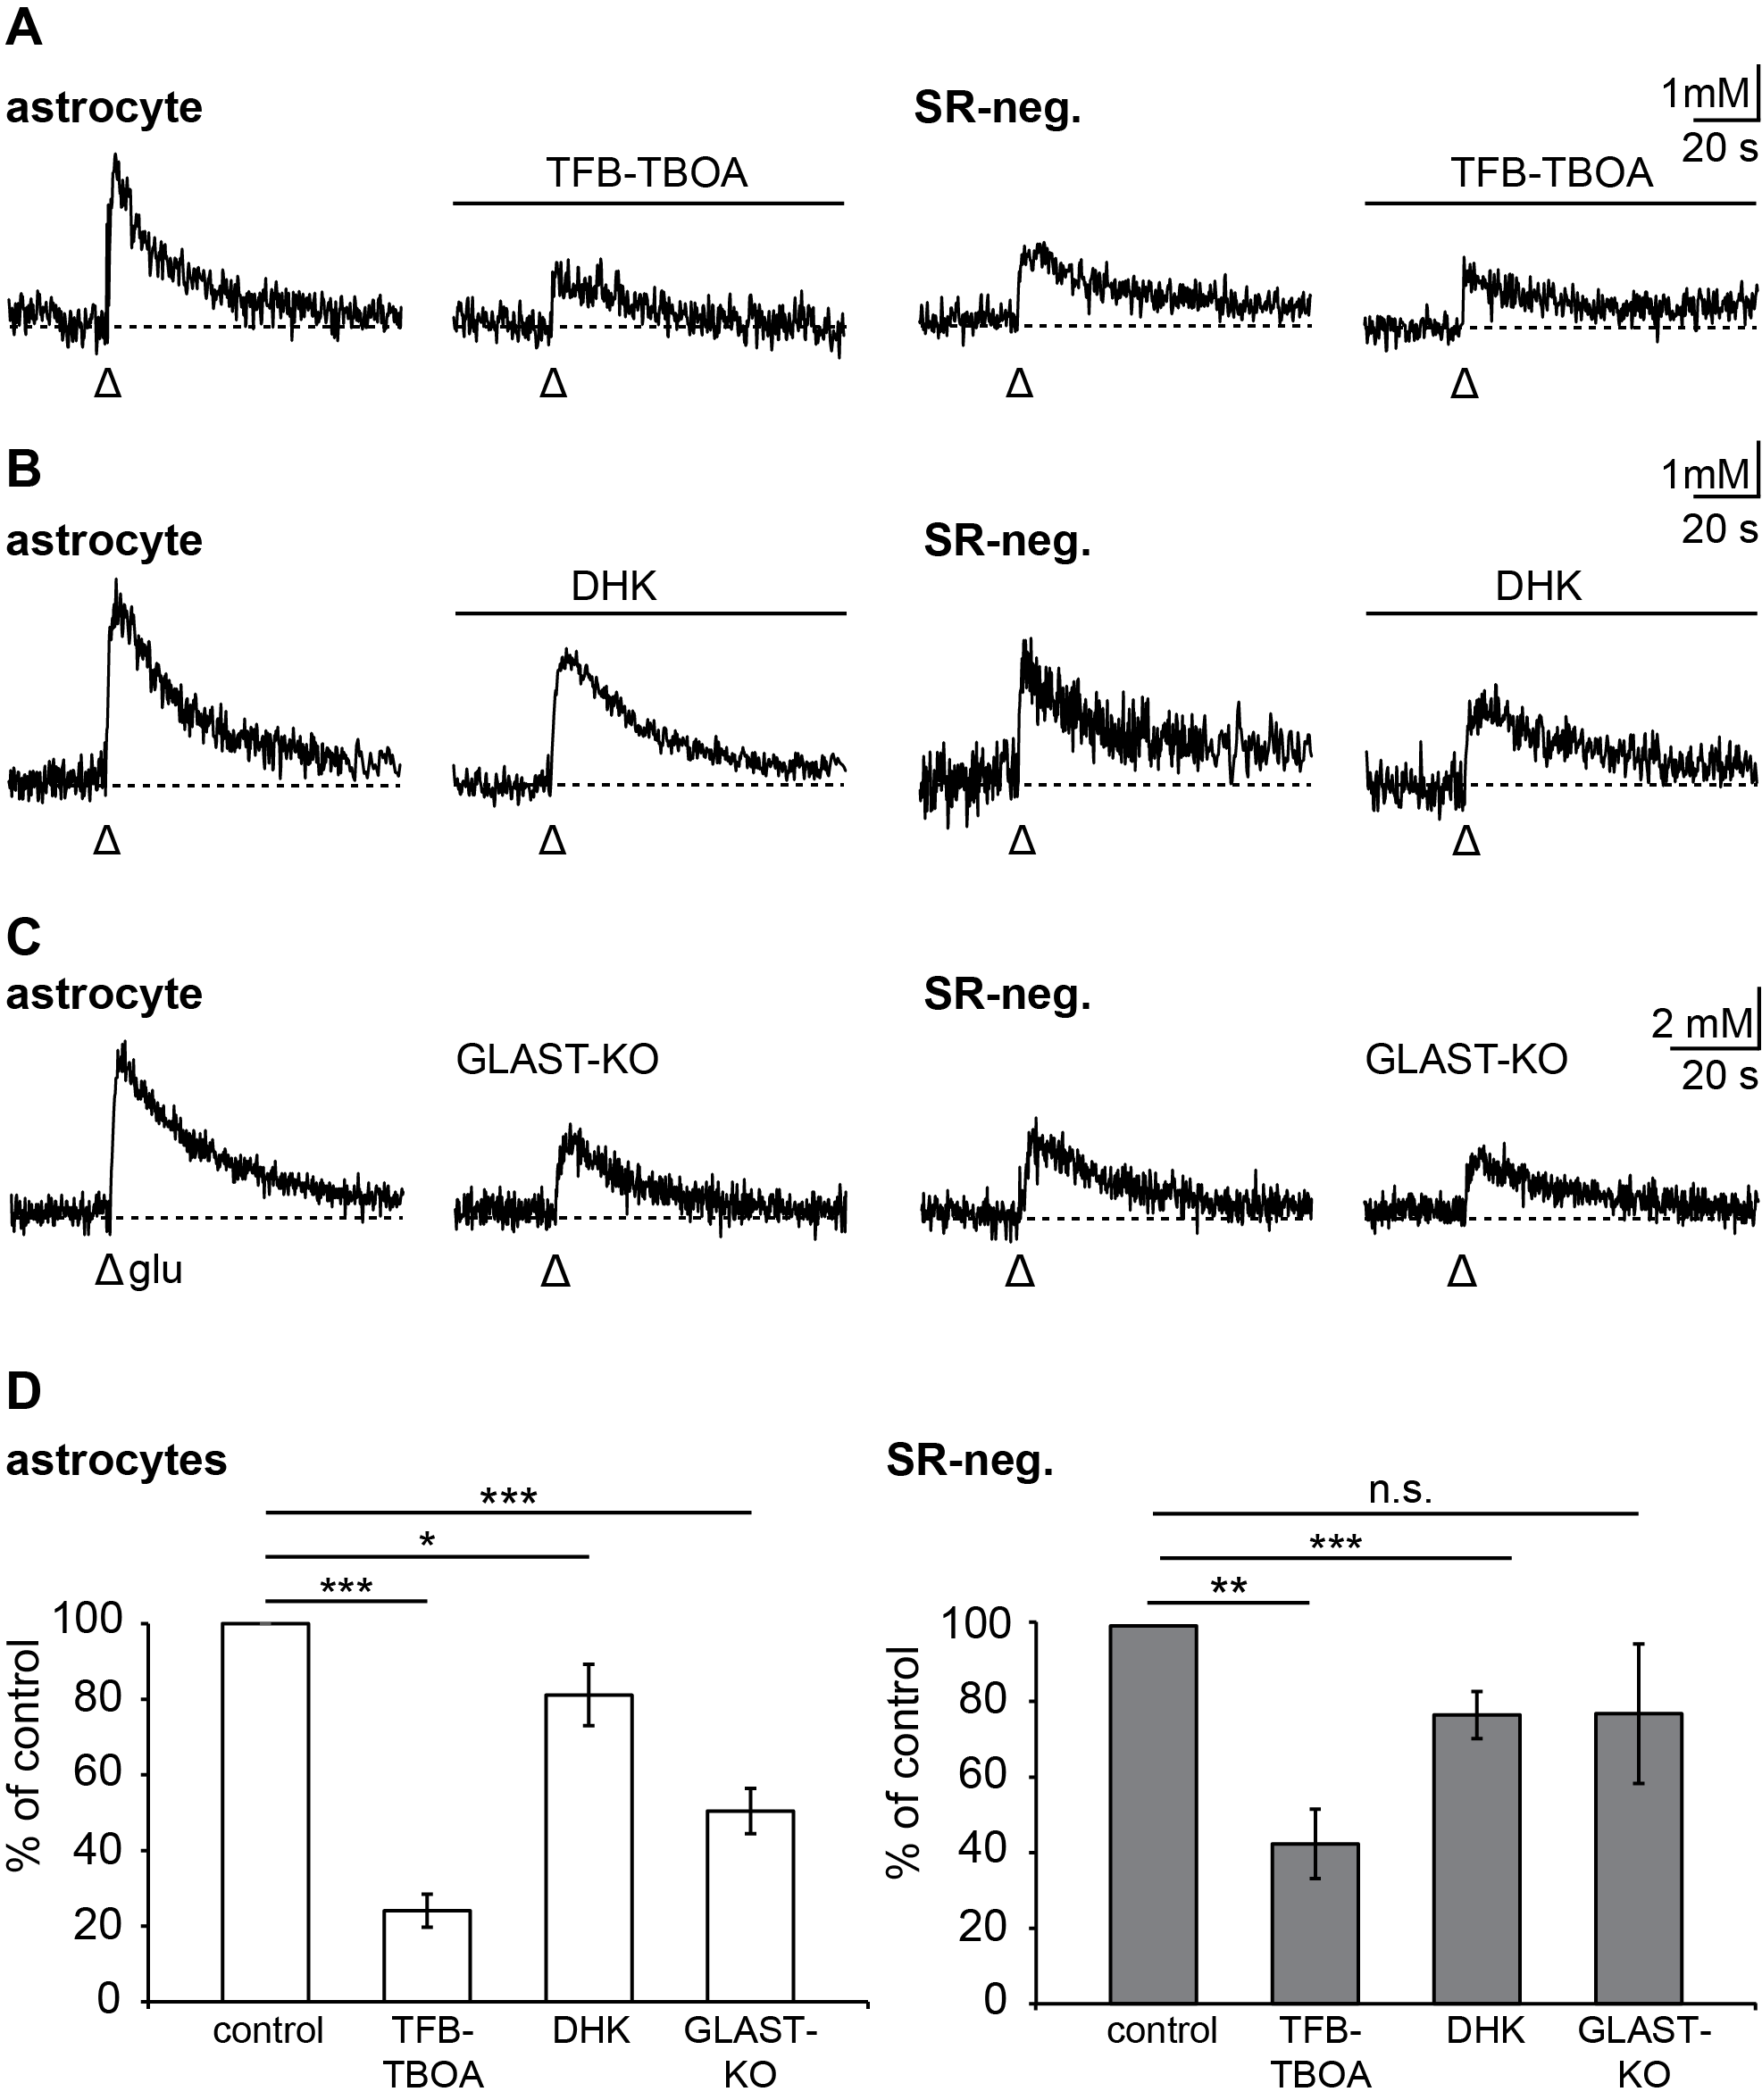
3.4. Relevance of Different Glutamate Transporter Subtypes

Grey matter astrocytes express two different subtypes of sodium-dependent glutamate transporters, GLT-1 and GLAST, with the former being dominant after the first postnatal week [8,9,43]. To address the specific involvement of GLAST and GLT-1 in the generation of sodium signals in macroglia of the corpus callosum, we studied the effect of different pharmacological blockers on sodium transients evoked by puff application of glutamate (1 mM/250 ms). Under control conditions (N = 15), this caused transient increase in sodium by 4.5 ± 0.3 mM in astrocytes (n = 71) and by 1.8 ± 0.1 mM in SR101-negative cells (n = 66) (Figure 5A–C).
We first applied the non-transported, competitive inhibitor TFB-TBOA (1 µM), which blocks both transporter subtypes [44]. In the presence of this blocker, the amplitude of glutamate-induced sodium transients in astrocytes was reduced to 24.1 ± 4.7% (n = 14, N = 4) as compared to control (Figure 5A,D). In SR101-negative cells, TFB-TBOA reduced the amplitude of sodium signals to 42.3 ± 9.2% (n = 16, N = 4) relative to control (Figure 5A,D). In another set of experiments, dihydrokainate (DHK, 100 µM), a GLT1-specific antagonist, was applied (N = 7). Dihydrokainate reduced the peak amplitude of sodium transients in astrocytes to 81.1 ± 8.1% (n = 30) of respective control. In SR101-negative cells, sodium transients were reduced to 76.4 ± 6.2% (n = 28) of control (Figure 5B,D).
In addition, we performed experiments in brain slices taken from GLAST-k.o. animals [37] (N = 6). Here, glutamate application induced sodium increases by 2.3 ± 0.3 mM in astrocytes (n = 20) and by 1.4 ± 0.3 mM (n = 33) in SR101-negative cells (Figure 5C,D). Compared to the mean peak amplitude of control experiments performed in wild type astrocytes as presented above, amplitudes were thus significantly reduced to 50.5 ± 6%. In SR101-negative cells, peak amplitudes were not significantly different between wild type controls and GLAST-k.o. animals (Figure 5D).
Taken together, these results show that sodium-dependent glutamate transport is a major pathway involved in the generation of glutamate-induced sodium signals in astrocytes as well as SR101-negative macroglial cells of the corpus callosum. Moreover, our data suggest that both glial transporter subtypes, GLT-1 and GLAST, contribute to glutamate-induced sodium influx.

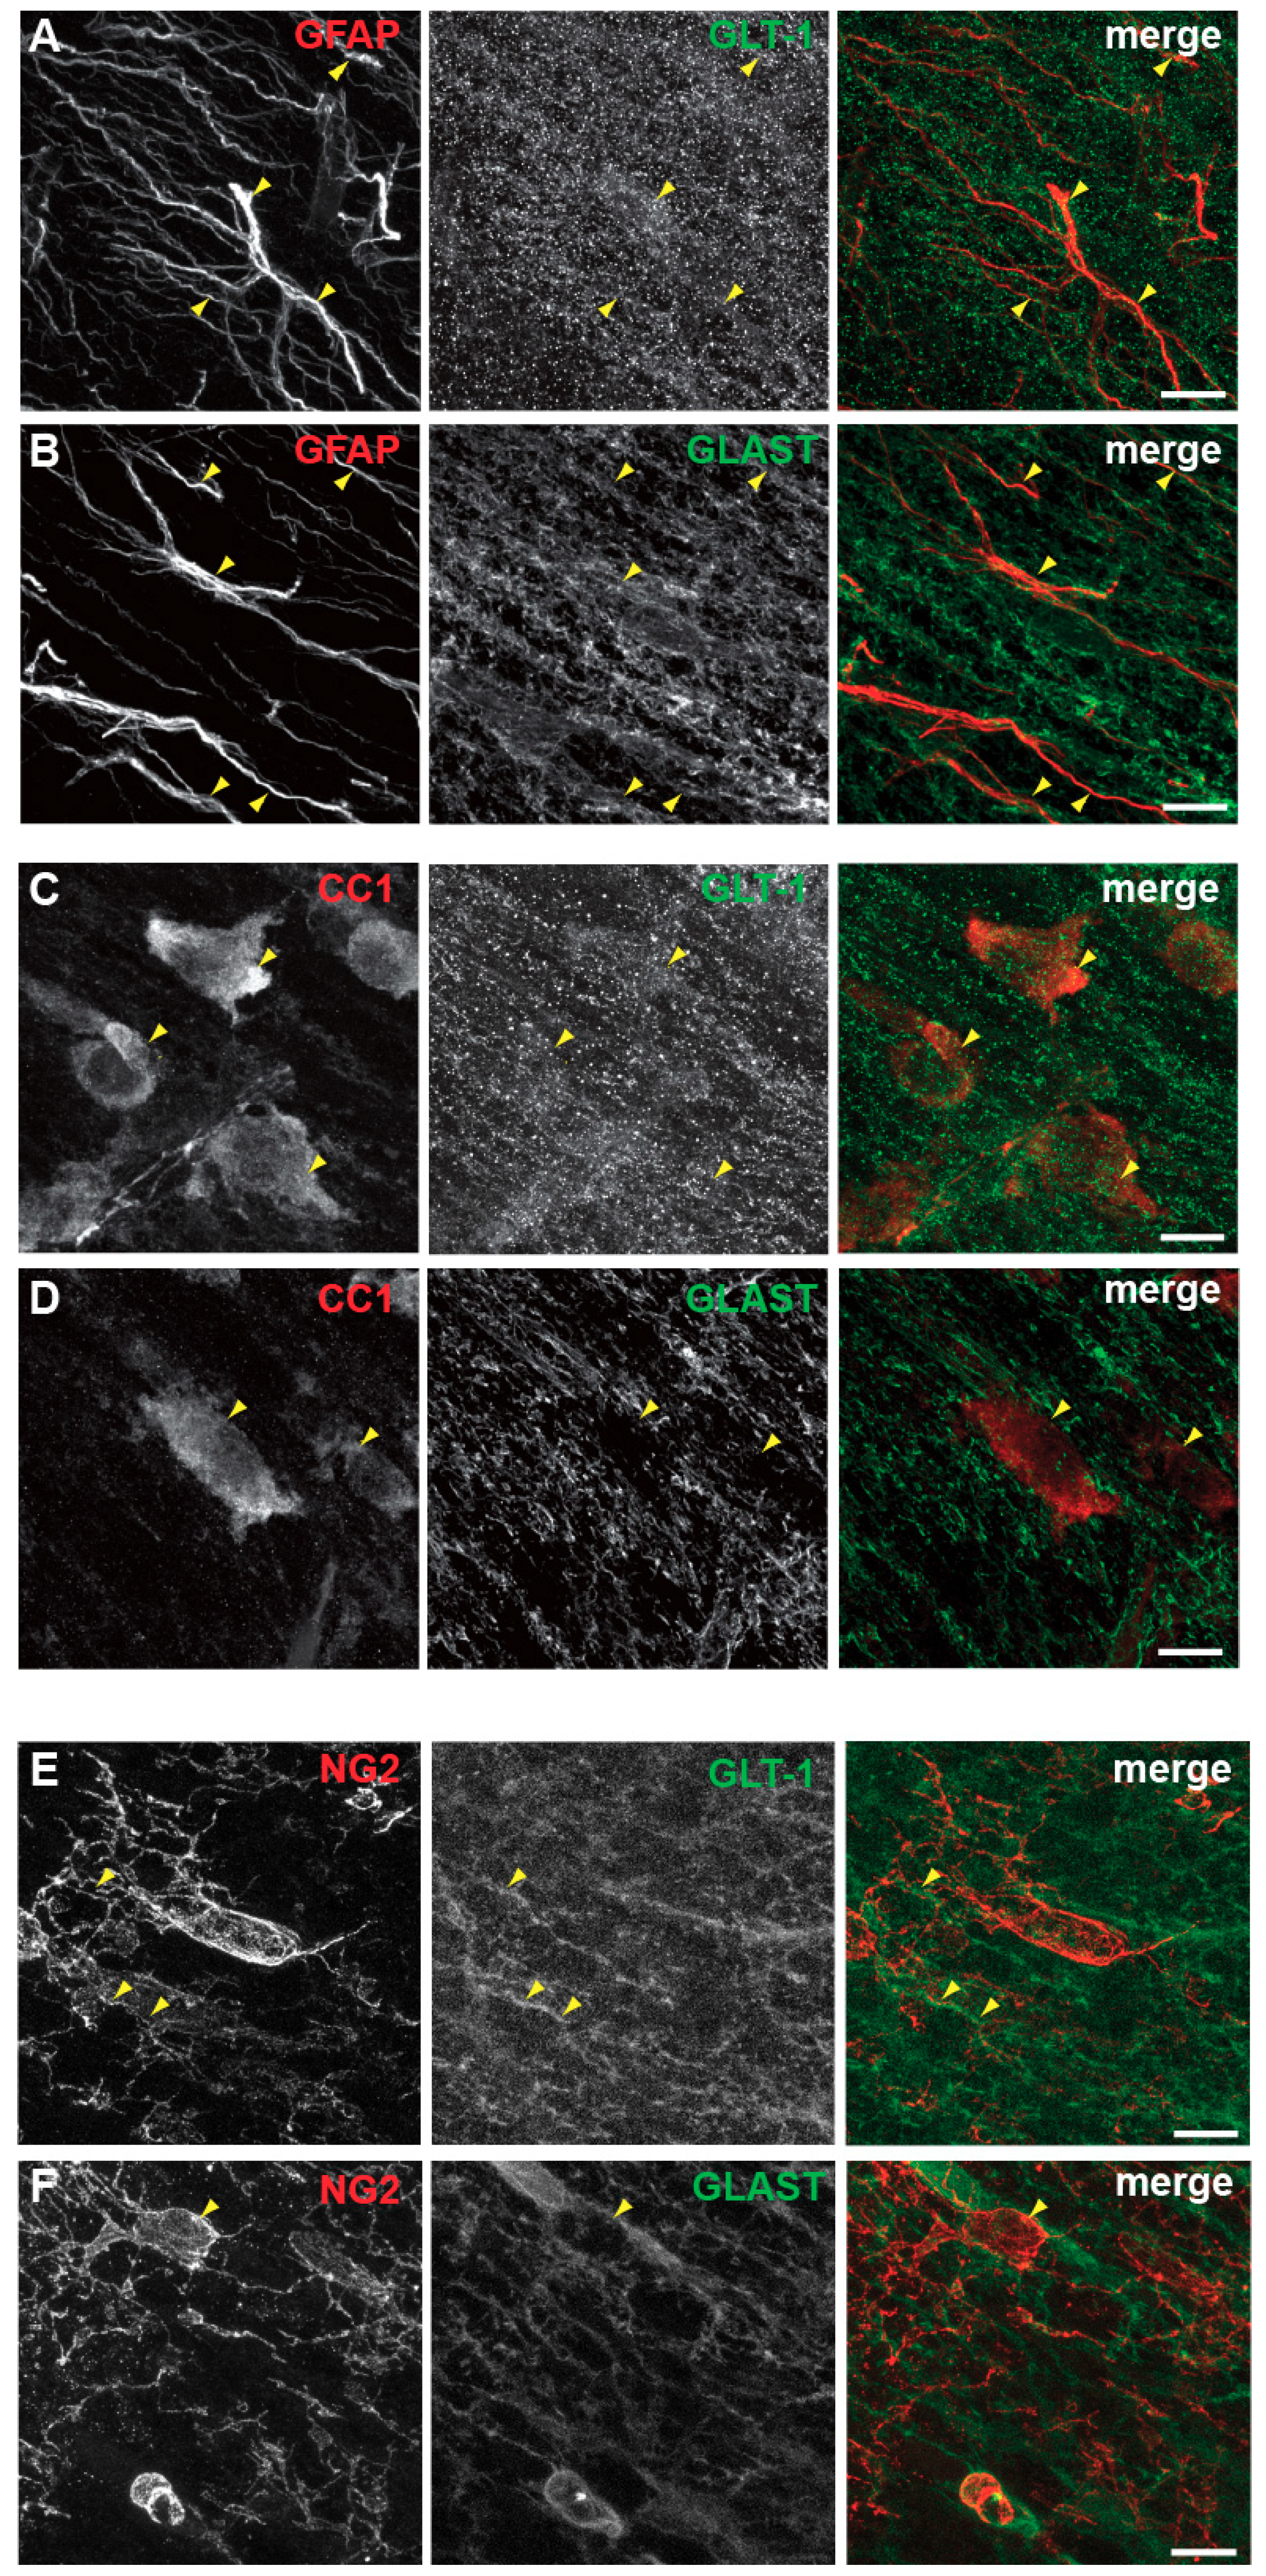
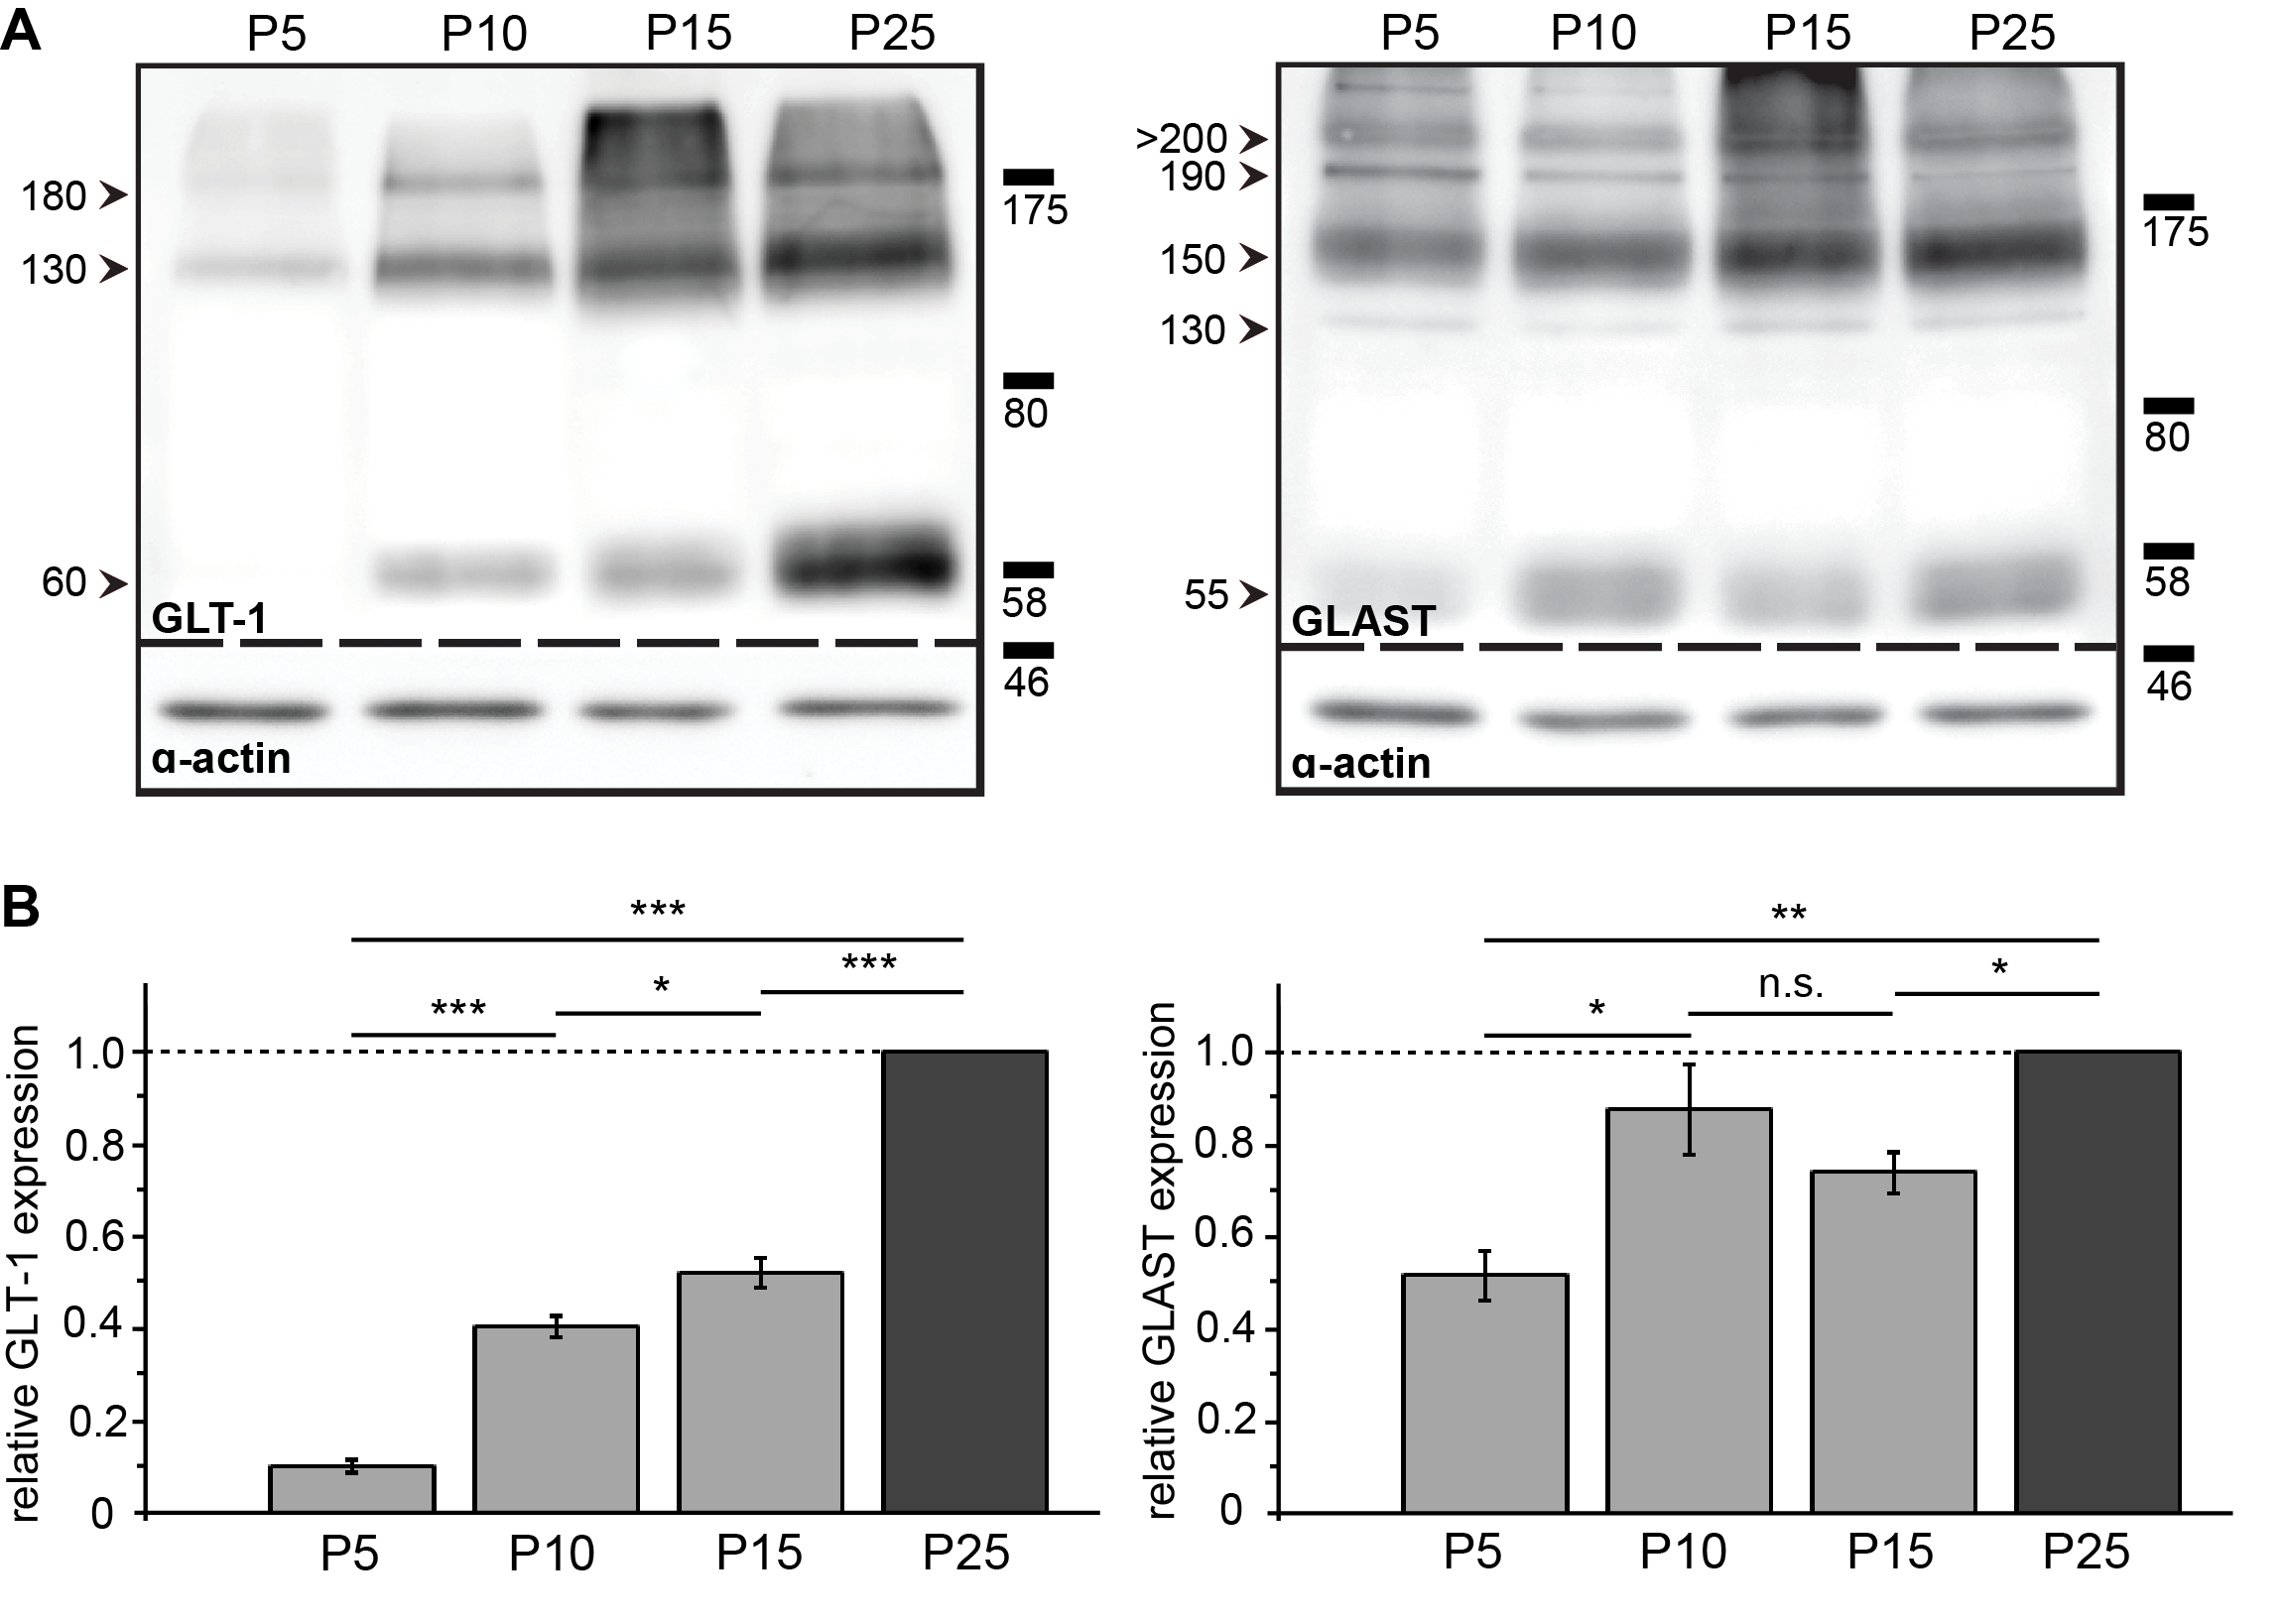
3.5. Spatial and Developmental Expression Profile of Glutamate-Aspartate-Transporter and Glutamate Transporter-1 in Corpus Callosum

Our results indicated that activation of the glutamate transporter subtypes GLT-1 and GLAST is involved in sodium influx in response to AP generation in macroglial cells. To study GLT-1 and GLAST expression at the protein level, we performed immunohistochemical stainings and immunoblotting of corpus callosum tissue.
For immunohistochemistry, tissue slices of corpus callosum, taken from mice at postnatal day 15–17, were labelled with antibodies targeting the astrocyte intermediate filament GFAP. Figure 6A,B illustrate the typical staining pattern of GFAP in white matter tracts, consisting of elongated fibres presumably running in parallel to axonal tracts. CC-1 antibodies were used to visualize the oligodendrocytic protein adenomatous polyposis coli (APC). CC-1 immunoreactivity showed the typical labelling of oligodendrocyte somata without labelling myelin (Figure 6C,D). Antibodies for NG2 proteoglycan were used to label NG2 glia. NG2 immunoreactivity resulted in plasma membrane labelling as shown in Figure 6E,F. Double labelling for GLT-1 (Figure 6A,C,E) or GLAST (Figure 6B,D,F) resulted in punctate labelling patterns for both transporters, which partially co-localized with GFAP, CC-1, and NG2-positive structures.
In addition, we performed SDS-PAGE and Western blots of tissue dissected from corpus callosum of animals at different postnatal stages (P5, 10, 15, 25). For both GLT-1 and GLAST several distinct bands (60, 130, 180 kd and 55, 130, 150, 190 kd, respectively) were detected in all age groups most likely due to monomeric and multimeric fractions of the transporters (Figure 7A), confirming earlier studies indicating that both exist as homomultimers [45,46]. Numerical analysis of GLT-1 expression (60, 130, 180 kDa) revealed a steady increase in relative protein content during postnatal development (N = 4 per age group) as shown before for mouse hippocampus [43]. At the neonatal stage (P5), GLT-1 expression was low (10.4%) compared to P25 (100%). Its expression increased significantly at P10 (40.7%) and again at P15 (52.7%). In contrast, relative GLAST expression (55, 130, 150, 190 kDa) at P5 was already about half (51.5%) that of P25. While the GLAST protein expression level significantly rose from P5 to P10 (87.6%), there was no further significant increase at P15 (74.0%) as compared to P25 (N = 3 per age group) (Figure 7B). Again, this general expression profile was similar to that reported from early postnatal hippocampus [43].
These experiments clearly indicate that both GLT-1 and GLAST are expressed at the protein levels in the corpus callosum of mice during the first three weeks after birth. Both transporters show an increase in relative protein content between P5 and P25 that is similar to what was reported from hippocampus. However, the upregulation of GLT-1 expression appears to be slightly delayed when compared to GLAST, which already shows high expression levels in the neonatal corpus callosum.

4. Discussion

4.1. Action Potentials Induce Sodium Transients in White Matter Glial Cells That Are Related to Glutamate

In this study, we analysed activity-related intracellular sodium transients in mouse corpus callosum after injection of the chemical sodium indicator SBFI-AM into acutely isolated tissue slices. According to our previous work, this results in selective loading of the dye into macroglia, excluding microglial cells [25,30]. To separate between different subtypes of macroglia, astrocytes were additionally stained with the vital dye SR101 [38,47]. The population of SBFI-labelled SR101-negative cells, representing cells of the oligodendrocyte lineage, was further distinguished employing NG2 reporter mice [35], in which NG2 cells and mature oligodendrocytes of corpus callosum slices can be identified based on EYFP fluorescence [25]. Using these tools, we could demonstrate that the generation of APs is accompanied by sodium transients in all three main classes of macroglial cells, namely astrocytes, oligodendrocytes as well as NG2 glia in the corpus callosum.
Activity-related sodium transients are well described from astrocytes of different grey matter regions, including hippocampus, neocortex, cerebellar cortex and Calyx of Held [4,5,6,7,48,49]. They are mainly caused by activation of sodium-dependent glutamate transporters in response to presynaptic release of glutamate [10,12,50]. Knowledge on sodium signalling of cells of the oligodendrocyte lineage is sparse. Studies performed on cultured oligodendrocytes reported that application of glutamate or AMPA increases intracellular sodium [51,52]. In cultured NG2 cells, γ-aminobutyric acid (GABA) induced an elevation of intracellular sodium probably by opening non-inactivating sodium channels in response to GABA-mediated depolarization [53]. In addition, we recently described glutamate-induced sodium increases in corpus callosum oligodendrocytes and NG2 glia [25].
In our earlier study [25], we also showed that sodium can easily spread from astrocytes to both oligodendrocytes and NG2 cells and that this panglial spread of sodium depends on the presence of gap junctions composed of connexins 30 and 43. In the present study, application of glutamate in slices obtained from animals lacking connexins 30 and 43 in astrocytes induced prominent sodium transients in astrocytes and also in SR101-negative cells. This strongly suggests that glutamate directly acted on both cell types, namely on astrocytes and cells of the oligodendrocyte lineage. Glutamate-induced sodium signalling thus seems to be a widespread property of different macroglial cells of grey as well as of white matter.
As mentioned above, activity-induced sodium transients, resulting from synaptic release of glutamate and subsequent transporter-mediated uptake into glial cells, are well known from grey matter. Our data now show that macroglial cells also undergo activity-related sodium transients in the corpus callosum, that is in the absence of classical chemical synapses and presynaptic glutamate release. In this context it is worth mentioning that our stimulation protocol was relatively moderate, comprising only 25 pulses within 0.5 s. We thus assume that the stimulation resulted in a maximum of 25 APs fired at 50 Hz. Action potential-induced sodium increases in corpus callosum macroglial cells were strongly reduced by combined inhibition of glutamate receptors and glutamate transport, indicating that they are largely related to release of glutamate. This is in line with numerous earlier reports suggesting that active axons release glutamate into the periaxonal space (e.g., [16,17,18,19,26]). In addition, there is evidence that glutamate is also released by astrocytes [19].
Interestingly, while AP-induced sodium signals were of similar amplitude in astrocytes and in SR101-negative cells, sodium transients induced by direct pressure application of glutamate were significantly larger in astrocytes as compared to SR101-negative macroglia. The latter observation confirms data obtained in our earlier study [25]. A likely reason for this disparity is the different spatial relationship between the sources of glutamate (axonal versus external pipette) and the distribution of glutamate receptors/transporters on macroglial cells. Axonal glutamate release will most likely reach receptors/transporters on the innermost layer of myelin facing the axonal membrane directly and may less efficiently escape at nodes of Ranvier to activate receptors on nearby astrocytes. Applying glutamate by a pipette will probably activate receptors/transporters on astrocytes efficiently, whereas it may not fully reach those underneath the myelin sheath.
While our measurements enabled detection of activity-related sodium transients in white matter astrocytes, oligodendrocytes as well as NG2 cells, axonal fibres were not visible with the experimental approach employed. Action potential generation in axons obviously depends on the opening of voltage-gated sodium channels and it was indeed shown that this results in prominent transient elevation in intra-axonal sodium concentrations in different central neurons [54,55,56,57]. It is therefore probably safe to assume that AP generation also caused sodium transients in axonal fibres of corpus callosum. Finally, sodium influx into neuronal and glial compartments will most likely be accompanied by a transient decrease in extracellular sodium as shown e.g., for cortex [58].

4.2. Relevance of Different Sodium Influx Pathways

In the present study, perfusing slices with NBQX reduced the peak amplitude of AP-induced sodium transients by 30–40% in astrocytes, oligodendrocytes and NG2 cells. This indicates that activation of AMPA receptors in response to AP-related release of glutamate provides a prominent pathway for sodium influx into all three types of macroglial cells in corpus callosum. Moreover, sodium influx into oligodendrocytes and NG2 glia was significantly reduced upon additional pharmacological inhibition of NMDA receptors. This in in line with earlier reports describing expression of ionotropic glutamate receptors in white matter glia [26,27]. White matter astrocytes, in addition to ionotropic glutamate receptors, express a wide variety of different other transmitter receptors, most notably ionotropic P2X7 purinoceptors [28,29]. The latter, activated by axonal release of ATP, might represent a further influx pathway for sodium into astrocytes [28].
Like astrocytes in white matter, cells of the oligodendrocytic lineage express different glutamate receptors, including ionotropic AMPA and NMDA receptors, which are activated in response to AP firing [59,60,61,62,63]. For example, it was shown that glutamate released by axons is sensed by AMPA receptors on oligodendrocyte precursor (NG2) cells, which influences their proliferation and differentiation [17,19,32,64,65,66]. There is also firm evidence that glutamate derived from active axons is sensed by AMPA and NMDA receptors expressed on the surrounding myelin sheath, resulting in calcium signals proposed to play a central role in coupling axonal activity and integrity with oligodendrocyte metabolism and driving formation of myelin [67,68,69,70,71,72]. Metabolic support of axons was moreover suggested to be provided by astrocytes, which break down glycogen and release lactate into the extracellular space that can then be taken up by axons during periods of high energy demand [73,74].
Our data in addition demonstrate a significant contribution of high-affinity glutamate uptake to AP-related sodium signals in astrocytes, oligodendrocytes as well as NG2 cells, suggesting that glutamate transporters are activated upon AP propagation in the corpus callosum. These results are thus in line with earlier reports showing expression of different subtypes of glutamate transporters in white matter [21,22,23,24,75,76]. To address the involvement of glutamate transporter subtypes GLT-1 and GLAST, we performed immunohistochemical stainings and immunoblotting, demonstrating expression of both transporters at the protein level during the first three weeks after birth in corpus callosum. Their expression levels increased between P5 and P25, which is similar to hippocampus and neocortex [43,77].
We also tested the effect of DHK, a selective pharmacological inhibitor of GLT-1, on glutamate-induced sodium signals. DHK resulted in a significant reduction of sodium increases in both astrocytes and cells of the oligodendrocyte lineage, indicating that this subtype is functionally relevant for both groups. Moreover, in GLAST-k.o. animals, glutamate-induced sodium signals were significantly altered in astrocytes as compared to wild type controls. In contrast, sodium signals were unaltered in cells of the oligodendrocyte lineage in animals lacking GLAST, suggesting that GLAST is not ultimately required for efficient uptake of glutamate in SR101-negative cells. This in in agreement with studies demonstrating that glutamate uptake in white matter oligodendrocytes additionally involves excitatory amino acid carrier 1 (EAAC1) [24,76].

5. Conclusions

Our study establishes that the propagation of APs in the corpus callosum, a major white matter tract, generates transient sodium elevations in macroglial cells. While many studies have demonstrated the existence of glial calcium signalling in white matter [26,27], activity-related sodium signalling has, to the best of our knowledge, not been reported so far. Interestingly, sodium transients in astrocytes and cells of the oligodendrocyte lineage shared many characteristics. Their amplitudes and time courses were rather similar, and the majority of sodium influx was mediated by glutamate-related pathways, namely ionotropic receptors and high-affinity glutamate transport. The only essential differences found were the apparent involvement of GLAST in astrocytes, but not in cells of the oligodendrocyte lineage, and the contribution of NMDA receptors to sodium signals of the latter, but not the former group of cells. Along with these considerations, it is important to keep in mind that measurements in the present study were taken from somata and that signal properties as well as sodium influx pathways might be different in cellular processes and in myelin compartments.
At present, we can only speculate about the possible functional relevance of macroglial sodium signals in white matter. In general, it is of note that glial calcium and sodium signals share a common influx pathway, namely inotropic glutamate receptors, emphasizing the involvement of the latter in the communication between axons and surrounding glia. Sodium elevations are additionally augmented by high-affinity glutamate uptake, which is not directly involved in the generation of calcium signalling. In grey matter, activity-related sodium signals induced upon activation of glutamate transport were suggested to stimulate astrocyte glycolysis and lactate release, thereby representing important mediators of metabolic interaction between neurons and glial cells [10,11]. In analogy, they might also drive lactate production in white matter oligodendrocytes and astrocytes and thereby be involved in metabolic support of axons by both cell types [74,78,79].
Several studies have correlated sodium elevations with migration, proliferation and differentiation of oligodendrocyte precursor cells. Direct modulation of K+ channels by sodium influx resulting from activation of AMPA receptors was shown to inhibit proliferation of oligodendrocyte precursor cells [64,80,81,82]. In rat oligodendrocytes in culture, stimulating sodium-dependent glutamate uptake was associated with intracellular calcium signals most likely based on reverse mode NCX activity, which promoted their morphological differentiation [83]. Increased sodium and resulting reverse NCX activity were also found to promote synthesis of myelin basic protein in mouse oligodendrocyte precursor cells in culture [84]. Finally, NCX-mediated calcium signalling promoted by a persistent sodium current was involved in the migration of NG2 cells during early brain development [53].
Sodium transients induced in astrocytes and cells of the oligodendrocyte lineage by propagating APs along axonal fibre tracts might thus exert a role in the metabolic support of axons. In addition, they might promote the establishment of a compact myelin sheath. Activity-related sodium signalling in white matter macroglia is therefore likely to represent an essential component in the communication between axons and surrounding glia.

Author Contributions

Conceptualization and supervision of experimental work: C.R.R.; Experimental work and primary data analysis, B.M.-R., D.Z., N.P., M.F.; Figure preparation, B.M.-R., D.Z., N.P., M.F., C.R.R.; Writing of original text version, B.M.-R., C.R.R.; Writing of final text version: C.R.R., Final editing and approval of text, B.M.-R., D.Z., N.P., M.F., C.R.R., Project administration: C.R.R., Funding acquisition: C.R.R.

Funding

This research was funded by the Deutsche Forschungsgemeinschaft (DFG), Special Priority Programme 1757 (“glial heterogeneity”), grant number Ro2327/8-2.

Acknowledgments

We thank the following colleagues for providing transgenic animals: Gerald Seifert and Christian Steinhäuser, University of Bonn, Germany (Cx-k.o.), Nikolaj Klöcker, Heinrich Heine University Düsseldorf, Germany (NG2-EYFP), and Christoph Fahlke and Verena Untiet, Forschungszentrum Jülich, Germany (GLAST-k.o). We thank Ulrich Rüther, Heinrich Heine University Düsseldorf, Germany, for support in the densitometric analysis of immunoblots.

Conflicts of Interest

The authors declare no conflict of interest.

References

  1. Rose, C.R.; Verkhratsky, A. Principles of sodium homeostasis and sodium signalling in astroglia. Glia 2016, 64, 1611–1627. [Google Scholar] [CrossRef] [PubMed]
  2. Kirischuk, S.; Heja, L.; Kardos, J.; Billups, B. Astrocyte sodium signaling and the regulation of neurotransmission. Glia 2016, 64, 1655–1666. [Google Scholar] [CrossRef] [PubMed]
  3. Chatton, J.Y.; Marquet, P.; Magistretti, P.J. A quantitative analysis of l-glutamate-regulated Na+ dynamics in mouse cortical astrocytes: Implications for cellular bioenergetics. Eur. J. Neurosci. 2000, 12, 3843–3853. [Google Scholar] [CrossRef] [PubMed]
  4. Langer, J.; Rose, C.R. Synaptically induced sodium signals in hippocampal astrocytes in situ. J. Physiol. 2009, 587, 5859–5877. [Google Scholar] [CrossRef] [PubMed]
  5. Kirischuk, S.; Kettenmann, H.; Verkhratsky, A. Membrane currents and cytoplasmic sodium transients generated by glutamate transport in bergmann glial cells. Pflugers Arch. 2007, 454, 245–252. [Google Scholar] [CrossRef] [PubMed]
  6. Bennay, M.; Langer, J.; Meier, S.D.; Kafitz, K.W.; Rose, C.R. Sodium signals in cerebellar Purkinje neurons and Bergmann glial cells evoked by glutamatergic synaptic transmission. Glia 2008, 56, 1138–1149. [Google Scholar] [CrossRef] [PubMed]
  7. Karus, C.; Mondragao, M.A.; Ziemens, D.; Rose, C.R. Astrocytes restrict discharge duration and neuronal sodium loads during recurrent network activity. Glia 2015, 63, 936–957. [Google Scholar] [CrossRef] [PubMed]
  8. Danbolt, N.C. Glutamate uptake. Prog. Neurobiol. 2001, 65, 1–105. [Google Scholar] [CrossRef]
  9. Rose, C.R.; Ziemens, D.; Untiet, V.; Fahlke, C. Molecular and cellular physiology of sodium-dependent glutamate transporters. Brain Res. Bull. 2018, 136, 13–16. [Google Scholar] [CrossRef] [PubMed]
  10. Chatton, J.Y.; Magistretti, P.J.; Barros, L.F. Sodium signaling and astrocyte energy metabolism. Glia 2016, 64, 1667–1676. [Google Scholar] [CrossRef] [PubMed] [Green Version]
  11. Magistretti, P.J.; Allaman, I. Lactate in the brain: From metabolic end-product to signalling molecule. Nat. Rev. Neurosci. 2018, 19, 235–249. [Google Scholar] [CrossRef] [PubMed]
  12. Kirischuk, S.; Parpura, V.; Verkhratsky, A. Sodium dynamics: Another key to astroglial excitability? Trends Neurosci. 2012, 35, 497–506. [Google Scholar] [CrossRef] [PubMed]
  13. Parpura, V.; Sekler, I.; Fern, R. Plasmalemmal and mitochondrial Na+-Ca2+ exchange in neuroglia. Glia 2016, 64, 1646–1654. [Google Scholar] [CrossRef] [PubMed]
  14. Jackson, J.G.; O’Donnell, J.C.; Takano, H.; Coulter, D.A.; Robinson, M.B. Neuronal activity and glutamate uptake decrease mitochondrial mobility in astrocytes and position mitochondria near glutamate transporters. J. Neurosci. 2014, 34, 1613–1624. [Google Scholar] [CrossRef] [PubMed]
  15. Gerkau, N.J.; Rakers, C.; Durry, S.; Petzold, G.; Rose, C.R. Reverse NCX attenuates cellular sodium loading in metabolically compromised cortex. Cereb. Cortex 2017, 1–7. [Google Scholar] [CrossRef] [PubMed]
  16. Kukley, M.; Capetillo-Zarate, E.; Dietrich, D. Vesicular glutamate release from axons in white matter. Nat. Neurosci. 2007, 10, 311–320. [Google Scholar] [CrossRef] [PubMed]
  17. Ziskin, J.L.; Nishiyama, A.; Rubio, M.; Fukaya, M.; Bergles, D.E. Vesicular release of glutamate from unmyelinated axons in white matter. Nat. Neurosci. 2007, 10, 321–330. [Google Scholar] [CrossRef] [PubMed] [Green Version]
  18. Fruhbeis, C.; Frohlich, D.; Kuo, W.P.; Amphornrat, J.; Thilemann, S.; Saab, A.S.; Kirchhoff, F.; Mobius, W.; Goebbels, S.; Nave, K.A.; et al. Neurotransmitter-triggered transfer of exosomes mediates oligodendrocyte-neuron communication. PLoS Biol. 2013, 11, e1001604. [Google Scholar] [CrossRef] [PubMed]
  19. Hamilton, N.; Vayro, S.; Wigley, R.; Butt, A.M. Axons and astrocytes release ATP and glutamate to evoke calcium signals in NG2-glia. Glia 2010, 58, 66–79. [Google Scholar] [CrossRef] [PubMed]
  20. Fern, R.F.; Matute, C.; Stys, P.K. White matter injury: Ischemic and nonischemic. Glia 2014, 62, 1780–1789. [Google Scholar] [CrossRef] [PubMed]
  21. Domercq, M.; Matute, C. Expression of glutamate transporters in the adult bovine corpus callosum. Brain Res. Mol. Brain Res. 1999, 67, 296–302. [Google Scholar] [CrossRef]
  22. Goursaud, S.; Kozlova, E.N.; Maloteaux, J.M.; Hermans, E. Cultured astrocytes derived from corpus callosum or cortical grey matter show distinct glutamate handling properties. J. Neurochem. 2009, 108, 1442–1452. [Google Scholar] [CrossRef] [PubMed]
  23. Lundgaard, I.; Osorio, M.J.; Kress, B.T.; Sanggaard, S.; Nedergaard, M. White matter astrocytes in health and disease. Neuroscience 2014, 276, 161–173. [Google Scholar] [CrossRef] [PubMed] [Green Version]
  24. Arranz, A.M.; Hussein, A.; Alix, J.J.; Perez-Cerda, F.; Allcock, N.; Matute, C.; Fern, R. Functional glutamate transport in rodent optic nerve axons and glia. Glia 2008, 56, 1353–1367. [Google Scholar] [CrossRef] [PubMed] [Green Version]
  25. Moshrefi-Ravasdjani, B.; Hammel, E.L.; Kafitz, K.W.; Rose, C.R. Astrocyte sodium signalling and panglial spread of sodium signals in brain white matter. Neurochem. Res. 2017, 42, 2505–2518. [Google Scholar] [CrossRef] [PubMed]
  26. Butt, A.M.; Fern, R.F.; Matute, C. Neurotransmitter signaling in white matter. Glia 2014, 62, 1762–1779. [Google Scholar] [CrossRef] [PubMed] [Green Version]
  27. Micu, I.; Plemel, J.R.; Caprariello, A.V.; Nave, K.A.; Stys, P.K. Axo-myelinic neurotransmission: A novel mode of cell signalling in the central nervous system. Nat. Rev. Neurosci. 2018, 19, 49–58. [Google Scholar] [CrossRef] [PubMed]
  28. Hamilton, N.; Vayro, S.; Kirchhoff, F.; Verkhratsky, A.; Robbins, J.; Gorecki, D.C.; Butt, A.M. Mechanisms of ATP- and glutamate-mediated calcium signaling in white matter astrocytes. Glia 2008, 56, 734–749. [Google Scholar] [CrossRef] [PubMed]
  29. Bernstein, M.; Lyons, S.A.; Moller, T.; Kettenmann, H. Receptor-mediated calcium signalling in glial cells from mouse corpus callosum slices. J. Neurosci. Res. 1996, 46, 152–163. [Google Scholar] [CrossRef]
  30. Schipke, C.G.; Boucsein, C.; Ohlemeyer, C.; Kirchhoff, F.; Kettenmann, H. Astrocyte Ca2+ waves trigger responses in microglial cells in brain slices. FASEB J. 2002, 16, 255–257. [Google Scholar] [CrossRef] [PubMed]
  31. Hamilton, N.; Hubbard, P.S.; Butt, A.M. Effects of glutamate receptor activation on NG2-glia in the rat optic nerve. J. Anat. 2009, 214, 208–218. [Google Scholar] [CrossRef] [PubMed] [Green Version]
  32. Bergles, D.E.; Jabs, R.; Steinhäuser, C. Neuron-glia synapses in the brain. Brain Res. Rev. 2010, 63, 130–137. [Google Scholar] [CrossRef] [PubMed] [Green Version]
  33. Dimou, L.; Gallo, V. NG2-glia and their functions in the central nervous system. Glia 2015, 63, 1429–1451. [Google Scholar] [CrossRef] [PubMed] [Green Version]
  34. Close, B.; Banister, K.; Baumans, V.; Bernoth, E.M.; Bromage, N.; Bunyan, J.; Erhardt, W.; Flecknell, P.; Gregory, N.; Hackbarth, H.; et al. Recommendations for euthanasia of experimental animals: Part 2. DGXT of the european commission. Lab. Anim. 1997, 31, 1–32. [Google Scholar] [CrossRef] [PubMed]
  35. Karram, K.; Goebbels, S.; Schwab, M.; Jennissen, K.; Seifert, G.; Steinhauser, C.; Nave, K.A.; Trotter, J. NG2-expressing cells in the nervous system revealed by the NG2-EYFP-knockin mouse. Genesis 2008, 46, 743–757. [Google Scholar] [CrossRef] [PubMed]
  36. Wallraff, A.; Kohling, R.; Heinemann, U.; Theis, M.; Willecke, K.; Steinhauser, C. The impact of astrocytic gap junctional coupling on potassium buffering in the hippocampus. J. Neurosci. 2006, 26, 5438–5447. [Google Scholar] [CrossRef] [PubMed]
  37. Watase, K.; Hashimoto, K.; Kano, M.; Yamada, K.; Watanabe, M.; Inoue, Y.; Okuyama, S.; Sakagawa, T.; Ogawa, S.-i.; Kawashima, N.; et al. Motor discoordination and increased susceptibility to cerebellar injury in glast mutant mice. Eur. J. Neurosci. 1998, 10, 976–988. [Google Scholar] [CrossRef] [PubMed]
  38. Kafitz, K.W.; Meier, S.D.; Stephan, J.; Rose, C.R. Developmental profile and properties of sulforhodamine 101-labeled glial cells in acute brain slices of rat hippocampus. J. Neurosci. Methods 2008, 169, 84–92. [Google Scholar] [CrossRef] [PubMed]
  39. Meier, S.D.; Kovalchuk, Y.; Rose, C.R. Properties of the new fluorescent Na+ indicator corona green: Comparison with SBFI and confocal Na+ imaging. J. Neurosci. Methods 2006, 155, 251–259. [Google Scholar] [CrossRef] [PubMed]
  40. Langer, J.; Stephan, J.; Theis, M.; Rose, C.R. Gap junctions mediate intercellular spread of sodium between hippocampal astrocytes in situ. Glia 2012, 60, 239–252. [Google Scholar] [CrossRef] [PubMed]
  41. Towbin, H.; Staehelin, T.; Gordon, J. Electrophoretic transfer of proteins from polyacrylamide gels to nitrocellulose sheets: Procedure and some applications. Proc. Natl. Acad. Sci. USA 1979, 76, 4350–4354. [Google Scholar] [CrossRef] [PubMed]
  42. Burnette, W.N. “Western blotting”: Electrophoretic transfer of proteins from sodium dodecyl sulfate—Polyacrylamide gels to unmodified nitrocellulose and radiographic detection with antibody and radioiodinated protein a. Anal. Biochem. 1981, 112, 195–203. [Google Scholar] [CrossRef]
  43. Schreiner, A.E.; Durry, S.; Aida, T.; Stock, M.C.; Rüther, U.; Tanaka, K.; Rose, C.R.; Kafitz, K.W. Laminar and subcellular heterogeneity of GLAST and GLT-1 immunoreactivity in the developing postnatal mouse hippocampus. J. Comp. Neurol. 2014, 522, 204–224. [Google Scholar] [CrossRef] [PubMed]
  44. Tsukada, S.; Iino, M.; Takayasu, Y.; Shimamoto, K.; Ozawa, S. Effects of a novel glutamate transporter blocker, (2s, 3s)-3-[3-[4-(trifluoromethyl)benzoylamino]benzyloxy]aspartate (TFB-TBOA), on activities of hippocampal neurons. Neuropharmacology 2005, 48, 479–491. [Google Scholar] [CrossRef] [PubMed]
  45. Haugeto, O.; Ullensvang, K.; Levy, L.M.; Chaudhry, F.A.; Honore, T.; Nielsen, M.; Lehre, K.P.; Danbolt, N.C. Brain glutamate transporter proteins form homomultimers. J. Biol. Chem. 1996, 271, 27715–27722. [Google Scholar] [CrossRef] [PubMed]
  46. Peacey, E.; Miller, C.C.; Dunlop, J.; Rattray, M. The four major N- and C-terminal splice variants of the excitatory amino acid transporter GLT-1 form cell surface homomeric and heteromeric assemblies. Mol. Pharmacol. 2009, 75, 1062–1073. [Google Scholar] [CrossRef] [PubMed]
  47. Nimmerjahn, A.; Kirchhoff, F.; Kerr, J.N.; Helmchen, F. Sulforhodamine 101 as a specific marker of astroglia in the neocortex in vivo. Nat. Methods 2004, 1, 31–37. [Google Scholar] [CrossRef] [PubMed]
  48. Uwechue, N.M.; Marx, M.C.; Chevy, Q.; Billups, B. Activation of glutamate transport evokes rapid glutamine release from perisynaptic astrocytes. J. Physiol. 2012, 590, 2317–2331. [Google Scholar] [CrossRef] [PubMed]
  49. Lamy, C.M.; Chatton, J.Y. Optical probing of sodium dynamics in neurons and astrocytes. Neuroimage 2011, 58, 572–578. [Google Scholar] [CrossRef] [PubMed] [Green Version]
  50. Rose, C.R.; Chatton, J.Y. Astrocyte sodium signaling and neuro-metabolic coupling in the brain. Neuroscience 2016, 323, 121–134. [Google Scholar] [CrossRef] [PubMed]
  51. Ballanyi, K.; Kettenmann, H. Intracellular Na+ activity in cultured mouse oligodendrocytes. J. Neurosci. Res. 1990, 26, 455–460. [Google Scholar] [CrossRef] [PubMed]
  52. Chen, H.; Kintner, D.B.; Jones, M.; Matsuda, T.; Baba, A.; Kiedrowski, L.; Sun, D. Ampa-mediated excitotoxicity in oligodendrocytes: Role for Na+-K+-Cl- co-transport and reversal of Na+/Ca2+ exchanger. J. Neurochem. 2007, 102, 1783–1795. [Google Scholar] [CrossRef] [PubMed]
  53. Tong, X.P.; Li, X.Y.; Zhou, B.; Shen, W.; Zhang, Z.J.; Xu, T.L.; Duan, S. Ca2+ signaling evoked by activation of Na+ channels and Na+/Ca2+ exchangers is required for GABA-induced NG2 cell migration. J. Cell Biol. 2009, 186, 113–128. [Google Scholar] [CrossRef] [PubMed]
  54. Baranauskas, G.; David, Y.; Fleidervish, I.A. Spatial mismatch between the Na+ flux and spike initiation in axon initial segment. Proc. Natl. Acad. Sci. USA 2013, 110, 4051–4056. [Google Scholar] [CrossRef] [PubMed]
  55. Miyazaki, K.; Ross, W.N. Simultaneous sodium and calcium imaging from dendrites and axons. eNeuro 2015, 2. [Google Scholar] [CrossRef] [PubMed]
  56. Ona-Jodar, T.; Gerkau, N.J.; Sara Aghvami, S.; Rose, C.R.; Egger, V. Two-photon Na+ imaging reports somatically evoked action potentials in rat olfactory bulb mitral and granule cell neurites. Front. Cell. Neurosci. 2017, 11, 50. [Google Scholar] [CrossRef] [PubMed]
  57. Kole, M.H.; Ilschner, S.U.; Kampa, B.M.; Williams, S.R.; Ruben, P.C.; Stuart, G.J. Action potential generation requires a high sodium channel density in the axon initial segment. Nat. Neurosci. 2008, 11, 178–186. [Google Scholar] [CrossRef] [PubMed]
  58. Dietzel, I.; Heinemann, U.; Hofmeier, G.; Lux, H.D. Stimulus-induced changes in extracellular Na+ and Cl- concentration in relation to changes in the size of the extracellular space. Exp. Brain Res. 1982, 46, 73–84. [Google Scholar] [CrossRef] [PubMed]
  59. Deng, W.; Rosenberg, P.A.; Volpe, J.J.; Jensen, F.E. Calcium-permeable AMPA/kainate receptors mediate toxicity and preconditioning by oxygen-glucose deprivation in oligodendrocyte precursors. Proc. Natl. Acad. Sci. USA 2003, 100, 6801–6806. [Google Scholar] [CrossRef] [PubMed] [Green Version]
  60. Karadottir, R.; Cavelier, P.; Bergersen, L.H.; Attwell, D. NMDA receptors are expressed in oligodendrocytes and activated in ischaemia. Nature 2005, 438, 1162–1166. [Google Scholar] [CrossRef] [PubMed] [Green Version]
  61. Salter, M.G.; Fern, R. Nmda receptors are expressed in developing oligodendrocyte processes and mediate injury. Nature 2005, 438, 1167–1171. [Google Scholar] [CrossRef] [PubMed]
  62. Matute, C.; Alberdi, E.; Domercq, M.; Sanchez-Gomez, M.V.; Perez-Samartin, A.; Rodriguez-Antiguedad, A.; Perez-Cerda, F. Excitotoxic damage to white matter. J. Anat. 2007, 210, 693–702. [Google Scholar] [CrossRef] [PubMed] [Green Version]
  63. Micu, I.; Ridsdale, A.; Zhang, L.; Woulfe, J.; McClintock, J.; Brantner, C.A.; Andrews, S.B.; Stys, P.K. Real-time measurement of free Ca2+ changes in CNS myelin by two-photon microscopy. Nat. Med. 2007, 13, 874–879. [Google Scholar] [CrossRef] [PubMed]
  64. Gallo, V.; Zhou, J.M.; McBain, C.J.; Wright, P.; Knutson, P.L.; Armstrong, R.C. Oligodendrocyte progenitor cell proliferation and lineage progression are regulated by glutamate receptor-mediated k+ channel block. J. Neurosci. 1996, 16, 2659–2670. [Google Scholar] [CrossRef] [PubMed]
  65. Yuan, X.; Eisen, A.M.; McBain, C.J.; Gallo, V. A role for glutamate and its receptors in the regulation of oligodendrocyte development in cerebellar tissue slices. Development 1998, 125, 2901–2914. [Google Scholar] [PubMed]
  66. Nagy, B.; Hovhannisyan, A.; Barzan, R.; Chen, T.J.; Kukley, M. Different patterns of neuronal activity trigger distinct responses of oligodendrocyte precursor cells in the corpus callosum. PLoS Biol. 2017, 15, e2001993. [Google Scholar] [CrossRef] [PubMed]
  67. Funfschilling, U.; Supplie, L.M.; Mahad, D.; Boretius, S.; Saab, A.S.; Edgar, J.; Brinkmann, B.G.; Kassmann, C.M.; Tzvetanova, I.D.; Mobius, W.; et al. Glycolytic oligodendrocytes maintain myelin and long-term axonal integrity. Nature 2012, 485, 517–521. [Google Scholar] [CrossRef] [PubMed] [Green Version]
  68. Saab, A.S.; Tzvetavona, I.D.; Trevisiol, A.; Baltan, S.; Dibaj, P.; Kusch, K.; Mobius, W.; Goetze, B.; Jahn, H.M.; Huang, W.; et al. Oligodendroglial NMDA receptors regulate glucose import and axonal energy metabolism. Neuron 2016, 91, 119–132. [Google Scholar] [CrossRef] [PubMed]
  69. Meyer, N.; Richter, N.; Fan, Z.; Siemonsmeier, G.; Pivneva, T.; Jordan, P.; Steinhauser, C.; Semtner, M.; Nolte, C.; Kettenmann, H. Oligodendrocytes in the mouse corpus callosum maintain axonal function by delivery of glucose. Cell Rep. 2018, 22, 2383–2394. [Google Scholar] [CrossRef] [PubMed]
  70. Lee, Y.; Morrison, B.M.; Li, Y.; Lengacher, S.; Farah, M.H.; Hoffman, P.N.; Liu, Y.; Tsingalia, A.; Jin, L.; Zhang, P.W.; et al. Oligodendroglia metabolically support axons and contribute to neurodegeneration. Nature 2012, 487, 443–448. [Google Scholar] [CrossRef] [PubMed] [Green Version]
  71. Baraban, M.; Koudelka, S.; Lyons, D.A. Ca2+ activity signatures of myelin sheath formation and growth in vivo. Nat. Neurosci. 2018, 21, 19–23. [Google Scholar] [CrossRef] [PubMed]
  72. Krasnow, A.M.; Ford, M.C.; Valdivia, L.E.; Wilson, S.W.; Attwell, D. Regulation of developing myelin sheath elongation by oligodendrocyte calcium transients in vivo. Nat. Neurosci. 2018, 21, 24–28. [Google Scholar] [CrossRef] [PubMed]
  73. Brown, A.M.; Sickmann, H.M.; Fosgerau, K.; Lund, T.M.; Schousboe, A.; Waagepetersen, H.S.; Ransom, B.R. Astrocyte glycogen metabolism is required for neural activity during aglycemia or intense stimulation in mouse white matter. J. Neurosci. Res. 2005, 79, 74–80. [Google Scholar] [CrossRef] [PubMed]
  74. Brown, A.M.; Ransom, B.R. Astrocyte glycogen and brain energy metabolism. Glia 2007, 55, 1263–1271. [Google Scholar] [CrossRef] [PubMed]
  75. Regan, M.R.; Huang, Y.H.; Kim, Y.S.; Dykes-Hoberg, M.I.; Jin, L.; Watkins, A.M.; Bergles, D.E.; Rothstein, J.D. Variations in promoter activity reveal a differential expression and physiology of glutamate transporters by glia in the developing and mature CNS. J. Neurosci. 2007, 27, 6607–6619. [Google Scholar] [CrossRef] [PubMed]
  76. DeSilva, T.M.; Kabakov, A.Y.; Goldhoff, P.E.; Volpe, J.J.; Rosenberg, P.A. Regulation of glutamate transport in developing rat oligodendrocytes. J. Neurosci. 2009, 29, 7898–7908. [Google Scholar] [CrossRef] [PubMed]
  77. Hanson, E.; Armbruster, M.; Cantu, D.; Andresen, L.; Taylor, A.; Danbolt, N.C.; Dulla, C.G. Astrocytic glutamate uptake is slow and does not limit neuronal nmda receptor activation in the neonatal neocortex. Glia 2015, 63, 1784–1796. [Google Scholar] [CrossRef] [PubMed]
  78. Morrison, B.M.; Lee, Y.; Rothstein, J.D. Oligodendroglia: Metabolic supporters of axons. Trends Cell Biol. 2013, 23, 644–651. [Google Scholar] [CrossRef] [PubMed]
  79. Hirrlinger, J.; Nave, K.A. Adapting brain metabolism to myelination and long-range signal transduction. Glia 2014, 62, 1749–1761. [Google Scholar] [CrossRef] [PubMed]
  80. Borges, K.; Kettenmann, H. Blockade of K+ channels induced by AMPA/kainate receptor activation in mouse oligodendrocyte precursor cells is mediated by Na+ entry. J. Neurosci. Res. 1995, 42, 579–593. [Google Scholar] [CrossRef] [PubMed]
  81. Knutson, P.; Ghiani, C.A.; Zhou, J.M.; Gallo, V.; McBain, C.J. K+ channel expression and cell proliferation are regulated by intracellular sodium and membrane depolarization in oligodendrocyte progenitor cells. J. Neurosci. 1997, 17, 2669–2682. [Google Scholar] [CrossRef] [PubMed]
  82. Schroder, W.; Seifert, G.; Huttmann, K.; Hinterkeuser, S.; Steinhauser, C. AMPA receptor-mediated modulation of inward rectifier K+ channels in astrocytes of mouse hippocampus. Mol. Cell. Neurosci. 2002, 19, 447–458. [Google Scholar] [CrossRef] [PubMed]
  83. Martinez-Lozada, Z.; Waggener, C.T.; Kim, K.; Zou, S.; Knapp, P.E.; Hayashi, Y.; Ortega, A.; Fuss, B. Activation of sodium-dependent glutamate transporters regulates the morphological aspects of oligodendrocyte maturation via signaling through calcium/calmodulin-dependent kinase IIβ’s actin-binding/-stabilizing domain. Glia 2014, 62, 1543–1558. [Google Scholar] [CrossRef] [PubMed]
  84. Friess, M.; Hammann, J.; Unichenko, P.; Luhmann, H.J.; White, R.; Kirischuk, S. Intracellular ion signaling influences myelin basic protein synthesis in oligodendrocyte precursor cells. Cell Calcium 2016, 60, 322–330. [Google Scholar] [CrossRef] [PubMed]
Figure 1. Action potential-induced sodium signals in macroglial cells of the corpus callosum. (A) Images of sodium-binding benzofurane isophthalate (SBFI) fluorescence (left) and sulforhodamine 101 (SR101) fluorescence (centre) of a tissue slice. The dotted box indicates the region depicted in the merged image on the right. Yellow arrowheads point to SBFI-loaded, SR101-positive cells (astrocytes), green arrowheads show SBFI-loaded, SR101-negative cells (cells of the oligodendrocyte lineage). Scale bars: 50 µm (left and centre) and 10 µm (right). (B) Sodium transients evoked by electrical stimulation (arrowheads) in an astrocyte and a SR101-negative cell. The measurement was interrupted for 18 min; note that cells fully recovered to baseline sodium within this time. (C) Histogram showing average peak amplitudes ± standard error of mean (SEM) of action potential (AP)-induced sodium signals in astrocytes and SR101-negative cells in control and after perfusion with tetrodotoxin (TTX). n.s.: not significant. (D) Transient AP-induced sodium changes in an astrocyte and a SR101-negative cell with four consecutive stimulations (arrowheads). Right: Histograms showing average peak amplitudes ± S.E.M. of AP-induced sodium signals in astrocytes and SR101-negative cells with four consecutive stimulations.
Neuroglia 01 00009 g001aNeuroglia 01 00009 g001b
Figure 2. Pharmacology of AP-induced sodium transients. (A) Action potential-induced (arrowheads) changes in sodium in an astrocyte and a SR101-negative cell with four consecutive stimulations under control conditions and after addition of different blockers as indicated by the bars (for abbreviations see text). (B) Histograms showing peak amplitudes ± SEM of AP-induced sodium signals in astrocytes and SR101-negative cells in control and after perfusion with different blockers as indicated, normalized to the respective controls. *** p < 0.001; n.s.: not significant.
Neuroglia 01 00009 g002
Figure 3. Pharmacology of AP-induced sodium transients in NG2 cells and oligodendrocytes. (A) Images of SR101 (left), EYFP (middle), and SBFI fluorescence (right) of a tissue slice prepared from a NG2/EYFP transgenic mouse. The pipette for electrical stimulation is indicated in the right image. Areas encircled by dotted lines represent regions of interest in which sodium signals were measured as depicted in (B) (regions of interest (ROI) 1: NG2-cell; ROI2: oligodendrocyte). Scale bar: 50 µm. (B) AP-induced (arrowheads) changes in sodium in an NG2 cell and an oligodendrocyte with four consecutive stimulations under control conditions and after addition of different blockers as indicated by the bars (for abbreviations see text). (C) Histograms showing peak amplitudes ± SEM of AP-induced sodium signals in NG2 cells and (EYFP/SR101-negative) oligodendrocytes in control and after perfusion with blockers as indicated, normalized to the respective controls. ***: p < 0.001.
Neuroglia 01 00009 g003
Figure 4. Relevance of gap junctional coupling for glutamate-induced sodium transients. (A) Sodium increases evoked by pressure application of glutamate (1 mM/250 ms; arrowheads) in astrocytes (upper traces) and SR101-negative cells (lower traces) in slices obtained from control mice (left) and Cx-k.o. mice (right). (B) Histogram showing peak amplitudes ± SEM of glutamate-induced sodium signals in astrocytes and SR101-negative cells in control and Cx-k.o. mice. *: 0.01 ≤ p < 0.05.
Neuroglia 01 00009 g004
Figure 5. Involvement of glutamate-aspartate-transporter (GLAST) and glutamate transporter 1 (GLT-1) in the generation of sodium signals. (A) Sodium increase evoked by pressure application of glutamate (1 mM/250 ms; arrowheads) in an astrocyte (left) and a SR101-negative cell (right) in control and after application of (3S)-3-[[3-[[4-(Trifluoromethyl)benzoyl]amino]phenyl]methoxy]-l-aspartic acid (TFB-TBOA). (B) Same as in (A), but with application of dihydrokainate (DHK). (C) Sodium increase evoked by pressure application of glutamate (1 mM/250 ms; arrowheads) in a representative wild type astrocyte and SR101-negative cell (left traces) and in cells from a GLAST-k.o. animal (right traces). (D) Histograms showing peak amplitudes ± S.E.M. of glutamate-induced sodium signals in astrocytes and SR101-negative cells in control and after perfusion with different blockers as well as in GLAST-k.o. animals, normalized to the respective controls. n.s.: not significant, *: 0.01 ≤ p < 0.05, **: 0.001 ≤ p < 0.01, ***: p < 0.001.
Neuroglia 01 00009 g005
Figure 6. Immunohistochemical analysis of glutamate transporter expression in macroglia of corpus callosum at P15-17. (A) GFAP and GLT-1 immunoreactivity and merge. (B) GFAP and GLAST immunoreactivity and merge. (C) CC-1 and GLT-1 immunoreactivity and merge. (D) CC-1 and GLAST immunoreactivity and merge. (E) NG2 and GLT-1 immunoreactivity and merge. (F) NG2 and GLAST immunoreactivity and merge. Yellow arrowheads point to structures with apparent co-labelling. Scale bar: 5 µm.
Neuroglia 01 00009 g006
Figure 7. Quantitative analysis of glutamate transporter expression. (A) Western blots incubated with anti-GLT-1/GLAST and α-actin from corpus callosum preparations taken from mice aged P5, P10, P15 and P25. (B) Mean relative intensities of GLT-1 and GLAST bands normalized to P25. n.s.: not significant, *: 0.01 ≤ p < 0.05, **: 0.001 ≤ p < 0.01, ***: p < 0.001.
Neuroglia 01 00009 g007

