2. Materials and Methods
2.1. Requirement Set and Derived Functions (R1–R5)
The methodological development is guided by an explicit requirement set that defines the functional target quantities as well as the practical boundary conditions for additively manufactured vibration isolators in the considered application context. From these requirements, system functions are derived and subsequently translated into design principles and, ultimately, into parameterized designs.
R1: Direction-dependent stiffness. The isolator shall provide anisotropic stiffness (k{ax} ≠ k{rad}) to accommodate direction-specific load paths and vibroacoustic transfer characteristics in cabin interiors.
R2a: Bearing structural loads, high strength: Under high structural loads (i.e., from emergency landing substantiation), the design requires sufficient strength.
R2b: Acoustically yielding, low stiffness: Acoustic power transfer usually involves very small deflections. However, these tiny excitation movements, which should be minimized in the further transfer by the isolator, occur at operating frequencies that shall lie sufficiently above the resonance region to ensure operation within the vibration-isolation range. To reduce unwanted noise transfer over a wide frequency range, the isolator resonance, together with the attached mass, should therefore be as low as possible. Consequently, the stiffness of the isolator must be sufficiently low such that the relevant excitation frequency ranges lie above the isolator resonance.
For the considered direction, the isolator–mass system is approximated as an undamped single-degree-of-freedom (SDOF) oscillator, for which the natural frequency
fn [Hz] follows from the coupling stiffness
k [N/m] and the effective suspended mass
m [kg] as [
26]:
where
k denotes the isolator stiffness in the direction under consideration (
kax for the axial direction addressed here), such that a reduction in the axial stiffness
kax shifts the resonance and the associated transmissibility crossover toward lower frequencies, thereby extending the usable isolation range within the considered frequency band.
R2c: Nonlinear stiffness for the combination of requirements: As the structural load requirement calling for high stiffness contradicts the acoustically yielding requirement in typical material mechanics, a solution needs to be found. One possible solution is a nonlinear stiffness requirement: small deflections fall under the acoustically yielding requirement with low stiffness, whereas for large deflections the structural load requirement with high strength and inherently higher stiffness becomes active.
R3: Preloadability. The installed state shall be set reproducibly via a defined preload displacement in order to ensure consistent coupling conditions and a stable operating point.
R4: Variant capability. The geometry and its stiffness-determining features shall be parameterizable such that variants can be adapted efficiently to different interface boundary conditions.
R5: Practicality (cross-cutting requirement). Manufacturing and iteration shall be feasible using commercially available AM processes, allow short iteration cycles, and yield reproducible geometric and mechanical properties. R5 is understood as a cross-cutting requirement and influences all subsequent steps (design, manufacturing, assembly, and measurement).
From these requirements, the key system functions are derived: (i) direction-specific tailoring of coupling stiffness to control vibroacoustic transfer (R1), (ii) reconciliation of low small-signal stiffness with extreme-load capability by an amplitude-dependent load path (e.g., progressive stiffening and/or travel limitation) (R2), (iii) establishment of a reproducible preload and mounting state (R3), (iv) systematic variant generation through parameterized geometry (R4), and (v) manufacturing and measurement procedures that are feasible with commercially available AM processes and yield reproducible properties (R5).
2.2. Design Principles as Principle Building Blocks (P-A to P-C)
The functional implementation of the requirements is realized through three principle building blocks that capture fundamental mechanisms and can be implemented in additively manufactured isolators either individually or in combination. The structured assignment of these principle building blocks to the defined requirements (R1–R5), together with their respective validation status within the present work, is summarized in
Table 1. Requirement R5 (Practicality) is treated as a cross-cutting boundary condition influencing all principles with respect to manufacturability, reproducibility, and feasibility within commercially available additive manufacturing processes.
P-A: Geometrically anisotropic base structure. P-A describes the generation of direction-dependent stiffness properties through geometric degrees of freedom of the load-bearing structure. By varying, for example, the wall thickness t, the slicer-defined infill parameter ϕ, and the orientation θ of internal structural features, anisotropic stiffness distributions can be tuned deliberately. The objective is high radial load-bearing capability while maintaining low axial coupling stiffness. P-A therefore primarily addresses R1 and R4.
P-B: Limiting/stop mechanism/nonlinear stiffness (design principle). P-B implements a geometrically defined end stop for deformation, characterized by a stop gap g (e.g., a step feature or blocking contact) that activates additional stiffness once the gap is closed at large deflections. This represents R2 at the design level. The stop mechanism is investigated primarily at the design and simulation level. Exploratory higher-excitation measurements were performed, but dedicated experimental validation of stop contact was outside the scope and was not achieved within the present campaign.
P-C: Preload/coupling mechanism. P-C defines the preload and mounting state via integrated geometric features, characterized by a defined preload displacement δ0 (e.g., a seating displacement or contact geometries), in order to establish reproducible coupling conditions and stabilize the operating point. P-C addresses R3 and supports R4.
To ensure methodological traceability, the principles are first investigated in single-mechanism variants in which one dominant building block is varied deliberately. In addition, an integrated reference design combining P-A and P-C is implemented, while P-B is treated as an optional design function. This combined configuration enables an initial qualitative assessment of potential interactions between the individual principles within a unified structural concept, while preserving interpretability at the level of the dominant design drivers.
2.3. Parameter Space, Variant Generation, and Hypotheses
The analysis is based on a parameterized design space.
Table 2 assigns the parameters to the corresponding principle building blocks and summarizes the scope of their respective numerical and experimental assessments.
Parameters: t (wall thickness), ϕ (slicer-defined infill fraction), θ (orientation of internal structures), δ0 (preload displacement), g (stop gap, design parameter of P-B only, without experimental evaluation). In addition, AM process and build-orientation parameters are considered (e.g., part orientation, perimeter/infill settings).
H1: Increasing t increases coupling stiffness and shifts the natural frequency fn upward, thereby reducing isolation effectiveness within the operating band.
H2: Increasing ϕ and/or selecting a suitable θ enables targeted anisotropy with krad ≫ kax.
H3: The preload displacement δ0 stabilizes the axial operating point and improves mounting repeatability.
H4: (design hypothesis): A small stop gap g promotes a progressive force–displacement characteristic and amplitude-dependent behavior. This is incorporated at the design level but not experimentally verified.
H5: Process and build-orientation parameters measurably affect kax, krad and resonance- and isolation-region metrics.
H6: Increasing perimeter and/or infill increases effective stiffness and shifts fn upward.
As a benchmark, a commercial, axisymmetric elastomer isolator is measured as a series-production reference.
2.4. Simulation as a Pre-Screening Step (Down-Selection)
Numerical investigations (finite element analysis, FEA) are used exclusively as a qualitative pre-screening step to support design decisions, estimate trends, and reduce the number of variants requiring experimental evaluation. The objective is not a full design optimization or a quantitatively validated prediction of the measured performance, but a structured preselection of plausible candidates within the defined parameter space, prior to experimental transmissibility testing. The detailed simulation settings used for qualitative pre-screening are provided in
Appendix A.1 (
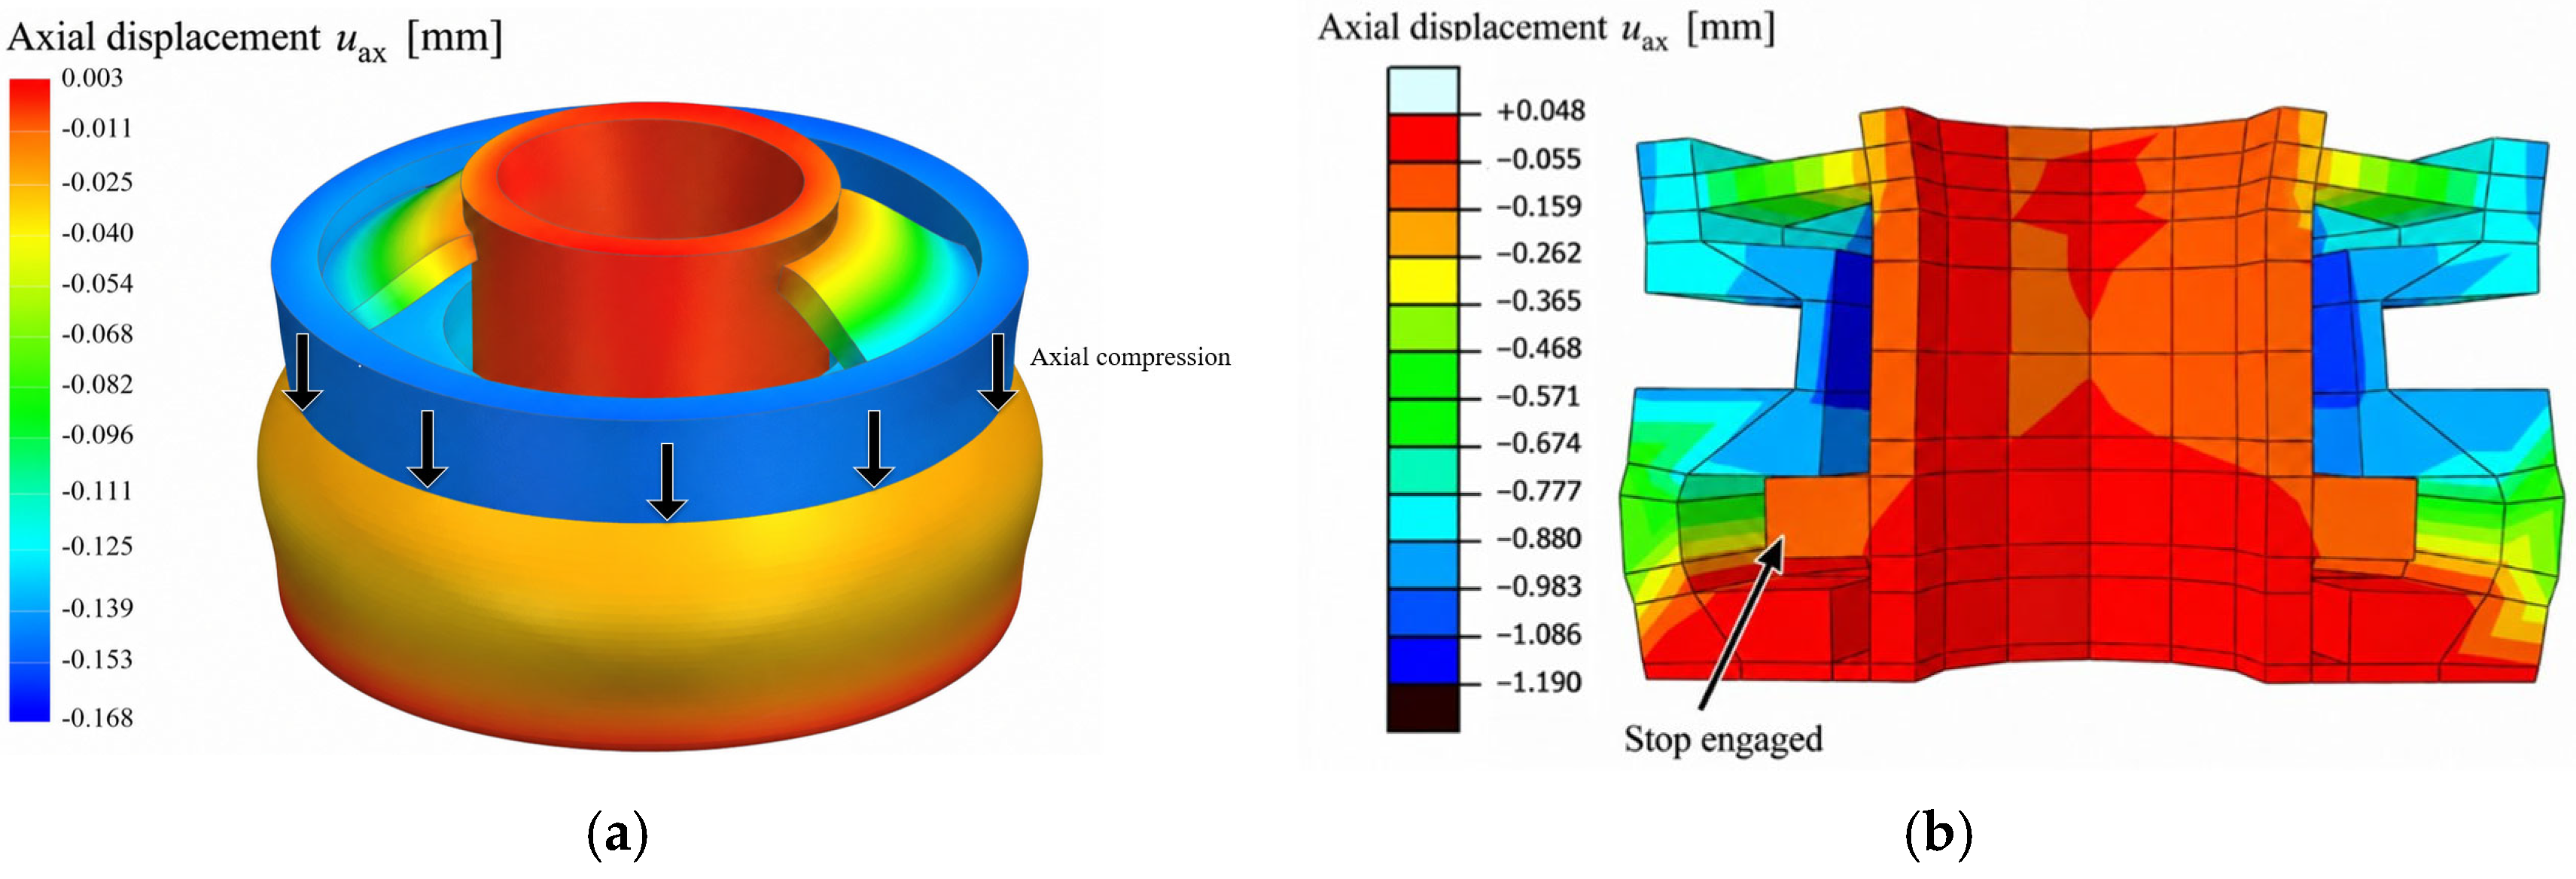
Table A1). Key outputs include force–displacement characteristics and load paths. An exemplary deformation field and hard-stop (fail-safe) engagement behavior of the travel-limited isolator concept is shown in
Figure 1. The simulation results are primarily used to prioritize parameter combinations that address hypothesis H1. H4 is considered exclusively as an optional design exploration. Because FEA is used here only for qualitative down-selection and trend assessment, the simulation results are not treated as stand-alone validation evidence.
Two aspects of the numerical work should be stated explicitly. First, a formal mesh-independence study was not carried out; the discretization was selected pragmatically for the intended qualitative comparison, and the simulation results are therefore not claimed to be mesh-converged. Second, the simulations and the experiments are not directly comparable in a quantitative sense: the numerical model does not reproduce the experimental preload state and uses idealized boundary conditions, so the two are deliberately used for different purposes—relative screening of design variants on the one hand, and absolute transmission behavior on the other. A quantitative simulation-to-experiment comparison of stiffness or resonance frequency is consequently outside the scope of the present work and is identified as a task for future studies with a model specifically prepared for that purpose.
2.5. Additive Manufacturing (Fabrication and Reproducibility)
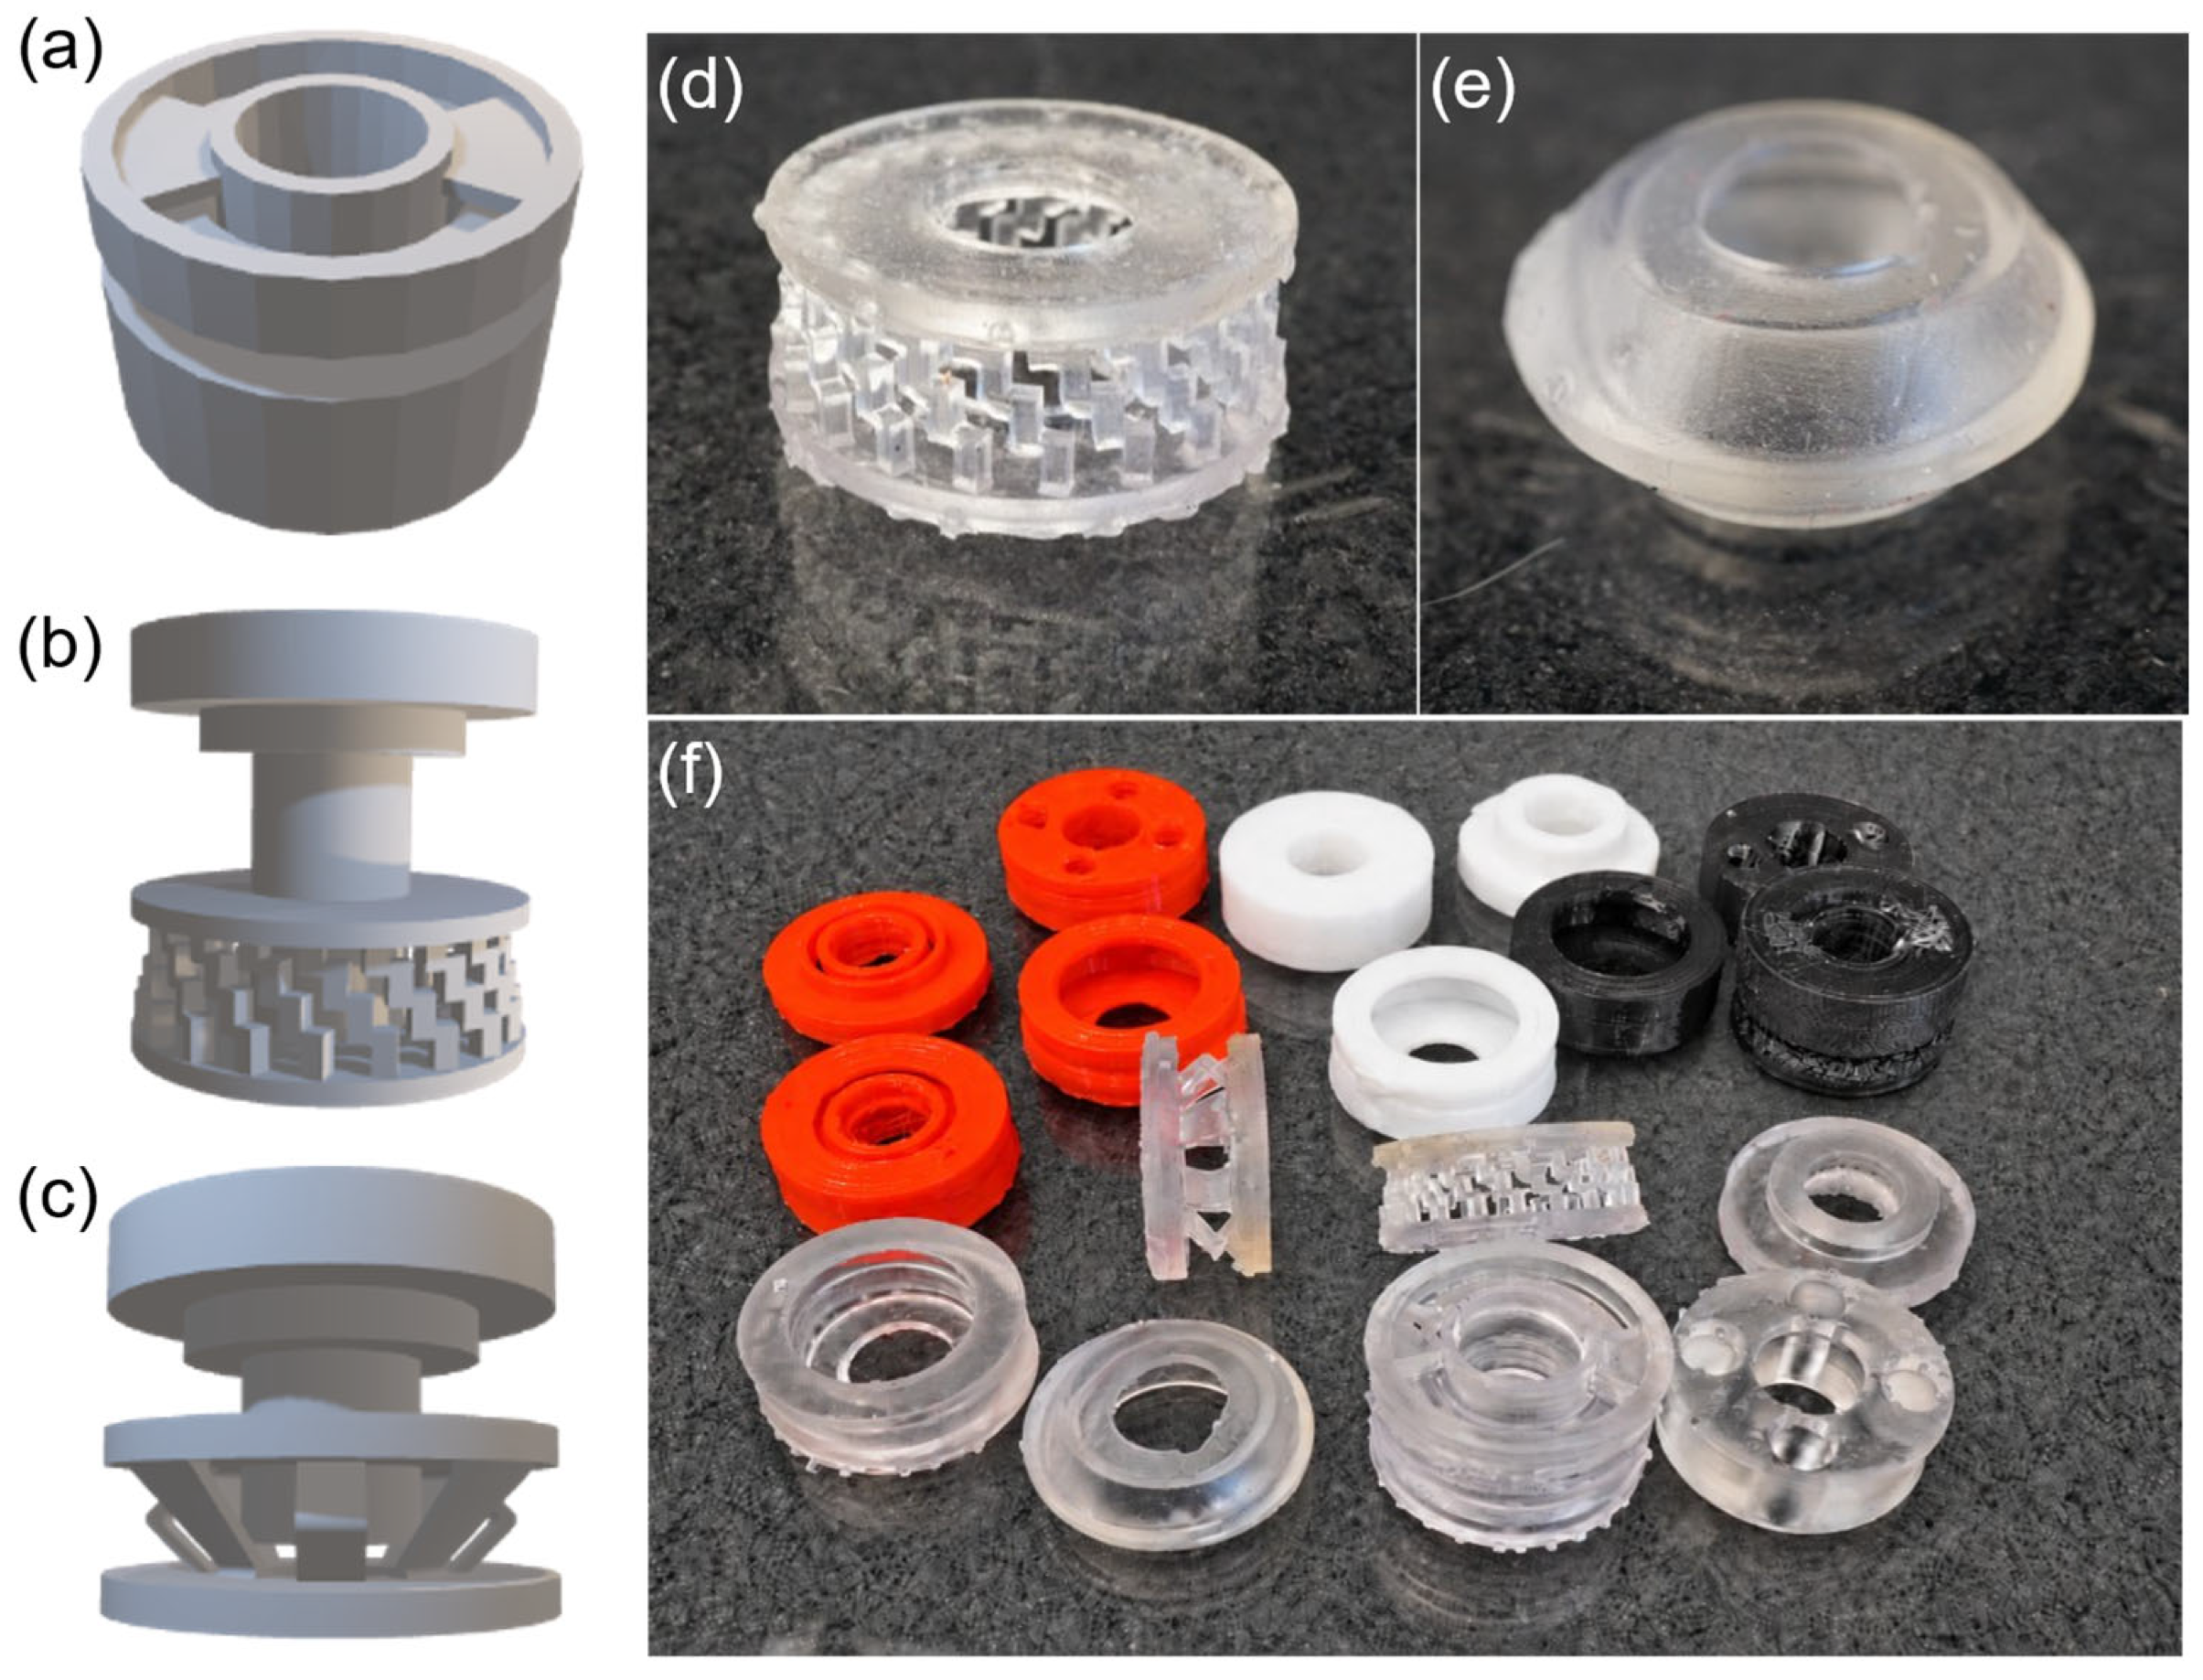
The experimental specimen set comprises four FDM-based design variants and three SLA-based design variants. Within the FDM-based variants, four TPU hardness grades (85A, 70A, 45D, and 60A) were explored as a separate material dimension. SLA is employed deliberately for designs whose geometric features (e.g., delicate internal architectures, complex cavities, or well-defined contours) cannot be realized reliably and reproducibly using the FDM process. The 60A grade was investigated across multiple print attempts, including adjustments to the print parameters; despite this, no specimens of sufficient quality for the shaker measurement campaign were obtained, and this grade was therefore not dynamically characterized. All other FDM material grades described here and all three SLA design variants were experimentally characterized; specimen rejection also occurred during the SLA manufacturing process. An overview of the manufactured variants and representative geometries is provided in
Figure 2. To improve the traceability and reproducibility of the fabrication process, the complete manufacturing settings for both process routes are provided in
Appendix A.2 (
Table A2). Within each investigated comparison, machine- and material-specific settings are kept constant unless explicitly varied as part of the parameter study. For the FDM variants, the controlled settings include the printer and material specification, nozzle diameter, layer height, extrusion and build-platform temperatures, printing speed, perimeter settings, infill characteristics, and build orientation. For the SLA variants, the relevant settings include the printer and resin specification, layer height, build orientation, support strategy, cleaning procedure, and post-curing conditions. Material handling and storage conditions are additionally reported where documented. Since absolute machine settings are equipment- and material-specific, the present study focuses on the transferable relationships between geometry, material selection, manufacturing route, selected process parameters, and the resulting dynamic behavior.
Parameters intentionally varied within the experimental design, in particular wall thickness, perimeter settings, material hardness, and build-orientation-related variables, are distinguished from the fixed fabrication settings summarized in
Appendix A.2 (
Table A2). This separation allows observed changes in dynamic behavior to be interpreted with respect to the investigated design or process parameter while limiting unintended manufacturing-related variation. The slicer-defined infill fraction, φ, was considered as an additional manufacturing parameter and was explored during preliminary fabrication trials. However, owing to the challenging and time-intensive processing of the flexible materials, a systematic experimental parameter study could not be completed within the scope of the present work. Consequently, no quantitative conclusions regarding the influence of φ are drawn from the present data.
2.6. Experimental Setup and Measurement Methodology (Shaker)
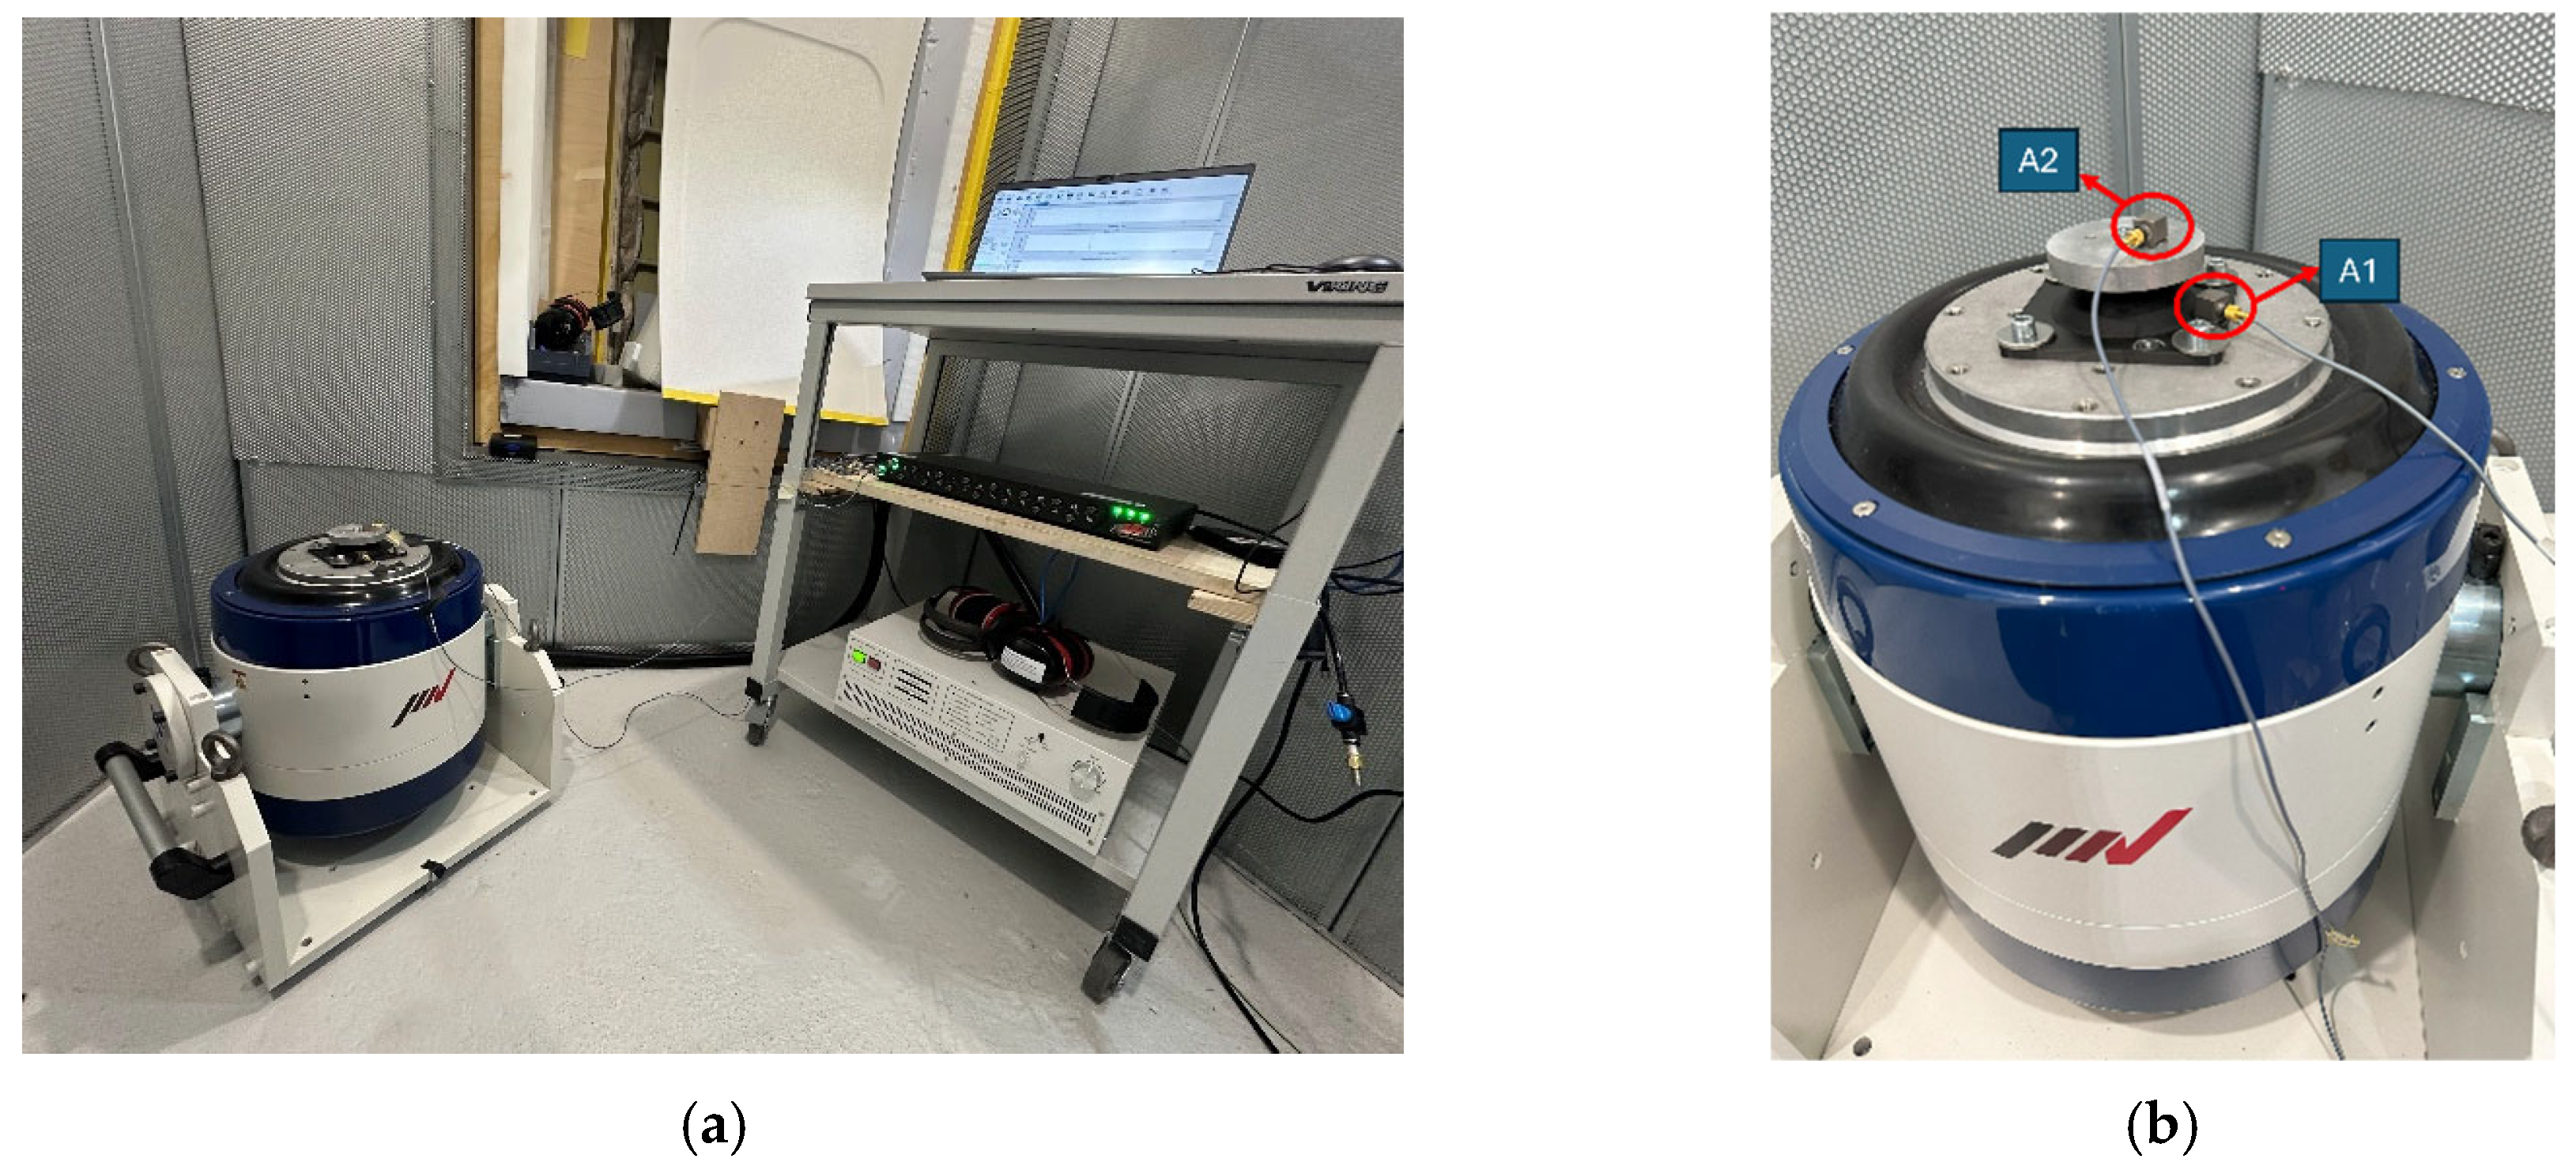
Figure 3 shows the shaker-based test setup used to evaluate the dynamic performance of the isolator variants for aircraft interior applications. The setup employs an IMV m160 electrodynamic shaker (IMV Corporation, Osaka, Japan) capable of providing the required peak forces and accelerations over a frequency range of 5–2000 Hz; the frequency range evaluated in the present measurement campaign is 30–2000 Hz. The shaker is powered by a dedicated amplifier and operated via a Vibration Research VR10500 controller (Vibration Research Corporation, Jenison, MI, USA), which supervises the excitation and measurement procedure. The test rig comprises a stiff base plate on the excitation side, an adapter assembly accommodating the isolator, and a test-mass plate representing the isolated structure. The isolator is mounted in axial orientation and subjected to a static preload resulting from the weight of the test-mass plate (approximately 0.86 N); an inner metal cylinder provides radial guidance and centering of the isolator. The resulting axial preload displacement, δ
0, was not separately measured, as it is minimal and not practically quantifiable with the available setup.
Excitation is applied as a sinusoidal sweep at a constant acceleration amplitude over the entire frequency range, using swept-sine excitation with synchronous (tracking-filter) detection, consistent with the standard operating principle of the employed vibration controller. Signals are acquired synchronously using accelerometers placed on the excitation side and on the isolated side of the specimen, and the axial transmissibility curve is obtained as the frequency-resolved ratio of the output to the input acceleration amplitude throughout the sweep. Sweep parameters, including sweep rate and, where applicable, dwell times, are selected to ensure that the resonance frequency and characteristic metrics can be extracted from the measured transfer function; the complete sweep, acquisition, and processing settings, together with the applied averaging and repeatability information, are summarized in
Appendix A.3 (
Table A3). Two Brüel & Kjær type 4508B accelerometers (Brüel & Kjær Sound & Vibration Measurement A/S, Nærum, Denmark) are used: accelerometer A1 is mounted on the shaker-side stiff plate to measure the input acceleration (Channel 1), while accelerometer A2 is mounted on the top plate above the isolator to measure the output acceleration (Channel 2), as shown in
Figure 3b. The transmissibility curves are obtained directly from the vibration controller, which performs the synchronous tracking-filter detection internally; no additional external signal processing is applied to the acquired signals. For presentation, the frequency axis is normalized to the respective measured natural frequency where indicated in
Section 3, so that the corresponding results are shown as a function of the frequency ratio rather than of absolute frequency; other result plots retain absolute frequency.
For comparative assessment, the primary metrics considered are the natural frequency fn, the maximum transmissibility Tmax and band- or fit-based descriptors of the resonance region (e.g., peak width/bandwidth around fn, or fit parameters of an appropriate resonance model). An explicitly norm-defined damping parameter is not reported as a primary outcome metric in this work unless its determination can be ensured unambiguously and consistently across all variants.
For variant comparison in the isolation region, an isolation-region log–log slope is additionally reported, computed following the signed logarithmic-slope definition of Hein et al. [
3] (Equation 5), |
n|= [log(y
2) − log(
y1)]/[log(
x2) − log(
x1)], with
x =
f/fn and points selected within the approximately linear portion of the falling isolation branch. On this falling branch, the signed slope n is negative. For variant-comparison purposes,
Table 3 reports the corresponding positive slope magnitude, |
n| (isolation-region log–log slope magnitude).
Goals in Verification and Validation Tests
The measurement campaign targeted the following goals:
Assessment of the feasibility of the proposed approach under boundary conditions representative of aircraft interior isolator applications.
Identification of design parameters that produce measurable and controllable changes in transmissibility-derived behavior.
Assessment of robustness, such that intended parameter variations dominate the response while secondary manufacturing and assembly influences remain limited; within the present campaign, this assessment provides a qualitative indication of consistency and parameter trends rather than a statistical validation of robustness.
Limiting and fail-safe-oriented design functions (stop/travel-limiting mechanisms) are included as design options. The sinusoidal sweep measurements used in this study characterize the approximately linear small-deflection regime relevant to vibroacoustic operation at a fixed excitation level. The transition to the high-stiffness on-block regime at large deflections is outside the scope of the present shaker protocol. Accordingly, stop contact is not evaluated as an experimentally validated function in this work; the blocking mechanism was assessed only manually under overload, while dedicated static, impact, or other large-deflection characterization is reserved for future work.
2.7. Parametric Design Map (Concept and Representation)
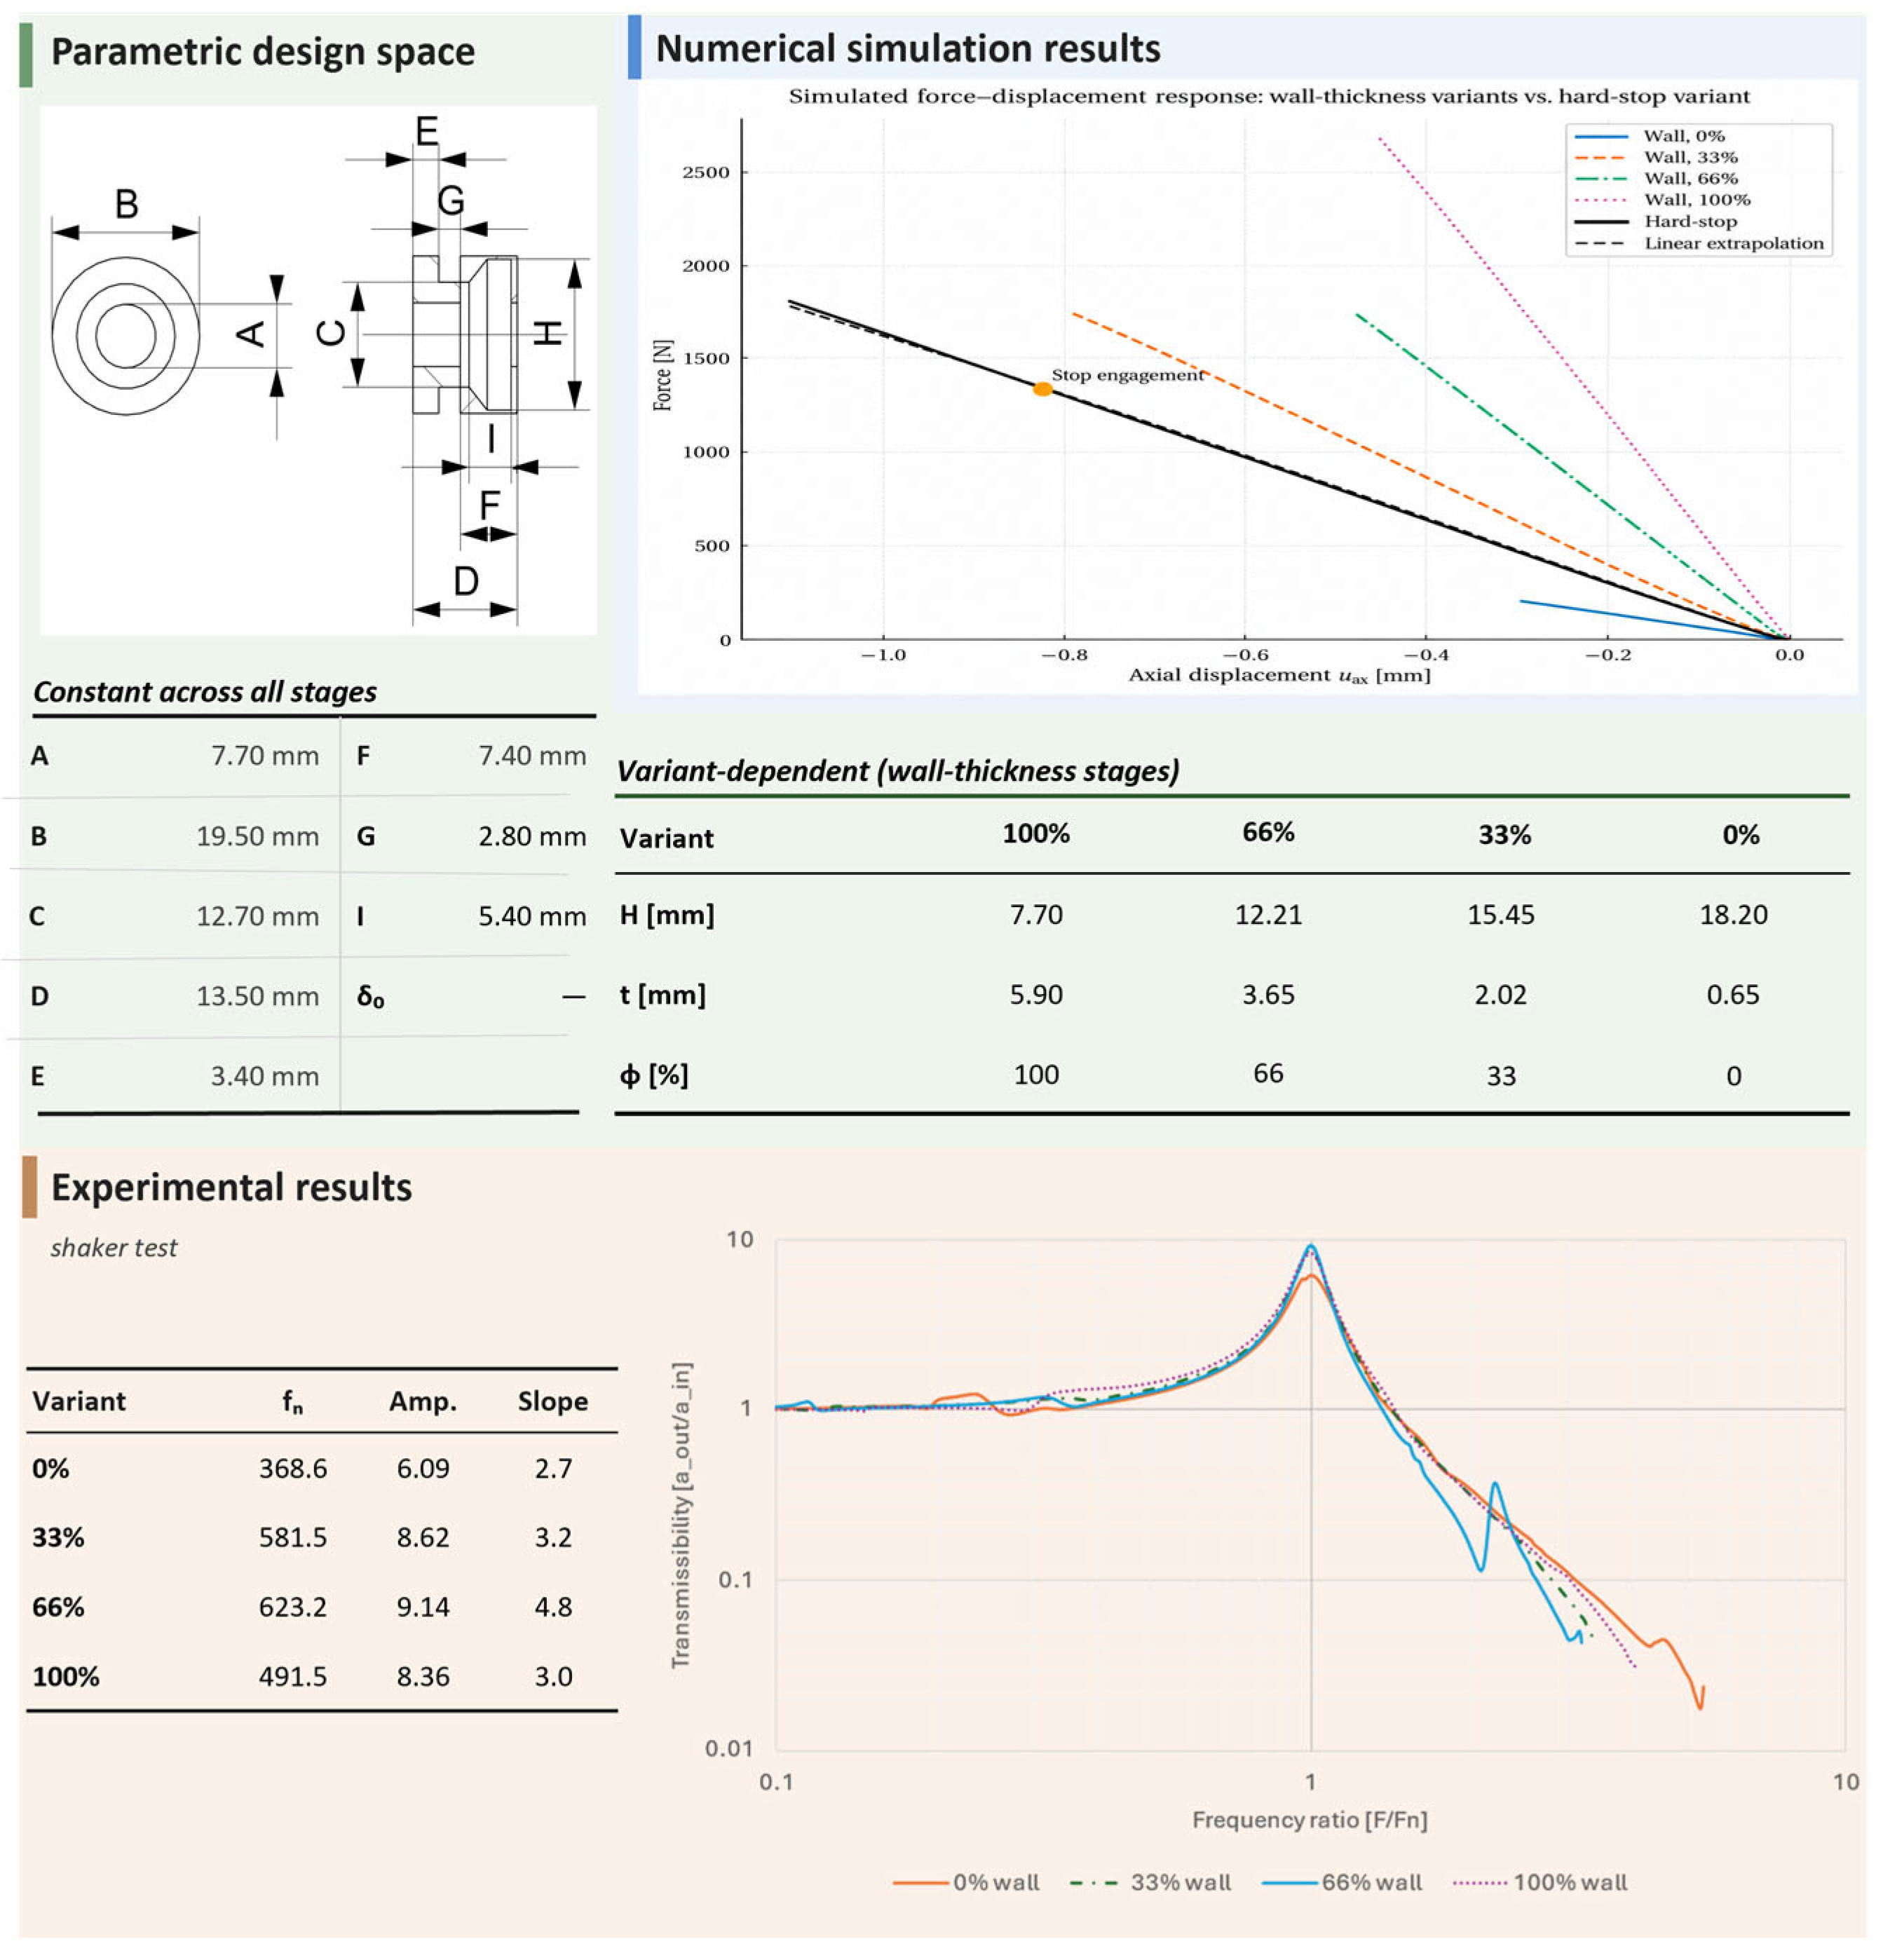
To systematically integrate design, simulation, and experiment, a Parametric Design Map is established (see exemplary
Figure 4). It serves as a structured documentation and evaluation framework in which design options, parameter settings, manufacturing and assembly conditions, and the resulting measurement-based performance metrics are linked consistently. The objective is to represent the relationship between the parameterized design space, numerically inferred trend directions, and experimentally determined transmission metrics in a traceable manner, thereby making variant decisions transparent.
The Design Map is organized in two levels. On the first level, a principle map captures the assignment of the principle building blocks (P-A to P-C) to the requirements (R1–R5) and indicates which functions are experimentally supported within the present test program and which remain design assumptions and/or development options (e.g., limiting mechanisms without stop contact under the applied sweep protocol).
On the second level, parameter–metric relationships are recorded to document the link between input variables
and experimentally derived output quantities, for each variant m, where the subscript m denotes the respective isolator variant. The input variables shown in Equation (2) correspond to the wall thickness, slicer-defined infill fraction, orientation, preload displacement, and stop gap introduced for the design principles P-A to P-C in
Section 2.2. The stop gap is included as a design and simulation parameter of P-B but is not experimentally evaluated within the present test program. Here,
pm denotes the manufacturing process and build orientation. The primary metrics tracked are, in particular,
Here, the natural frequency and maximum transmissibility correspond to the quantities introduced in
Section 2.6, where
dm denotes band-/fit-based descriptors of the resonance region. The PDM serves as a traceable documentation and decision framework that links design, simulation, and experimental data for each variant; within this framework, simulation and experiment retain separate evidentiary roles and are not combined into a single validated metric. A formal statistical repeatability study across a larger specimen population is outside the scope of the present work.
Looking ahead, the Parametric Design Map is intended to be expanded stepwise into a catalog-like tool that supports targeted preselection and parameterization of future isolator variants for specific interfaces.
3. Results
3.1. Variant Product Family
For the experimental investigation, a total of seven additively manufactured isolator variants were defined, covering different design principles and parameter combinations. The objective is to examine the influence of key design parameters on axial transmission behavior within a compact yet representative variant space and to assess the hypotheses formulated in
Section 2 at the level of trends.
The variants are produced via two process chains, comprising four FDM-based design variants and three SLA-based design variants. Within the FDM-based variants, four TPU hardness grades were explored as a separate material dimension to capture material effects in combination with geometric parameters; the 60A grade did not yield specimens suitable for dynamic characterization despite repeated print attempts (see
Section 2.5), while the remaining three grades were used dynamically. The SLA-based variants are fabricated from transparent resin. SLA is used deliberately for geometrically demanding designs whose features (e.g., delicate structures, complex cavities, or well-defined contours) cannot be realized reliably and reproducibly in the FDM process.
The variant product family comprises concepts that (i) target particularly low axial coupling stiffness and thus a favorable placement of the natural frequency (e.g., designs approaching quasi-zero stiffness within the intended operating range), (ii) leverage internal structuring principles to tailor stiffness and curve shape (e.g., “bubble”-type internal architectures), (iii) represent an integrated reference design that combines multiple principle building blocks, and (iv) include intentionally simplified geometric variations in which individual parameters (e.g., wall thickness or the slicer-defined infill fraction) dominate in order to expose baseline trends in isolation.
All variants are characterized exclusively in the axial direction within the present test program. Experimental quantification of radial directional performance metrics is not part of this work; statements regarding anisotropic target relations (e.g., k_rad ≫ k_ax) are therefore stated as design intent but are not experimentally substantiated. As an additional benchmark, a commercial series-production isolator is measured under comparable mounting and excitation conditions and is used as a reference for the achievable transmissibility level.
3.2. Linear Transmissibility of AM Variants Compared with the Series Reference
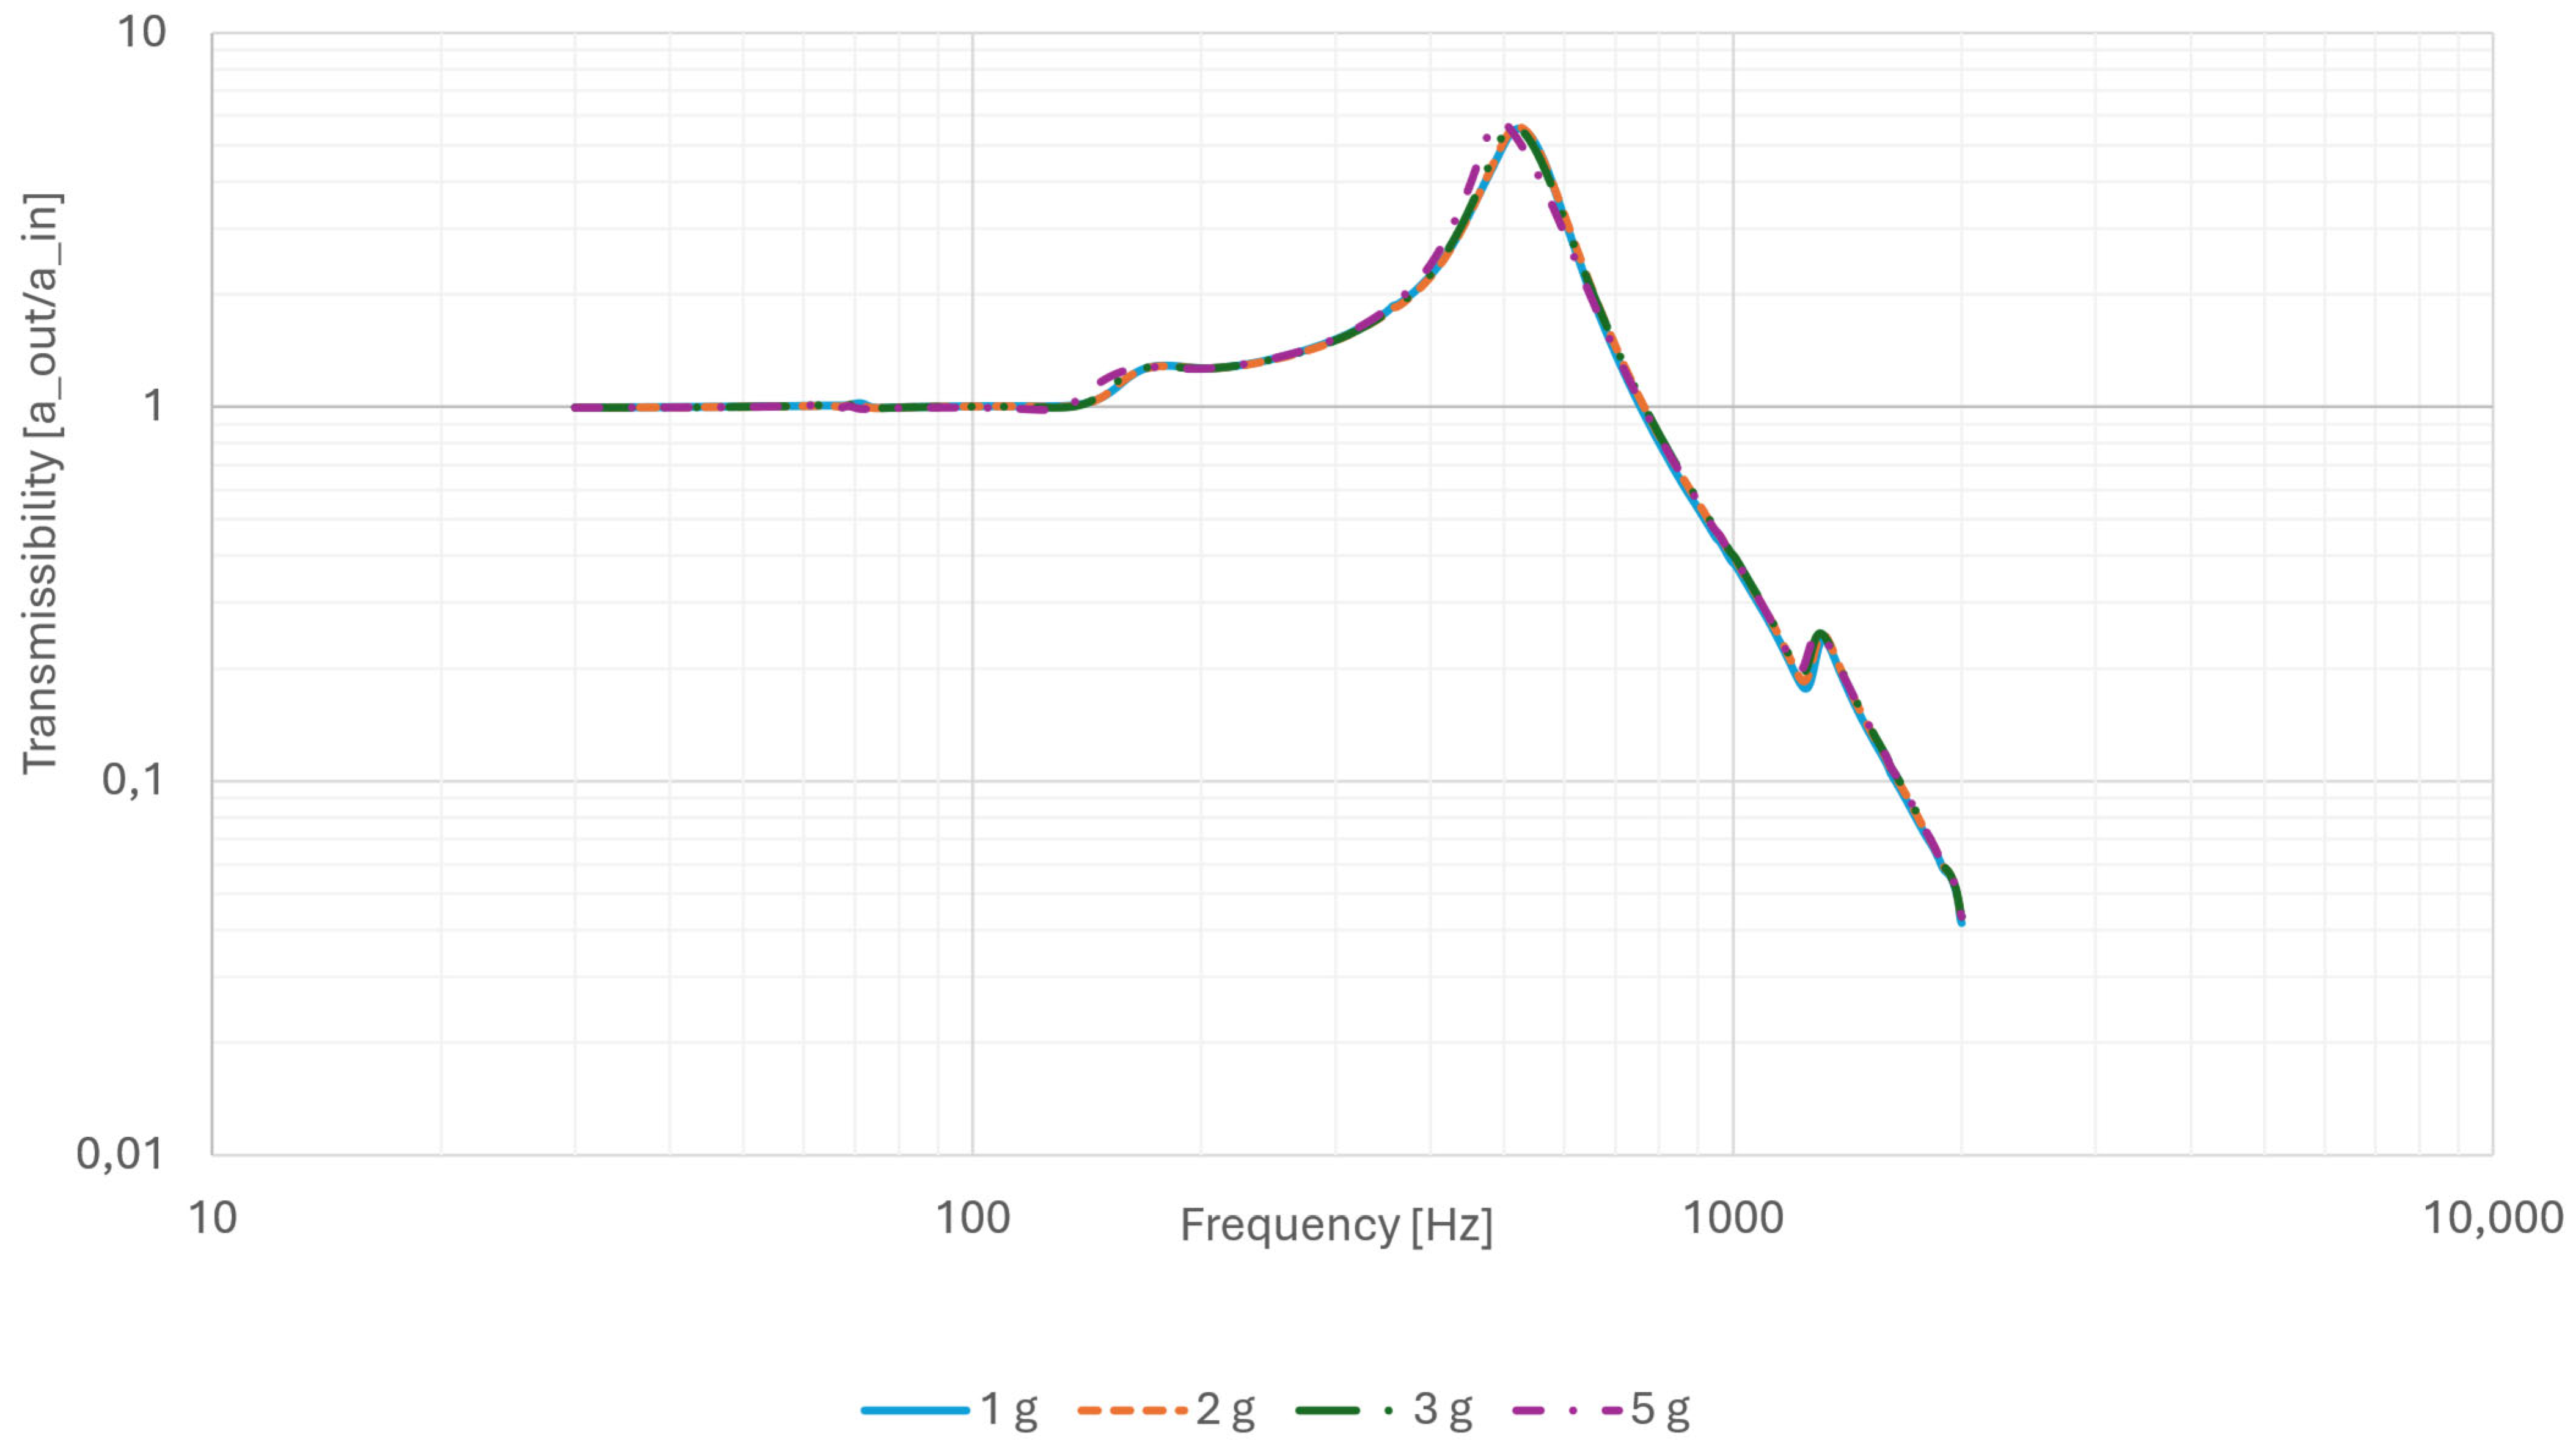
The transmissibility measurements show that resonance location and the overall transfer-function shape vary with the investigated design parameters. To support a consistent interpretation of the transmissibility metrics under linear-system assumptions, amplitude linearity was examined within the low-deflection excitation range, as shown in
Figure 5. Because the shaker setup uses comparatively small attached masses, acceleration levels from 1 g to 5 g were applied to probe the upper end of the investigated small-deflection regime. In an aircraft installation, larger attached masses, such as sidewall lining elements, would produce comparable interface forces at lower acceleration levels. This verification therefore addresses the linear response behavior relevant to vibroacoustic operation and does not constitute validation of the nonlinear stop mechanism, which is expected to become relevant only at larger deflections.
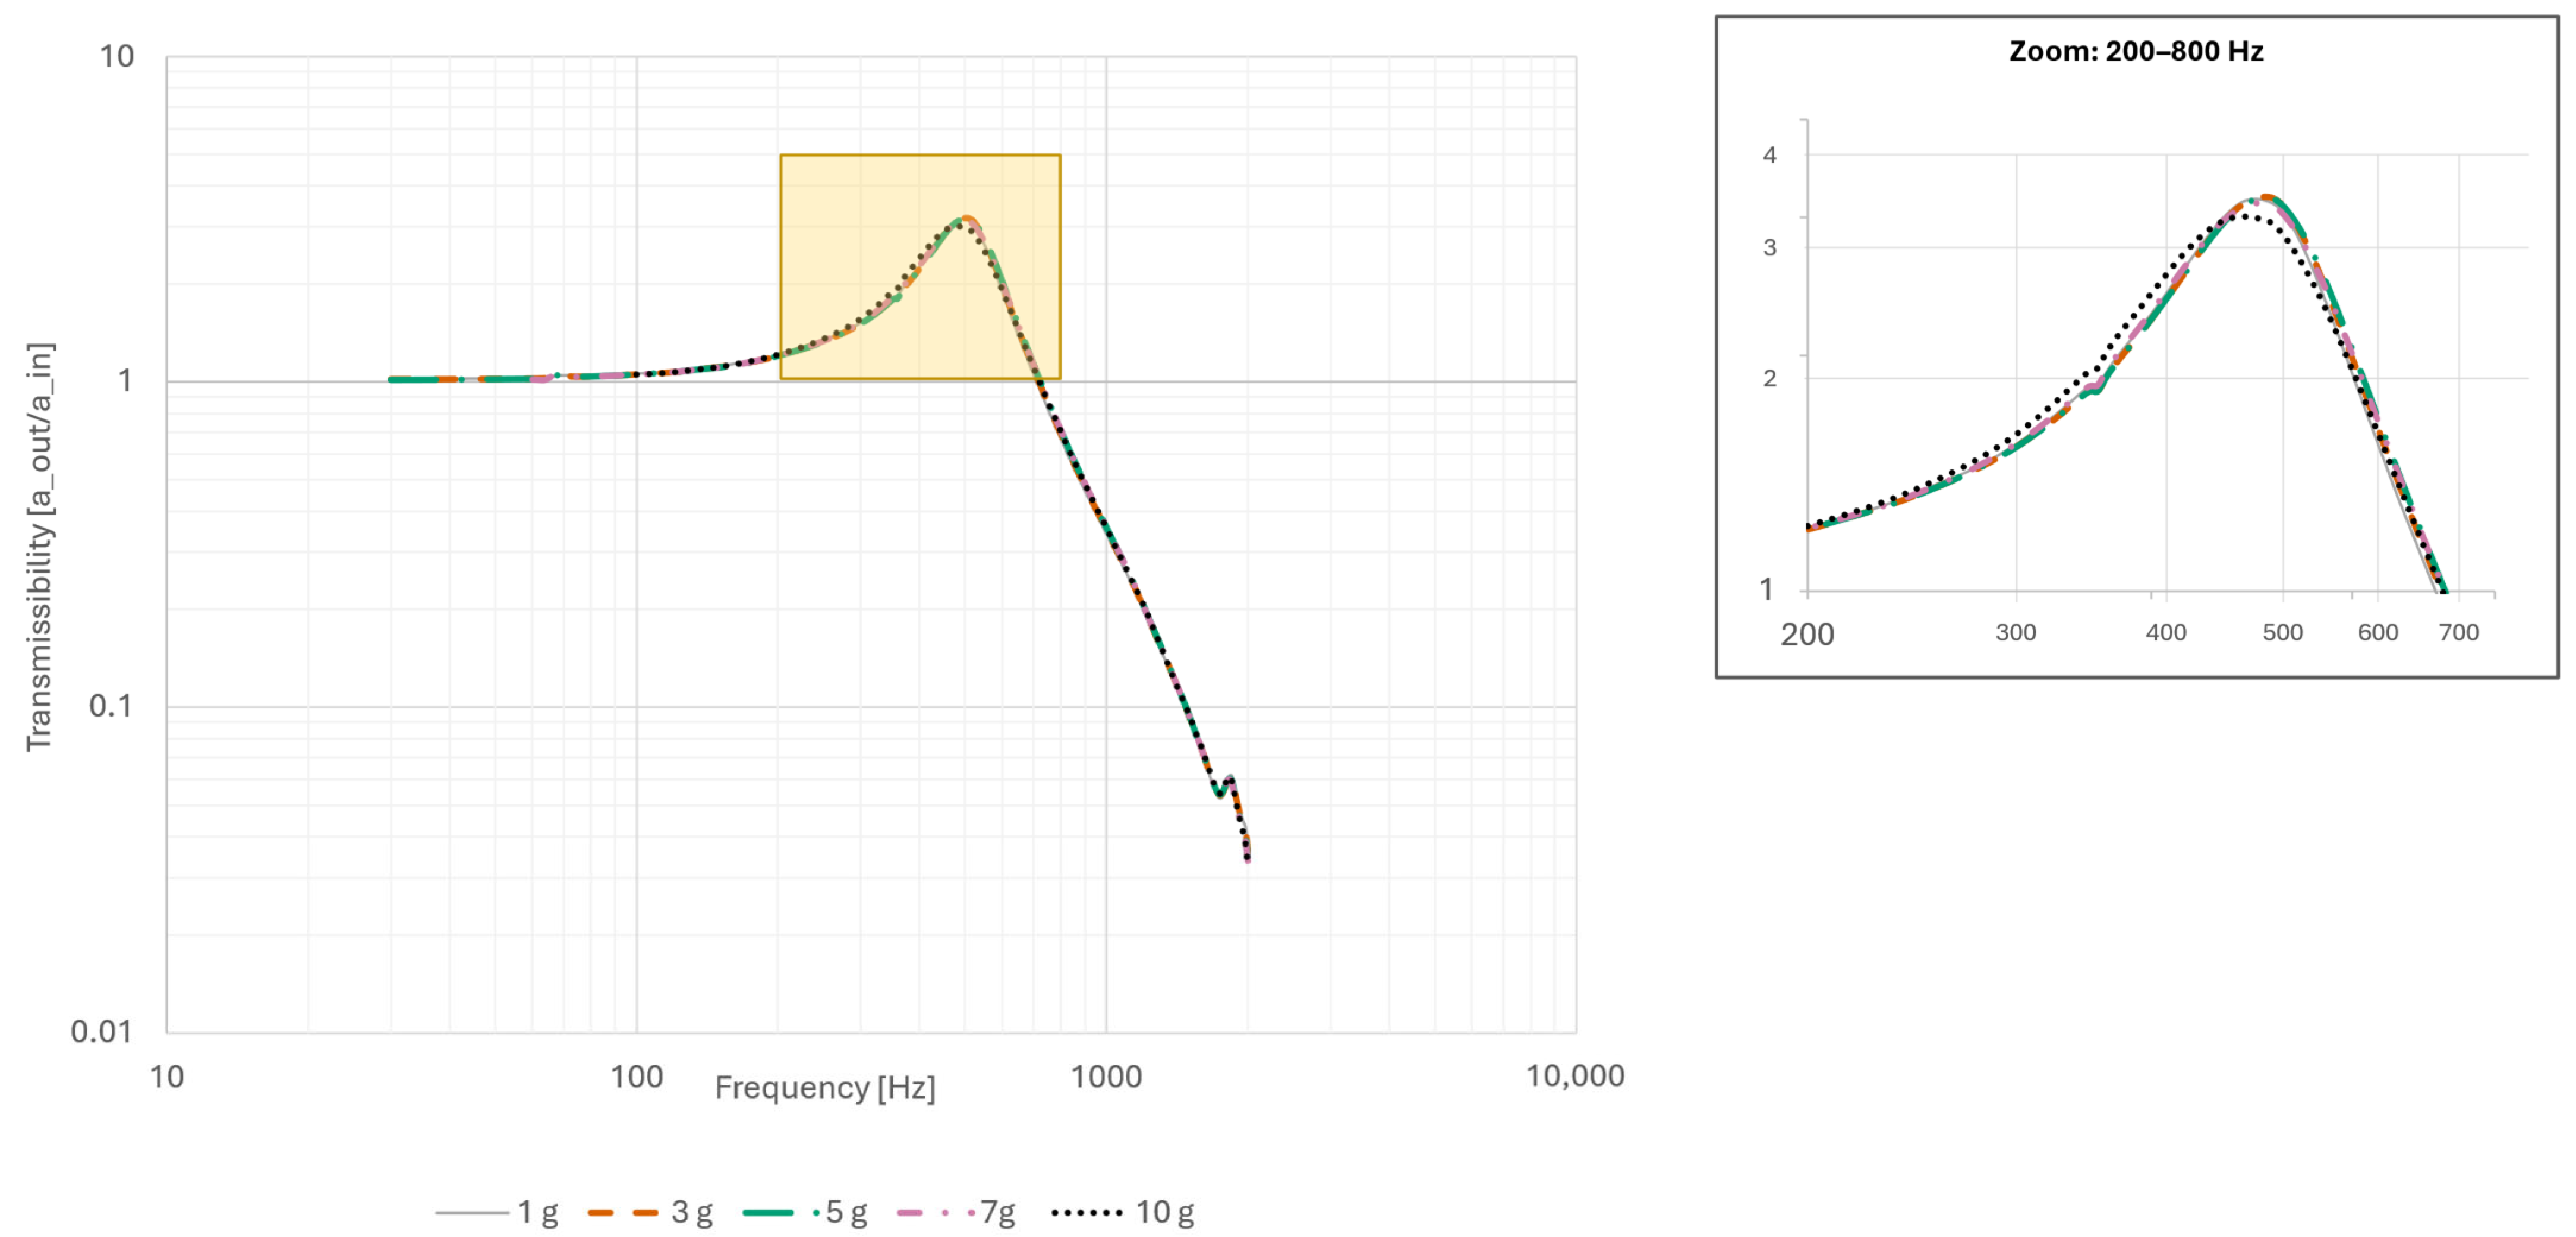
As shown in
Figure 6, excitation-level sensitivity was assessed for the hard-stop SLA variant (Resin80A) over an extended range of 1–10 g. The results indicate a resonance-frequency increase from 493.6 Hz at 1 g to 504.1 Hz at 3–5 g, after which the resonance frequency decreases again toward higher excitation levels. The resonance-frequency trend suggests excitation-dependent changes in the dynamic response; however, distinct stiffness states were not identified directly from the present measurements. Structural failure was observed in a separate, isolated trial at a higher excitation level; the known installation sensitivity of the SLA/resin variants may be a possible contributing factor, though this was not systematically investigated. This isolated event is not tied to a specific excitation threshold and is not part of the measurements shown in
Figure 6.
Across the investigated designs, the measurements show the expected qualitative relationship between design-controlled coupling stiffness and natural frequency: variants with higher effective stiffness exhibit a shift in the resonance toward higher frequencies. More compliant designs (lower effective stiffness) move the resonance and the associated transmissibility crossover to lower frequencies, extending the usable isolation range within the considered frequency band.
Depending on internal architecture and parameterization, differences are observed in the degree of resonance amplification and in band- or fit-based descriptors of the resonance region (e.g., peak width and peak shape), underscoring the suitability of geometric degrees of freedom for targeted tuning of linear transmission behavior.
3.3. Parameter Effects and Hypothesis Assessment
The results enable an assessment of hypotheses H1 to H3 within the scope of the axial transmissibility measurements. H1 is evaluated directly at trend level, H2 is assessed only with respect to axial transmission effects, and H3 is assessed qualitatively with respect to mounting-state control.
H1 (wall thickness): Within the investigated range, wall thickness is observed to influence the effective coupling stiffness, manifesting as a shift in the resonance frequency and a change in isolation effectiveness within the considered operating band; this relationship is not strictly monotonic across the full tested range (see Section 3.2). Wall thickness therefore constitutes an effective lever for coarse tuning of the dynamic performance metrics and provides trend-level support for H1.
H2 (slicer-defined infill fraction and orientation): H2 could not be evaluated quantitatively within the present experimental campaign. The slicer-defined infill fraction φ was not investigated systematically, and the intended anisotropic stiffness relation additionally requires radial characterization. H2 therefore remains a design hypothesis for future investigation.
H3 (preload): H3 is supported qualitatively with respect to establishing a controlled mounting state under the approximately 0.86 N static preload provided by the test-mass plate, while no quantitative conclusion regarding improved repeatability can be drawn from the present data.
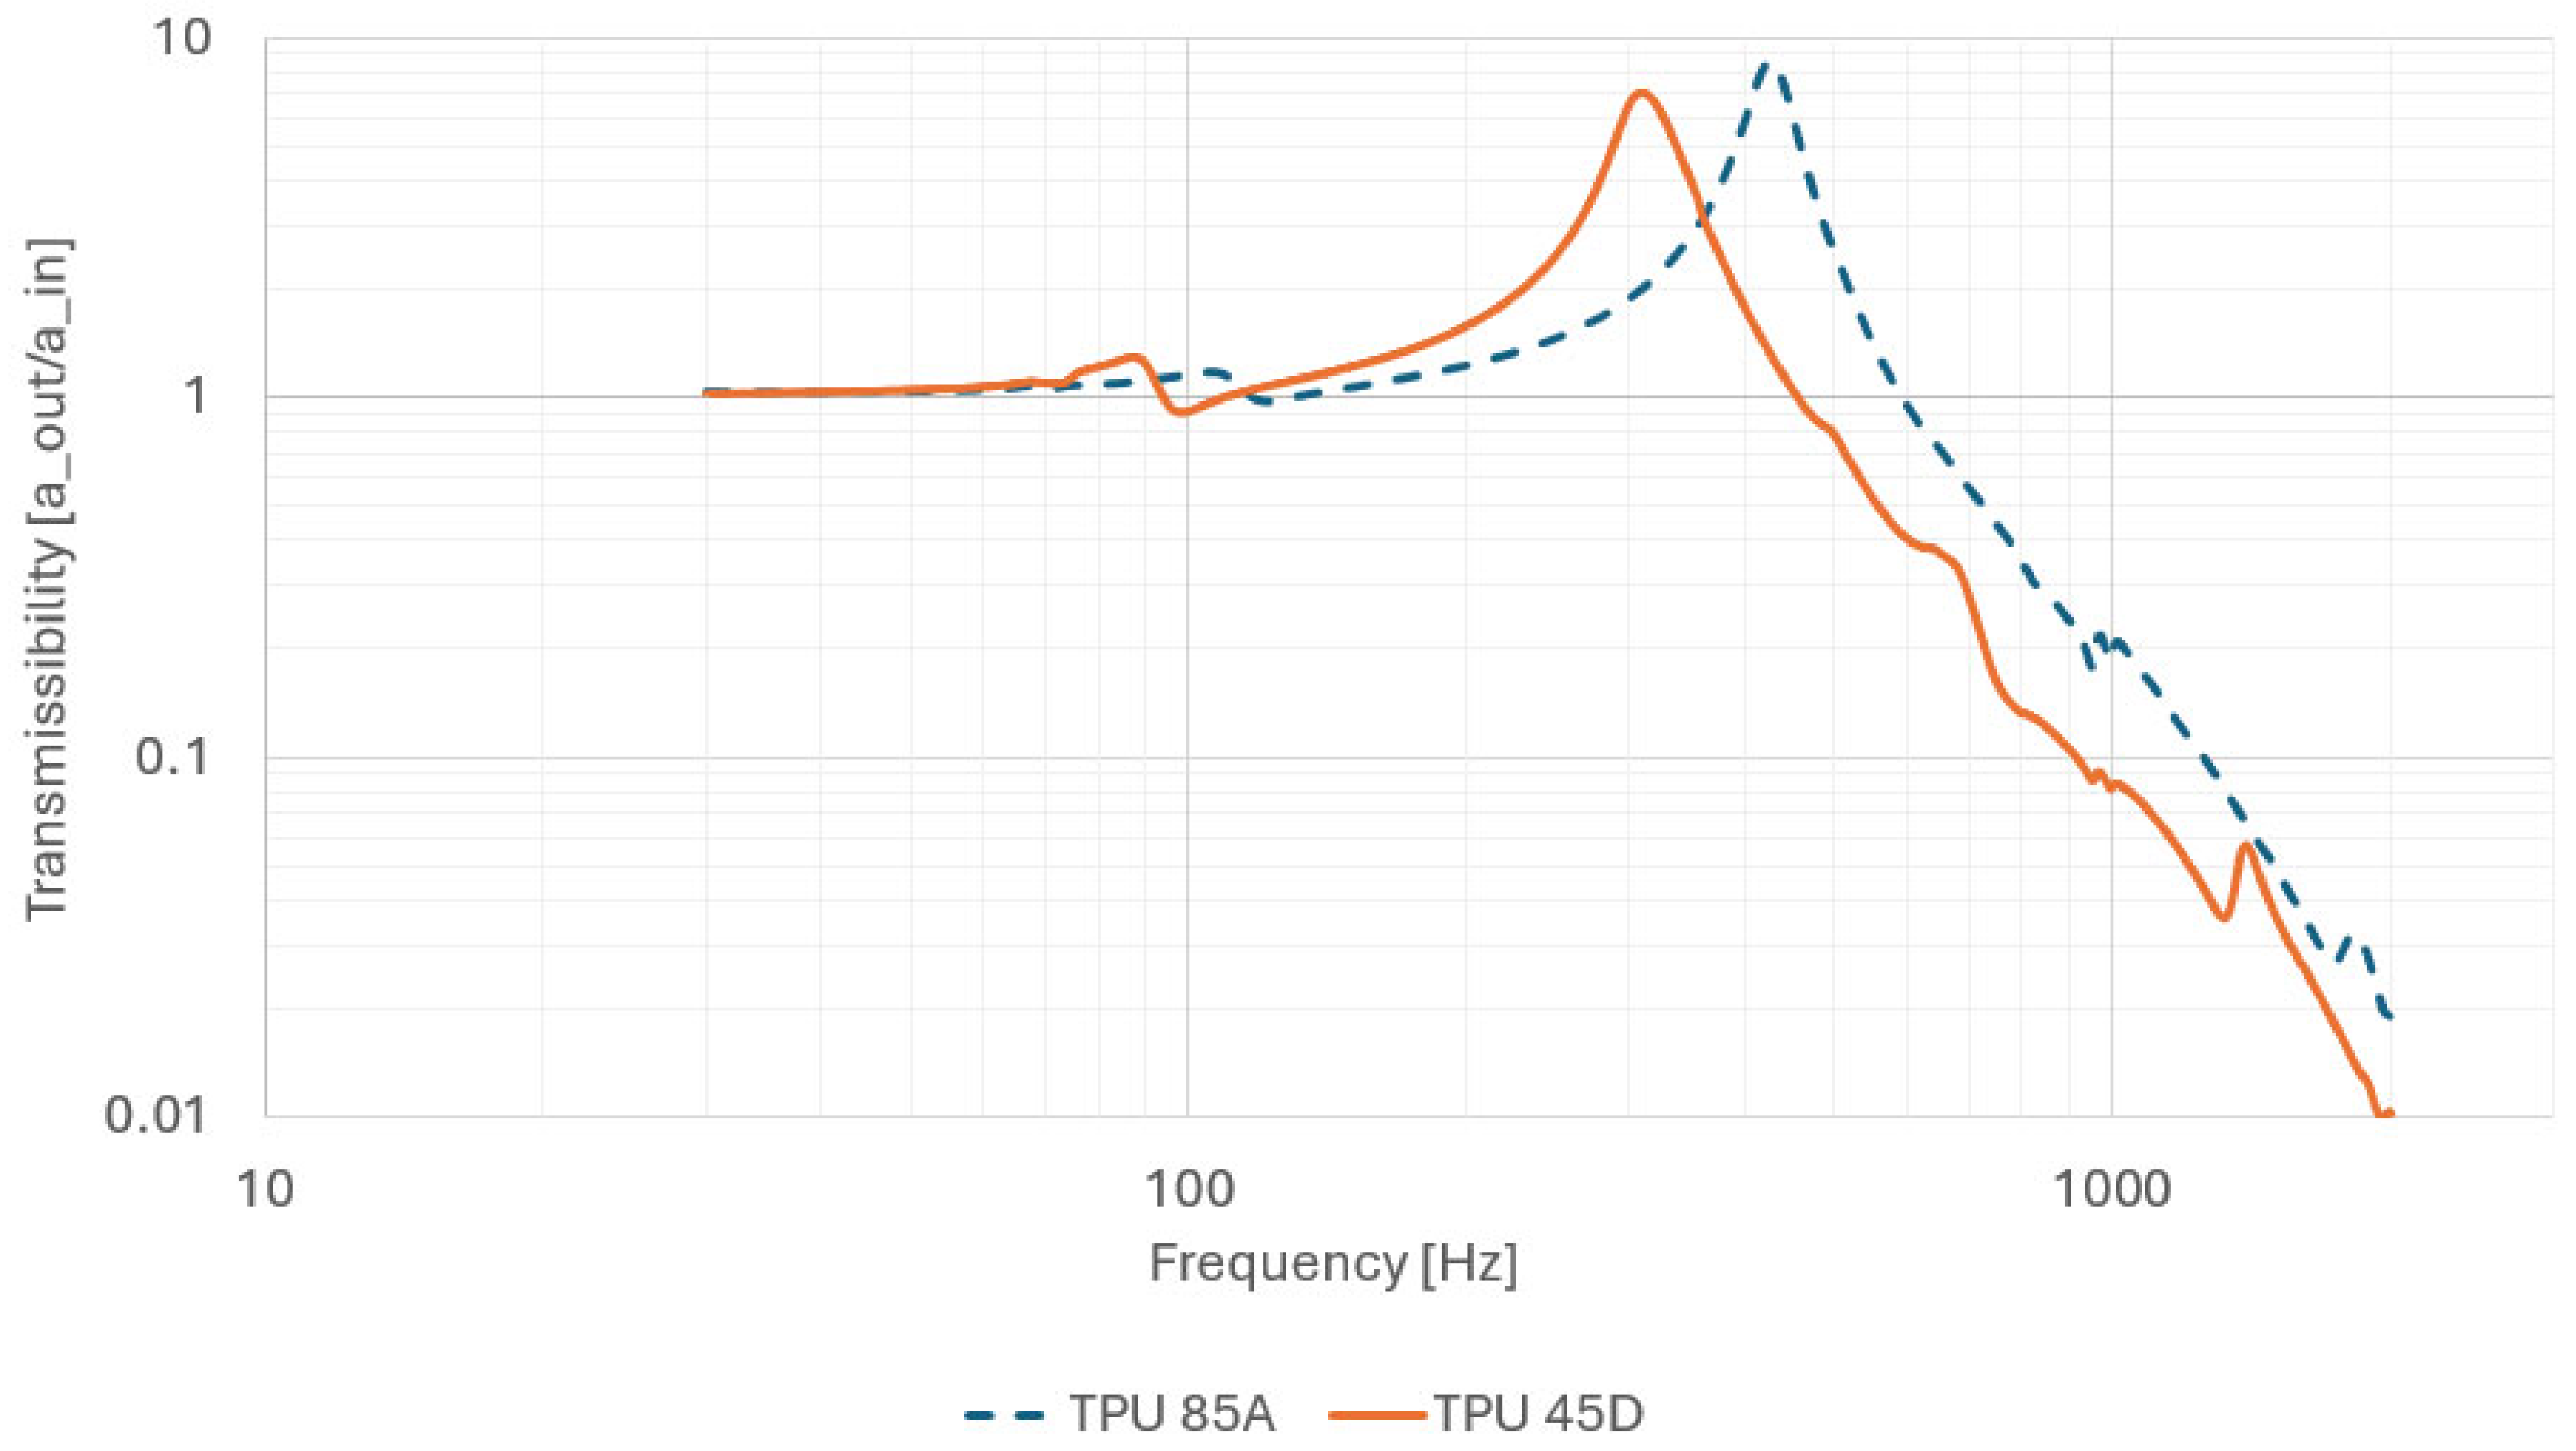
To complement the geometry- and mounting-related findings (H1–H3), Example 1 investigates a constant design with varying TPU hardness. As shown in
Figure 7, changes in stiffness and mass shift the resonance frequency, whereas resonance amplification and peak shape change only modestly. This indicates a sensitivity to material hardness.
Although TPU 45D and TPU 85A are reported on different Shore hardness scales (D and A) that are not directly comparable in absolute terms, the results indicate that the TPU 85A specimens exhibited a higher effective stiffness under the investigated conditions. This pattern was observed across multiple designs in the data set, although a formal statistical comparison was not performed.
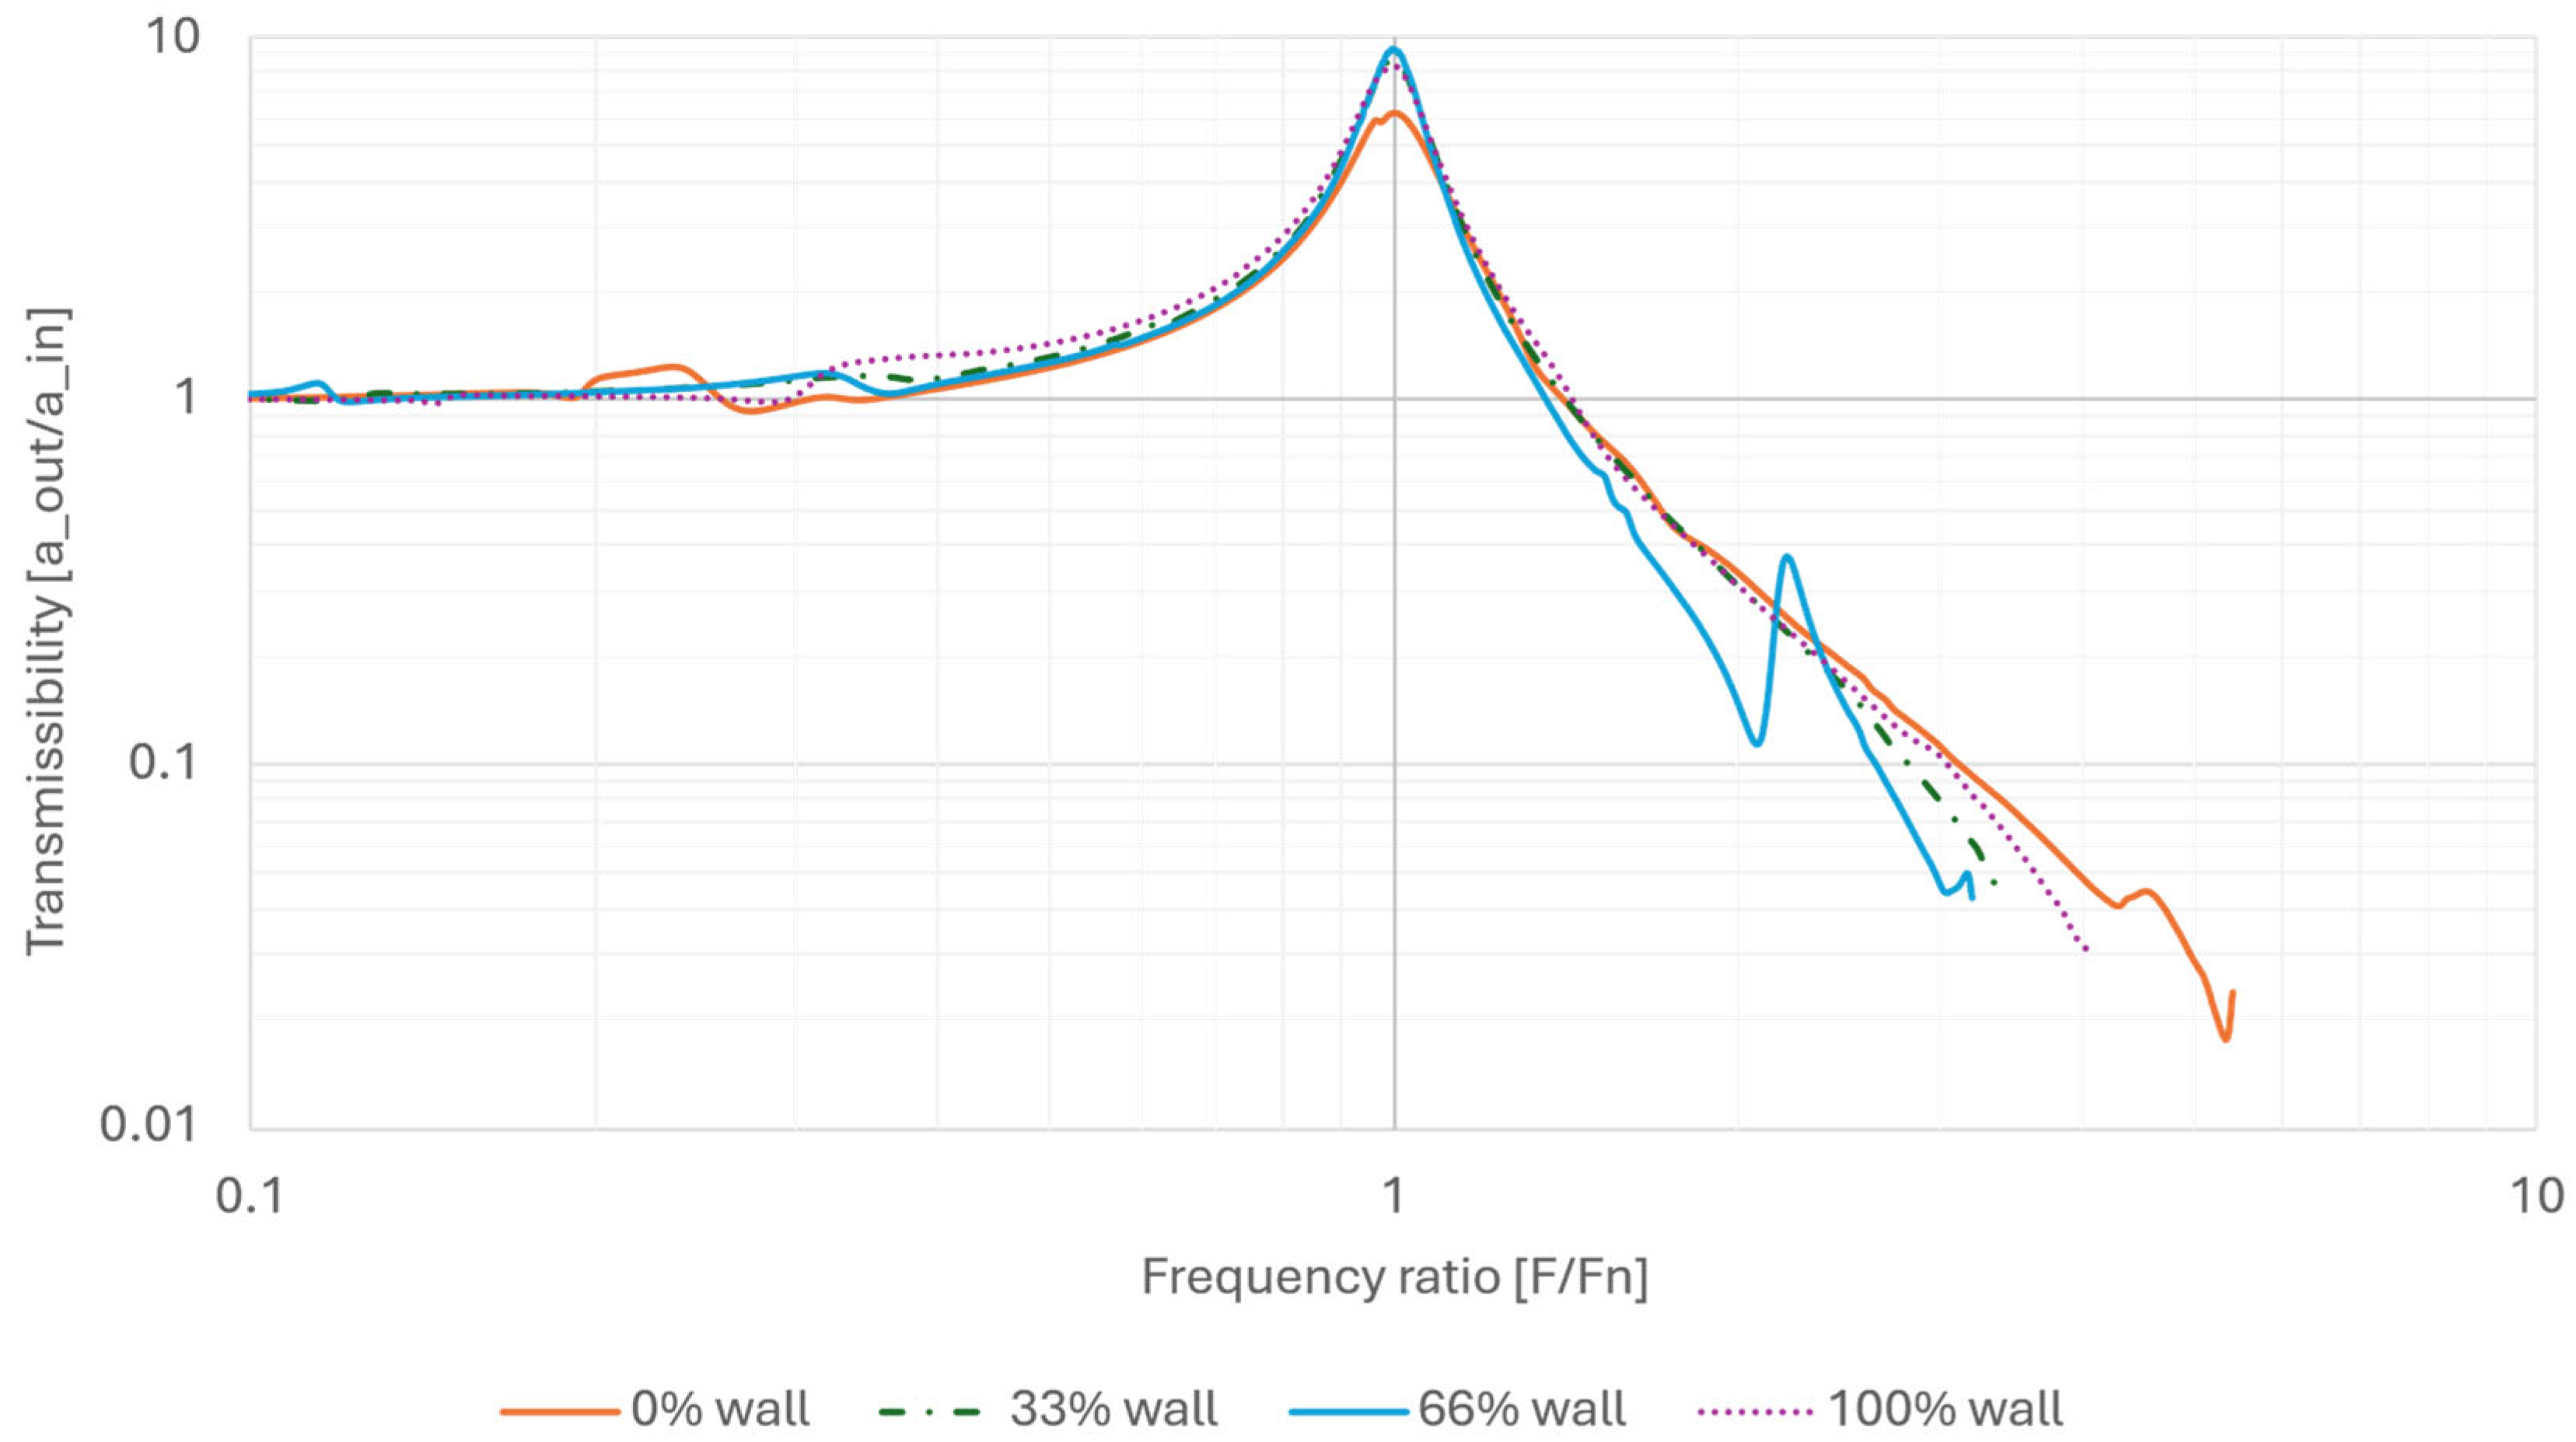
To further assess the influence of wall thickness while keeping material hardness constant, Example 2 varies the wall thickness (see
Section 2.2, parameter t).
Figure 8 indicates that the resonance-region response and isolation-region slope change only slightly across the investigated wall-thickness range. This example provides trend-level support for H1 (wall thickness) rather than a complete factorial validation.
Similar resonance-region behavior, except for the 0% wall variant.
Similar isolation-region log–log slope magnitude |n|, except for the 66% wall variant.
Wall thickness constitutes a constructive lever for tuning stiffness, mass, and resonance frequency; within the investigated range, this relationship is not strictly monotonic (see
Section 3.3, H1). In contrast, the resonance-region response changes only modestly with wall thickness.
Accordingly, the wall thickness can be adjusted to tune stiffness and mass properties for a given design application without introducing major unintended changes in resonance amplification or in the isolation-region slope within the investigated parameter range.
The process-related hypotheses H5 and H6 were addressed only exploratorily within the present manufacturing campaign; since neither the slicer-defined infill fraction nor the relevant process parameters were varied in a complete systematic parameter study, no quantitative validation of these hypotheses is claimed.
3.4. Nonlinearity as a Simulation Finding and Experimental Interpretation
Nonlinear effects and a two-stage stiffness response could be represented as plausible mechanisms in the numerical investigations. In the simulated force–displacement response of the hard-stop variant, the transition between the two stiffness regions is visible as a weak but recognizable change in slope once the stop gap closes, whereas the wall-thickness variants exhibit an essentially constant slope over the same displacement range. The mechanism is therefore reproduced by the model at the level of the intended design principle. However, this behavior could not be confirmed unambiguously in the transmissibility measurements conducted with the present shaker setup, even when selected specimens were additionally measured at higher excitation levels in order to reach the stop-contact regime. Accordingly, nonlinearity is treated in this work as a design and simulation finding rather than an experimentally demonstrated function. As a next experimental step, load cases with higher short-duration excitation levels, such as shock/impact tests or alternative large-deflection protocols, appear suitable for deliberately exciting nonlinear regions of the force–displacement characteristic. The blocking mechanism has so far been assessed only by manual overload checks; future work will evaluate this function using dedicated experimental protocols.
3.5. Initial Population of the Parametric Design Map
In this work, the Parametric Design Map is populated for the first time with design parameters, simulation-derived trends, and experimental performance metrics. At the principle level, it documents requirement coverage by the principle building blocks and makes explicit which functions are experimentally supported and which remain design assumptions. At the parameter level, the input variables and process/orientation settings are mapped to the measured output metrics. Where repeated data are available, manufacturing- and assembly-related scatter can be added as tolerance information in subsequent map development.
In its current form, the map serves primarily as a structured working and documentation basis following design and data acquisition. Looking forward, it can be expanded into a catalog-like tool that enables rapid preselection of suitable variants for recurring interfaces and supports targeted parameterization based on measurement-backed performance metrics.
4. Discussion
This work investigated additively manufactured vibration isolators as a lightweight-compatible approach to reducing structure-borne cabin noise in VIP interiors. Based on an application-driven requirement set, design principles and a parameterized design space were defined. Candidate selection was supported by finite element analysis as a pre-screening step and subsequently assessed experimentally on an electrodynamic shaker via axial transmissibility measurements against a series-production reference.
The results indicate that axial transmission behavior can be tuned through geometric parameters. In particular, wall thickness and internal architecture shift resonance location and modify resonance amplification, along with the transmissibility response beyond the associated crossover frequency, in the expected trend. Within the present experimental scope, H1 is supported at trend level by the observed stiffness–resonance relationship, though this relationship is not strictly monotonic across the full tested range; H2 could not be evaluated quantitatively, since the slicer-defined infill fraction was not investigated systematically and the intended anisotropic relation remains to be quantified radially; and H3 is supported qualitatively through the use of a controlled preload and defined mounting conditions. H4 is qualitatively supported by simulation only, with no experimental functional validation achieved, whereas the process-related observations associated with H5–H6 are exploratory rather than a complete factorial validation. Accordingly, the study substantiates the experimentally addressed trends without claiming full validation of all six hypotheses. The integrated variant nevertheless indicates that several targeted requirements can be combined within a single design concept, supporting the overall feasibility of the proposed workflow.
The unexpected finding that TPU 85A exhibited higher effective stiffness than TPU 45D (
Section 3.3) warrants further interpretation. Shore A and Shore D represent different hardness scales and their numerical values are therefore not directly comparable. Nevertheless, the observed stiffness ordering cannot be explained solely by the nominal hardness designation. Related work on PLA/TPU blend systems indicates that nominal Shore hardness, while generally related to material stiffness, does not uniquely determine the mechanical response of an additively manufactured material system. Differences in hard-to-soft segment composition have been shown to strongly influence frequency-dependent storage modulus and viscoelastic behavior, while grade-specific processing behavior, including extrusion stability, dimensional accuracy, and interlayer adhesion, can also contribute to differences in the resulting mechanical performance [
27]. In a related PLA/TPU system, an intermediate-hardness grade was even reported to outperform a nominally stiffer grade in specific mechanical metrics due to differences in phase compatibility, although this blend-specific mechanism does not directly apply to the unblended, printed TPU isolators studied here [
27]. Because the nominal isolator geometry was held constant in this comparison, differences in the intended design geometry cannot explain the observed trend. However, a contribution from grade-specific additive manufacturing behavior, such as differences in interlayer bonding between the TPU grades, cannot be ruled out with the present data. Clarifying this behavior would require dedicated material characterization, for example via dynamic mechanical analysis at the relevant frequencies, which is beyond the scope of the present isolator-level study.
The observed trend that lower effective coupling stiffness shifts the isolation resonance toward lower frequencies is consistent with classical vibration-isolation theory [
12,
26] and with high-static-low-dynamic-stiffness and quasi-zero-stiffness concepts reported in the literature [
13,
14,
15,
24,
25]. In this context, the contribution of additive manufacturing is not a new isolation mechanism in itself, but the ability to implement and vary stiffness-shaping geometries and direction-dependent architectures systematically, as also motivated by prior work on additively manufactured isolators and mechanical metamaterials [
14,
16,
17,
18,
19]. The present results extend these concepts toward aircraft-interior interface design by linking parameterized geometry, manufacturing, pre-screening simulation, and shaker-based verification within one workflow.
The Parametric Design Map was populated for the first time with design parameters, process information, and measurement-based metrics, thereby providing a consistent basis for continued variant development toward a catalog-like sizing tool. Although the overall approach remains at an early stage, the results support its practical applicability and show that the transition from parametric design to experimentally verifiable and comparable performance metrics is feasible in an application-oriented context.
Two limitations are particularly relevant to the interpretation of the present results. First, the experimental characterization is restricted to axial transmissibility. Consequently, the intended direction-dependent stiffness relation cannot be quantified from the present measurements and requires additional characterization in at least one radial direction. Second, the experimental campaign was designed primarily for comparative assessment of parameter trends rather than for population-level statistical characterization. A formal repeatability analysis across a larger number of independently manufactured specimens was therefore not performed, and the reported trends should not be interpreted as statistical estimates of manufacturing variability. The numerical analyses should likewise be interpreted as qualitative pre-screening only, since no formal mesh-convergence study or quantitative simulation-to-experiment validation was performed within the present work. Long-term behavior, environmental and aging effects, certification-relevant substantiation, and complete experimental characterization of nonlinear mechanisms likewise remain outside the scope of the present study.
As a next methodological step, the shaker setup is intended to be extended to experimentally capture a second axis in addition to axial characterization. Direction-dependent tuning is already embedded in the design and can, among other levers, be varied through the material selection of the inner cylinder; however, robust quantification requires an appropriate fixture concept and measurement strategy. In parallel, initial investigations using mechanically most promising variants have been conducted in a VIP cabin demonstrator, intended as a precursor to subsequent acoustic assessment. These realistic tests are still at an early stage and are currently under evaluation.
Furthermore, the experimental study is to be transferred to a simulation-based parameter analysis using models to be developed and validated against the experimental data obtained. A complementary repeatability study should further include multiple independently manufactured specimens for selected variants together with repeated measurements under identical mounting and excitation conditions. This would allow specimen-to-specimen variability to be distinguished from measurement and assembly variability and would enable uncertainty ranges to be reported for the key transmissibility-derived metrics.
5. Conclusions
Overall, this work provides a verifiable methodological framework that links parameterization, manufacturing reality, and measurement-based performance metrics. The results indicate that axial transmission behavior can be tuned through geometric parameters, while the investigated process-related effects remain exploratory. Within the present experimental scope, H1 received partial trend-level support; H2 could not be evaluated quantitatively, as the slicer-defined infill fraction was not investigated systematically, and the intended direction-dependent (anisotropic) stiffness relation remains experimentally unverified and requires radial characterization in future work; and H3 was implemented as a controlled mounting/preload condition, while the hypothesized improvement in repeatability was not quantitatively assessed. The hard-stop/nonlinear mechanism (H4) remains a design and simulation finding, and the process-related effects (H5–H6) require broader validation. Likewise, because no formal repeatability study across a larger specimen population was performed, the reported parameter effects are interpreted at trend level rather than as population-level statistical estimates. The workflow therefore provides a sound basis for more targeted sizing and systematic development of additively manufactured isolators, enabling a stepwise transition from variant exploration toward robust, reusable design solutions for specific aircraft interior interfaces.