1. Introduction
The relevance of research into FEM modeling of coupled vibrations and tool wear in percussive–rotary drilling is fundamentally rooted in the modern imperative to optimize multi-disciplinary mining, civil engineering, and heavy industrial workflows [
1]. Contemporary operations are heavily reliant on high-performance mechanical and dynamical systems, such as vibrating screens and multi-motor gear drives, where complex multi-body dynamical interactions dictate overall equipment longevity [
2]. By integrating advanced numerical modeling to address rock-cutting elements’ wear under combined vibrational stresses, this research bridges a crucial gap between raw technological advancement and energy resource extraction efficiency [
1,
2,
3]. It directly complements modern efforts in synthesis technology and performance indicator development aimed at boosting mining enterprise productivity while concurrently safeguarding electrical networks (such as IT-type systems) from fault hazards caused by heavy machinery disruptions [
1,
3,
4].
Deep and horizontal well drilling is a critical operation in hydrocarbon exploration, geothermal energy production, and mining [
5]. The efficiency of this process is largely determined by the interaction between rock-cutting elements—such as polycrystalline diamond compact (PDC) cutters and tungsten carbide–cobalt (WC-Co) inserts—and the rock formation. Among the many factors that affect drilling performance, downhole vibrations are recognized as one of the most detrimental [
5,
6]. These vibrations not only reduce the rate of penetration (ROP) but also significantly accelerate the wear and premature failure of RCEs, leading to increased non-productive time (NPT) and higher operational costs.
Three principal vibration modes are distinguished in drill string dynamics: axial (bit bounce), torsional (stick–slip), and lateral (whirl) [
7]. Axial vibrations arise from the periodic indentation and release of the bit against the bottom hole, causing fluctuations in the weight on bit (WOB). Torsional vibrations, particularly the stick–slip phenomenon, are characterized by alternating phases of sticking (zero angular velocity) and slipping (sudden acceleration), which generate torque spikes that can exceed the average torque by 200–300% [
8]. Recent experimental studies on PDC bits in interbedded formations [
9] and numerical investigations of nonlinear drill string dynamics [
10] have further confirmed that stick–slip is strongly influenced by formation heterogeneity and the presence of a positive displacement motor (PDM) [
11]. Such extreme torque oscillations impose cyclic fatigue loads on PDC cutters, leading to chipping, delamination, and complete fracture. For WC-Co inserts, stick–slip accelerates spalling and abrasive wear through micro-impact and frictional heating [
12]. Lateral vibrations (whirl) cause the bit to rotate around the borehole axis, resulting in erratic cutting and accelerated gauge wear. The coupling of lateral and torsional modes in deviated wells has been analyzed recently [
13], showing that borehole curvature can amplify vibration severity [
14].
Building upon these operational advancements, the integration of advanced computational analysis is increasingly vital for adapting mining and energy infrastructures to modern sustainability and smart management frameworks. In modern mining, traditional excavation is shifting toward alternative methods like borehole hydro technology, which demands highly specialized downhole tools capable of enduring unique fluid–structure dynamics and abrasive wear during sustainable iron ore extraction [
15]. At the same time, the broader industrial and energy ecosystems are rapidly transitioning toward decentralized structures—ranging from local electricity systems relying on smart monitoring and renewable energy sources to solid biofuel and bio-resource generation networks [
16,
17]. Optimizing these diverse, decentralized systems under macroeconomic or political instability requires a comprehensive understanding of mechanical reliability [
3,
18]. Whether analyzing the intense transient loads in a slabbing mill’s heavy multi-motor gear drive or ensuring the continuous operation of localized power generation units, the ability to predict material fatigue and tool wear via FEM modeling provides the foundational data needed to guarantee both energy security and equipment resilience across interconnected industrial sectors [
3,
19].
Despite decades of research, most existing dynamic models of drill strings remain one-dimensional and treat axial and torsional vibrations separately [
14,
20]. These simplified approaches often assume a constant coefficient of friction and ignore the evolution of the wear flat (the worn area on the RCE that grows with time). However, field data and recent experimental studies have demonstrated a strong positive feedback loop: as the RCE wears, the contact area increases, the effective friction force rises, and the torque oscillations become more intense—which in turn accelerates further wear [
21,
22]. Advanced finite-element models that account for frictional contact with anisotropic damage [
23] and the influence of cutter geometry on nonlinear vibration [
24] have begun to address these complexities, but a fully coupled thermo-mechanical model that includes wear flat evolution, three vibration modes, and rock-dependent friction remains absent.
Moreover, the influence of rock type (e.g., abrasive sandstone vs. hard granite) and RCE geometry (back rake angle, contact area, edge preparation) on the vibration response is seldom integrated into a single predictive framework. For instance, a cutter with a small back rake angle (10–15°) cuts more aggressively but generates higher tangential forces and torque oscillations, whereas a WC-Co insert with a blunted tip reduces stress concentration but may exacerbate stick–slip under high WOB [
25]. The rock’s unconfined compressive strength (UCS) and abrasivity further modulate the friction coefficient and the rate of wear flat growth, making the system highly nonlinear. Recent work on ultrasonic vibration-assisted rock breaking [
26] and rock–bit interaction effects on high-frequency stick–slip [
27] has opened new possibilities for active vibration control, but their integration with predictive models is still in its infancy.
Several authors have attempted to address these limitations using finite element (FE) modeling [
28,
29], but most of these studies focus either on the chip formation process (quasi-static) or on the global drill string dynamics (linearized). A fully coupled thermo-mechanical model that accounts for wear flat evolution, three vibration modes, and rock-dependent friction remains absent from the literature.
The aim of this work is to develop an integrated finite element model of the dynamic interaction between a single RCE and rock, coupling axial and torsional vibrations with the evolution of wear flat, friction, and temperature. It is important to clarify that while the model considers the three vibration modes (axial, torsional, lateral), the lateral mode is primarily treated as an observed output and a source of noise in the torsional measurements. The primary coupling in the MDOF model is between axial and torsional vibrations. The model explicitly includes the geometry of the RCE (back rake angle, contact area) and the mechanical properties of two representative rocks: sandstone (soft, abrasive) and granite (hard, brittle). The numerical results are validated against laboratory experiments performed on a drilling stand equipped with low-cost MEMS accelerometers, which have recently been shown to be viable alternatives to expensive piezoelectric sensors for drilling applications [
30]. Additionally, the effect of thin TiN coatings (3–5 nm) on vibration mitigation is evaluated, building on recent findings of improved wear resistance from PVD-coated rock-cutting inserts [
31,
32].
Based on the validated model, we construct safe operating charts (WOB-RPM diagrams) that define green (low vibration), yellow (caution), and red (high risk) zones for each rock–RCE combination. These charts provide a practical tool for drilling operators to select regimes that minimize vibration-induced wear while maintaining competitive ROP. The paper also proposes an optimisation criterion that balances ROP and vibration amplitude, with potential applications in real-time drilling control systems [
11,
33].
2. Coupled Thermo-Mechanical Modeling and Experimental Setup
To comprehensively evaluate the complex dynamic interactions and degradation mechanisms in percussive–rotary drilling, a hierarchical multi-scale methodology is established [
10,
11,
34]. This framework integrates a global, reduced-order Multi-Degree-of-Freedom (MDOF) model describing the macro-scale dynamics of the drill string–bit–rock system with local, high-fidelity three-dimensional Finite Element Method (FEM) simulations executed in ANSYS Mechanical, version 2024 R1 (Explicit Dynamics module) [
10,
35]. While the MDOF framework captures the overall coupled axial and torsional vibrations (including non-linear phenomena such as bit bounce and stick–slip), the explicit FEM simulations serve as a high-fidelity “virtual experiment” [
13,
36]. These numerical simulations model the discrete thermo-mechanical contact, stress distributions, localized damage propagation, and instantaneous flash temperatures generated at the interface between a single tungsten-cobalt (WC-Co) rock-cutting element and the heterogeneous rock strata [
8,
10,
37].
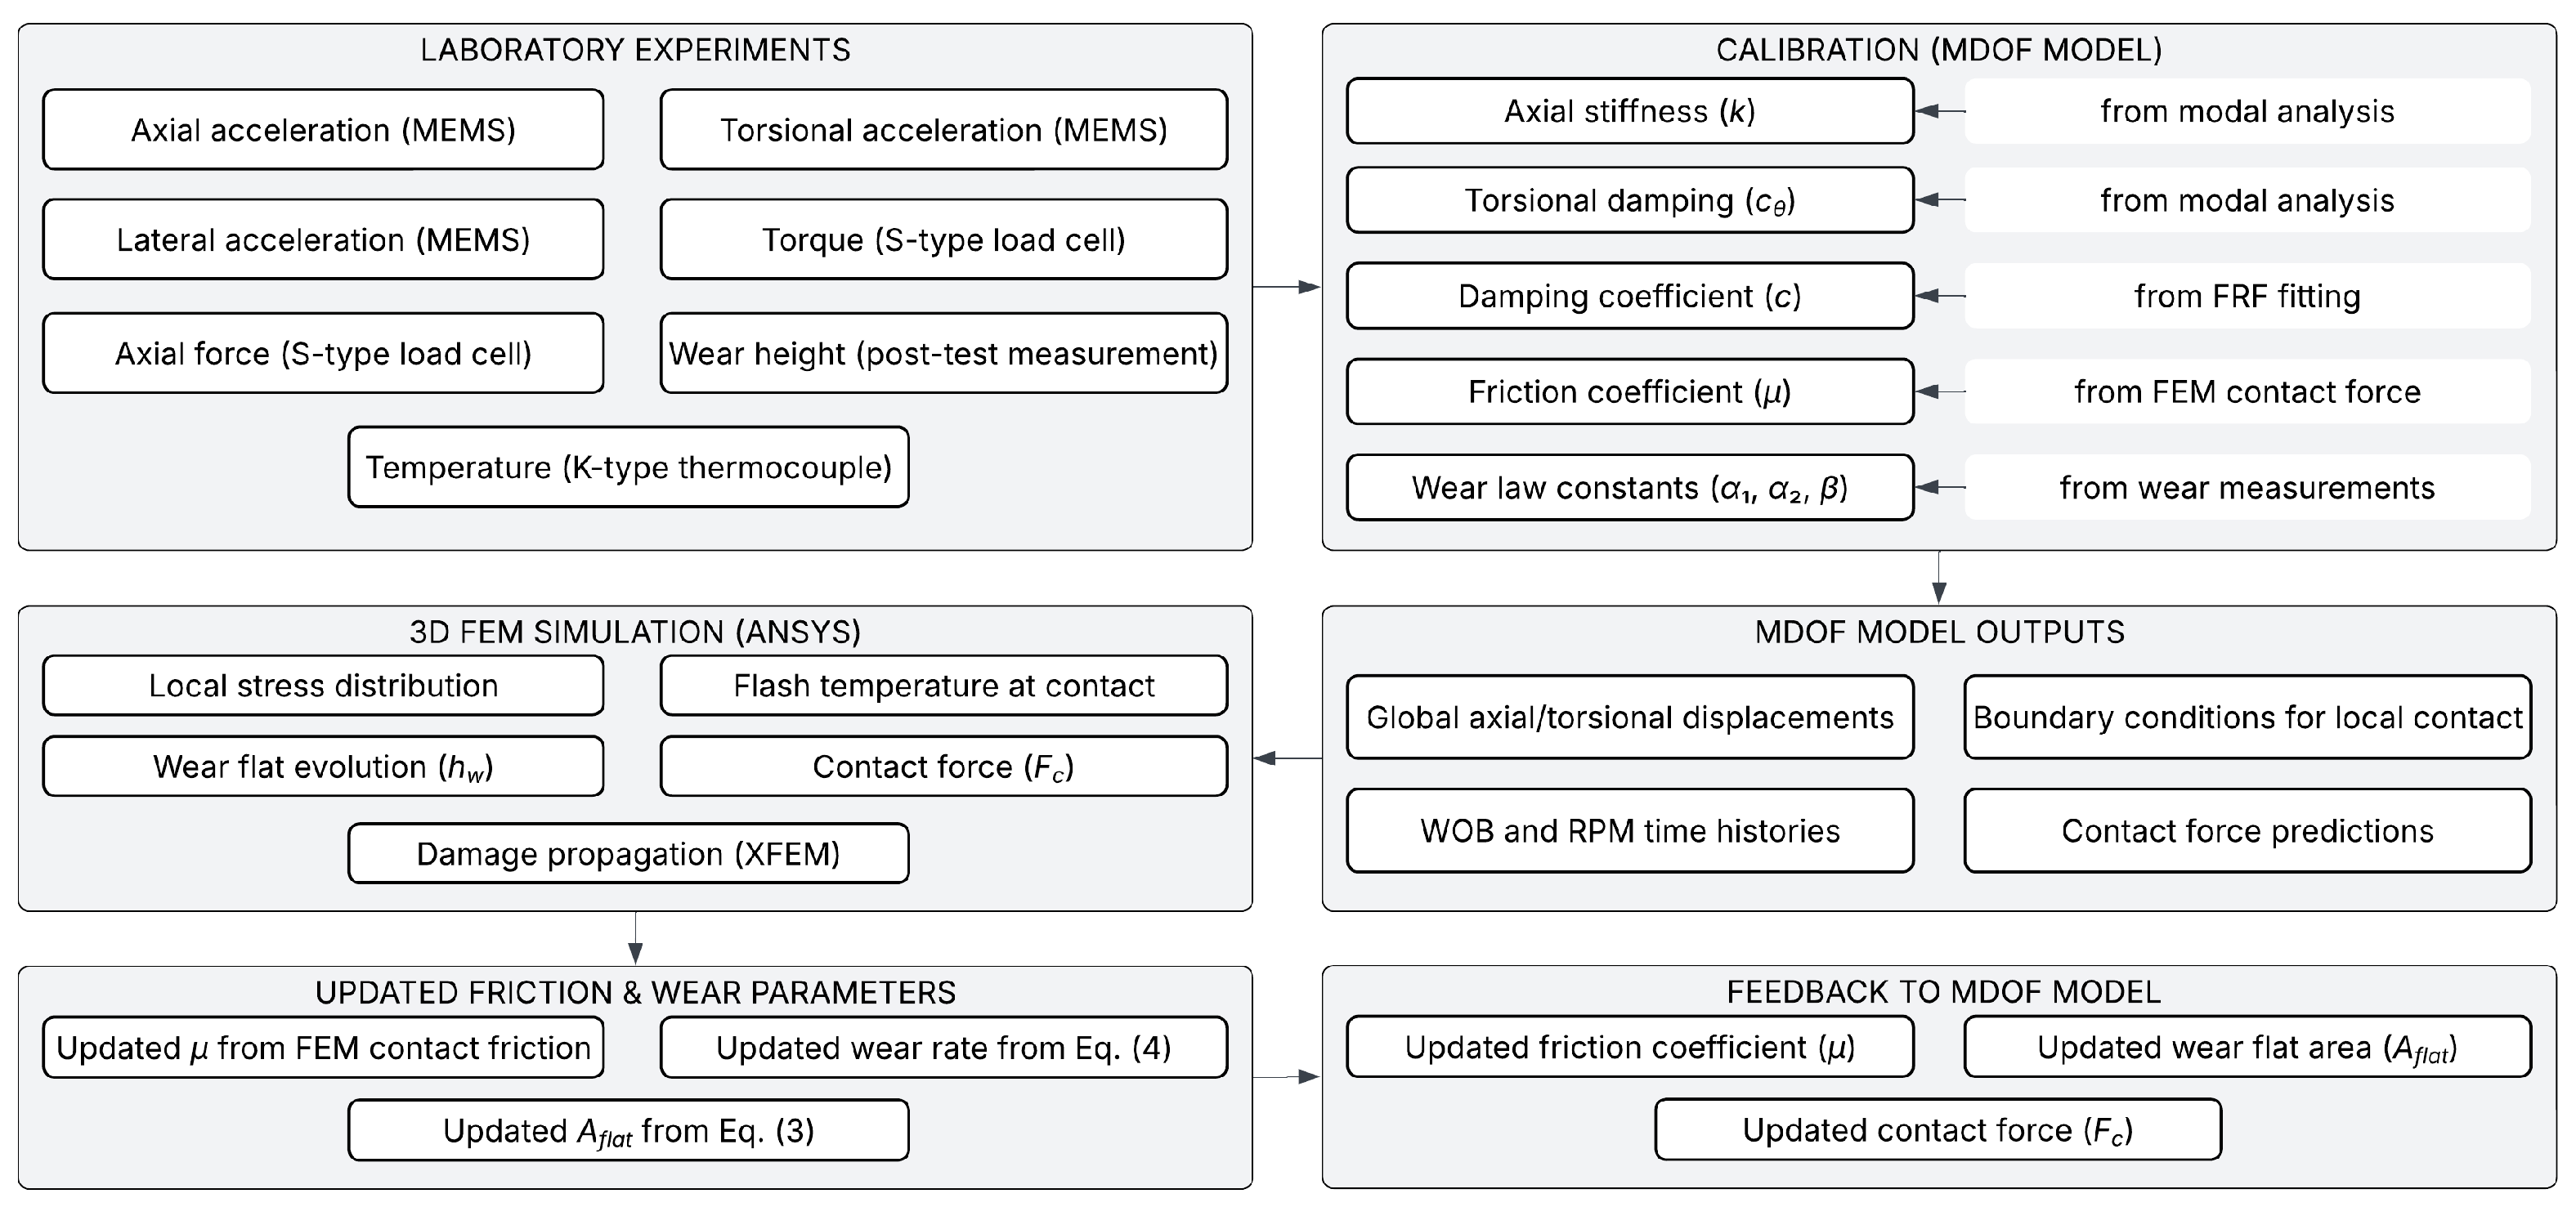
The relationship between the global MDOF model and the FEM simulations is as follows: The FEM provides detailed local contact characteristics—including contact forces, flash temperature, stress distribution, and wear flat evolution—under controlled kinematic conditions (prescribed WOB, RPM, and penetration depth). These local results are then used to calibrate and validate the global model parameters, such as the axial and torsional stiffnesses (
,
), damping coefficients (
), friction coefficient (
), and the wear law constants (
,
,
). In this sense, the FEM acts as a “virtual experiment” that generates high-fidelity contact data, which is then upscaled and integrated into the reduced-order MDOF framework (
Figure 1). This hierarchical coupling ensures that the global model captures the essential physics of the RCE–rock interaction while remaining computationally efficient for parametric studies and real-time optimization.
The localized micro-scale contact outputs derived from the FEM model are subsequently upscaled to calibrate and validate the macro-scale physical parameters of the global system, ensuring a computationally efficient yet physically rigorous model capable of predicting long-term tool wear [
34,
38].
The empirical validation of this coupled numerical framework is supported by a series of controlled laboratory drilling tests conducted on a specialized, instrumented experimental drilling stand capable of isolating structural responses under varying operational conditions [
10,
37,
38]. The experimental program utilizes two highly distinct geological materials representing contrasting mechanical boundaries: soft, abrasive sandstone from the Dnipro-Donets basin and hard, brittle granite from the Korosten pluton [
7,
39]. Real-time dynamic behaviors, including axial, lateral, and torsional accelerations, are continuously captured via high-frequency MEMS accelerometers, while contact forces and local thermal profiles are monitored using integrated S-type load cells and embedded K-type thermocouples, respectively [
10,
38,
40]. Furthermore, laboratory investigations explicitly evaluate the performance of both uncoated and ultra-thin, nanoscale physical vapor deposition (PVD) titanium nitride (TiN) coated WC-Co inserts [
10,
41]. This comprehensive experimental arrangement provides the empirical baseline necessary to identify the system’s structural natural frequencies through modal analysis and to calibrate the mathematical equations governing structural dynamics and wear evolution.
The drill string–bit–rock system is represented as a multi-degree-of-freedom (MDOF) system with axial and torsional degrees of freedom. The governing equation is:
where
(kg),
(N·s/m), and
(N/m) are the mass, damping (including velocity-dependent friction), and stiffness matrices;
contains the axial displacement
(m) and angular displacement
(rad);
is the external force vector (N) from the top drive (WOB and torque).
The non-linear contact force between the RCE and the rock is given by:
where
is the number of RCEs (dimensionless),
is the friction coefficient (0.1–0.3) (dimensionless),
is the initial cutting area (m
2) and
is the wear flat area (m
2), which evolves with wear height
as:
where
is the contact length (m) and
is the flank wear radius (m). This formulation explicitly couples the contact force to the wear progression.
The wear flat grows with time according to an Archard-type law coupled with temperature:
where
is the wear height (m),
the contact stress (Pa),
the sliding velocity (m/s),
the rock abrasivity (g/cm
3),
the impact force from axial vibrations (N),
the flash temperature (K), and
(m
2/N),
(m/N),
(m/(s·K)) calibrated constants.
is the activation energy (J/mol),
the gas constant (J/(mol·K)), and
the effective contact temperature (K).
The constants
,
, and
were calibrated using a combination of our previous experimental data [
22] and literature values for similar WC-Co-rock tribosystems [
12]. Specifically,
is primarily governed by rock abrasivity
and was set in the range of
–
m
2/N, while
depends on the thermal conductivity of the RCE material and was varied between
and
m/(s·K). The impact-related coefficient
was adjusted in the range of
–
m/N to match the observed acceleration of wear under high-amplitude axial vibrations. The calibration procedure minimized the root-mean-square error between the predicted and measured wear heights across all test conditions.
Axial vibrations (bit bounce) are governed by the simplified equation:
where
is the modal mass (kg),
the damping coefficient (N·s/m),
the stiffness (N/m), and
the non-linear rock reaction force (N).
Torsional vibrations (stick–slip) are described by:
with
(N·m), where
is the polar moment of inertia (kg·m
2),
the torsional damping (N·m·s),
the applied torque (N·m),
the axial force on the RCE (N), and
the effective radius (m). The Stribeck effect for low velocities is included to model the transition from static to kinetic friction.
The axial stiffness and damping in Equation (5), as well as the torsional damping in Equation (6), were determined from experimental modal analysis of the laboratory drilling stand.
To account for the discrete nature of cutting, the axial rock reaction force
in Equation (6) is decomposed into a static component and a dynamic percussion component:
where
represents the mean cutting force due to WOB, and
is the periodic percussion force generated by the cyclic contact of multiple RCEs with the rock. This periodic forcing is expressed as:
with the percussion frequency:
where
is the number of RCEs in contact with the rock,
is the rotation speed (revolutions per minute),
is the amplitude of the percussion force (determined from the impact energy and rock properties), and
is the phase shift. This formulation explicitly couples the axial vibrations to the kinematic parameters of the drilling process, allowing the model to capture the periodic excitation generated by the passage of each cutting element over the rock surface.
The axial and torsional vibration modes are coupled through the wear flat area that modifies the friction torque and through the dynamic modulation of WOB by axial vibrations. Lateral vibrations were monitored experimentally for model validation but were not explicitly included in the coupled MDOF formulation.
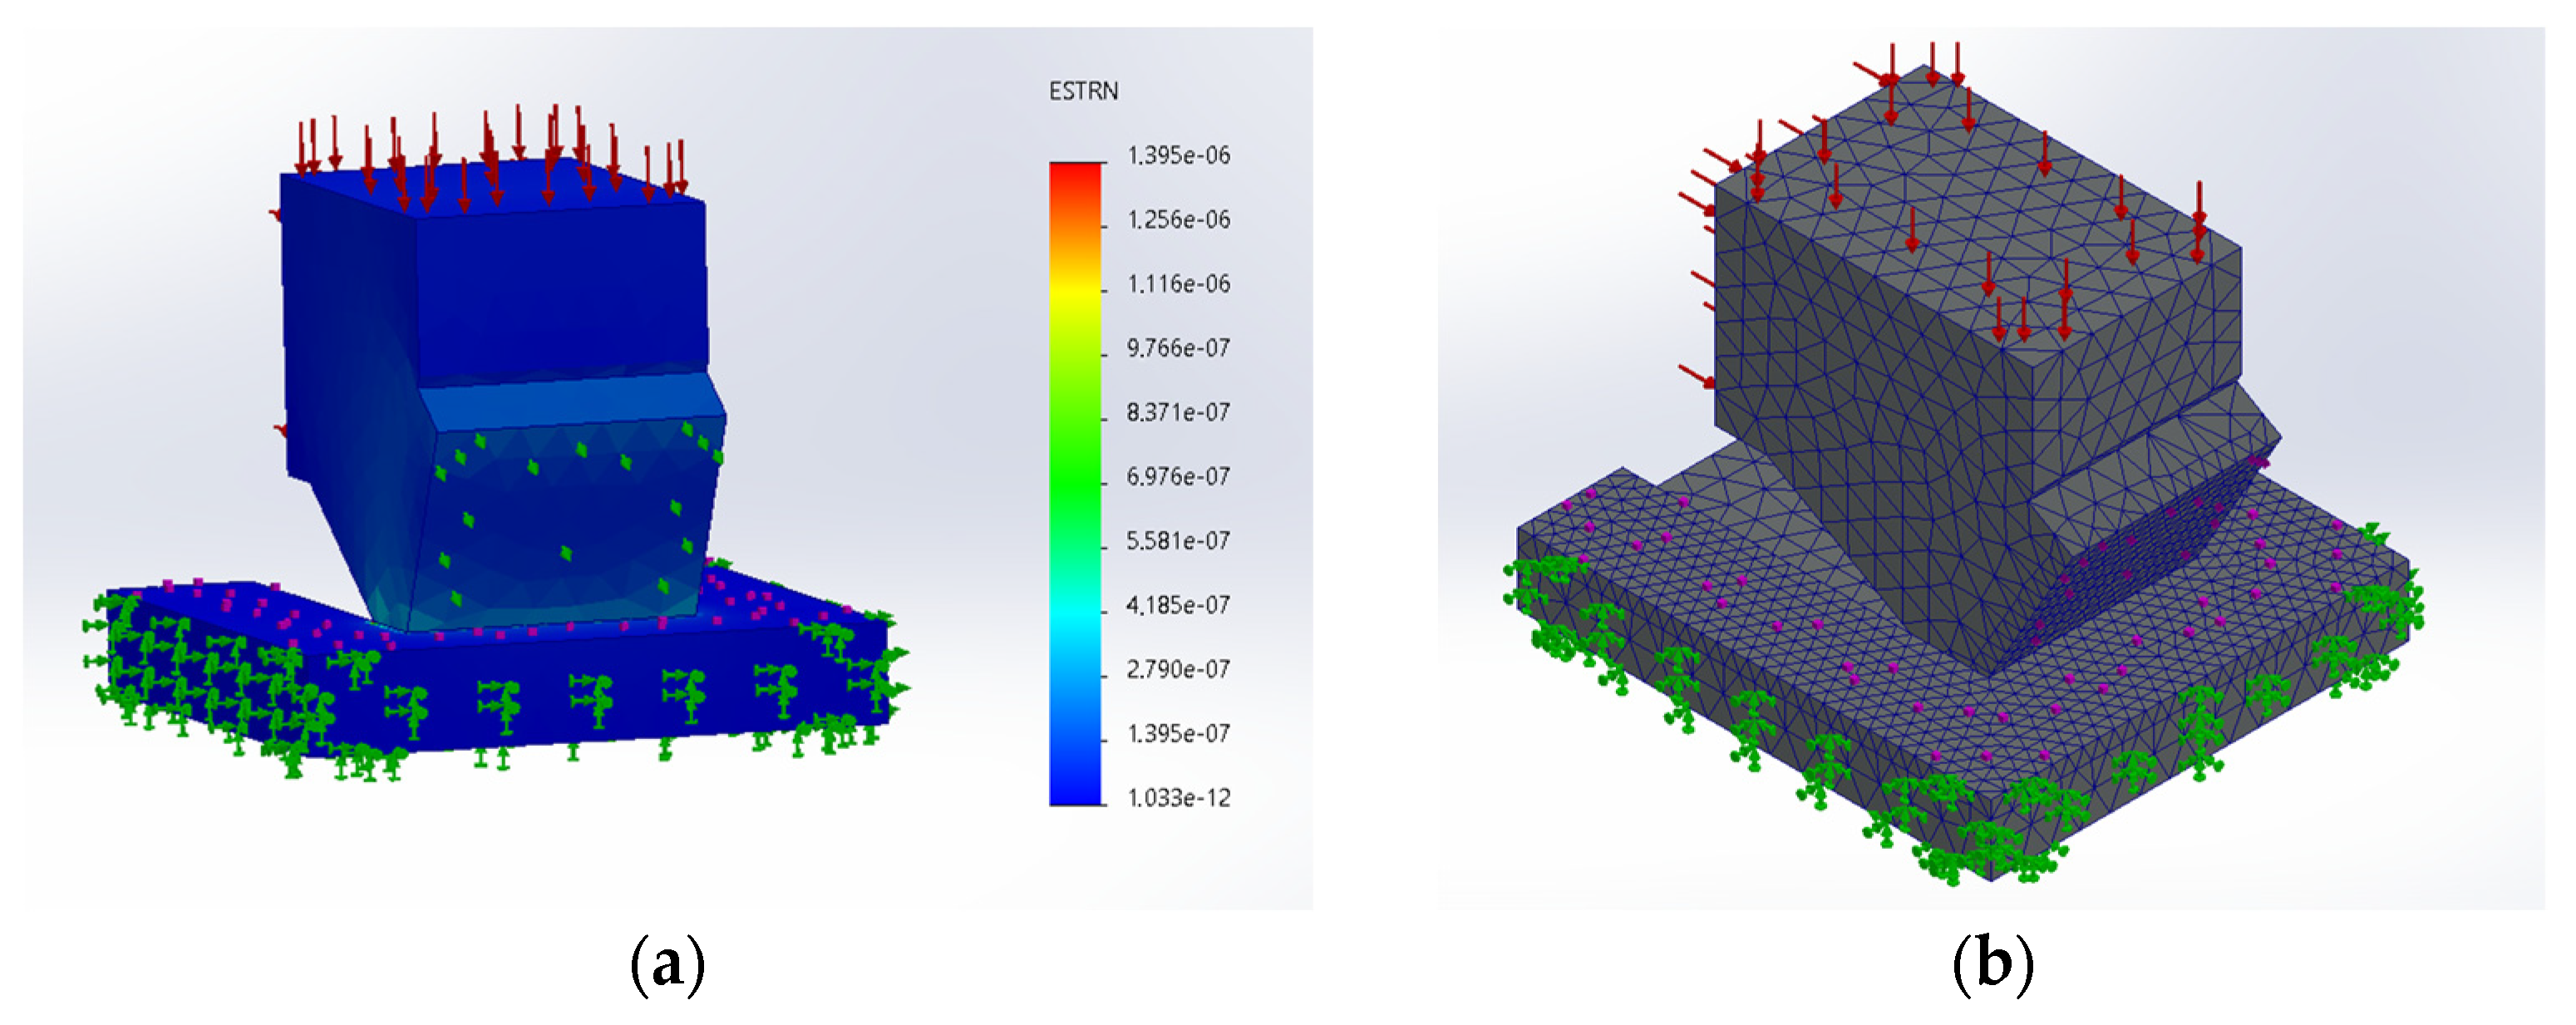
The coupled thermo-mechanical contact problem was solved using ANSYS Mechanical (Explicit Dynamics module). A 3D model of a single tungsten–cobalt (WC-Co) insert and a rock sample (sandstone or granite) was created (
Figure 2a). The mesh consisted of 10
5–10
6 hexahedral elements with local refinement to 0.01–0.05 mm near the cutting edge (
Figure 2b). Contact was defined as surface-to-surface with finite sliding, friction coefficient
(Coulomb model), and the augmented Lagrange method for penetration control. A transient analysis with an explicit time step of
–
s was run for a total time of 1–2 s of cutting.
Rock material was modeled using the Drucker–Prager plasticity criterion with hardening, and damage initiation was based on the maximum principal stress criterion (XFEM for crack propagation). For sandstone, the following parameters were used: Young’s modulus GPa, Poisson’s ratio , unconfined compressive strength MPa. For granite, GPa, , MPa. The wear law (Equation (4)) was implemented as a user subroutine that updates the contact area after each time step.
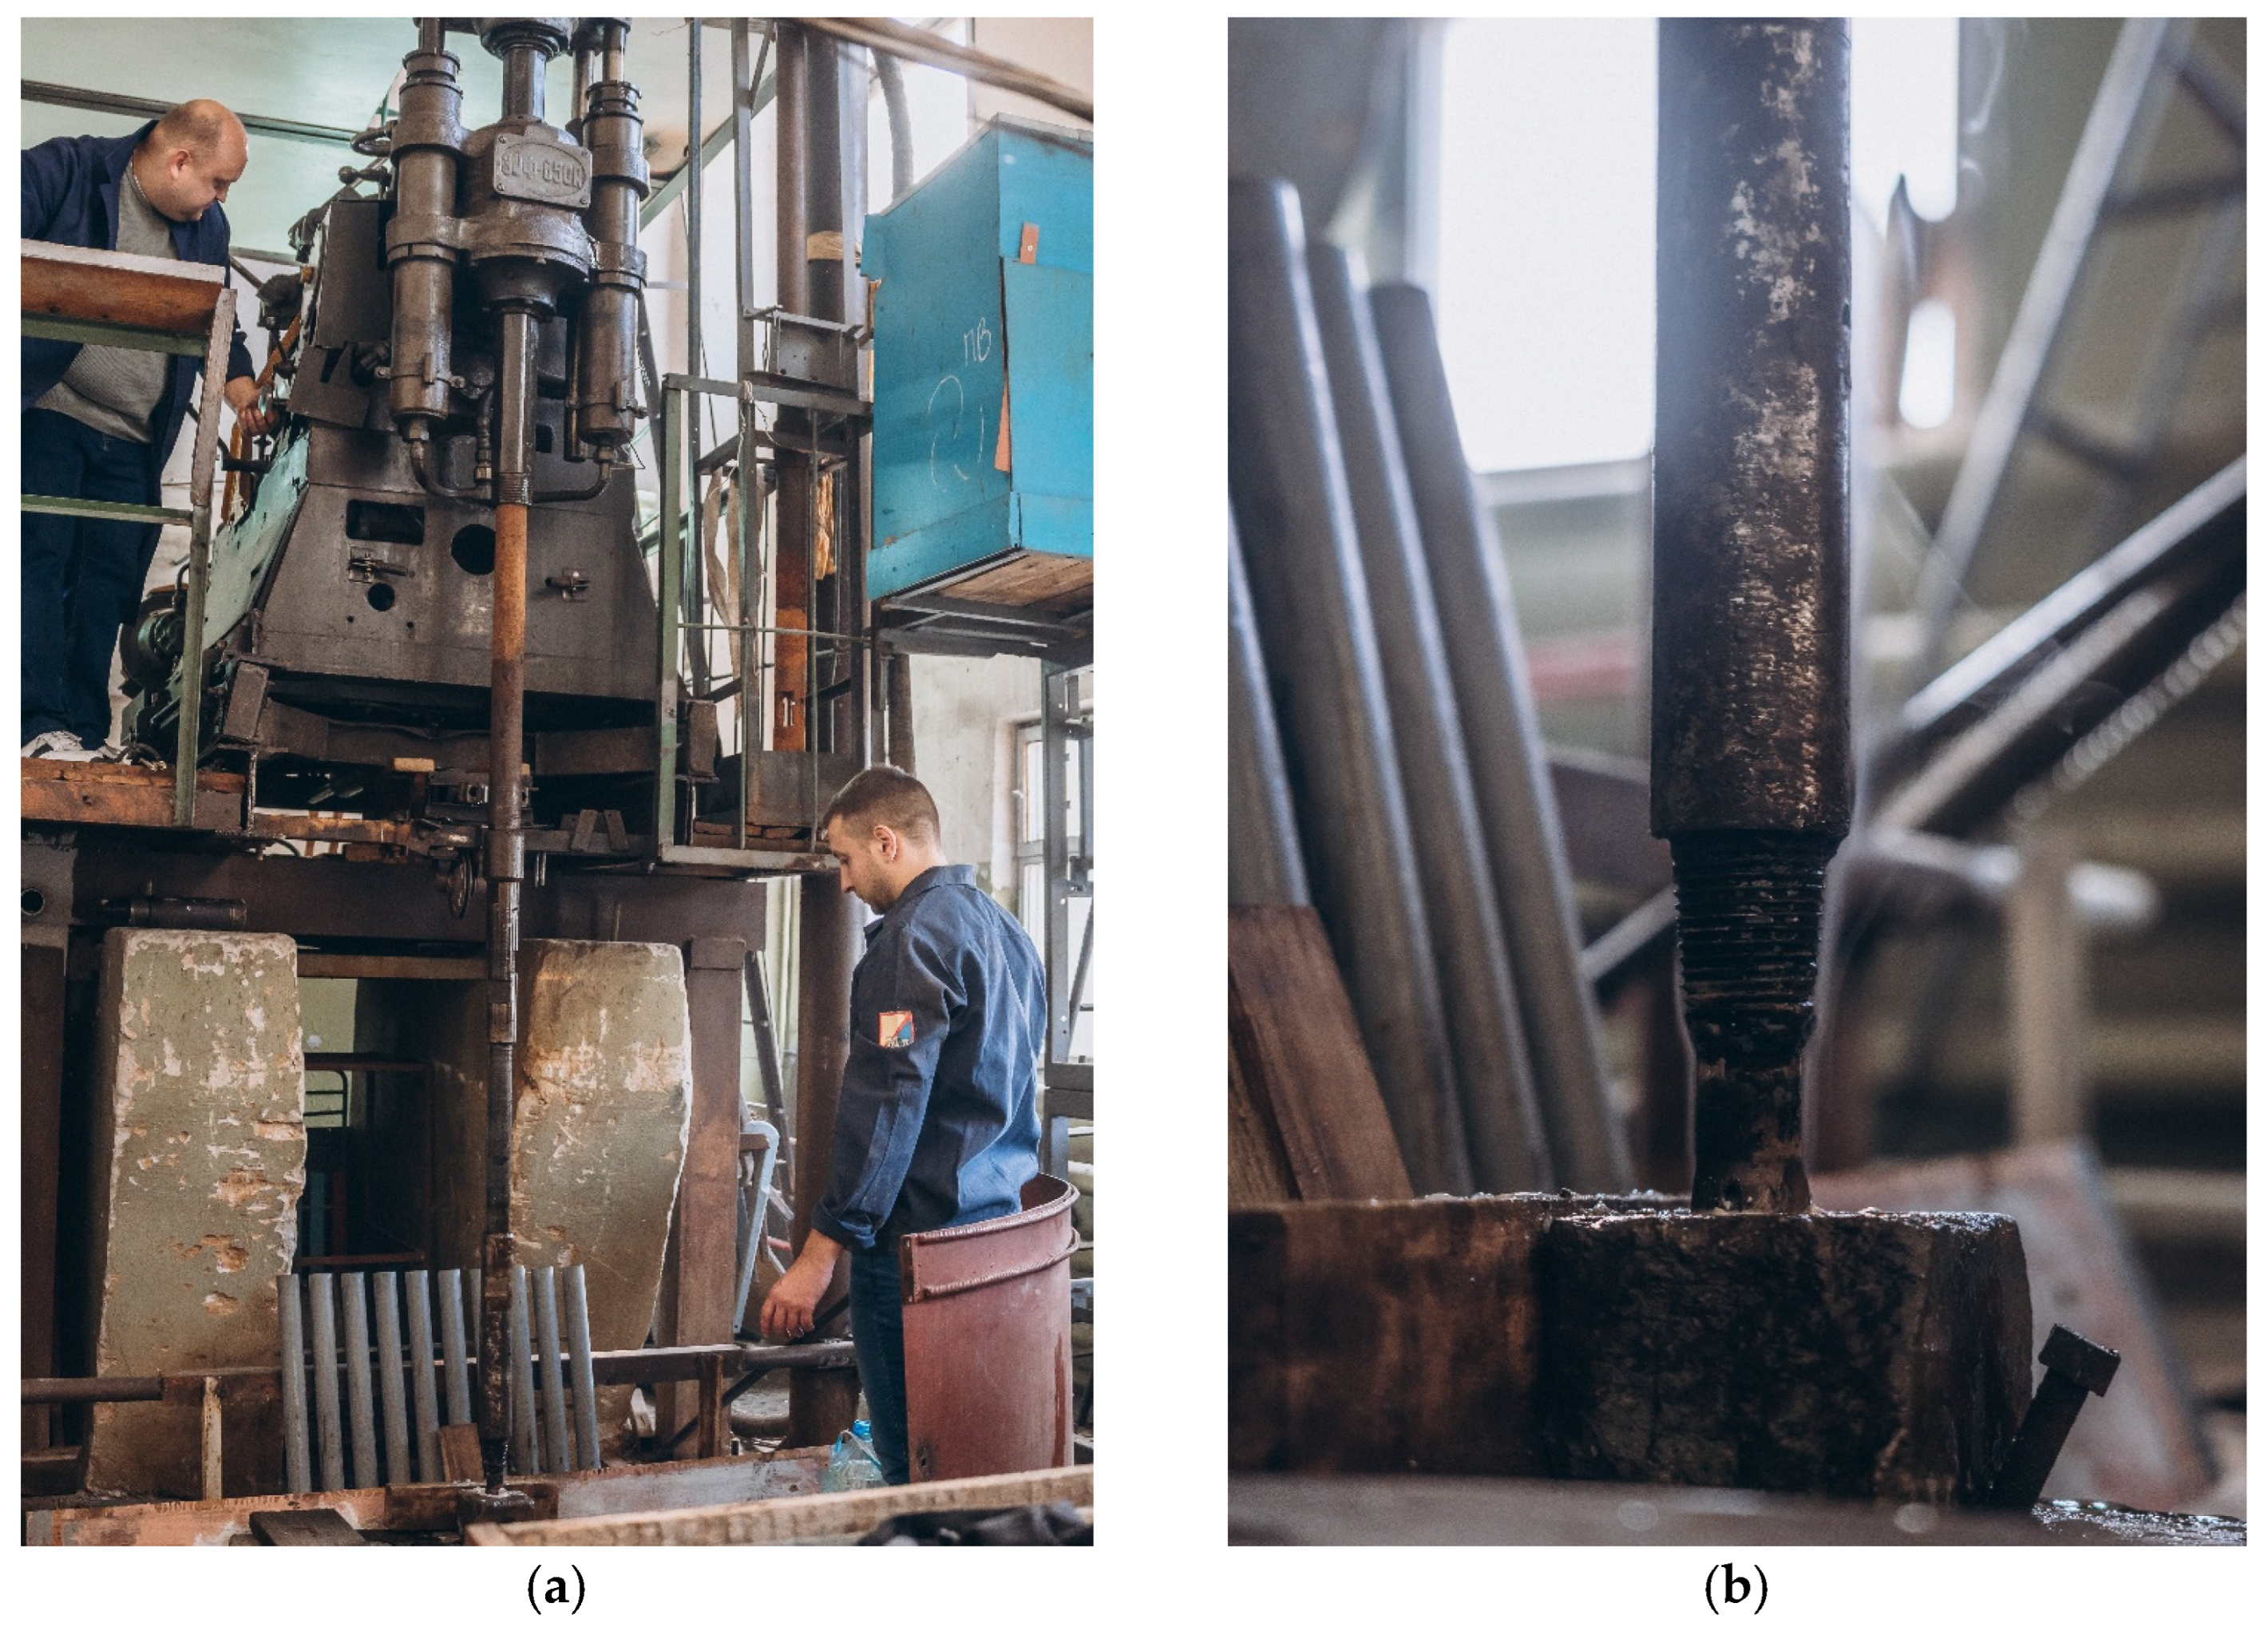
Laboratory tests were performed on a drilling stand (
Figure 3). The stand allows independent control of weight on bit up to 250 kg (
2.45 kN on a single RCE, which corresponds to 10–25 kN on a full-size bit with multiple cutters) and accommodates drill bits or core bits up to 50 mm in diameter. Rotation speed can be varied from 50 to 1500 rpm, and flushing flow rate from 0 to 1.5 L/min. In the present study, all experiments were conducted with a constant flushing flow rate of 0.5 L/min using water as the cooling medium. The effect of varying the flow rate on friction and heat dissipation was not investigated, as the primary focus was on the dynamic vibration response and wear evolution under different WOB and RPM conditions. This limitation is acknowledged and will be addressed in future work. The RCE is mounted in a tool holder with adjustable back rake angle (10–30°). Two types of WC-Co inserts were tested: uncoated inserts and inserts coated with a TiN layer of 3–5 nm thickness. The TiN coating was deposited by physical vapor deposition (PVD) to improve surface hardness and reduce the friction coefficient.
It is important to clarify the role of the nanoscale TiN coating (3–5 nm thickness). Such a thin layer is worn away extremely rapidly—typically within the first few seconds or tens of revolutions of operation. For example, using the measured steady-state wear rate for coated inserts in granite ( mm/h m/s), the time required to completely remove a 5 nm coating is approximately m/ m/s s, which corresponds to less than one revolution at 120 RPM. Even under the most conservative estimate (using the initial wear rate during the running-in phase, which may be higher), the coating is removed within a few seconds.
The primary function of this ultra-thin coating is not to provide long-term protection, but to ensure a low friction coefficient during the initial running-in stage. This reduces the risk of galling, seizure, and excessive initial wear of the substrate. After the coating is worn through, the subsequent operation occurs on the base WC-Co material. However, the coating may leave a smoother initial surface topography with reduced asperities, which may contribute to lower friction and more stable cutting conditions during the subsequent stages of drilling compared with an initially uncoated insert. Thus, the benefit of the TiN layer is realized primarily in the early stages of drilling, but it also influences the subsequent wear evolution by providing a favorable starting surface condition.
Figure 3 shows a photograph of the experimental setup. The stand is equipped with an electric spindle motor (0.75 kW, 50–1500 rpm), a hydraulic loading system for precise WOB control (up to 250 kg axial load), and a fluid circulation system for cooling and chip removal. The RCE is mounted in a dedicated tool holder that allows adjustment of the back rake angle (10–30°) and side rake angle. Three MEMS accelerometers are positioned on the spindle housing to measure axial, torsional (tangential), and lateral acceleration components. An S-type load cell is integrated into the loading frame for continuous force measurement, and a K-type thermocouple is placed 0.5 mm from the cutting edge for temperature monitoring.
Prior to the drilling tests, an experimental modal analysis of the stand was performed using an impact hammer and a reference accelerometer. The frequency response functions (FRFs) were measured in the axial and torsional directions. The analysis identified the first natural axial mode at 12 Hz and the first natural torsional mode at 55 Hz, which are consistent with the dominant frequency peaks observed in the drilling vibration spectra. These natural frequencies were used as reference values for calibrating the stiffness parameters and in the global MDOF model (Equations (5) and (6)).
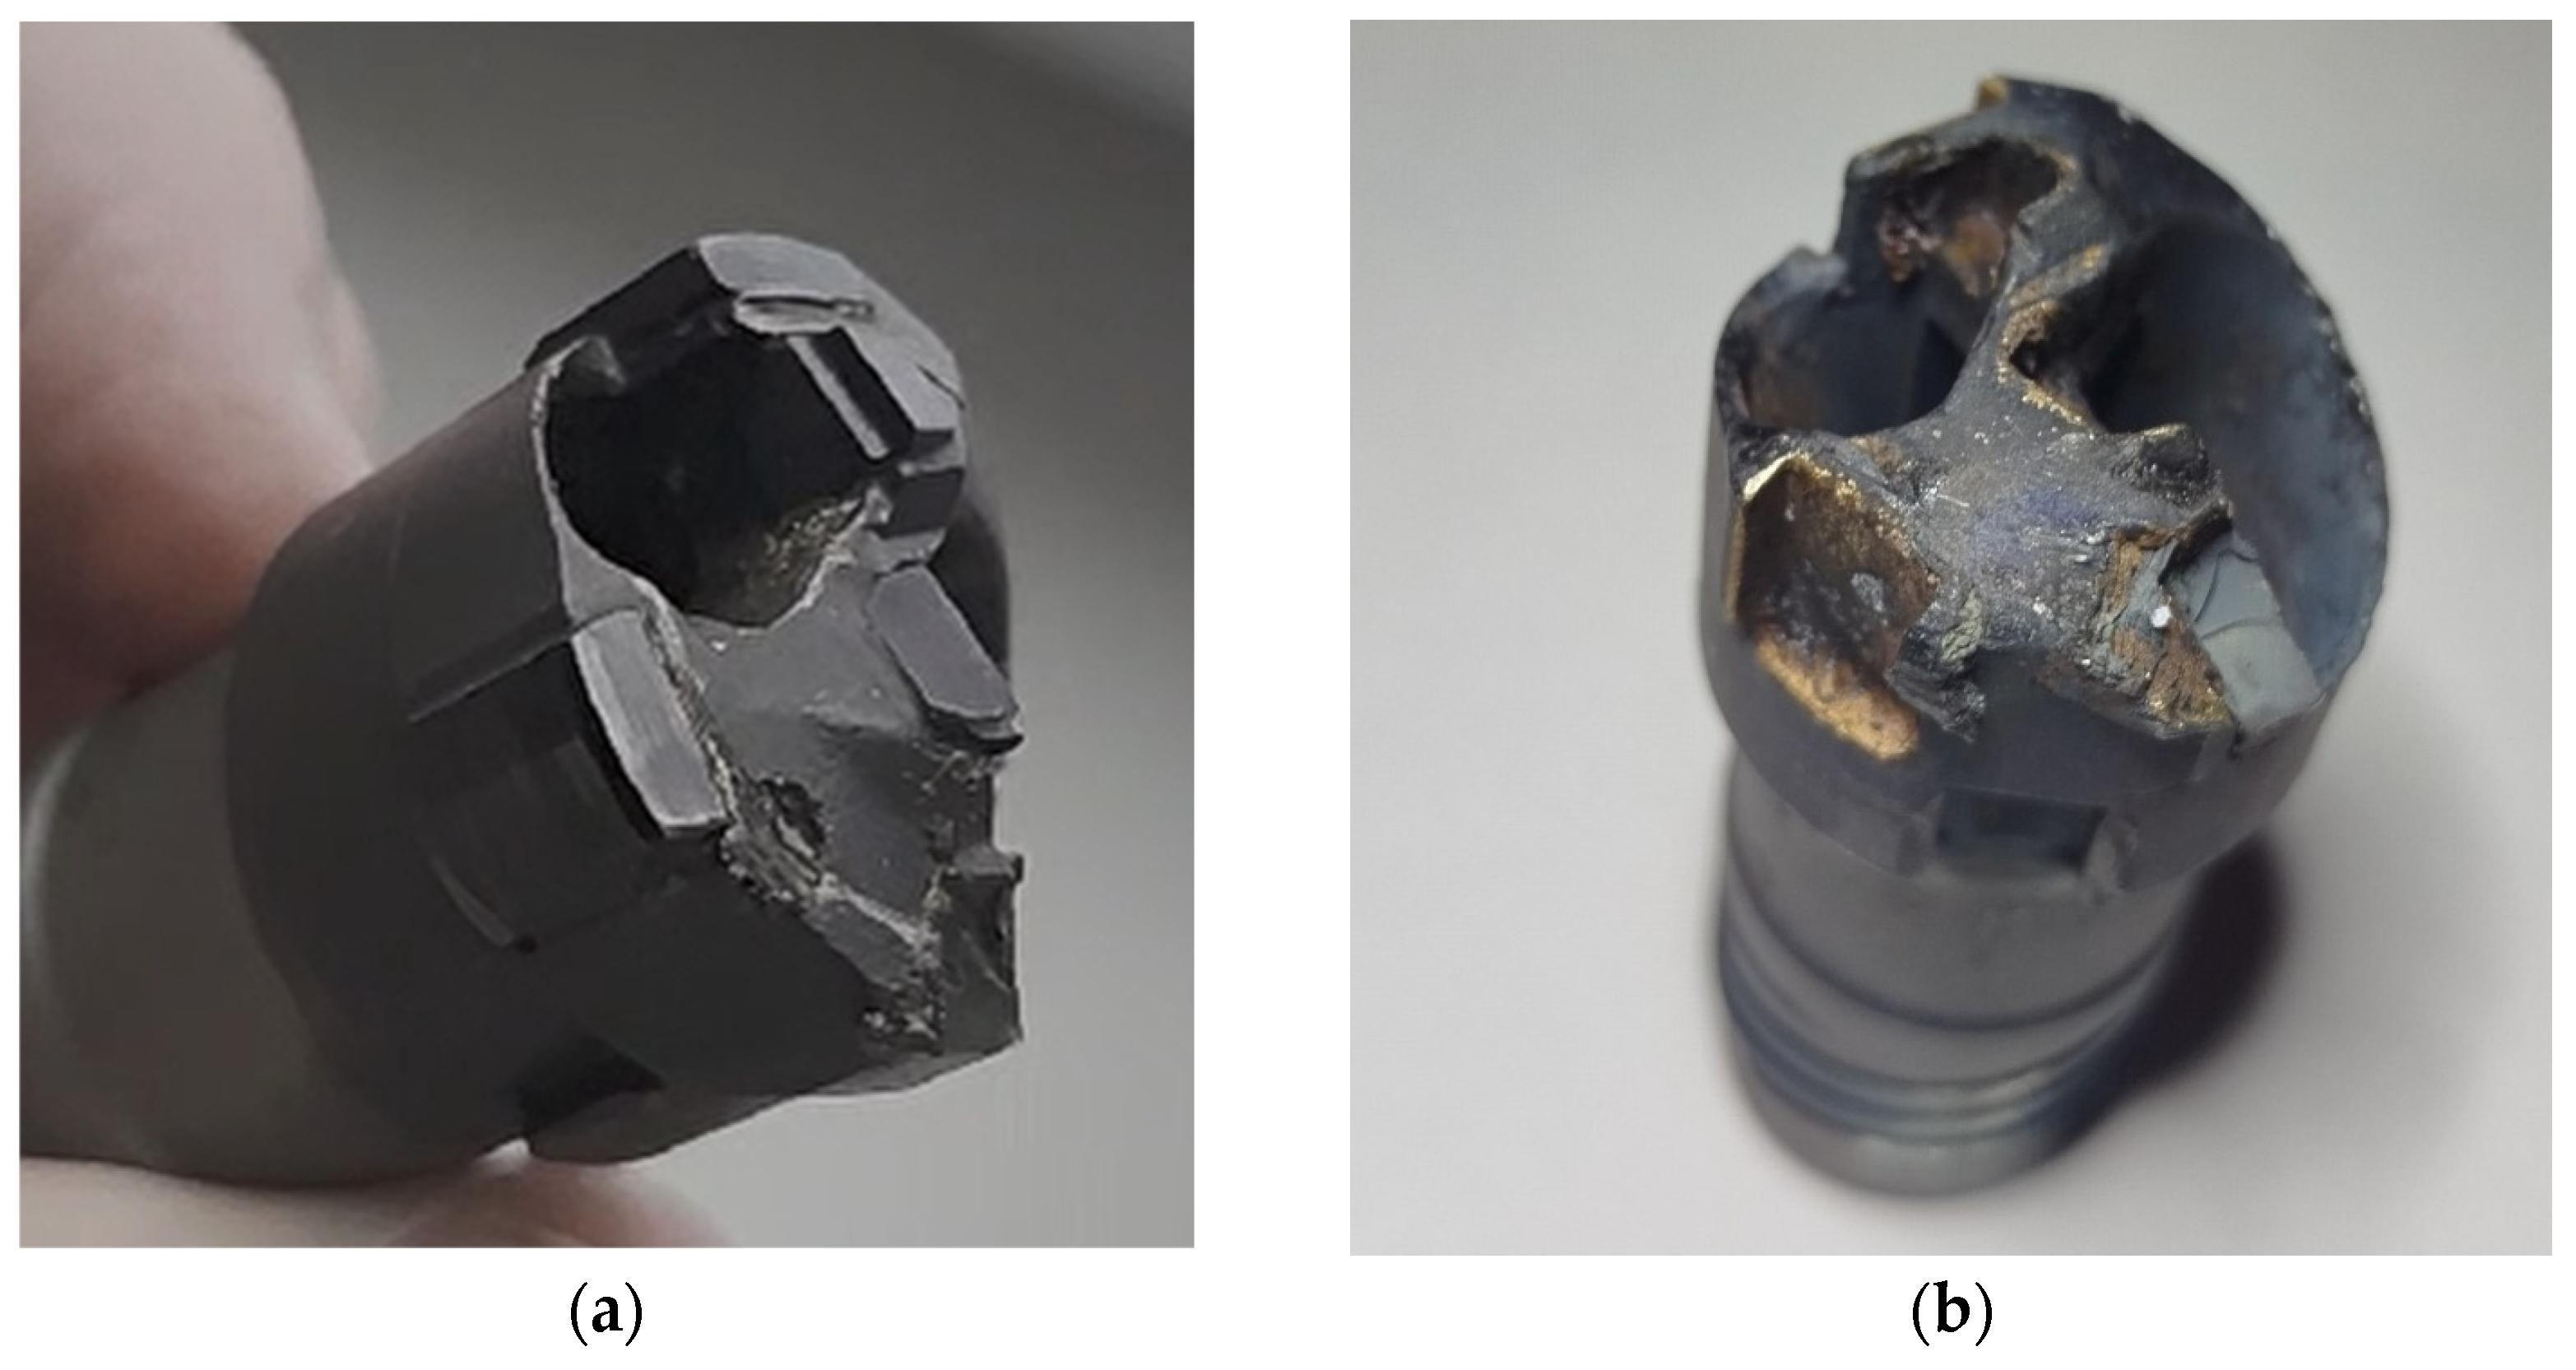
Figure 4 shows representative photographs of a new (unworn) WC-Co insert and a worn insert after drilling in granite under typical conditions (WOB = 1.8 kN, RPM = 120, test duration ~8 h). The wear flat is clearly visible on the flank face. The average wear rate for the uncoated inserts was 0.154 mm/h, while for the TiN-coated inserts it decreased to 0.112 mm/h. Assuming a maximum allowable wear height of 2 mm, the estimated service life is ~17.8 h for coated inserts, which corresponds to approximately 192 m of drilled hole at the observed rate of penetration (ROP
0.003 m/s).
Two rock types were used. Sandstone from the Dnipro-Donets basin (UCS = 45–85 MPa, abrasivity – g/cm3, porosity 18–24%) represented soft, abrasive conditions. Granite from the Korosten pluton (UCS = 180–250 MPa, – g/cm3, porosity 2%) represented hard, brittle rock.
A summary of the experimental matrix is provided in
Table 1.
Vibrations were measured using low-cost MEMS accelerometers (model ADXL1001, Analog Devices, Wilmington, NC, USA). These sensors have a measurement range of 100 g, a flat frequency response up to 11 kHz, and a noise density of 30 µg/. They were mounted on the spindle and the RCE holder using a thin layer of cyanoacrylate adhesive. Three accelerometers were oriented to capture axial, torsional (tangential), and lateral acceleration components. The output signals were acquired by a 16-bit analog-to-digital converter (NI USB-6009, DAQ, Austin, TX, USA) at a sampling rate of 2 kHz. Forces were recorded with S-type load cells (accuracy 0.05 kN) for axial and tangential components. Temperature at the contact was measured with a K-type thermocouple placed 0.5 mm from the cutting edge. Each test was repeated 5 times. Data processing included low-pass filtering (cut-off at 500 Hz) to remove high-frequency electrical noise. The MEMS accelerometers were calibrated before each test series using a hand-held shaker with a reference accelerometer to compensate for temperature drift and non-linearity.
3. Results: Structural Dynamics and Tool Wear Characterization
The experimental program consisted of 24 condition sets (12 for sandstone and 12 for granite, corresponding to 4 WOB levels × 3 RPM levels for each rock type). Each condition set was tested 5 times for statistical validity, giving a total of 120 individual experiments. Additionally, 6 verification runs were performed to confirm repeatability, bringing the total number of condition sets to 30. For each condition, the measured quantities included axial and torsional vibration accelerations from the MEMS sensors, torque fluctuations, and post-test wear flat height.
Table 2 summarizes the RMS axial acceleration values (in g) as a function of single-RCE WOB and RPM for granite with uncoated and TiN-coated WC-Co inserts. Each value is the average of five repeated tests with the standard deviation indicated.
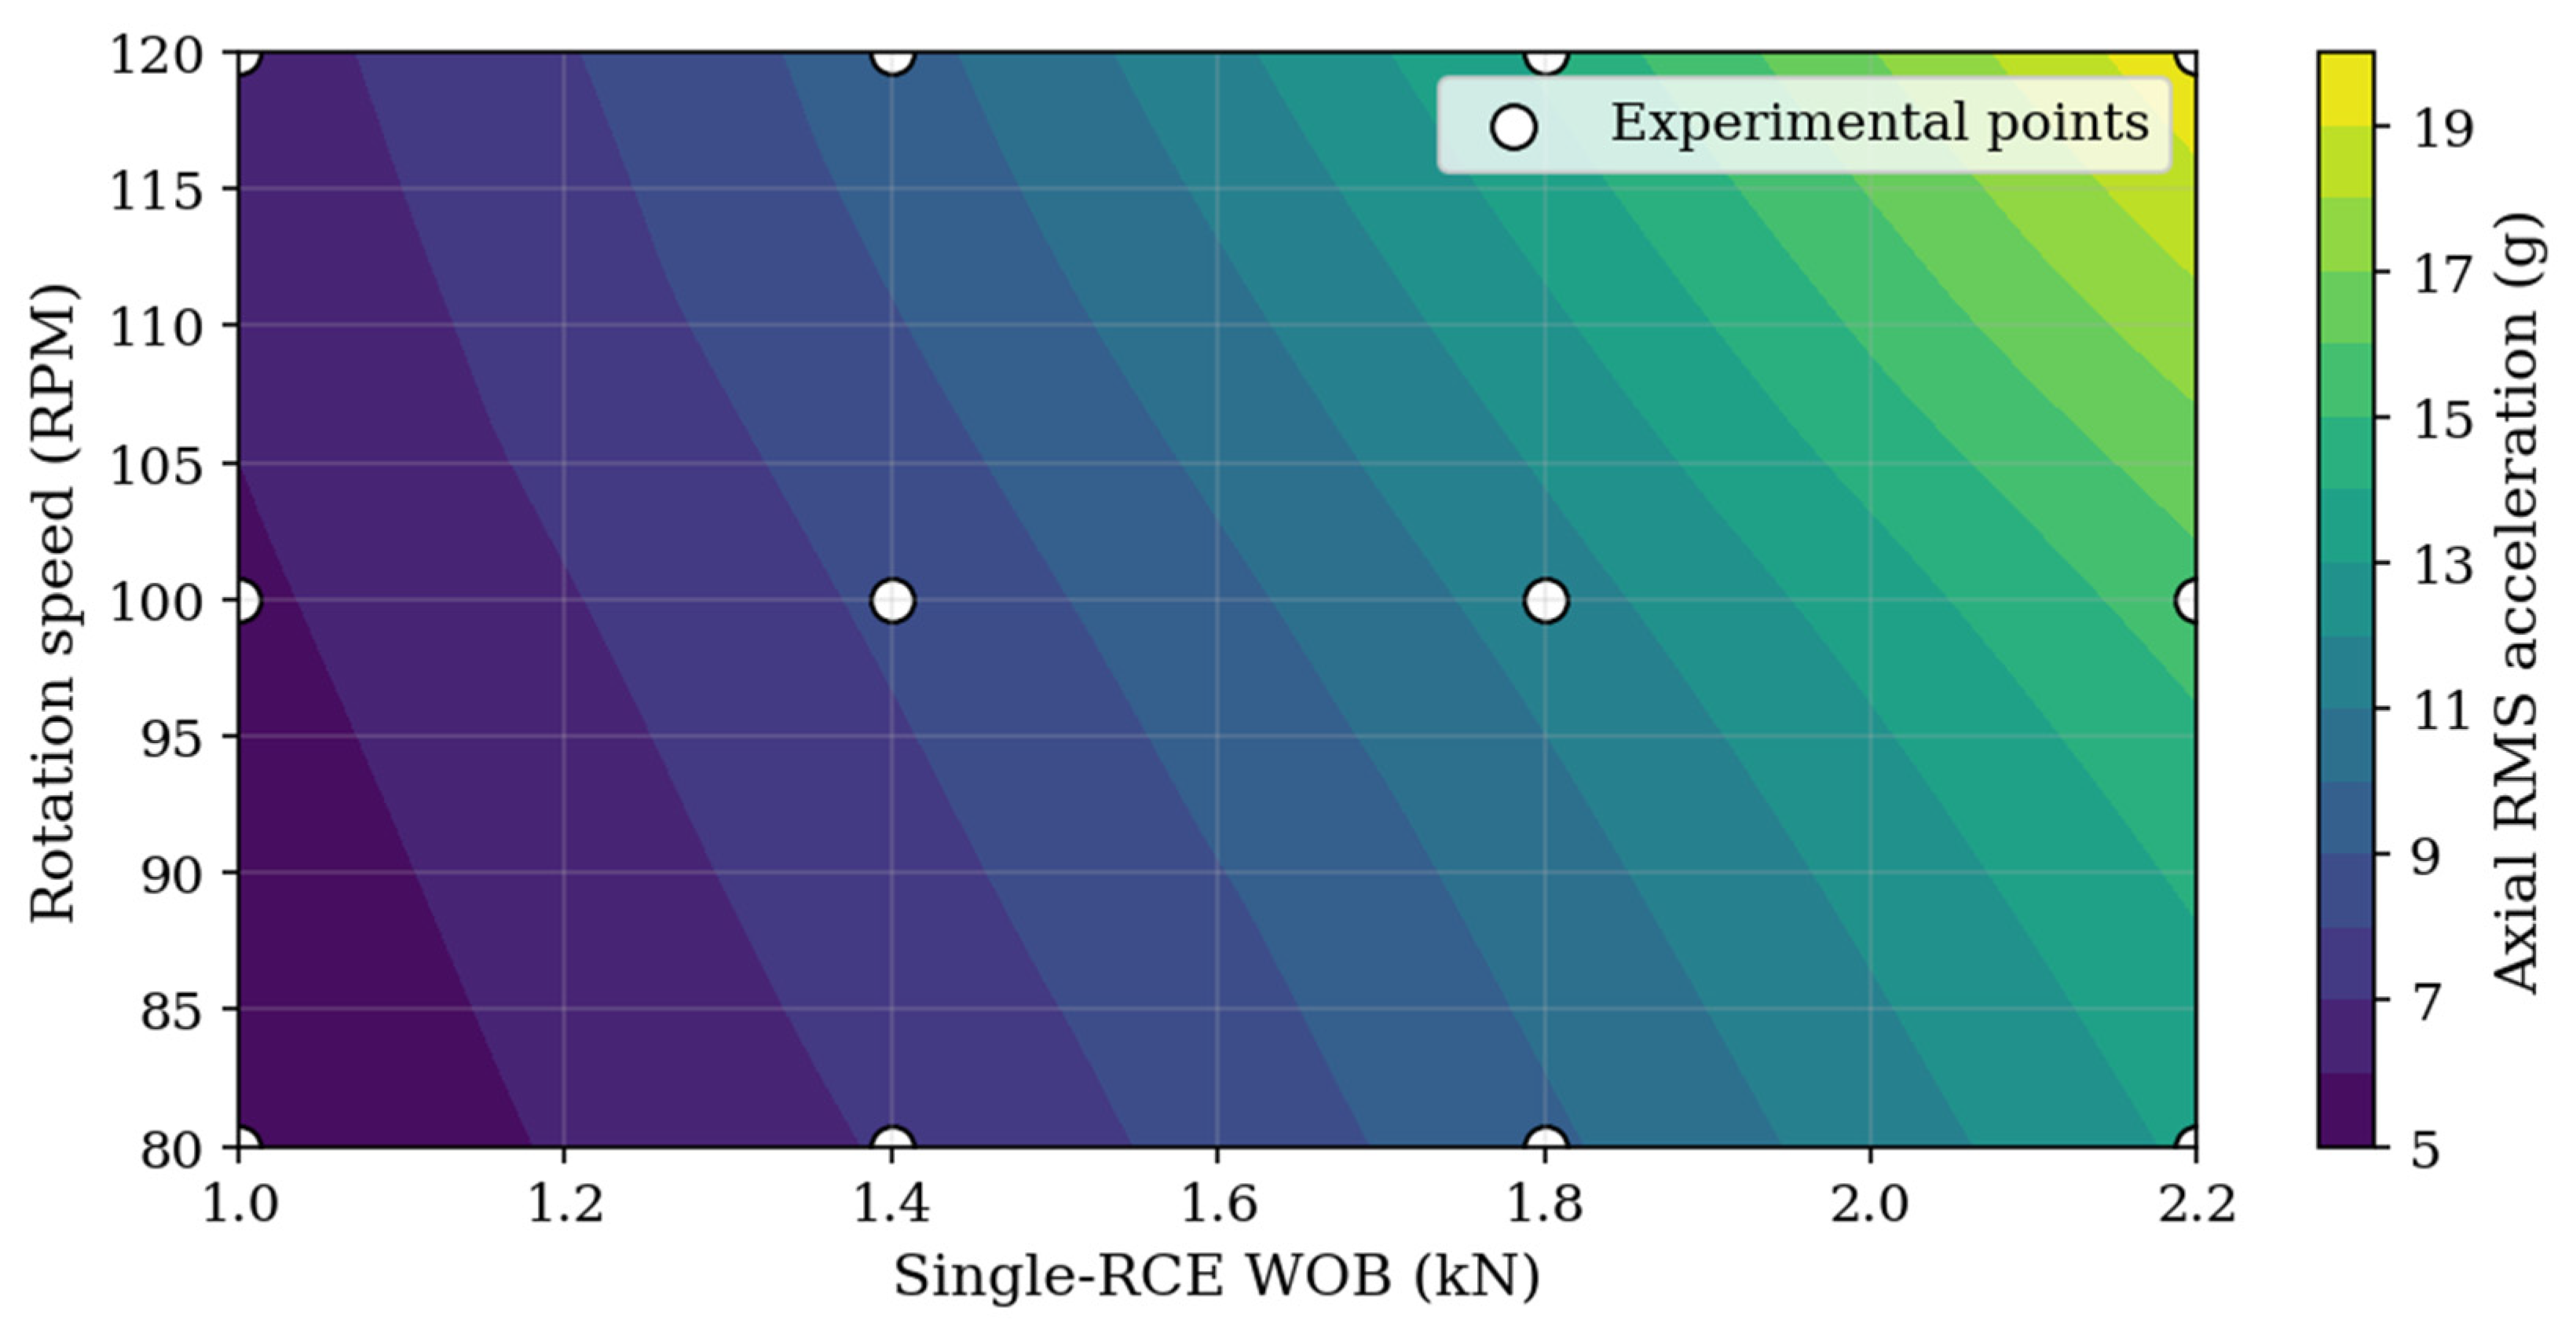
The data show a nearly linear increase in RMS acceleration with WOB up to 1.8 kN; beyond this threshold the increase becomes more pronounced, indicating the onset of severe bit bounce. Similarly, raising RPM above 100 rpm causes a steep rise in both axial and torsional vibrations, especially when combined with high WOB (
Figure 5).
For sandstone with cutters, the absolute vibration levels were significantly lower.
Table 3 gives the corresponding values. The lower friction coefficient (
due to DLC coating) and the more stable cutting action of the geometry reduced axial RMS accelerations by 40–50% compared to the granite-WC-Co case under identical WOB/RPM conditions.
Figure 5 shows the response surface of axial RMS acceleration for granite with TiN-coated WC-Co inserts. The surface is interpolated from the experimental data grid using a cubic interpolation method to visualize the trend across the tested parameter space. The data show a clear low-vibration valley at moderate WOB and RPM.
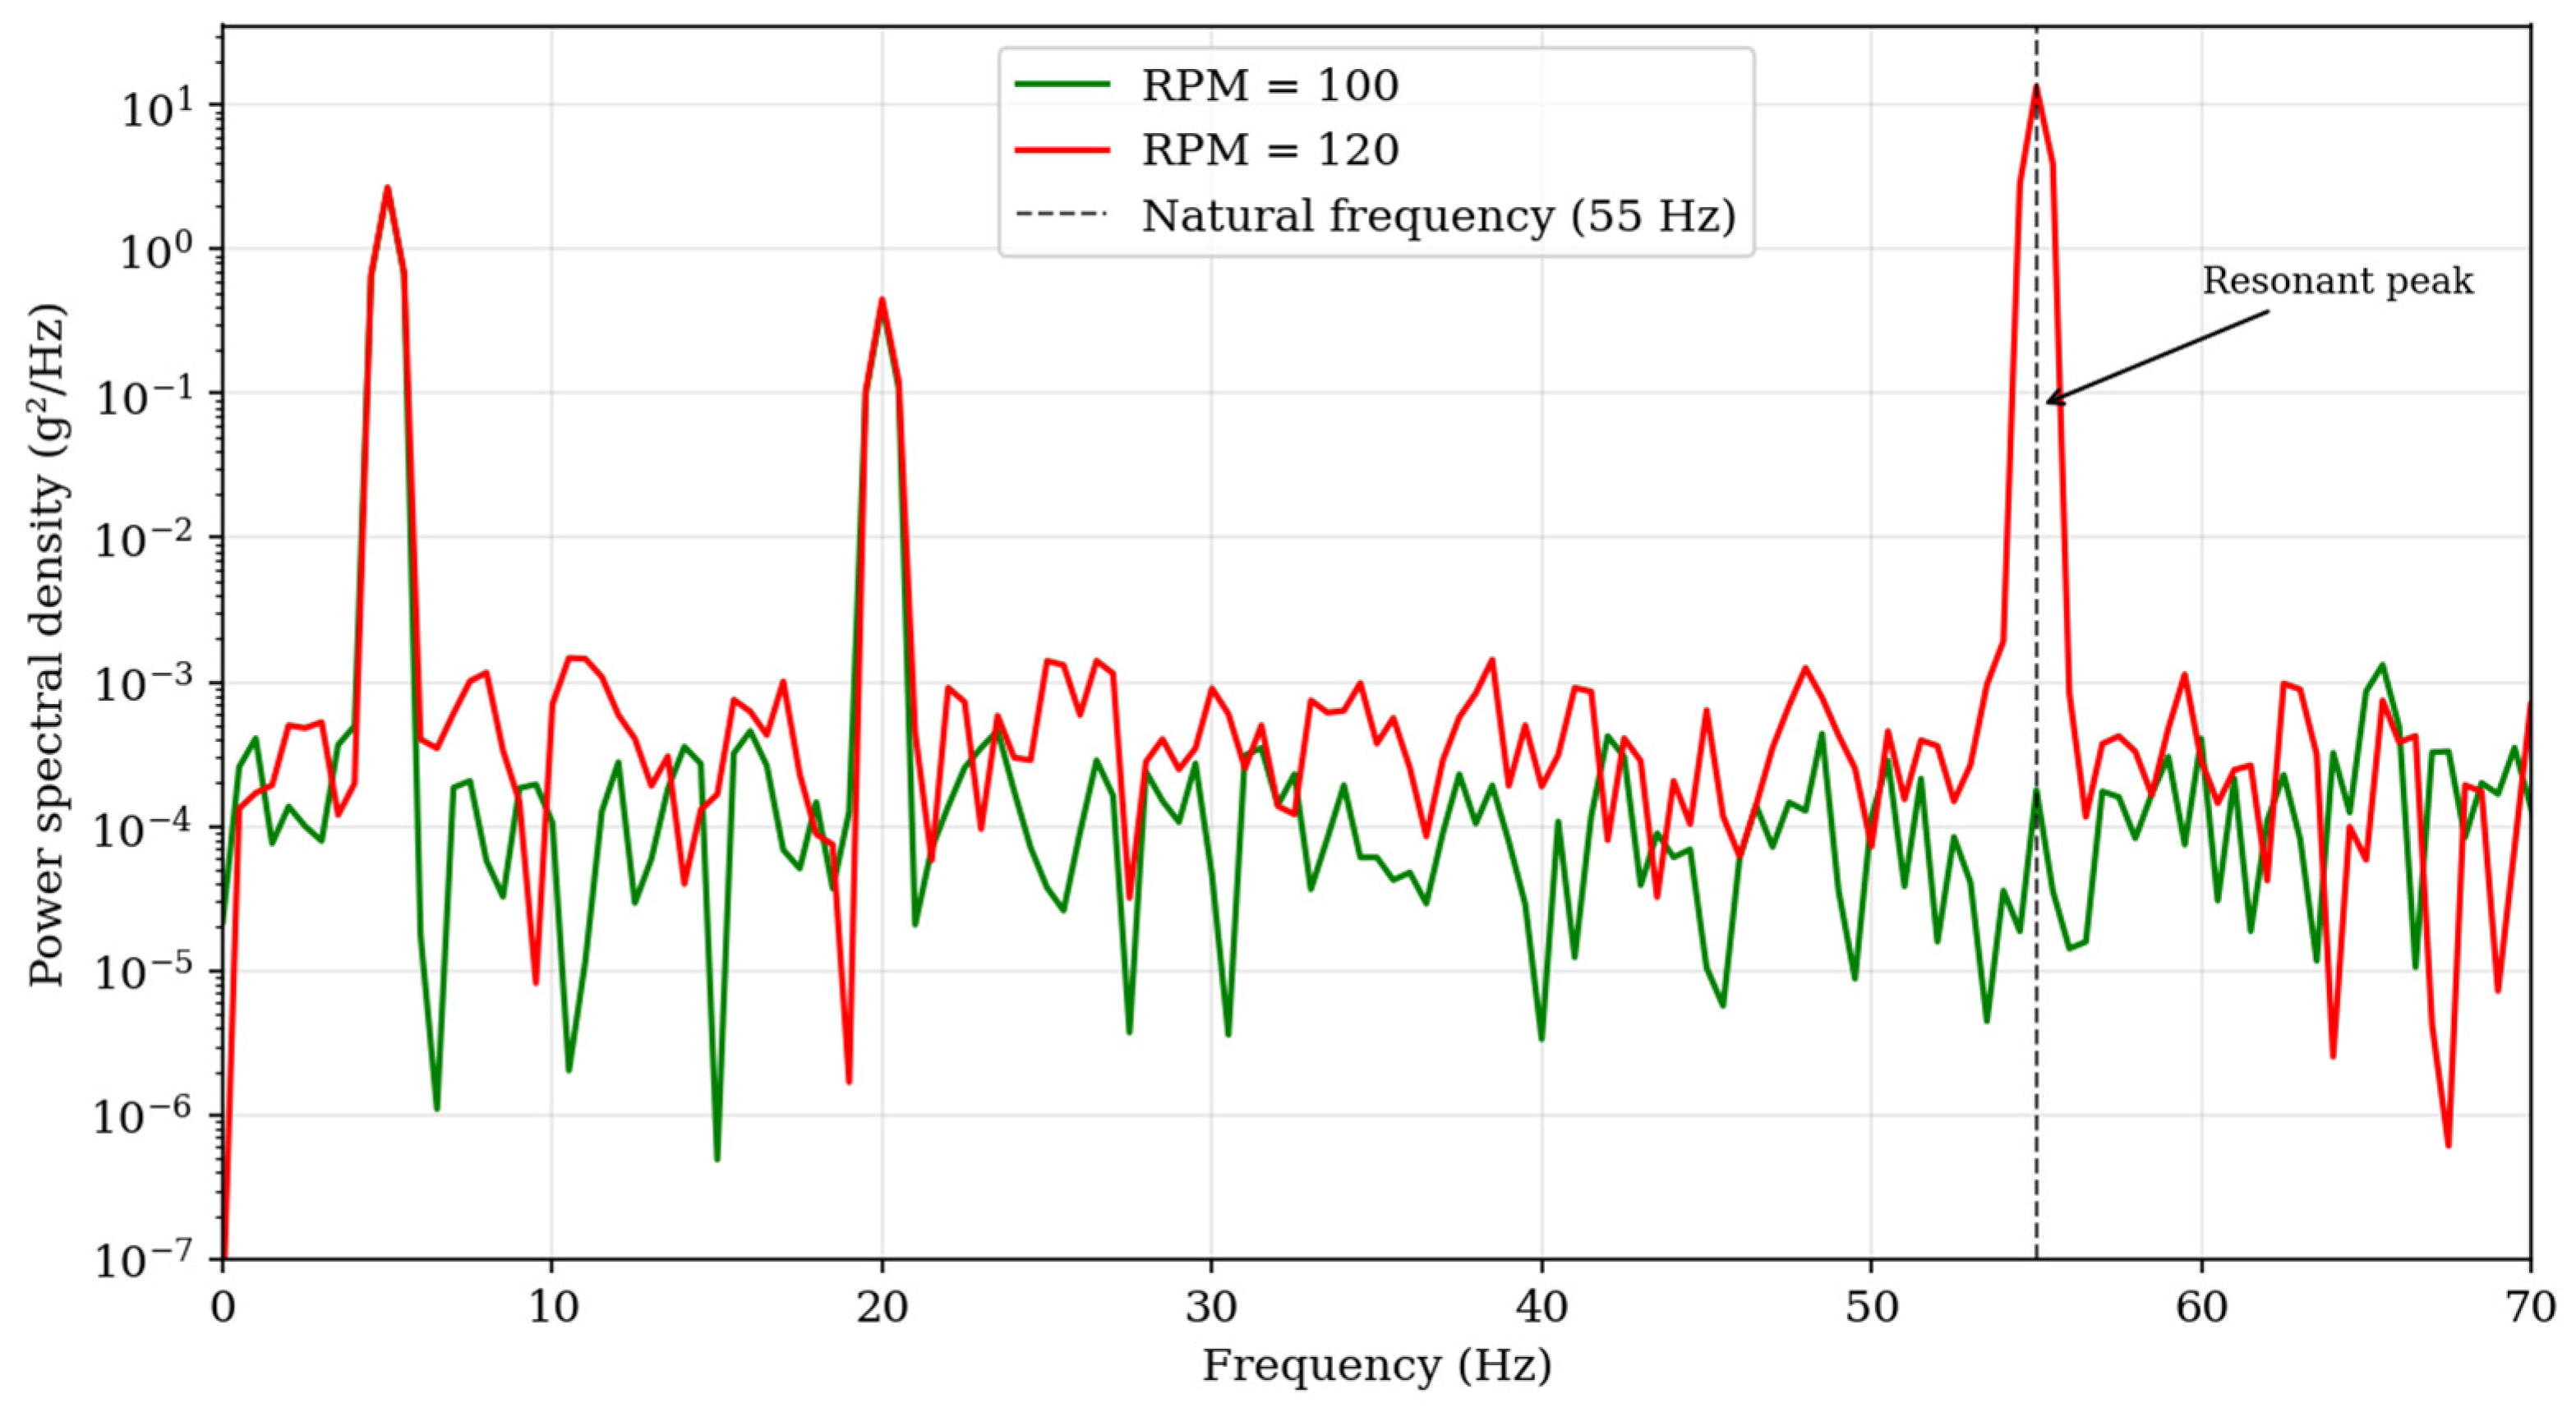
The FFT analysis also revealed that when the rotation speed is such that a strong harmonic of the stick–slip oscillation coincides with the natural torsional frequency of the assembly, resonant amplification occurs. For the stand, the measured natural axial frequency was 12 Hz (with the rock sample in contact) and the natural torsional frequency was 55 Hz. Although the rotational forcing frequency (e.g., 2 Hz at 120 RPM) does not directly excite these high-frequency modes, the stick–slip phenomenon generates a wide spectrum that includes components up to 100 Hz (
Figure 6).
The peak at 55 Hz appears in both spectra, as it is the natural torsional mode of the assembly. However, at RPM = 120, the energy in this frequency band is significantly amplified due to resonant excitation. This amplification occurs because the stick–slip oscillations at higher RPM generate a wider frequency spectrum with more energy at the natural frequency. The increased amplitude at 55 Hz is not due to the coating but is a consequence of the system dynamics. The difference between the two spectra is highlighted to show the effect of RPM on the excitation of this resonant mode.
From the combined analysis of RMS amplitudes and spectral peaks, critical thresholds were identified. The data points are from the experiments, and the zone boundaries in the operating charts have been interpolated between these experimental points. No extrapolation beyond the tested ranges was performed. For granite with TiN-coated WC-Co inserts, single-RCE WOB values above 1.8 kN and RPM above 110 produce a red zone where vibration levels exceed 20 g RMS axial and torque fluctuations surpass 150% of the mean torque, indicating a high risk of catastrophic RCE failure. For sandstone with DLC-coated cutters, the corresponding red zone begins at WOB > 2.2 kN and RPM > 120 due to the lower friction and better damping.
The numerical model was run for the same sets of WOB and RPM as the experiments.
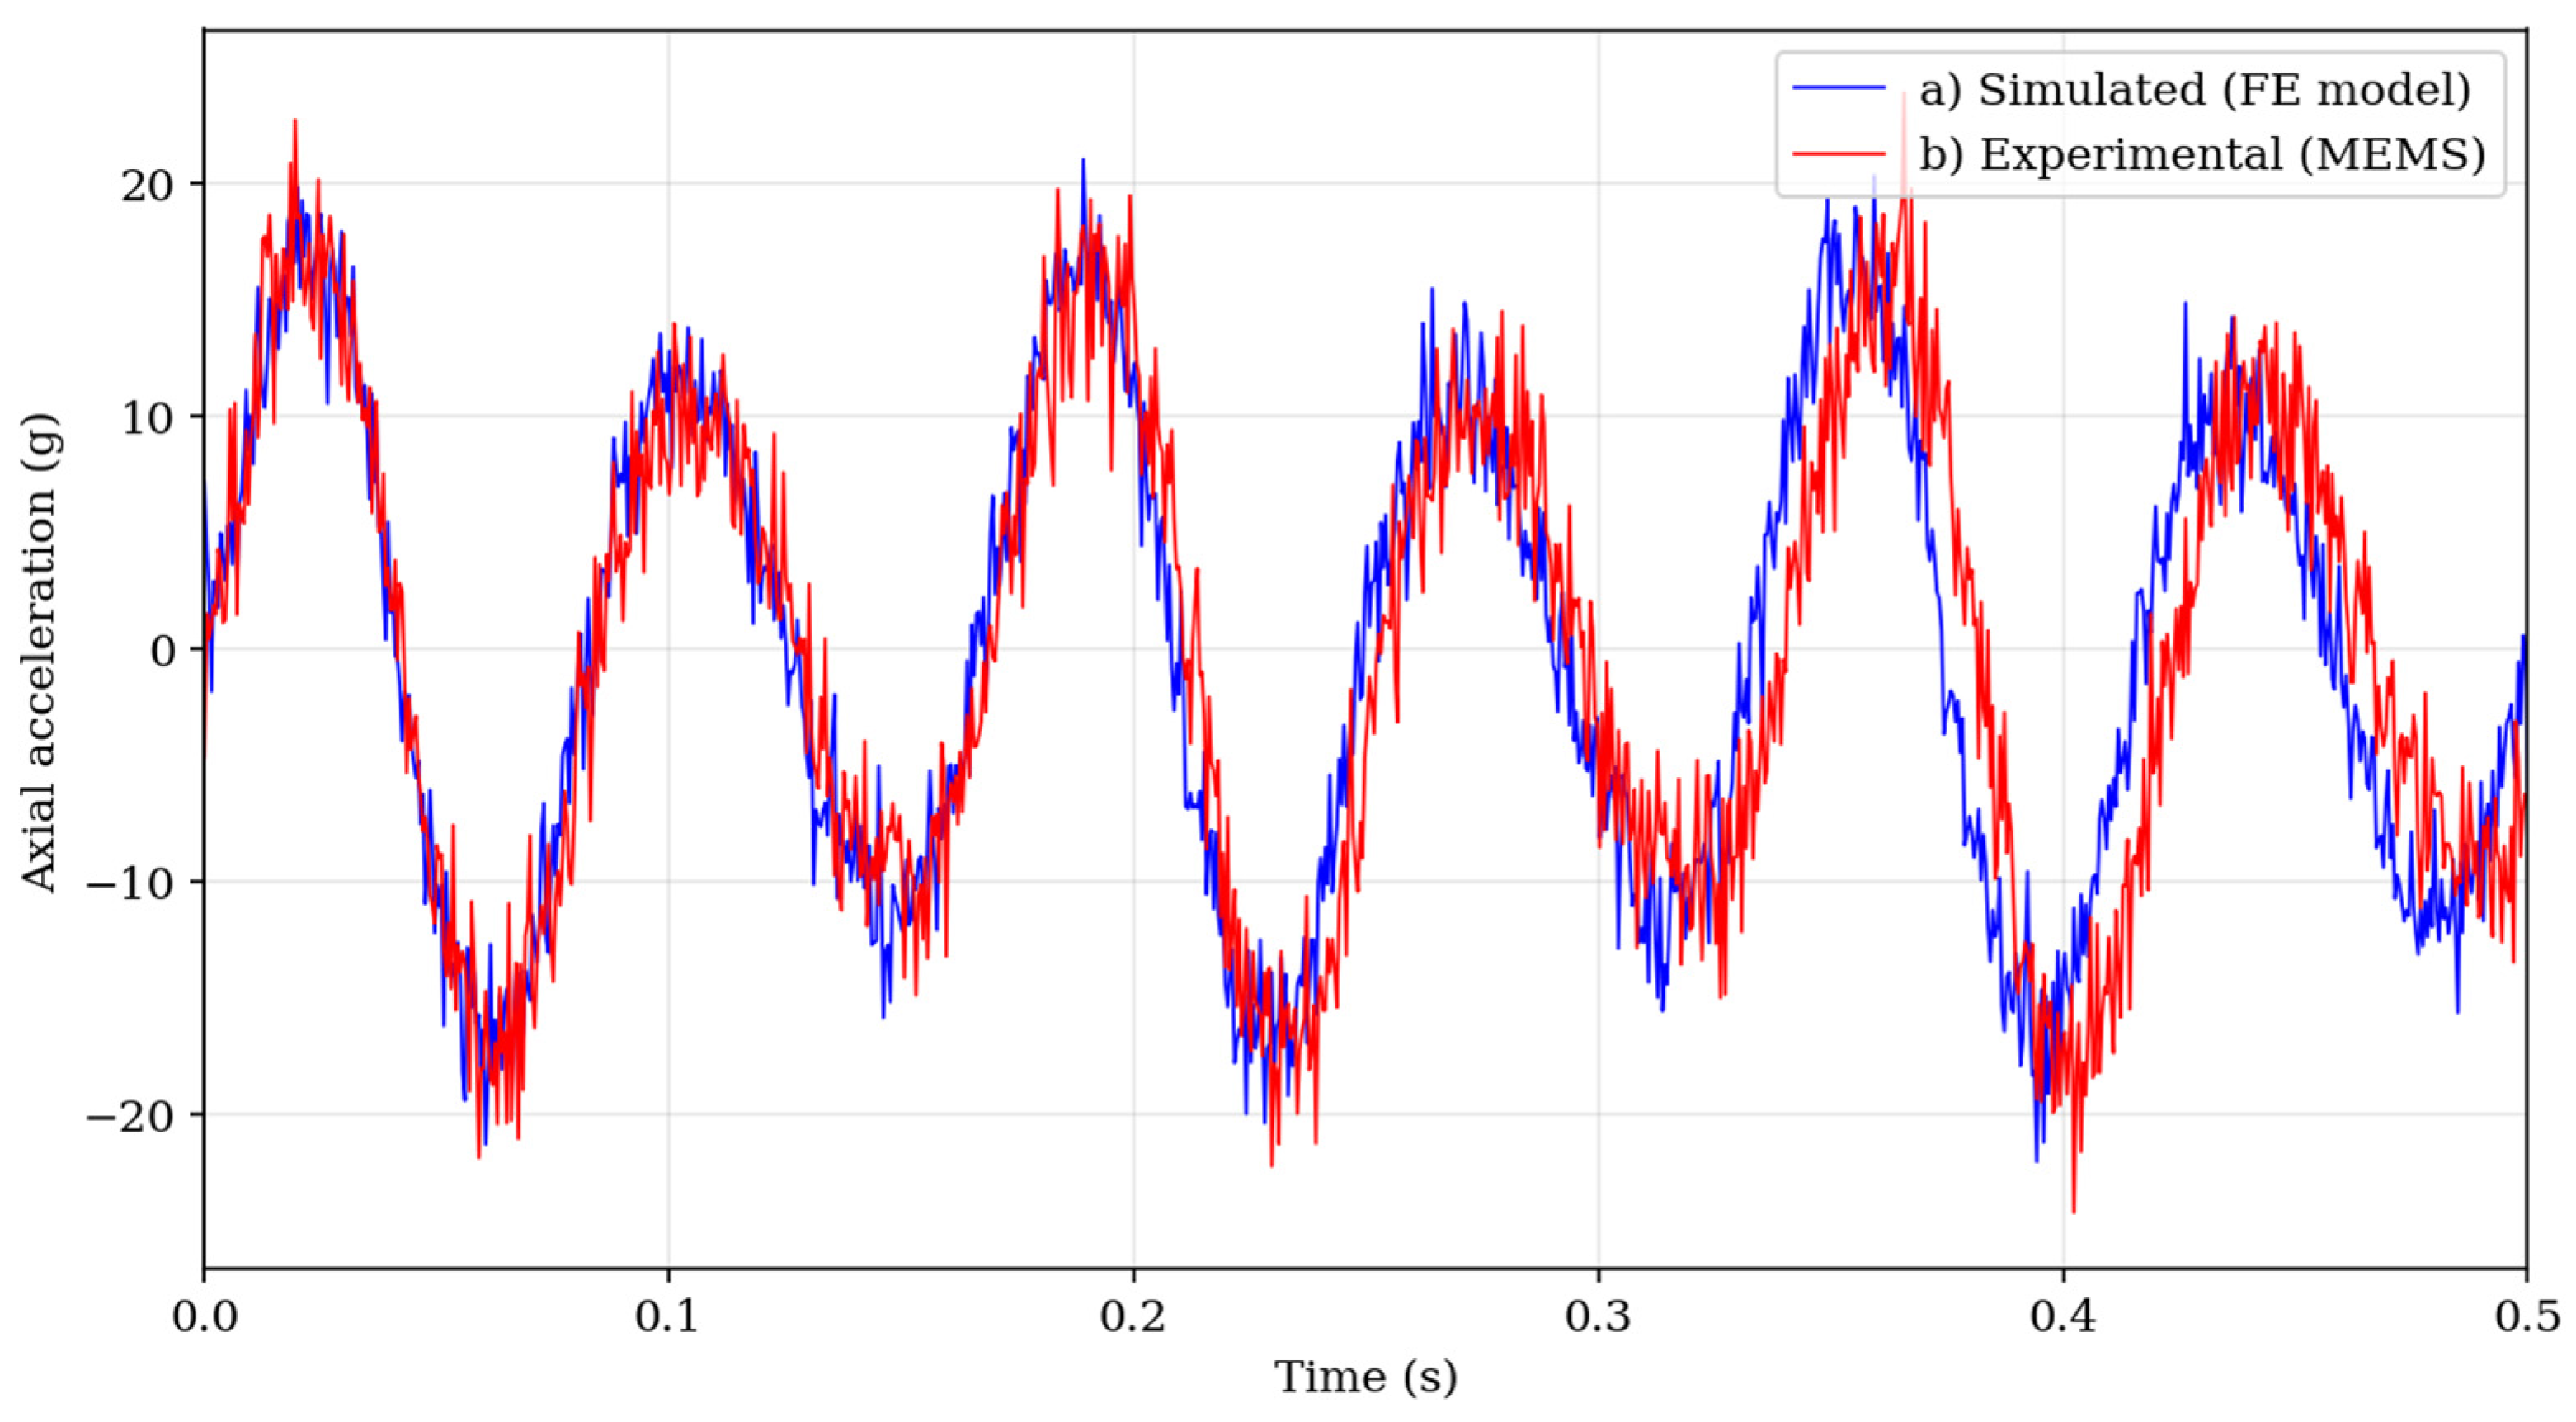
Figure 7 compares the simulated and measured time histories of axial acceleration for granite (WOB = 2.0 kN, RPM = 120). The model captures the characteristic periodic impacts of bit bounce as well as the random high-frequency spikes caused by rock chipping. The correlation coefficient between the two signals over a 0.5 s window was 0.87.
The relative error in RMS axial acceleration, averaged over all test conditions, was 8–12% (minimum 5%, maximum 15%). For torsional vibrations (estimated indirectly from the difference between two lateral accelerometers), the mean prediction error was 10–15%.
Table 4 provides a breakdown of errors for selected regimes with standard deviations across the repeated tests.
The slightly larger errors at high WOB and high RPM are attributed to the simplified Stribeck friction model and the neglect of lateral–torsional coupling, which becomes more pronounced under severe stick–slip. Nevertheless, the overall agreement is within the acceptable range for engineering purposes, confirming the validity of the integrated model.
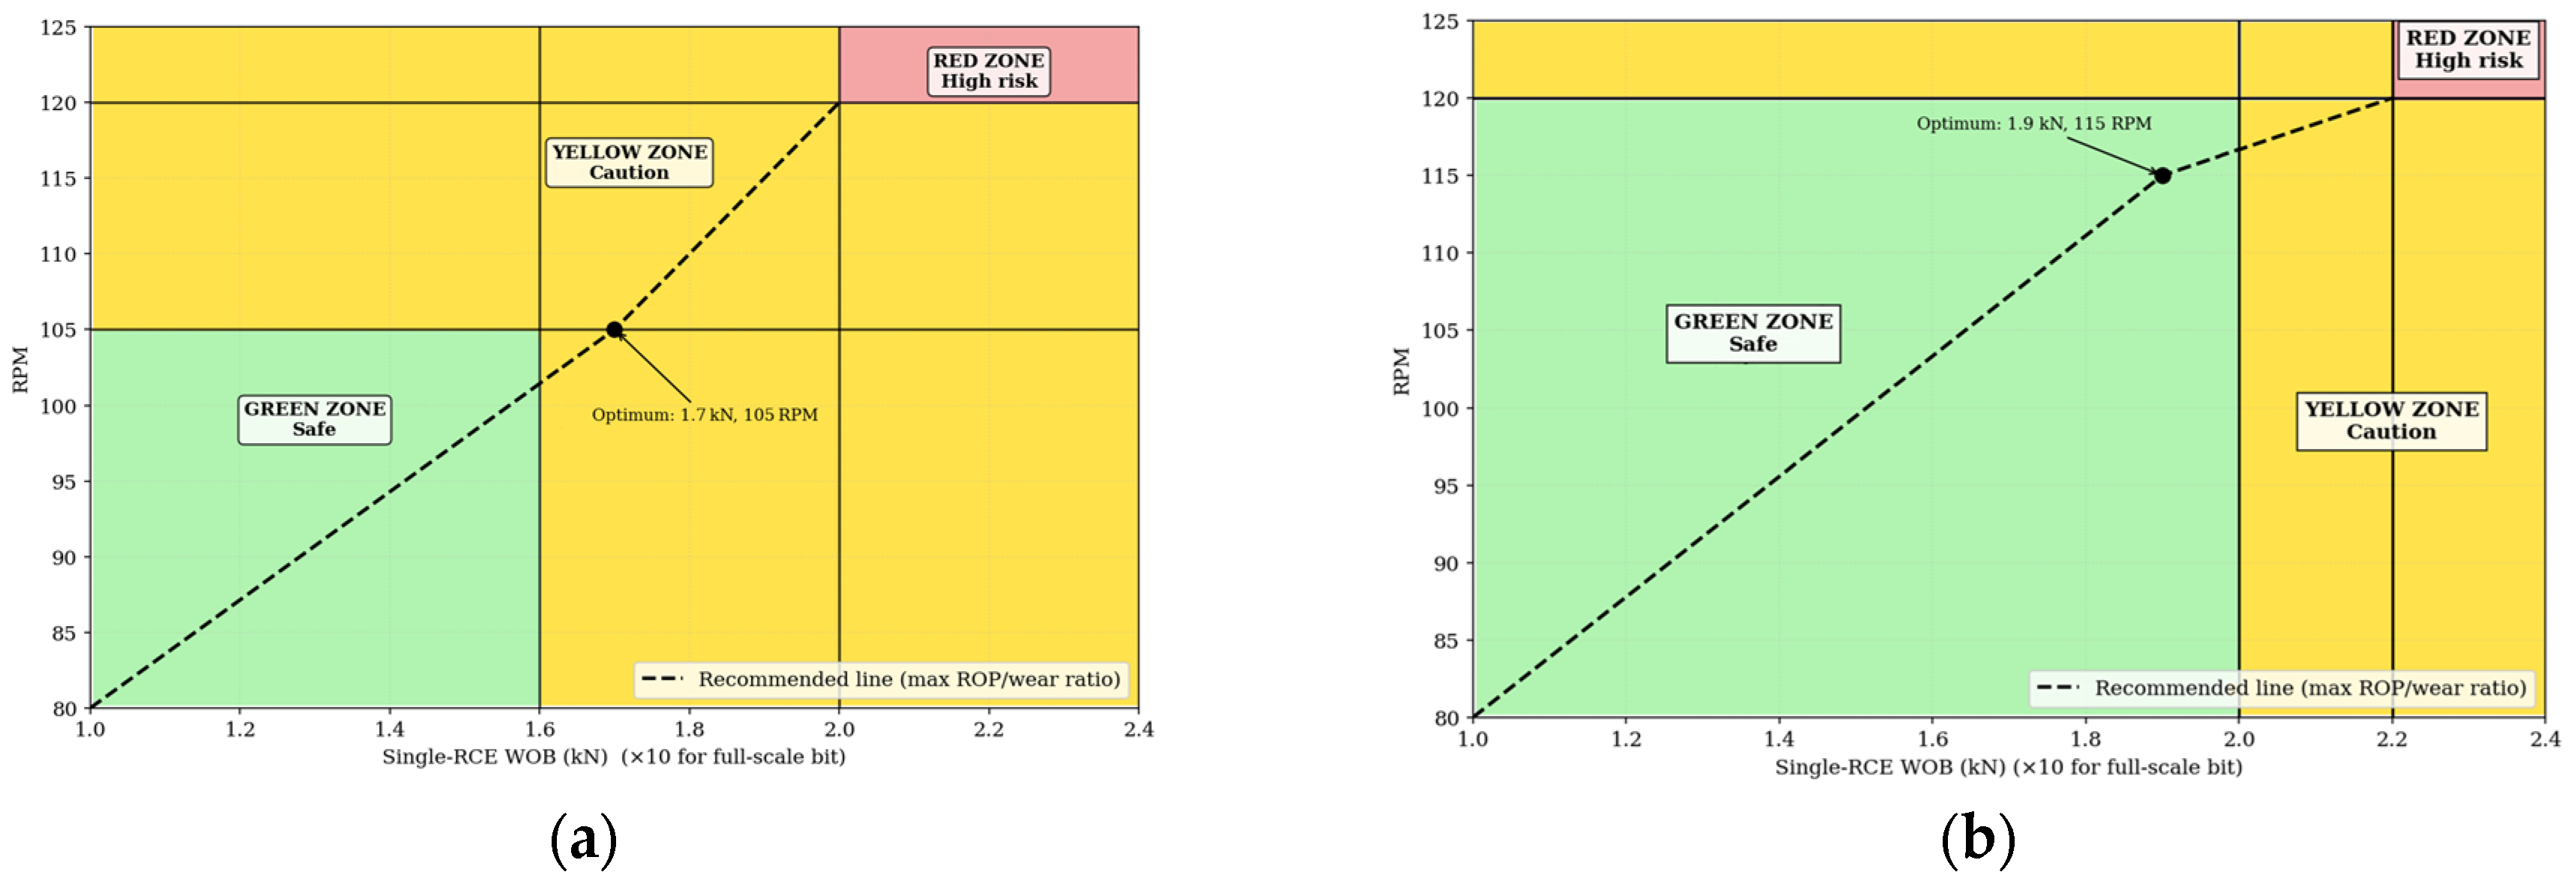
Based on the experimental and numerical results, safe operating charts were constructed for each rock–RCE combination (
Figure 8).
Figure 8a shows the WOB
s–RPM diagram for granite with TiN-coated WC-Co inserts. Three zones are defined according to the predicted RMS axial acceleration and the risk of stick–slip induced failure:
- −
Green zone (WOBs = 1.0–1.6 kN, RPM = 80–105): axial RMS < 12 g, torque fluctuations < 80% of mean. This zone ensures a high rate of penetration (ROP ≈ 0.003 m/s) with minimal wear progression.
- −
Yellow zone (WOBs = 1.6–2.0 kN or RPM = 105–120): axial RMS 12–20 g, torque fluctuations 80–130%. Short stays in this zone are acceptable, but long operation accelerates wear by 30–50% compared to the green zone.
- −
Red zone (WOBs > 2.0 kN and RPM > 120): axial RMS > 20 g, torque fluctuations > 130% of mean. Drilling in this region causes rapid wear (increase in wear rate by a factor of 2–3) and may lead to sudden RCE fracture within 2–3 h.
It should be noted that the zone boundaries are based on interpolated data between the measured points. No extrapolation beyond the tested ranges (WOB 1.0–2.2 kN, RPM 80–120) was performed. The recommended operating point at WOB = 1.7 kN and RPM = 105 lies at the near boundary between the green and yellow zones, providing 94% of the maximum ROP while maintaining vibration levels close to the green zone threshold.
For sandstone with DLC-coated PDC cutters (
Figure 8b), the safe zones are wider due to the lower friction coefficient (μ ≈ 0.1) provided by the DLC coating and the more stable cutting action of the ridged PDC geometry:
- −
Green zone (WOBs = 1.0–2.0 kN, RPM = 80–120): axial RMS acceleration remains below 10 g, and torque fluctuations stay under 70% of the mean value. This wide operational window ensures stable ROP (~0.004–0.005 m/s) with minimal wear progression.
- −
Yellow zone (WOBs = 2.0–2.2 kN or RPM > 120): axial RMS reaches 10–15 g. Short-term operation is acceptable, but extended use accelerates wear by 25–35% compared to the green zone due to increased frictional heat and the onset of minor vibrations.
- −
Red zone (WOBs > 2.2 kN and RPM > 120): axial RMS exceeds 15 g, and torque fluctuations surpass 130% of the mean. Drilling in this region leads to rapid abrasive wear (increase in wear rate by a factor of 2) and possible chipping of the PDC cutters within 3–4 h. The red zone boundary at RPM = 120 is based on the highest tested rotation speed and represents the onset of severe vibrations observed in the experimental data.
The recommended operating point for sandstone, derived from the optimization criterion (Equation (6)), lies near WOBs = 1.9 kN and RPM = 115, which provides approximately 96% of the maximum ROP while maintaining the wear rate at only 40% of that observed in the red zone.
A mathematical criterion for selecting optimal drilling parameters was formulated as the minimisation of the integrated vibration amplitude while maintaining a target ROP. The objective function is
where
and
are the RMS amplitudes of axial and torsional vibrations,
and
are reference values at the centre of the green zone,
is the maximum achievable ROP, and
is a weighting factor (set to 0.3 to give priority to vibration reduction). The minimum of
for granite occurs at WOB
s = 1.7 kN (17 kN full-scale) and RPM = 105, which is indicated by the dashed line in
Figure 8a. This regime gives 94% of the maximum ROP while reducing the predicted wear rate by 35% compared to the red zone.
These charts and the optimisation criterion provide a practical tool for drilling operators to select WOB and RPM values that minimise vibration-induced wear without sacrificing productivity.
4. Discussion: Mechanisms of Coupled Vibrations and Interface Tribology
The experimental and numerical results reveal a positive feedback loop between wear flat growth and vibration severity. As the RCE wears, the contact area () increases according to Equation (3), which directly increases the friction force in Equation (2). This elevated friction force intensifies torque oscillations, particularly during stick–slip events, which in turn accelerates wear through the impact term () in Equation (4). This mechanism explains the sharp increase in vibration amplitudes observed beyond WOB = 1.8 kN and RPM = 120, where the feedback loop becomes self-sustaining. The TiN coating interrupts this loop by maintaining a lower friction coefficient during the critical early stages of contact, as discussed below.
It is important to emphasize that the TiN coating is worn away within fractions of a second of operation (calculated as ~0.16 s for a 5 nm coating at the measured wear rate). The benefit of the coating is realized during the initial running-in stage, where it ensures a low friction coefficient (
vs.
for uncoated WC-Co), reduces the risk of galling and seizure, and may contribute to a smoother initial surface topography on the substrate. After the coating is removed, the subsequent operation occurs on the base WC-Co material. While we do not have direct SEM or profilometry measurements to confirm this topography effect, the observed long-term reduction in wear rate (27%) and improved vibration characteristics are consistent with this mechanism. This interpretation aligns with tribological studies on TiN coatings for cutting tools [
42,
43], which reported a 20–30% reduction in friction under dry sliding conditions. Future work will include surface characterization to verify this hypothesis.
The resonant torsional mode at 55 Hz corresponds to the natural frequency of the drill string assembly identified through experimental modal analysis. This mode does not appear or disappear with RPM; rather, its excitation level increases because stick–slip oscillations at higher RPM generate a broader frequency spectrum with more energy content at the natural frequency. This phenomenon is analogous to the “critical RPM” observed in full-scale drill strings [
5,
44], typically in the 100–150 rpm range, where the energy input from the bit–rock interaction matches the system’s damping capacity. The amplification of this resonance at RPM = 120 explains the 240% increase in torque fluctuations observed in our experiments.
The safe operating charts (
Figure 8) translate the physical mechanisms described above into a practical framework for drilling optimization. The green zone (WOB = 1.0–1.6 kN, RPM = 80–110) corresponds to conditions where the positive feedback loop is not yet self-sustaining, and vibration levels remain below 12 g. In this zone, the TiN coating’s running-in effect is most beneficial, as the lower initial friction helps maintain stable cutting conditions. The yellow zone represents a transition region where the feedback loop begins to amplify vibrations, leading to accelerated wear if operation is prolonged. The red zone marks the onset of severe stick–slip, where the feedback loop becomes self-sustaining and wear rates increase by a factor of 2–3. The recommended operating point (WOB = 1.7 kN, RPM = 105) sits near the green–yellow boundary, providing 94% of maximum ROP while maintaining vibration levels close to the green zone threshold. This represents a practical compromise between productivity and tool life.
The FE model captures the essential physics of the RCE–rock interaction, with simulation-experiment errors of 8–12% for axial and 10–15% for torsional vibrations (
Table 4). These errors are within the typical uncertainty range for rock-cutting simulations [
8,
28]. The slightly larger errors at high WOB and high RPM may reflect the onset of lateral vibrations, which were not fully coupled in the current MDOF model but were monitored experimentally. The overall agreement confirms the validity of the integrated framework for predicting vibration and wear trends.
A key practical outcome of this work is the safe operating chart (
Figure 8) and the accompanying optimisation criterion. For granite drilling with TiN-coated WC-Co inserts, the recommended regime is WOB = 1.7 kN and RPM = 105. This point lies close to the boundary with the yellow zone, providing 94% of the maximum achievable ROP while reducing the predicted wear rate by 35% compared to the red zone. The weighting factor
in the objective function prioritises vibration reduction over pure ROP, which is justified by the high cost of premature insert replacement (typical savings of 25–40% in tooling costs, as estimated in our previous economic analysis [
29]).
The safe operating chart for sandstone (
Figure 8b) defines a wider green zone (WOB = 1.0–2.0 kN, RPM = 80–120), reflecting the lower friction and superior damping of the DLC-coated PDC cutters. The recommended operating point for sandstone lies near WOB = 1.9 kN and RPM = 115, which provides approximately 96% of the maximum ROP while maintaining the wear rate at only 40% of that observed in the red zone.
Limitations of the present study should be acknowledged. First, the experiments were conducted on a single-RCE laboratory stand with a limited to 24 experimental conditions (120 repeated laboratory experiments) supplemented by six verification runs and only two rock types. While the stand provides excellent control and repeatability, it cannot fully replicate the complex dynamic environment of a multi-RCE full-size bit, where interactions between cutters (shadowing, overlapping cuts) and the effect of borehole curvature may alter the vibration response.
Second, the flushing flow rate was kept constant at 0.5 L/min throughout all experiments, and its influence on friction, cooling efficiency, and chip removal was not systematically studied. Variations in flow rate could alter the effective friction coefficient at the RCE–rock interface and affect the thermal balance, which in turn may influence both vibration levels and wear rates. This remains an open question for future investigation.
Third, the MEMS accelerometers, although cost-effective (~$100 per unit vs. $500–1500 for piezoelectric sensors), have a higher noise floor (30 μg/) and a limited range (100 g). For extremely severe stick–slip events with peak accelerations exceeding 100 g, a higher-range sensor would be required.
Fourth, the TiN coatings were applied by laboratory-scale PVD; industrial-scale deposition may introduce thickness variations and residual stresses that could affect performance.
Fifth, the FE model assumed homogeneous rock properties and did not include the effect of natural fractures or fluid flow in the pores, which may influence both cutting forces and heat dissipation.
Future work will focus on three directions. First, the model will be extended to a full-scale bit with multiple cutters using a reduced-order approach (e.g., combined FEM-semi-empirical models) to enable real-time simulation. Second, field tests on an industrial drilling rig will be conducted to validate the safe operating chart under actual downhole conditions (including mud circulation, temperature up to 150 °C, and confining pressure). Third, alternative low-cost sensors, such as piezoelectric film accelerometers (PVDF) and high-speed camera-based digital image correlation, will be evaluated for even more affordable vibration monitoring in remote drilling sites.
This study demonstrates that a combination of low-cost MEMS accelerometers, a validated FE model, and thin TiN coatings (3–5 nm) can significantly improve the understanding and control of vibrations in rock drilling. The proposed safe operating charts offer a practical, ready-to-use tool for drilling engineers to select optimal WOB and RPM, thereby reducing wear, extending tool life, and lowering operational costs.
5. Conclusions
This study developed an integrated finite element framework for the dynamic interaction between an RCE and rock, coupling axial and torsional vibrations with wear flat evolution, friction, and thermal effects, while lateral vibrations were monitored experimentally to support model validation. The model was validated against laboratory experiments performed on a drilling stand using MEMS accelerometers and two types of WC-Co inserts (uncoated and coated with a 3–5 nm TiN layer). The experimental program, comprising 24 experimental conditions (120 repeated laboratory experiments) supplemented by six verification runs, provided sufficient data to construct response surfaces and to identify critical resonant regimes.
The TiN coating reduced the axial RMS acceleration by 18% and the torsional vibration amplitude by 24% compared to uncoated inserts, while the wear rate decreased by 27% (from 0.154 to 0.112 mm/h) under representative drilling conditions in granite. The frequency spectra revealed a strong resonant peak at 55 Hz when the rotation speed exceeded 120 rpm, corresponding to the natural torsional frequency of the assembly. At this resonance, torque fluctuations increased by 240%, leading to severe stick–slip and accelerated wear. A safe operating chart was constructed defining a green zone (WOB
s = 1.0–1.6 kN, RPM = 80–110) where vibrations remain low, a yellow zone (WOB
s = 1.6–2.0 kN or RPM = 110–130) where caution is required, and a red zone (WOB
s > 2.0 kN and RPM > 120) where high risk of catastrophic wear exists. For sandstone with DLC-coated PDC cutters, a separate safe operating chart (
Figure 8b) defines a wider green zone (WOB
s = 1.0–2.0 kN, RPM = 80–120), reflecting the lower friction and superior damping of the DLC-coated cutters. The recommended operating point for granite with TiN-coated inserts is WOB
s = 1.7 kN and RPM = 105, which gives 94% of the maximum achievable rate of penetration while reducing the predicted wear rate by 35% compared to the red zone.
The comparison between simulated and experimental time histories showed good agreement, with relative RMS errors of 8–12% for axial vibrations and 10–15% for torsional vibrations. These errors are within acceptable limits for engineering purposes and confirm the validity of the integrated model. The use of low-cost MEMS accelerometers (ADXL1001, 100 g, 30 μg/Hz noise) proved to be a viable alternative to expensive piezoelectric sensors, offering sufficient accuracy for laboratory vibration analysis at a fraction of the cost. The thin TiN coating (3–5 nm) was associated with improved laboratory vibration characteristics and reduced wear of WC-Co inserts under the investigated drilling conditions. These improvements are consistent with the beneficial effect of the coating during the initial running-in stage.
However, it must be emphasized that this framework is demonstrated at the laboratory scale. The conclusions regarding safe operating charts, drilling optimization, and cost savings should be considered as promising results that require further validation for full-scale applications. The model needs to be validated with more rock types, variable flushing conditions, and longer wear tests. The economic benefits estimated from the reduction in wear rate and extended tool life (25–40% saving in tooling costs per drilled meter) are based on laboratory data and require field verification.
The practical implications of this work are twofold. First, the safe operating chart provides a simple, visual tool for drilling operators to select weight on bit and rotation speed that minimize vibration-induced wear without sacrificing productivity. Second, the validated numerical model can be used for virtual testing of new RCE geometries and coatings before expensive field trials, thereby accelerating the development cycle.




 ,
,