1. Introduction
Overhead power transmission lines are a vital means of transmitting electrical energy, and ensuring their safe operation can significantly enhance the reliability of the power grid [
1]. Under the influence of light winds (Force class 1–3), transmission line conductors exhibit periodic vibrations (i.e., aeolian vibrations), while conductors, shielded cables, and overhead communication cables experience high-frequency low-amplitude micro-vibrations. This is caused by periodic vortices (Karman vortices) on the downwind side of the conductor, which induce vibrations perpendicular to the wind direction. Vibration frequencies range from 3 to 120 Hz, with amplitudes reaching up to one time the conductor’s diameter.
These vibrations generate alternating bending stresses in the conductors, which are superimposed on the static tensile and bending stresses of the wires. Prolonged vibration can cause damage to the conductor at the clamping points, ranging from fatigue failure of individual conductors to the breakage of the entire strands. Vibration is transmitted to the utility poles via suspension and tension hardware, leading to issues such as loose joints and pole failure [
2].
Anti-vibration dampers, as a cost-effective means of suppressing aeolian vibrations, are widely used in power transmission networks around the world [
3]. Despite many other damping devices being invented during the last century, the Stockbridge type vibration damper is still the best technical and economical solution for the control, within the safety limits, of the overhead cable vibrations. Stockbridge dampers eliminate wind-induced vibrations in conductors and significantly reduce vibration stresses, thereby ensuring the long-term service life of overhead power lines [
4]. If the physical principles governing the interaction between the damper and the conductor are overlooked, not only will sufficient damping effects fail to be achieved, but the damper may even cause damage to the conductor at its fixing points, or suffer damage itself due to overloading.
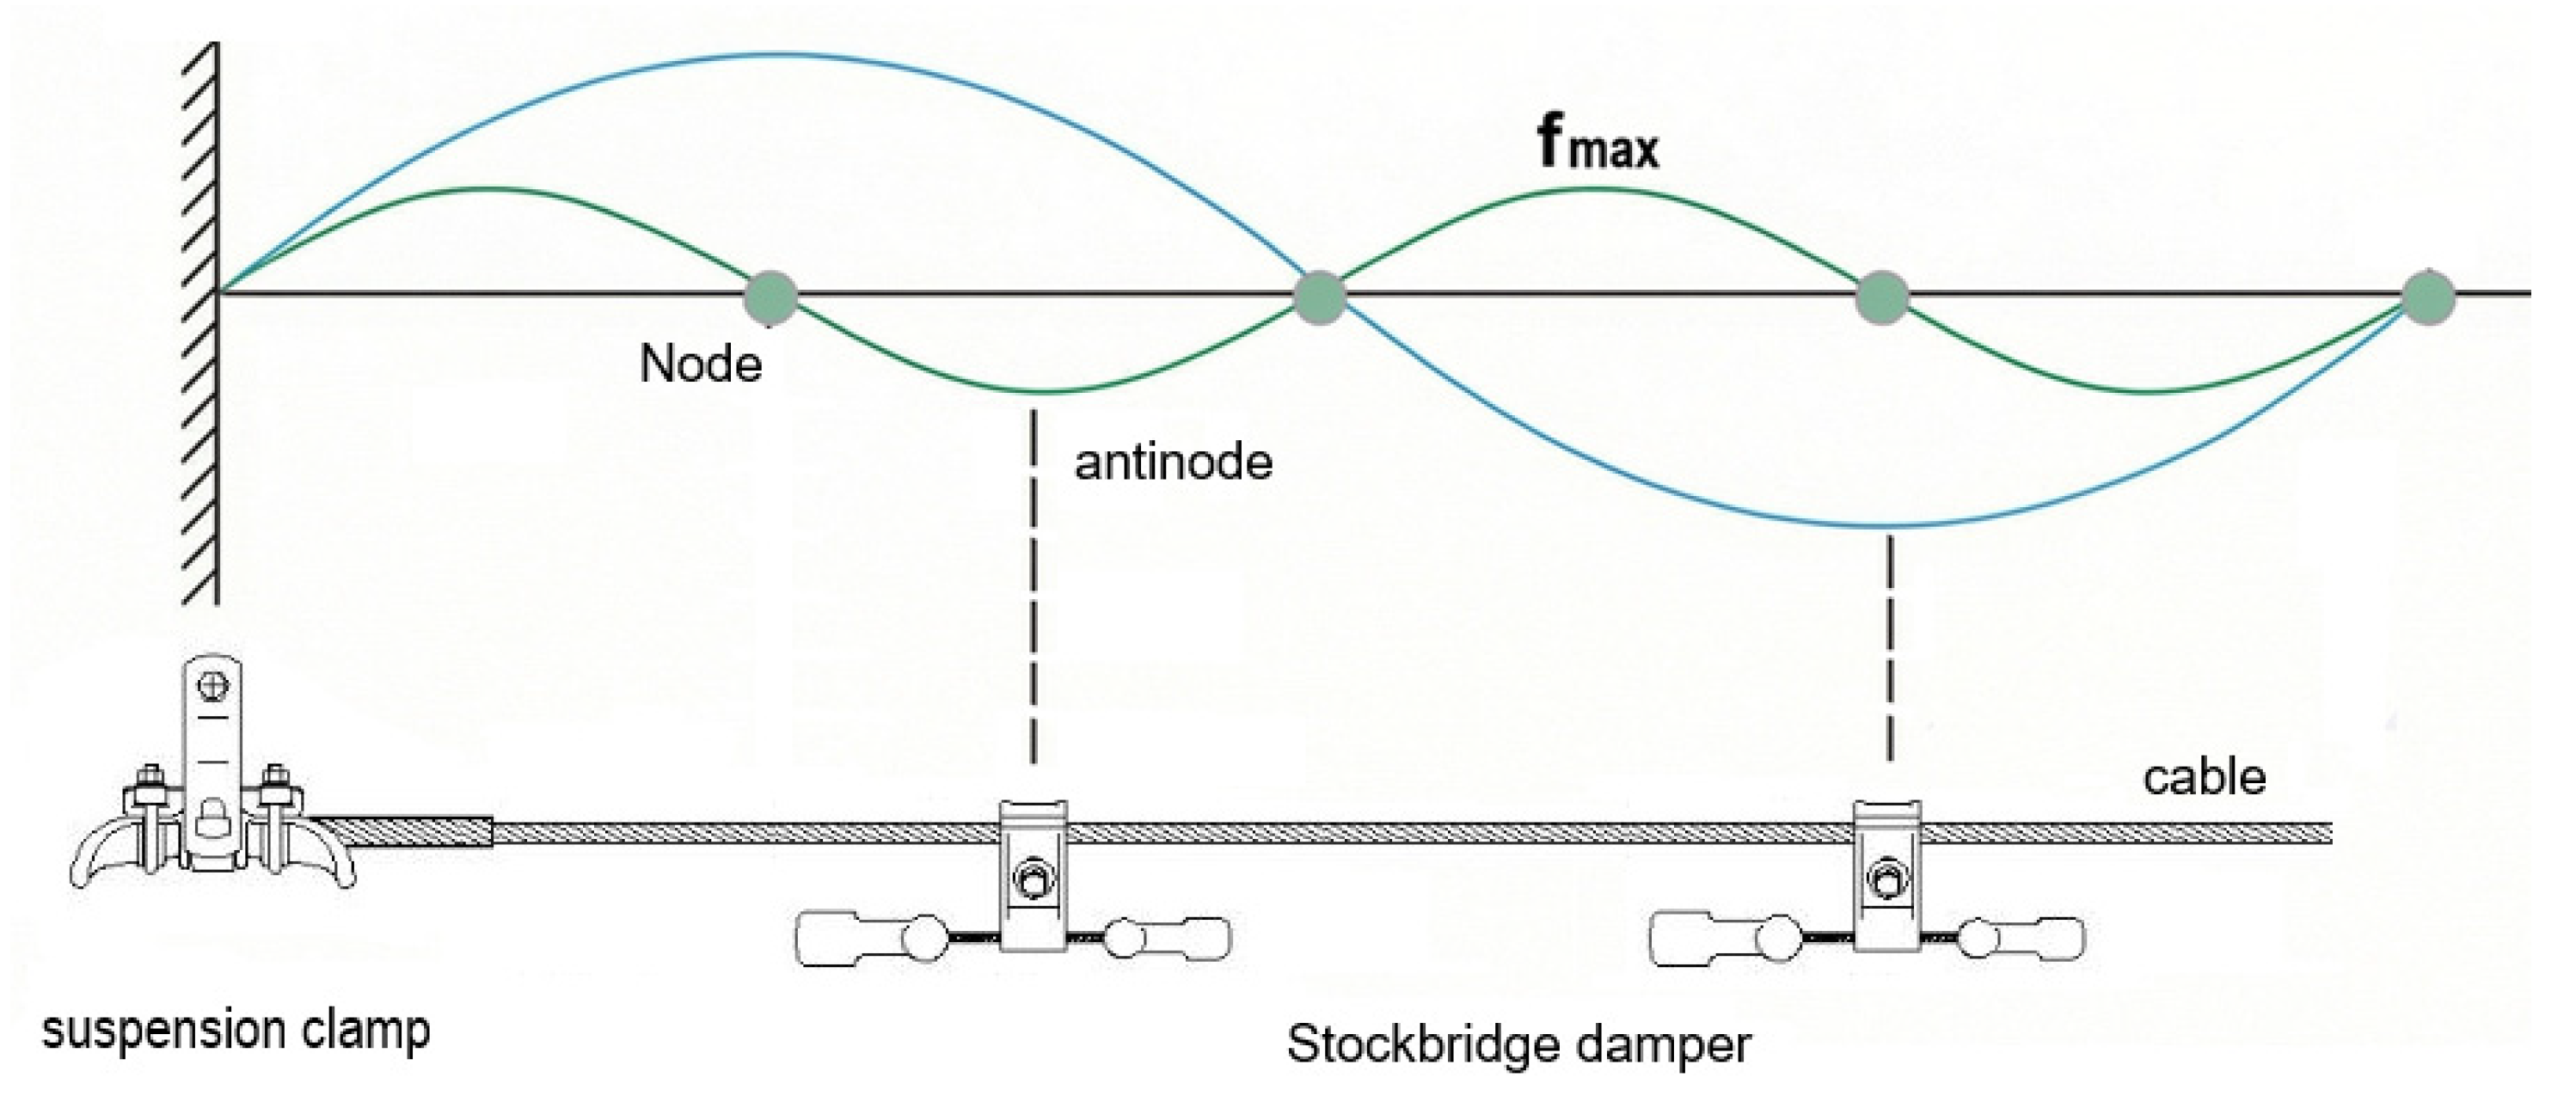
The vibration dampers must be installed at the antinodes of the vibration waves in the conductor in order to effectively absorb vibration energy and suppress conductor vibration [
5]. However, in practice, the frequencies of conductor vibration are dynamic, forming a vibration spectrum ranging from the lowest to the highest frequency; therefore, the selection of the installation position for vibration dampers must take into account the effects of these various frequencies. The frequency range that poses the greatest risk to the conductor is generally 3 Hz to 80 Hz. At higher frequencies, the damping effect increases significantly, preventing damage; conversely, at lower frequencies, the damping effect weakens, and the frequency response of the vibration dampers is also poorer.
According to a 2013 survey of multiple power lines conducted by the Huzhou Power Supply Company in Zhejiang, China, it was found that the average slippage rate accounted for 2.8% of the total number of vibration dampers installed; this has become a key indicator for assessing the overall severity of the issue. Following improvements in design standards and manufacturing quality control, incidents of vibration dampers slipping have been significantly reduced. With the increase in ultra-high-voltage (UHV) ultra-long-distance transmission lines, the reliability requirements for UHV transmission lines have correspondingly risen. Research into the issues of vibration damper loosening and slippage, and their solutions, continues to hold engineering value and technical significance.
Stockbridge damper is composed of a heavy hammer of a certain quality, zinc-coated steel strand and wire clamp with high elasticity and strength. By providing sufficient grip strength, the clamp secures the damper to the conductor at a specific location. Adjusting the preload on the fastening bolts allows for precise control of the clamping force.
The failure of the connection between the damper and the power line is a cumulative process involving multiple contributing factors, primarily influenced by dynamic loads, installation practices, and design and material characteristics [
6]. Firstly, the continuous effect of dynamic alternating loads must be considered. The subject of this study is the effect of micro-vibrations from wind and sub-chordal oscillations on connection points, which are subject to prolonged high-frequency, low-amplitude alternating stresses. This loading is the primary mechanical cause of bolt preload decay. Secondly, defects in the installation process can have a substantial impact on connection reliability. For instance, torque control is critical: insufficient torque results in inadequate initial preload, while excessive torque may cause plastic deformation of bolts or clamps, accelerating stress relaxation. Furthermore, inadequate cleaning of conductor-clamp contact surfaces prior to installation has been demonstrated to reduce initial friction [
7]. The influence of environmental humidity on friction and wear behavior at interfaces has been demonstrated to be a significant factor in the development of fretting and stress-softening vibration (FISSV) characteristics. In conditions of dry operation, the formation of stable friction layers at interfaces has been demonstrated to increase contact stiffness [
8]. Nonlinear friction forces initially manifest as equivalent stiffness and damping coefficients, with the stiffness coefficient mitigating the vibration-damping effect of the damping coefficient [
9]. In conclusion, it should be noted that inherent limitations in design and materials may also induce failure [
10]. It is important to note that traditional bolted connections inherently exhibit an element of risk with regard to loosening under conditions of extreme vibration [
11,
12,
13]. Furthermore, creep and stress relaxation in metallic materials under sustained stress naturally result in a decline in preload over time [
14].
With regard to the issue of bolt preload decay, some scholars have conducted research on it. Zadoks et al. [
15] derived a theoretical predictive model for the decay process of preload force, and utilized this model to elucidate the mechanism of rotational loosening. Zhu et al. [
16] used the finite element method to calculate the time-domain characteristics of the axial stress distribution of bolts under random vibration conditions, and investigated methods for selecting bolts under different preload conditions. Hu et al. [
17] utilized the finite element method to simulate the bolt loosening process under lateral loading, analyzing the variation in residual preload of bolt assemblies under cyclic loading, as well as the influence of load application position, amplitude and frequency on bolt loosening. Our research group [
18] experimentally investigated the preload decay law of bolt fasteners for stockbridge damper under vibration load. The transverse vibration testing machine is used to simulate the vibration environment under actual working conditions, and the anti-loosening performance of a variety of gasket combinations (including ordinary flat washers, spring washers, nylon lock nuts and NLX anti-loosening gaskets, etc.) is compared and analyzed. The experimental results show that, under the enhanced vibration conditions, all the tested solutions show a sharp decrease in preload force in the initial stage and the downward trend gradually levelled off after five hundred cycles. Among them, the combination of NORD-LOCK X series gaskets shows the optimal anti-loosening ability, with the lowest preload force decay rate. The conclusion of the study provides an experimental basis for the anti-loosening design of stockbridge damper bolted connections, which is an important reference value for improving the reliability of transmission line operation.
Based on engineering experience, the probability of bolts loosening under dynamic loads is significantly higher than under static loads, and the dynamic loads experienced by vibration dampers under aeolian vibrations are complex and variable. Building upon the industry-wide improvements in material stability and manufacturing quality, and having already mitigated the effects of installation processes through the use of torque wrenches, the primary objective of this paper is to investigate the relationship between bolt preload and vibration frequency under dynamic loads. First, the theoretical impact of the vibration damper’s positional displacement on its damping effectiveness is analyzed. Subsequently, pull-out tests are conducted to determine the safety thresholds for friction forces at different torque levels. Finally, a displacement test under aeolian vibration conditions is designed. By combining theoretical analysis with experimental methods, this study investigates the key factors influencing the loosening of bolts in vibration damper clamps, with the aim of providing a theoretical foundation for engineering applications.
2. The Effect of Vibration Dampers’ Position Deviation on Damping Performance
It is evident that, for vibrations at a given frequency, the best energy dissipation or vibration damping effect is achieved when the vibration damper is installed at the antinode, as shown in
Figure 1. Conversely, if the installation position is selected at the node, the vibration damper will be unable to dissipate the vibration energy of the overhead power line, regardless of how suitable its frequency response characteristics may be. The optimal installation position for a vibration damper is typically located approximately 0.15–0.25 wavelengths from the suspension point. The specific position requires optimization calculations based on the actual vibration frequency range and conductor parameters [
19]. However, if the installation position shifts, thereby altering the optimal position, the damping effect will decrease significantly, or even cease to function altogether.
The vibration damper is mounted on the conductor, and its vibrational excitation is derived from the vibrational displacement of the conductor. When the vibration damper deviates from its optimal position, the excitation displacement changes. For simple harmonic vibration, the mode function of the conductor is:
Here, A represents the amplitude, and k = 2π/λ represents the wave number.
The displacement amplitude detected by the vibration damper is:
When the vibration damper is located at a wave antinode (x = λ/4, 3λ/4, …), the excitation displacement is at its maximum, Ymax = A.
When the vibration damper is located at a wave node (x = 0, λ/2, λ, …), the excitation displacement is zero, Ymin = 0.
As mentioned above, when the damper is located at the wave node, its power dissipation is zero; this theoretically explains the effect of positional offset on the damping performance.
2.1. The Effect of Positional Offset on Energy Dissipation Capacity
The power dissipated by the vibration damper is proportional to the square of its vibration amplitude, as shown in Equation (3):
Here, Y represents the amplitude of vibration, which is related to the excitation displacement.
When the damper moves away from its optimal position (near the antinode) towards the node, the excitation displacement decreases, the amplitude decreases, and the power dissipated decreases.
The location factor can be defined by Equation (4):
Thus, the energy dissipation capacity is proportional to the square of the position factor:
Here, Pmax represents the dissipated power at the optimal position. The relationship between the position factor and the normalized position (x/λ) is shown in
Table 1. As seen from
Table 1, when the damper is displaced by 1/8 wavelength, its energy dissipation capacity is reduced by 50%; when displaced to the node position, its energy dissipation capacity is completely lost.
2.2. The Effect of Damper Displacement on Different Frequencies
Since different frequencies correspond to different wavelengths, the effect of a displacement in the damper’s position varies depending on the frequency. Let the designed position be x
0. For frequency f
1 and wavelength λ
1, the position factor (Equation (6)) is:
When the damper has displaced by Δx, the position factor becomes:
For frequency f
2 and wavelength λ
2, the position factor after the shift is:
Since λ
1 ≠ λ
2, the degree of influence of the positional offset varies depending on the frequency. This may result in a greater reduction in the damping effectiveness at certain frequencies [
20].
2.3. The Relationship Between the Positional Offset and the Damping Effect
Assume that the designed installation position is x0 (near the optimal position), and the actual position is x = x0 + Δx, with an offset of Δx.
For a specific frequency f, the rate of decline in vibration damping is:
If the design position is at the antinode (x
0 = λ/4), then
For small displacements (Δx ≪ λ):
This indicates that the rate of decline is proportional to the square of the displacement, as shown in
Table 2.
As can be seen from
Table 2, when the displacement reaches 1/8 of the wavelength (0.125λ), the damping effect is reduced by 50%; when the displacement reaches 1/4 of the wavelength (0.25λ), the damper completely loses its damping effect [
21].
3. Determination of the Friction Coefficient Between the Conductor and the Damper
In circumstances where conductors and clamping devices exhibit a propensity to slip as a consequence of external forces, friction can be viewed as the counterforce that prevents such movement [
22]. The materials constituting the friction pair are principally cast aluminum alloy and aluminum alloy conductors, functioning in the absence of lubrication under conditions of near-dry friction. The static friction coefficient μs between materials and the variation in the coefficient of friction μk under dynamic loads are critical parameters. The static friction coefficient ranges from μs ≈ 0.40 to 0.55, but the precise friction coefficient requires experimental testing to determine [
23].
3.1. Bolt Torque and Preload Force
Bolts rely on their own preload to generate frictional torque on the surfaces of the connected components, thereby joining two or more parts together. This ensures the reliability and tightness of the bolted connection.
The permissible tightening torque for M16x2 Grade 6.8 bolts is 145–193 N·m. For M16x2 Grade 6.8 galvanized bolts selected in the design, the relationship between tightening torque and tension force is as follows:
In the formula: T denotes the tightening torque (N·m); k is the torque coefficient (provided by experiments or manufacturers, typically between 0.10 and 0.30); Pb is the required preload force for the bolt (kN, related to the bolt strength grade and stress-bearing cross-sectional area); and d is the nominal diameter of the bolt (mm). The selection of a friction coefficient of μ = 0.25 for galvanized bolts and steel nuts results in a calculated torque coefficient of approximately 0.311. In conditions of high friction (K = 0.311), it has been determined that each 1 N·m of torque can generate approximately 201 N of preload force. The dispersion of K values is significantly influenced by assembly processes (e.g., lubrication, tightening tool precision) and requires calibration through experimental measurement [
24,
25]. It is imperative that the bolt tightening force be sufficiently high to ensure that static friction between contact surfaces adequately resists external lateral shear loads, thereby preventing relative slippage between clamped components [
26]. The calculated corresponding preload data for different tightening torques is shown in
Table 3.
3.2. Static Mechanical Analysis of the Vibration Damper
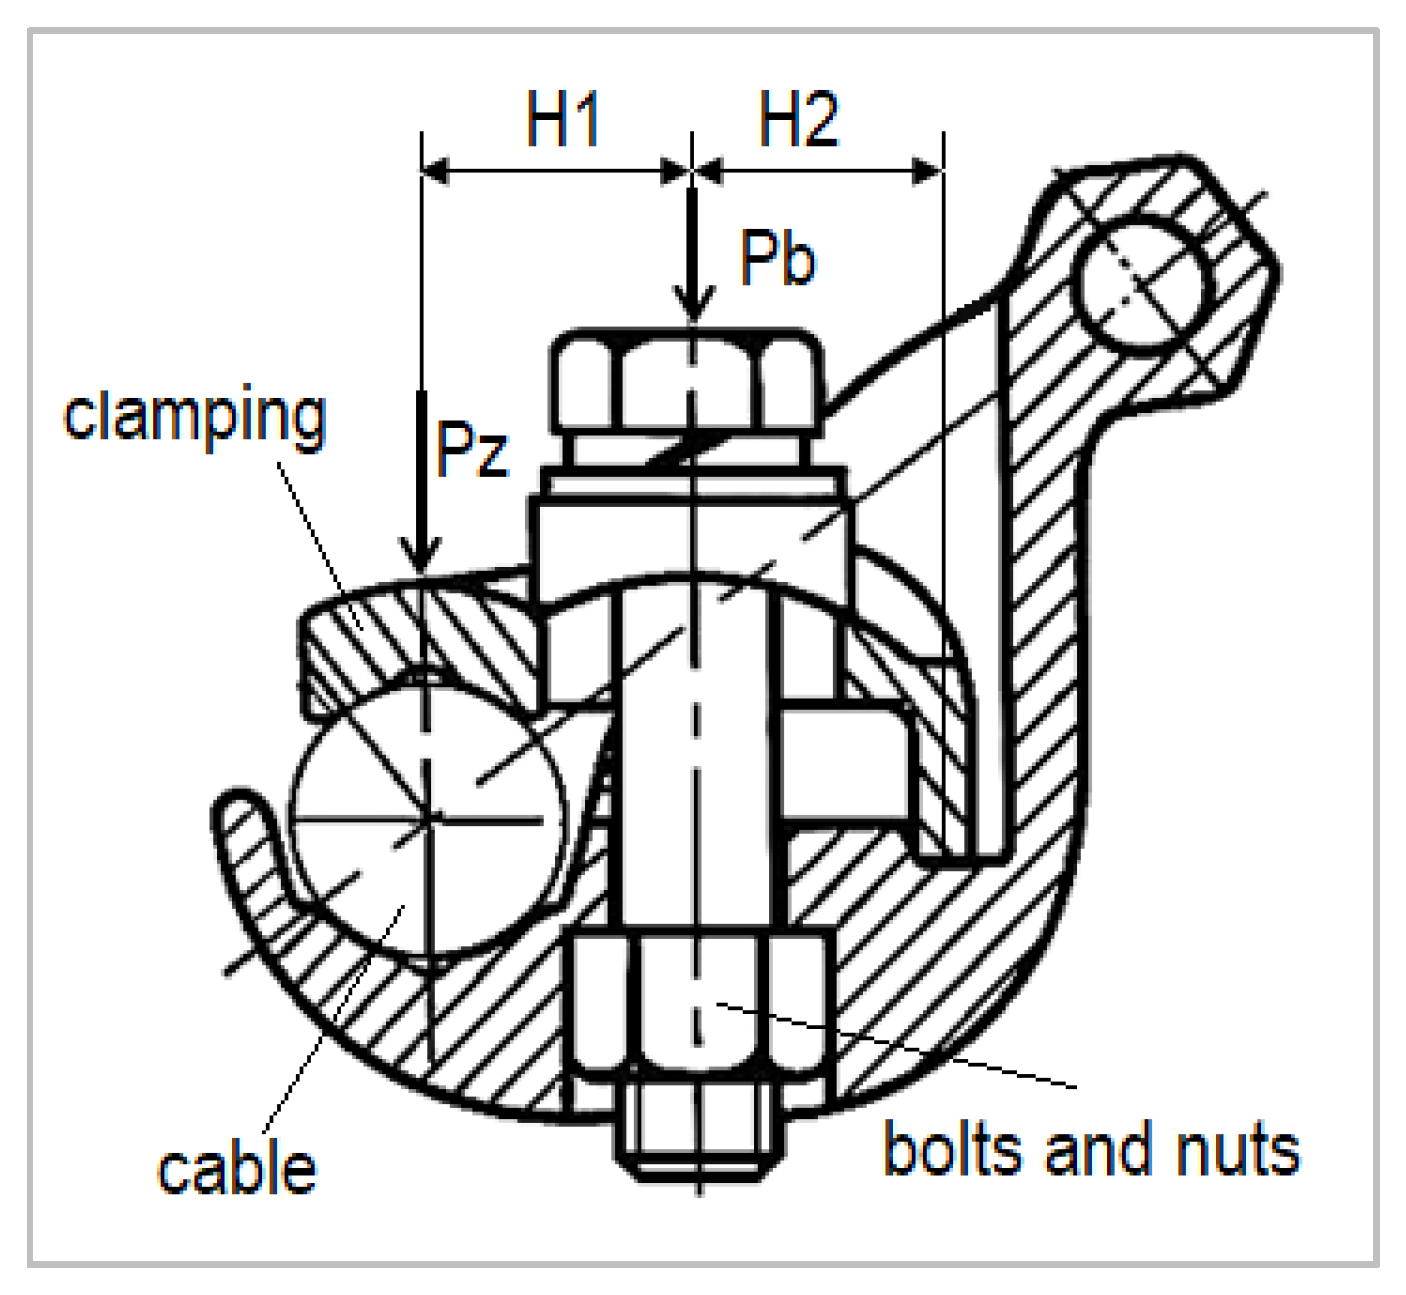
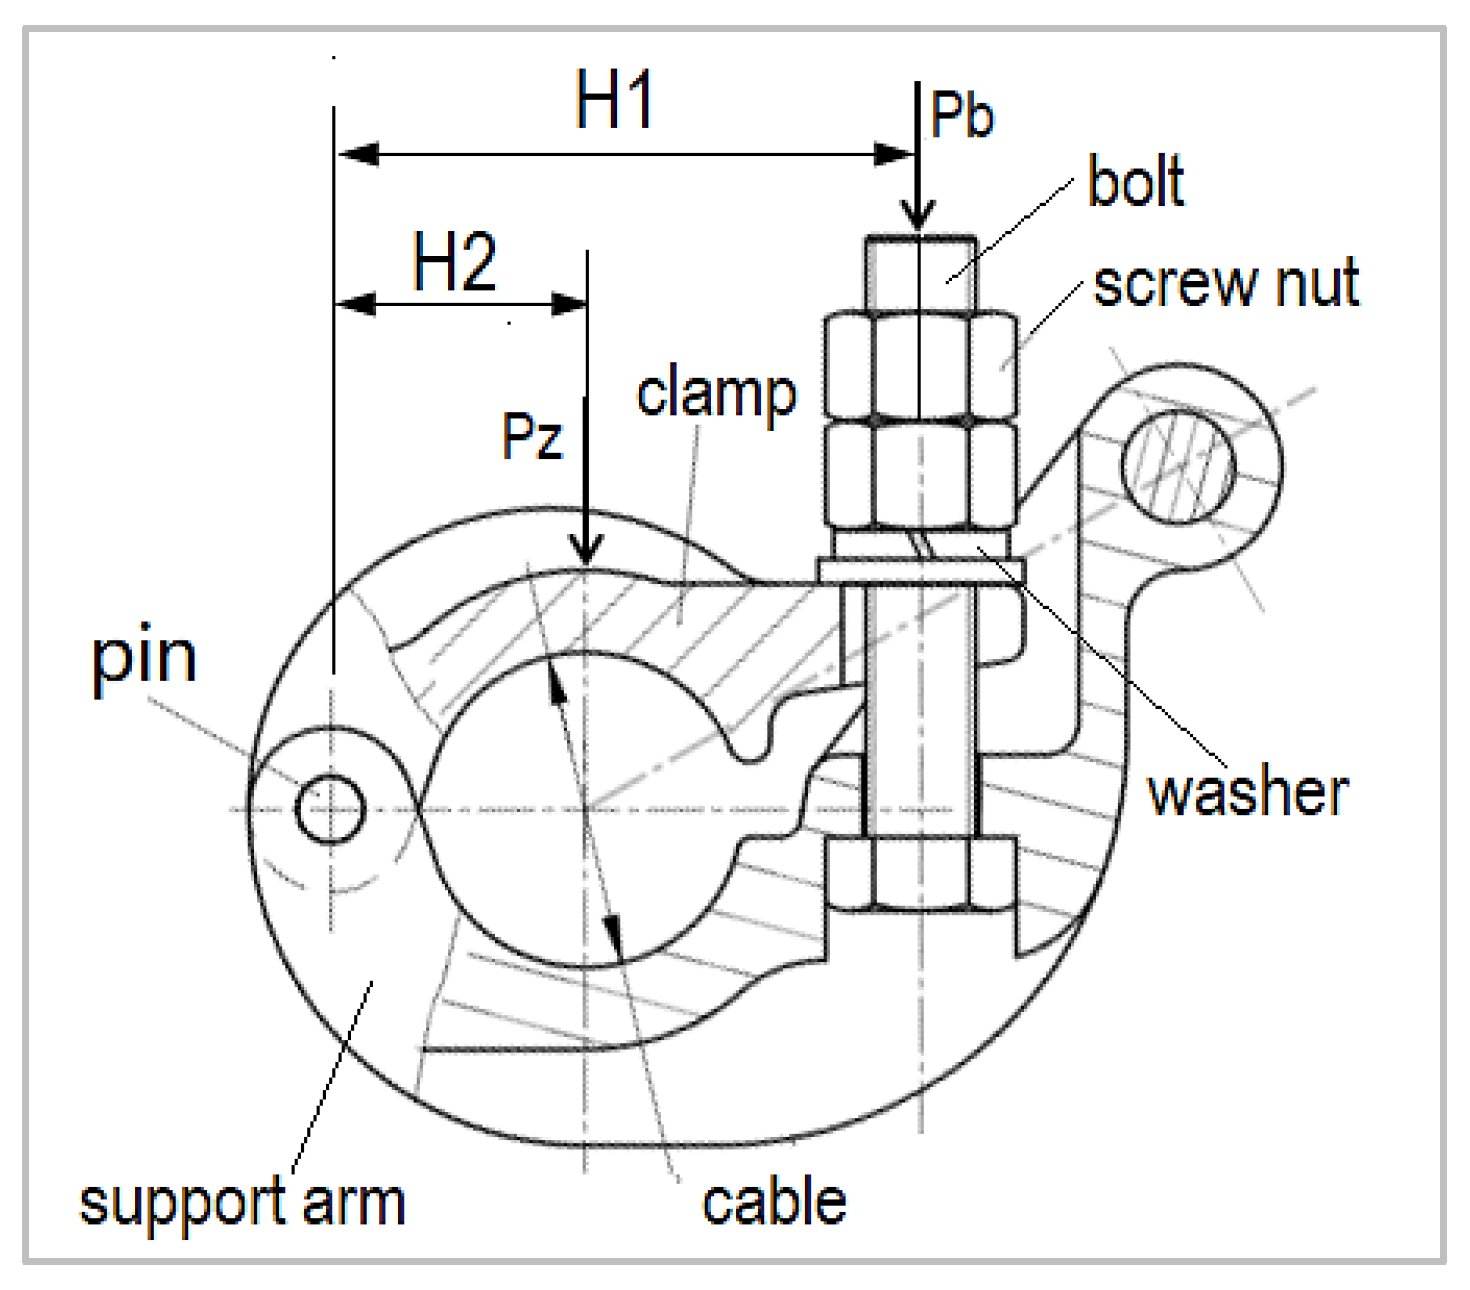
The vibration damper structure consists of a steel strand, a clamp affixed to the center of the steel strand, and a hammer head that is shaped like a tuning fork and is fixed at both ends of the clamp. The hammer head has been designed to adopt a tuning fork configuration. The wire clamp structure is composed of two primary components: the pressure block support arm cover and the hinged support arm cover. The block-type structure secures the clamp to the support arm using bolts and nuts, while the hinged-type structure employs a hinged connection. The two designs differ in their anti-loosening performance and installation processes. The arm-cover and bolt fastening assembly of the vibration damper connects the damper to the conductor, as illustrated in
Figure 2 and
Figure 3.
A static mechanical analysis of the vibration damper was carried out in order to determine the relationship between the preload of the bolts and the clamping force of the clamps.
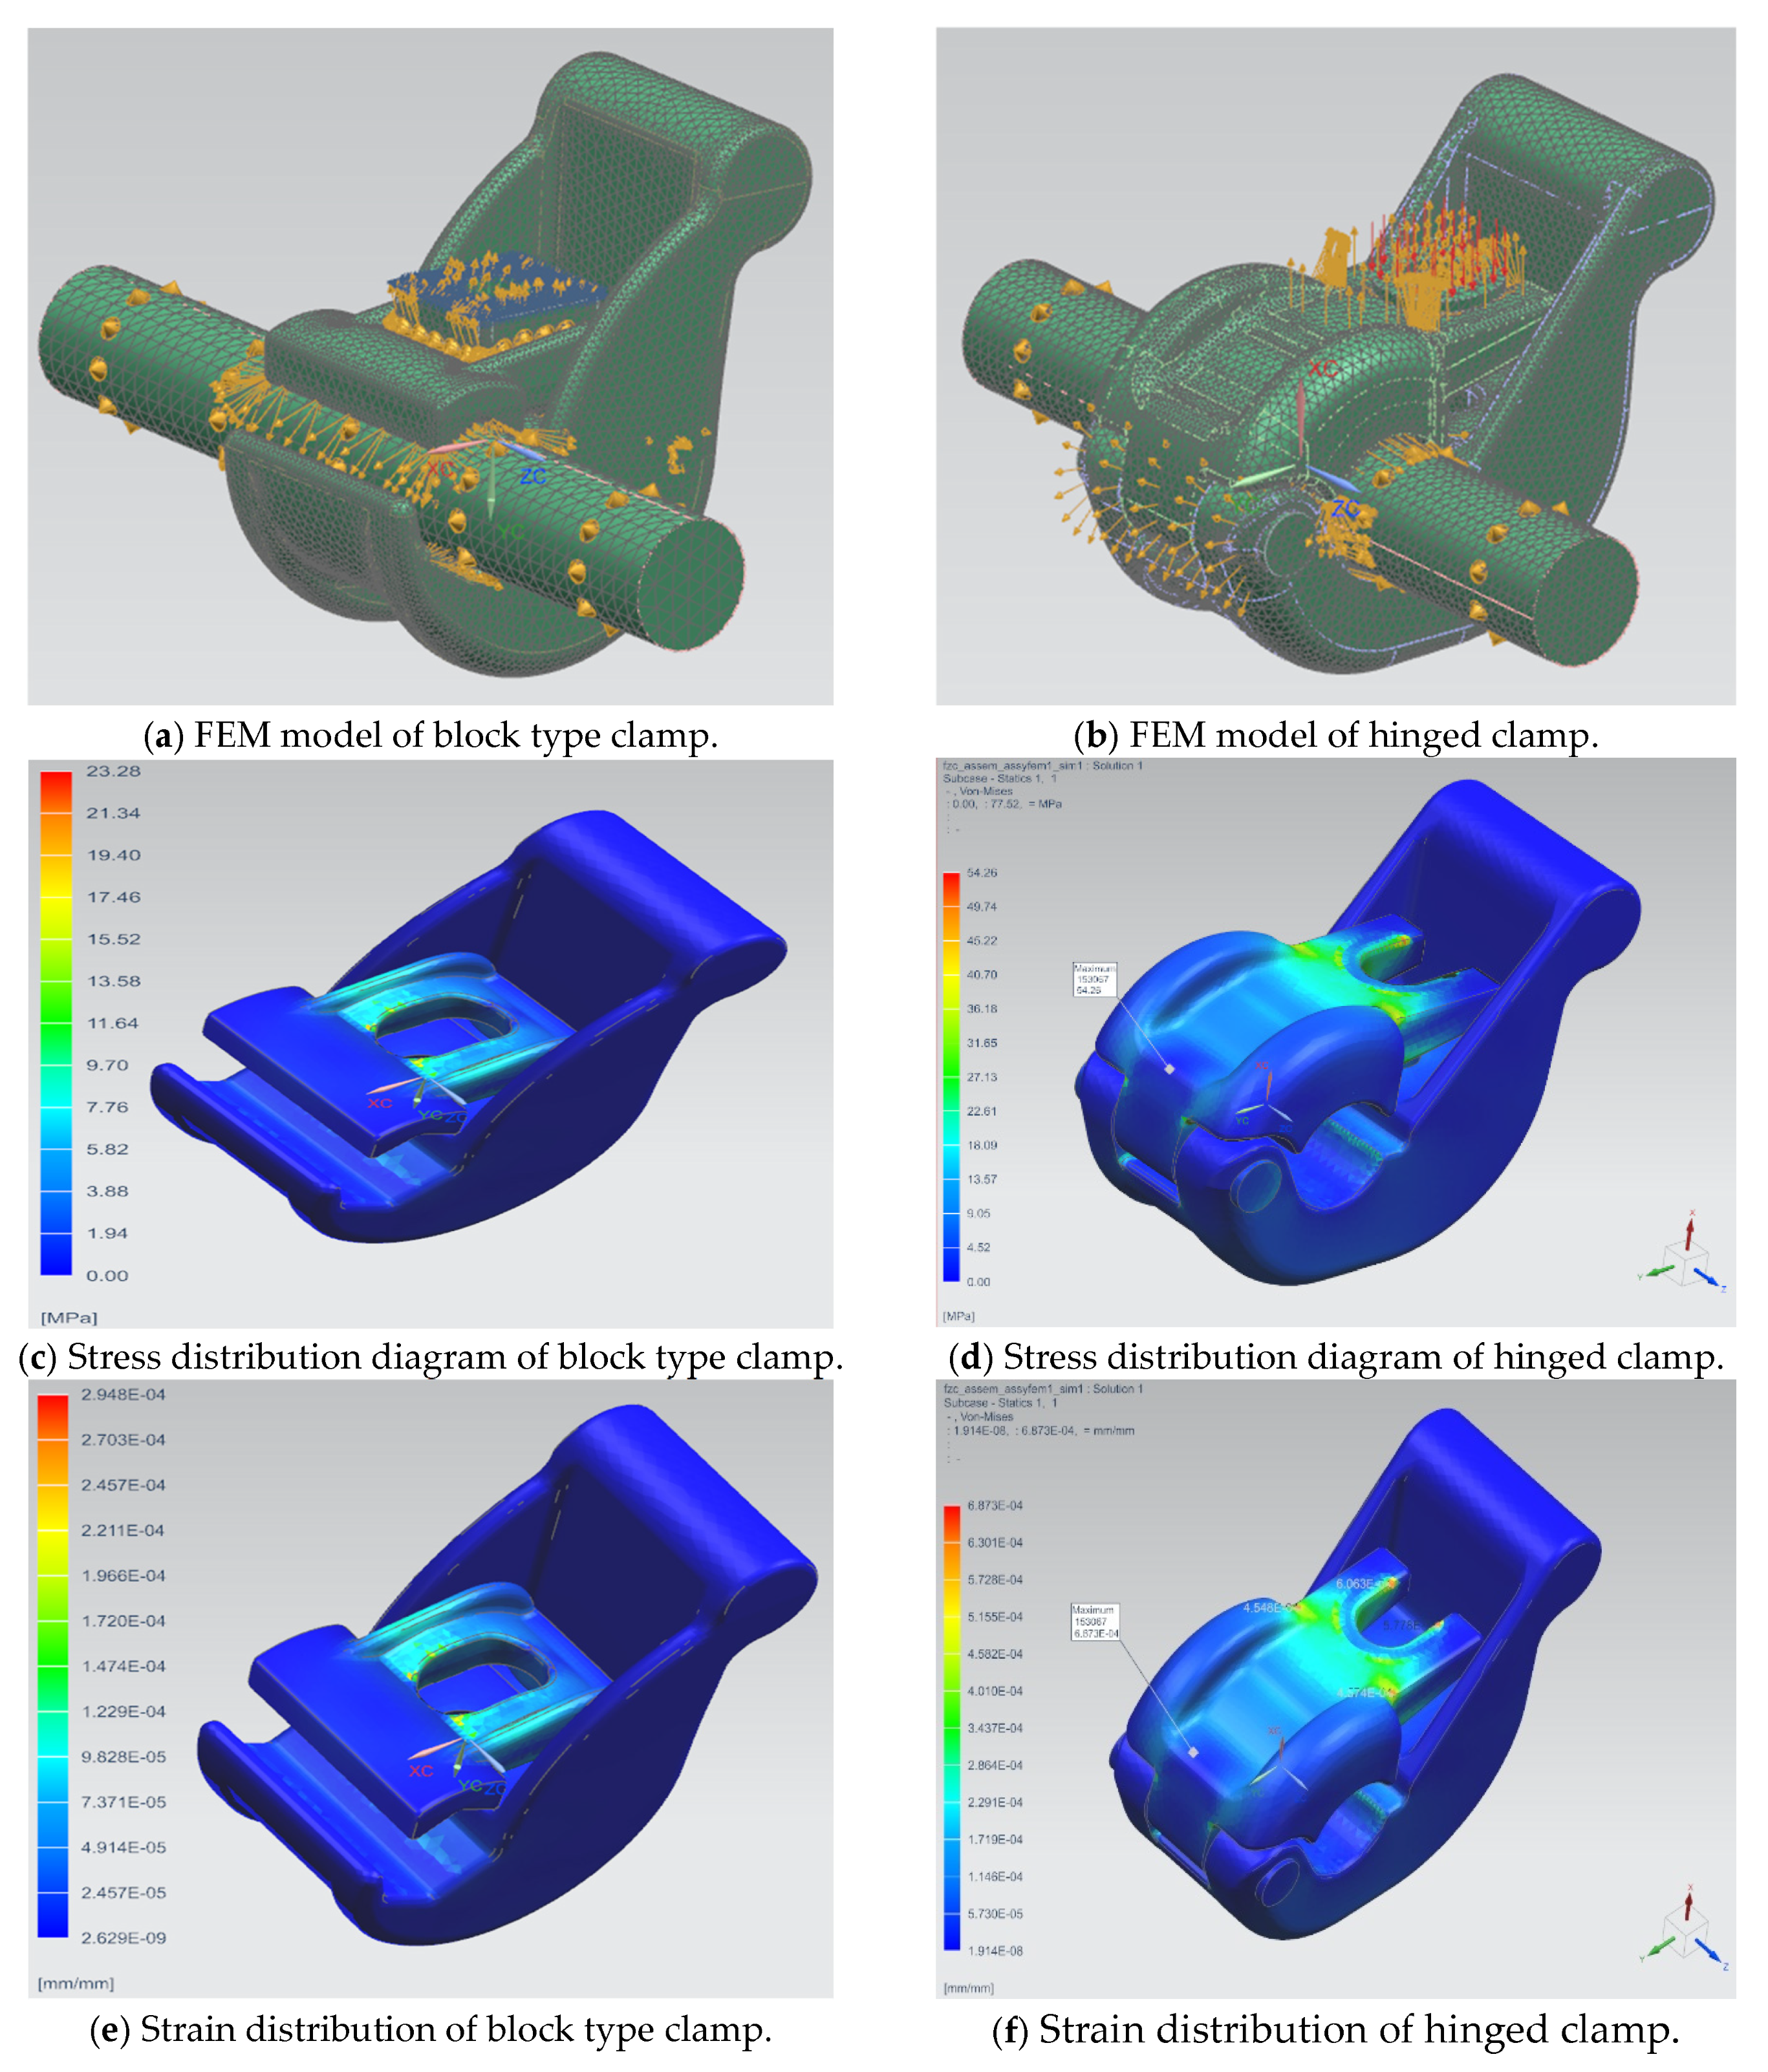
Figure 4a,b show the finite element models of the two types of clamps. By varying the preload, different stress–strain values can be obtained (as shown in
Figure 4c–f).
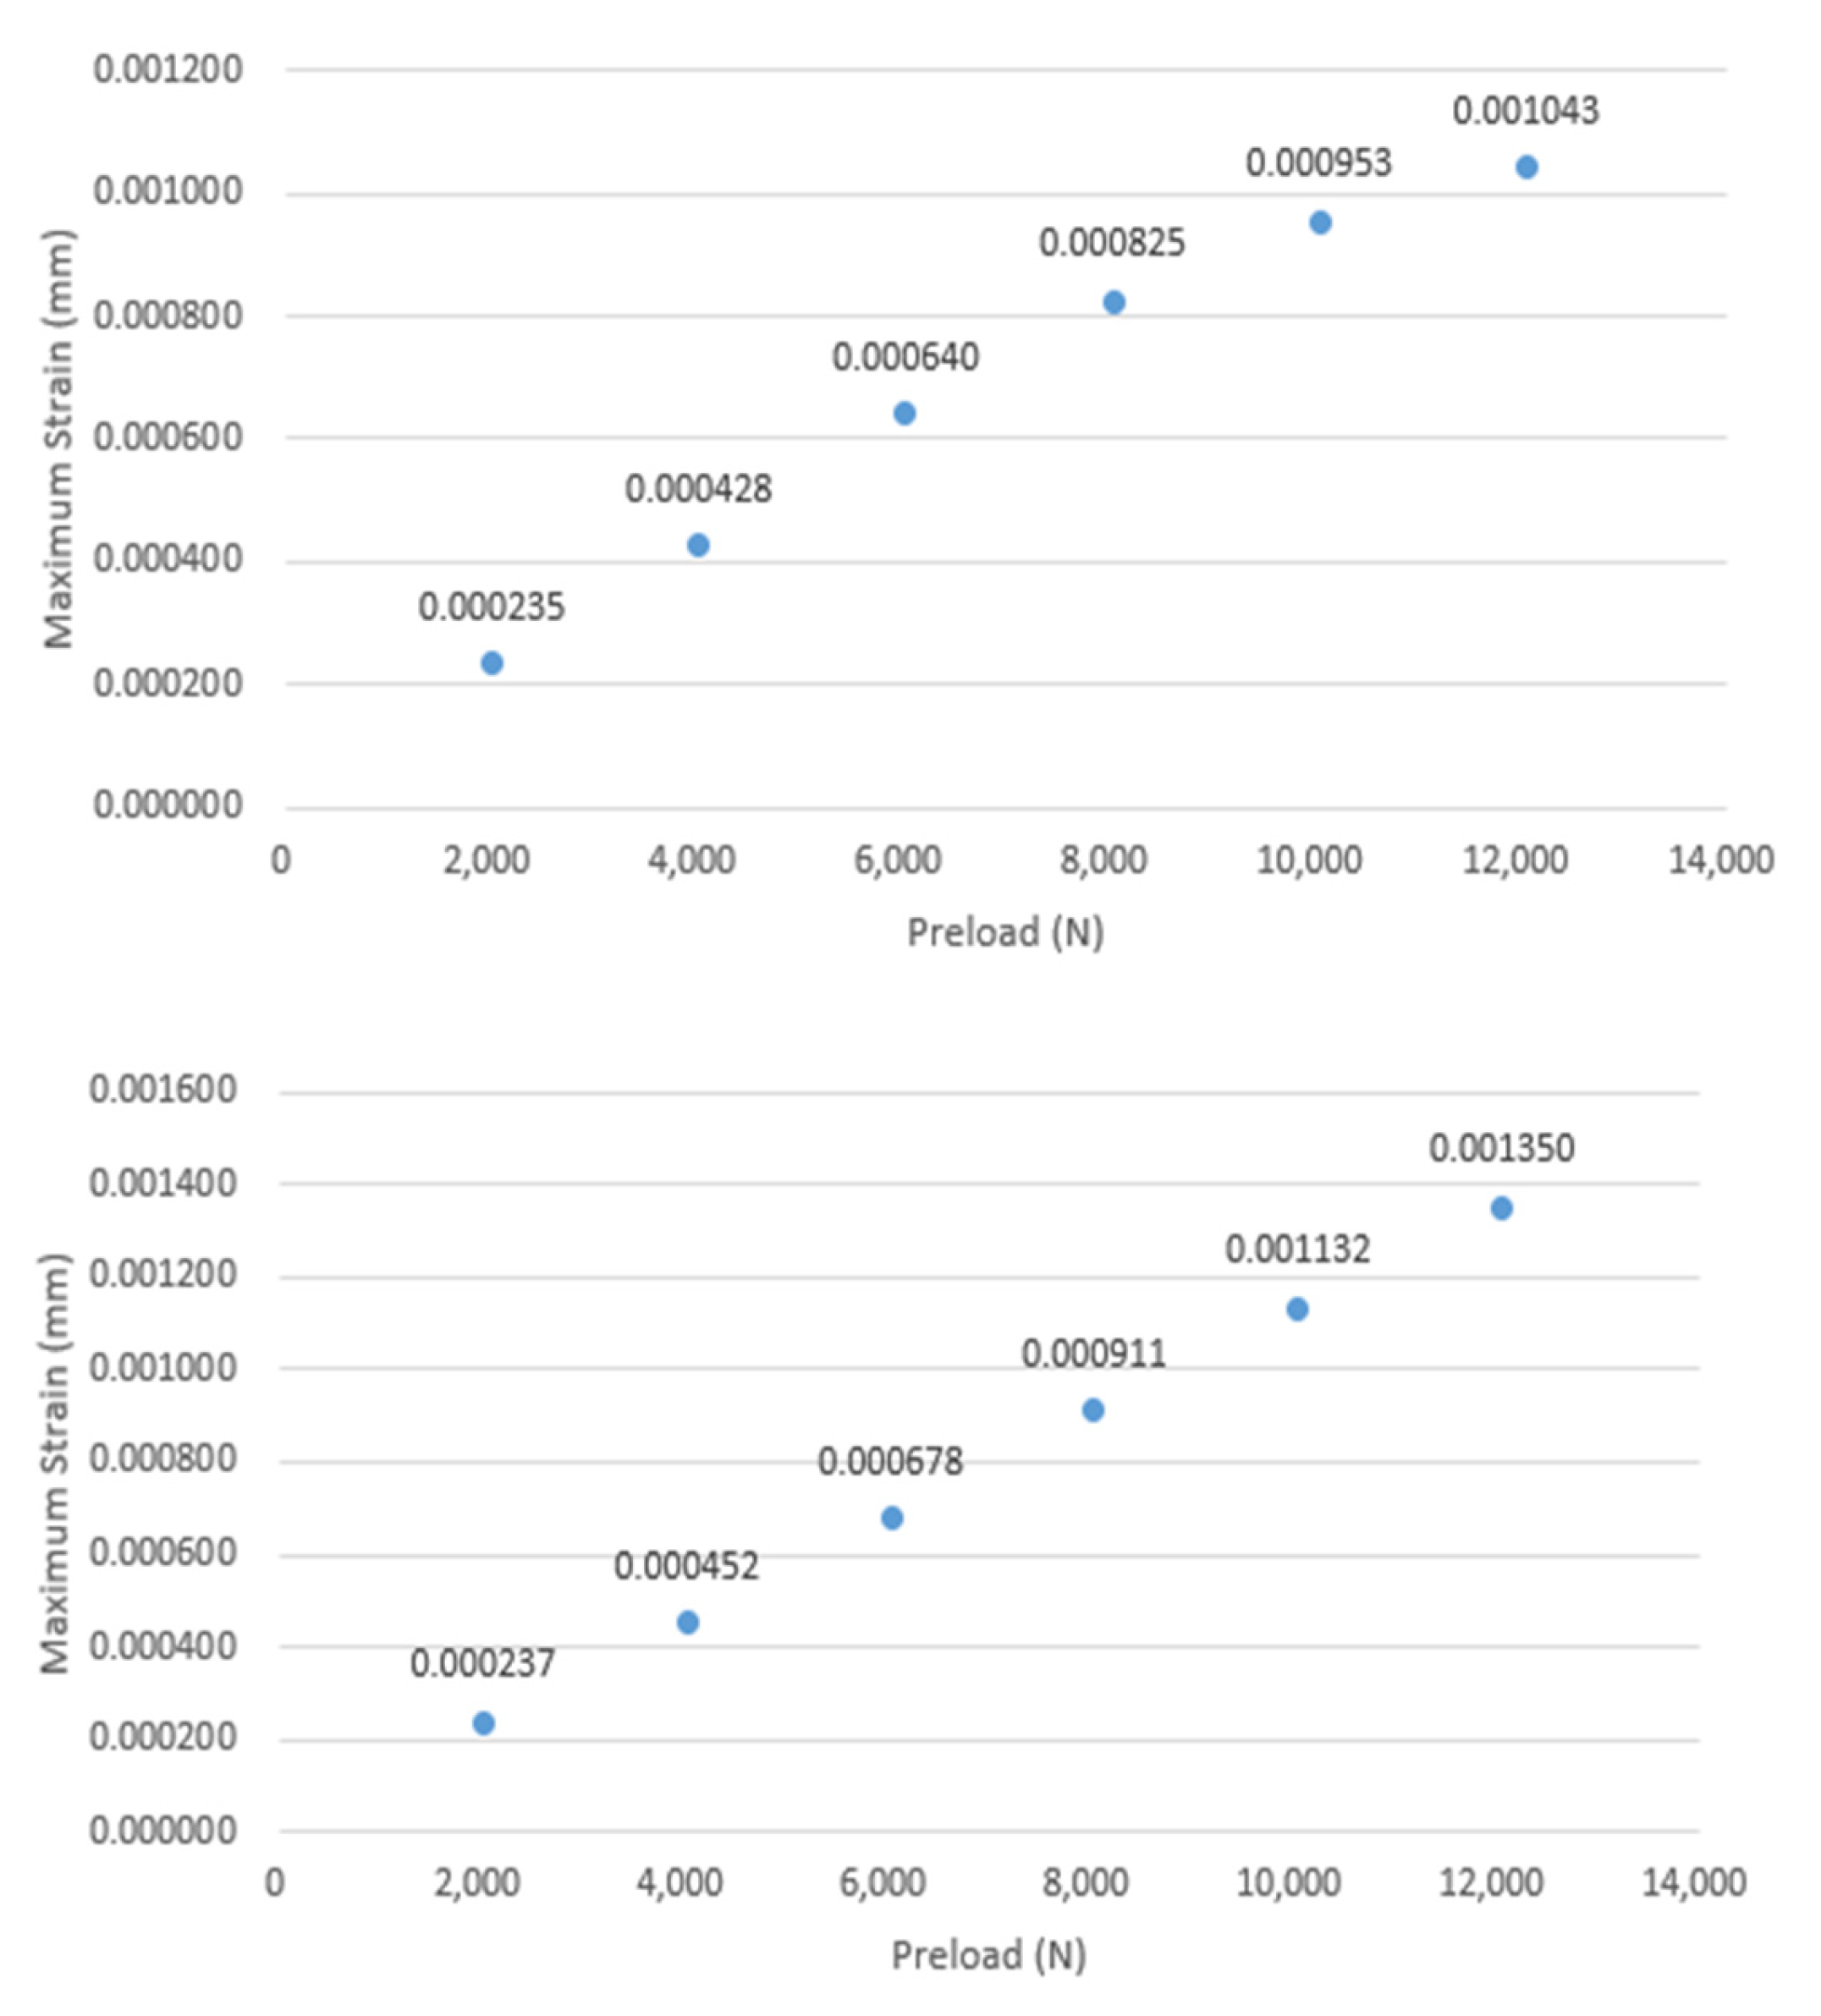
By reading the maximum strain value from the strain diagram, the relationship between the preload and the maximum strain can be determined, as shown in
Figure 5. The simulation results show that, as the preload increases, the maximum strain on the wire clamp also increases linearly; however, the maximum strain remains well below the threshold for plastic deformation, and the component’s deformation remains within the elastic range. Therefore, when calculating the pressure on the wire clamp, it may be treated as a rigid body.
The magnitude of the positive pressure Pz is contingent on the configuration of the vibration damper structure. As illustrated in
Figure 2, the block-type structure under consideration features two distinct distances, designated H1 and H2, measured from the center of the bolt tension to the conductor clamp head and the fixed support end, respectively. In the event of H1 = H2, the relationship between the bolt tension force Pb and the conductor positive pressure Pz can be regarded as a lever ratio, where Pz = 0.5 Pb. The hinged gland structure depicted in
Figure 3 is characterized by a lever ratio of Pz = (H1/H2)Pb. It is evident that, in accordance with the design parameters of the FR-3 vibration damper, the Pz value is equivalent to 2.33 Pb.
3.3. Friction Pull-Off Testing and Friction Model
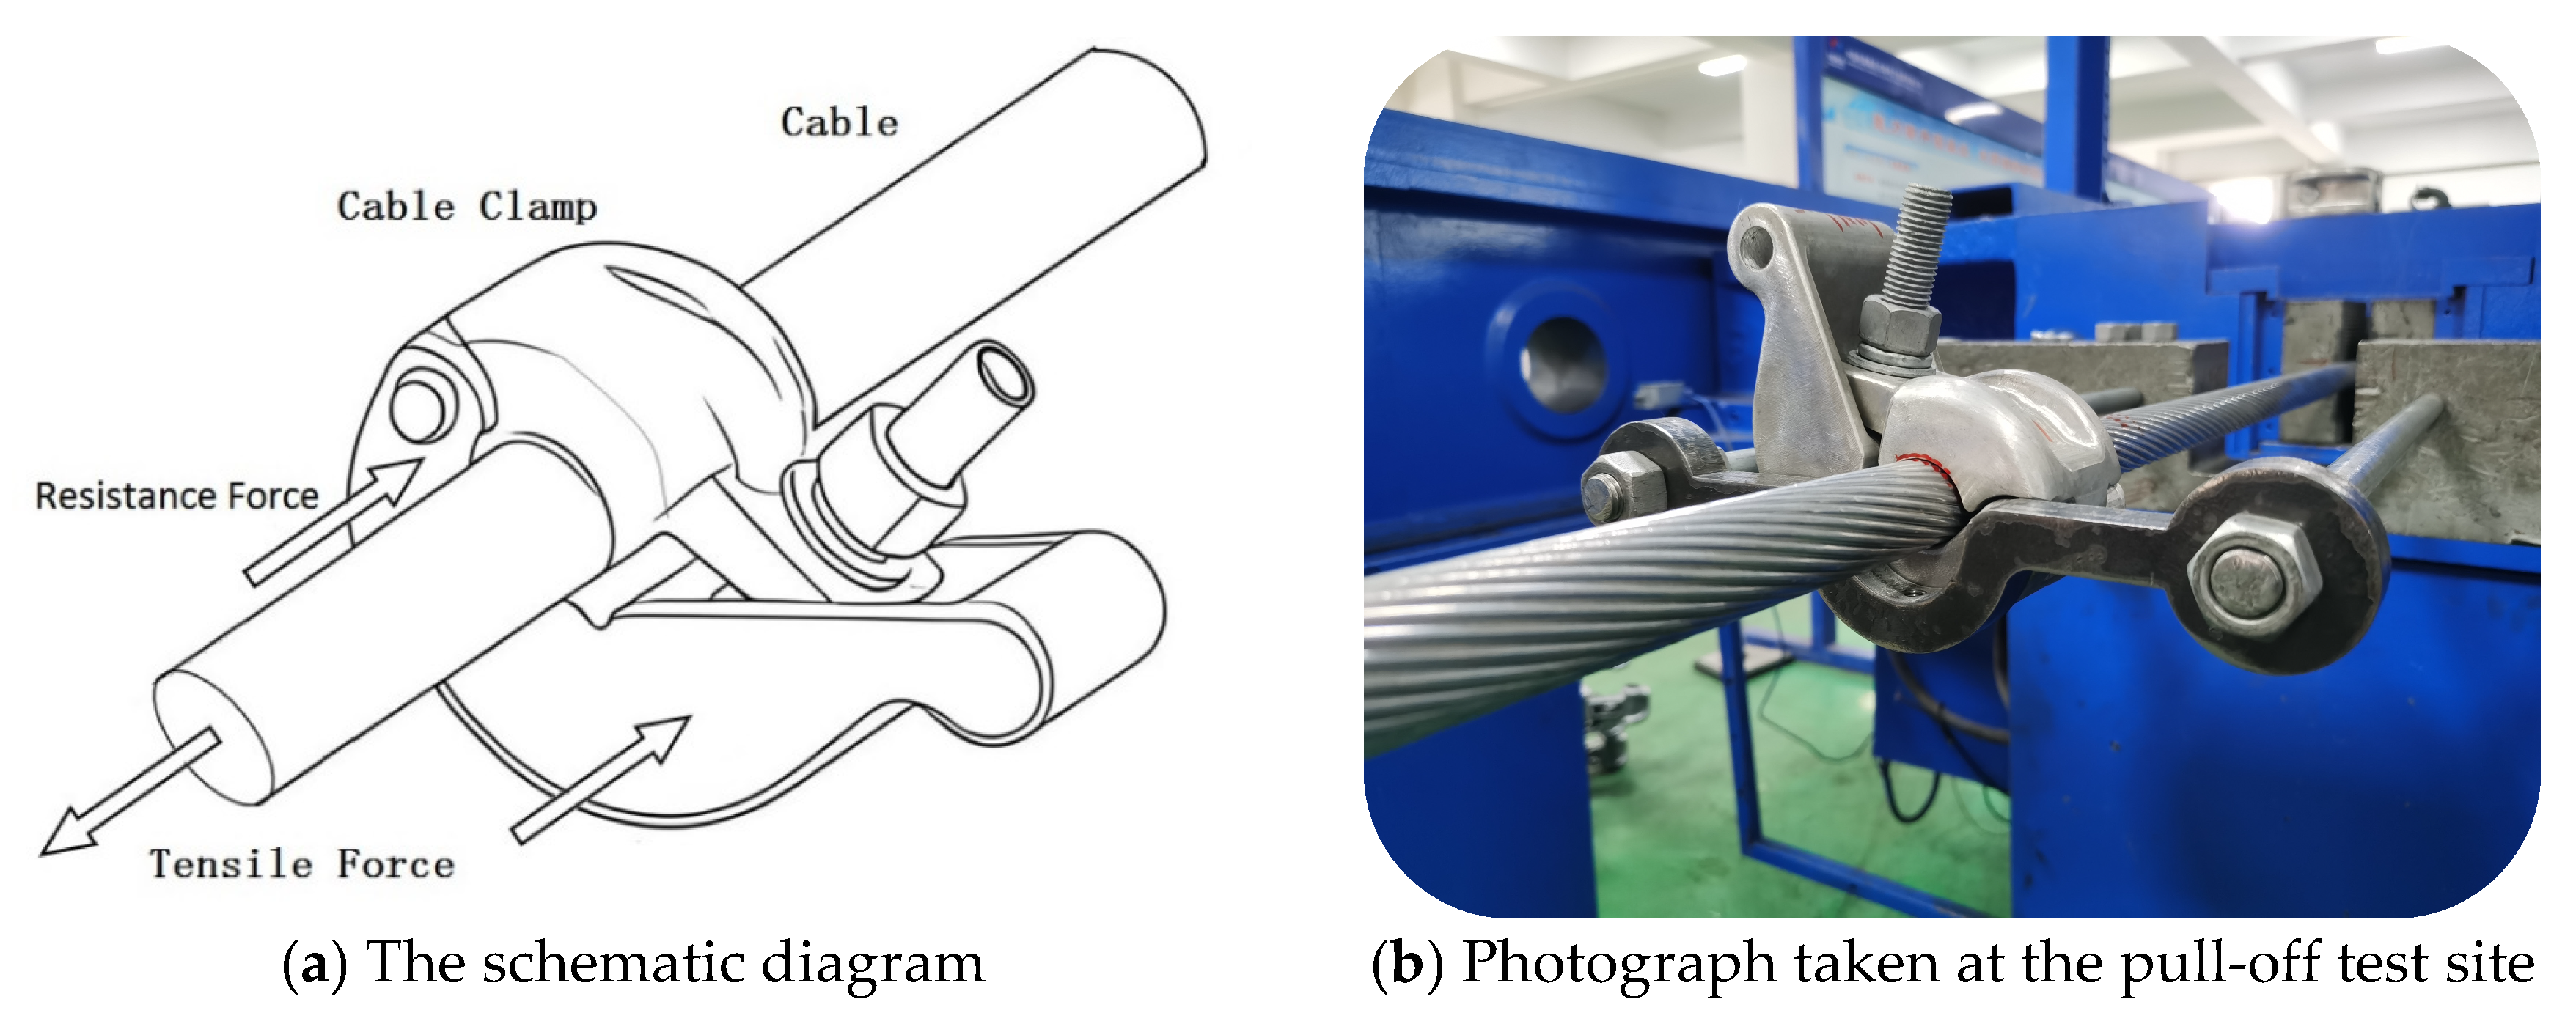
In order to ascertain the friction force Pf between the clamping plate and the wire, it is necessary to conduct a friction pull-off test (grip strength test) on the vibration damper’s support arm clamping mechanism and connecting wire. This data can then be used to derive the actual friction coefficient (see
Figure 6).
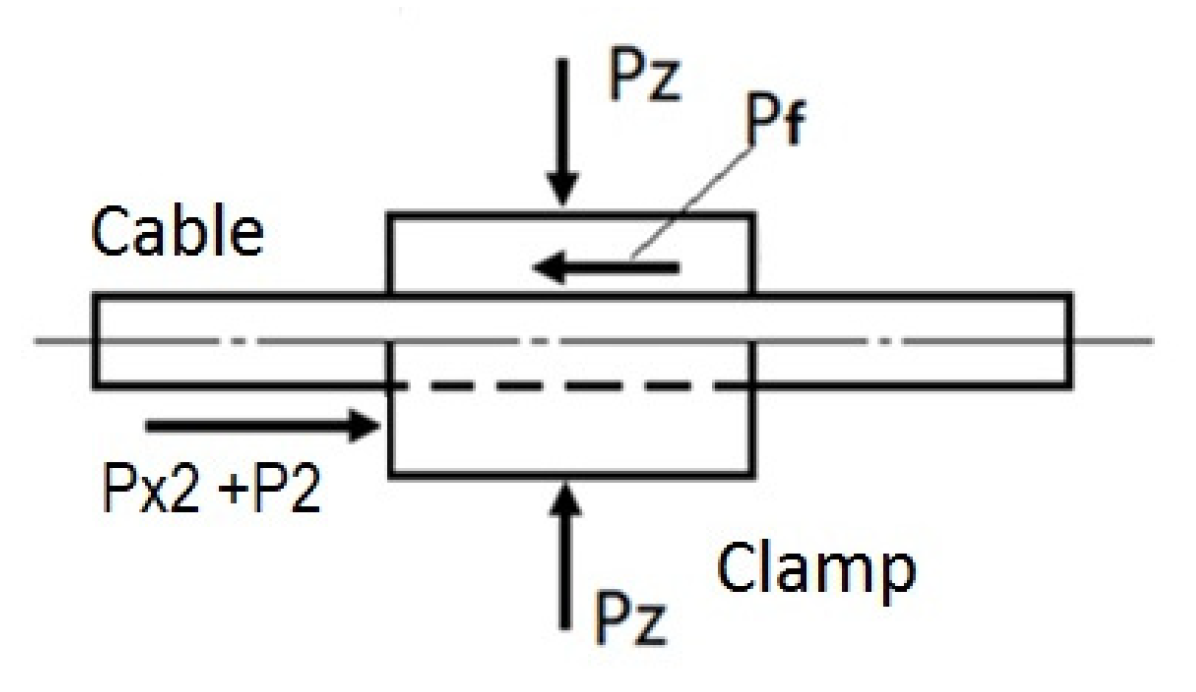
It is evident that under the action of normal pressure Pz, the friction force (grip force) exerted by the conductor is primarily derived from the product of normal pressure Pz and the coefficient of friction μs, i.e., Friction force Pf = μs · Pz. The establishment of a friction model is predicated on the structural connection between the vibration damper pressure plate and the conductor, as illustrated in
Figure 7.
3.4. Test Results and Analysis
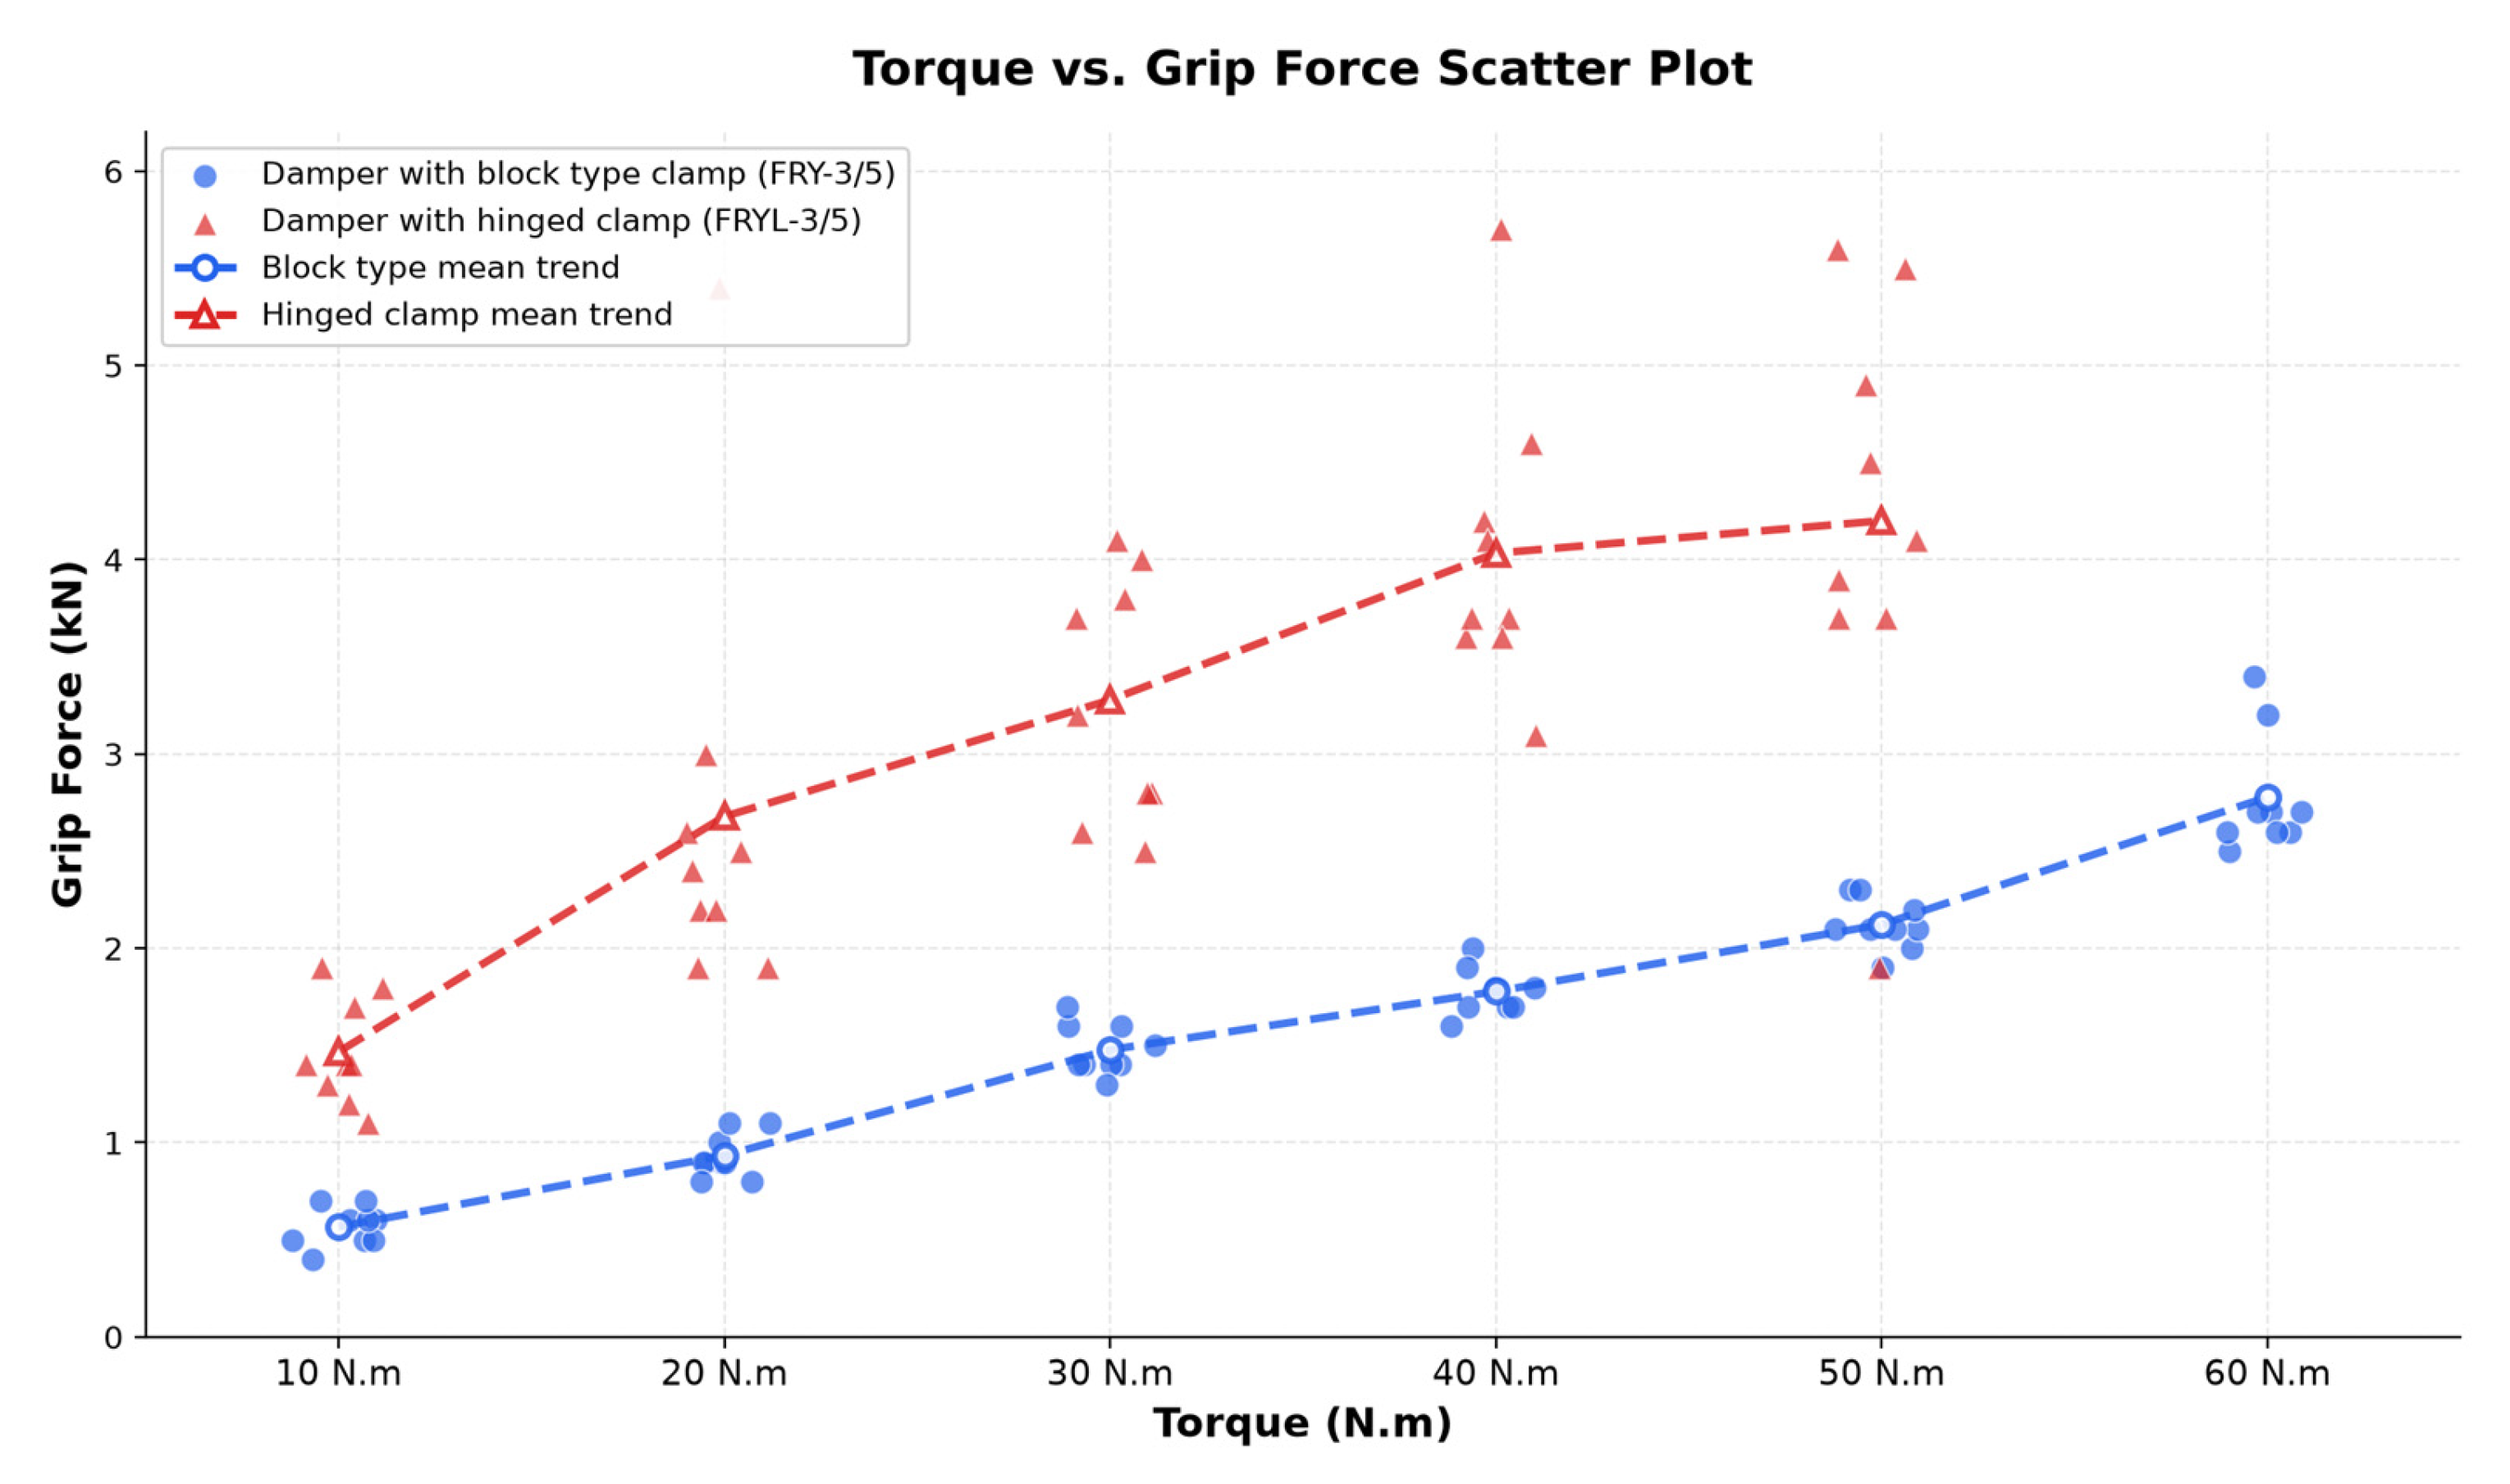
The torque of the bolts was measured and ranged from 10 Nm to 60 Nm. Under conditions that are identical, multiple replicate experiments (e.g., five or more) should be conducted. The final result should be the average of the multiple experimental data points, with the standard deviation or coefficient of variation calculated to quantify the dispersion of the data.
The relevant test data for the pull-off force is presented in
Figure 8. The test results show that as the bolt torque increases, the preload also increases accordingly, and consequently the frictional force increases as well. Testing revealed significant fluctuations in pull-off force values under identical conditions, primarily attributable to the complexity and uncertainty of the contact interface. One side of the contact interface is the clamping cap of the clamp. We measured the surface hardness of the clamping cap at three locations; the results are as follows: (1) For a hinged damper: the hardness is HB 58.1/52/53; (2) For block-type damping: the hardness of clamping block is HB 58.6/58.1/57; and the hardness of clamp body is HB 53.2/55.1/58.6. The measurement results indicate that the high and uniform hardness values on the surface of the clamps are not the main cause of the fluctuations.
Firstly, multi-strand conductors are not rigid monolithic structures. During the process of pulling, minute relative slippage, rearrangement, and compression deformation occur between individual strands. This results in dynamic changes to the actual contact points, contact area, and pressure distribution between the conductor and the inner wall of the clamp, causing fluctuations in friction force. Secondly, aluminum is a reactive metal with a dense aluminum oxide (Al2O3) film on its surface. When exposed to elevated clamping and drawing forces, minute protrusions on the contact surface undergo plastic deformation, thereby rendering the oxide film susceptible to rupture. When fresh, pure aluminum substrates come into direct contact, atomic-level bonding occurs instantaneously, forming “cold welds.” The pulling force must first overcome the shear strength of these weld points, causing friction to suddenly increase. Subsequent to the shearing off of the weld points, there is an abrupt decrease in friction, which gives rise to the characteristic “stick-slip” phenomenon, thereby producing sawtooth patterns in the data curves. Finally, fluctuations in the equipment’s pulling speed significantly affect the frequency and amplitude of stick-slip events, thereby impacting data smoothness.
Furthermore, the inherent material properties of aluminum alloys, and, in particular, their creep behavior, must be taken into account. It is evident that under constant clamping force (Pz), aluminum alloy conductors of a softer nature undergo gradual plastic deformation, a process which is referred to as creep. This results in a slight reduction in the diameter of the conductor, consequently decreasing the normal pressure between the conductor and the clamp. Consequently, even if the externally applied Pz remains unchanged, the actual pressure at the interface gradually diminishes over time. This phenomenon leads to a gradual decline or fluctuation in the friction force.
Formula for calculating the average value of the coefficient of friction
:
In the case of n = 9, the standard deviation is calculated as follows:
The average measured friction coefficient (μs) between the support arm gland and the conductor under a tightening torque of 20 N·m to 60 N·m is
= 0.44596 ± 0.04384. The test data and calculated results are displayed in
Table 4 and
Table 5.
4. Vibration Experiment Design and Result Analysis
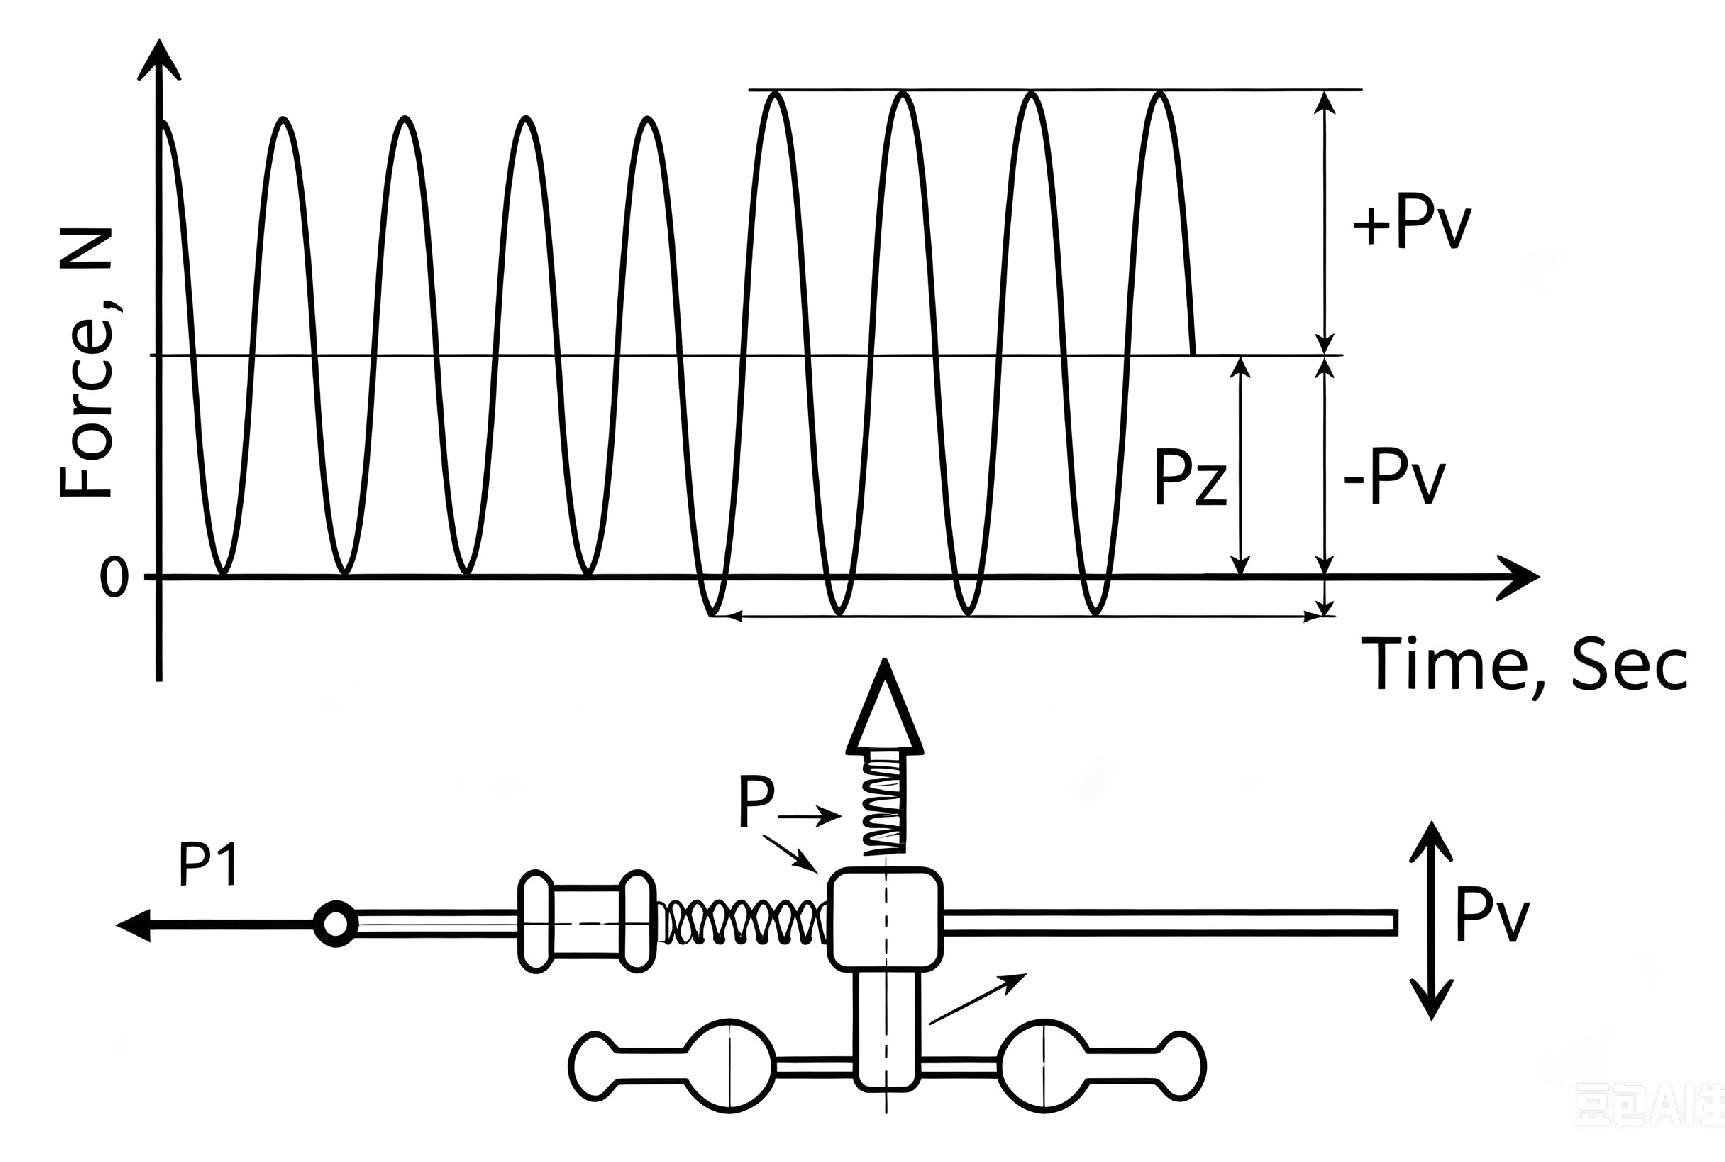
The vibration dampers are installed on overhead transmission lines with a view to mitigating vibration caused by vortex shedding, which is generated by airflow around conductors. Within the conventional span lengths of overhead transmission lines, the vibration frequency of standard conductors ranges from 3 to 120 Hz. The vibration wave of the conductor superimposes itself on the normal pressure exerted by the vibration damper, creating a combined load state. In the context of vibrational conditions, an alternating pressure wave is superimposed on the original static pressure. The variation in normal pressure induced by vibration manifests as modulation of the normal pressure exerted by the vibration load force on the support arm of the vibration damper and the conductor, as demonstrated in
Figure 9. The vibration model detected by the accelerometer at the upper end of the vibration damper clamp can be integrated to reconstruct the dynamic load (Pv) variation.
The calculation of instantaneous positive pressure is based on the displacement equation of vibration: a_z(t) = Asin(ωt), where A is the amplitude and ω = 2πf is the angular frequency. The acceleration is thus given by the following equation:
. In accordance with Newton’s second law, the phenomenon of vibration gives rise to an inertial force (see Equation (15)).
In this equation, m denotes the mass of the object under consideration, subjected to a normal pressure of Pz. The simplified combined calculation formula is shown in (Equation (16)).
In the equation: Pz is the static preload (positive pressure), PV is the amplitude of the vibration force, f is the vibration frequency, and t is time.
It is important to note that this total positive pressure is no longer a constant value, Pz, but fluctuates between (Pz − Pv) and (Pz + Pv). In order to observe unidirectional slippage between the vibration damper and the conductor, a horizontal preload spring (see
Figure 6) was designed in the experimental setup. The value of this spring (P2) was found to be significantly smaller than the static friction force calculated based on static pressure (Pz) (μs·Pz). However, it has been demonstrated that this may exceed the static friction force calculated based on the minimum instantaneous positive pressure (Pz − Pv), thereby reducing the force required to move the vibration damper.
4.1. Vibration Displacement Test Protocol
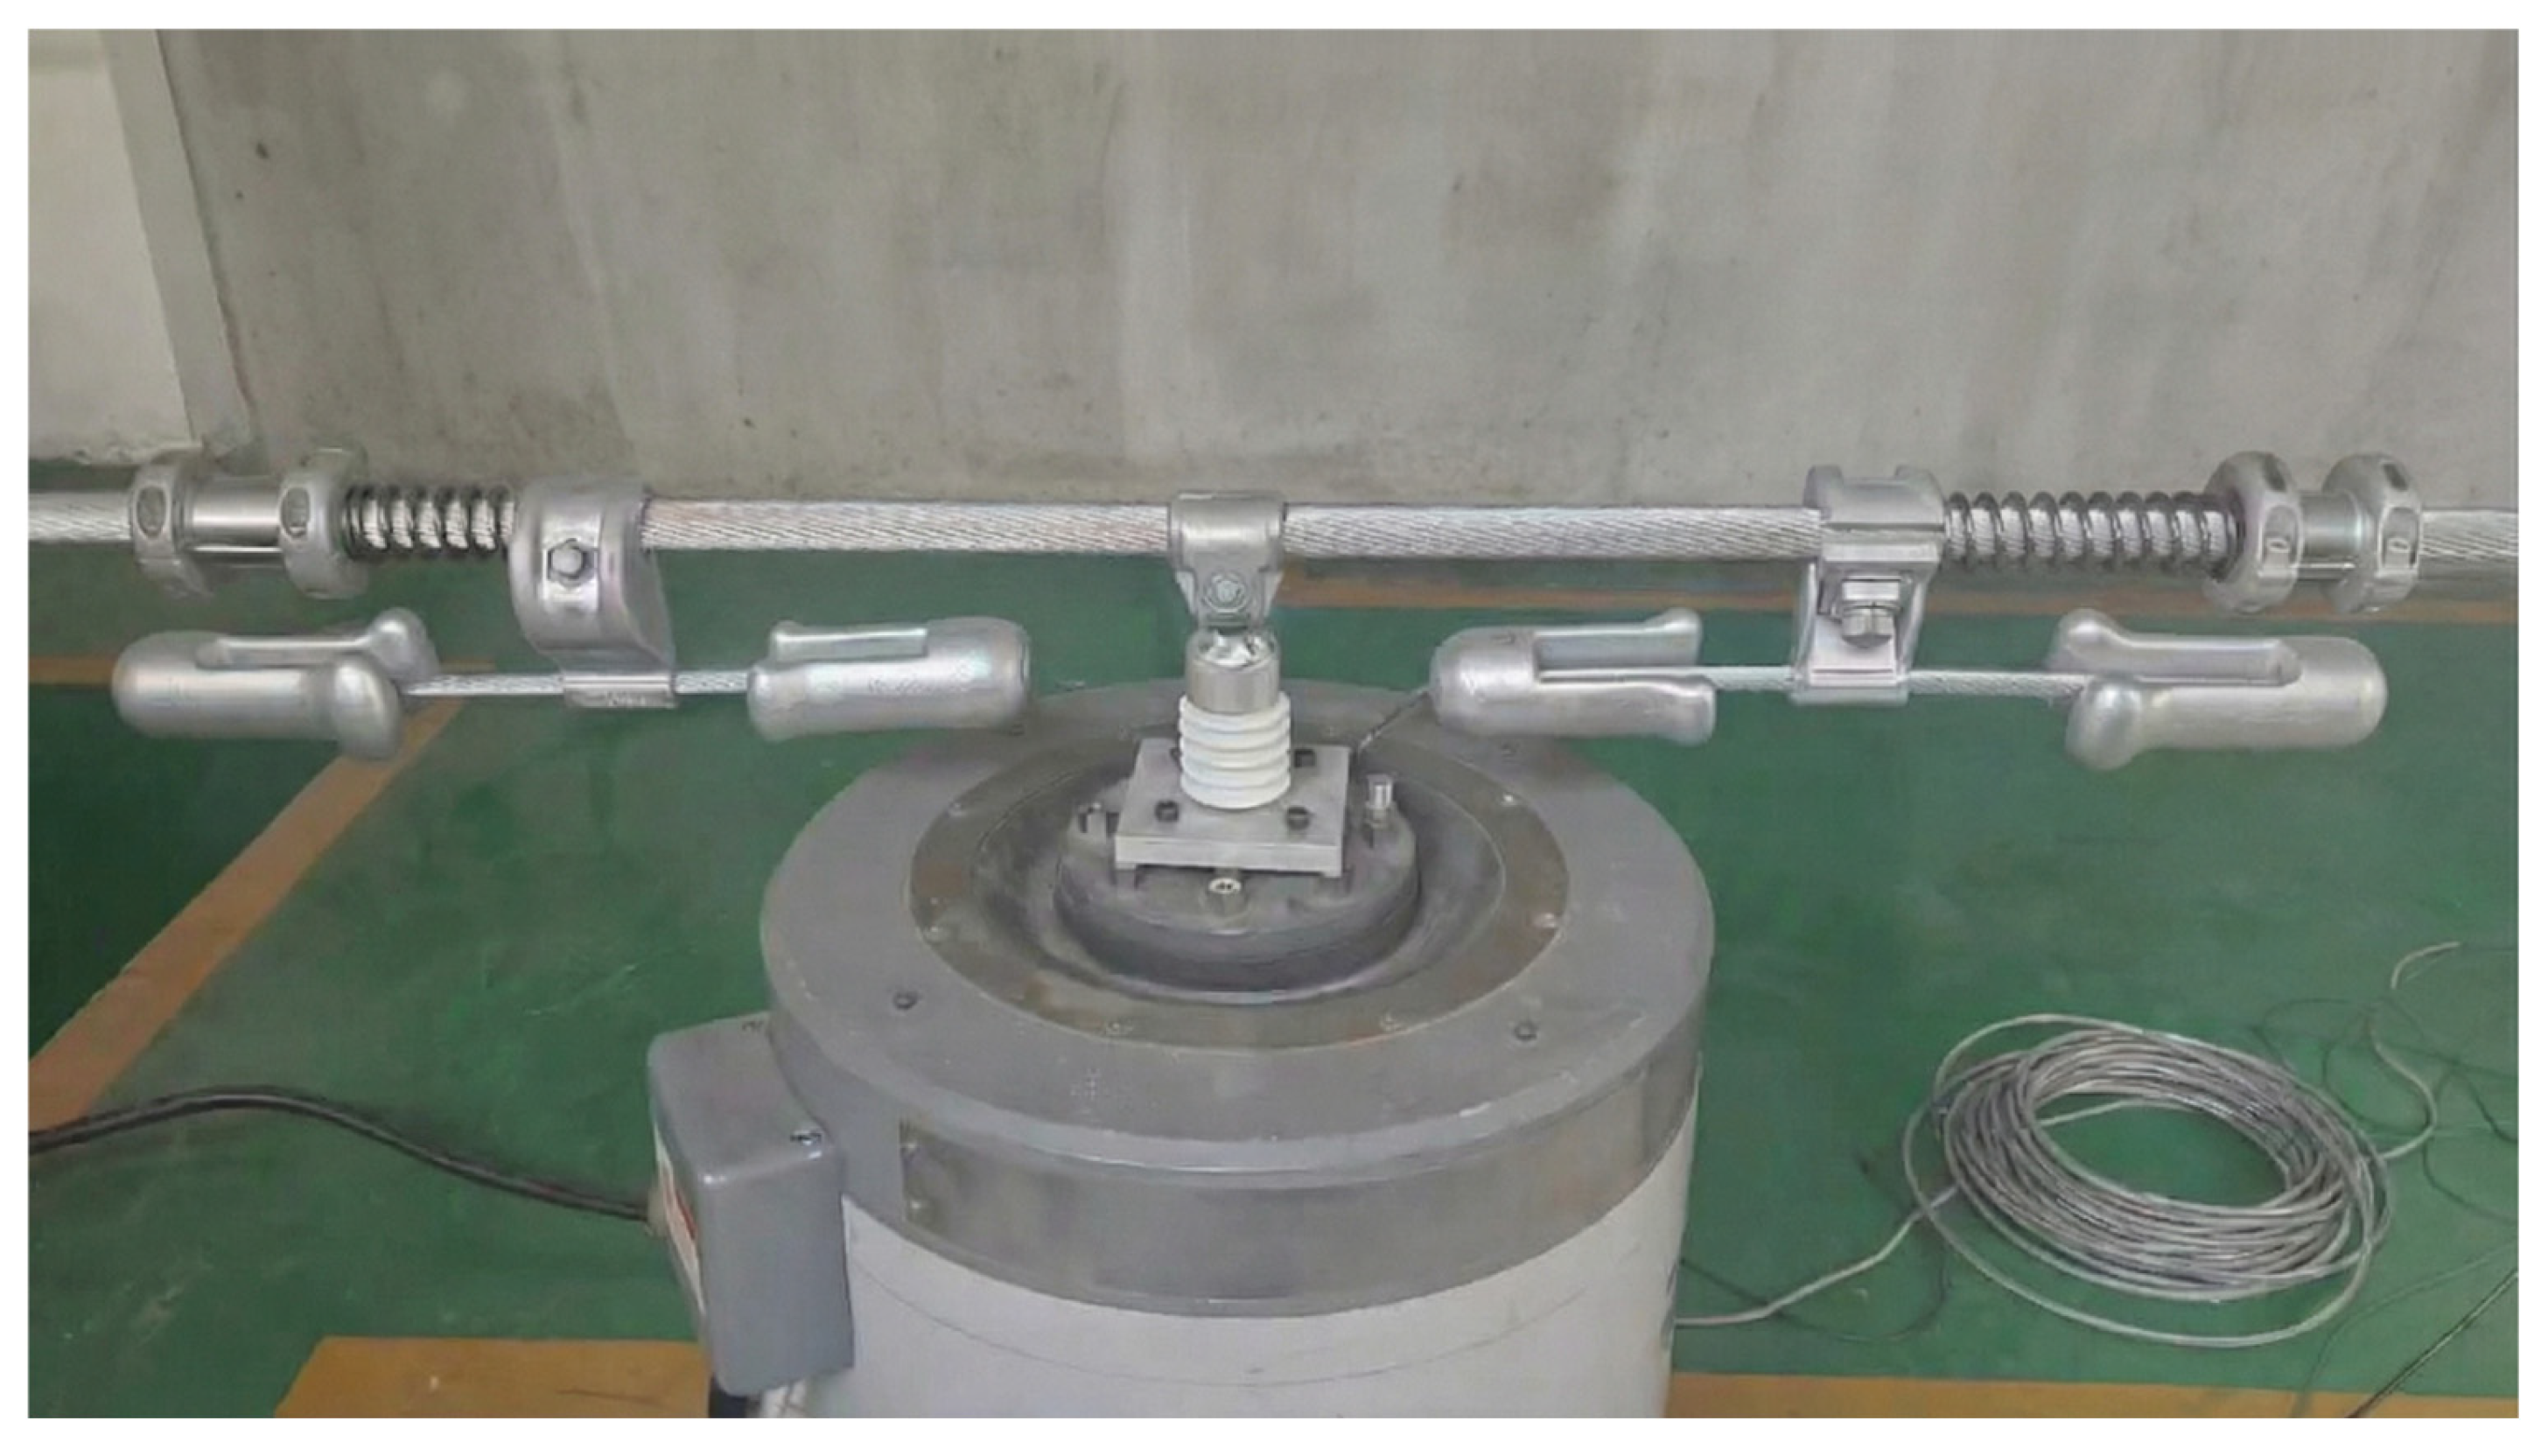
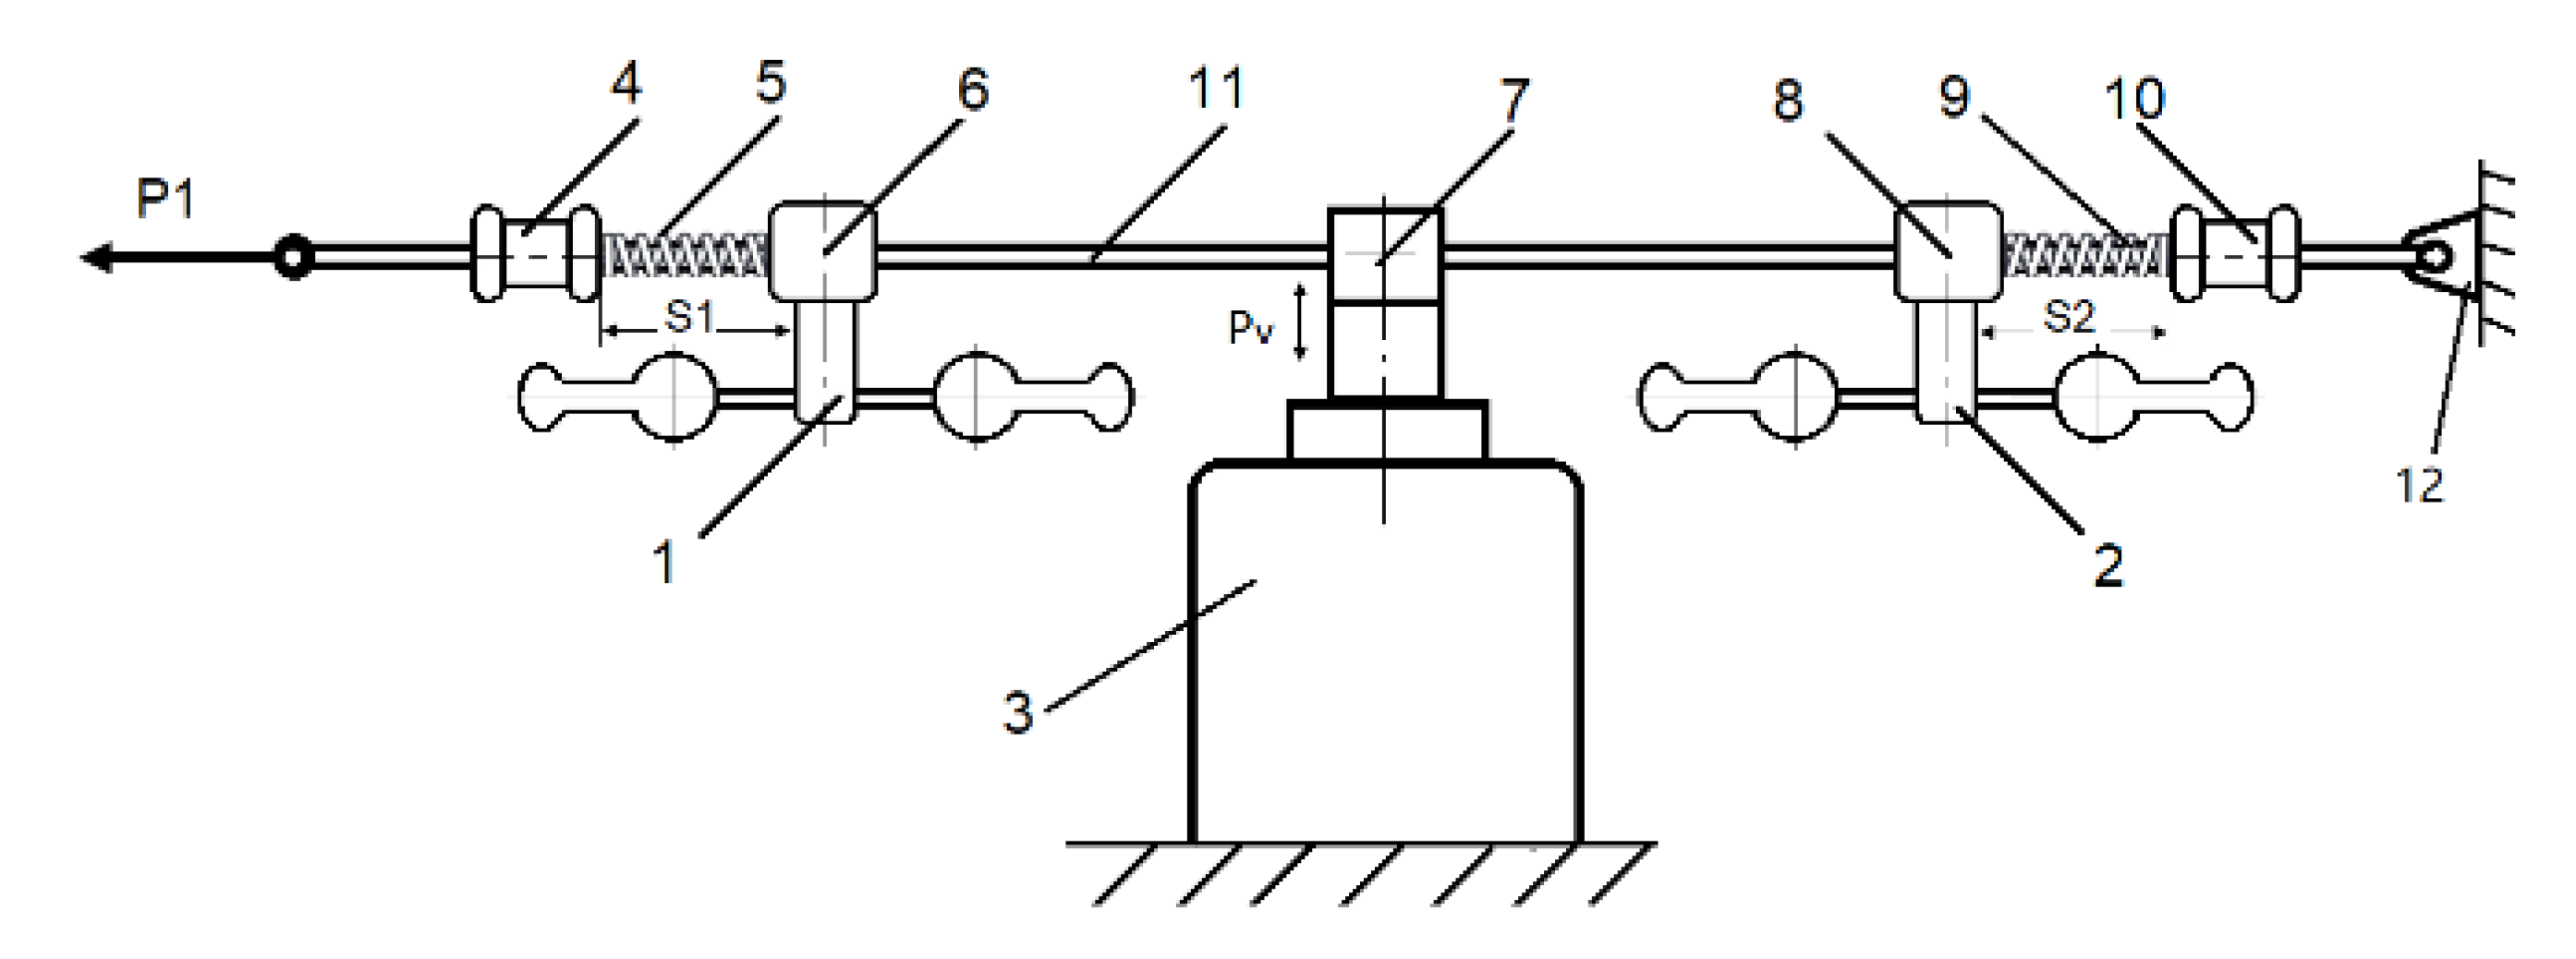
In order to investigate the effect of different tightening torques on the slip characteristics of vibration dampers, a dedicated vibration test apparatus was designed, as illustrated in
Figure 10. The clamping device for the test specimen consists of a connecting body, a pressure cap, and fastening bolts, which are secured with nuts in order to maintain a constant clamping force between the pressure cap and the wire. It is imperative to note that any occurrence of loosening or displacement of the test specimen will invariably result in a consequential alteration to its initial position, which has been meticulously calibrated by S1 and S2.
Before the test begins, the surface of the tested conductors and the vibration dampers must be cleaned to ensure that no dust, grease or impurities are adhering to the surface. The number of test cycles is set at 10 million. If the vibration damper moves more than 1 mm from its original position, this is deemed to be slippage. In this case, the test is terminated. Each specimen is used only once; after unloading, the surface condition of the clamp is observed.
The core methodology of this test is outlined as follows: Initially, under simulated conventional wire tension (P1), a constant axial thrust (P2 ≤ 20 N) is applied to the vibration damper via the spring-adjustable wheel set. This thrust is initially far smaller than the static friction force generated by clamping, thus keeping the vibration damper stationary. During the process of vibration, the dynamic friction force (Px2) at the clamping interface undergoes a process of decay. When the dynamic friction force decays to a value less than or equal to the preset axial friction force (i.e., (Px2 + P2) ≤ Pf), the vibration damper undergoes observable directional slippage. This design methodically unveils the response relationship between bolt tightening torque and dynamic friction force at the interface under complex vibration loads, thus facilitating a reliable testing method for determining critical anti-slip conditions. The test bench is equipped with two vibration dampers of varying specifications. Accelerometers are mounted at the clamp ends of the dampers (positions 6 and 8 in
Figure 6), with the objective of recording variations in friction force under identical excitation parameters for each damper during dynamic conditions.
Figure 11 shows a photograph of the test site.
4.2. Physical Models and Computational Methods
Symmetrical vibration dampers exhibit two resonant frequencies within their design frequency range, whereas asymmetrical structures possess at least four [
10,
27]. The fundamental experimental principle underlying this study is that inertial forces generated by normal (vertical) vibrations periodically reduce normal pressure, thereby decreasing the friction force Px2 required to initiate horizontal movement. For the four primary resonance frequencies of the asymmetrical FR-3 vibration damper, the three frequencies with stronger energy were selected as excitation frequencies for dynamic experiments. The acceleration and vibration inertia of the aforementioned components are demonstrated in
Table 5. The term “excitation acceleration” is employed to denote the peak acceleration a in the normal (vertical) direction. Px2 is representative of the frictional force that must be overcome to induce horizontal displacement of the vibration damper during vibration.
4.3. Slip Detection for the Press-Type Clamp Structure
Following the implementation of a comprehensive review of the dynamic loading parameters enumerated in
Table 6, a comparative analysis was conducted with experimental loosening results. When the clamping block structure exhibited a lever ratio of 0.5, a comparison was made between the dynamic friction force (Px2) at varying excitation frequencies and the measured critical slip friction force (Pf). The objective of this assessment was to ascertain the probability of slippage occurrence (refer to
Table 6).
The calculation results indicate that under three excitation parameters and tightening torques ranging from 20 to 60 Nm, slip is likely to occur whenever Px2 < Pf. When the tightening torque is 50 Nm, although meeting the criteria Px2 > Pf, the two data are too close, it can be assumed that it satisfy the slip condition.
4.4. Slip Detection for Hinged Clamp Structures
The calculation results for the hinged clamp connection are presented in
Table 7. The lever ratio exceeds 2.33, the normal pressure Pz between the conductor and clamp plate is substantial, and the friction force Px2 under vibration conditions far exceeds the critical sliding friction force Pf. Consequently, within the range of three excitation parameters and tightening torques spanning from 20 to 50 Nm, the occurrence of slippage is rendered entirely unfeasible.
4.5. Result Analysis
A comparative analysis was conducted on the dynamic friction force (Px2) and critical moving friction resistance (Pf) of the FR-3 vibration damper (lever ratio 0.5) under vibrational conditions. Theoretically, the risk of slippage is present when Px2 < Pf. The experimental results indicate that the occurrence of slippage risk is observed at frequencies of 10.5 Hz, 17.25 Hz and 22.5 Hz, when the torque range is between 20 and 60 Nm. Thereby confirming the hypothesis that torque is the critical factor controlling slippage.
When the tightening torque is 20 Nm, calculations indicate a risk of slippage (Px2 < Pf). This assessment was validated in experimental testing, where the vibration damper did indeed slip after exceeding 270,000 vibration cycles. When the tightening torque was increased to 40 Nm, although calculations still indicated risk, no actual displacement occurred during over 10 million vibration tests. Conversely, when the tightening torque reached or exceeded 50 Nm, calculations indicated safety (Px2 > Pf). Furthermore, experimental testing encompassing over 10 million vibrations also failed to reveal any instances of slippage. The findings of this study demonstrate that higher excitation frequencies accelerate the decay of dynamic friction forces, thereby increasing the risk of slippage. However, the implementation of an adequately elevated bolt tightening torque effectively suppresses this phenomenon, thereby ensuring the installation stability of the vibration damper.
5. Conclusions
In response to the risk of vibration dampers slipping on ultra-high-voltage transmission lines, this paper presents experimental research focusing on two typical types of vibration dampers. Using a test rig independently designed by our research team, the study investigates the anti-slip performance of the vibration dampers under specific bolt torques and at excitation frequencies matching those of coupled light wind vibrations.
The computational results corroborate two fundamental principles inherent to this physical model: Firstly, it is evident that an increase in normal pressure results in a corresponding increase in the horizontal friction force required to overcome it. Secondly, at a given normal pressure, as the excitation acceleration increases from 5.3 m/s2 to 13.8 m/s2, the horizontal friction force correspondingly decreases, indicating that vibration exhibits a pronounced friction-reducing effect.
Of the many factors contributing to the slippage of vibration dampers, the structure of the damper and the preload of the bolts have the greatest influence. In the case of vibration dampers equipped with a block-type clamp structure, slippage is observed in circumstances where the tightening torque falls below 40 N·m, particularly under conditions of long-period vibration. When the tightening torque reaches 50 N·m or higher, no significant slippage occurs. The vibration damper, complete with a hinged clamp structure, employs a lever-based force-amplification mechanism. It is characterized by an extremely low probability of slippage under long-period vibrations with tightening torques ≥ 20 N·m. The optimized structure thus exhibits a superior anti-loosening performance.
The findings of this study have been applied to the 110 kV transmission line project between the 220 kV Qingnan Substation and the 110 kV Nan’an Substation in Zhaoqing, China (2024–2025). The mechanical model, residual grip testing methods and anti-slip performance of the vibration dampers developed in this study have been successfully validated under the harsh weather conditions encountered on the actual line.