1. Introduction
The elastic properties of materials are characterized by Young’s modulus. Elastic deformations proportional to stress are described by Hooke’s law [
1]. If a material is subjected to stress that changes over time, including vibrations, its mechanical properties are described by the dynamic Young’s modulus of elasticity, usually with a different value than the static modulus. Examples are presented in many works, e.g., in [
2,
3,
4]. This is because the dynamic Young’s modulus is a parameter that characterizes adiabatic changes in a material subject to vibrations. Such changes occur with rapid deformations of the tested sample material, i.e., when there is no heat exchange with the environment. On the other hand, the static modulus is used in isothermal conditions, i.e., it describes slow deformations that occur at a constant temperature of the medium.
Below, we describe the basic methods used in such tests and propose a new method for measuring vibrations of the tested element using a non-contact reflective fiber optic sensor of a special design.
2. Impulse Methods for Testing the Elasticity of Materials
In dynamic tests of the elastic properties of materials, impulse methods are usually used. They are divided into ultrasonic methods and mechanical—hammer methods. They also differ in the frequency of the impulses used for testing. In ultrasonic methods, equipment is used that generates impulses with a frequency above 20 kHz. In the hammer or impulse–hammer method, impulses are generated by the impacts of an electromechanical hammer. The principles of using both impulse methods are similar.
2.1. Ultrasonic Method
Determination of the dynamic Young’s modulus using the ultrasonic technique requires the generation of an ultrasonic or sound pulse delivered to the interior of the sample from the tested material. This pulse travels a specific path at a speed that depends on the material properties and its quality. The dynamic modulus of elasticity of the material is a function of the speed of propagation of ultrasonic waves. Its relationship with the strength of the material is usually known or is determined experimentally. This is described in many works, e.g., in [
2,
5,
6].
The main criterion for assessing the quality of a material using the ultrasonic method is the speed of propagation of the longitudinal wave in it. The accuracy of measuring this speed depends on the accuracy of measuring the pulse path and the accuracy of measuring its transit time. If the wave velocity in the tested material is known sufficiently accurately, it facilitates the interpretation of the pulse image obtained after its passage. Therefore, the parameters of the ultrasonic equipment are selected so that the measurement of this speed is as accurate as possible. The path length depends on the dimensions of the tested element. The error in measuring the path length in laboratory tests is usually about 1%, but it can also be greater.
The ultrasonic technique is quite commonly used to determine the modulus of elasticity—an example is given in [
7].
2.2. Accuracy of Ultrasonic Wave Time Measurement
The accuracy of ultrasonic wave time measurement depends on
The applied measuring frequency of the electrical to mechanical vibration transducer and the directionality of their waveform,
The damping characteristics of the material and
The method of coupling the transmitting and receiving transducers with the material.
It is important to strive to ensure contact over the entire surface of the transducer. This is possible by smoothing the contact surface and using appropriate coupling media. Regardless of this, the equipment must have precisely determined time indicators and a system that guarantees their stability during measurements.
Studies of the modulus of elasticity in a non-destructive way are presented in [
5,
6,
8,
9,
10,
11,
12,
13]. Non-contact measurement of Young’s modulus is presented in [
11]. Short laser pulses are used to generate elastic waves in a material reinforced with continuous fibers. Using an optical interferometer, the time of travel of these waves in different directions is measured in a non-contact manner (point-source-point-receiver technique). Based on these data, five independent components of the total elasticity tensor of the unidirectional fiber are determined. The laser pulse technique has several advantages: it is non-contact, non-destructive and can be used in online quality control in production processes.
In [
3], the pulse technique was used for non-contact measurement of the elastic modulus. The pulse excitation configuration is based on the ASTM E-1876 standard [
14]. The sample is placed on a structure with support, and a mechanical pulse is applied to it from above. A microphone is located near the sample to receive the signal after the pulse impact. It is connected to a computer with LabView software v20.0.1 (National Instruments, Austin, TX, USA)that converts the signal to the resonance frequency.
A simple method of measuring the response of a vibrating thin-film membrane was also used in [
13]. Piezoelectric excitation and acoustic detection (using a microphone) allow performing tests of the vibration spectrum of thin membranes in the kHz range. The vibration frequencies of stressed super-thin polystyrene foils were used to determine the Young’s modulus of these samples (µm).
A new proposal for a remote, non-contact method for determining the dynamic Young’s modulus using a reflective fiber optic sensor is discussed in this paper.
3. Application of Fiber Optic Sensor in the Vibration Elasticity Tests
Optical measurement techniques and fiber optic sensors have many applications, including biology, medicine and technology [
15]. One of them, of great practical importance, is the possibility of using it to control the parameters of the tested material during mechanical vibration. For example, in [
5] the detection of resonance frequency by laser beam without the use of optical fibers is described. The use of scattered light to monitor Young’s modulus during gel hardening is presented in [
9].
This paper describes the use of fiber optic sensor type POF (Polymer Optical Fiber) to measure resonance of mechanical vibrations. This concept includes the use of a pair of optical fibers in measurements to observe the amplitude of vibrations of the light scattering surface.
The sensor does not participate in the measurement path. The variable voltage is supplied from the generator. For specific voltage frequencies, the ferromagnetic steel element has a maximum vibration amplitude, i.e., it is in resonance. The fiber optic sensor provides remote observation of the ferromagnetic vibrations. In the case of a mirror surface of a ferromagnet, there is no need to use a fiber optic cable. It is enough to use a laser to observe the vibration amplitude. The laser beam is collimated and the trace of the reflected beam on the screen provides a good observation of the vibration amplitude. In the case of a matte surface, we have reflected scattered light, and it is necessary to use a reflective fiber optic sensor. Reflective fiber optic sensors are also used in the measurement path where it is necessary to measure, e.g., displacement, offset, displacement, angle between mechanical elements [
15]. In this case, mirror reflective surfaces are used.
The optical signal is a laser beam passing through a pair of optical fibers. Two multimode optical fibers are arranged non-parallel to each other. The angle between the transmitting and receiving fiber is about 35 degrees and does not change during the measurement series. Since the sensor is only used to observe the amplitude, the angle between the fibers has no effect on finding the maximum vibration amplitude.
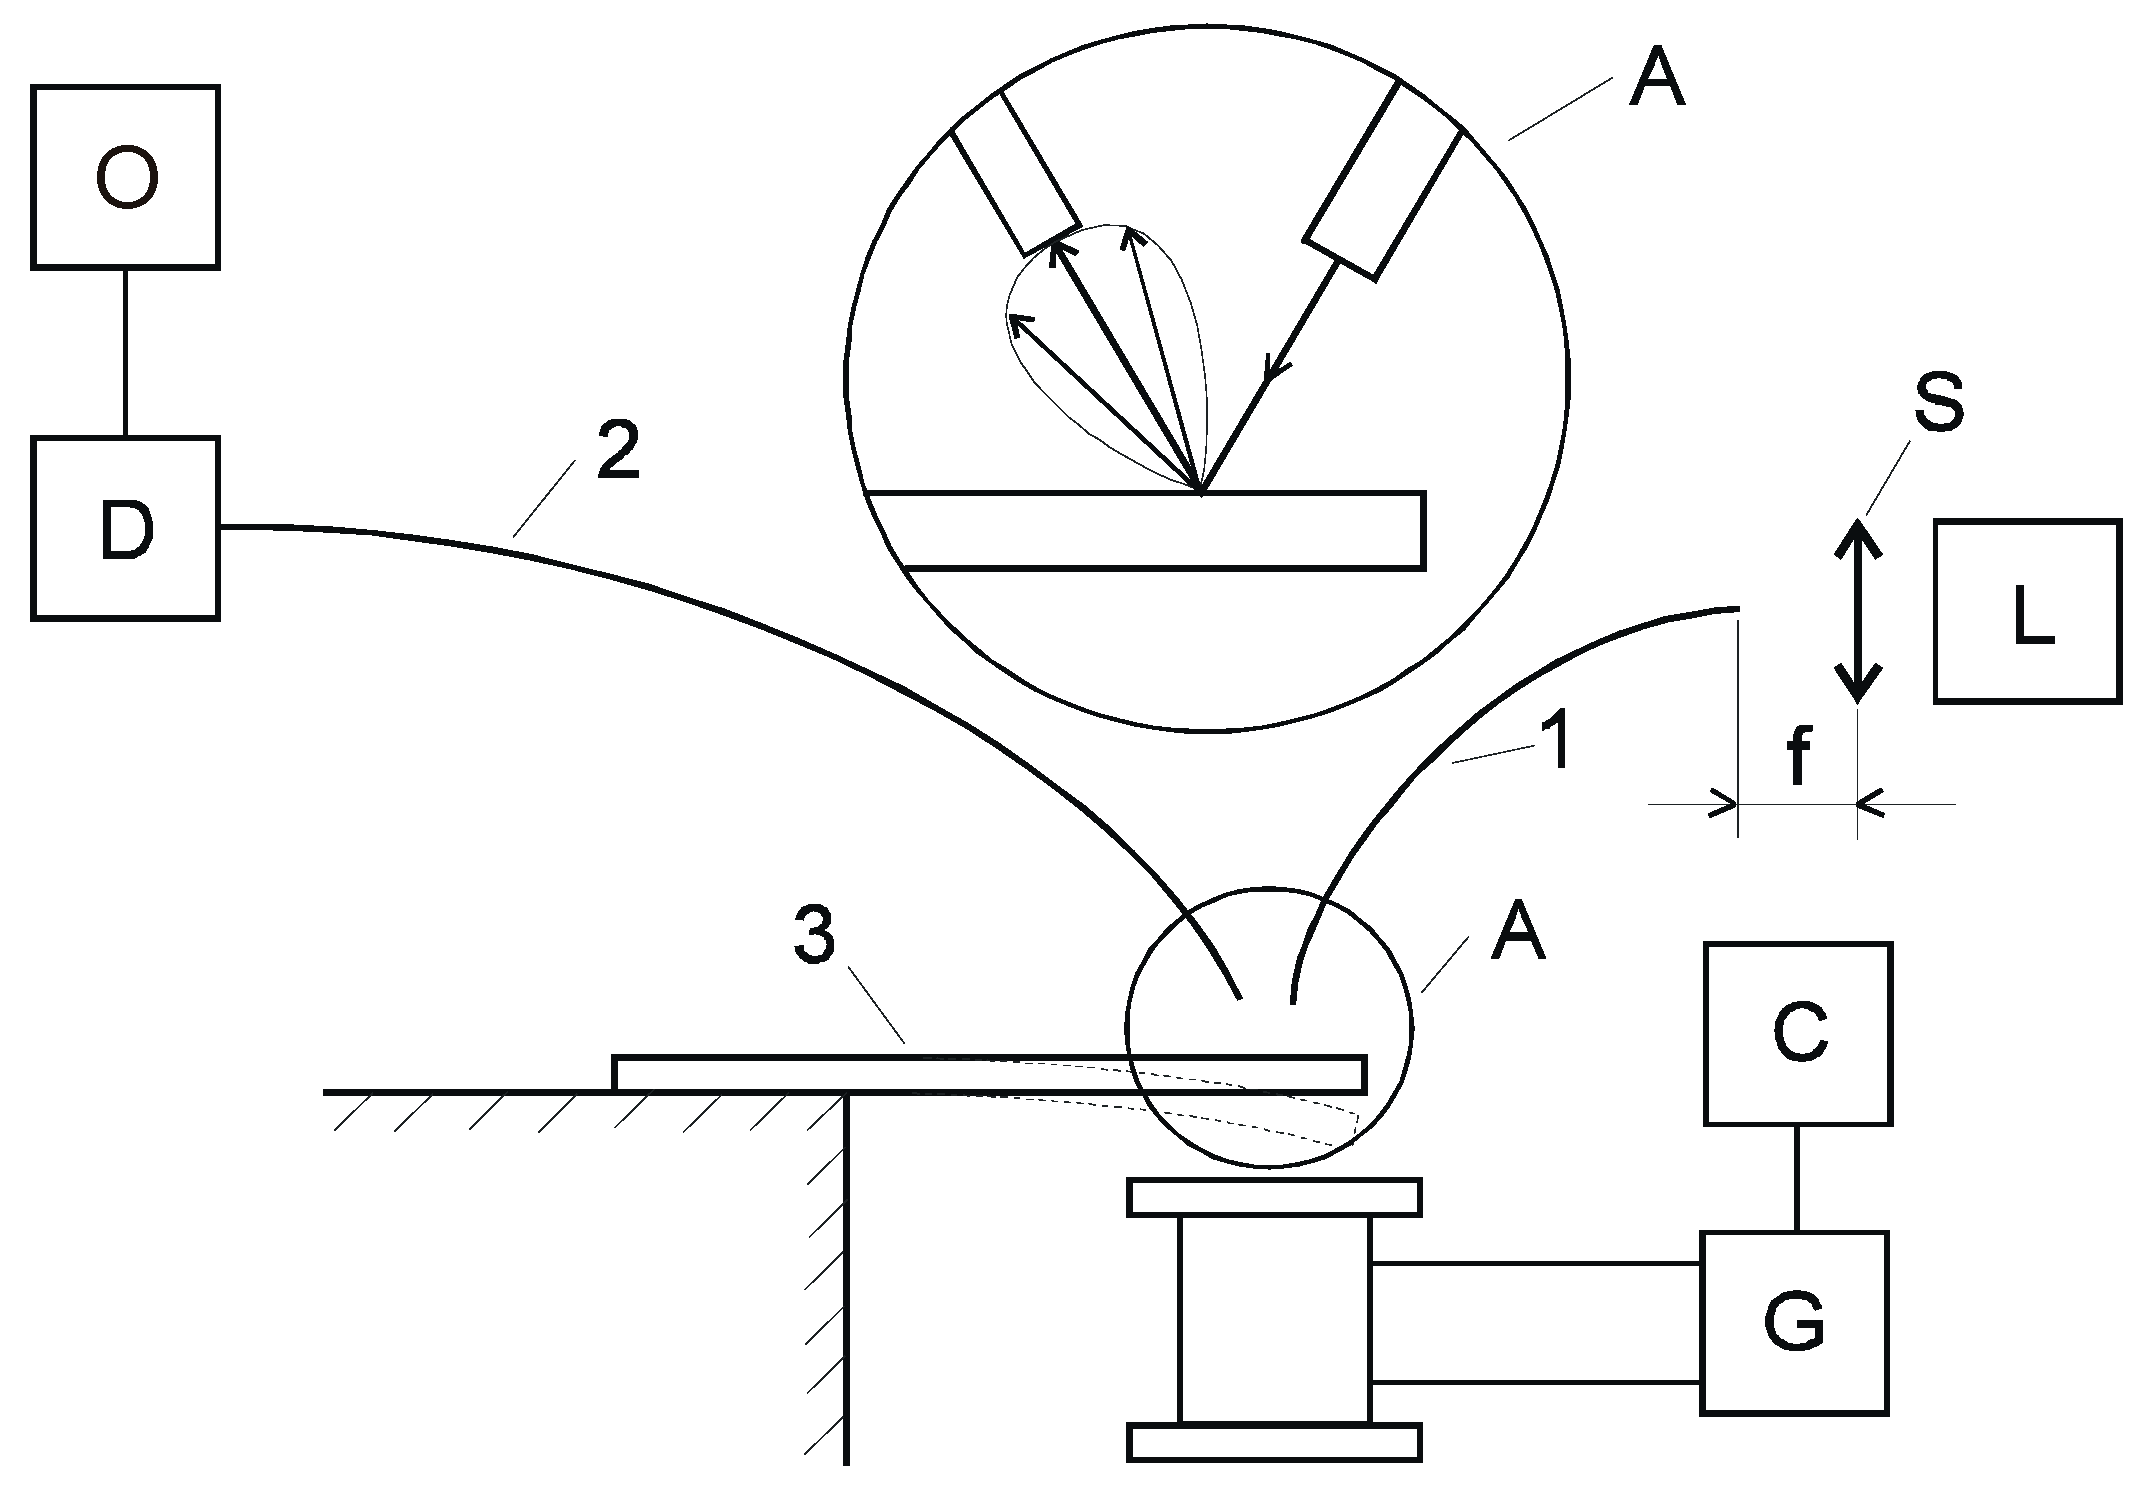
The experimental measurement system is shown in
Figure 1. Light from the laser, through optical fiber 1, is directed onto the vibrating surface of the tested sample in the form of a steel beam 3 [
15]. The light is scattered on this surface and some of it falls into fiber 2. Changing the position of the surface of the steel element also changes the spatial distribution of light. The iron mechanical element achieves the greatest amplitude of vibrations at resonance frequency. The light signal, after being reflected from the vibrating surface of the beam, reaches the photodiode D via optical fiber 2, which converts this optical signal into an electrical signal. The amplitude value of this electrical signal is measured on the oscilloscope screen. It is the greatest for the resonance frequency.
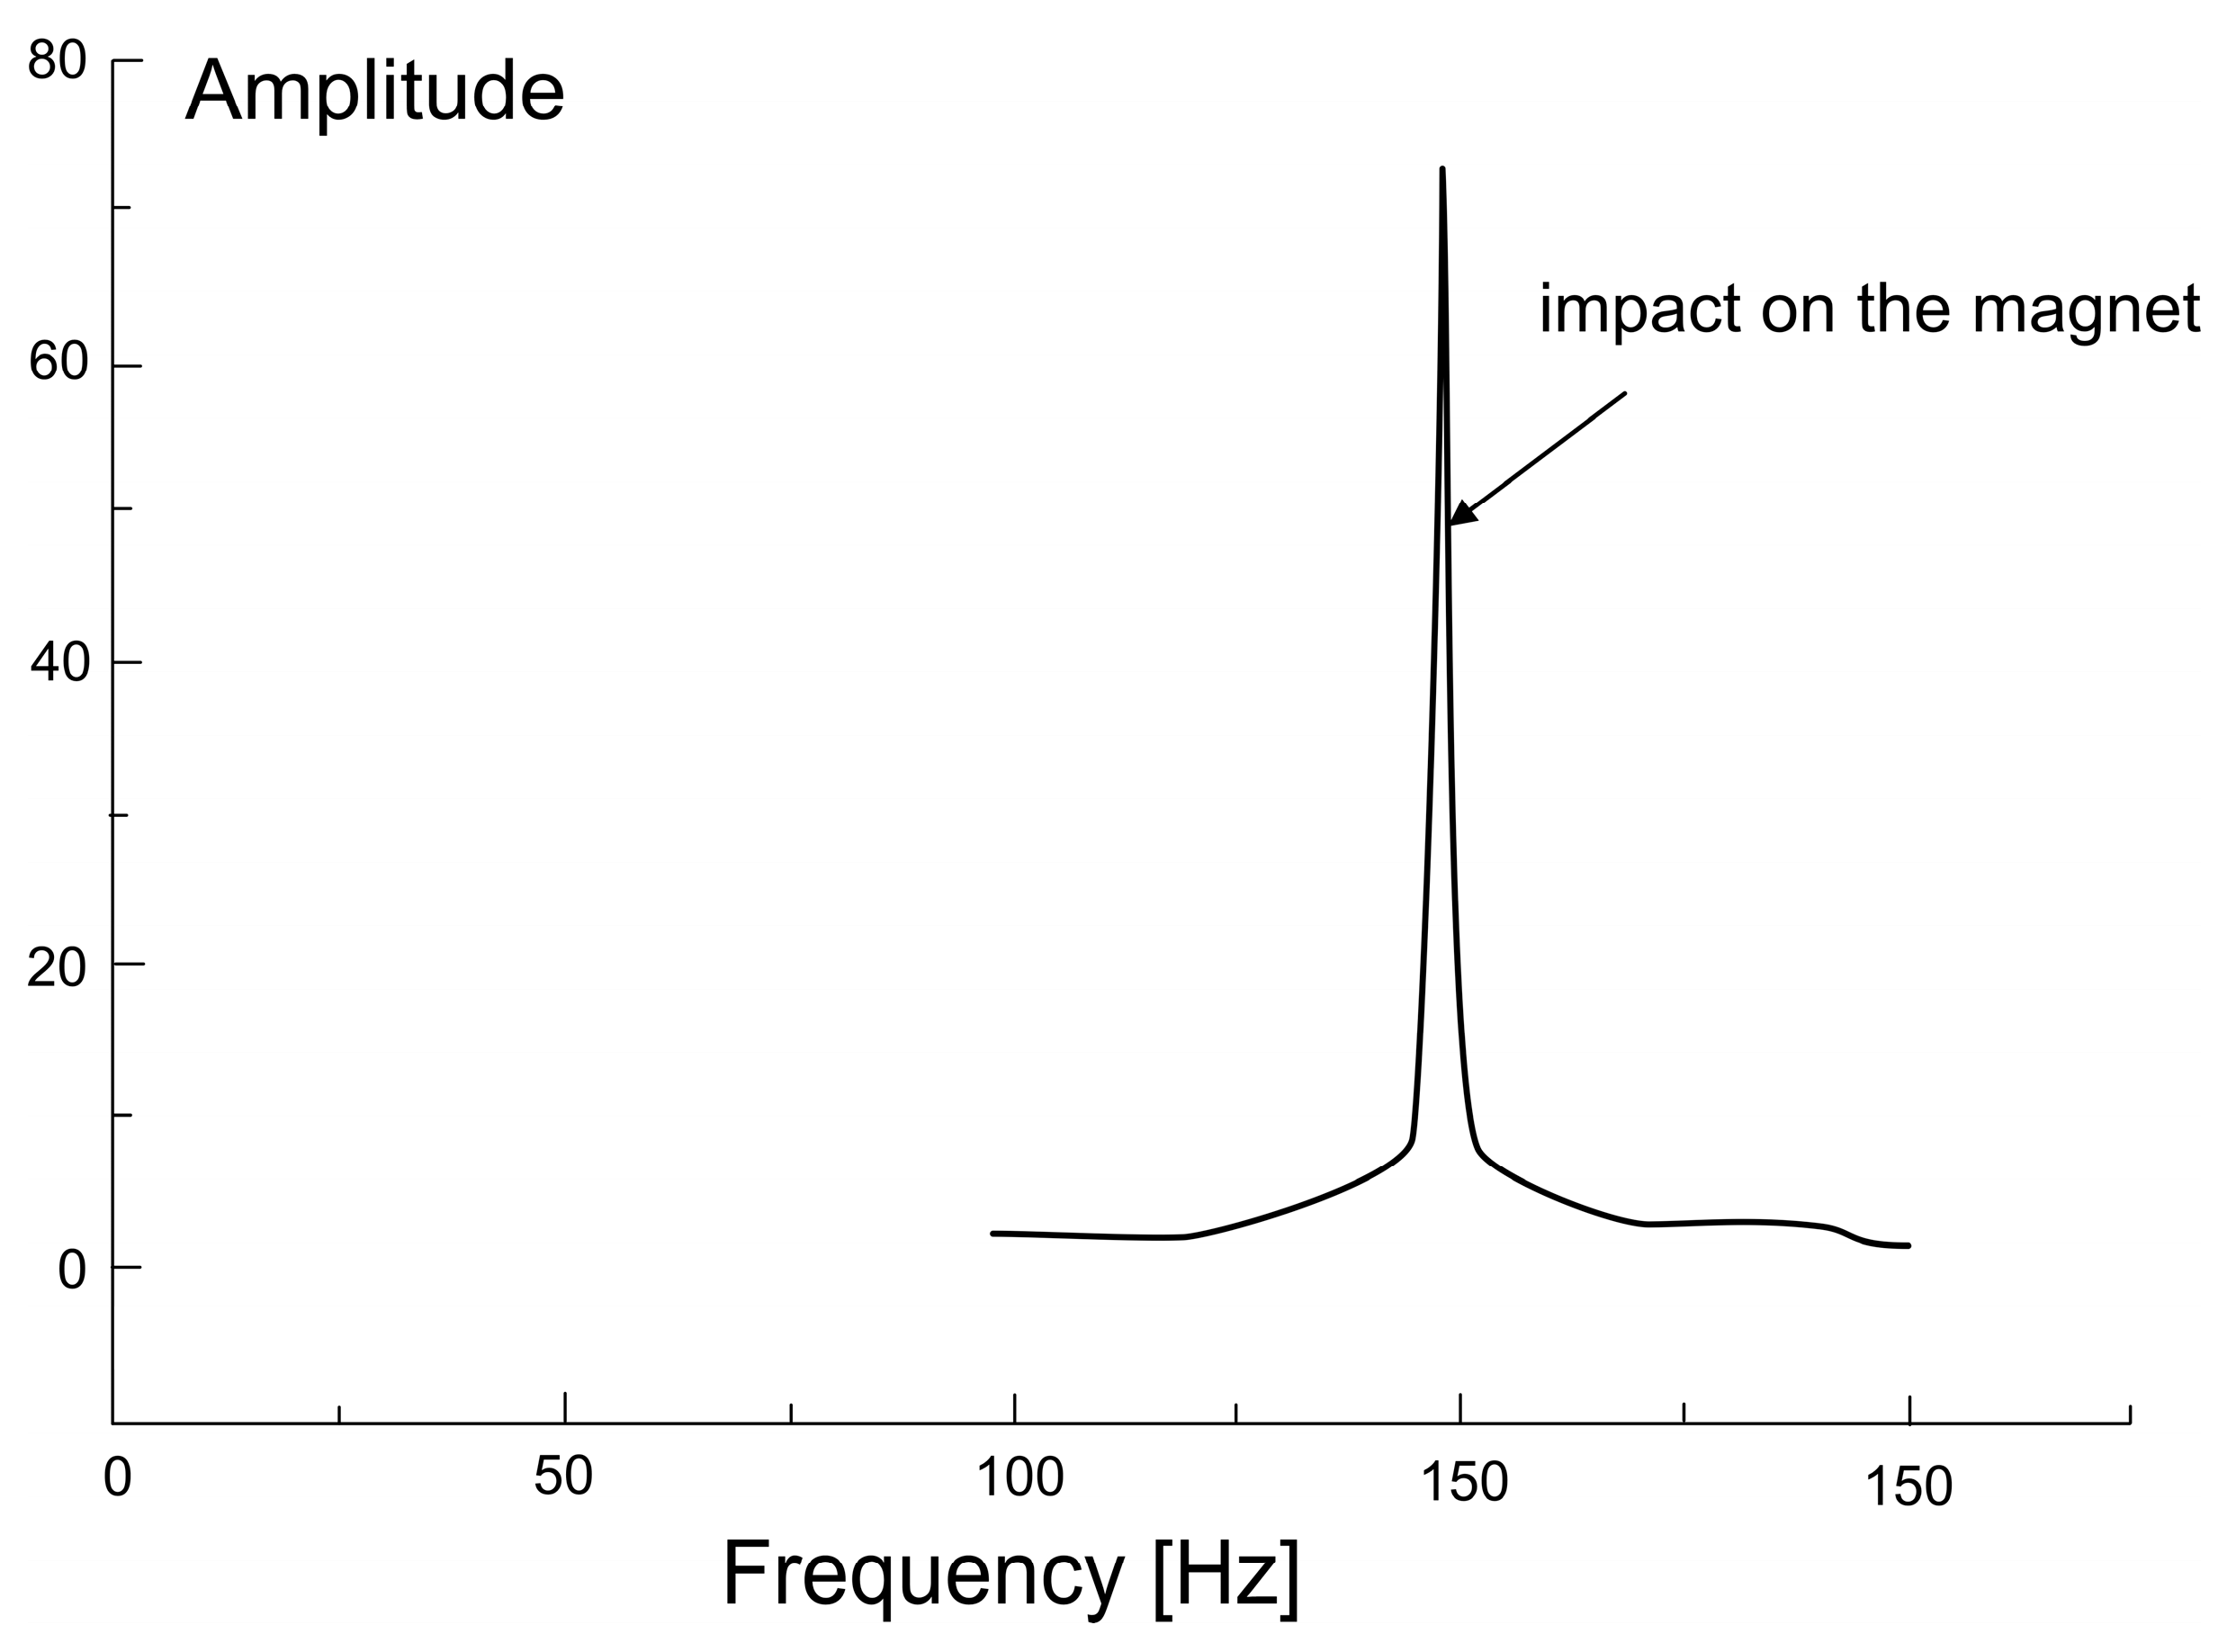
The measurement system shown in
Figure 1 was used to record the amplitude of vibrations of the surface of the tested steel sample. The vibration frequency in the range of 10–400 Hz with an accuracy of 0.1 Hz and the vibration amplitude were measured by it. The experimentally obtained maximum values of the amplitude of the vibrating surface for different magnetic field frequencies are shown in
Figure 2.
4. Theoretical Basis of the Method
The resonance frequency of the steel element is obtained by using an alternating magnetic field. Each ferromagnetic steel element is characterized by residual magnetism. Even after its special demagnetization, after some time it will be re-magnetized due to the action of the Earth’s magnetic field. Then, the alternating magnetic field affects the magnetized element. In such a field, attractive and repulsive forces are created on the magnetized steel element and its vibration will occur.
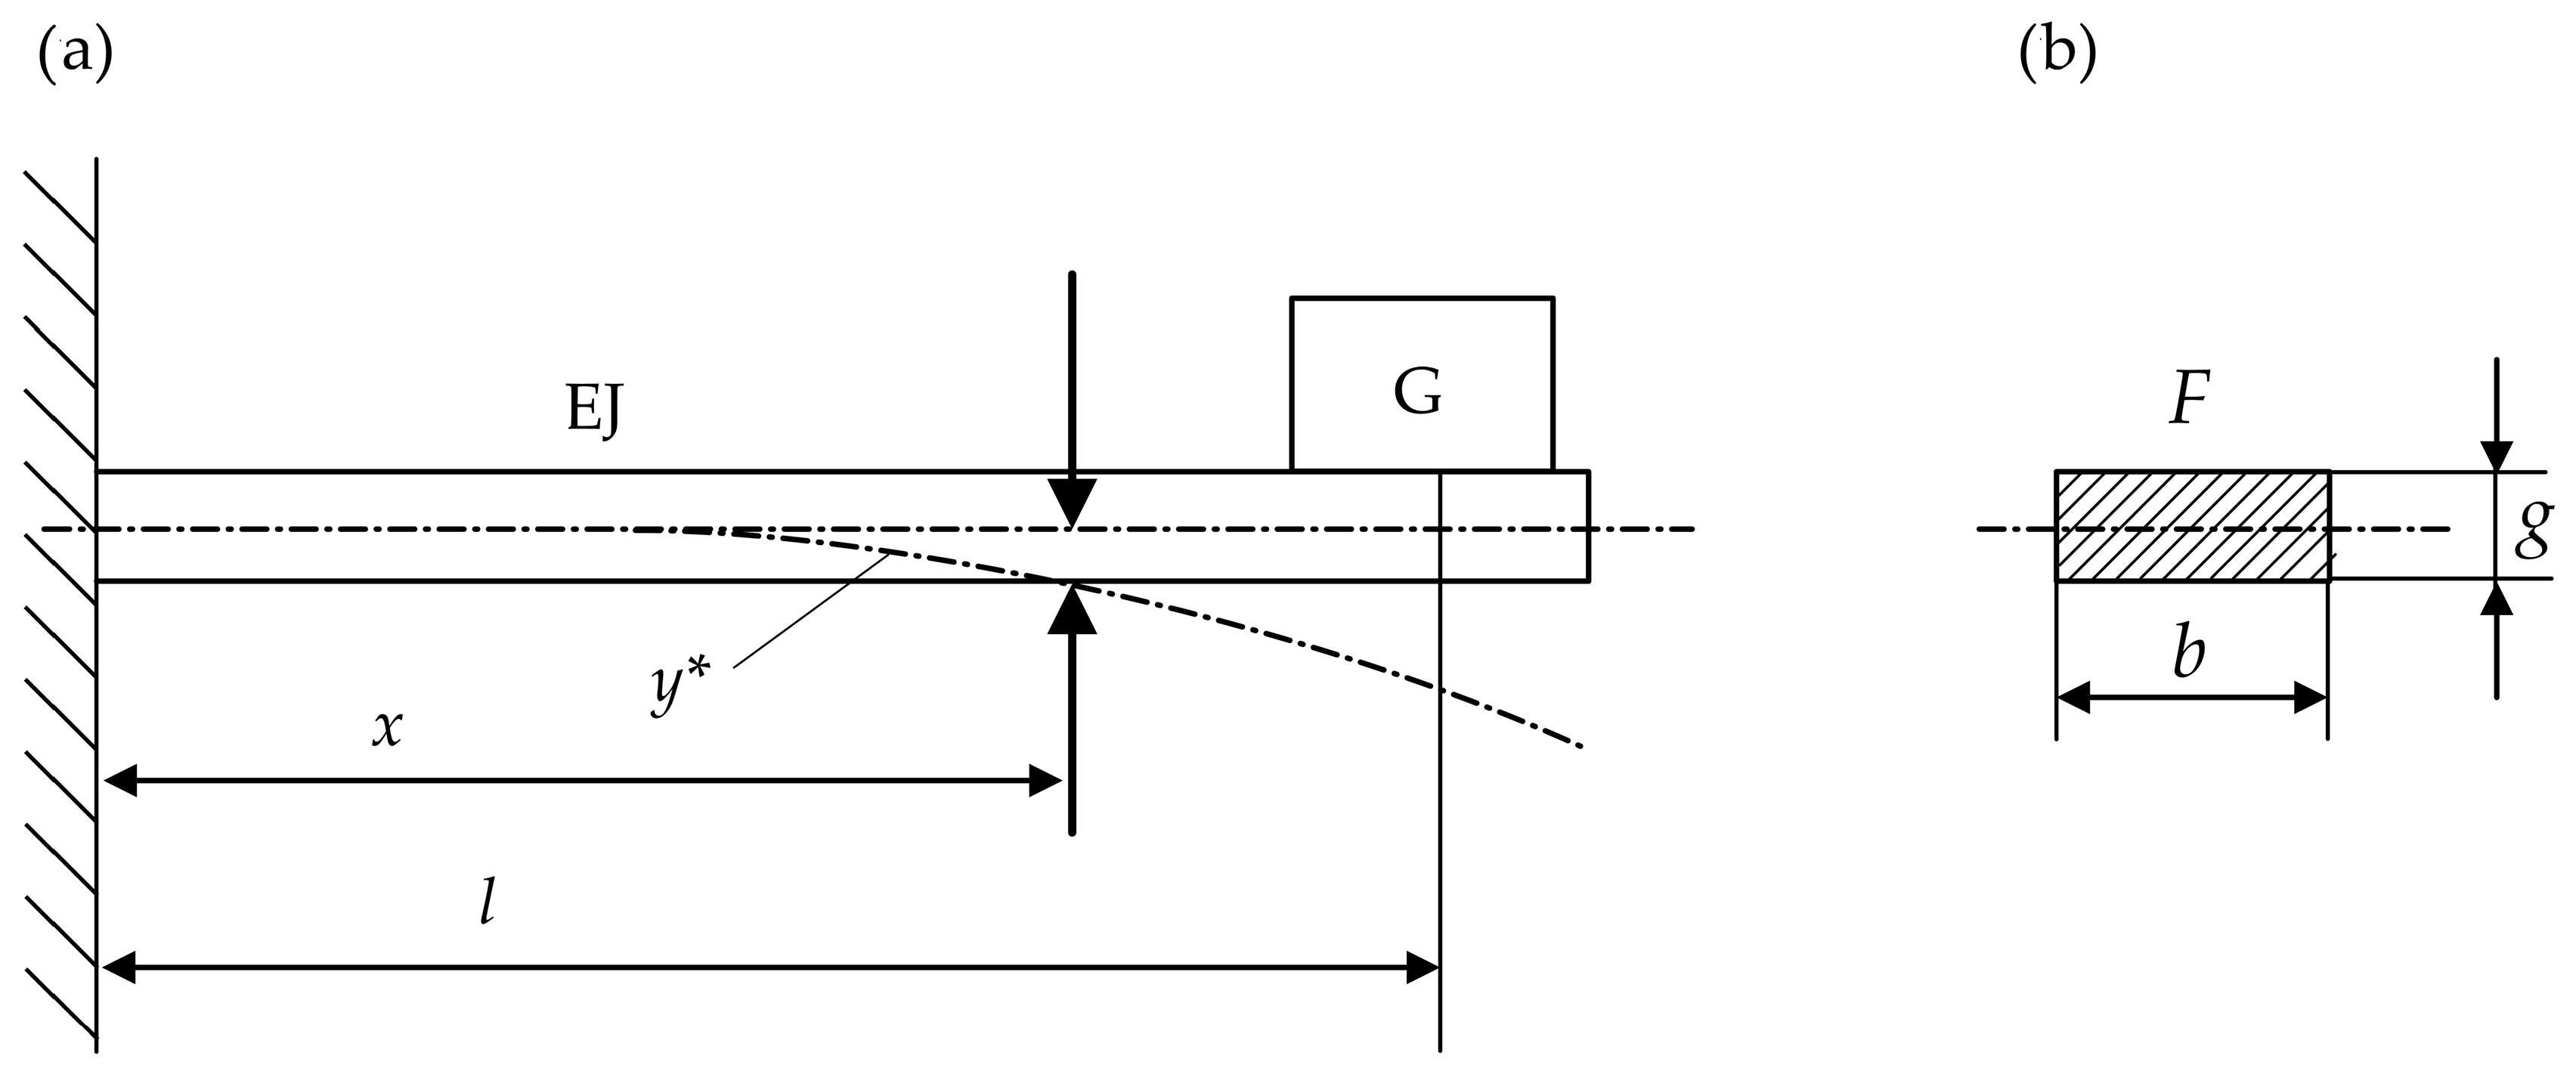
The tested beam and its rectangular cross-section are shown in
Figure 3.
In the measurement system on
Figure 1, the vibrations of such a beam caused by the alternating magnetic field of the electromagnet aslant from the G generator with adjustable frequency are tested. The laser optical signal reflected from the surface of this beam, modulated by its vibrations, is used. The signal fed from the laser to the oscilloscope via two sections of optical fiber and a photodiode is measured. The amplitude and frequency of the oscillogram of this signal are read from the scale on the oscilloscope screen.
The frequency f of the magnetic field is changed to obtain vibrations that are changed, and the amplitude A of the optical signal is measured. Its maximum value of deviation occurs at a specific frequency f and contains information that the vibrating beam is in resonance. From the value of its deviation, the angular frequency of the natural vibrations of the beam of length l and its bending stiffness E·l are determined.
This method uses free undamped vibrations of the beam. Then, the kinetic energy
E and potential energy
V are equal [
16,
17] as the relationship
Emax =
Vmax.
The kinetic energy
E and potential energy
V of the system are described by the following expressions:
where
,
,
.
The bending of the beam is described as follows:
where:
y(
x)—a function describing the deformation of a beam of weight
G resulting from a force
P without permanently damaging it,
ω—the angular frequency of beam vibrations.
The function y(x) satisfies the boundary conditions of the task, i.e., for x = 0, y(0) = 0, and also for
x = 1,
y(1) = 0. Then we obtain
The maximum values of kinetic energy
Emax and potential energy
Vmax are described by the formulas:
A comparison of both energies
Emax −
Vmax = 0 results
For
G = 0, the frequency of the beam natural vibrations is obtained, calculated from the relationship:
where
,
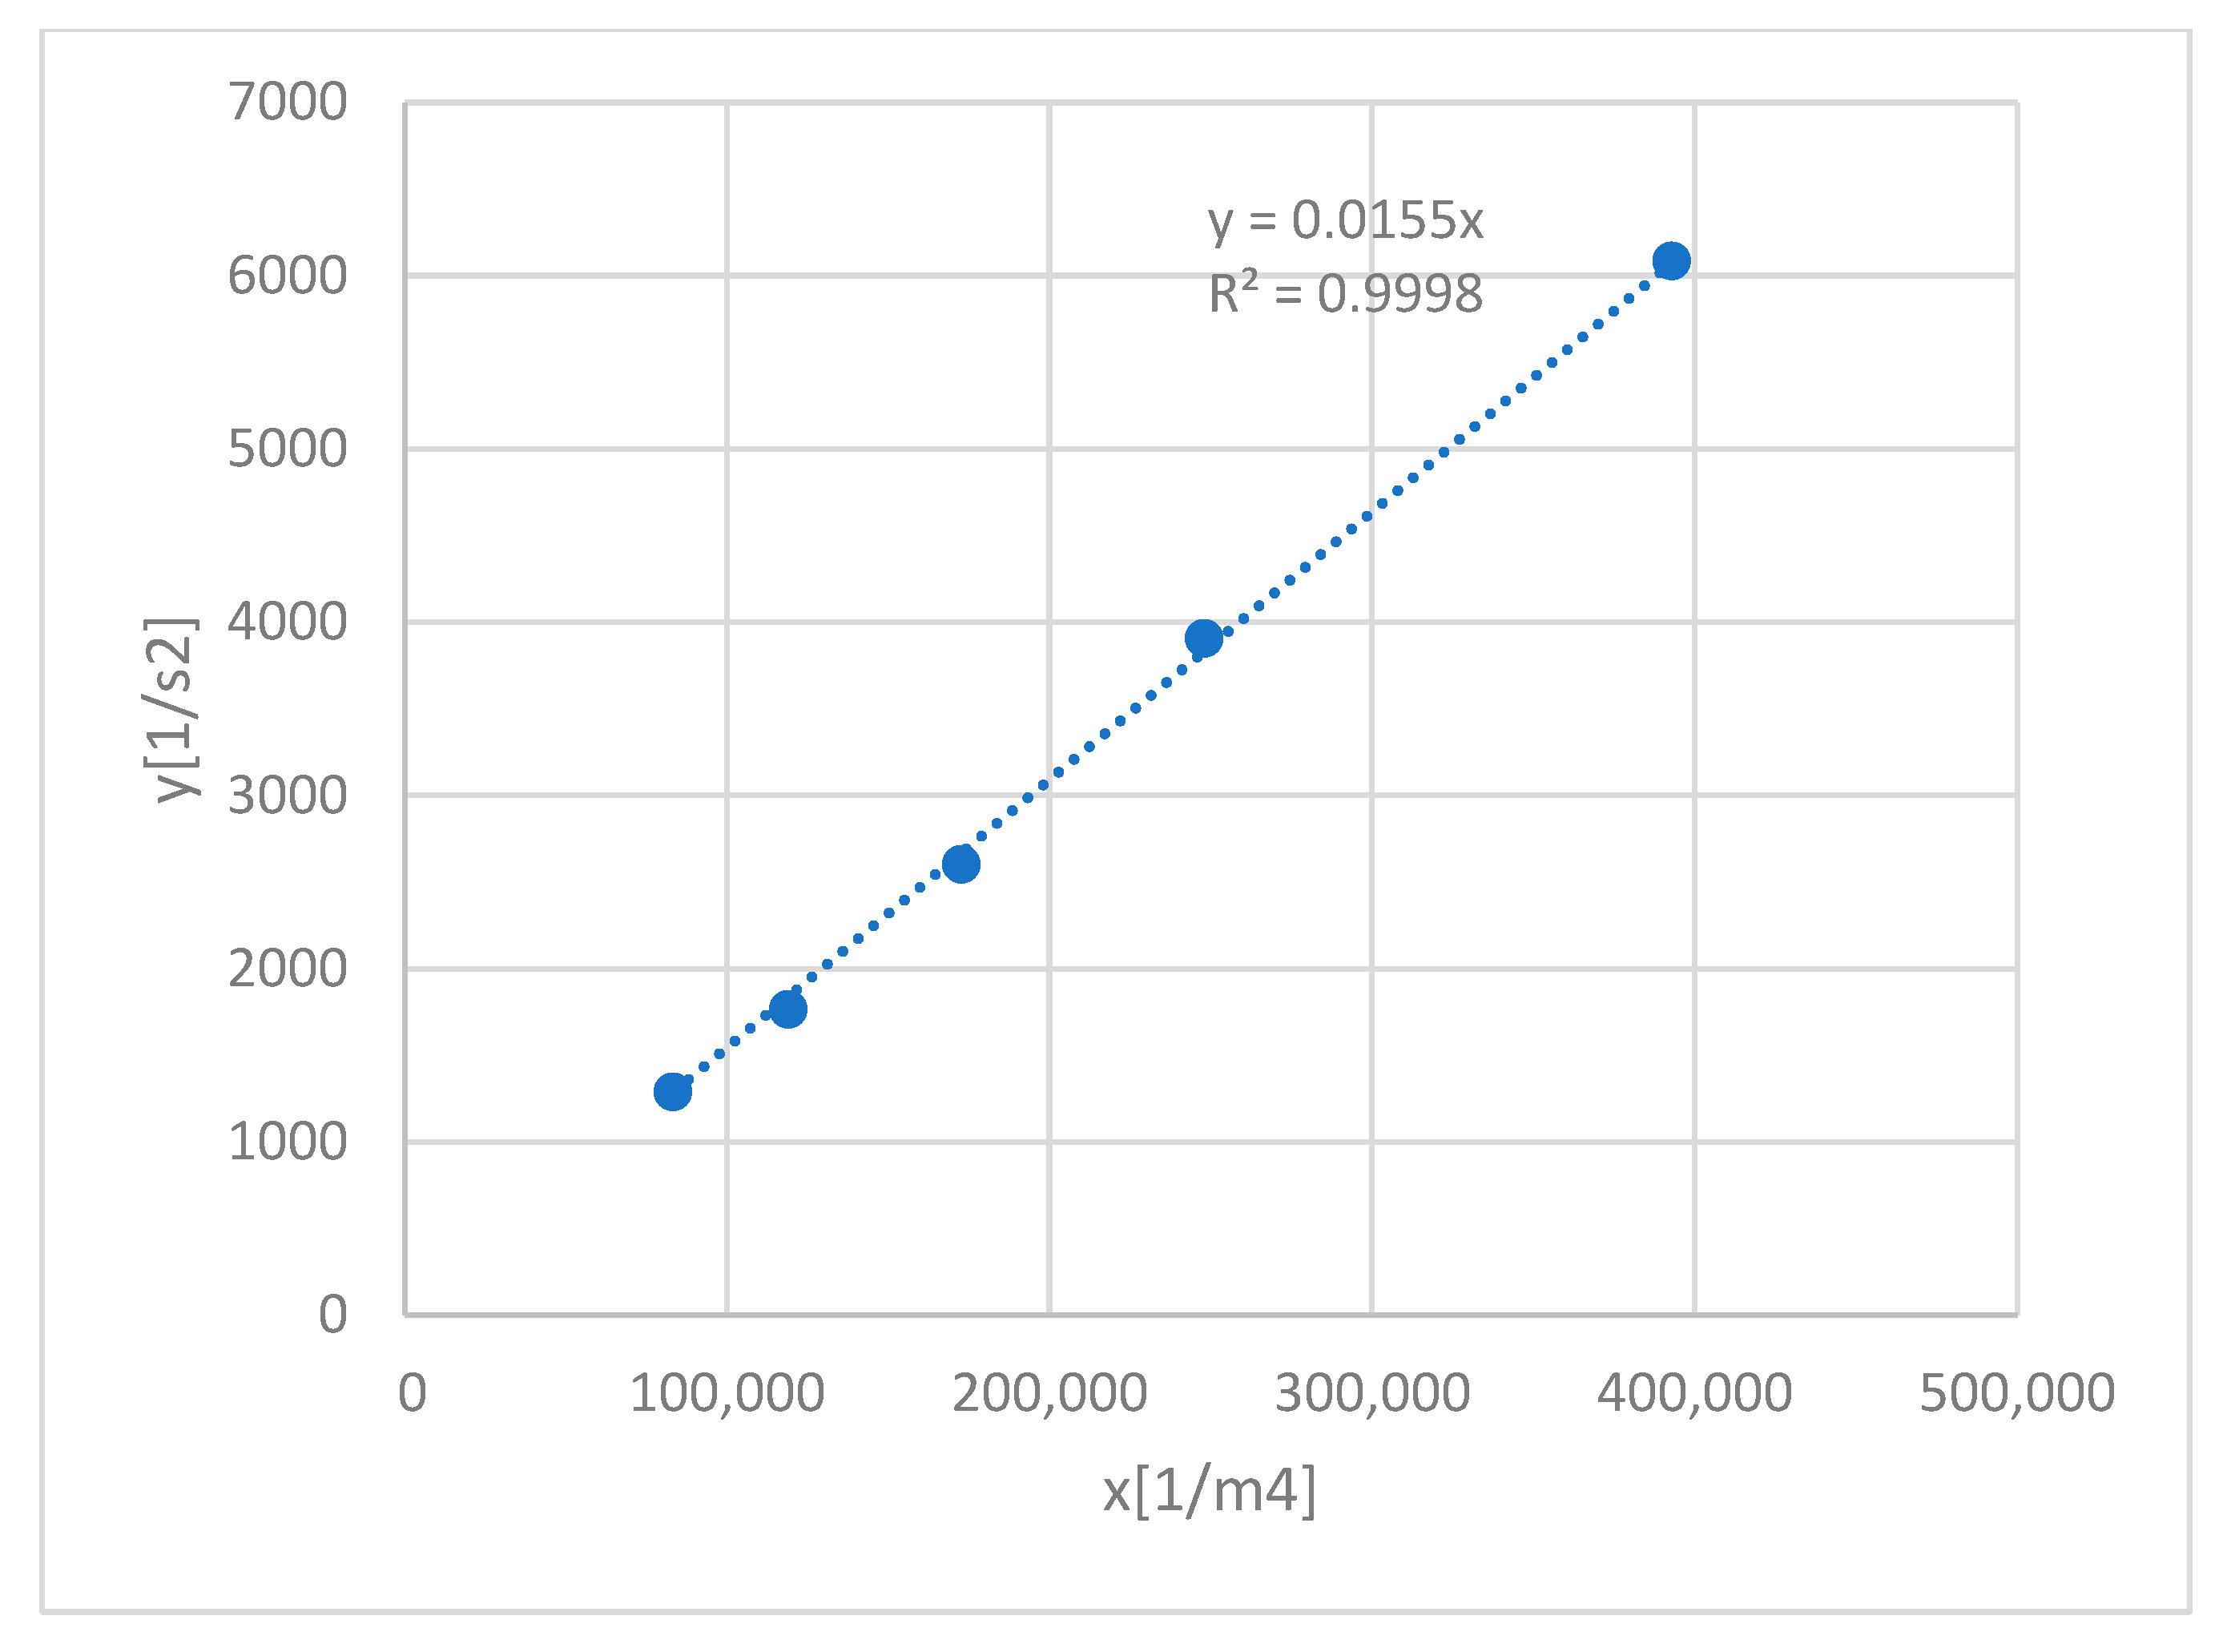
The nonlinear relationship (9) can be linearized. Then, according to the suggestion contained in [
18], it becomes easier to determine the parameters of a straight line and its uncertainty band from the measurement results using the linear regression method. After substituting
and
we get a straight-line
y = ax. 5. Example
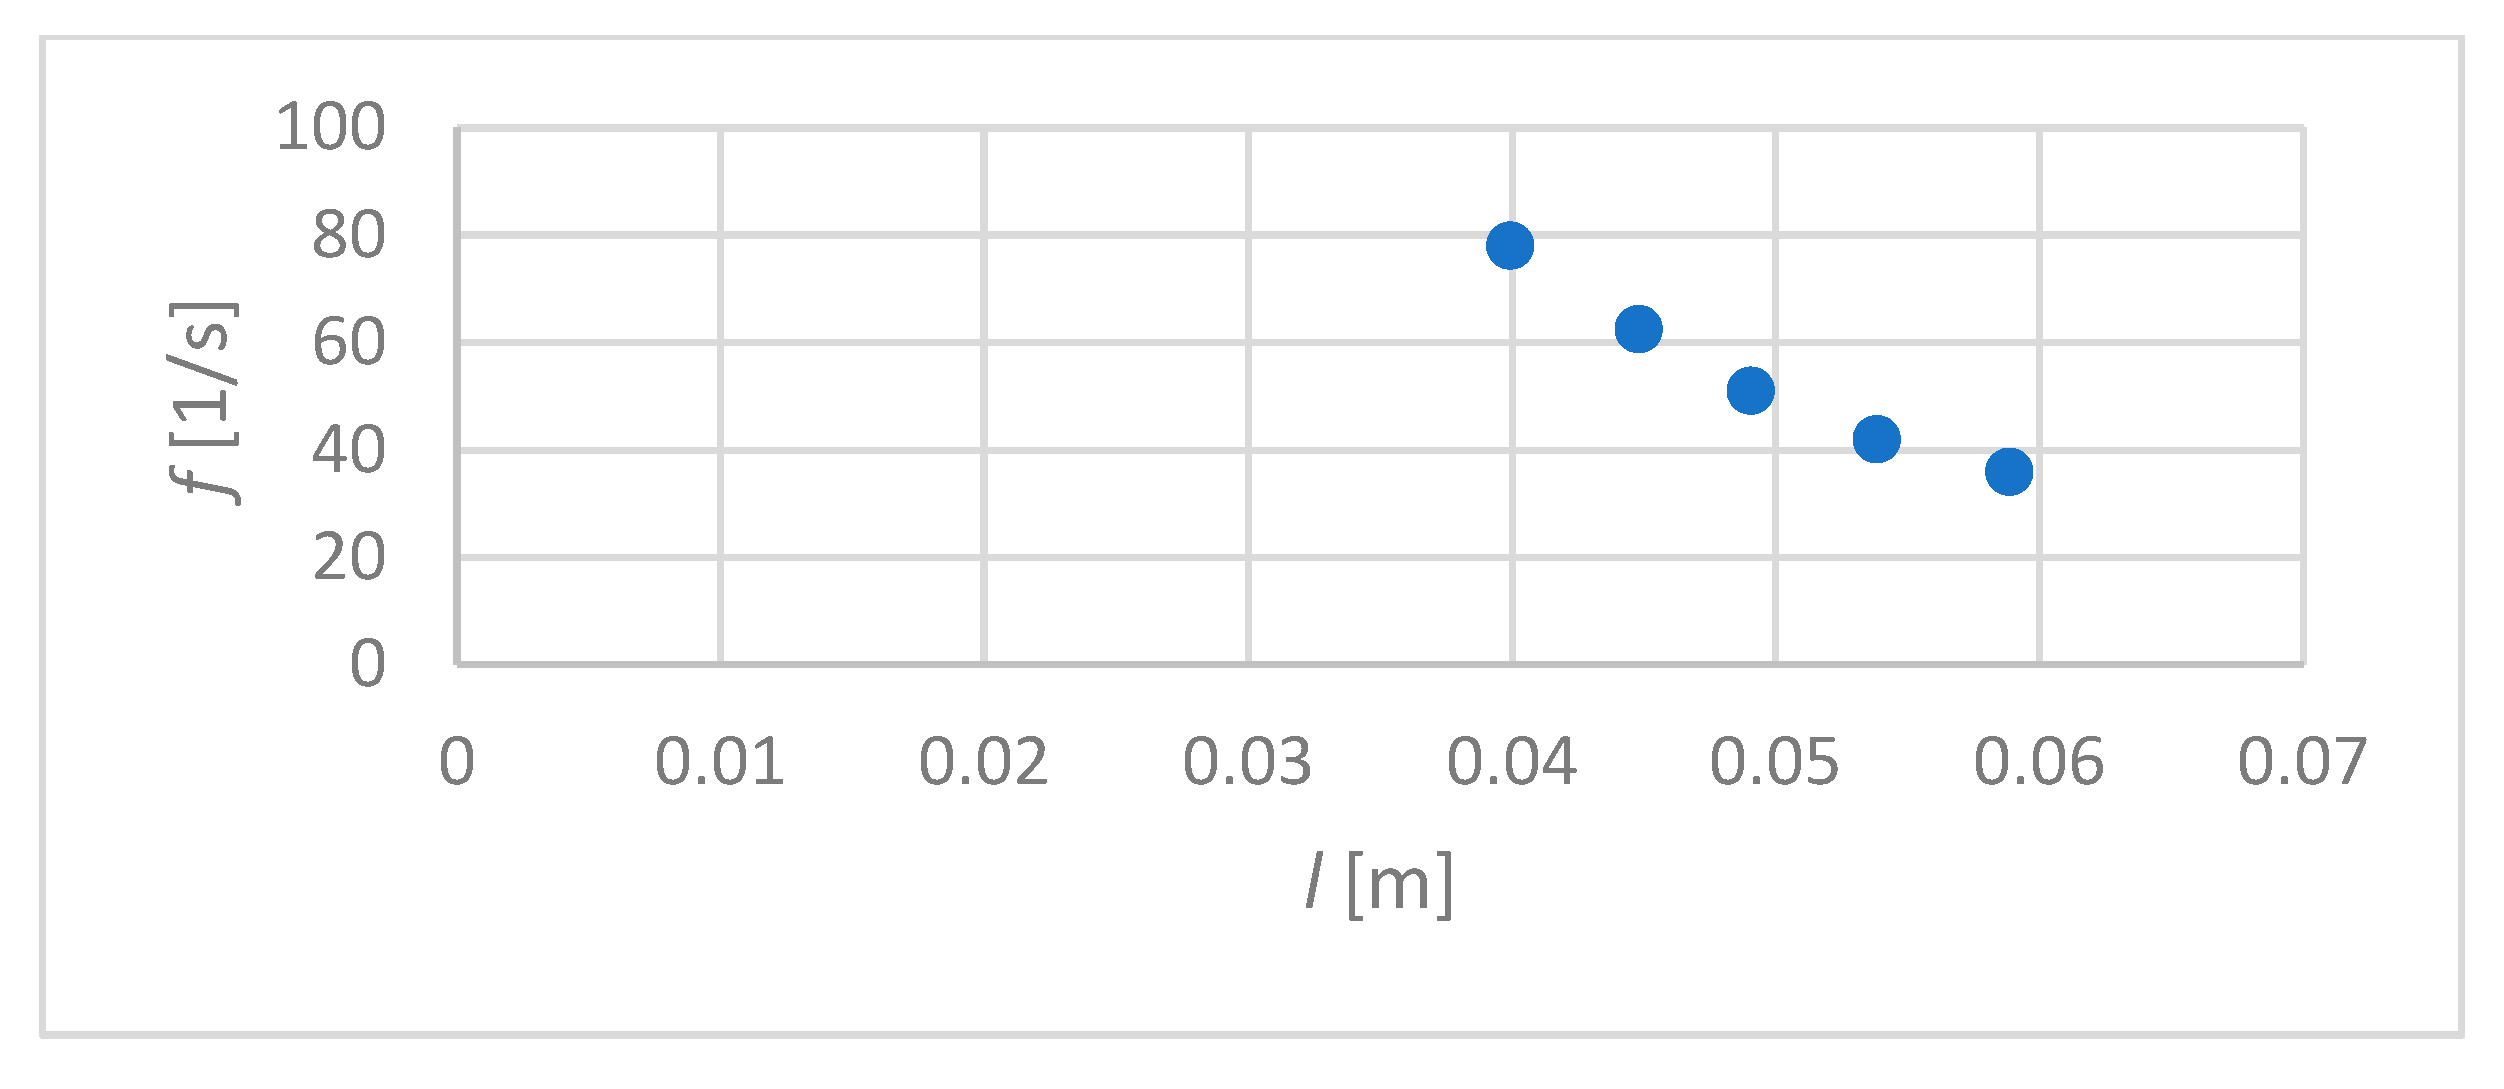
The measurement data are presented in
Table 1.
Figure 4 shows the relationship (9) obtained for these data, and
Figure 5—its linearization.
The slope coefficient a of the straight line and Young’s modulus E were determined using the least squares method. According to the data of the vibrating element with the following parameters:
Is g = (0.150 ± 0.001)·10
−3 m,
b = (9.99 ± 0.01)·10
−3 m,
ρ = (8011 ± 53) kg/m
3. Young’s modulus
E is calculated. The slope coefficient of the straight line is
a = (0.01546 ± 0.00013) m
4/s
2 By transforming the above relationship, we calculate the modulus
EExpanded uncertainty is U(E) = 2
6. Summary and Conclusions
The paper describes the vibration method of dynamic measurement of Jung’s modulus. The tested metal beam is stimulated to vibrate with a magnetic field of variable frequency. When the forcing frequency is consistent with the natural frequency of the system, resonance occurs. The beam’s resonance frequencies were recorded for its different lengths.
From the measurement results, the Young’s modulus values are determined, as well as its standard deviation and extended deviation determined by the least squares method for the assumption that measurement errors have normal distributions.
In the measurement system implementing the discussed method, a fiber optic laser sensor using light reflection from the beam surface can be used to control the vibration amplitude. Thanks to this, the method is non-contact and suitable for observing free damp vibrations of a beam made of any material and stimulated to vibrate in various ways.
Further research on this method will concern the improvement of the measurement station and analysis of the influence of various interactions.


