Technical Note

User-Friendly Tool for Expedited Ground Vibration Assessment Induced by Impact Pile Driving

by
Ahmed M. Abouelmaty
1,2,
Aires Colaço
1,* and
Pedro Alves Costa
1
1
CONSTRUCT, Faculty of Engineering, University of Porto, Rua Dr. Roberto Frias, 4200-465 Porto, Portugal
2
Arab Academy for Science, Technology & Maritime Transport, AASTMT, Alexandria 5528341, Egypt
*
Author to whom correspondence should be addressed.
Vibration 2025, 8(2), 17; https://doi.org/10.3390/vibration8020017
Submission received: 21 February 2025 / Revised: 27 March 2025 / Accepted: 2 April 2025 / Published: 4 April 2025

Abstract

:
Driven piles are a common geotechnical solution for foundations in weak soil profiles. However, hammer impacts during the driving process can generate excessive levels of ground vibration, which, in extreme cases, can affect nearby structures and people. Due to the complexity of wave propagation in soils, the accurate prediction of these vibrations typically requires advanced numerical modeling approaches. To address this challenge, a surrogate modeling framework was developed by integrating Artificial Neural Networks (ANNs) and Extreme Gradient Boosting (XGBoost), trained on a synthetic dataset generated from an experimentally validated numerical model. The proposed surrogate model enables the rapid prediction of ground vibration characteristics, including peak particle velocity (PPV) and frequency content, across a broad range of soil, pile, and hammer conditions. In addition to its predictive capabilities, the tool allows users to design a specific mitigation measure (open trench) and compare the vibration levels with international standards. Experimental validation confirmed the model’s ability to replicate field measurements with acceptable accuracy. The expedited prediction tool is available as supplemental data and can be used by other researchers and technicians for quick and accurate ground vibration predictions.

1. Introduction

Ground vibrations are a critical consideration in geotechnical construction, particularly during the installation of driven piles using impact hammers, where induced particle velocities may exceed the threshold values specified by prevailing standards. Accordingly, the accurate prediction of vibration levels is essential for assessing potential risks and implementing appropriate mitigation measures to prevent damage to adjacent structures and sensitive facilities.
Some recent works offer valuable insights into this complex phenomenon. Ref. [1] analyzed dynamic measurements during vibratory pile driving, emphasizing the significance of dynamic testing methods for interpreting vibration data. Refs. [2,3] developed a real-time instrumentation system for monitoring ground vibrations during sheet pile driving, highlighting the influence of soil conditions on the propagation of vibrations. Ref. [4] compared various vibration prediction methods, addressing the complexities introduced by different soil types and driving techniques. Ref. [5] explored how groundwater levels and ground inclination affect the propagation of vibrations, while refs. [6,7] focused on compressive sensing techniques to reduce monitoring costs in urban areas. Finally, ref. [8] utilized experimental and numerical models to examine vibrations caused by pile driving, providing valuable insights into the factors influencing vibration behavior.
As understood, the prediction of ground vibrations resulting from pile driving is a complex problem affected by numerous factors, such as the energy transmitted from the hammer to the pile, the geotechnical conditions of the site, the distance from the source, and the soil–structure interaction, among others (see Figure 1).
Empirical vibration prediction models, based on experimental data, were the first methods used to predict pile driving vibrations. Notable approaches include those by [9,10]. However, ref. [11] found that the predicted vibration levels were quite variable across these different empirical methods, which posed challenges for accurate prediction. In contrast, recent numerical approaches offer deeper insights into the physical behavior of the entire system, allowing for an overall assessment of vibration levels. These include the advanced numerical approaches proposed by [8,11,12,13,14,15,16]. While numerical models provide more accurate predictions and can account for complex phenomena, such as nonlinear soil behavior, they are complex, computationally expensive, and time-consuming.
Following recent trends, different researchers have used machine learning techniques to predict ground-borne vibrations with high accuracy in different application fields. Ref. [17] used ANNs to predict mining-induced vibrations, while ref. [18] applied ANNs to wave propagation modeling to mitigate railway-induced vibrations. Ref. [19] demonstrated the superior accuracy of ANNs in predicting blast-induced vibrations compared to traditional methods. Ref. [20] developed a real-time tool for assessing high-speed rail vibrations.
This work presents the development, validation, and use of a stand-alone computer tool based on machine learning techniques for an expedite prediction of ground vibrations induced by pile driving activities. The machine learning algorithms used for training from the learning dataset are ANNs and XGBoost. Moreover, this short paper also makes the proposed tool available for free use by other researchers or engineering professionals.

2. Development of the User-Friendly Prediction Tool

2.1. Database Generation

An axisymmetric FEM–PML (Finite Element Method–Perfectly Matched Layer) numerical model was employed to generate an extensive learning database. The model comprises two primary modules: the first simulates the dynamic behavior of the hammer system, while the second represents the coupled pile–soil interaction. The nonlinear response of the ground is incorporated using the equivalent linear approach, which captures soil nonlinearity through an iterative procedure. This method adjusts the elastic material properties to reflect the effects of inelastic behavior at strain-compatible levels. The applicability of this iterative technique relies on empirical relationships that describe the degradation of shear stiffness and the increase in damping ratio with increasing shear strain (see [21], for further details).
The generated database covers a wide range of possible scenarios, addressing the properties of the pile, soil, and hammer. A parametric study previously conducted by [22] allowed for the identification of the most relevant parameters of the driving process.
To generate the input combinations, Latin Hypercube Sampling (LHS) was employed. This method enables a stratified and statistically robust exploration of the multidimensional parameter space, ensuring better coverage and distribution across the defined ranges compared to uniform or random sampling.
Thus, the database was developed taking into account three typologies of geotechnical profiles: homogeneous halfspace soil model; one single layer on a halfspace soil model; and two layers on a halfspace soil model. The range of variation for the different soil parameters is presented in Table 1, covering the most typical practical conditions. Regarding the properties of the pile, its diameter ranges from 0.5 to 0.2 m, the penetration depth ranges from 15 to 0.5 m, and the hammer drop height ranges from 1 to 0.3 m.
The total number of samples generated varied depending on the output type and soil profile complexity. For the peak particle velocity (PPV) predictions, 1400 samples were generated for both the homogeneous and the two-layer soil profiles. These were based on 100 numerical simulations per profile, each evaluated at 14 distinct distances from the pile axis (from 0.5 to 30 m). For the three-layer profile, the PPV dataset included 2000 samples, taken from 100 simulations evaluated at 20 distances.
For frequency-domain predictions, the homogeneous and two-layer cases were evaluated at 400 frequency bins (from 1 to 200 Hz), producing a total of 560,000 samples. The three-layer configuration required higher resolution, with 600 frequency bins per case, resulting in approximately 1.2 million samples. This increased volume was necessary to capture the more complex spectral behavior introduced by the additional stratigraphic interface.

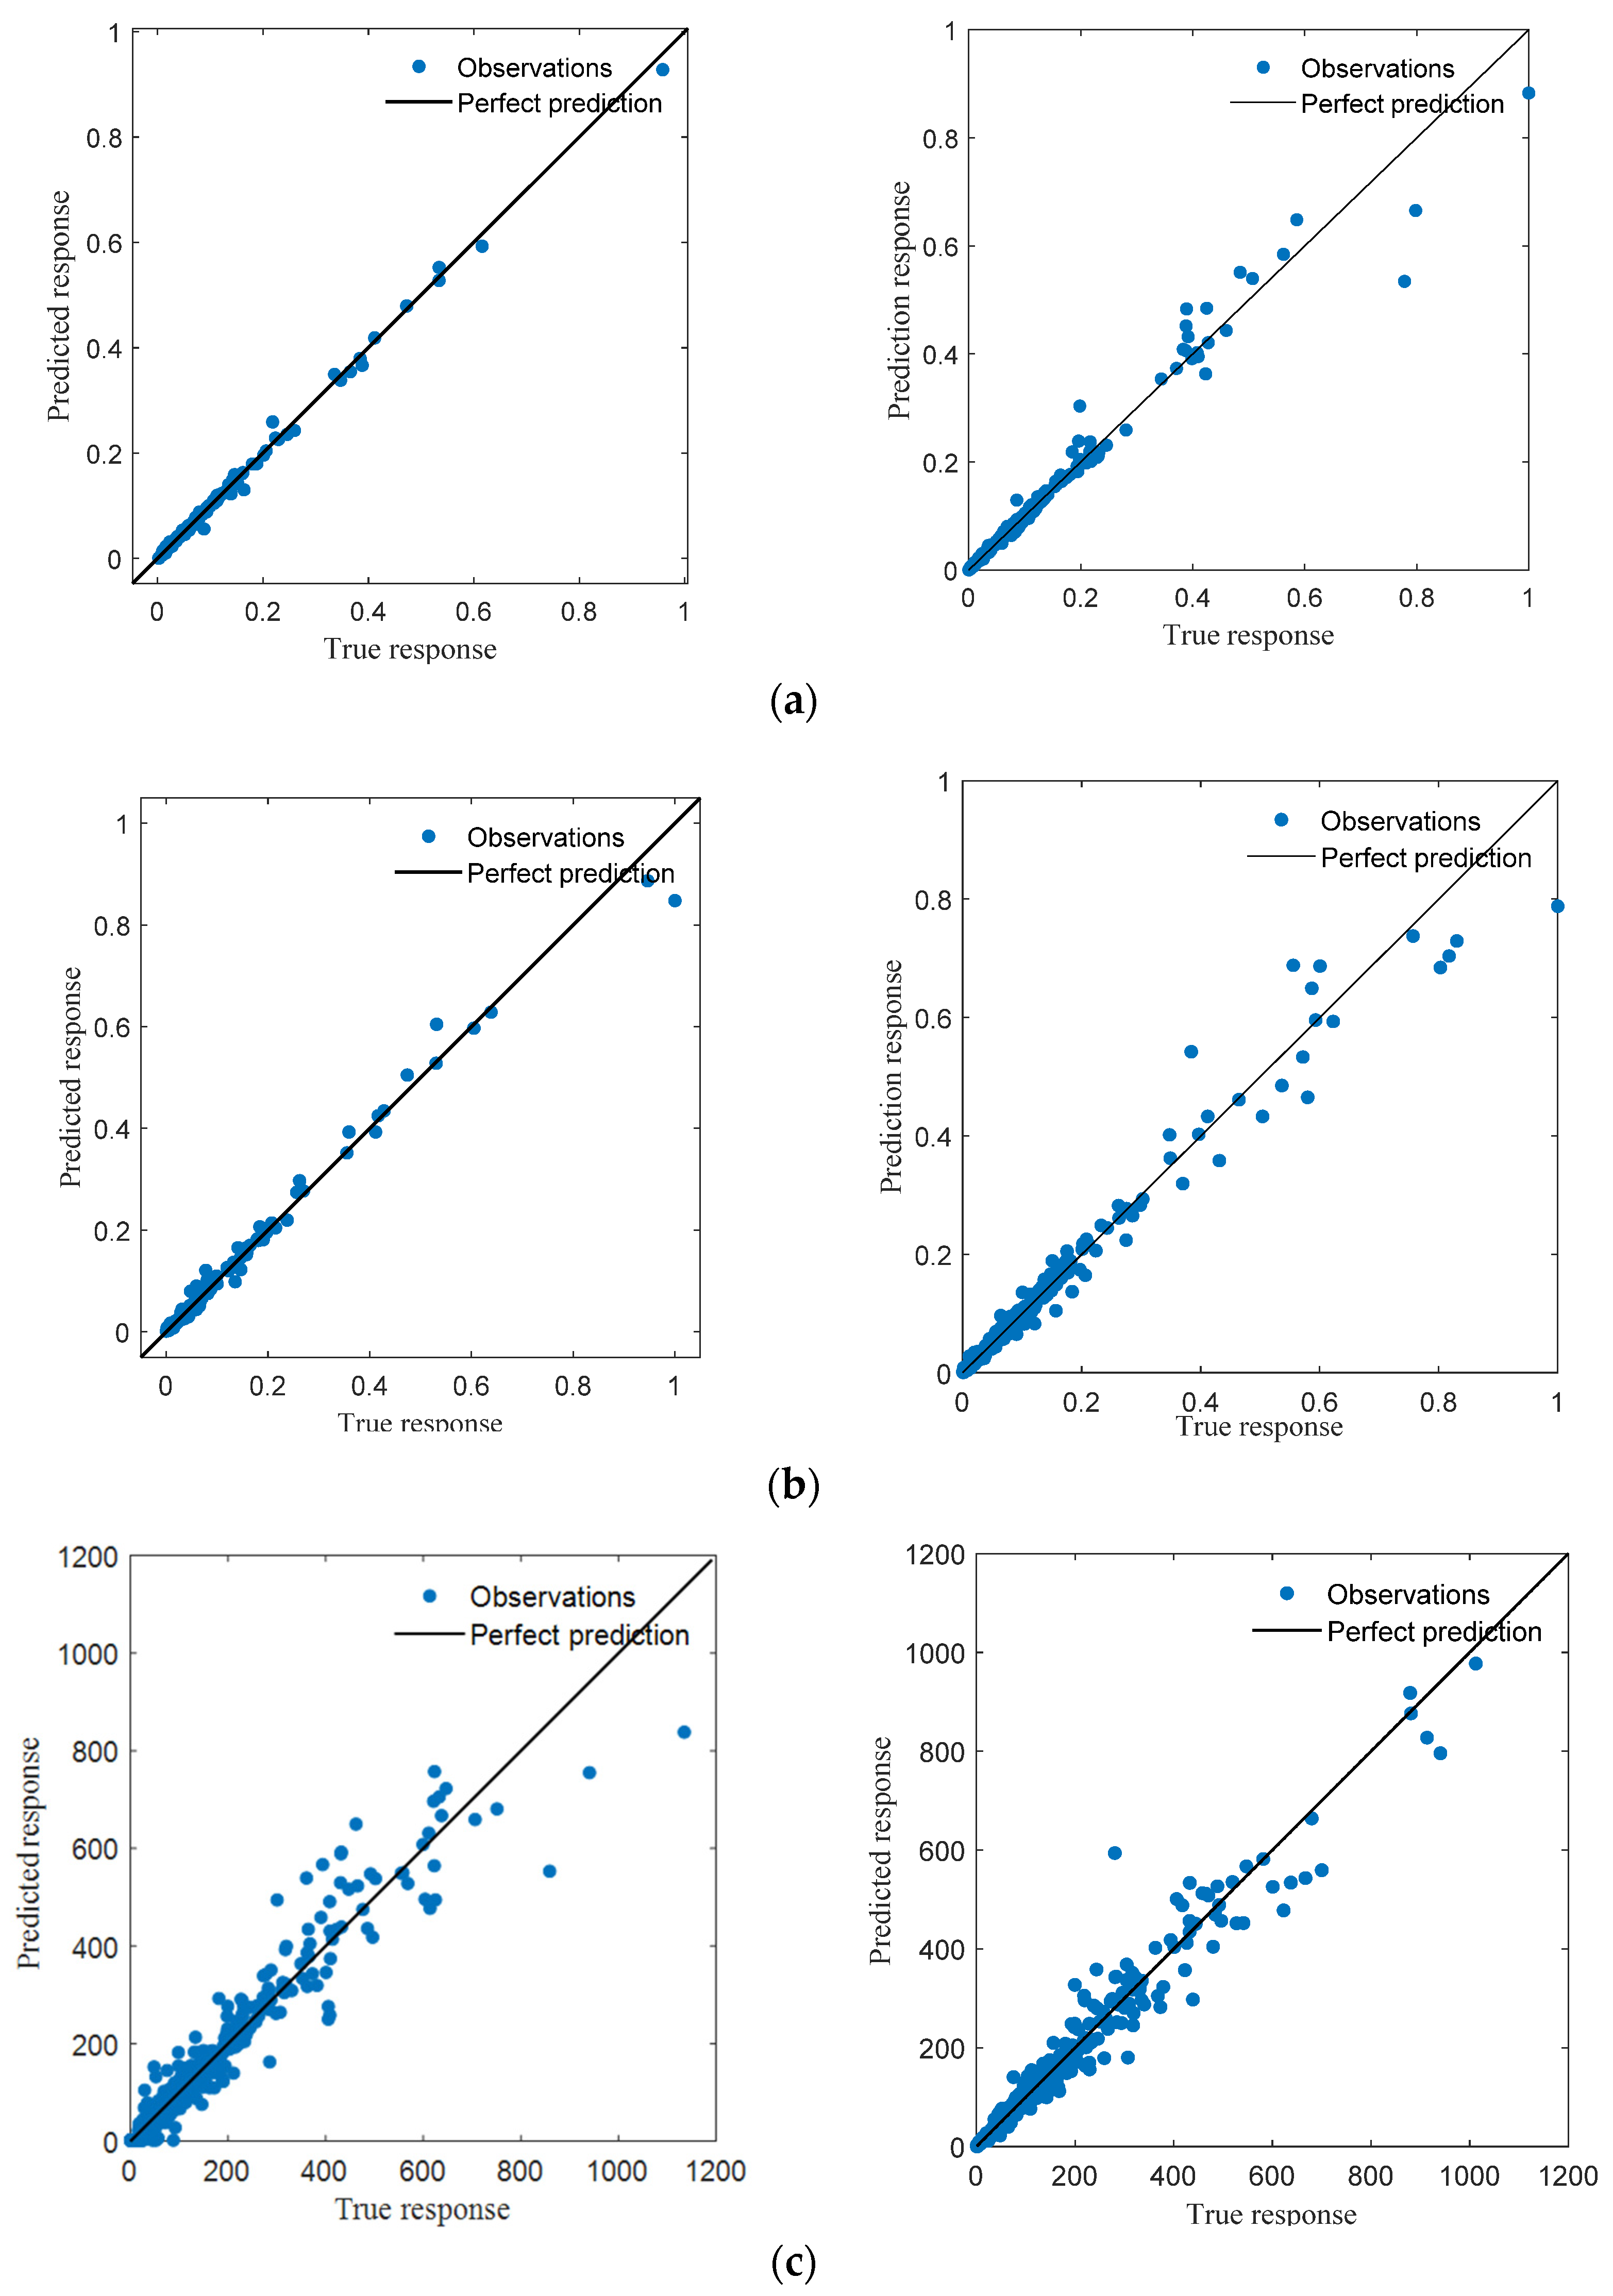
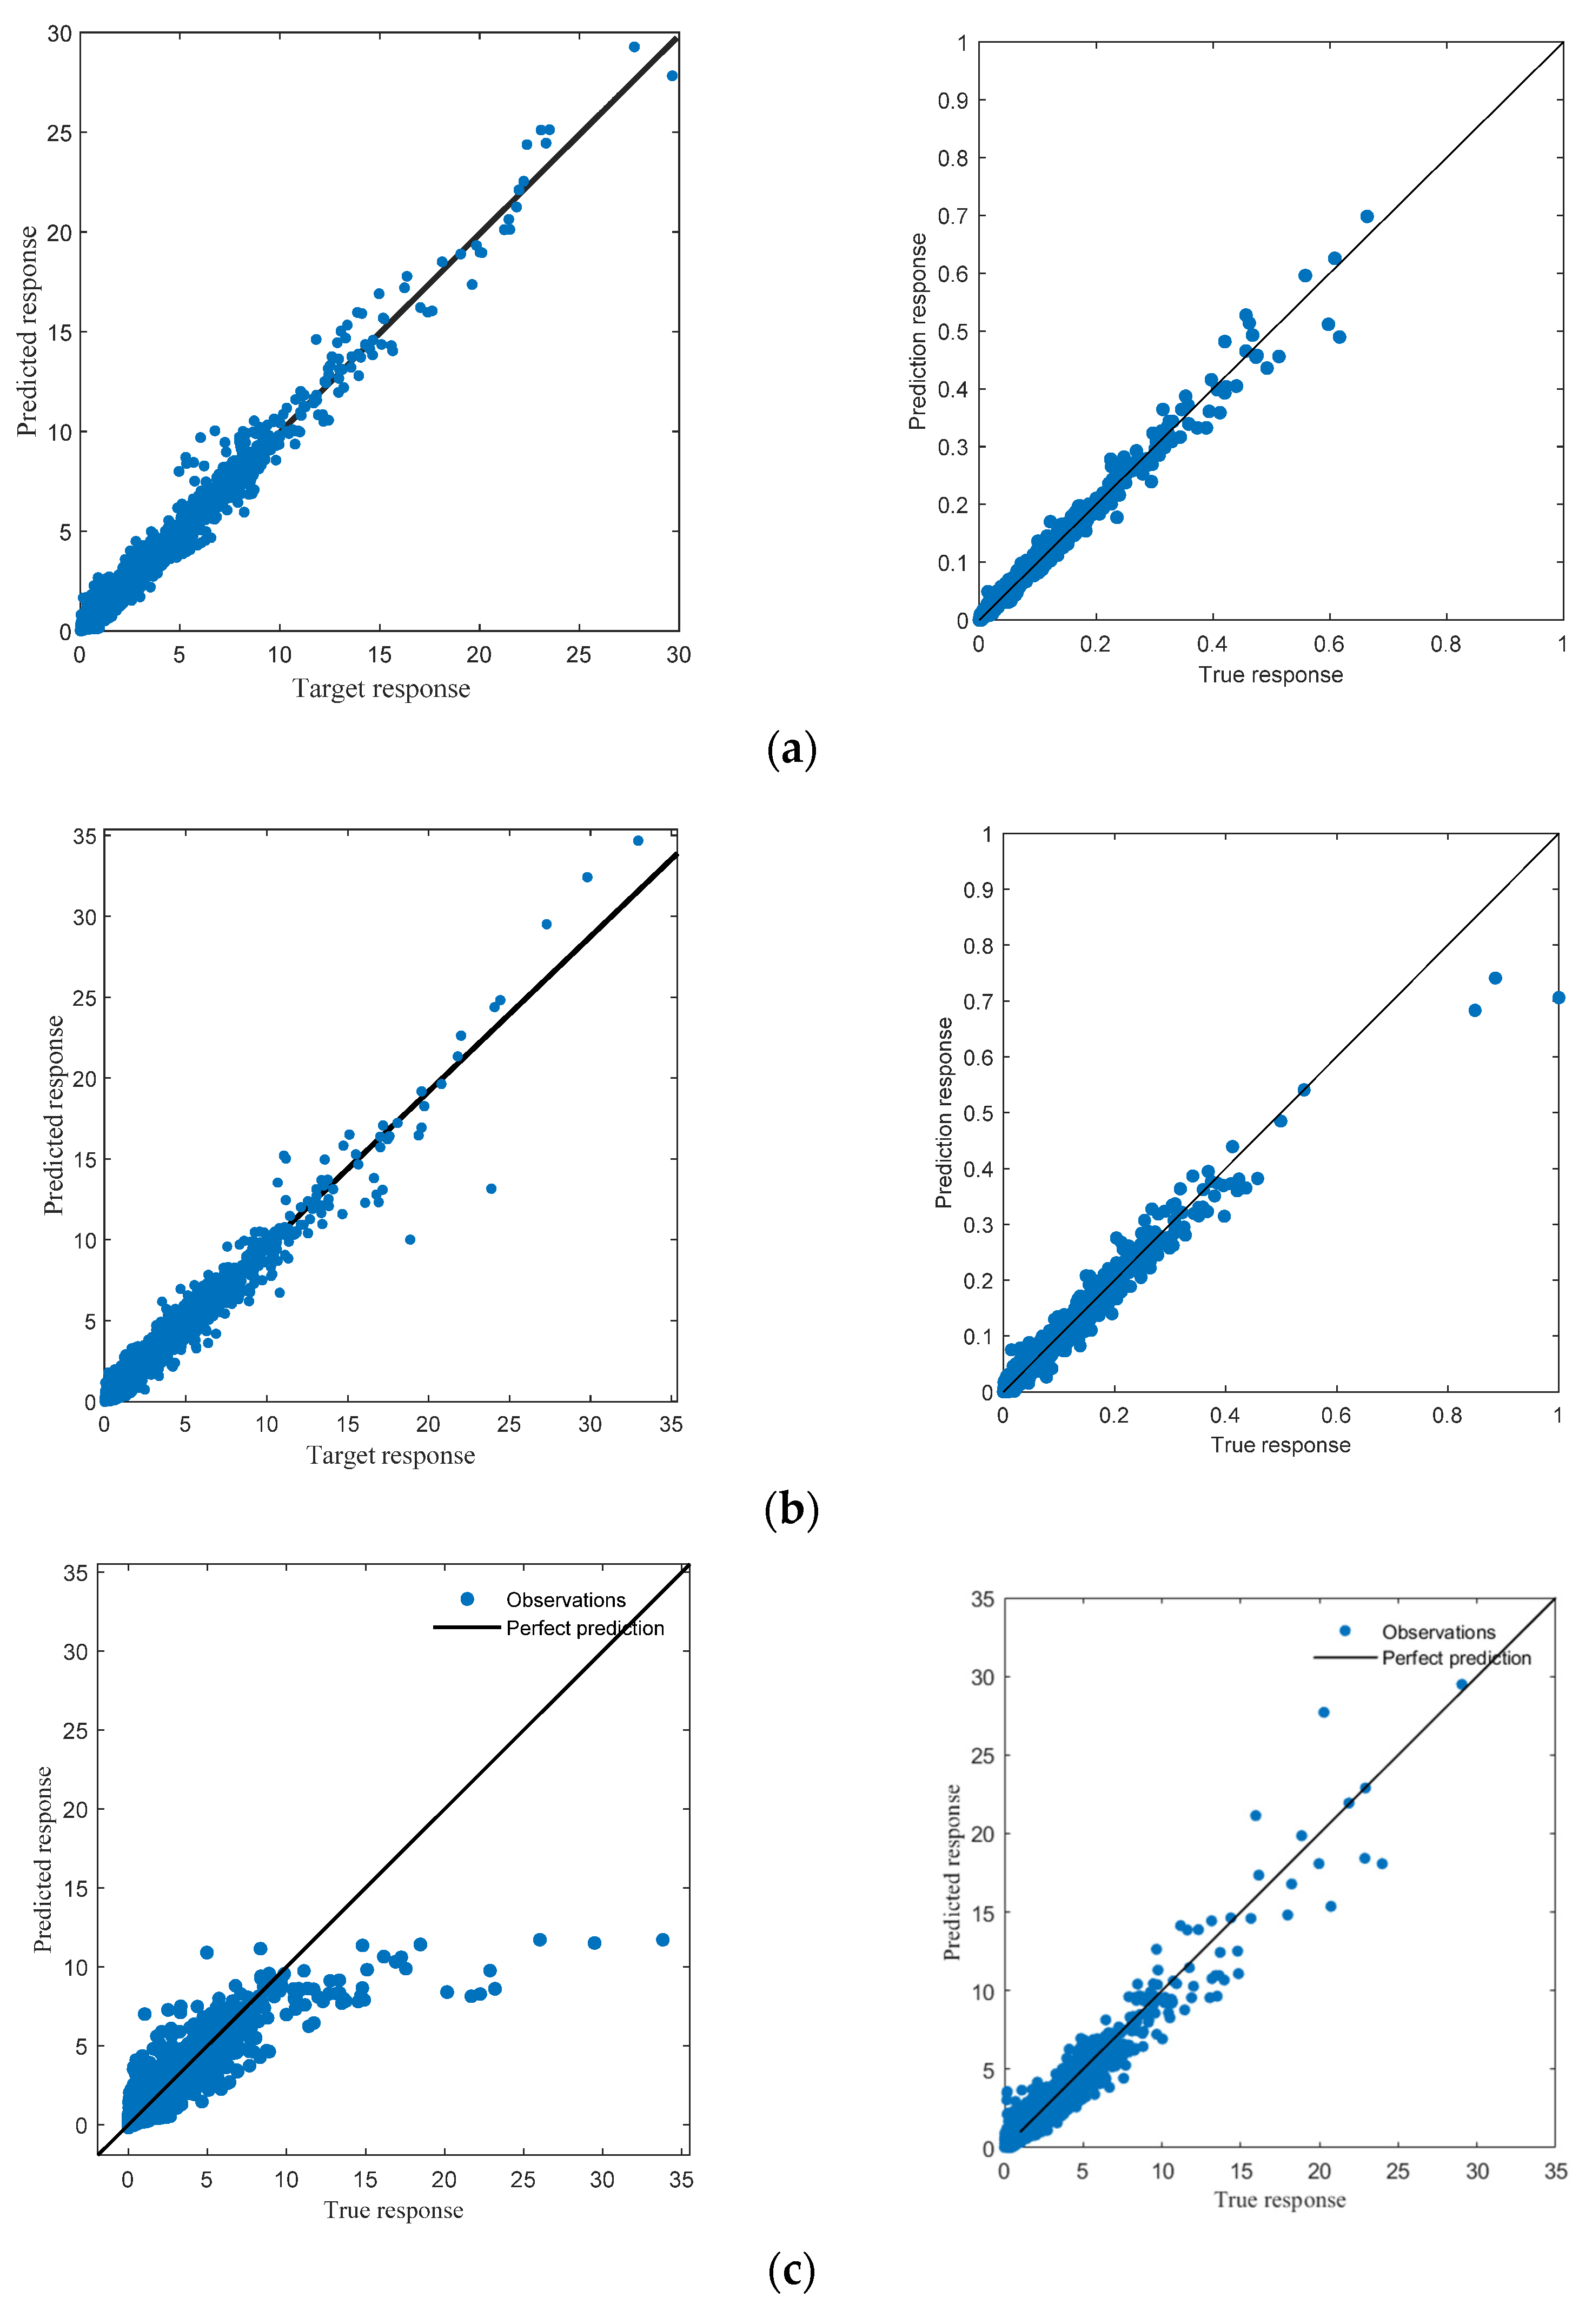
2.2. Machine Learning Model

The machine learning models developed for predicting ground vibrations induced by pile driving activities are based on Artificial Neural Networks (ANNs) and the XGBoost algorithm, each offering distinct advantages. ANNs are well suited for modeling complex, nonlinear interactions but require larger datasets and more training time. In contrast, XGBoost is an efficient tree-based ensemble method that handles smaller datasets effectively and offers improved interpretability through feature importance metrics. Both models were trained using Python V.3.11.
The architecture of the ANN model was adapted based on the soil profile complexity and the output type (PPV or frequency content). For PPV prediction, a single hidden layer with three neurons was used for the homogeneous soil profile. For the two-layer profile, the network had a single hidden layer with six neurons. For the three-layer profile, a two-hidden-layer structure was adopted, with six and five neurons in the first and second layers, respectively.
For frequency content prediction, more complex architectures were necessary. For the homogeneous soil profile, the ANN had three hidden layers with nine, five, and three neurons. For the two-layer profile, the hidden layers included 10, 5, and 3 neurons. In the case of the three-layer profile, three hidden layers were also used, with 153, 1, and 4 neurons, respectively.
These architectures were selected after iterative testing to optimize performance in terms of RMSE and R2 for each soil configuration and output type.
The input features used to train the ANN models included pile diameter, penetration depth, hammer drop height, and the geotechnical parameters of each soil layer: shear wave velocity, Poisson’s ratio, damping ratio, and thickness. These were selected for their influence on wave propagation and ground response.
The fitting training algorithm applied was the Levenberg–Marquardt method, which was chosen due to its fast convergence properties and proven effectiveness in training moderate-sized neural networks.
The learning datasets were divided into training, testing, and validation sets. For the primary model configuration, a ratio of 70% training, 10% testing, and 20% validation was adopted. To explore the effect of data partitioning, seven scenarios with varying ratios were also assessed, as shown in Table 2 and Figure 2. The Levenberg–Marquardt algorithm was used for ANN training due to its efficiency in moderate-sized networks. For the XGBoost model, hyperparameter tuning was performed.
Additionally, the normalization of the input parameters was applied prior to training the ANN models to account for the varying scales of the input data (e.g., wave velocities in m/s, damping as a unitless ratio). Normalization was used to enhance model training efficiency and convergence. In contrast, no normalization was applied to the input parameters of the XGBoost model, as this algorithm is not sensitive to feature scaling due to its tree-based structure.
The predictive accuracy of the ANN model was evaluated using normalized RMSE and R2 values, as reported in Table 3. For homogeneous and single-layer soil profiles, the ANN achieved high accuracy, with normalized RMSE values typically below 0.05 and R2 values exceeding 0.99 for PPV predictions. In more complex soil conditions (e.g., two-layer or three-layer profiles), slightly lower performance was observed—particularly for frequency content—though the R2 values generally remained above 0.93.
The normalized RMSE and R2 for the output peak particle velocity (PPV) and frequency content are presented in Table 3 for both ANNs and XGBoost. All values are presented using consistent numerical formatting to facilitate clear comparisons across training, testing, and validation datasets. This ensures that comparisons across training, testing, and validation sets are presented uniformly. Table 3 presents the normalized RMSE and R2 values for the ANNs and XGBoost models’ prediction of PPV and frequency content in different soil profiles.
As shown in Figure 3, the ANN model shows high RMSE and R2 metrics but struggles to accurately predict high vibration levels, which are evaluated near the excitation force where the nonlinearity of the soil is high. This behavior can be attributed to the limited number of data points representing that specific zone in the database, which results in less reliable model predictions. However, this has minimal practical impact, as higher vibration levels are confined to a reduced distance around the pile. Conversely, XGBoost excels in predicting these nonlinear zones due to its tree-based approach to understanding the dataset.
A similar analysis can be conducted in relation to the response in the frequency domain. As shown in Table 3, the results highlight a clear distinction between the performance on the validation sets and the test set, indicating that both models effectively mitigated overfitting. However, the R2 value for the ANN model remains below 0.9, suggesting potential limitations in its generalization capability, particularly under increased complexity. Complementarily, Figure 4 provides a scatter plot comparison of the ANN and XGBoost model predictions, further illustrating their respective performances.

2.3. User-Friendly Graphical Interface

A standalone software tool, ZBZBAT V.1, was developed to integrate the ANNs and XGBoost models for predicting ground vibrations. The interface simplifies user interaction by allowing the input of pile properties (diameter and penetration depth), hammering properties (drop height), and soil profile (shear wave velocity, Poisson’s ratio, damping ratio, and layer thickness). Users can also specify evaluation points for responses in the frequency domain.
It should be clarified that the soil profile is also an input to the machine learning models. The input features include shear wave velocity, Poisson’s ratio, damping ratio, and the thickness of each soil layer, which are entered by the user through the GUI. These parameters reflect the layered configuration and allow the model to differentiate between homogeneous, single-layered, and two-layered soil profiles.
The tool includes vibration limits based on widely used international standards and provides an option to assess mitigation measures like open trenches. The interface displays outputs such as peak particle velocity (PPV) and frequency spectra, offering real-time visualizations of predicted vibration levels (see Figure 5).
This figure displays the graphical user interface (GUI) of the ZBZBAT standalone software tool, which integrates the trained machine learning models (ANNs and XGBoost) for ground vibration prediction. The interface allows users to input critical parameters, including the pile diameter, penetration depth, hammer drop height, and geotechnical properties of each soil layer, such as shear wave velocity, Poisson’s ratio, damping ratio, and layer thickness. Users can define specific evaluation points for vibration prediction in both time and frequency domains. The tool also includes modules for visualizing output responses such as peak particle velocity (PPV) and frequency spectra, and it offers an option to assess mitigation strategies (open trench). International vibration limit references are incorporated to assist in compliance checking. The design of the GUI emphasizes accessibility for practitioners by simplifying complex predictive processes into an intuitive workflow.

3. Experimental Validation

This section presents the experimental validation of the proposed prediction tool, with the objective of assessing its reliability for the rapid estimation of ground vibrations induced by pile driving. The experimental campaign was conducted in Porto, Portugal, with the test configuration and site-specific details comprehensively documented in [23]
Figure 6 presents the experimental validation of the machine learning models, demonstrating a strong correlation between the measured data and the predictions obtained from both the numerical model and the XGBoost algorithm across all evaluated distances. In contrast, the ANN model exhibits a tendency to overestimate vibration levels in proximity to the excitation source.
The ANN’s overestimation for distances below or equal to 5 m stems from its single-model approach, which struggles with the limited data points collected at short distances compared to the broader spatial domain. This imbalance skews its predictions, particularly in the nonlinear zone close to the pile. In contrast, XGBoost excels by constructing sub-models for different data groups, which allows it to capture localized behavior effectively, resulting in a better fit for experimental data near the pile.
Furthermore, the accuracy metrics from the analysis may be misleading due to the sparse representation of data near the pile, diminishing its influence on overall accuracy. This explains why the metrics in Table 3 seem robust for both algorithms, despite the potential inaccuracies in the ANN’s predictions.
Additionally, the discussion is expanded by incorporating typical empirical prediction models, specifically those proposed by [9] and the Federal Railroad Administration [10], with results presented in Figure 6. In this particular case, a reasonable correlation was found between the experimental data and the upper limit of the FTA methodology, whereas the remaining curves tend to underestimate the PPV, especially at larger distances. However, the key issue is the significant variability in the vibration levels predicted by different empirical models. Without additional information, selecting a reliable expected value becomes challenging, potentially forcing decision-makers to consider a wide range of values, which, in some cases, can be highly penalizing for the chosen construction method.

4. Conclusions

Vibrations on the ground surface induced by the pile driving process using an impact hammer are a significant phenomenon requiring careful control. This paper presents a user-friendly prediction tool for expedited ground vibration assessment, based on machine learning algorithms, specifically XGBoost and Artificial Neural Networks (ANNs).
The experimental validation demonstrates the success of the presented tool in rapidly and accurately predicting ground-borne vibrations. Although the ANN model performs well overall, it shows some limitations in predicting vibration levels near the pile. Conversely, the XGBoost exhibits superior performance due to its tree-based structure, effectively handling complex interactions and nonlinear relationships.
The developed tool offers a practical solution for engineers and practitioners by enabling quick estimations of ground vibration levels during the early phases of project planning and design. Its ability to simulate a wide variety of pile–soil–hammer configurations, evaluate mitigation measures such as open trenches, and provide output in both PPV and frequency domains significantly enhances the decision-making process. Moreover, the built-in widely accepted vibration standards facilitate risk assessment and support the selection of construction techniques that minimize effects on surrounding structures and sensitive zones.
Finally, the standalone program is available for download to be used by other researchers and technicians for quick and accurate ground vibration predictions.

Author Contributions

Conceptualization, A.M.A., A.C. and P.A.C.; methodology, A.M.A., A.C. and P.A.C.; software, A.M.A. and A.C.; validation, A.M.A. and A.C.; resources, P.A.C.; writing—original draft preparation, A.M.A.; writing—review and editing, A.C. and P.A.C.; visualization, A.M.A. and A.C.; supervision, A.C. and P.A.C. All authors have read and agreed to the published version of the manuscript.

Funding

This work was financially supported by funding—UID/04708 of the CONSTRUCT—Instituto de I&D em Estruturas e Construções—as funded by Fundação para a Ciência e a Tecnologia, I.P./MCTES through the national funds; by national funds through the FCT/MCTES (PIDDAC), under the project PTDC/ECI-EGC/3352/2021—IntRAIL—Intelligent prediction tool for ground-borne noise and vibrations induced by railway traffic; Individual Grant No. 2022.11639.BD; Individual Grant no. 2022.00898. CEECIND (Scientific Employment Stimulus—5th Edition) provided by FCT (10.54499/2022.00898.CEECIND/CP1733/CT0005).Vibration 08 00017 i001

Data Availability Statement

The user-friendly prediction tool can be downloaded after requesting it via the following link: https://sites.google.com/view/zbzbat/home, accessed on 1 September 2024.

Conflicts of Interest

The authors declare no conflict of interest.

References

  1. Rausche, F.; Beim, J. Analyzing and Interpreting Dynamic Measurements Taken During Vibratory Pile Driving; GRL Engineers Technical Report; Testing and Design Methods for Deep Foundations: Kanazawa, Japan, 2012; pp. 123–131. [Google Scholar]
  2. Deckner, F.; Guillemet, C.; Viking, K.; Hintze, S. Instrumentation system for ground vibration analysis during sheet pile driving. Geotech. Test. J. 2015, 38, 893–905. [Google Scholar]
  3. Deckner, F.; Viking, K.; Hintze, S. Wave Patterns in the Ground: Case Studies Related to Vibratory Sheet Pile Driving. Geotech. Geol. Eng. 2017, 35, 2863–2878. [Google Scholar] [CrossRef]
  4. Cleary, J.C.; Steward, E.J. Analysis of Ground Vibrations Induced by Pile Driving and a Comparison of Vibration Prediction Methods. DFI J. J. Deep Found. Inst. 2017, 10, 125–134. [Google Scholar]
  5. Bayındır, C. Effects of ground water table and ground inclination on train induced ground-borne vibrations. TWMS J. Appl. Eng. Math. 2019, 9, 735–746. [Google Scholar]
  6. Bayındır, C.; Namlı, B. Efficient Sensing of Von KáRmáN Vortices Using Compressive Sensing. Comput. Fluids 2021, 226, 104975. [Google Scholar] [CrossRef]
  7. Bayındır, C.; Alan, A.R. Efficient sensing of ground-borne vibrations induced by pile driving using compressive sampling. TWMS J. Appl. Eng. Math. 2022, 12, 24–33. [Google Scholar]
  8. Madheswaran, C.; Sundaravadivelu, R.; Boominathan, A.; Natarajan, K. Response of ground during pile driving. J. Inst. Eng. (India) Part CV Civ. Eng. Div. 2005, 86, 22–27. [Google Scholar]
  9. Attewell, P.B.; Selby, A.R.; O’Donnell, L. Estimation of ground vibration from driven piling based on statistical analyses of recorded data. Geotech. Geol. Eng. 1992, 10, 41–59. [Google Scholar] [CrossRef]
  10. Federal Railroad Administration (FTA). Department of Transportation Federal Transit Administration; Federal Railroad Administration: Washington, DC, USA, 2018. [Google Scholar]
  11. Colaço, A.; Ferreira, M.; Alves Costa, P.A. Empirical, experimental and numerical prediction of ground-borne vibrations induced by impact pile driving. Vibration 2023, 5, 80–95. [Google Scholar] [CrossRef]
  12. Serdaroglu, M. Nonlinear Analysis of Pile Driving and Ground Vibrations in Saturated Cohesive Soils Using the Finite Element Method. Ph.D. Thesis, University of Iowa, Iowa City, IA, USA, 2010. [Google Scholar]
  13. Masoumi, H.; Degrande, G.; Lombaert, G. Prediction of free field vibrations due to pile driving using a dynamic soil–structure interaction formulation. Soil Dyn. Earthq. Eng. 2007, 27, 126–143. [Google Scholar]
  14. Masoumi, H.; François, S.; Degrande, G. A non-linear coupled finite element–boundary element model for the prediction of vibrations due to vibratory and impact pile driving. Int. J. Numer. Anal. Methods Geomech. 2009, 33, 245–274. [Google Scholar] [CrossRef]
  15. Khoubani, A.; Ahmadi, M. Numerical study of ground vibration due to impact pile driving. Proc. Inst. Civ. Eng.-Geotech. Eng. 2014, 167, 28–39. [Google Scholar] [CrossRef]
  16. Rooz, A.; Hamidi, A. A numerical model for continuous impact pile driving using ale adaptive mesh method. Soil Dyn. Earthq. Eng. 2019, 118, 134–143. [Google Scholar] [CrossRef]
  17. Singh, T.N.; Singh, V. An intelligent approach to prediction and control ground vibration in mines. Geotech. Geol. Eng. 2005, 23, 249–262. [Google Scholar] [CrossRef]
  18. Hung, C.; Ni, S. Using multiple neural networks to estimate the screening effect of surface waves by in-filled trenches. Comput. Geotech. 2007, 34, 397–409. [Google Scholar] [CrossRef]
  19. Monjezi, M.; Ghafurikalajahi, M.; Bahrami, A. Prediction of blast-induced ground vibration using artificial neural networks. Tunn. Undergr. Space Technol. 2011, 26, 46–50. [Google Scholar] [CrossRef]
  20. Connolly, D.; Kouroussis, G.; Giannopoulos, A.; Verlinden, O.; Woodward, P.K.; Forde, M.C. Assessment of railway vibrations using an efficient scoping model. Soil Dyn. Earthq. Eng. 2014, 58, 37–47. [Google Scholar]
  21. Colaço, A.; Alves Costa, P.; Mont’Alverne Parente, C.; Silva Cardoso, A. Ground-borne noise and vibrations in buildings induced by pile driving: An integrated approach. Appl. Acoust. 2021, 179, 108059. [Google Scholar]
  22. Abouelmaty, A.M.; Colaço, A.; Fares, A.; Ramos, A.; Alves Costa, P.A. Integrating Machine Learning Techniques for Ground Vibration Prediction in Pile Driving Activities. Comput. Geotech. 2024, 176, 106784. [Google Scholar] [CrossRef]
  23. Colaço, A.; Abouelmaty, A.M.; Alves Costa, P.A. Ground-borne vibrations induced by impact pile driving: Experimental assessment and mitigation measures. Earthq. Eng. Eng. Vib. 2023, 22, 105–115. [Google Scholar] [CrossRef]
Figure 1. Schematic representation of the pile driving system.
Vibration 08 00017 g001
Figure 2. Root mean square error (RMSE) for different dividing ratios of the ANNs.
Vibration 08 00017 g002
Figure 3. Predicted vs. observed values for PPV: (a) homogeneous halfspace soil model; (b) one single layer on a halfspace soil model; (c) two layers on a halfspace soil model, (left: ANNs; right: XGBoost model).
Vibration 08 00017 g003
Figure 4. Predicted vs. observed values for response in the frequency domain: (a) homogeneous halfspace soil model; (b) one single layer on a halfspace soil model; (c) two layers on a halfspace soil model, (left: ANNs; right: XGBoost model).
Vibration 08 00017 g004
Figure 5. ZBZBAT computer software interface.
Vibration 08 00017 g005
Figure 6. Model’s experimental validation (Attwell et al. (1992) [9]; FTA [10]).
Vibration 08 00017 g006
Table 1. Learning database input parameters.
ItemUnitHomo. SoilSingle Layer on a Half-SpaceTwo Layers on a Half-Space
MaxMinMaxMinMaxMin
1st level
Shear wave velocitym/s200602006020060
Layer thicknessmInf.154154
Damping ratio-0.020.080.020.080.020.08
Poisson’s ratio-0.490.250.490.250.490.25
2nd level
Shear wave velocitym/sN/A *800200800200
Layer thicknessmN/AInf.63
Damping ratio-N/A0.040.020.020.04
Poisson’s ratio-N/A0.490.250.490.25
3rd level
Shear wave velocitym/sN/AN/A800600
Layer thicknessmN/AN/AInf.
Damping ratio-N/AN/A0.02
Poisson’s ratio-N/AN/A0.3
* N/A: Not Applicable.
Table 2. Case scenarios of the dividing ratio for the ANN database.
SetUnit Case Scenario Number
1234567
Training%40505560704540
Validation%30202030202525
Testing%30302520103035
Table 3. Normalized RMSE and R2 from the ANNs and XGBoost models.
Soil ProfileTraining ModelNormalized RMSE × 10−3 (R2)
Training SetTesting SetValidation Set
PPVFreq.PPVFreq.PPVFreq.
Homo. soilANNS0.030 (0.996)3.0 (0.992)0.028 (0.996)2.7 (0.992)0.027 (0.993)2.9 (0.99)
XGBoost0.5 (0.97)0.007 (0.95)0.5 (0.97)0.004 (0.97)0.4 (0.966)0.004 (0.97)
Single layer on a half-spaceANNS0.042 (0.994)2.8 (0.989)0.042 (0.994)2.8 (0.985)0.044 (0.995)2.9 (0.99)
XGBoost0.76 (0.98)0.006 (0.97)0.7 (0.97)0.007 (0.97)0.65 (0.97)0.007 (0.97)
Two layers on a half-spaceANNS0.048 (0.93)4.0 (0.88)0.048 (0.92)3.8 (0.88)0.042 (0.93)3.6 (0.88)
XGBoost0.035 (0.94)0.017 (0.94)0.034 (0.95)0.015 (0.94)0.039 (0.93)0.013 (0.95)
Disclaimer/Publisher’s Note: The statements, opinions and data contained in all publications are solely those of the individual author(s) and contributor(s) and not of MDPI and/or the editor(s). MDPI and/or the editor(s) disclaim responsibility for any injury to people or property resulting from any ideas, methods, instructions or products referred to in the content.

