Abstract
In order to address the issue of vibration, it is crucial to accurately measure the vibration distribution. The authors previously developed the one-pitch phase analysis (OPPA) method, which allows for rapidly capturing the three-dimensional shape of a flat object. By integrating this method into a system, an OPPA vibration distribution measurement system was created, utilizing a line light source consisting of LEDs or optical fibers and also a high-speed camera to measure the vibrations of three-dimensional objects without physical contact. To further extend the application of the OPPA method to larger objects, such as cars, in this paper, a new system is introduced using a commercially available projector using a liquid crystal display (LCD) instead of a liner light source and a glass grating. This new system, which employs an ultra-short throw projector, is highly sensitive in displacement measurements and provides a wide-area analysis. These kinds of projectors produce noises at the frequency of the cooling fan and the refresh rate of the LCD. However, in this study, these noise sources were also examined. The capabilities of the new system are demonstrated through its application to the measurement of vibrations in a car door and an engine head. The measurement system and examples of its application are presented.
1. Introduction
It cannot be emphasized enough how significant vibration analysis is to the stability and security of structures and machines. For instance, the vibrations caused by the construction of subways and tunnels not only induce discomfort but also have detrimental effects on one’s health. In severe cases, ground subsidence can occur, leading to serious damage. Vibrations in buildings and infrastructure can significantly impact their longevity and strength. Furthermore, vibrations of machines can lead to mechanical failures and structural damage over time, which can be a safety hazard, particularly in cars and devices that are used in sensitive environments, such as medical equipment, and in the aerospace field. On the positive side, vibrations can be employed to assess the soundness of these components and to develop solutions for vibration-related issues.
The measurement of vibrations is primarily carried out using a variety of contact and non-contact vibrometers, such as accelerometers [1,2,3], eddy current displacement sensors [4], capacitive acceleration sensors [5], and laser displacement sensors [6]. By analyzing the change in amplitude over time at a single measured point, frequency analysis can be performed to determine the resonance frequencies.
While these single-point measurement methods can provide information about a specific location, it is necessary to measure the distribution of a vibration at multiple points to truly understand the location of the maximum amplitude (antinode), minimum amplitude (node), vibration mode at resonance, and vibration transmission. As an example, by analyzing the vibration distribution, engineers can identify areas on the surface of a device that experience high levels of vibration and they can take corrective actions to prevent failures and ensure the longevity of the device. This measurement requires a multitude of single-point measurement sensors or repeated measurements at different sensor locations, which is time-consuming and costly. It also requires specialized knowledge to analyze the data.
Although numerical methods, such as the finite element method (FEM), are widely used for measuring the whole-surface vibration of specimens [7,8,9], they can be very inaccurate in the hands of an inexperienced engineer. Therefore, scientists are turning to experimental approaches as a trustworthy alternative. There is already research and commercialization of the laser Doppler method [10] and Polytec’s laser Doppler vibrometers, which can scan a single point at high speed, but cannot perform simultaneous measurements over a large surface area. Additionally, they cannot measure transient phenomena. While a multi-point synchronous optical vibration tester (Polytec MPV-800) is available that can examine the distribution simultaneously, it is limited by a maximum of 48 channels and is also an extremely expensive option.
Furthermore, there exists another approach to simultaneously obtaining distribution measurements: the image correlation method [11]. However, this method is known to be time-consuming and is restricted to a limited range of objects.
Recently, the authors developed a vibration distribution measurement method based on the one-pitch phase analysis (OPPA) method [12,13,14], which uses grating projection to simultaneously analyze vibrations at hundreds of thousands of points on the surface. This method enables the measurement of vibration distributions, including transient phenomena, that cannot be measured by doing one-point measurements, repeatedly. Additionally, this developed method is non-contact, which makes it faster, more accurate, easier to implement, and cost-effective compared to the previously mentioned methods. With its ability to perform the measurement simultaneously, the OPPA method has proven to be a valuable tool in the field of vibration analysis.
Specifically for cars, as mentioned before, vibration analysis is necessary to ensure their safety, performance, and comfort, and to improve their reliability and longevity. For analyzing car vibrations, Davies and Jones utilized electric speckle pattern interferometry (ESPI) to assess the vibration modes of the engine and doors [15,16]. Beeck and Hentschel [17] further used not only ESPI but also holographic interferometry to visualize interference fringes during vibration. However, these methods only reveal the mode at the set frequency, but not the full spectrum; thus, the mode at the resonance frequency cannot be obtained. Moreover, the interference fringes are displayed but the accuracy of the quantitative analysis is rough. In 2002, Castellini utilized a laser Doppler vibrometer (TLDV) to examine the vibrations of tires, timing belts, and wipers [18]. However, their analysis was limited to one-point measurements and did not encompass the distribution of the observed surface. In 2009, Oliver and Schuessler used a combination of a 3D laser Doppler vibrometer and a robot to study the vibration distribution of a car body [19]. Although they performed frequency analysis, their approach was not suitable for analyzing transient phenomena as the time synchronization was not obtained at all points due to the scanning process. In 2018, Ozana et al. performed a vibration analysis utilizing a pulsed Doppler radar; however, they only presented a single-point analysis [20]. In contrast, Fu et al. [21] in 2021, arranged 16 laser Doppler vibrometers (LDVs) in a line and conducted simultaneous measurements on a car body to obtain the distribution along the line, but failed to capture the distribution on the surface. Besides all these non-contact optical methods, researchers also used numerical methods for whole-surface vibration analysis of cars [22,23,24]. Developing an accurate numerical model can be challenging due to the complexity of a car’s structure and the variety of materials used in its construction. Small errors or variations in the input data or assumptions used in the model can result in significant inaccuracies in the predicted vibration behavior of the car.
In this study, we employed the vibration distribution analyzer developed by the authors, which is based on the OPPA method, to measure the vibration distribution on the surface of the door and engine of a car. The measurement was conducted by rapidly changing the engine from idle to full throttle. To the best of our knowledge, this is the first time that such a vibration mode measurement has been performed in a car vibration investigation.
To measure the vibration distribution on the surface of the door and engine of a car, an ultra-short throw projector, which is a special commercially available projector for presentations, was used instead of the linear light source using LED and optical fiber. This allowed for the measurement of small amplitudes and expanded the scope of application for the OPPA method. The results of applying the analyzing setup to the vibration measurement of the car door and engine head are reported, along with the discussion of a method for eliminating the noise from the air-cooling fan used in the equipment. Finally, a laser displacement meter was used for verification of the proposed system. The outline of this paper is as follows: In Section 2, we discuss the steps toward the whole-surface shape and vibration measurement through the theory of the OPPA method. The experimental setup is addressed in Section 3, and the results along with the evaluations are discussed in Section 4. The whole study is discussed and concluded in Section 5 and Section 6, respectively.
2. Principle of Shape Measurement and Vibration Analysis Using the OPPA Method
In order to perform a highly accurate height analysis, image processing is applied to the grating projection method to analyze the phase of the grating and the phase of moiré fringes, and to obtain the displacement (height) of the surface to be measured. In this method, the reference grating and the deformed grating are photographed separately by the same optical system, the phases of the obtained reference grating image and the deformed grating image are analyzed, and the phase difference of the moiré fringes is obtained. The equi-phase surface of this moiré fringe represents the contour line [25]. Since the relationship between phase and height is determined by the dimensional parameters of the optical system, measurements can be obtained theoretically or experimentally.
In previous studies, the principle of the OPPA method was reported [12,13,14]. In this study, the generalized principle is newly introduced in Section 2.2.
2.1. Phase Analysis of Projected Gratings Using the OPPA Method
Figure 1a presents a schematic of the optical system used in moiré topography which is a type of grating projection method [26]. As shown in Figure 1b, the grating pattern is projected onto the reference plane, and in Figure 1c, the same pattern is projected onto the object. The distortion of the grating lines is proportional to the height variations of the object. Figure 1d displays the phase distribution of this distorted grating pattern.
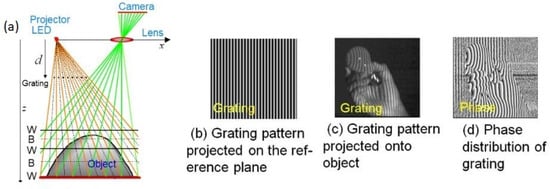
Figure 1.
Optical system for grating projection method.
Figure 2a shows the grating images taken by dividing one cycle into N times (in this case, N = 9) at equal intervals and shifting the phase of the projected grating. Figure 2b depicts the intensity distribution of the central horizontal line of the obtained grating image. The blue crosses in Figure 2a,b indicate changes in the point on the right end of the central horizontal line shown in Figure 2a. In the phase shift method [27,28], the phase is obtained by analyzing the temporal change in the brightness of these blue crosses for one cycle. Phase analysis can also be performed using red dot brightness data, which the OPPA method in this paper uses. The first point of blue color and the first point of red color (the left end) differ by one cycle, so they have the same phase value. In other words, the phase can be obtained by analyzing the brightness data of the blue crosses and the brightness data of the red points. In the phase shift method, which analyzes the brightness data of the blue crosses, the spatial resolution is good because it only analyzes the information of one point, but the object should not move during one cycle of obtaining the data. On the other hand, in the case of the OPPA method, the data of the red points are obtained from only one image, so the time resolution is good, and even moving objects can be measured if a grating image can be captured. However, since it uses N different pixels of data, the spatial resolution is poor. Because the phase shift method uses N times the amount of data, the accuracy is generally better.
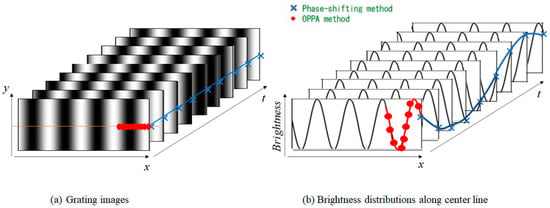
Figure 2.
Phase-shifted grating pattern during one cycle. (a) Grating images; (b) Brightness distributions along center line.
Even if the brightness distribution is not cosine-shaped, it can be analyzed in the same manner as if it were a cosine wave. This is achieved by Fourier transforming the brightness distribution, extracting frequency 1, and then performing an inverse Fourier transform, resulting in a cosine-shaped pattern.
In this study, the phase analysis of the grating does not involve a direct Fourier transform. Instead, the same effect is achieved by using the following formula (Equation (1)), which is derived from the N brightness values ( to N) obtained for one cycle. The phase value at the center position of the N data is then calculated.
2.2. Shape Analysis
The OPPA method utilizes the moiré topography optical system depicted in Figure 1 for shape measurement. Figure 3 is an illustration that explains the optical system of Figure 1a and how it relates the grating’s phase to the height of the object. The light source’s position, represented by L, serves as the origin and the x-, y-, and z-axes are orthogonal coordinate axes. The x-axis and y-axis are parallel to the grating plane, with the x-axis being the direction from the light source to the center of the camera lens, the y-axis being the direction perpendicular to the x-axis, and the z-axis being perpendicular to the grating plane. As is shown in the figure, the reference plane is parallel to the grating plane. “p” represents the length of one grating pitch on the grating plane (), “d” is the distance from the light source to the grating plane, “” is the length of one grating pitch on the reference plane (), “” represents the z coordinate of the reference plane, which is parallel to the grating plane, and “v” is the x-directional distance (LV) between the light source and the camera lens center. When the object to be measured is positioned, the surface point S is reflected onto a pixel on the camera’s imaging surface, appearing as point R on the reference surface. The camera line of sight, represented by a straight line connecting the camera pixel, S point, and R point is depicted in Figure 3. The x-coordinate of point R is designated as , while the x-coordinate of point S is designated as . and represent the straight lines extending from the light source “L” and passing through the point on the grating plane where the phase is zero () and the point with one cycle change in phase, compared to (). “” and “” are x-coordinates of and , respectively. Similarly, the intersections of the straight lines “” and “” with the surface being measured are referred to as “” and “”, and their x-coordinates are noted as “” and “”, respectively.
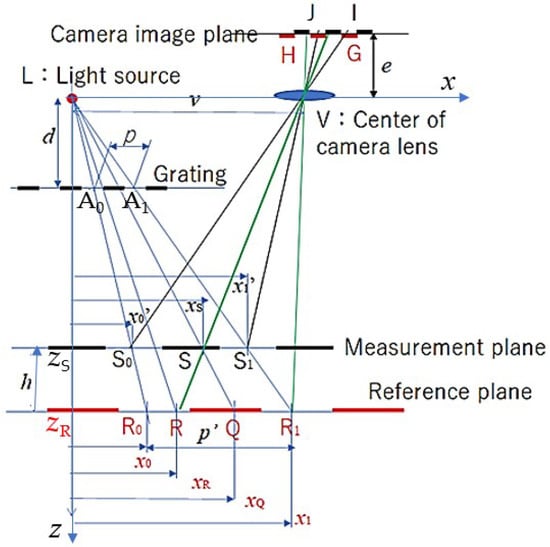
Figure 3.
Explanatory schematic optical system used for shape measurement with the grating projection method.
In this optical system, the width of the projected grating, or the length of one grating pitch, remains constant on the camera’s imaging plane, independent of the height of the measurement plane. By adjusting the number of pixels in one grating pitch to an integer value N, the number of pixels in one grating pitch of the object’s image remains unchanged, even if the height “h” of the object changes. The accuracy of the Fourier transform is consistently maintained using the intensity data and only the phase of the grating varies with changes in height. The concept of height measurement is explained in detail in the following paragraphs.
On the reference plane, the phases of the points and of the projected grating are 0 and 2, respectively, and the phase of point R is given by Equation (2).
Assuming that the surface to be measured exhibits only minute displacements and tilts, and that points S, , and on the surface are located on a plane parallel to the reference plane, the phase of the grating projected onto the measurement target plane at point S () can be similarly derived using Equation (3). Based on the mentioned assumptions the phase amount at point Q (4) which is the intersects of the reference plane and the line passing through points L and S, would be equal to .
Equation (5) is derived through the principle of proportionality and makes it possible to calculate the phase difference between and with ease through the use of Equation (6).
Since the triangles SRQ and SVL are similar, Equation (7) can be derived and, using that the value of , can be calculated as shown in Equation (8).
Finally, the relation between the phase difference () between the phase on the object plane and the phase on the reference plane at each pixel, and the height (h) of the object plane from the reference plane can be expressed through Equation (9). It is worth noting that the relation between the phase difference () and the height (h) remains constant for all pixels, regardless of the x and y coordinates.
When analyzed using image processing, the phase is limited to the range between − and + or 0 to +2. To account for this limitation, the value of H in Equation (10) is obtained by substituting 2 for the phase difference in Equation (9), and it is referred to as the dynamic range.
The phase analysis in the OPPA method can be carried out with a high level of accuracy, ranging from 1/100 to 1/1000 of the dynamic range. The dynamic range (H) can be adjusted to either increase the measurement range or improve the measurement accuracy. Due to this fact, in order to obtain the most accurate results, as the amplitude of vibration is usually small, it is best to choose a small value for H.
2.3. Vibration Analysis Method
A customized software according to the theory of the OPPA method was produced with LabVIEW by the authors. Using that, grating images are projected onto an object under vibration. With the use of a high-speed camera, images of the object are captured over a specified period of time. The phases of the grating images are then analyzed one by one, using the OPPA method, leading to the determination of the height distribution. Focusing on each pixel of the camera, the temporal change of its height is obtained and a Fourier transform is performed to derive the spectrum of power and phase with respect to the frequency. The resulting power and/or height distribution for each frequency is displayed for all pixels. Using these results, the resonance frequency would be the local maximum frequency, marked by the maximum value of power and/or a sudden jump in the phase. By obtaining the power and phase distributions at each resonance frequency, the natural vibration modes can be determined.
In this paper, this method is applied to the vibration analysis of an automobile’s door and engine head.
3. Experimental Setup
Although the OPPA method has been previously reported for vibration analysis [14], the device used an optical fiber as a light source. For measuring cars, a high-brightness projector is necessary as the measurement area is large and requires a powerful projector. Hence, a vibration distribution analyzer was manufactured using a commercially available, high-brightness, ultra-short-throw projector (EPSON EB685W) typically used for presentations on a wall. This allows for the expansion of the under-analyzed area and increases the variety of vibrating objects even when the distance from the reference plane to the light source () is small, as depicted in Figure 3. This option will increase the resolution of analyzing by decreasing the amount of H. To support this capability, a super wide-angle camera lens (Theia MY125M with a focal length of 1.3 mm) was utilized. Using this lens, for a equal to 360 mm, the measurement area recorded by the camera (Basler acA640-750 um) was 850.7 × 638.0 mm2.
Figure 4a,b display the measurement system when used to analyze the vibration of a car door and engine. The mentioned projector is employed to project light onto the driver’s door on the left side of the car and a portion of the fender. However, these types of projectors tend to heat up during use and are equipped with air-cooling fans, which can generate noise that will affect the recorded frames. Additionally, the projector’s use of a liquid crystal for grating projection can also result in noise through its refresh frequency. To mitigate these effects, the same measurement is taken when the object is not vibrating, and the noise frequency of the measurement device is evaluated beforehand. For instance, the rotation frequency of the air-cooling fans and the refresh frequency of the liquid crystal display were both set to 60 Hz, causing a significant amplitude noise at that frequency. However, the impact of this frequency can be minimized by ignoring its effect.
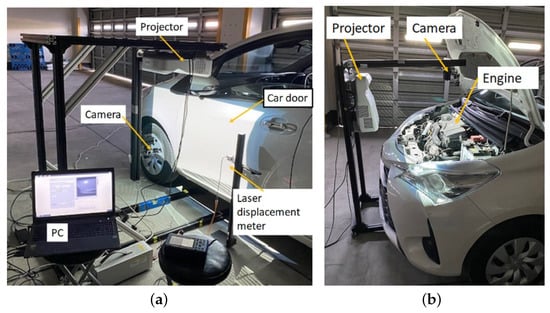
Figure 4.
Vibration measurement systems. (a) For door; (b) For engine.
Table 1 shows the specifications of the vibration distribution measurement system using an ultra-short throw projector. These amounts can be easily readjusted each time according to the size of the object and the required accuracy.

Table 1.
Specification of vibration distribution measurement system.
As is shown in Figure 4a, the analysis was performed on a white Toyota Vitz passenger car. The transient vibration when the engine was idle and when the accelerator was fully pressed was measured for 10 s, and 4800 shots were captured at a rate of 480 fps for the same duration. Fourier transform was applied to the images and a frequency analysis was conducted with the resolution of 0.1 Hz. The maximum analyzed frequency is theoretically limited by the Nyquist frequency, which is half the sampling frequency. In the present experiment, the sampling frequency was 480 fps, which means the maximum analyzed frequency in this method was 240 Hz. However, if a higher frequency analysis is required (for example, when the device is vibrating at higher frequencies), a camera with a higher frame speed will be needed.
4. Results
4.1. Vibration Distribution Measurement of Car Door
Based on Figure 4a, simultaneous measurements were taken of one door beside the passenger seat and part of the fender of the car. Figure 5 displays a captured image of the car door in the “brightness intensity graph” window, along with the height measurement data in the “height distribution graph” window. The height, power, and phase distributions are displayed in pseudo-color in the following figures and are indicated by the color bar on the right side of the figures. It is important to note that these values are determined by considering the maximum value for each image, so they differ from figure to figure. As a result, the height distribution of the car door shown in the figure displays all zero values (green), representing the height from the reference time (frame zero represents the recorded image before vibration, which is the same as the reference image). The two graphs at the bottom of the figure demonstrate the temporal changes in brightness and height at a single point located in the pixel position of and (indicated by the intersection of the cursor lines in the upper left of the figure).
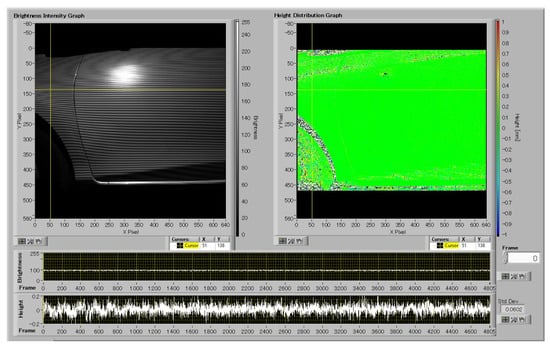
Figure 5.
Grating image and height distribution of the car door.
It should also be noted that near the center of the upper part, secularly reflected light from the projector enters the camera sensor, causing halation, which makes accurate analysis difficult for that part.
Figure 6 displays the power and phase distributions at 55 Hz, obtained by Fourier analysis of the height amounts at each point. The upper left of the figure showcases the “power distribution” window, while the “phase distribution” is also visible on the right side. The lower two waveforms represent the power and phase spectrums (logarithmic representation) of the point indicated by the cursor. The analysis shows that 55 Hz is the local peak when the engine is in operation, which is considered the first resonance frequency. The zoomed power waveform located at the bottom right of Figure 6 further illustrates this finding.
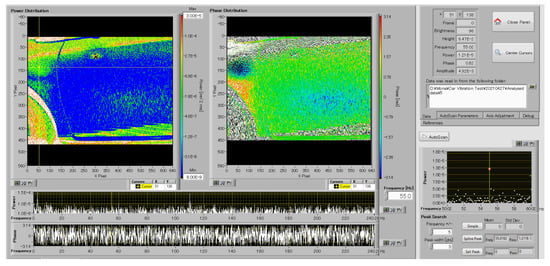
Figure 6.
Power and phase distributions at the first resonance frequency of car door vibration.
The power distribution provides valuable insights into the vibration of the door and fender at the same time. The central part of the door sways at the same phase, while a node position is observed in the fender area.
The second resonance frequency can also be detected at 110 Hz. However, there was a possibility that the detected peaks were a result of the projector noise that was mentioned previously. To verify this, we examined the power spectra at those frequencies when the engine was turned off. Figure 7 provides a detailed illustration of the results of this investigation.
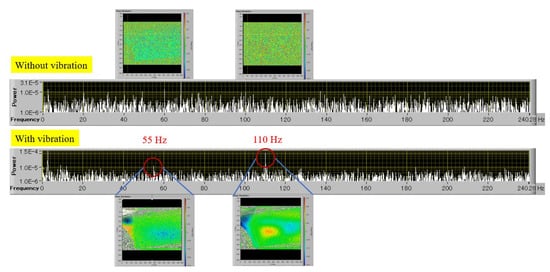
Figure 7.
Comparison of car door vibration modes with and without vibration.
In Figure 7, the extracted phase distribution data in the position of potential resonance frequencies are shown in the lower waveforms at 55 and 110 Hz. The same phase distributions were also extracted at the same frequencies while the engine was off. As is shown in the upper phase distributions, no information is detectable at these specific frequencies, indicating that the lower phase data were generated in the resonance frequencies and were not related to projector noises. Of course, the resonance frequencies differ in the fender area, as previously shown in Figure 6.
4.2. Vibration Distribution Measurement of Car Engine
In order to analyze the vibration behavior of the car engine head, which is largely in the horizontal plane, the optical axis of the projector and camera was directed almost in parallel to the vertical axis with an approximate tilt of 5 degrees due to the tilting of the engine head (Figure 4b). Frequency analysis of the engine was able to be performed despite being covered with black plastic which results in low reflectance and poor contrast in the captured images. The brightness and height distribution of the analyzed engine during vibration are displayed in Figure 8, in which the front of the car is located on the upper side.
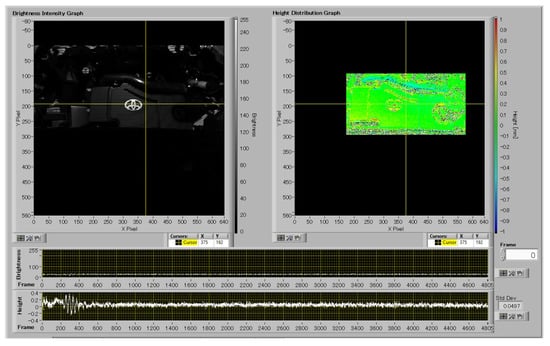
Figure 8.
Brightness and height distributions of engine head during vibration.
The height data collected from all pixel points were used to calculate the power and phase distributions. Furthermore, the potential resonance frequencies were checked by comparing the results obtained when the engine was off. This process confirmed frequencies of 12, 55, 110, and 220.1 Hz as the actual resonance frequencies of the engine in the pixel position of and . The intricate details of this process can be viewed in Figure 9.
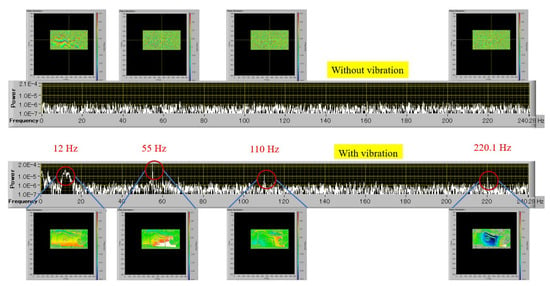
Figure 9.
Comparison of car engine vibration modes with and without vibration.
4.3. Verification Using Laser Displacement Meter
In order to verify the accuracy of the OPPA vibration measurement system in measuring frequencies, a comparison was made with the results obtained using a laser displacement meter (Fastus CD22M-15), as shown in Figure 4a. During the experiment, a single pixel point near the position of the laser point was selected and analyzed using the proposed system. The results are shown in detail in Figure 10, which compares the peak positions (resonance frequencies) of both methods and confirms the accuracy of the OPPA system in measuring vibrations across the entire surface.
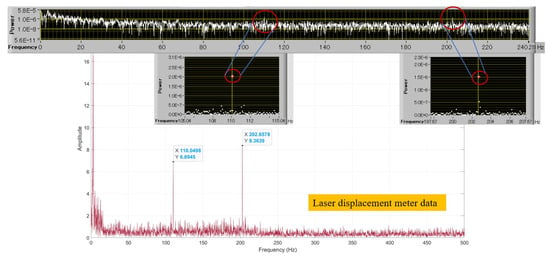
Figure 10.
Comparison of vibration frequency modes measured by OPPA vibration analyzer and laser displacement meter.
5. Discussion
In this study, we conducted a comprehensive analysis of the whole-surface vibration behavior in a car door and engine head using 10-second imaging and an ultra-short throw projector. The use of an ultra-wide angle lens did result in a decrease in accuracy at the edges of the screen due to aberrations; however, this was not a significant issue in the analysis of vibration, as the reference plane was captured using the same system. To enhance the resolution of height measurement, we modified the x-directional distance between the light source and the camera lens center (v) based on Equation (10). This improvement made the system ideal for measuring vibrations with a small amplitude.
The analyzed frequency modes were differentiated from the noise signals of the projector through a separate analysis before and after vibration. The effect of the cooling fans and the refresh frequency of the LCD was mainly concentrated at 60 Hz. However, The power was fairly small compared to those with vibrating, as shown in Figure 7 and Figure 9. We also validated our results using a laser displacement meter to measure the vibration frequencies at a random point on the car surface.
The results of this study demonstrate the effectiveness of this method in investigating the movement behavior of the door and the engine head during vibration, which was not possible as a whole-surface investigation method in previous studies. This information can be extremely useful for car maintenance and offers a new approach to analyzing vibration behaviors in other vibrators. In the future, it would be interesting to compare the results from both healthy and non-healthy cars.
6. Conclusions
In this paper, the authors successfully developed a new method that allows for the non-contact, simultaneous, and efficient measurement of the vibration distribution on the entire surface of the car door and engine. This method uses a high-brightness, high-precision grating projected onto the object with the aid of a commercially available ultra-short-throw projector. The results show that the frequency modes appeared at 55 Hz and 110 Hz, and 12 Hz, 55 Hz, 110 Hz, and 220.1 Hz in the specific pixel points of the car door and engine head, respectively. The whole-surface phase and power spectrum made it possible to investigate the distribution of the vibration on the surface of the door and engine during 10 s of analysis. Using a laser displacement meter on a random location on the surface of the car door, the frequency of vibration was calculated to be 110.0 Hz and 202.6 Hz, which confirmed our findings using the newly developed OPPA system. This visualization made it easier to investigate the root cause of the vibration and implement effective countermeasures. Additionally, this method offers the advantage of being able to analyze transient phenomena by synchronizing all pixel points without the need for repeated measurements.
Author Contributions
Conceptualization, Y.M.; methodology, M.Y. and Y.M.; software, M.Y.; validation, M.Y.; formal analysis, M.Y.; investigation, M.Y.; resources, Y.M.; data curation, M.Y.; writing—original draft preparation, M.Y. and Y.M.; writing—review and editing, M.Y., Y.M. and Y.T.; visualization, M.Y.; supervision, Y.M. and Y.T. All authors have read and agreed to the published version of the manuscript.
Funding
This research was generously supported by the 2014 Manufacturing, Commerce, and Service Innovation Subsidy. We also received valuable guidance from Harutaka Koike (former Kawasaki Heavy Industries Research Institute engineer, former Okayama University professor) and Yoshihisa Honda (former Kinki University professor). Also, part of the software programming and testing was completed with the support of 4D Sensor Inc. members. Our sincerest gratitude goes out to them.
Data Availability Statement
The data presented in this study are available on request from the corresponding author.
Conflicts of Interest
The authors declare no conflict of interest.
References
- Sabato, A.; Niezrecki, C.; Fortino, G. Wireless MEMS-based accelerometer sensor boards for structural vibration monitoring: A review. IEEE Sens. J. 2016, 17, 226–235. [Google Scholar] [CrossRef]
- Xiong, C.; Lu, H.; Zhu, J. Operational modal analysis of bridge structures with data from GNSS/accelerometer measurements. Sensors 2017, 17, 436. [Google Scholar] [CrossRef] [PubMed]
- Ogawa, W.; Kuratani, F.; Yoshida, T.; Koide, T.; Mizuta, T. Effect of bell size on sound characteristics of cymbals. Trans. JSME 2020, 86, 19–00237. (In Japanese) [Google Scholar] [CrossRef]
- Zhao, G.F.; Ying, J.; Wu, L.; Feng, Z.H. Eddy current displacement sensor with ultrahigh resolution obtained through the noise suppression of excitation voltage. Sens. Actuators A Phys. 2019, 299, 111622. [Google Scholar] [CrossRef]
- Ota, S.; Yoshioka, H.; Murai, T.; Terumichi, Y. Fundamental study on identifying ground coil irregularities for magnetically levitated vehicles. Trans. JSME 2014, 80. (In Japanese) [Google Scholar] [CrossRef]
- Zhang, Z.; Feng, Q.; Gao, Z.; Kuang, C.; Fei, C.; Li, Z.; Ding, J. A new laser displacement sensor based on triangulation for gauge real-time measurement. Opt. Laser Technol. 2008, 40, 252–255. [Google Scholar] [CrossRef]
- Andersen, L.; Jones, C. Coupled boundary and finite element analysis of vibration from railway tunnels—A comparison of two-and three-dimensional models. J. Sound Vib. 2006, 293, 611–625. [Google Scholar] [CrossRef]
- Mao, Q.; Mazzotti, M.; DeVitis, J.; Braley, J.; Young, C.; Sjoblom, K.; Aktan, E.; Moon, F.; Bartoli, I. Structural condition assessment of a bridge pier: A case study using experimental modal analysis and finite element model updating. Struct. Control. Health Monit. 2019, 26, e2273. [Google Scholar] [CrossRef]
- Liang, X.; Ali, M.Z.; Zhang, H. Induction motors fault diagnosis using finite element method: A review. IEEE Trans. Ind. Appl. 2019, 56, 1205–1217. [Google Scholar] [CrossRef]
- Kudela, P.; Wandowski, T.; Malinowski, P.; Ostachowicz, W. Application of scanning laser Doppler vibrometry for delamination detection in composite structures. Opt. Lasers Eng. 2017, 99, 46–57. [Google Scholar] [CrossRef]
- Siebert, T.; Splitthof, K. Vibration analysis using 3D Image correlation technique. In Proceedings of the EPJ Web of Conferences, EDP Sciences. Poitiers, France, 4–9 July 2010; Volume 6, p. 11004. [Google Scholar]
- Morimoto, Y.; Masaya, A.; Ueki, M. High-speed 3D shape measurement by one pitch phase analysis method using brightness values in small square area of single-shot image. Opt. Lasers Eng. 2019, 113, 38–46. [Google Scholar] [CrossRef]
- Morimoto, Y.; Takagi, A.; Ueki, M.; Pirsig, L. Vibration modal analysis by high-speed and accurate shape measurement using one-pitch phase analysis method. In Proceedings of the Advancement of Optical Methods & Digital Image Correlation in Experimental Mechanics, Volume 3: Proceedings of the 2018 Annual Conference on Experimental and Applied Mechanics, Greenville, SC, USA, 4–7 June 2019; pp. 103–108. [Google Scholar]
- Morimoto, Y. High-speed measurement of shape and vibration: Whole-field systems for motion capture and vibration modal analysis by OPPA method. Sensors 2020, 20, 4263. [Google Scholar] [CrossRef]
- Jones, R.; Wykes, C. Holographic and Speckle Interferometry; Cambridge University Press: Cambridge, UK, 1989; p. 6. [Google Scholar]
- Atcha, H.; Tatam, R.P.; Buckberry, C.H.; Davies, J.C.; Jones, J.D. Surface contouring using TV holography. In Proceedings of the Fiber-Optic Metrology and Standards, SPIE, The Hague, The Netherlands, 12–14 March 1991; Volume 1504, pp. 221–232. [Google Scholar]
- Beeck, M.A.; Hentschel, W. Laser metrology—A diagnostic tool in automotive development processes. Opt. Lasers Eng. 2000, 34, 101–120. [Google Scholar] [CrossRef]
- Castellini, P.; Marchetti, B.; Tomasini, E.P. Scanning Laser Doppler Vibrometer for dynamic measurements on small-and microsystems. In Proceedings of the Fifth International Conference on Vibration Measurements by Laser Techniques: Advances and Applications, SPIE, Ancona, Italy, 18–21 June 2002; Volume 4827, pp. 486–492. [Google Scholar]
- Oliver, D.E.; Schuessler, M. Automated robot-based 3d vibration measurement system. Sound Vib. 2009, 43, 12–15. [Google Scholar]
- Ozana, N.; Bauer, R.; Ashkenazy, K.; Sasson, N.; Schwarz, A.; Shemer, A.; Zalevsky, Z. Demonstration of a Speckle Based Sensing with Pulse-Doppler Radar for Vibration Detection. Sensors 2018, 18, 1409. [Google Scholar] [CrossRef]
- Fu, Y.; Shang, Y.; Hu, W.; Li, B.; Yu, Q. Non-contact optical dynamic measurements at different ranges: A review. Acta Mech. Sin. 2021, 37, 537–553. [Google Scholar] [CrossRef]
- Kiani, M.; Gandikota, I.; Rais-Rohani, M.; Motoyama, K. Design of lightweight magnesium car body structure under crash and vibration constraints. J. Magnes. Alloy. 2014, 2, 99–108. [Google Scholar] [CrossRef]
- Boubaker, M.; Druesne, F.; Lardeur, P.; Barillon, F.; Mordillat, P. Uncertain vibration analysis of an automotive car body modeled by finite elements with the modal stability procedure. In Proceedings of the International Conference on Noise and Vibration Engineering (ISMA) and International Conference on Uncertainty in Structural Dynamics (USD), Leuven, Belgium, 17–19 September 2012. [Google Scholar]
- Tomioka, T.; Takigami, T.; Suzuki, Y. Numerical analysis of three-dimensional flexural vibration of railway vehicle car body. Veh. Syst. Dyn. 2006, 44, 272–285. [Google Scholar] [CrossRef]
- Zhang, S. High-speed 3D shape measurement with structured light methods: A review. Opt. Lasers Eng. 2018, 106, 119–131. [Google Scholar] [CrossRef]
- Gu, R.; Yoshizawa, T. Talbot projected 3D profilometry by means of one-step phase-shift algorithms. In Proceedings of the Intl Symp on Optical Fabrication, Testing, and Surface Evaluation, SPIE, Tokyo, Japan, 10–12 June 1992; Volume 1720, pp. 470–477. [Google Scholar]
- Surrel, Y. Fringe analysis. Photomechanics 2000, 77, 55–102. [Google Scholar]
- Wang, W.; Wong, Y.; Hong, G. 3D measurement of crater wear by phase shifting method. Wear 2006, 261, 164–171. [Google Scholar] [CrossRef]
Disclaimer/Publisher’s Note: The statements, opinions and data contained in all publications are solely those of the individual author(s) and contributor(s) and not of MDPI and/or the editor(s). MDPI and/or the editor(s) disclaim responsibility for any injury to people or property resulting from any ideas, methods, instructions or products referred to in the content. |
© 2023 by the authors. Licensee MDPI, Basel, Switzerland. This article is an open access article distributed under the terms and conditions of the Creative Commons Attribution (CC BY) license (https://creativecommons.org/licenses/by/4.0/).