Article

Examining the Impact of Rotated Neck and Trunk Postures on Vertical Seat-to-Head Vibration Transmissibility and Self-Reported Discomfort

by
Katie A. Goggins
1,*,
Elizabeth A. Kelly
1,2,
Taryn J. Thompson
1,3 and
Tammy R. Eger
1,4
1
Centre for Research in Occupational Safety and Health, Laurentian University, Sudbury, ON P3E 2C6, Canada
2
Bharti School of Engineering, Laurentian University, Sudbury, ON P3E 2C6, Canada
3
School of Biological, Chemical and Forensic Sciences, Laurentian University, Sudbury, ON P3E 2C6, Canada
4
School of Kinesiology and Health Sciences, Laurentian University, Sudbury, ON P3E 2C6, Canada
*
Author to whom correspondence should be addressed.
Vibration 2022, 5(2), 306-325; https://doi.org/10.3390/vibration5020018
Submission received: 31 December 2021 / Revised: 22 April 2022 / Accepted: 3 May 2022 / Published: 16 May 2022

Abstract

:
Adopting non-neutral sitting postures while exposed to whole-body vibration (WBV) can put heavy equipment operators at an increased risk for lower back pain and may cause damage to the spinal tissue. A laboratory experiment involving 11 participants (5 females, 6 males) completing four 45-min test sessions incorporating different seated conditions (vibration versus no vibration, and rotation versus no rotation) was used to assess seat-to-head transmissibility (STHT) and self-reported discomfort while in four rotated neck and trunk postures. The vibration exposure profile was a constant vertical sinusoidal signal with a frequency of 3 Hz and 0.7 m/s2 acceleration. Vibration measured at the head was greater than at the seat under all conditions, with a statistically significant effect of time (F1,10 = 101.73, p < 0.001, Eta2 = 0.910) and posture (F3,8 = 5.64, p = 0.023, Eta2 = 0.679). Mean self-reported discomfort ratings revealed increased participant discomfort in rotated neck and trunk positions in both vibration and non-vibration conditions. Increasing time also had a significant (F(1,10) = 15.53, p = 0.003) impact on higher rates of participant discomfort. Overall, it was found that increasing the degree of rotated neck and trunk position from neutral amplified the STHT and self-reported discomfort.

1. Introduction

Whole-body vibration (WBV) occurs when the vibration caused by machinery is transmitted to the machine operator, either through the seat or the feet [1]. Over 3.5 million US workers are exposed to WBV daily [2], and 9 million workers from Great Britain per week [3], with an estimated 4–7% of all employees in the United States, Canada, and some European countries being exposed to potentially harmful WBV [4]. A survey conducted on 2764 participants from the American Society of Safety Engineers resulted in 69.5% self-reporting a lower than basic comprehension of the principles of WBV exposure [5]. So not only are workers being exposed to WBV regularly, but they also appear not to be properly supported by their occupational health and safety professionals, who lack satisfactory WBV knowledge. From an industry point of view, lower back pain (LBP) and related back disorders cost more in lost time than other injuries [6,7]. The severity of the pain resulting from exposure to WBV is associated with the amount of time for which an individual cannot perform daily occupational tasks, so it stands to reason that the majority of research on WBV has focused on this area [6].
As vibration enters the body at the seat/buttock interface of an operator, it is further transmitted through the body and attenuated or amplified as it travels up the spine to the head. A change in seat-to-head transmissibility (STHT) could indicate that the mode of vibration transmission within the body has changed and may be indicative of increased injury risk [8]. Various postures (neutral, flexed, rotated) are thought to affect the STHT of WBV [9,10]. Studies have shown LBP to be more prevalent among drivers exposed to seated WBV while adopting twisted trunk or awkward postures [11,12,13,14,15,16]. In an evaluation of seated positions (i.e., different rotational postures and duration in the rotated postures) for operators of buses, locomotives, cranes, earth moving machines, and forklifts, a correlation was found between LBP, WBV, and the angle of rotation for different awkward positions [17]. Previous work also demonstrated that twisted postures in combination with WBV exposure between 1–20 Hz has been shown to result in decreased task and work performance in industrial vehicle operators [18].
The term posture in the WBV literature is used loosely [8], where it can mean changes in pelvic rotation/tilt [19,20], tension in the spine [10], use of a backrest support [21,22], use of armrests [18,23], slouching [24], flexed and extended trunk and hip positions [25], and rotated trunk and neck positions [12,17,18,26,27]. In a study using nine different pelvis and spine postures, there were peaks in apparent mass at 5 and 10 Hz and peaks in seat-to-pelvis pitch transmissibility at 12 Hz [20]. Similarly, the effects of changes in seated posture and vibration frequency of WBV on the musculature, seat-to-trunk transmission and STHT were found to differ [19]. At frequencies below 6 Hz, STHT was greater in the posterior pelvic tilt position, and above 6 Hz was greater in the anterior pelvic tilt position. Although the results of both studies identified a positive relationship between postural change and STHT, it was limited to changes in pelvic orientation.
The STHT has been measured in laboratory experiments simulating WBV exposure from a dozer machine [23] and railway vehicle [21]. In the dozer study, two sitting postures were used: one with the subject sitting in a standard posture supported by the seat back, and the second in a forward back-unsupported posture, where the arms were on their laps and their feet on a foot pedal while using the armrests or grasping the steering wheel [23]. The use of the backrest was found to significantly alter STHT. The unsupported seated posture (i.e., no backrest) had STHT that peaked at 2.5 Hz, and the supported seated posture (i.e., backrest) had STHT that peaked at 4.5 Hz. The use of the backrest in the railway study was also found to influence the resonant frequency, with vertical axis STHT shifting from 4 Hz without a backrest to 7.5 Hz with the backrest [21].
Previous research has shown that industrial vehicle operators are in fact frequently assuming rotated neck and trunk postures while exposed to WBV [12,14,17,28]. The frequency-weighted r.m.s. acceleration values for load-haul-dump (LHD) truck drivers have been reported to range from 3.15 to 4 Hz in the z-axis [29]. It was also established that vertical direction dominant frequencies ranged between 2 and 4 Hz, with the majority falling below 4 Hz [30]. Because the pelvic/spinal resonance has been reported to be 3–5 Hz [20,31], an increase in vibration transmissibility can be anticipated if the vibration frequency is kept within this range and, thus, higher frequency-weighted r.m.s. acceleration will be experienced at the head.
Research has also demonstrated a strong association between exposure to seated WBV and self-report discomfort in the neck and shoulder areas [6], with increased discomfort being reported in postures that involved a rotated neck position when compared to a neutral neck position [32]. Ratings of discomfort are a subjective measure reported by an individual, based on a numeric scale, and these are considered a preliminary sign of eventual injury [33]. The perceived rate of discomfort in conjunction with seated exposure to WBV has suggested that the amount of discomfort experienced by an individual is a function of the frequency, magnitude, and direction of the vibration exposure [22,34,35,36] and the seat [37]. The STHT from seated WBV exposure has been shown to have consistent correlations with self-reported discomfort measures [8,38], wherein a greater vibration transmission to the head was associated with the greater discomfort reported. Research on the differences in self-reported discomfort evaluated simultaneously with controlled trunk and neck rotated postures has been limited.
Current standards for evaluating health and WBV (i.e., EU Directive 2002/44/EC [39], ISO 2631-1 [1], British Standards Institution [40]) do not account for differences in STHT for non-neutral trunk and neck postures, which are common practice when driving heavy equipment [6]. Another limitation of the standards is that they do no capture discomfort levels, potentially a pre-cursor for injury, from non-neutral trunk and neck postures [32,34]. As such, the potential for adverse health effects or injury risk to operators may be underestimated. This study used a laboratory experiment to simulate four seated postures with neck and trunk rotation experienced in LHD vehicles to determine if there are differences in STHT and self-reported discomfort based on the degree of neck and trunk rotation.

2. Materials and Methods

2.1. Participants

Participants completed a questionnaire to gather information on previous WBV exposure experience and musculoskeletal disorder history within the last 6 months prior to participation in the study. Volunteers who reported a back, neck, or head injury in the last 6 months were excluded from the study. All participants gave informed consent, and the study was approved by Laurentian University’s Research Ethics Board. Eleven participants, 6 males ((mean ± standard deviation) age 24 ± 1.26 years, mass 76.8 ± 12.4 kg, and height 1.73 ± 0.104 m) and 5 females (age 22 ± 3.39 years, mass 78.4 ± 17.9 kg, and height 1.71 ± 0.076 m), were selected from a sample of convenience.

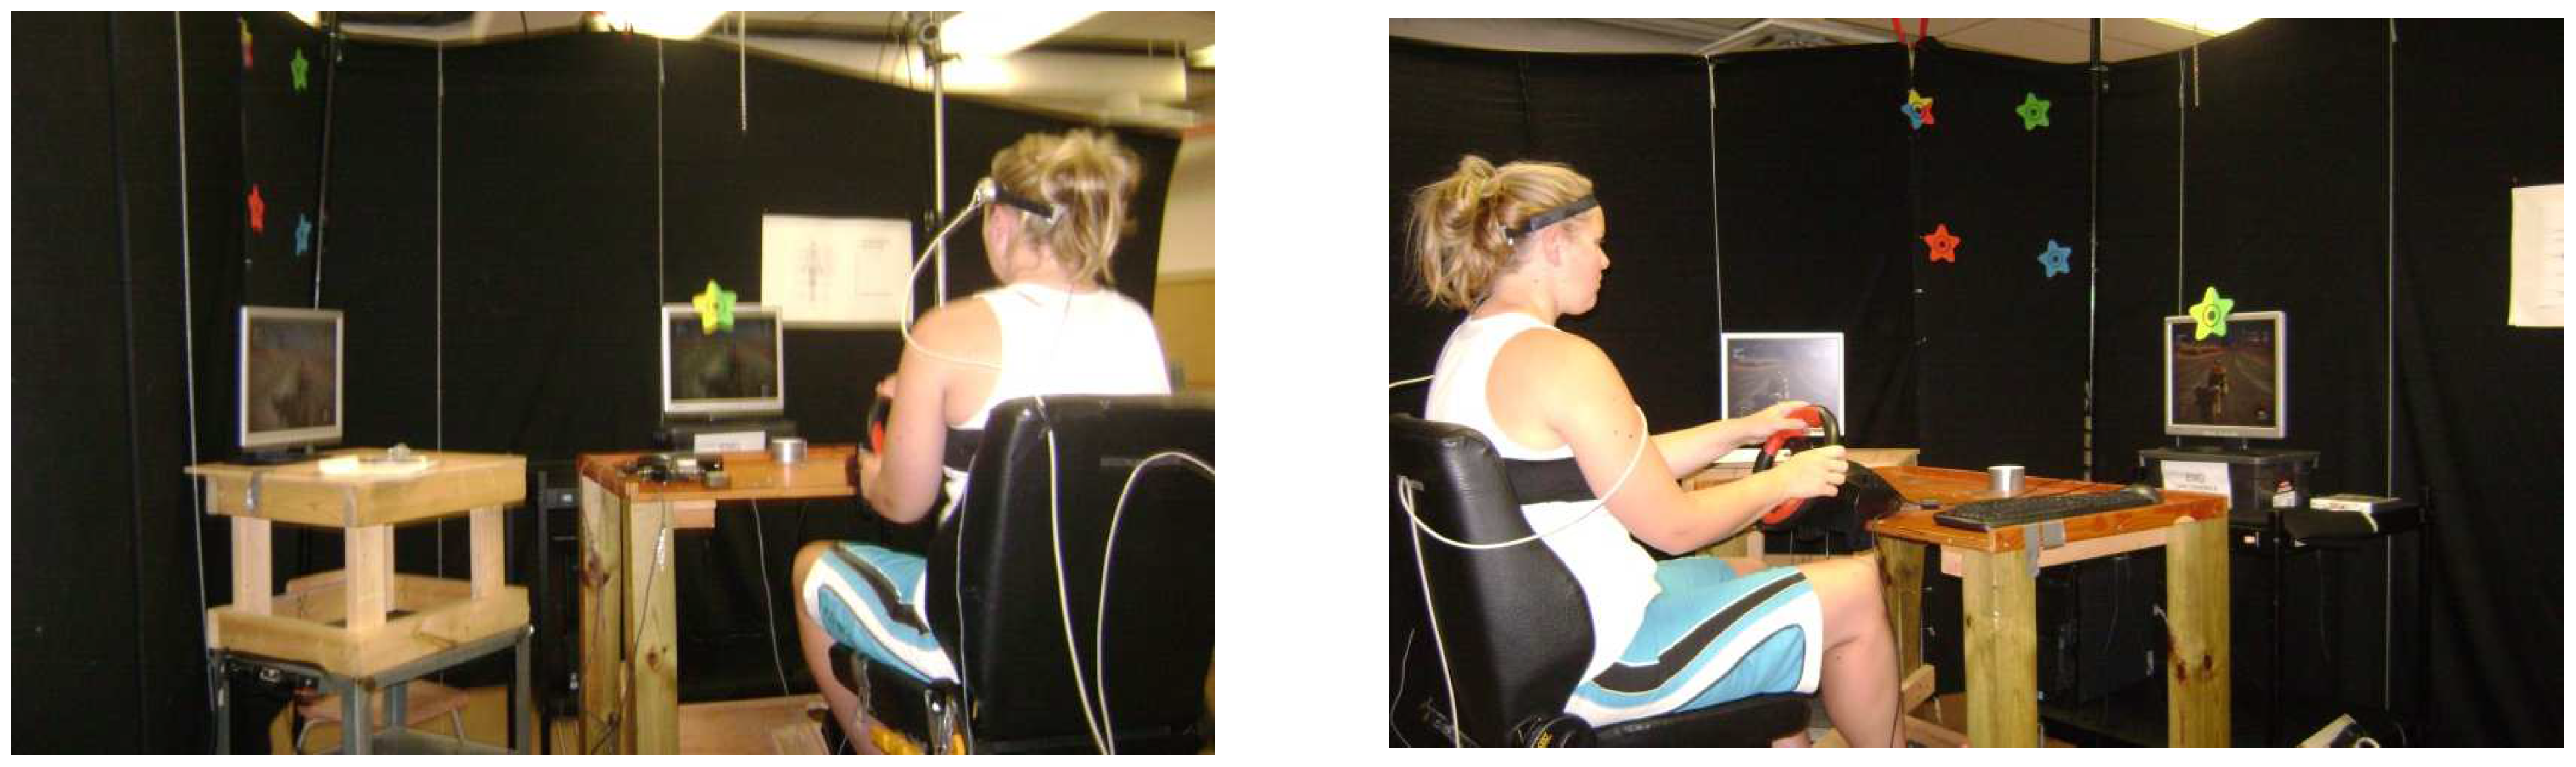
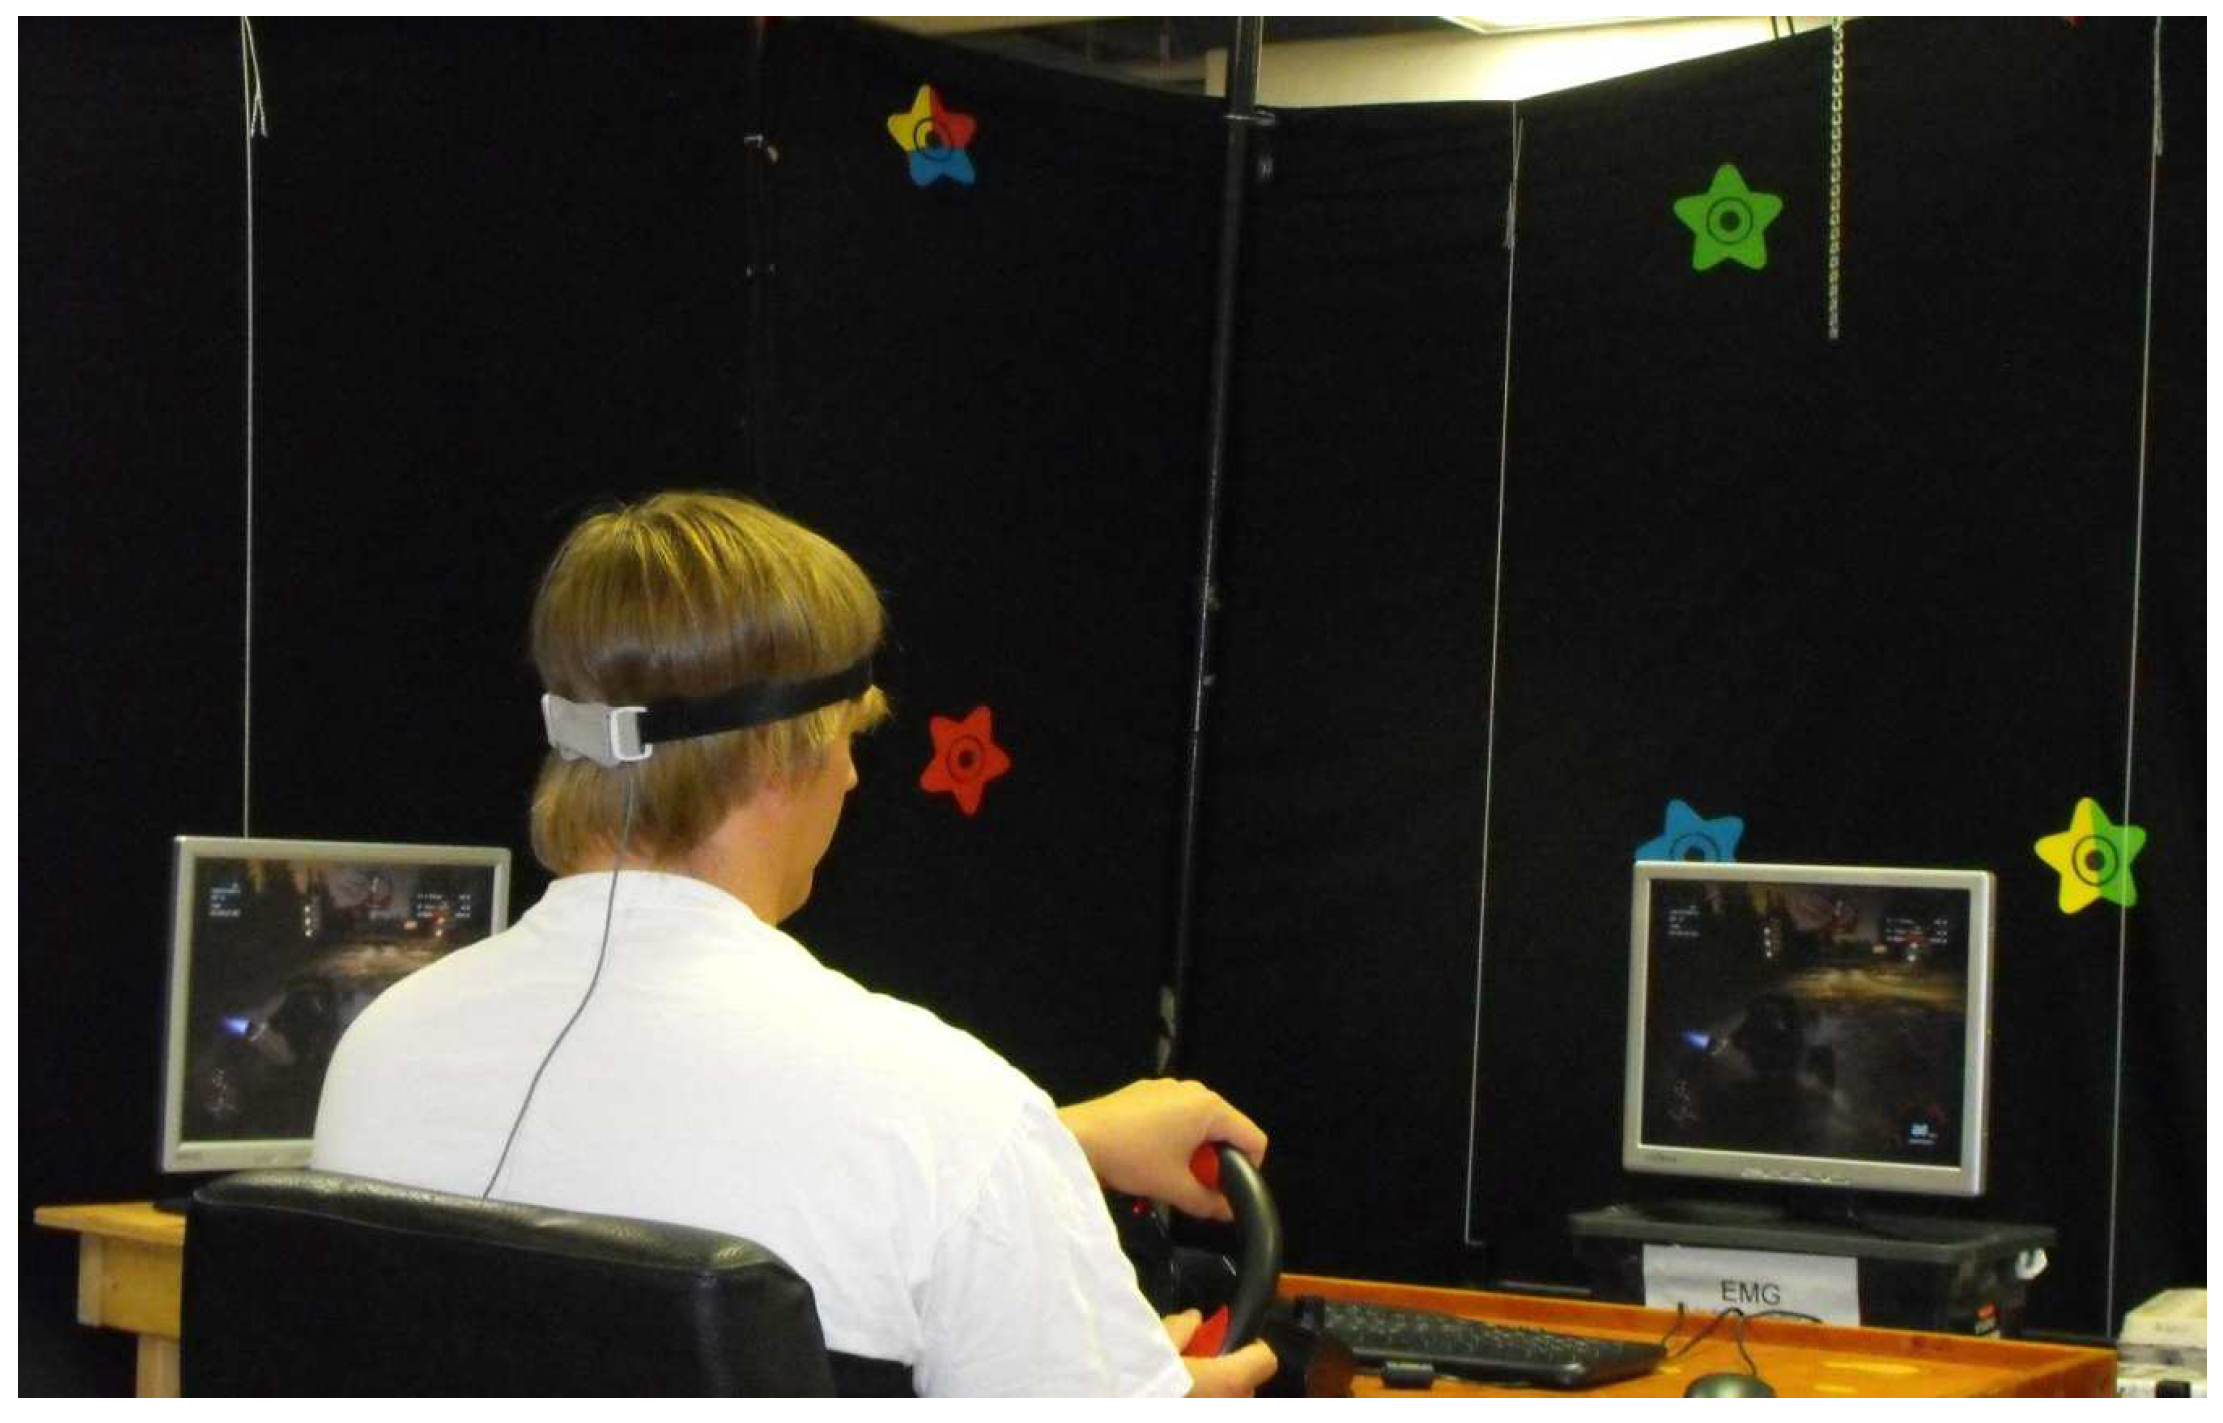
2.2. Experimental Set-Up

Vibration was measured at the seat-pan and head using accelerometers during exposure to WBV while adopting four different seated postures, and simulated driving using a steering wheel and foot pedal (Figure 1). Each participant attended four separate 1-h test sessions. The test sessions occurred at approximately the same time of day and were spaced a minimum of two days apart. Each session required a different condition: (1) seated in neutral posture without WBV, (2) seated in neutral posture with WBV, (3) seated in non-neutral postures without WBV, and (4) seated in non-neutral postures with WBV. The order of conditions was randomized for each participant. To control the five seated postures involving combinations of trunk and neck rotation, two lasers and five targets were used. Self-reported discomfort measurements were taken for each posture. A video game with two monitors was used to maintain the participants’ attention for the duration of the sessions. Specific details on the experimental set-up are described in the sections that follow.

2.2.1. WBV Simulator
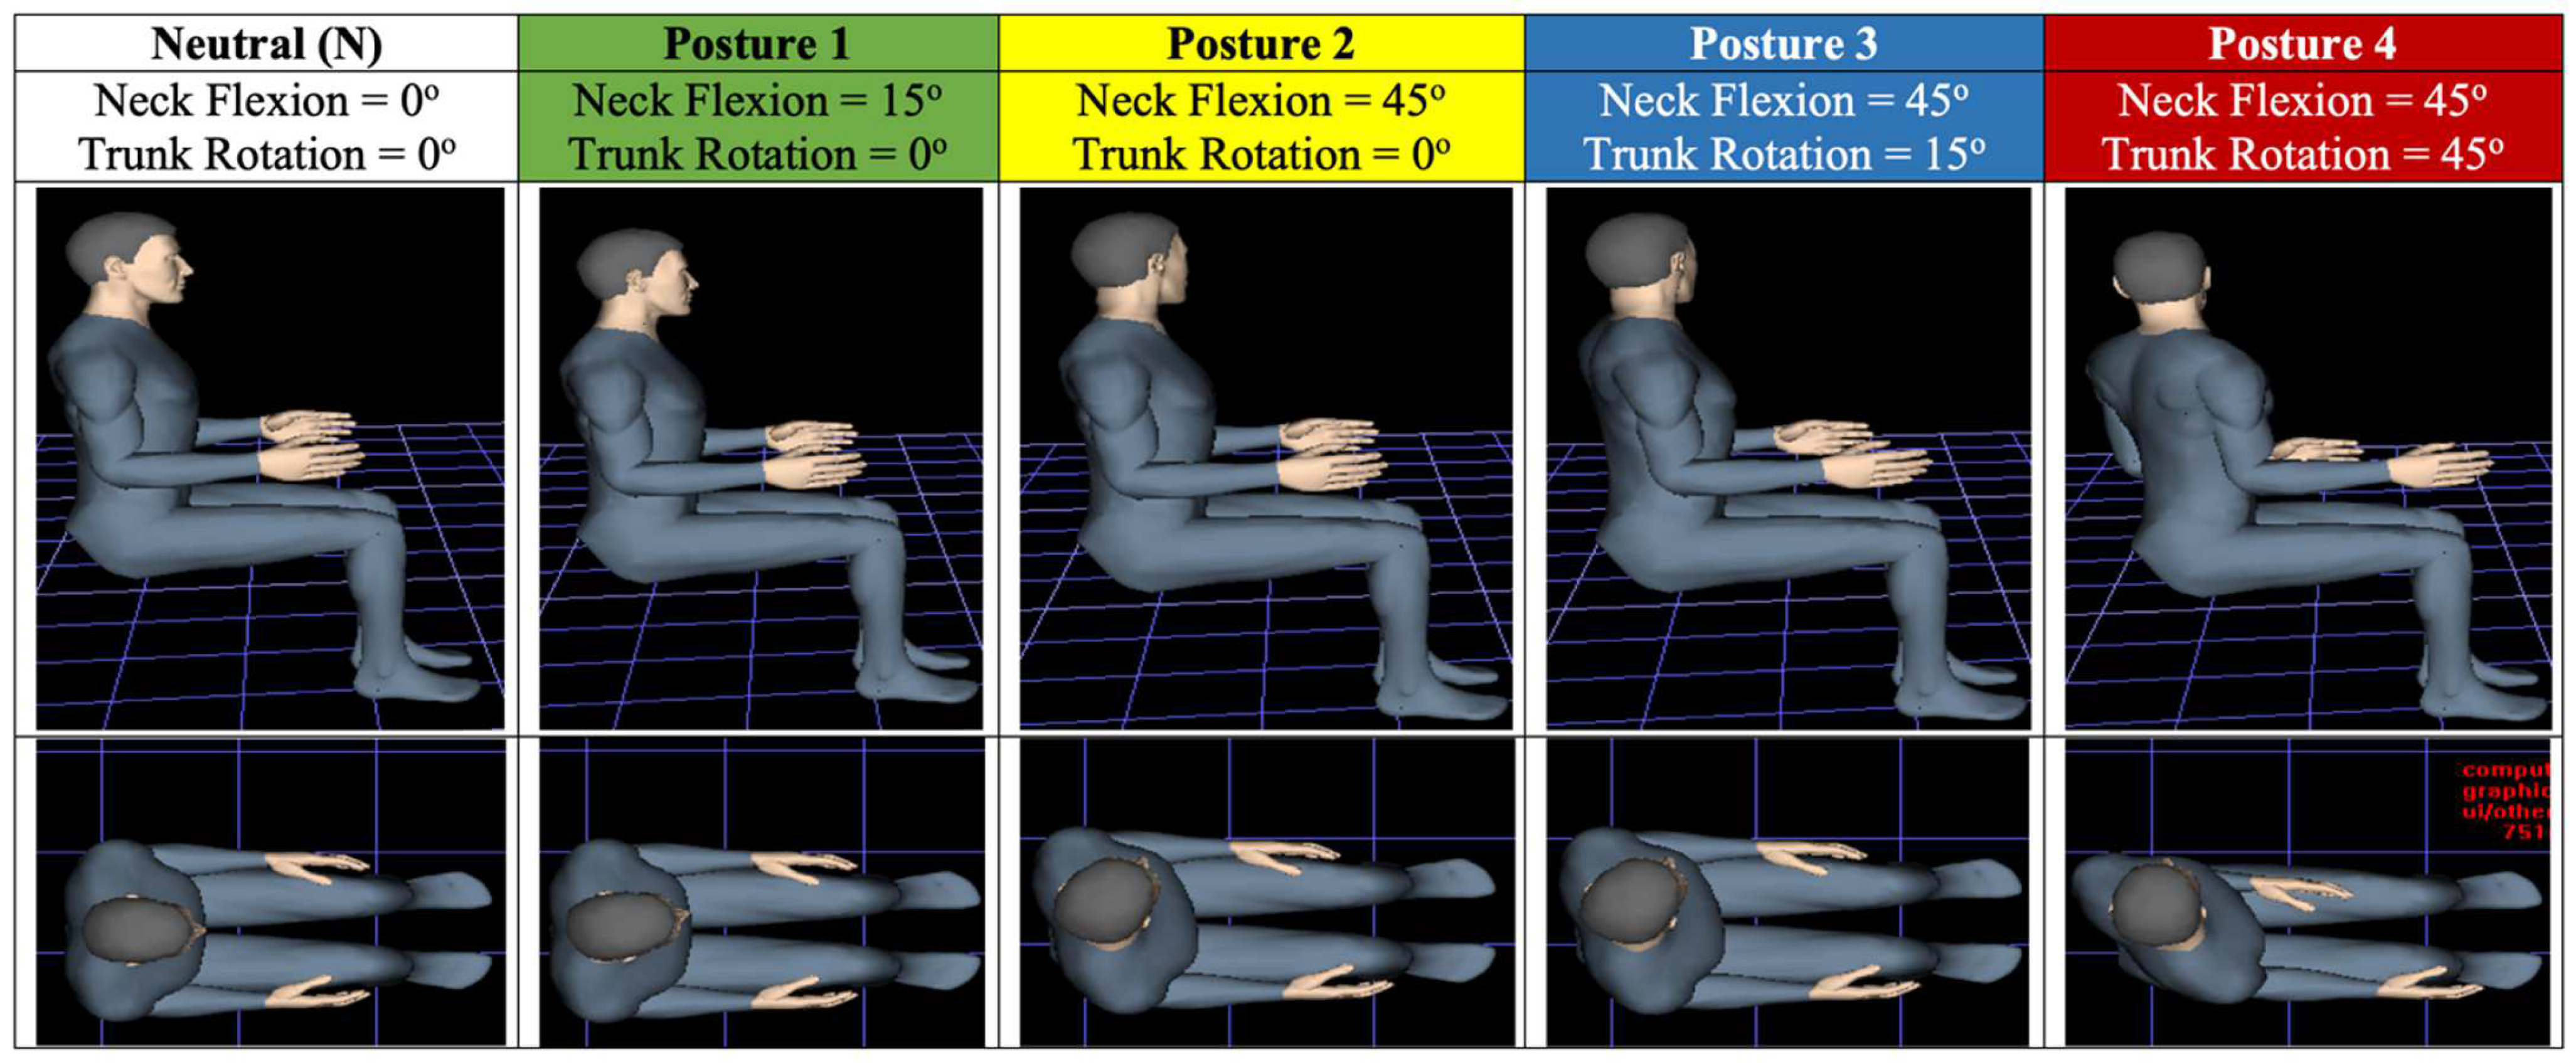
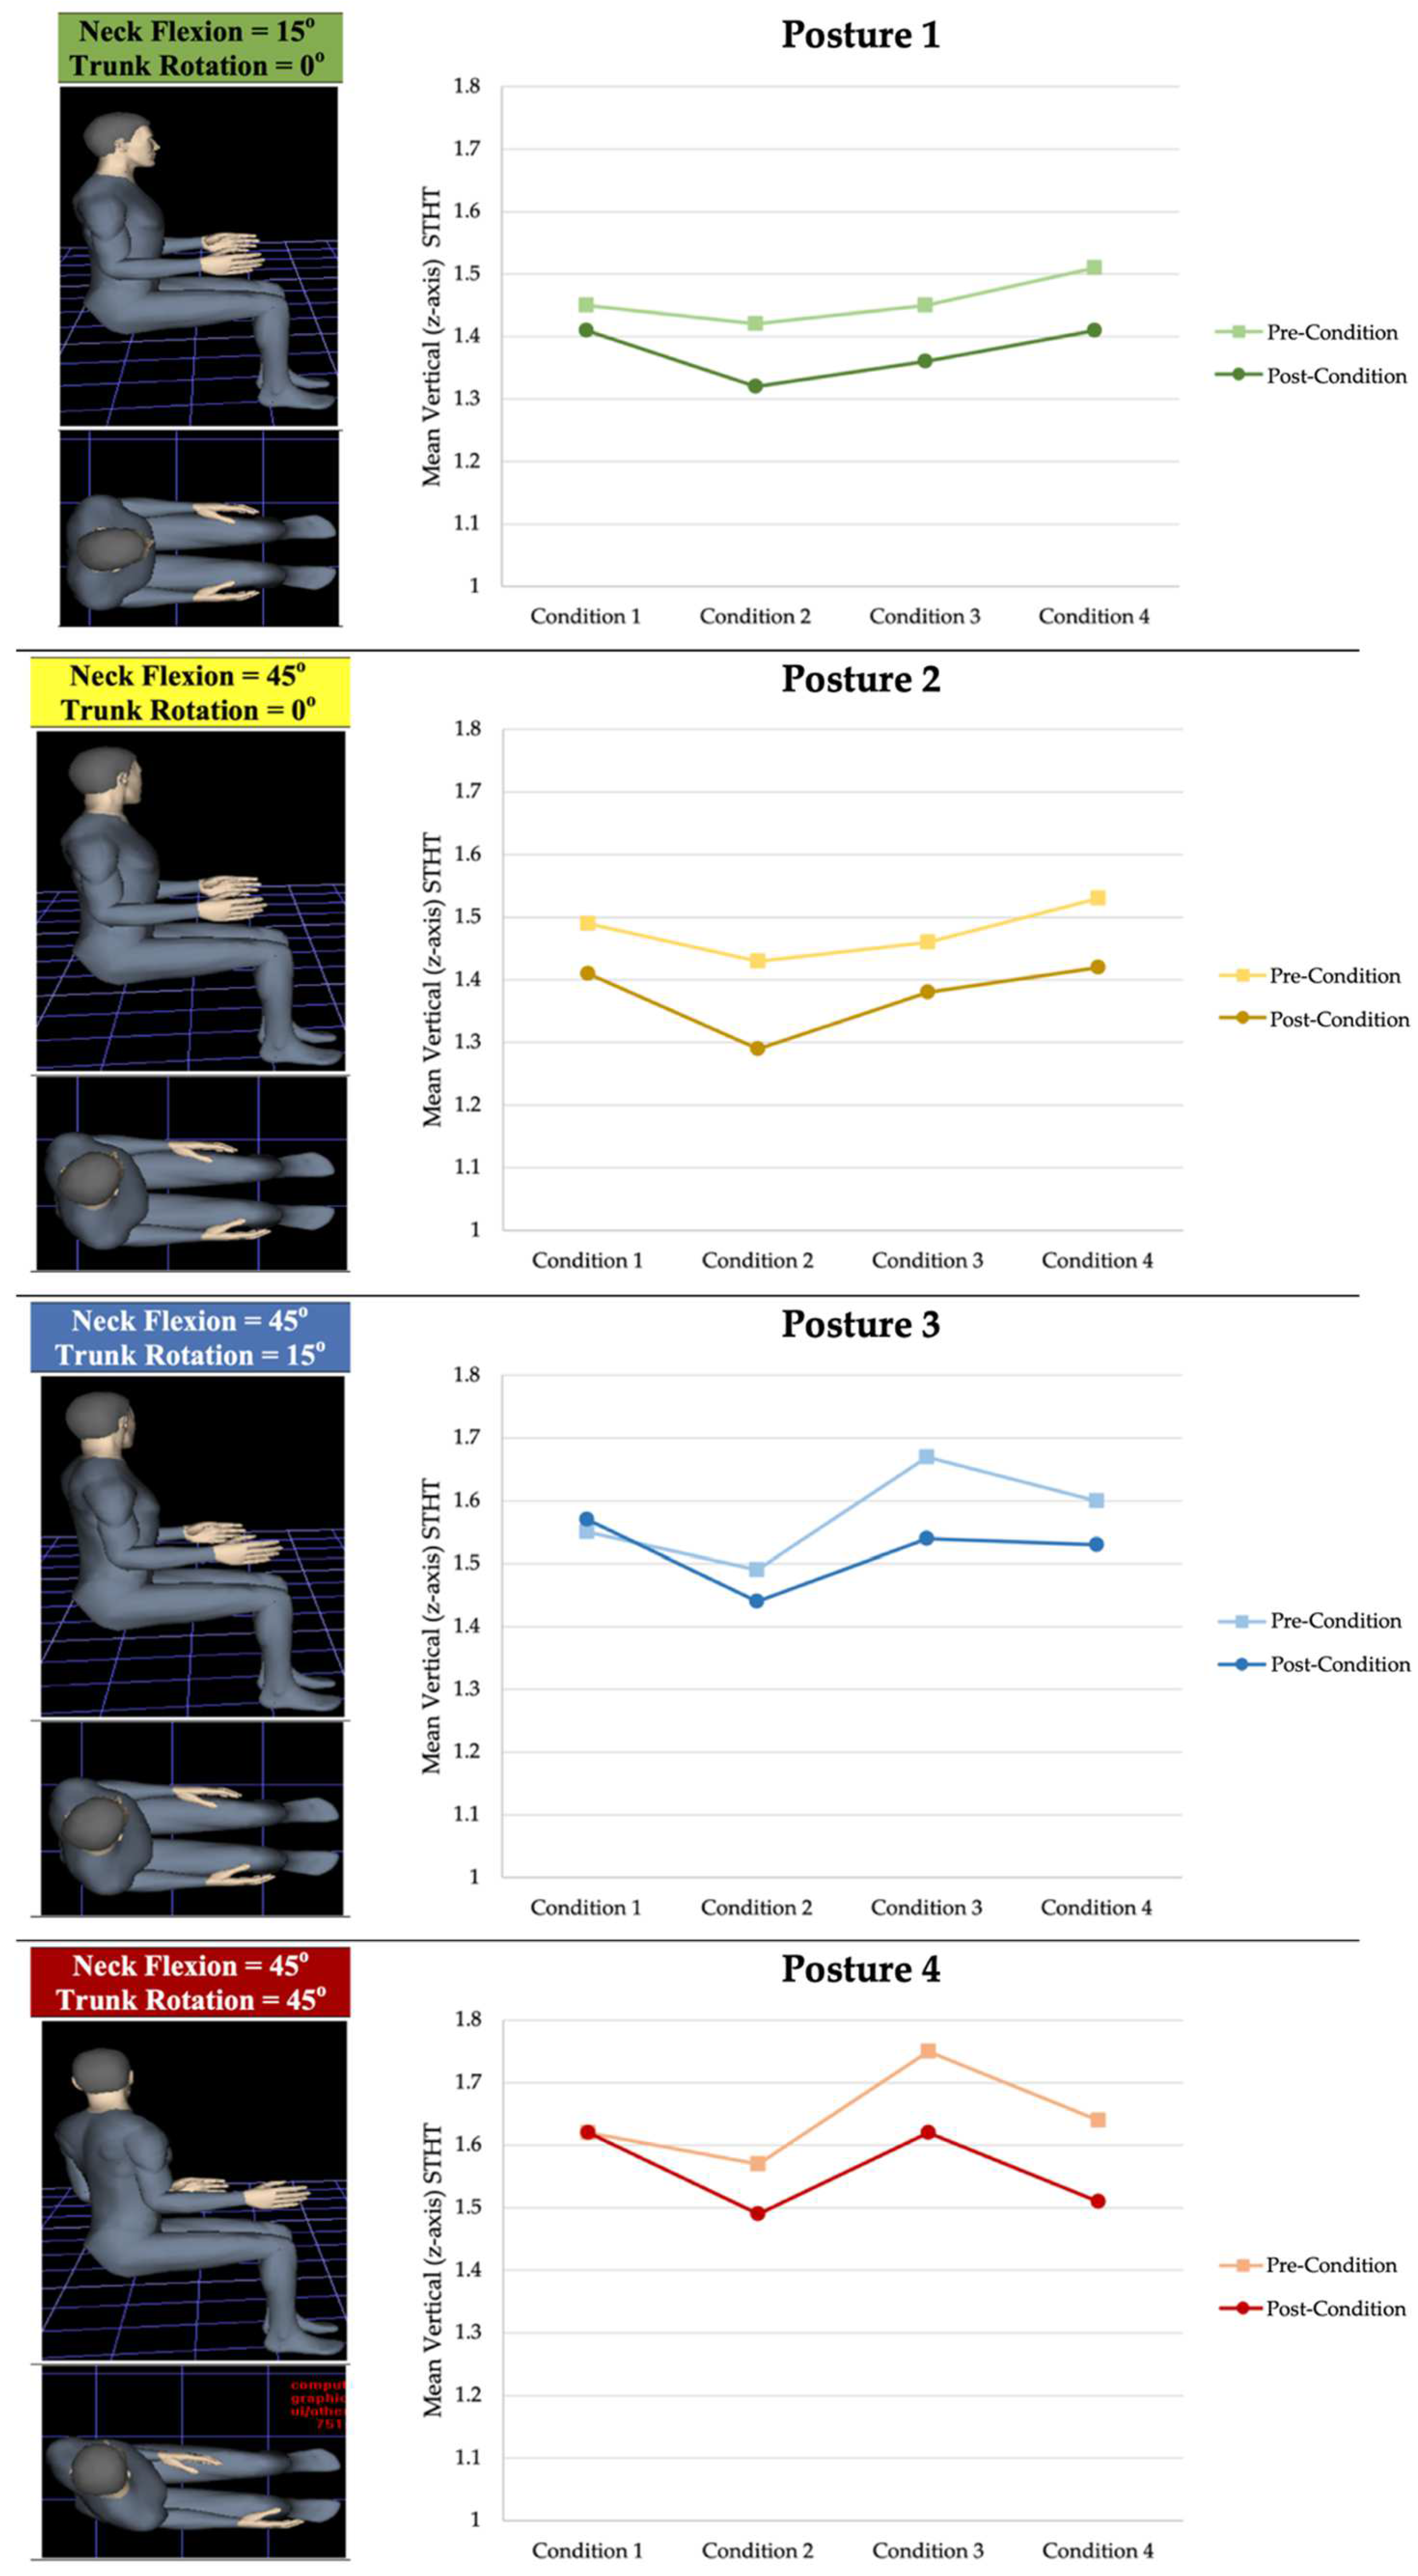
A vibration simulator was used to expose participants to seated WBV. An Isringhausen model chair intended for industrial mobile equipment was mounted onto a rectangular steel support structure. Beneath the base of the steel framework, an oscillating piston with a multi-drive DC Motor (Penta KB Power) was designed to push the steel plate which in turn pushes the attached springs upward, thus creating sinusoidal vertical WBV. For the purpose of this study the frequency was kept constant to match conditions experienced by LHD vehicles as reported by Eger et al. [29]. A vibration magnitude of 0.70 m/s2 (r.m.s. acceleration) with a dominant frequency of 3 Hz in the vertical direction was used for all test sessions. Testing magnitudes were confirmed using a tri-axial accelerometer on the steel plate below the seat.

2.2.2. Postures

Four rotated postures were selected to represent postures observed during typical mining LHD operation [14]. Participants were asked to hold one of five postures with varying degrees of neck rotation and trunk rotation (Figure 2) for specific time periods during the test sessions. Coloured targets were designed to represent the postures and make it easier for participants to associate a posture with a target colour.

2.2.3. Posture Control

The seated participant had their back resting on the chair back support in all postures. Participants were instructed to keep both hands on the steering wheel to drive as much as possible, and there were no armrests, as it was found that most pieces of heavy equipment were reported not to have arm rests (i.e., 351/384 has no armrests) [6].
Two lasers were used for posture control, one attached to the chest to control trunk rotation and the other attached to the head to control neck rotation. A chest strap designed to hold the laser ensured that the laser pointed forward from the sternum. The second laser was placed on the left side of the head band holding the accelerometer. The button controls on the lasers were taped down using a thick inflexible tape. The lasers were then attached to an adjustable dual-tracking DC Power Supply (Tandy, Realistic, Micronata, Fort Worth, TX, USA), thereby receiving a constant source of power.
Specifically, the targets were 14 cm in diameter, with a 2.5 cm black bullseye in the center. At the start of each session, a goniometer (J SKLAR MPG CO., Long Island City, NY, USA) was used to ensure placement of targets at appropriate angles. One arm of the goniometer was placed at neutral (straight ahead), and the second arm rotated either 15° or 45° to the left. The head orientations were measured with respect to the torso. Using the previously attached lasers, the subject was asked to move their chest and then their head, until the laser was pointing at the appropriate angle and the associated posture target was attached to the wall. The location of all targets was adjusted for each subject to account for differences in anthropometrics ensuring the desired posture was obtained.

2.2.4. Video Game and Computer Screen Set-Up

A driving video game (FUEL by CodeMasters, Stoneythorpe, Southam Warwickshire, United Kingdom) involving the use of a steering wheel and foot pedals was used to maintain the participants’ attention during the 45-min sitting exposure. A Lenovo (Beijing, China) Enhanced Experience Thinkcentre desktop computer was attached to two different monitors, a Proview screen, sized 13.5 × 11 inches, and a BenQ, model FP791, also sized 13.5 × 11 inches. Both monitors were placed on carts with wheels for easy adjustability. The video game was projected and played either in a neutral posture (looking straight forward), or in the designated rotated postures. Each participant was given instructions on how to play the game. None of the participants expressed concerns. Performance on the game was not monitored.
To play this video game a steering wheel, brake, and accelerator pedals, designed by Wingman Force Feedback (Fremont, CA, USA), were mounted on a previously constructed plywood table, which could be moved forwards or backwards depending on where the subject was comfortable. However, the angles of both the steering wheel and pedals were fixed but were within the recommended guidelines from the Society of Automotive Engineers control locations for off-road work machines [41].

2.3. Data Collection

2.3.1. Pre-Participation Questionnaire

At the beginning of a session, the age, height, and weight of each participant were recorded. Participants were questioned about previous vibration exposure and asked to complete a musculoskeletal questionnaire rating their perceived discomfort in specific locations on their body between 0 (no discomfort) and 9 (maximum discomfort). If the participant indicated lower back or neck discomfort or pain above a 2, they were unable to participate in the study.

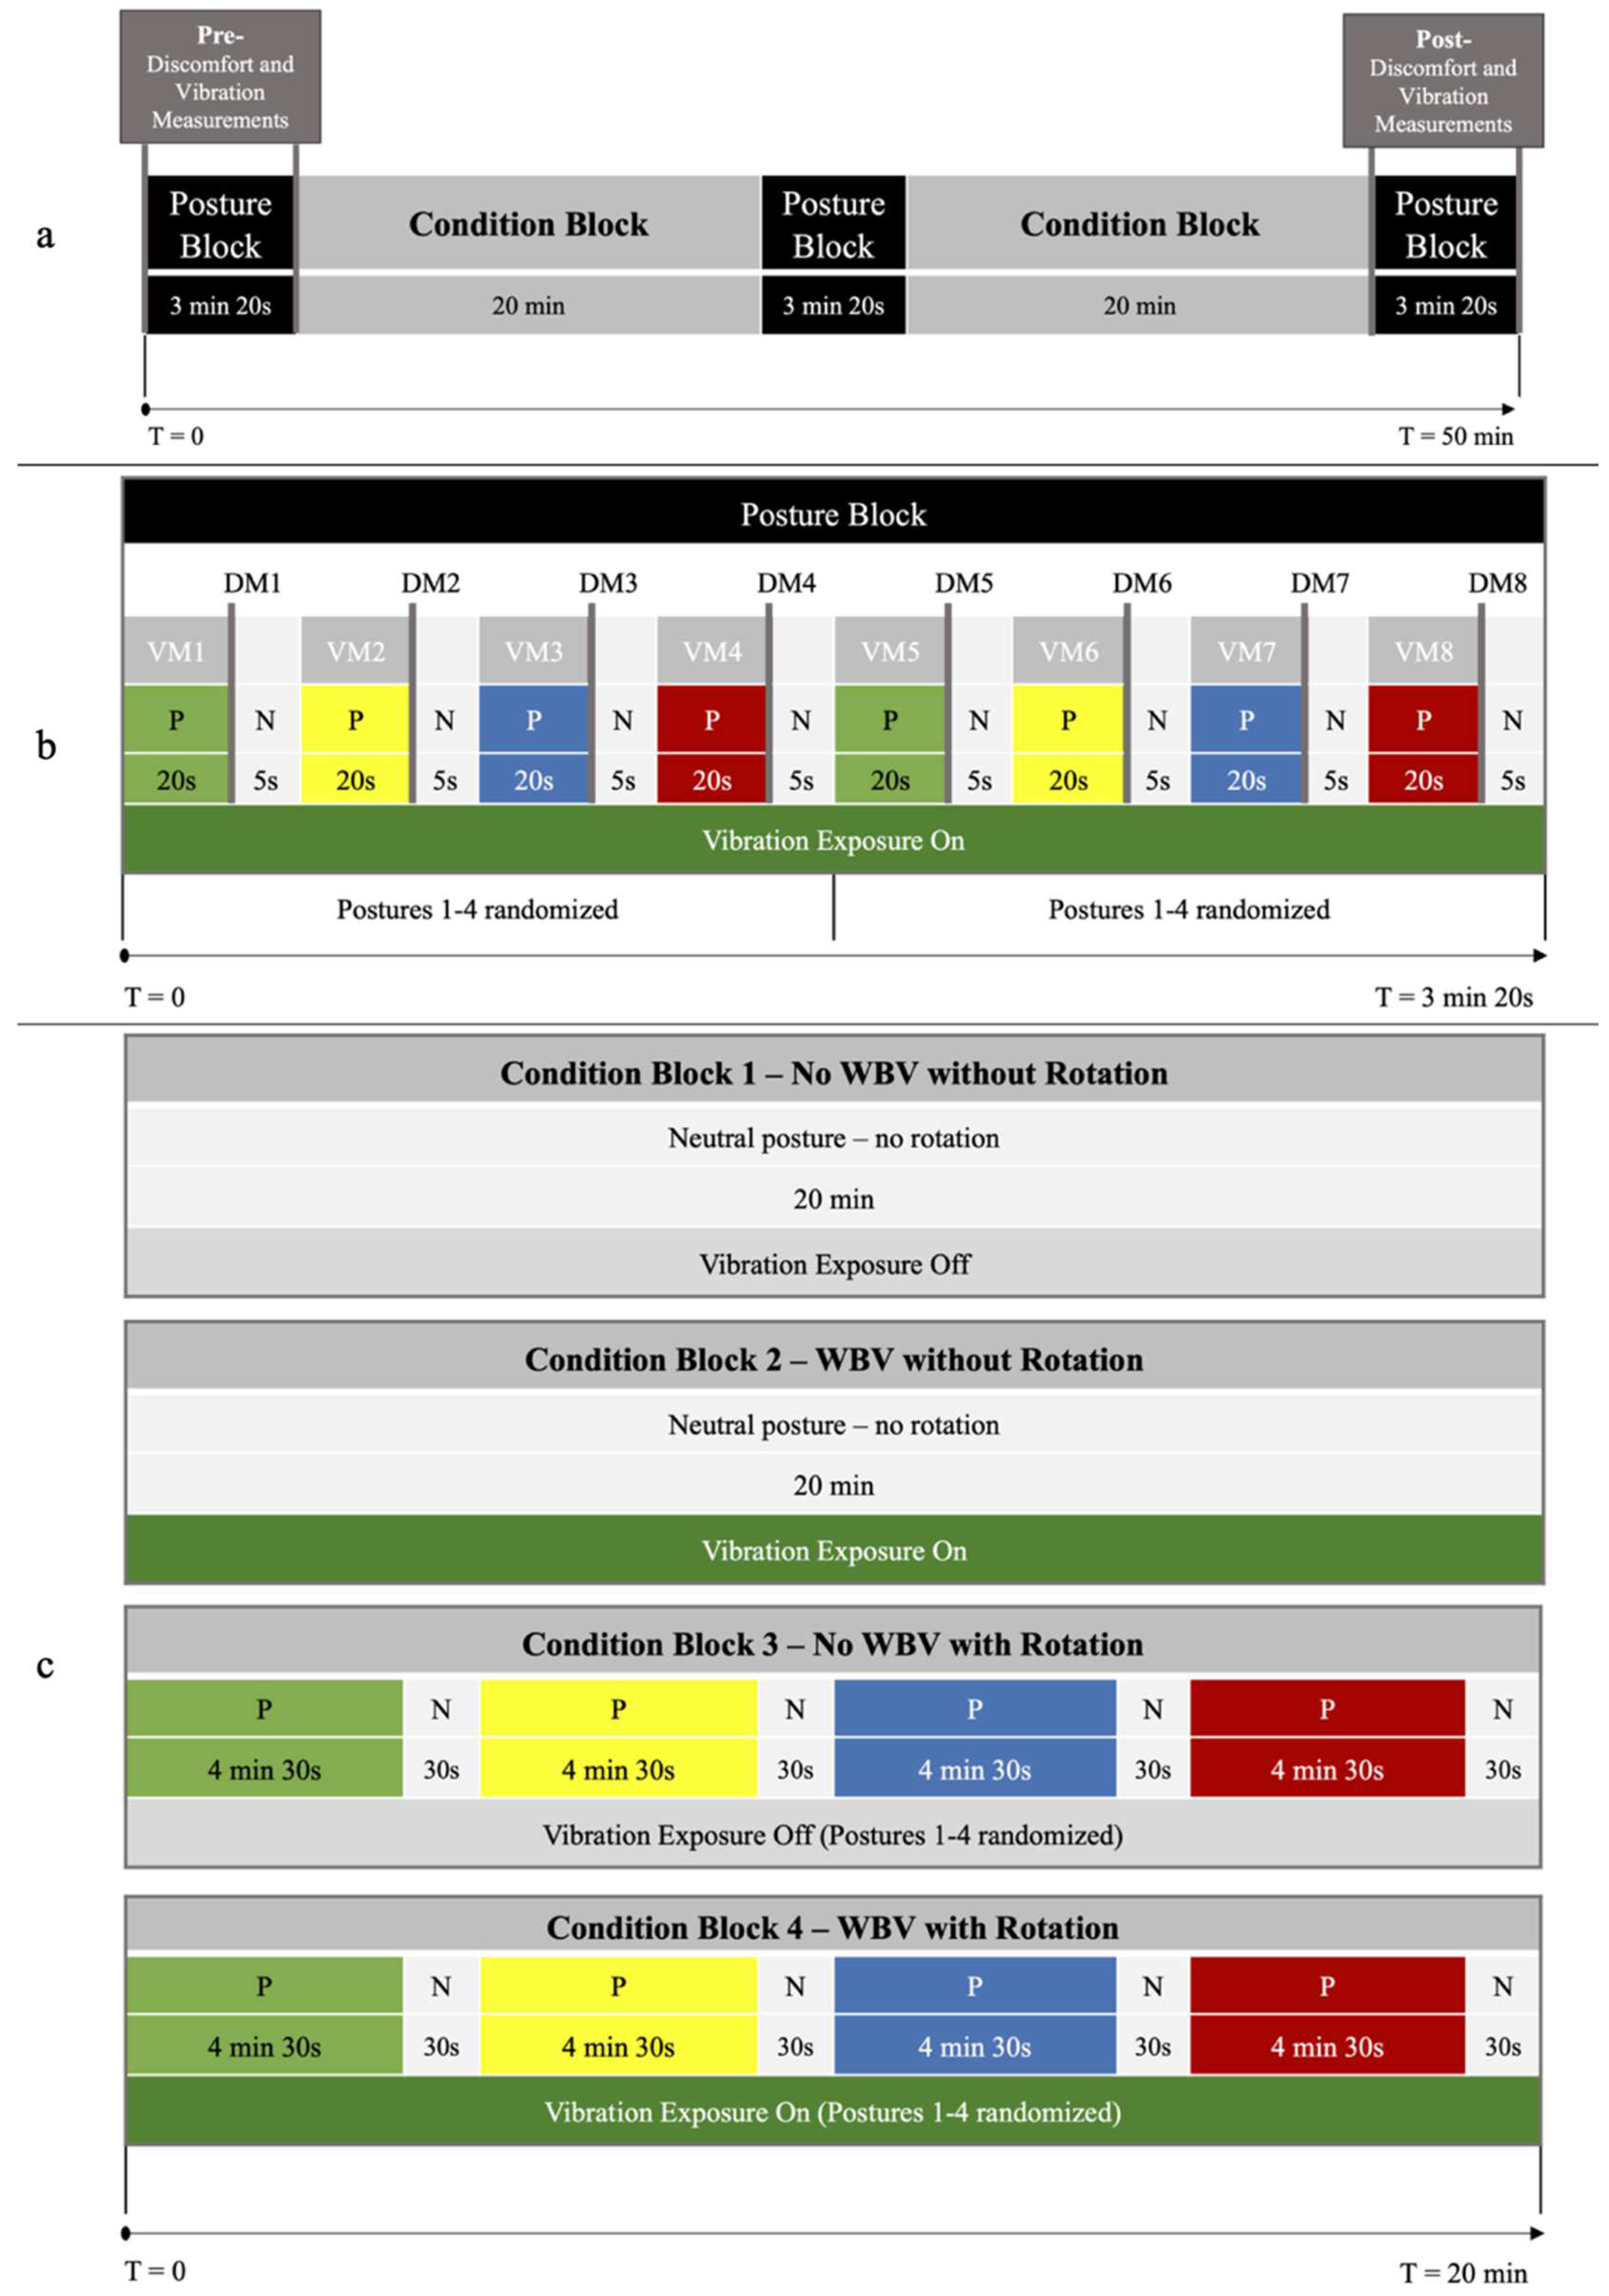
2.3.2. Test Session Outline with Conditions

Four 1-h tests sessions consisting of two separate segments, referred to as posture blocks and condition blocks (Figure 3a), were completed by each participant. The pre- and post-condition vibration and self-reported discomfort for each posture were measured during the first and last posture block (Figure 3b). During the posture blocks, the participant remained in a designated posture for 20 s (vibration at the operator/seat interface and head were measured) followed by 5 s in a neutral posture (self-reported discomfort was provided by the participant). This was repeated 8 times and totaled approximately 3:20 min. To explore whether the differences in STHT and self-reported discomfort were based on a neutral versus prolonged, rotated seated position, without and with WBV exposure, four conditions were included: (1) seated in neutral posture without WBV, (2) seated in neutral posture with WBV, (3) seated in non-neutral postures without WBV and (4) seated in non-neutral postures with WBV (Figure 3c). Two 20-min condition blocks were incorporated into each test. Conditions 1 and 2 involved the participant remaining in a neutral seated posture and playing the video game for 20 min on the monitor directly in front of the chair, without (condition 1), and with (condition 2) WBV exposure. During the rotated neck and trunk posture conditions (i.e., 3 and 4), the participant played the video game for 4:30 min in one of the 4 postures, followed by a 30-s break. This was repeated four times to total 20 min, and the postures were randomized for each participant. Condition 3 involved the rotated postures without WBV exposure, and condition 4 involved the rotated postures and WBV exposure.

2.3.3. Measurement of Whole-Body Vibration

Whole-body vibration exposure measurements were conducted in accordance with ISO 2631-1 [1]. All vibration measurements were obtained using two Series 2, 10 g tri-axial accelerometers (NexGen Ergonomics Inc., Pointe-Claire, QC, Canada), in conjunction with a single datalogger (P3X8-2C DataLOG II, Biometrics, Ladysmith, VA, USA). To measure vibration at the operator/seat interface, one tri-axial accelerometer was mounted in a rubber seat pad (8” diameter and ½” thickness in the centre) and secured to the supporting seat surface so that it was positioned between the ischial tuberosities of the subject (in accordance with ISO 2631-1). The seat pad was aligned with the basicentric axes of the human body (x-axis = fore-aft, y-axis = lateral, and z-axis = vertical). To measure vibration at the head, another tri-axial accelerometer was affixed to a custom-made headpiece and secured to the back of the subject’s head just below the occipital protuberance (Figure 4). The headpiece had a custom-sewn pocket to hold the accelerometer in a single orientation (x-axis = vertical, y-axis = lateral, z-axis= fore-aft). The occipital protuberance was palpated by the researcher, and the accelerometer was placed flush (i.e., no longer in basicentric axes) and held onto the anatomical location while the headband was tightened. The combined weight of the head harness was 351 g (129 g for the accelerometer, 222 g for the headband).

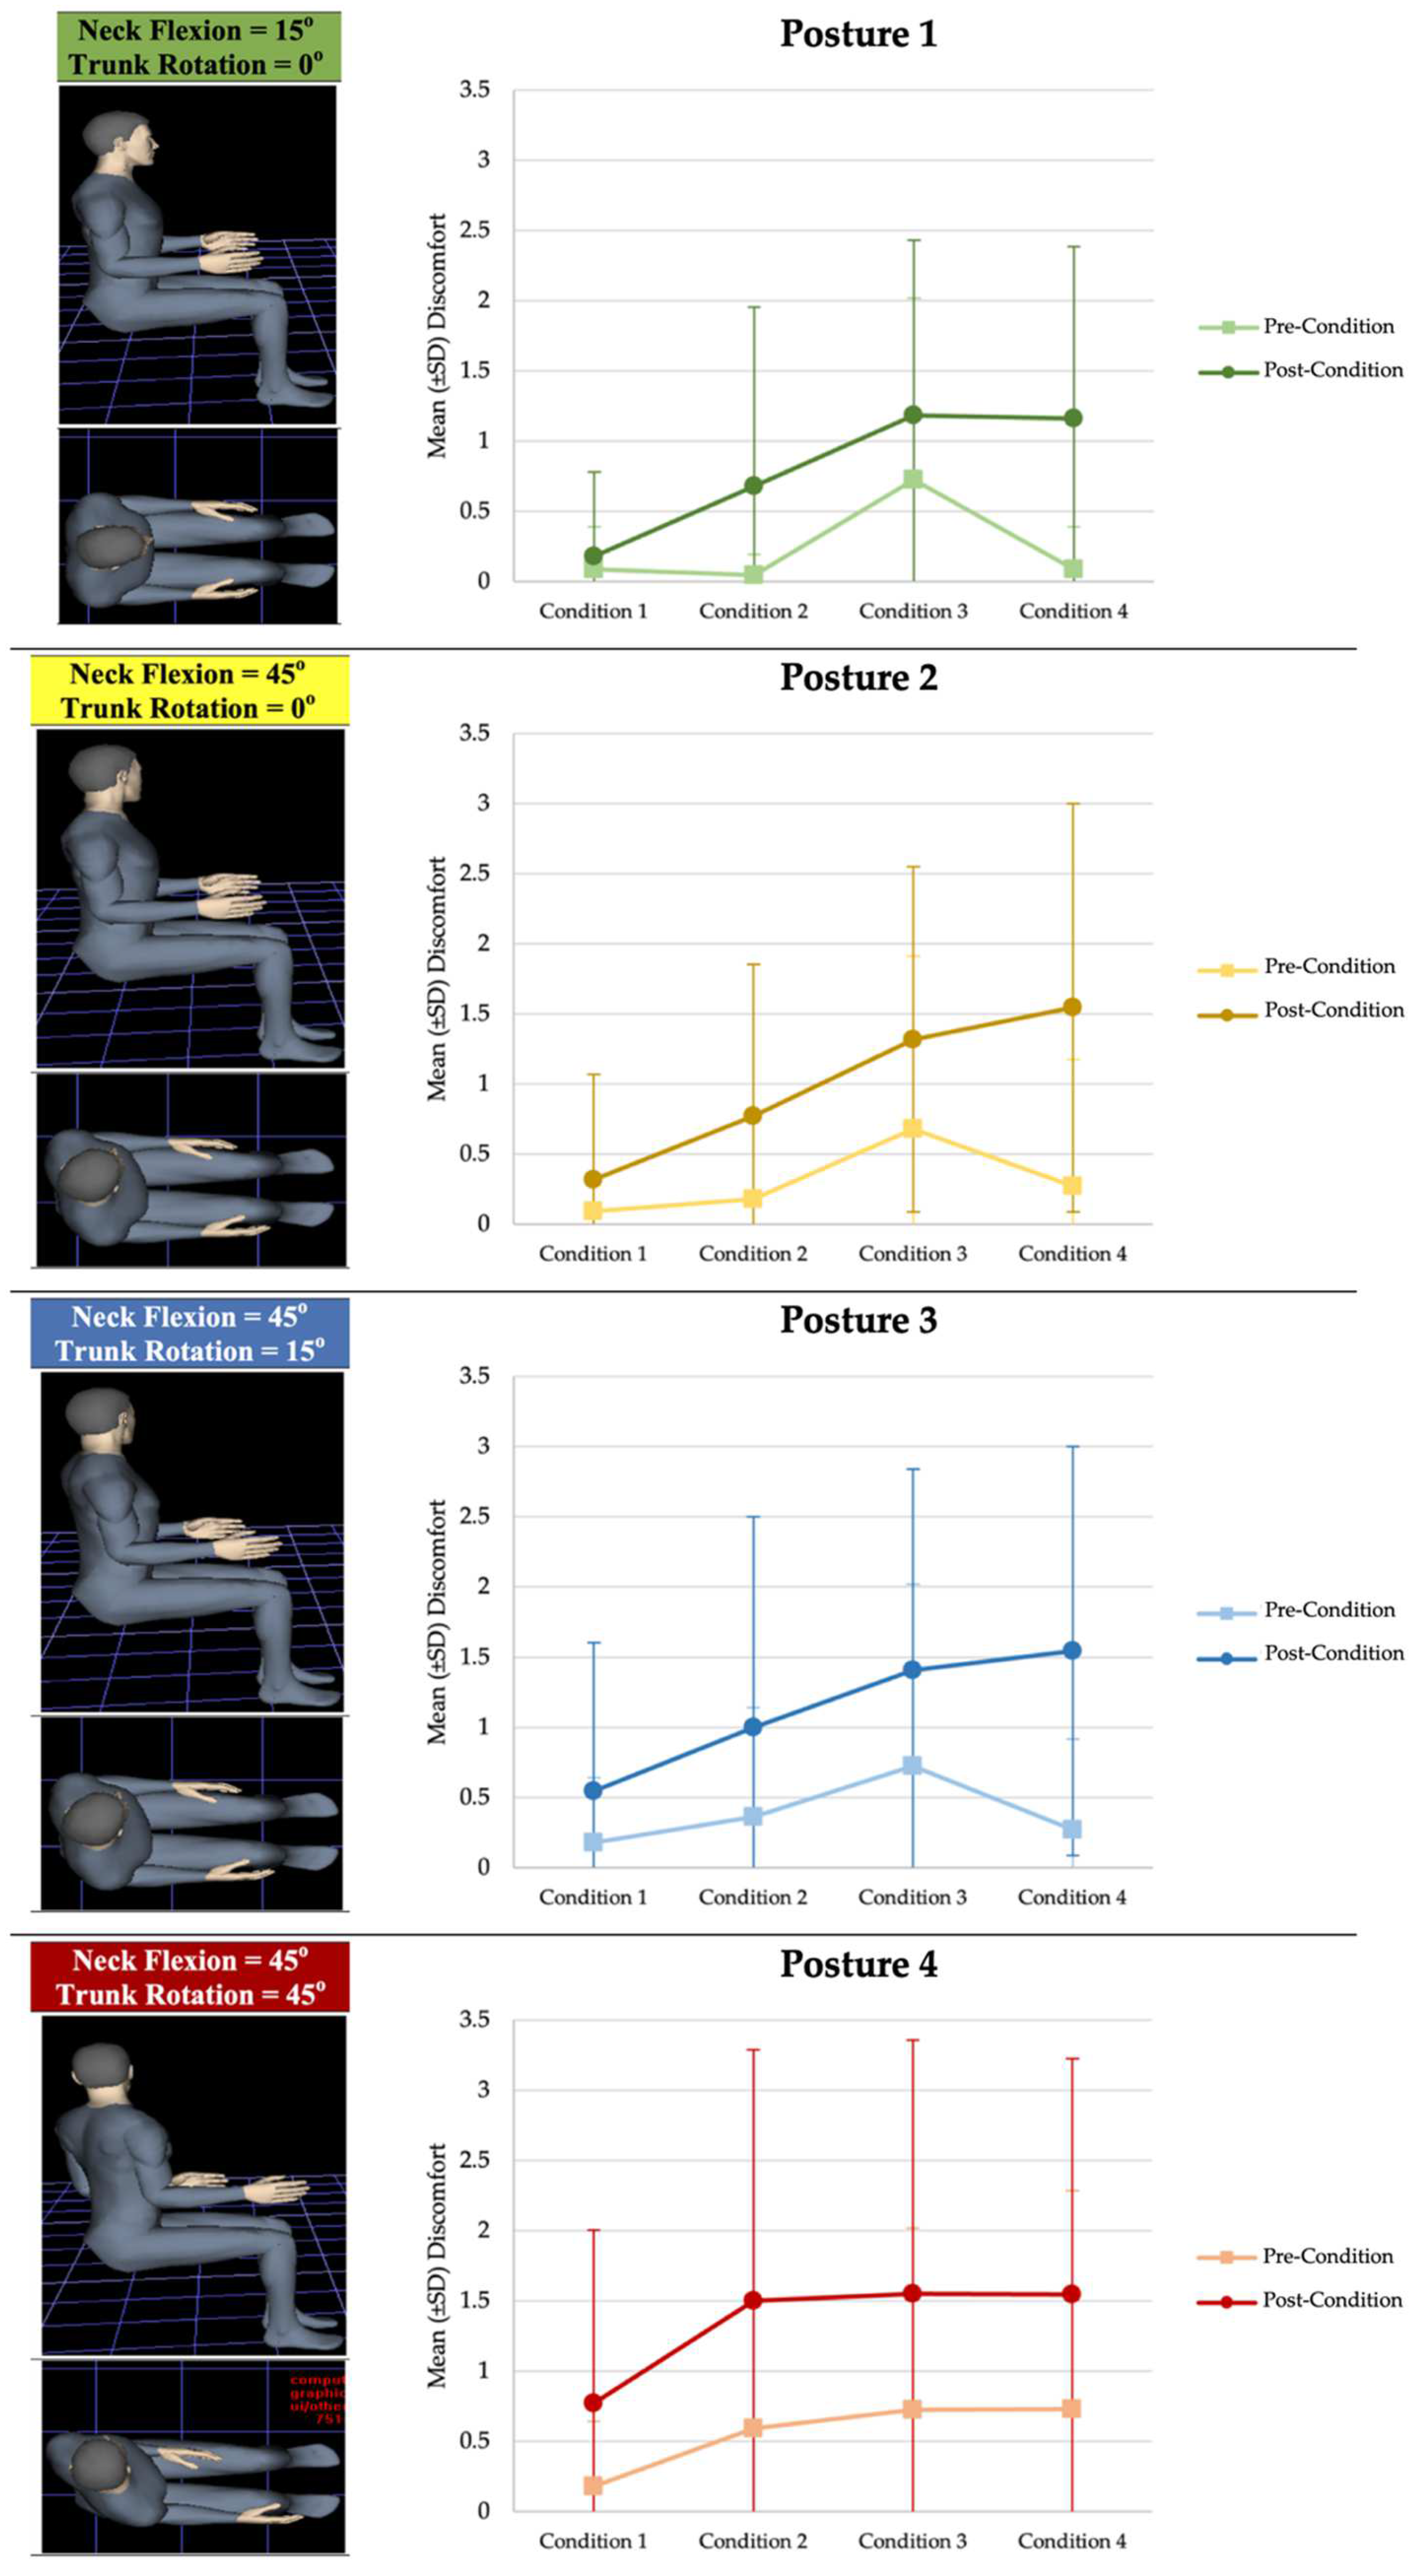
2.3.4. Discomfort Measurement

A subjective 10-point continuous, discomfort scale was utilized in this study [42]. The scale ranged from zero, indicating zero discomfort, through to nine, indicating maximum discomfort using the anchoring words “zero” and “maximum” to give the participants a sense of how to rate their discomfort [32,43]. The scale enabled participants to provide a verbal report of discomfort without interrupting each test session. All participants were familiarized with the scale prior to the start of testing, and a copy of the scale was posted in plain sight for easy reference. Pre-condition exposure discomfort measures were obtained from participants during their first posture block. Post-condition exposure measures of discomfort were measured during the last posture block, after two 20-min condition blocks.

2.4. Data Analysis

In accordance with ISO 2631-1 [1], the time histories were band-pass filtered with high- and low-pass cut-off frequencies at 0.5 and 100 Hz, respectively. The average vertical axis unweighted running root-mean-squared (r.m.s.) acceleration were calculated (Equation (1)).
a z = [ 1 T 0 T a z 2 ( t ) d t ] 1 2
where a z is the vertical axis unweighted r.m.s. average acceleration, a z ( t ) is the vertical axis unweighted acceleration as a function of time ( t ) and T is the measurement duration.
The vertical axis running r.m.s. average accelerations were calculated using a 1-s sliding window averaging with a 90% overlap (Equation (2)).
a z ( t 0 ) = [ 1 τ t 0 τ t 0 ( a z ( t ) ) 2 d t ] 1 2
where a z ( t 0 ) is the vertical axis unweighted running r.m.s. average acceleration, a z ( t ) is the instantaneous vertical axis unweighted acceleration as a function of time ( t ) , τ is the integration time for the running average, and t 0 is the time of observation.
The effect of rotated neck and trunk postures on the vertical axis (z-axis) STHT was then calculated using the ratio between the vertical axis running r.m.s. accelerations at the head and seat [8] (Equation (3)).
S T H T z = a z ( t 0 ) h e a d a z ( t 0 ) s e a t
The power spectral density (PSD) of each signal was calculated for the frequency range 0.1–20 Hz, and then the vertical axis STHT was calculated according to the cross spectral density (CSD) transfer function (Equation (4)) [21]. The input signals used were the vertical acceleration data measured at the seat, and the output signal was the vertical acceleration data measured at the head.
C S D   t r a n s f e r   f u n c t i o n   ( a z ) = C S D i n p u t . o u t p u t ( a z ) P S D i n p u t ( a z )
Coherence was also calculated (Equation (5)) [21]. If the coherence value dropped below 0.5 then caution was applied when interpreting transfer function findings. Transfer function values above 12 Hz had very low coherence and were therefore not considered in the results of this study.
c o h e r e n c e   f u n c t i o n   ( a z ) 2 = | C S D i n p u t . o u t p u t ( a z ) | 2 P S D i n p u t ( a z ) × P S D o u t p u t ( a z )
Independent contributions and interactions between independent variables of posture and condition on dependent variable transmissibility (frequency and magnitude) were also determined. More specifically, the amplitude of the transfer function at 3, 5, 7, and 9 Hz was extracted for statistical evaluation [44]. However, coherence values above 6 Hz were not consistently above the 0.5 cut-off point and should be interpreted with extreme caution. All data was processed using a custom written MATLab program (Mathworks, Natick, MA, USA).

2.5. Statistical Analysis

A 2 × 4 × 4 repeated measures analysis of variance (ANOVA) was conducted to analyze the effect of time (i.e., pre- and post-), condition, and posture on STHT. All significant main effects were determined with alpha set at p < 0.05. Post-hoc comparisons were determined using the Bonferroni procedure with paired t-tests controlling for familywise error. All statistical analysis were conducted using SPSS software (IBM Corporation, Armonk, NY, USA).
Prior to analysis, both the pre- and post-condition discomfort scores were averaged for each posture in each condition for each participant. Another 2 × 4 × 4 repeated measures ANOVA was conducted to analyze the effect of time (i.e., pre- and post-), condition, and posture on participant self-reported discomfort. All significant main effects were determined with alpha set at p < 0.05. Greenhouse–Geisser values were used where the assumption of sphericity was not met. Post-hoc comparisons were done using the Bonferroni procedure for significance.

3. Results

3.1. Vertical Axis Seat-to-Head Transmissibility (STHT)

Initial evaluation of the vertical STHT indicated that the vibration measured at the head was higher than the vibration measured at the seat for all participants in all postures regardless of the rotated neck and trunk posture and condition (Figure 5). In general, the mean STHT values showed an increase in transmissibility as the degree of neck and trunk rotation increased. Additionally, a general trend of decreasing STHT values from pre- to post-condition was found to exist among all postures for all conditions, except for the 45° neck, 15° trunk posture in condition 1.
Furthermore, a repeated measures ANOVA revealed a significant effect of time (F1,10 = 101.73, p < 0.001, Eta2 = 0.910) and posture (F3,8 = 5.64, p = 0.023, Eta2 = 0.679) on the STHT. Post-hoc analysis with Bonferroni comparisons further revealed a significant difference in transmissibility between the maximally rotated postures (45° neck, 45° trunk; 45° neck, 15° trunk) and the minimally rotated postures (45° neck, 0° trunk; 15° neck, 0° trunk) where the maximally rotated postures displayed higher STHT values than those of the minimally rotated postures (Table 1). More specifically, a significant difference in transmissibility was found to exist between the 45° neck, 45° trunk posture and the 15° neck, 0° trunk posture (p = 0.02) and between the 45° neck, 45° trunk posture and the 45° neck, 0° trunk posture (p= 0.02). Additionally, the 45° neck, 15° trunk posture was significantly different than both the 45° neck, 0° trunk and the 15°, neck 0° trunk postures (p = 0.008, p= 0.009, respectively). No significant difference was found to exist among the maximally rotated postures (p = 0.30) or the minimally rotated postures (p = 1.00).
When considering the effect of condition on STHT, there was no significant effect of condition on the transmission of the vibration (F3,8 = 0.636, p = 0.613, Eta2 = 0.192) for any of the four conditions. No significant interactions were found to exist among time, condition or posture.

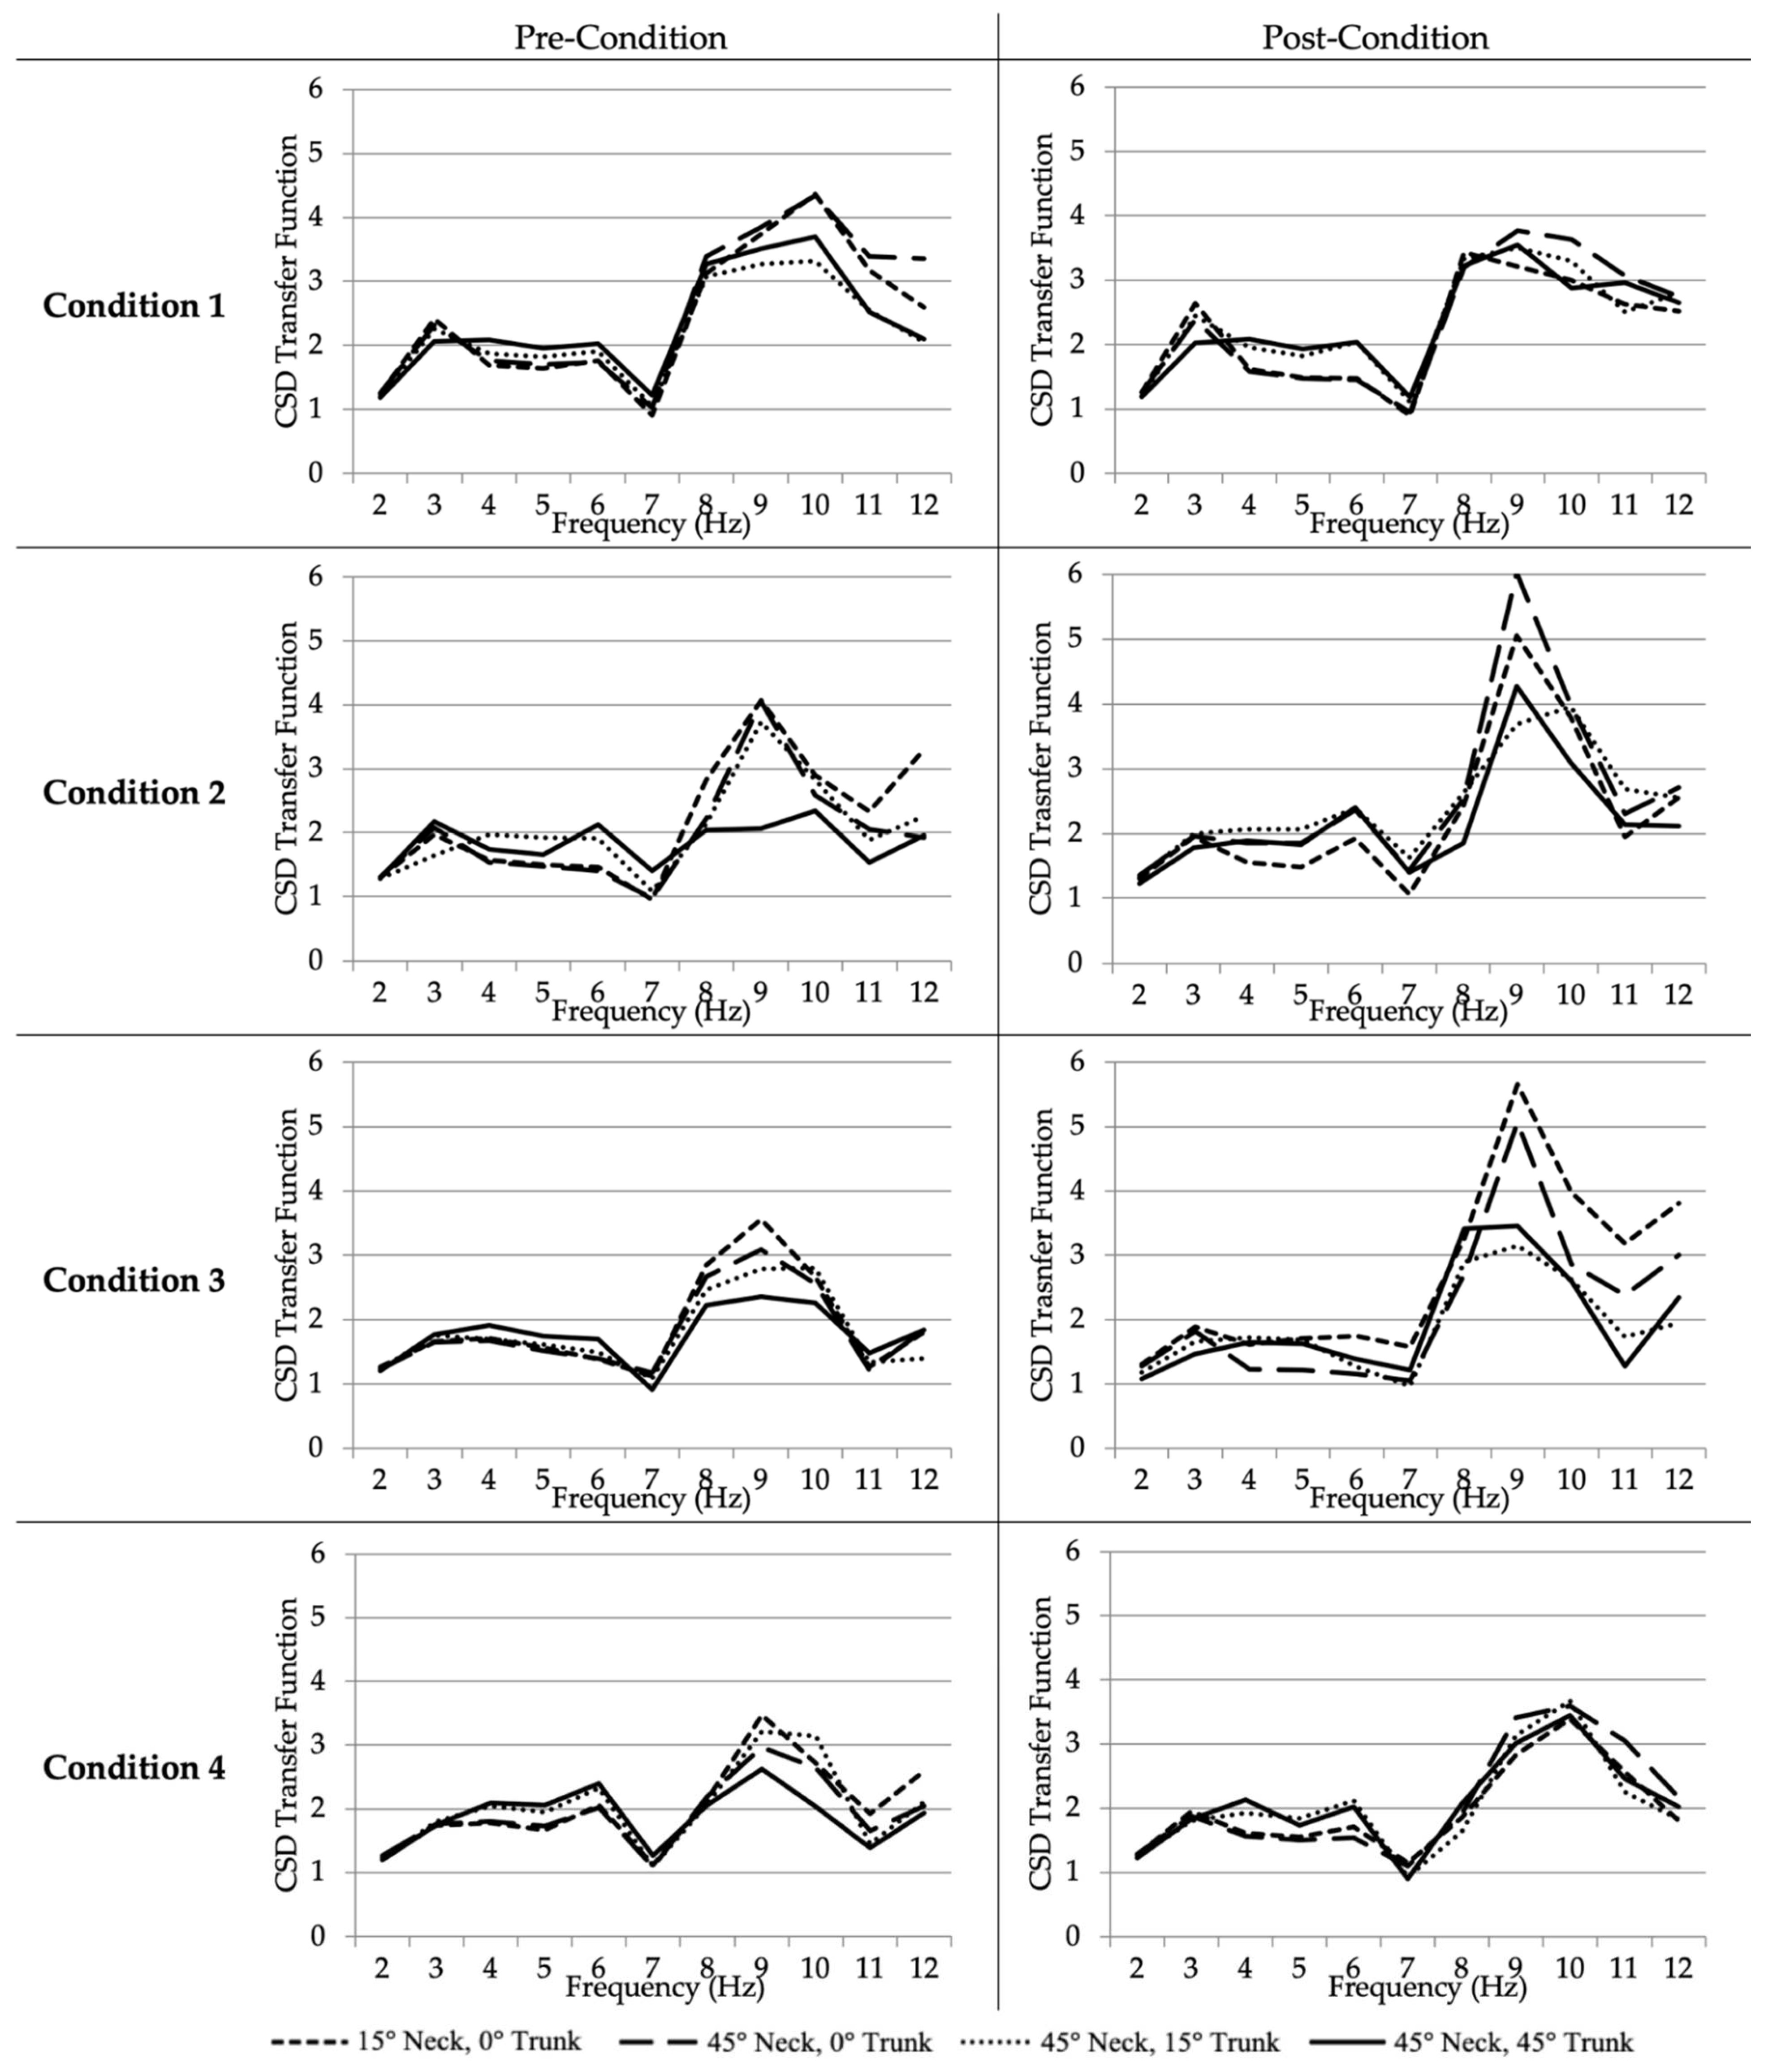
3.2. CSD Transfer Functions

The pre- and post-condition CSD transfer functions from 2 to 12 Hz for all four rotated trunk and neck postures are illustrated in Figure 6. Above 6 Hz, the coherence values were not consistently above the 0.5 cut-off point and should be interpreted with extreme caution. When considering the CSD transfer function values for condition 1, all pre-condition postures showed an initial peak at 3 Hz where their magnitudes remained relatively constant through to 6 Hz and then decreased and formed a trough at 7 Hz (Figure 6). A dominant peak at 10 Hz was evident for all postures, where the minimally rotated postures showed higher transmissibility values than the maximally rotated postures. Post-condition values displayed trends much like those of the pre-condition values except for the dominant peaks, which shifted from 10 Hz to 9 Hz for all postures. The magnitude of the transmissibility values remained relatively constant from pre- to post-condition.
In condition 2, pre-condition CSD transfer functions revealed an initial peak at 3 Hz for all rotated neck and trunk postures, besides in the 45° neck, 15° trunk posture, the initial peak occurred at 4 Hz and was maintained at the same magnitude through to 6 Hz (Figure 6). Therefore, this portion of the curve appears flat. All four postures displayed a trough at 7 Hz and a dominant peak at 9 Hz, except for the 45° neck, 45° trunk posture, which displayed a smaller peak at 10 Hz. This overall trend was maintained pre- and post-condition.
For the CSD transfer functions for condition 3, all four postures displayed a similar frequency pattern of vibration transmissibility. One dominant peak in transmissibility occurred at the 9 Hz frequency for all four postures in both the pre- and post-condition measures. Transmissibility was higher for the minimally rotated postures when compared to the maximally rotated postures. When compared to the pre-condition measure, post-condition transmissibility values at 9 Hz were higher in all postures.
Finally, condition 4 illustrates that, prior to exposure to the condition block, all four postures behaved similarly, where dominant transmissibility peaks occurred at 6 Hz and 9 Hz (Figure 6). All four postures also showed a trough at a frequency of 7 Hz. However, the secondary peaks differed between the postures where the maximally and semi-maximally rotated postures peaked at 4 Hz, while the more neutral postures showed an initial peak at 3 Hz. After exposure to any condition, the peak transmissibility value at the 9 Hz shifted to 10 Hz for all four postures. Peak transmissibility values did not differ significantly between pre- and post-condition for any of the postures.
Using the CSD transfer functions, a 2 × 4 × 4 repeated measures ANOVA was conducted for variables of time, condition, and posture at frequencies of 3, 5, 7, and 9 Hz. For the CSD analysis at 3 Hz no significant difference was found to exist for time (F1,10 = 0.499, p = 0.496, Eta2 = 0.048), condition (F3,8 = 1.077, p = 0.412, Eta2 = 0.288), or posture (F3,8 = 0.957, p = 0.458, Eta2 = 0.264). At 5 Hz, the only significant difference found was among the four postures (F3,8 = 17.398, p = 0.001, Eta2 = 0.867). Post-hoc analysis revealed a significant difference between the 45° neck, 45° trunk posture and the 45° neck, 0° trunk posture (p = 0.007), the 45° neck, 45° trunk posture and the 15° neck, 0° trunk posture (p = 0.008), the 45° neck, 15° trunk posture, and the 45° neck, 0° trunk posture (p < 0.001), and lastly between the 45° neck, 15° trunk posture and the 15° neck, 0° trunk (p = 0.001). No significant difference was found to exist between the maximal and semi maximal rotation postures (p = 1.000) or between the two partial rotation postures (p = 1.000). Analysis at 7 Hz revealed no significant difference for time (F1,10 = 1.896, p = 0.199, Eta2 = 0.159) or condition (F3,8 = 0.133, p = 0.938, Eta2 = 0.048), but did indicate a significant difference among posture (F3,8 = 4.756, p = 0.035, Eta2 = 0.641). Post-hoc analysis revealed that the only significant relationship was between the maximal rotation posture (45° neck, 45° trunk) and the semi-maximal rotation posture (45° neck 15° trunk) where p = 0.031. CSD transfer function analysis at 9 Hz revealed no significant differences for any of the examined variables of time (F1,10 = 0.020, p = 0.889, Eta2 = 0.002), condition (F3, 8 = 0.479, p = 0.706, Eta2 = 0.152), or posture (F3, 8 = 1.194, p = 0.372, Eta2 = 0.309). Lastly, no significant interactions were found to exist among any of the measured variables of time, condition, or posture at any of the examined frequencies.

3.3. Self-Reported Discomfort

Evaluation of the pre-condition self-reported discomfort values showed a high degree of variance for both between-subject and within-subject measures. Pre-condition mean (±SD) discomfort ratings ranged from 0.09(±0.3)–0.73(±1.29) across the four conditions and four postures, while post-condition discomfort ratings ranged from 0.18(±0.6)–1.55(±1.81) (Figure 7). The maximally rotated neck and trunk posture (i.e., posture 4: 45° neck, 45° trunk) resulted in the greatest discomfort (~1.5) in three conditions (2–4). More specifically, in the rotated neck and trunk postures with exposure to WBV condition, most of the scores were between 1.5 and 2.25, excluding two of the 11 participants whose discomfort remained zero throughout all trials.
A three-way repeated measures ANOVA was conducted to evaluate the effect of time (i.e., pre- and post-), condition, and posture on self-reported discomfort. Mauchly’s test indicated that the assumption of sphericity had been violated for all interactions and main effects except condition (X2(5) = 11.14, p = 0.050), and condition * time (X2(5) = 10.75, p = 0.058). Therefore, degrees of freedom were corrected using Greenhouse–Geisser estimates of sphericity (main effects of time ( ε = 1.0) and posture ( ε = 0.35) and interactions condition * posture ( ε = 0.71), time * posture ( ε = 0.44), and condition * time * posture ( ε = 0.45)). Tests of within-subjects effects using the Greenhouse–Geisser criterion revealed the main effect of time (i.e., pre- and post-condition) was significant (F(1,10) = 15.53, p = 0.003), while the main effects of condition (F(1.69,16.9) = 2.45, p = 0.122) and posture (F(1.06,10.6) = 3.60, p = 0.084) were not. The interaction effects of time * condition * posture (F(4.05,40.5) = 2.22, p = 0.083), time * condition(F(2.13,21.3) = 1.46, p = 0.256), condition * posture (F(2.54,25.4) = 1.54, p = 0.231), and time * posture (F(1.32,13.2) = 1.48, p = 0.254) were also not significant. Contrasts revealed that self-reported discomfort was significantly higher post-condition (F(1,10) = 15.5, r = 1.68).

4. Discussion

A laboratory study involving 11 participants (5 females and 6 males) was conducted to evaluate seated WBV at the seat/operator interface and head during four combinations of varying rotated neck and trunk postures that have previously been identified as being used in the field [14]. Four conditions (1: no vibration, no rotation; 2: no vibration, rotation; 3: vibration, no rotation; 4: vibration, rotation) were used to isolate the effects of vibration and rotated postures from prolonged sitting. Transmissibility was determined using the unweighted vertical axis r.m.s. acceleration STHT and CSD transfer functions, and self-reported discomfort was evaluated on a 10-point scale.
Overall, evaluation of STHT indicated that vibration was higher when measured at the head compared to the operator/seat interface in almost all cases, regardless of condition or rotated posture. These results indicate that exposure to translational WBV in the vertical axis at a magnitude of 0.70 m/s2 with a dominant frequency of 3 Hz results in an amplification of vibration exposure at the head when compared to the seat. In a study of multi- and single-axis suspension seats used in heavy equipment operation, a similar result was found where the vertical head acceleration was about 1.5 times higher than the acceleration measured on the seat [15]. Additionally, the magnitude of the STHT values increased as the degree of rotation in each posture increased, regardless of time or condition, thus indicating that the degree of rotated neck and trunk posture influences the STHT, where maximally rotated postures exhibit the greatest amount of amplification.
A general trend of decreasing STHT values from pre- to post-condition for all postures in all conditions was also evident; however, the trend did not reach statistical significance. Condition 1 displayed the smallest amount of change among pre- and post-condition STHT values, indicating the least amount of change in the mode of vibration transmissibility from seat to head among the four conditions. This decrease in STHT values may indicate that the vibration energy is being absorbed by the tissues in the spine and that this absorbed energy could potentially influence the health of the spine and back musculature. Vibration entering the body at the seat/buttock interface for heavy equipment operators can be further transmitted through the body and appears to be amplified as it travels up the spine to the head [31]. Therefore, vibration exposure at the seat may differ greatly from exposure at the head and could be a potential cause for damage to the spine or neck. The significance of these results is underscored by the fact that current standards for evaluating health risk from exposure to WBV (i.e., EU Directive 2002/44/EC [39], ISO 2631-1 [1], British Standards Institution [40]) do not account for the effects of non-neutral postures.
Generally, the greater the degree of neck and trunk rotation, the greater the influence on STHT. These findings are comparable to those of Eger et al. [29], who determined that posture has a significant effect on STHT magnitude. Additionally, previous research has found an increased risk for LBP or injury when WBV is combined with non-neutral working postures for operators of cranes and lift trucks [4,17], tractors [26,28], excavators and pavers [45], and LHD vehicles [14]. The idea of posture influencing STHT is supported by numerous authors who have reported changes in transmissibility, as well as frequency shifts for transmissibility peaks with changes in posture [10,19,21,24,46]. The findings of this study further support this notion. Lastly, the mean STHT values indicated that there was no significant effect of condition on the transmission of the vibration for any of the four conditions. Thus, the sole effect of rotated posture on vibration transmissibility was not successfully isolated from confounding factors such as the effect of sitting or the effect of prolonged vibration exposure. Additionally, participants were only exposed to 45-min durations, which are not comparable to a standard workday of 8–10 h.
The CSD transfer function values were evaluated for statistical significance for variables of time, condition, and posture at 3, 5, 7, and 9 Hz. Analysis at 3 Hz found no significant difference among the transmissibility values for the variables of time (p = 0.496), condition (p = 0.412), or posture (p = 0.264). Therefore, at a frequency of 3 Hz, rotated neck and trunk posture does not significantly affect the STHT at a magnitude of 0.70 m/s2. The initial peak at 3 Hz aligns with previous studies where the pelvic/spinal resonance has been reported to be between 3–5 Hz [20,31] and STHT is maximized at resonance [25,47,48]. Analysis at 5 Hz revealed a significant difference among the four postures (p = 0.001). A significant difference was found between posture 4 and 2 (p = 0.007), 4 and 1 (p = 0.008), 3 and 2 (p < 0.001), and 3 and 1 (p = 0.001). No significant difference was found to exist specifically among the two maximally rotated postures or the two minimally rotated postures. Therefore, at a frequency of 5 Hz, the degree to which the neck and trunk are rotated significantly affects STHT. Peak transmissibility that occurred at the 3–6 Hz frequency range may put operators at an increased risk of injury in the lower back region due to the potential for resonance to occur [31,49].
Visual observation of the CSD transfer functions (Figure 6) illustrates shifts in dominant frequency peaks from pre- to post-condition, as well as among posture. These shifts in frequency, with respect to the transmissibility of the vibration, further indicate that the degree of neck and trunk rotation influence the way vibration behaves as it is transmitted from seat to head. These findings correspond with those of a previous studies where changing posture from erect to slouched caused the natural frequency of the apparent mass of the entire body mode to decrease [24]. When the posture of subjects changed from slouched to tensed, the resonance frequency increased by 0.25 Hz [10]. Furthermore, the pelvic orientation of an individual exposed to seated WBV was determined to significantly influence acceleration transmissibility from seat to head [19].
Participants reported higher levels of discomfort post-condition for all measured conditions, where the greatest difference in discomfort was found to exist for the condition combining rotation and WBV exposure. It was anticipated that time (p = 0.003) would be a significant factor in discomfort rating because back muscle activity, while sitting with vibration, is higher than sitting without vibration [15,50]. Additionally, it has been shown that sustaining twisted, seated postures similar to those used by mining vehicle operators generates back muscle fatigue [50]. However, time was not expected to be significant for the conditions where participants were not exposed to prolonged WBV or rotated neck and trunk postures (i.e., conditions 1 and 2). The fact that participants reported higher levels of discomfort in the condition where they were not exposed to prolonged WBV or non-neutral postures was unexpected and may have occurred as a result of discomfort related strictly to prolonged sitting [51].
On average, the conditions that exposed participants to prolonged rotated postures with (mean (SD) = 0.89 (1.15)) and without vibration (1.04 (1.35)) yielded higher discomfort ratings when compared to the neutral conditions with (0.64 (1.01)) and without vibration exposure (0.30 (0.63)). Increased levels of discomfort have previously been documented when participants were exposed to vibration in a posture in which the neck was rotated as far as comfortably possible compared to postures with a neutral neck position [32]. These findings may suggest that increased muscle fatigue can occur because of prolonged exposure to one or both variables. When muscle fatigue occurs, it can lead to less stiff postures, and with decreased stiffness comes a decrease in vibration transmissibility [19,25]. The resulting muscle fatigue is associated with an increased risk of injury [52]. It was observed that as the back muscles of a participant became increasingly fatigued, the muscle reflex designed to protect the spine from shock injuries was delayed, supporting the conclusion that an increased risk of injury is present when exposed to WBV while experiencing muscle fatigue [52].
Another study of posture combined with WBV conducted recently looked at four neck postures of head-up, head-down, head-to-the-side, and neutral neck posture, with a vibration frequency range from 2–8 Hz [23]. This study found that all variations of head-neck postures, compared to neutral had a significant effect on subjective discomfort ratings. Lastly, the amplitude of vibration was also found to influence comfort level where greater amplitudes resulted in increased levels of discomfort [23]. In addition to the aforementioned findings, participants in this study reported the greatest amount of discomfort to be in the areas of the neck and lower back. These results correspond to the findings of previous researchers where exposure to WBV combined with poor posture was found to increase the risk of lower back disorders [6,11,28,53,54]. This is also supported by a study conducted by Song et al. [55], demonstrating the negative impact of poor posture on the subjective thresholds of discomfort of participants. It was concluded that participants experienced greater levels of discomfort in non-neutral postures, decreasing their self-reported threshold as the postures shifted further away from a neutral position [55]. Furthermore, discomfort is considered an early indicator of injury risk [33], and therefore the postures identified as most uncomfortable are likely to be the most harmful.
An almost-equal number of male and female participants were recruited for this study as it has been previously shown that males report less discomfort than females when exposed to the same vibration signal [35,56]. In this study, however, no significant difference was found to exist between genders on measures of discomfort. The proposed discomfort difference among genders is thought to occur due to differences in apparent mass and mechanical impedance [9]. However, the average mass of the male participants (77 kg) in this study only differed by one kilogram from the female participants (78 kg), and this may explain the lack of significant findings in discomfort ratings among genders.
This study did have a few limitations, which should be accounted for in future work. Primarily, the WBV input exposure was limited to a sinusoidal vertical (z-axis) signal at a single frequency, whereas significant differences in STHT have been found in multiple axes [15,32,35,38] and to vary with frequency [25,27]. Additionally, previous studies indicated that higher levels of discomfort have been reported with exposure to 6 degrees of freedom vibration in the XZ plane [32,35,56]. Vibrations in the z-axis are associated with less discomfort than vibrations in the x-axis and y-axis; however, they have been observed in larger quantities and thus contribute significantly to discomfort [43]. Furthermore, mobile equipment operators are exposed to 6 degrees of freedom vibrations in the field, and therefore this study likely underestimated the severity of WBV experienced in an occupational setting.
Studies have observed that increasing frequency corresponds with decreasing discomfort values, suggesting that idle vibrations at lower frequencies contribute more heavily to subjective discomfort than at higher frequencies [55,57]. Additionally, increasing magnitudes of vibration intensify the uncomfortable sensations felt by individuals at the same frequency [58]. Future studies should incorporate several different vibration profiles, with varying levels of magnitude and dominant frequencies, to better match real world occupational exposures. This is important when considering the accuracy of results of ISO 2631-1, as it has been found to underestimate participant discomfort at higher frequencies [58] and injury risk, following periods of exposure to WBV [15].
Another limitation to this study was that more specific subject anthropometric measurements were not considered, for example adipose tissue [25,59], girth measurements for weight distribution [25], pelvic tilt [19,25], and slouching [24]. Increased adipose tissue is believed to lead to greater attenuation of vibration; increased girth measurements are believed to measure increased areas of adipose tissue and thus decrease transmissibility to that area of the body; pelvic tilt includes flexing the hip, decreased lumbar lordosis, increased intervertebral disc pressure and muscle activity, thus transmitting vibration more readily through the spine; and finally, poor posture combined with WBV exposure increases the risk of lower back disorders [19,24,59]. Increased BMIs have been associated with increased prevalence of LBP in heavy truck drivers [6]. It is difficult to make specific conclusions regarding the differences in measured frequency-weighted r.m.s. accelerations without further information to account for these differences.
Furthermore, due to ethics restrictions, participants were only exposed to approximately 45 min of vibration, which is not indicative of an occupational vibration exposure. Therefore, future studies should consider measuring perceived discomfort over a longer duration of time to better represent a typical exposure. Additionally, individuals who participated in this study were not accustomed to prolonged durations of vibration exposure. Future studies should recruit a sample of miners, or mobile equipment operators so that the findings of the study will be more transferable to an occupational setting.

5. Conclusions

The effect of four rotated neck and trunk seated postures on STHT and self-reported discomfort were examined in a laboratory experiment involving four conditions. Analysis of the STHT values found that regardless of the condition and time (pre- or post-) in all postures, the vibration measured at the head was higher than vibration measured at the seat. As the degree of rotation increased in each posture, the magnitude of mean STHT values also increased, indicating that the degree of rotated neck and trunk postures influences the STHT. Generally, STHT values from pre- to post-condition decreased for all postures in all conditions. This suggests that the vibration energy transmitted to the human body from the seat surface is increasingly being absorbed by the tissues of the spine as time progresses. This absorbed energy may be responsible for damaging the tissues in the spine and increasing occupational risk for LBP. Due to the small sample size, the study did not have enough statistical power to isolate the effect of rotated posture on vibration transmissibility from other variables such as prolonged seated vibration exposure.
Observing the mean self-reported discomfort reported, exposure to WBV for extended periods of time resulted in significantly greater ratings of discomfort amongst participants. Discomfort scores were aggravated by postures in which the neck and trunk were rotated. This increase was especially prominent in positions involving larger degrees of rotation in the neck and trunk from neutral (i.e., 45° rotation). Unfortunately, the current ISO 2631-1 standard does not consider the additional discomfort caused by non-neutral seated postures. As such, the outlined exposure limits may be beyond appropriate levels, promoting limits that still present a risk of harm. Similar to recent studies, these discoveries outline the importance of minimizing lengthened exposure to WBV conditions in the workplace as it contributes to higher ratings of individual discomfort, and increases the potential for musculoskeletal injuries. Future research should include the following: using a population representative of LHD truck drivers (or completing a field study); obtaining more specific anthropometric measurements of participants; use of EMG to measure muscle activation; increased seated posture control (i.e., including pelvic tilt and slouching); and finally varying the frequency and acceleration of vibration exposure.

Author Contributions

Conceptualization, K.A.G. and T.R.E.; methodology, K.A.G., E.A.K. and T.J.T.; software, K.A.G. and T.R.E.; validation, K.A.G.; formal analysis, K.A.G.; investigation, K.A.G., E.A.K. and T.J.T.; resources, T.R.E.; data curation, K.A.G.; writing—original draft preparation, K.A.G., E.A.K. and T.J.T.; writing—review and editing, E.A.K., T.J.T. and T.R.E.; visualization, K.A.G.; supervision, T.R.E.; project administration, T.R.E.; funding acquisition, T.R.E. All authors have read and agreed to the published version of the manuscript.

Funding

This research was funded by Natural Sciences and Engineering Research Council of Canada (NSERC) Discovery Grant, grant number RGPIN/4252-2015.

Institutional Review Board Statement

The study was conducted in accordance with Laurentian University and approved by the Research Ethics Board (REB#20100508).

Informed Consent Statement

Informed consent was obtained from all subjects involved in the study.

Data Availability Statement

Not applicable.

Acknowledgments

This research was supported by the Natural Sciences and Engineering Research Council (NSERC) of Canada. A special thank you to Courtney Harnish for assistance with data collection, and Joel Jack for assistance with data analysis.

Conflicts of Interest

The authors declare no conflict of interest.

References

  1. ISO-2631-1; Mechanical Vibration and Shock—Evaluation of Human Exposure to Whole-Body Vibration—Whole-Body Vibration—Part 1: General Requirements. International Organization for Standardization: Geneva, Switzerland, 1997.
  2. Tak, S.; Calvert, G.M. The estimated national burden of physical ergonomics hazards among US workers. Am. J. Ind. Med. 2011, 54, 395–404. [Google Scholar] [CrossRef] [PubMed]
  3. Palmer, K.T.; Griffin, M.J.; Bendall, H.; Pannett, B.; Coggon, D. Prevalence and pattern of occupational exposure to whole body vibration in Great Britain: Findings from a national survey. Occup. Environ. Med. 2000, 57, 229–236. [Google Scholar] [CrossRef] [PubMed] [Green Version]
  4. Bovenzi, M.; Pinto, I.; Stacchini, N. Low back pain in port machinery operators. J. Sound Vib. 2002, 253, 3–20. [Google Scholar] [CrossRef]
  5. Paschold, H.W.; Sergeev, A.V. Whole-body vibration knowledge survey of U.S. occupational safety and health professionals. J. Saf. Res. 2009, 40, 171–176. [Google Scholar] [CrossRef] [PubMed]
  6. Nazerian, R.; Korhan, O.; Shakeri, E. Work-related musculoskeletal discomfort among heavy truck drivers. Int. J. Occup. Saf. Ergon. 2020, 26, 233–244. [Google Scholar] [CrossRef]
  7. WSIB. By the Numbers: Schedule 1—Injuries and Occupational Disease—Part of Body. Available online: https://www.wsib.ca/en/bythenumbers/schedule-1-injuries-and-occupational-disease-part-body (accessed on 27 December 2021).
  8. Paddan, G.S.; Griffin, M.J. A review of the transmission of translational seat vibration to the head. J. Sound Vib. 1998, 215, 863–882. [Google Scholar] [CrossRef]
  9. Mansfield, N.J. Review article: Impedance methods (apparent mass, driving point mechanical impedance and absorbed power) for assessment of the biomechanical response of the seated person to whole-body vibration. Ind. Health 2005, 43, 378–389. [Google Scholar] [CrossRef] [Green Version]
  10. Adam, S.A.; Jalil, N.A.; Razali, K.M.; Ng, Y.G. The effects of posture on suspension seat transmissibility during exposure to vertical whole-body vibration. IOP Conf Ser. J. Phys. 2019, 1262, 1–8. [Google Scholar]
  11. Donati, P. A procedure for developing a vibration test method for specific categories of industrial trucks. J. Sound Vib. 1998, 215, 947–957. [Google Scholar] [CrossRef]
  12. Hoy, J.; Mubarak, N.; Nelson, S.; De Landas, M.S.; Magnusson, M.; Okunribido, O.; Pope, M. Whole body vibration and posture as risk factors for low back pain among forklift truck drivers. J. Sound Vib. 2005, 284, 933–946. [Google Scholar] [CrossRef]
  13. Bovenzi, M.; Rui, F.; Negro, C.; D’Agostin, F.; Angotzi, G.; Bianchi, S.; Bramanti, L.; Festa, G.; Gatti, S.; Pinto, I.; et al. An epidemiological study of low back pain in professional drivers. J. Sound Vib. 2006, 298, 514–539. [Google Scholar] [CrossRef]
  14. Eger, T.; Stevenson, J.; Callaghan, J.; Grenier, S.G. Predictions of health risks associated with the operation of load-haul-dump mining vehicles: Part 2—Evaluation of operator driving postures and associated postural loading. Int. J. Ind. Ergon. 2008, 38, 801–815. [Google Scholar] [CrossRef]
  15. Kim, J.H.; Dennerlein, J.T.; Johnson, P.W. The effect of a multi-axis suspension on whole body vibration exposures and physical stress in the neck and low back in agricultural tractor applications. Appl. Ergon. 2018, 68, 80–89. [Google Scholar] [CrossRef] [PubMed]
  16. Mansfield, N.J.; Maeda, S. Effect of backrest and torso twist on the apparent mass of the seated body exposed to vertical vibration. Ind. Health 2005, 43, 413–420. [Google Scholar] [CrossRef] [Green Version]
  17. Raffler, N.; Rissler, J.; Ellegast, R.; Schikowsky, C.; Kraus, T.; Ochsmann, E. Combined exposures of whole-body vibration and awkward posture: A cross sectional investigation among occupational drivers by means of simultaneous field measurements. Ergonomics 2017, 60, 1564–1575. [Google Scholar] [CrossRef]
  18. Newell, G.S.; Mansfield, N.J. Evaluation of reaction time performance and subjective workload during whole-body vibration exposure while seated in upright and twisted postures with and without armrests. Int. J. Ind. Ergon. 2008, 38, 499–508. [Google Scholar] [CrossRef]
  19. Zimmerman, C.L.; Cook, T.M. Effects of vibration frequency and postural changes on human responses to seated whole-body vibration exposure. Int. Arch. Occup. Environ. Health 1997, 69, 165–179. [Google Scholar] [CrossRef]
  20. Mansfield, N.J.; Griffin, M.J. Effects of posture and vibration magnitude on apparent mass and pelvis rotation during exposure to whole-body vertical vibration. J. Sound Vib. 2002, 253, 93–107. [Google Scholar] [CrossRef]
  21. Bhiwapurkar, M.K.; Saran, V.H.; Harsha, S.P. Effects of posture and vibration magnitude on seat to head transmissibility during exposure to fore-and-aft vibration. J. Low Freq. Noise 2019, 38, 826–838. [Google Scholar] [CrossRef] [Green Version]
  22. Wang, W.; Rakheja, S.; Boileau, P.-E. Effects of sitting postures on biodynamic response of seated occupants under vertical vibration. Int. J. Ind. Ergon. 2004, 34, 289–306. [Google Scholar] [CrossRef]
  23. Rahmatalla, S.; DeShaw, J. Effective seat-to-head transmissibility in whole-body vibration: Effects of posture and arm position. J. Sound Vib. 2011, 330, 6277–6286. [Google Scholar] [CrossRef]
  24. Kitzaki, S.; Griffin, M.J. Resonance behaviour of the seat human body and effects of posture. J. Biomech. 1998, 31, 143–149. [Google Scholar] [CrossRef]
  25. Jack, R.J.; Eger, T.R. The effects of posture on seat-to-head whole-body vibration transmission. J. Low Freq. Noise 2008, 27, 309–325. [Google Scholar] [CrossRef] [Green Version]
  26. Wikstrom, B.-O. Effects from twisted postures and whole-body vibration during driving. Int. J. Ind. Ergon. 1994, 12, 61–75. [Google Scholar] [CrossRef]
  27. Eger, T.; Dickey, J.P.; Boileau, P.-É.; Stevenson, J.M. Changes in seat-head whole-body vibration transmissibility and muscle activity under asymmetric neck and trunk postures. In Proceedings of the 2nd American Conference on Human Vibration, Chicago, IL, USA, 4–6 June 2008. [Google Scholar]
  28. Scutter, S.; Turker, K.S.; Hall, R. Headaches and neck pain in farmers. Aust. J. Rural. Health 1997, 5, 2–5. [Google Scholar] [CrossRef]
  29. Eger, T.; Stevenson, J.; Boileau, P.É.; Salmoni, A. Predictions of health risks associated with the operation of load-haul-dump mining vehicles: Part 1—Analysis of whole-body vibration exposure using ISO 2631-1 and ISO-2631-5 standards. Int. J. Ind. Ergon. 2008, 38, 726–738. [Google Scholar] [CrossRef]
  30. Smets, M.P.H.; Eger, T.R.; Grenier, S.G. Whole-body vibration experienced by haulage trick operators in surface mining operations: A comparison of various analysis methods utilized in the prediction of health risks. Appl. Ergon. 2010, 41, 763–770. [Google Scholar] [CrossRef]
  31. Griffin, M.J. Handbook of Human Vibration, 1st ed.; Academic Press: London, UK, 1990; p. 988. [Google Scholar]
  32. DeShaw, J.; Rahmatalla, S. Predictive discomfort in single- and combined-axis whole-body vibration considering different seated postures. Hum. Factors 2014, 56, 850–863. [Google Scholar] [CrossRef]
  33. Hamberg-Van Reenen, H.H.; Van Der Beek, A.J.; Blatter, B.M.; Van Der Grinten, M.P.; Van Mechelen, W.; Bongers, P.M. Does musculoskeletal discomfort at work predict future musculoskeletal pain? Ergonomics 2008, 51, 637–648. [Google Scholar] [CrossRef]
  34. Grenier, S.G.; Eger, T.R.; Dickey, J.P. Predicting discomfort scores reported by LHD operators using whole-body vibration exposure values and musculoskeletal pain scores. Work 2010, 35, 49–62. [Google Scholar] [CrossRef]
  35. Dickey, J.P.; Eger, T.R.; Oliver, M.L.; Boileau, P.E.; Trick, L.M.; Edwards, A.M. Multi-axis sinusoidal whole-body vibrations: Part 1—How long should the vibration and rest exposures be for reliable discomfort measures? J. Low Freq. Noise 2006, 25, 175–184. [Google Scholar] [CrossRef]
  36. Dickey, J.P.; Eger, T.R.; Oliver, M.L.; Boileau, P.E.; Trick, L.M.; Edwards, A.M. Multi-axis sinusoidal whole-body vibrations: Part 2—Relationship between vibration total value and discomfort varies between vibration axes. J. Low Freq. Noise 2007, 26, 195–204. [Google Scholar] [CrossRef]
  37. Patelli, G.; Griffin, M.J. Effects of seating on the discomfort caused by mechanical shocks: Measurement and prediction of SEAT values. Appl. Ergon. 2019, 74, 134–144. [Google Scholar] [CrossRef] [PubMed] [Green Version]
  38. Paddan, G.S.; Griffin, M.J. Transmission of yaw seat vibration to the head. J. Sound Vib. 2000, 229, 1077–1095. [Google Scholar] [CrossRef]
  39. European Parliament. Directive 2002/44/EC of the European Parliament and of the council on the minimum health and safety requirements regarding the exposure of workers to the risks arising from physical agents (vibration). Off. J. Eur. Communities 2002, 6, 13–19. [Google Scholar]
  40. Guide, B.S. BS 6841: Measurement and Evaluation of Human Exposure to Whole-Body Mechanical Vibration and Repeated Shock; BSI: London, UK, 1987; p. 24. [Google Scholar]
  41. SAE J898_199410; Control Locations for Off-Road for Machines. The Society of Automotive Engineers: Warrendale, PA, USA, 1994.
  42. Dempsey, T.K.; Leatherwood, J.D.; Clevenson, S.A. Development of noise and vibration ride comfort criteria. J. Acoust. Soc. Am. 1979, 65, 124–132. [Google Scholar] [CrossRef]
  43. Du, B.B.; Bigelow, P.L.; Wells, R.P.; Davies, H.W.; Hall, P.; Johnson, P.W. The impact of different seats and whole-body vibration exposures on truck driver vigilance and discomfort. Ergonomics 2018, 61, 528–537. [Google Scholar] [CrossRef]
  44. Kolich, M.; Wan, D.; Pielemeier, W.J.; Meier Jr, R.C.; Szott, M.L. A comparison of occupied seat vibration transmissibility from two independent facilities. J. Vib. Control 2006, 12, 189–196. [Google Scholar] [CrossRef]
  45. Kittusamy, N.K.; Buchholz, B. Whole-body vibration and postural stress among operators of construction equipment: A literature review. J. Saf. Res. 2004, 35, 255–261. [Google Scholar] [CrossRef]
  46. Pope, M.H.; Wilder, D.G.; Magnusson, M. Possible mechanisms of low back pain due to whole-body vibration. J. Sound Vib. 1998, 215, 687–697. [Google Scholar] [CrossRef]
  47. Paddan, G.S.; Griffin, M.J. Effect of seating on exposures to whole-body vibration in vehicles. J. Sound Vib. 2002, 253, 215–241. [Google Scholar] [CrossRef]
  48. Demic, M.; Lukic, J. Investigation of the transmission of fore and aft vibration through the human body. Appl. Ergon. 2009, 40, 622–629. [Google Scholar] [CrossRef] [PubMed]
  49. Guo, L.-X.; Teo, E.C.; Lee, K.K.; Zhang, Q.H. Vibration characteristics of the human spine under axial cycle loads: Effect of frequency and damping. Spine 2005, 30, 631–637. [Google Scholar] [CrossRef] [PubMed]
  50. Santos, B.R.; Larivière, C.; Delisle, A.; Plamondon, A.; Boileau P, É.; Imbeau, D.; Vibration Research Group. A laboratory study to quantify the biomechanical responses to whole-body vibration: The influence on balance, reflex response, muscular activity and fatigue. Int. J. Ind. Ergon. 2008, 38, 626–639. [Google Scholar] [CrossRef]
  51. Dunk, N.M.; Callaghan, J.P. Lumbar spine movement patterns during prolonged sitting differentiate low back pain developers from matched asymptomatic controls. Work 2010, 35, 3–14. [Google Scholar] [CrossRef] [PubMed]
  52. Nolan, A.J.; Govers, M.E.; Oliver, M.L. Effect of fatigue on muscle latency, muscle activation and perceived discomfort when exposed to whole-body vibration. Ergonomics 2021, 64, 1281–1296. [Google Scholar] [CrossRef] [PubMed]
  53. Milosavljevic, S.; Bergman, F.; Rehn, B.; Carman, A.B. All-terrain vehicle use in agriculture: Exposure to whole body vibration and mechanical shock. Appl. Ergon. 2010, 41, 530–535. [Google Scholar] [CrossRef] [PubMed]
  54. Seidel, H.; Blüthner, R.; Hinz, B.; Schust, M. On the health risk of the lumbar spine due to whole-body vibration—Theoretical approach, experimental data and evaluation of whole-body vibration. J. Sound Vib. 1998, 215, 723–741. [Google Scholar] [CrossRef]
  55. Song, J.T.; Ahn, S.J.; Jeong, W.B.; Yoo, W.S. Subjective absolute discomfort threshold due to idle vibration in passenger vehicles according to sitting posture. Int. J. Automot. Technol. 2017, 18, 293–300. [Google Scholar] [CrossRef]
  56. Mansfield, N.J.; Griffin, M.J. Non-linearities in apparent mass and transmissibility during exposure to whole-body vertical vibration. J. Biomech. 2000, 33, 933–941. [Google Scholar] [CrossRef]
  57. Zhou, Z.; Griffin, M.J. Response of the seated human body to whole-body vertical vibration: Biodynamic responses to mechanical shocks. Ergonomics 2017, 60, 333–346. [Google Scholar] [CrossRef] [PubMed] [Green Version]
  58. Huang, Y.; Zhang, P. Subjective discomfort caused by vertical whole-body vibration in the frequency range 2-100 Hz. Ergonomics 2019, 62, 420–430. [Google Scholar] [CrossRef] [PubMed]
  59. Nawayseh, N.; Sinan, H.A.; Alteneiji, S.; Hamdan, S. Effect of gender on the biodynamic responses to vibration induced by a whole-body vibration training machine. Eng. Med. 2019, 233, 383–392. [Google Scholar] [CrossRef] [PubMed]
Figure 1. Example of a participant test session with full equipment set-up.
Vibration 05 00018 g001
Figure 2. The five postures with their corresponding target position (in degrees) and target colour.
Vibration 05 00018 g002
Figure 3. A schematic timeline overview of (a) an overall test session, (b) the posture block (where discomfort and vibration measurements occurred), and (c) the four possible condition blocks. Dark grey vertical lines on the test session (a) indicate when pre- and post-discomfort and vibration measures were taken. Light grey blocks indicate when vibration was off and green blocks indicate when vibration was on. DM: discomfort measurement; VM: vibration measurement; N: neutral posture; P: posture (1 of 4); T: time; min: minutes; s: seconds.
Vibration 05 00018 g003
Figure 4. Example of the typical placement of the adjustable headband secured to the back of the participant’s head just below occipital protuberance.
Vibration 05 00018 g004
Figure 5. Mean vertical (z-axis) STHT in four rotated neck and trunk postures for 11 participants pre- and post-condition (i.e., before and after varying combinations of rotated postures and vibration exposure).
Vibration 05 00018 g005
Figure 6. The pre- and post-condition, CSD transfer functions from 2 to 12 Hz for all four rotated trunk and neck postures. Coherence values were not consistently above the 0.5 cut-off point at 6 Hz and should be interpreted with extreme caution.
Vibration 05 00018 g006
Figure 7. Mean (±SD) self-reported discomfort scores (0–9) in each posture for 11 participants pre- and post-exposure conditions (combinations of rotation and vibration).
Vibration 05 00018 g007
Table 1. Percentage difference between mean STHT pre- and post-condition in four rotated neck and trunk postures.
Condition
Posture1 (%)2 (%)3 (%)4 (%)
15° Neck 0° Trunk2.767.046.216.62
45° Neck 0° Trunk5.379.795.487.19
45° Neck 15° Trunk1.293.367.784.38
45° Neck 45° Trunk0.005.107.437.94
The colours correspond back to the rest of the colours for the postures throughout the rest of the figures in the manuscript.
Publisher’s Note: MDPI stays neutral with regard to jurisdictional claims in published maps and institutional affiliations.

