
A Multiscale Approach for Predicting Certain Effects of Hand-Transmitted Vibration on Finger Arteries


Abstract
1. Introduction
1.1. Problem of Vibrations Transmitted to the Upper Limb
1.2. Shortcomings in the Standardized Estimation of Vibration Exposure and Their Impact on Some Prevention Strategies
1.3. Objectives
2. Materials and Methods
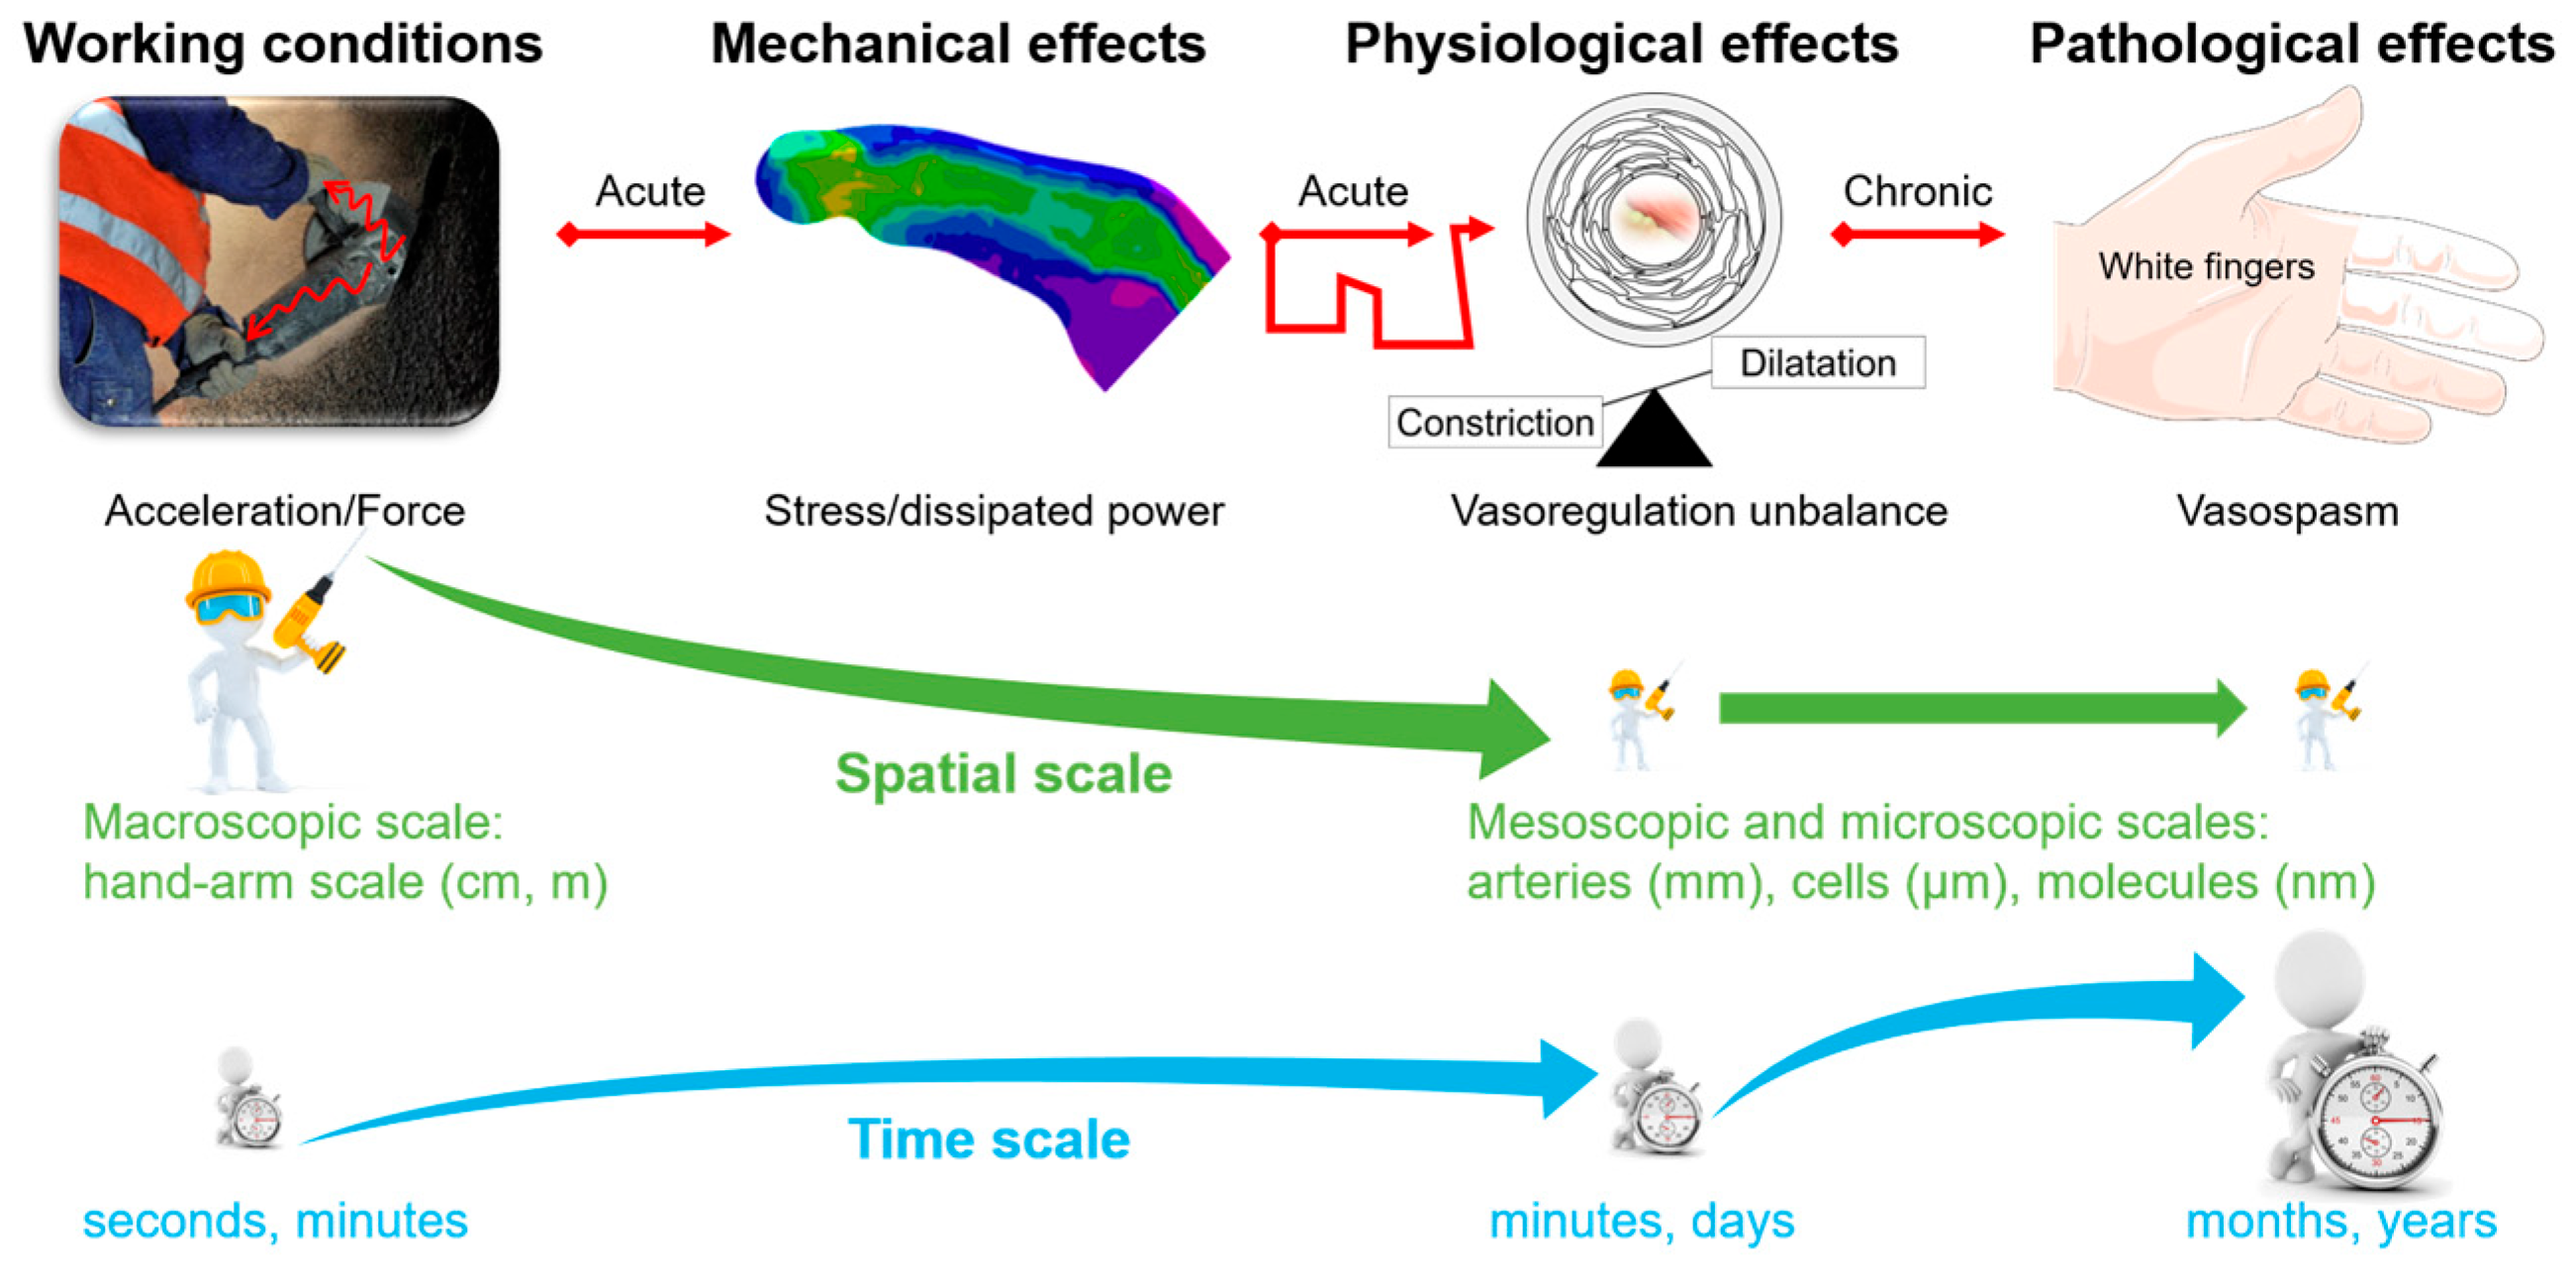
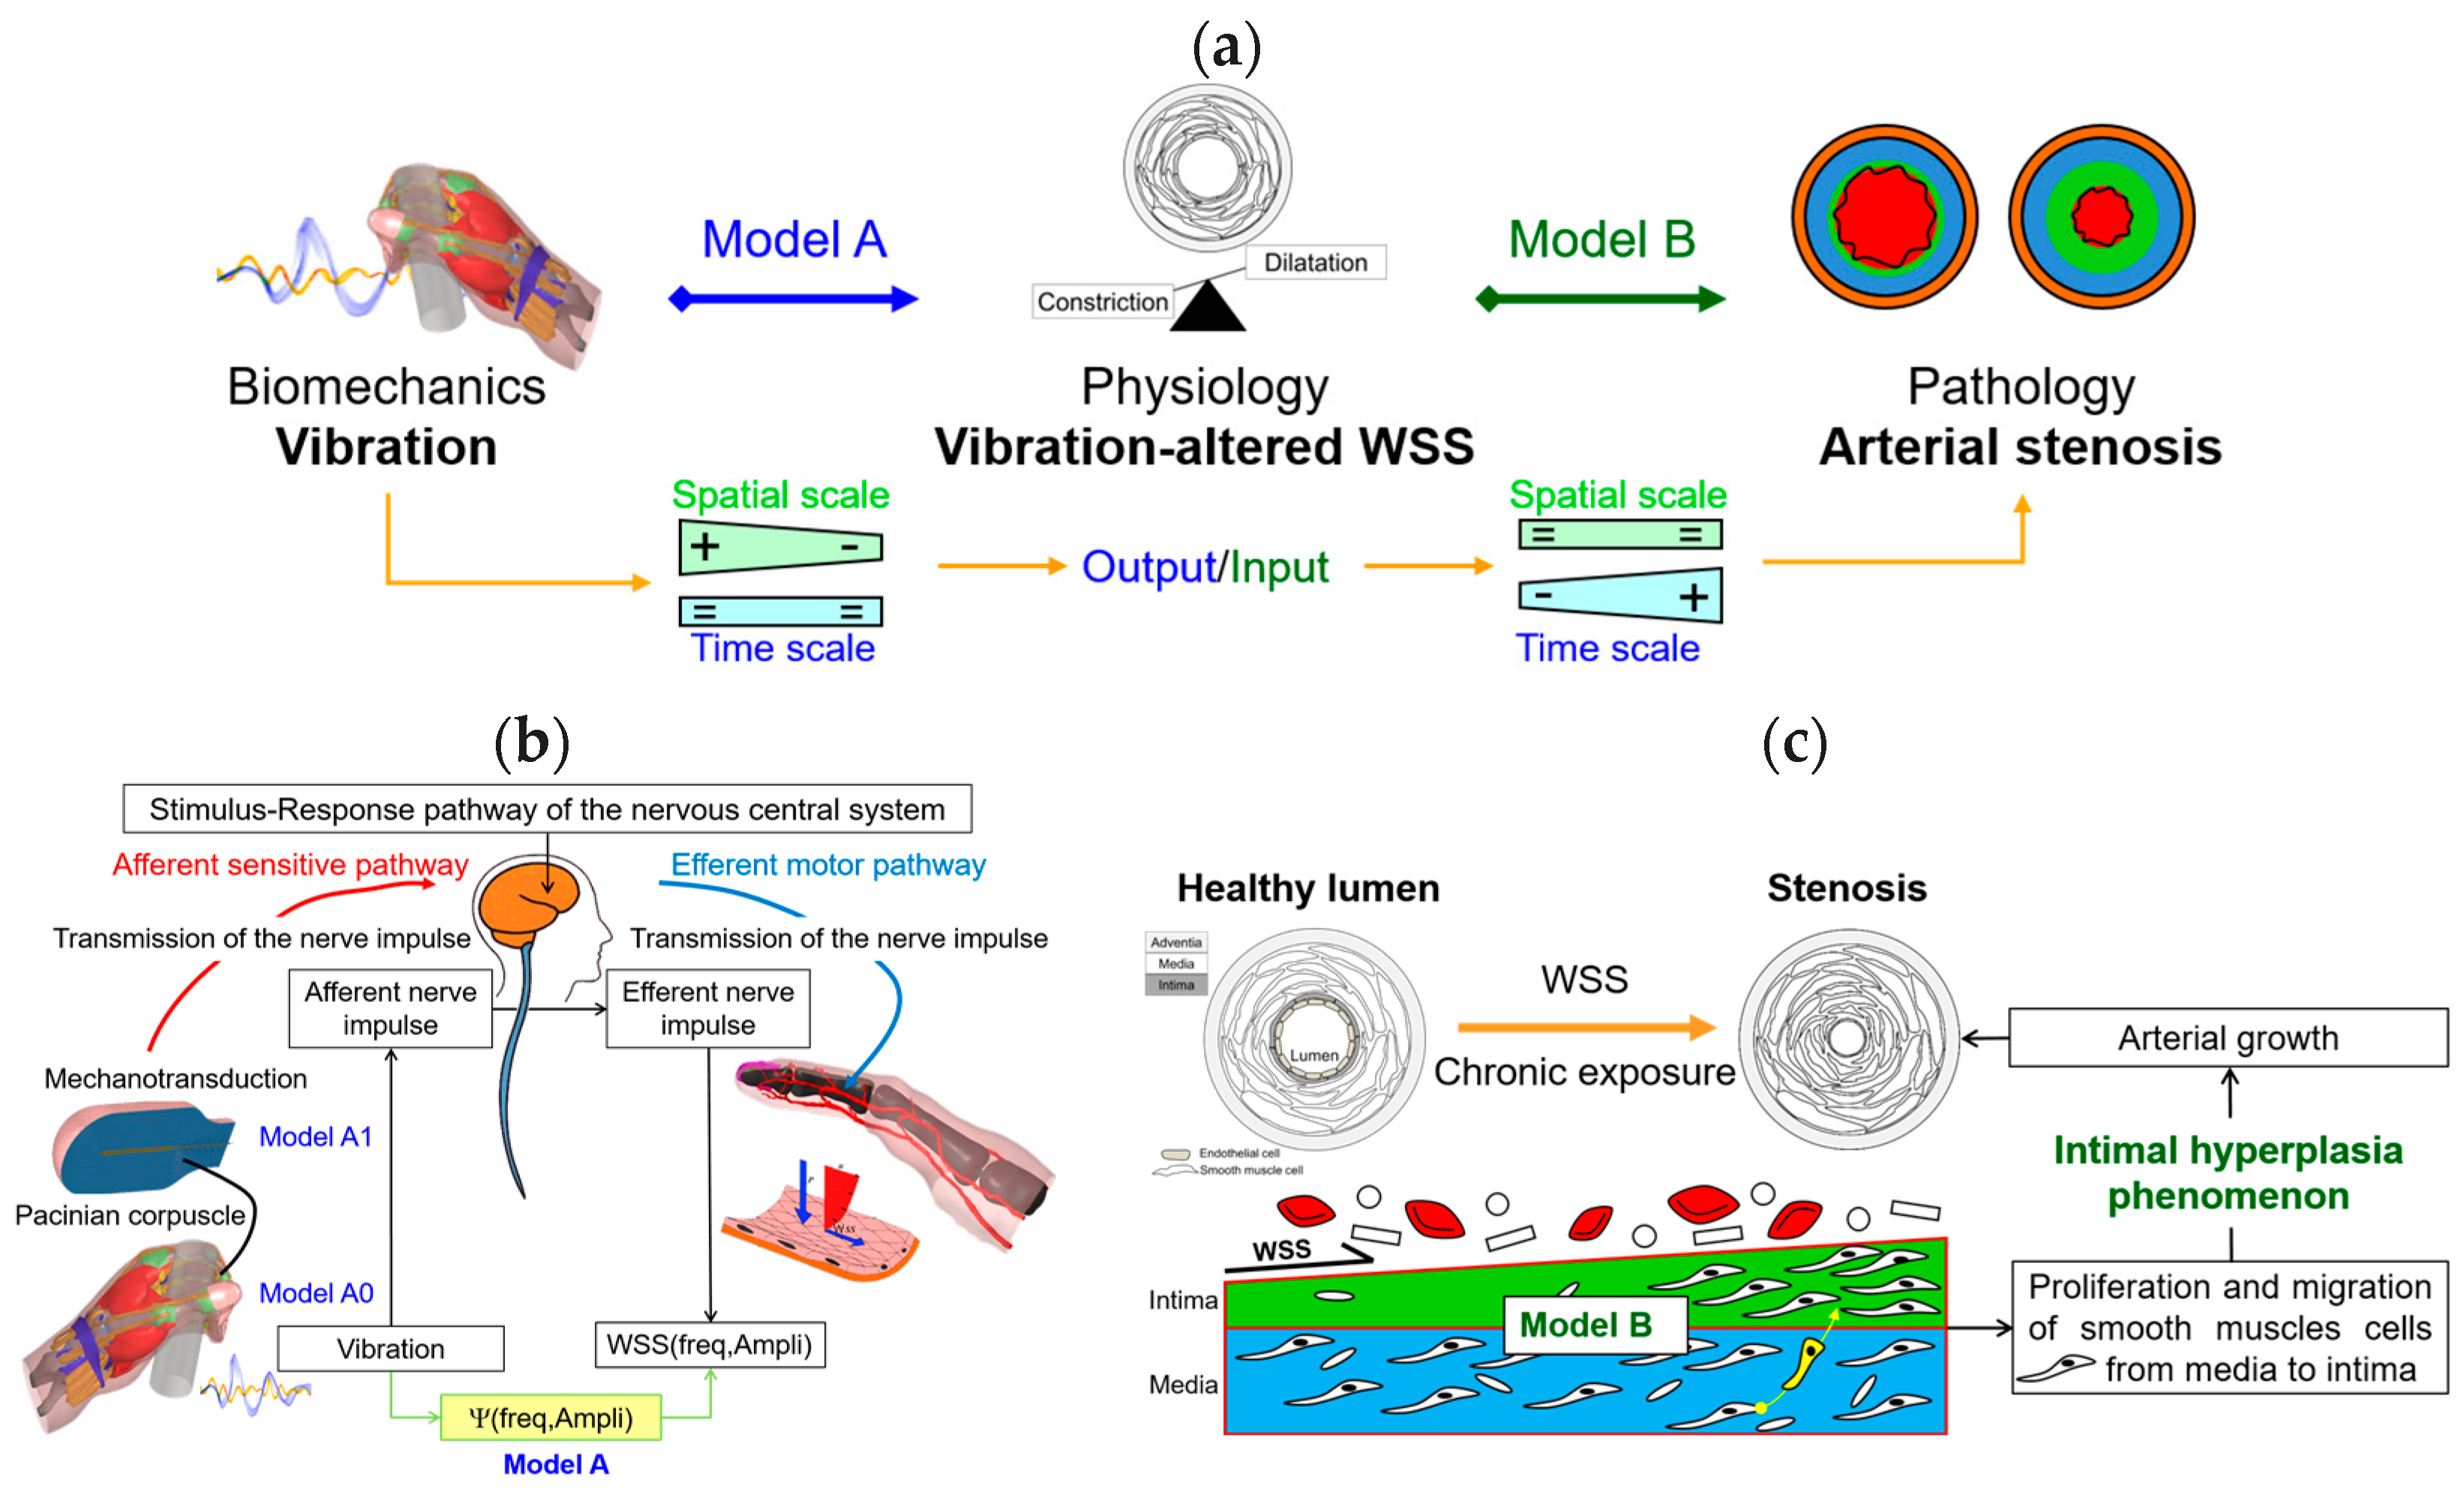
2.1. The Original Strategy Implemented
2.2. Model A: Thermomechanics and Physiology
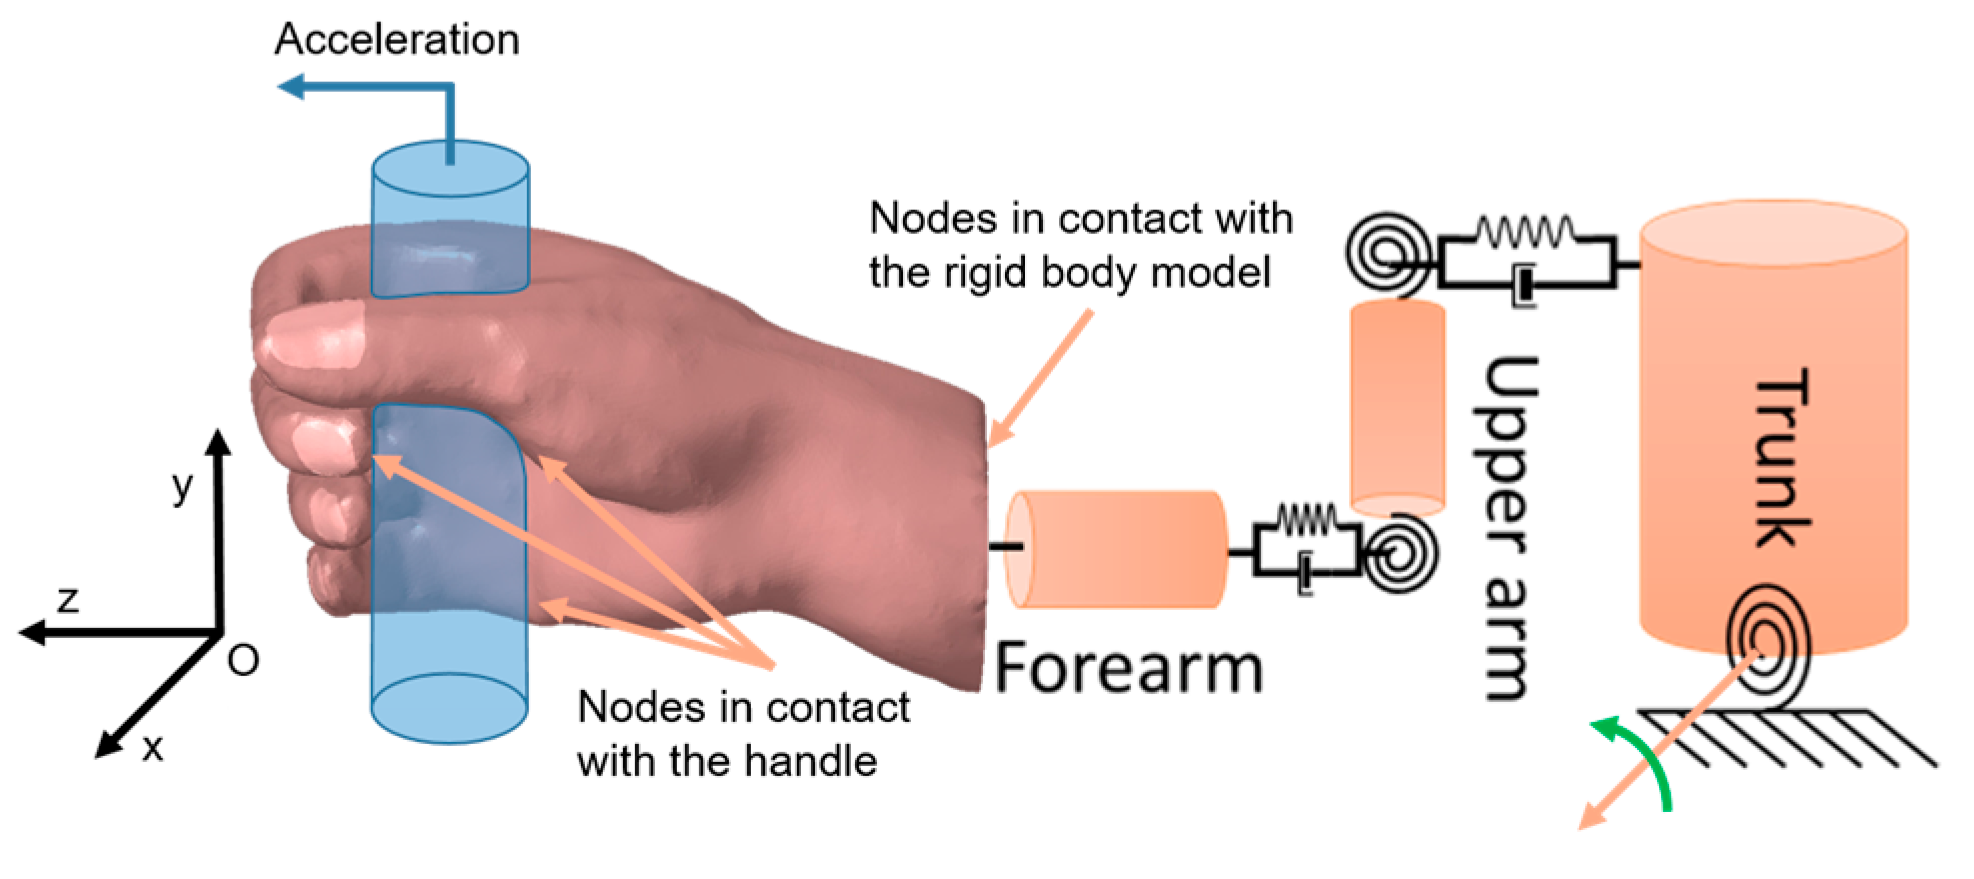
2.2.1. Model A0: Finite Element Model of a Hand Gripping a Handle
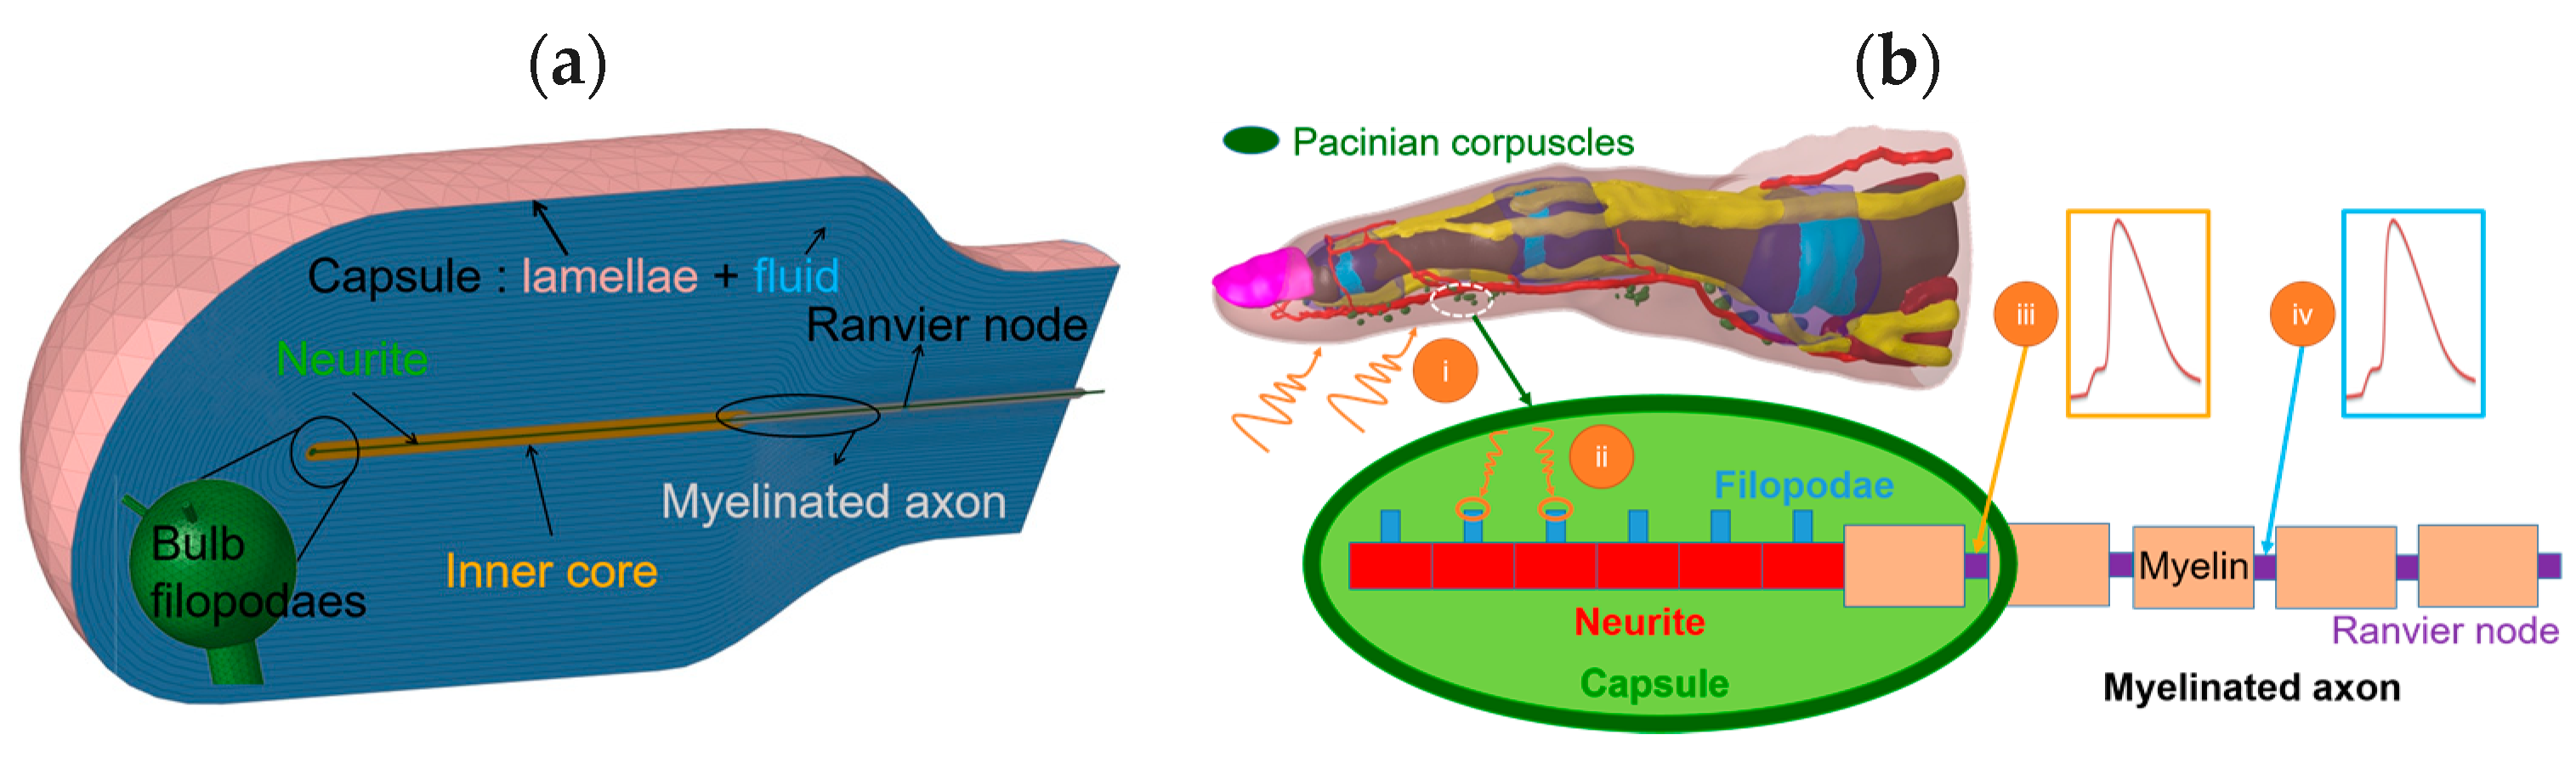
2.2.2. Model A1: Modeling the Mechanotransduction of Pacinian Corpuscles
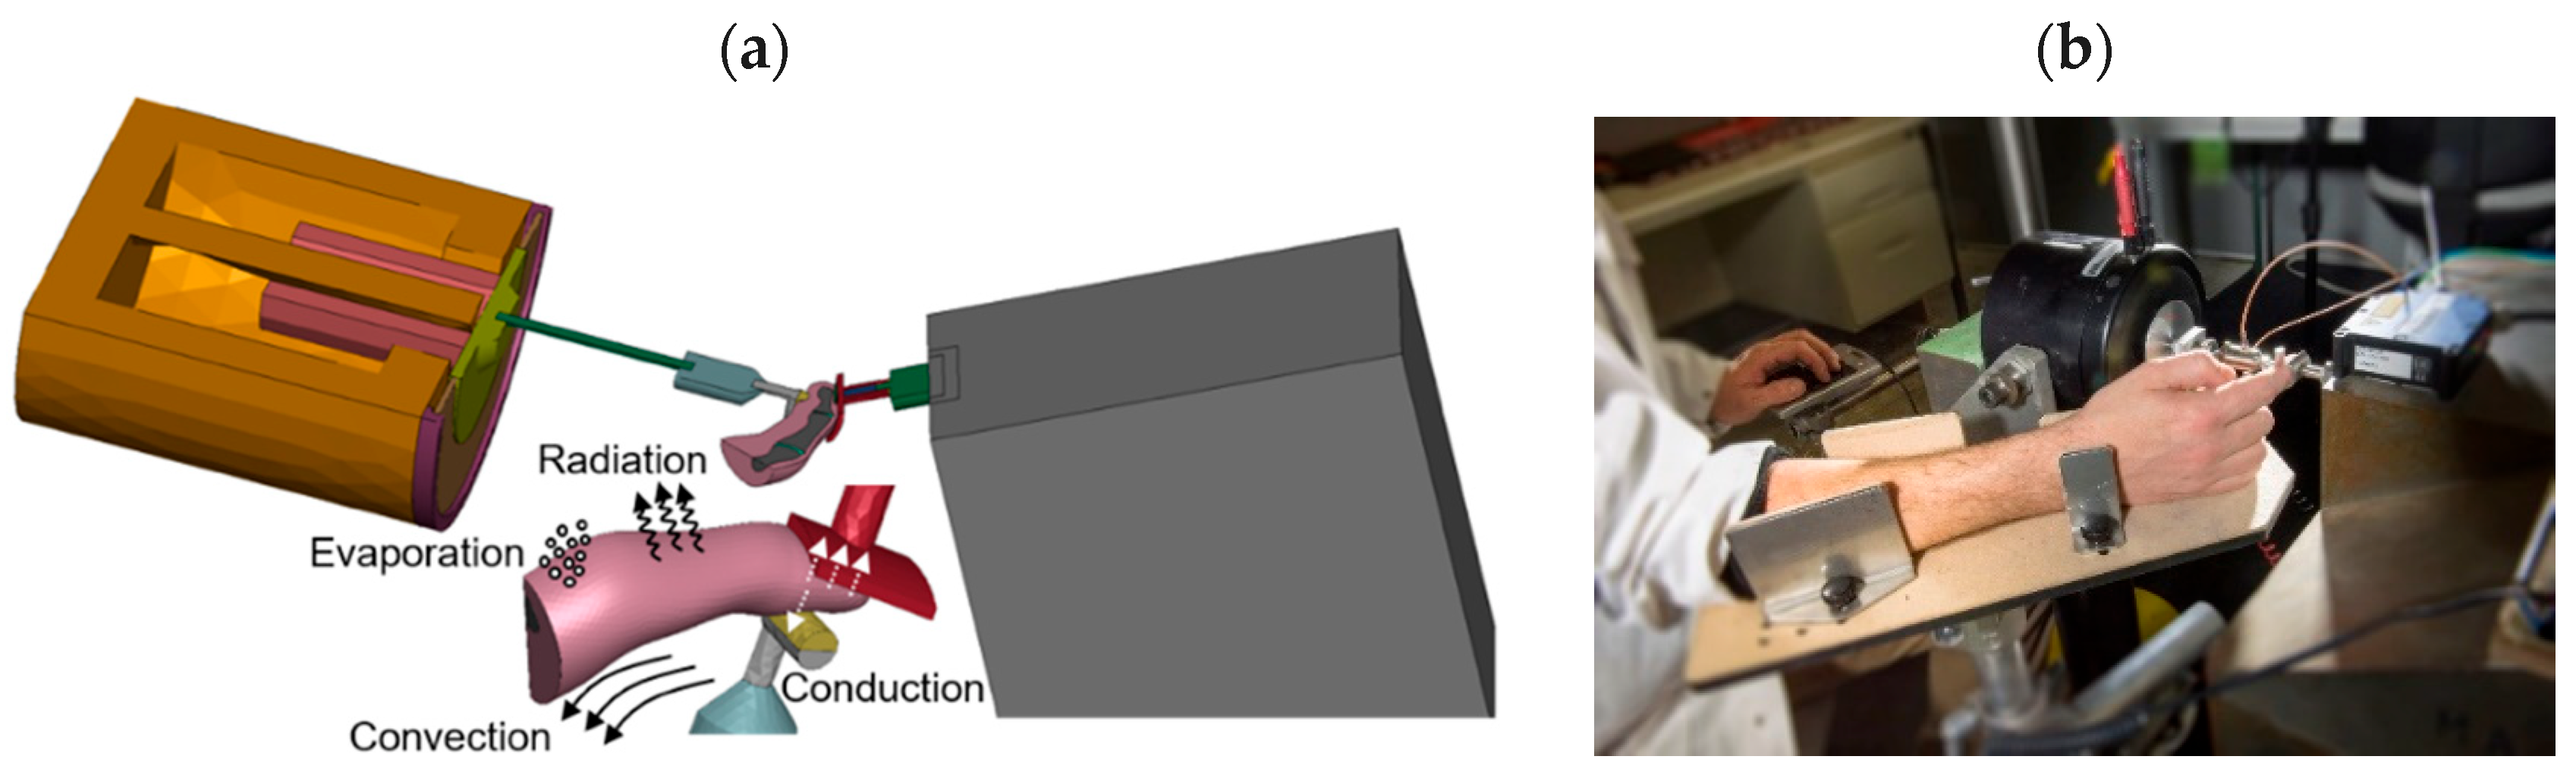
2.2.3. Model A2: Temperature Induced by the Vibrations
2.3. Model A: Effect of Vibrations on Blood/Endothelium Shearing Stress
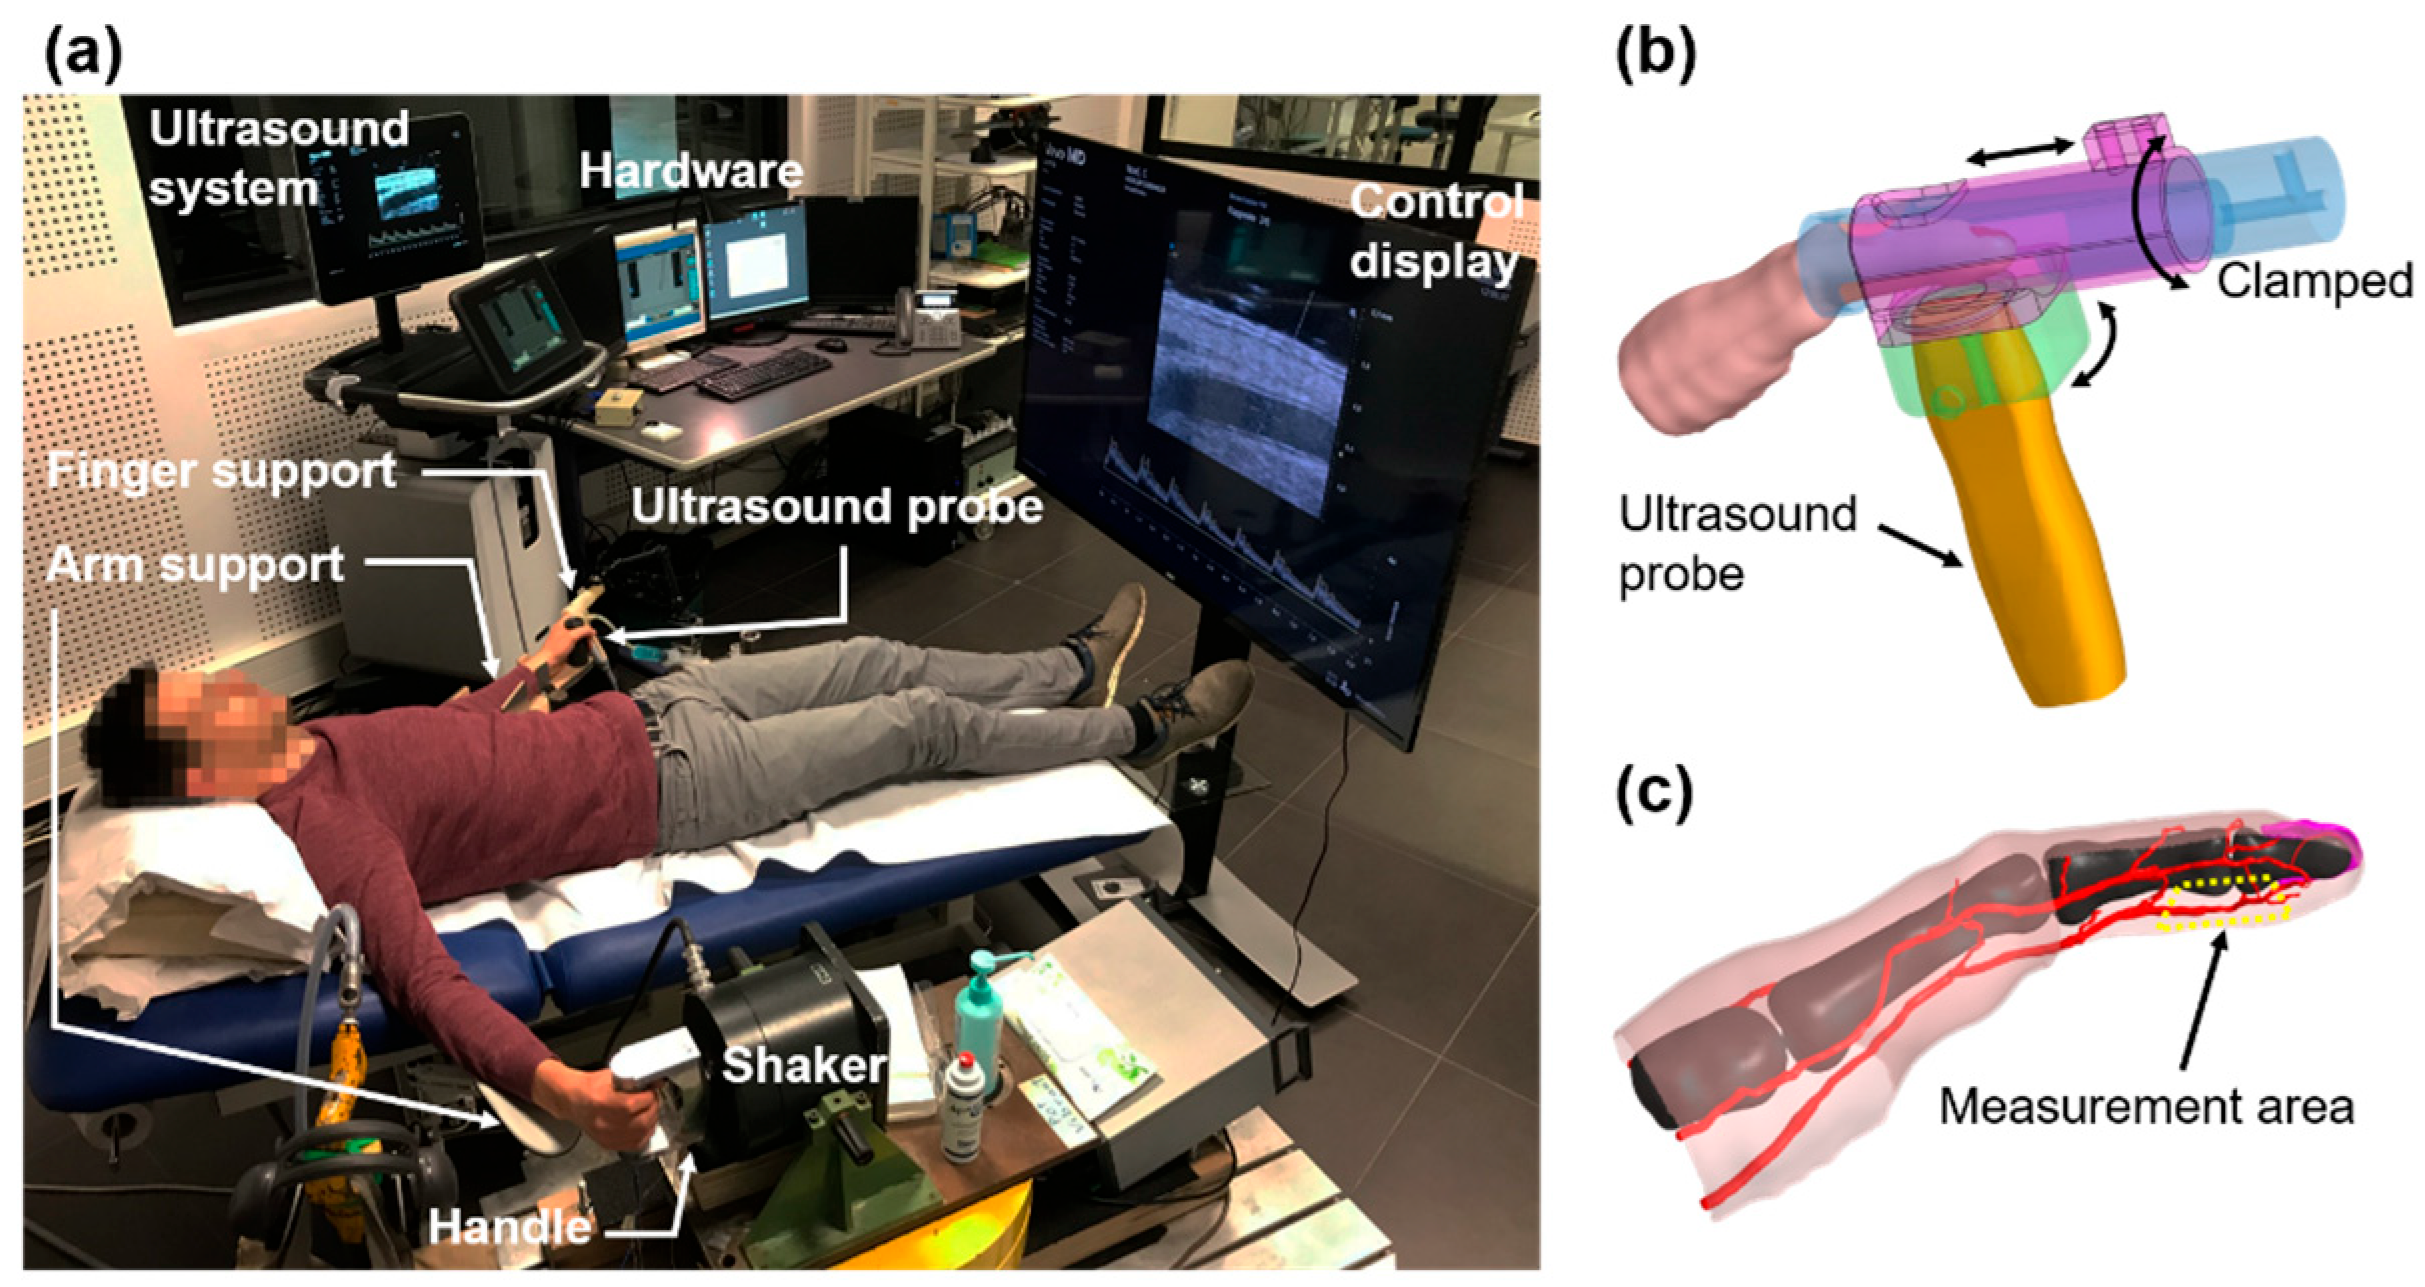
2.3.1. Protocol
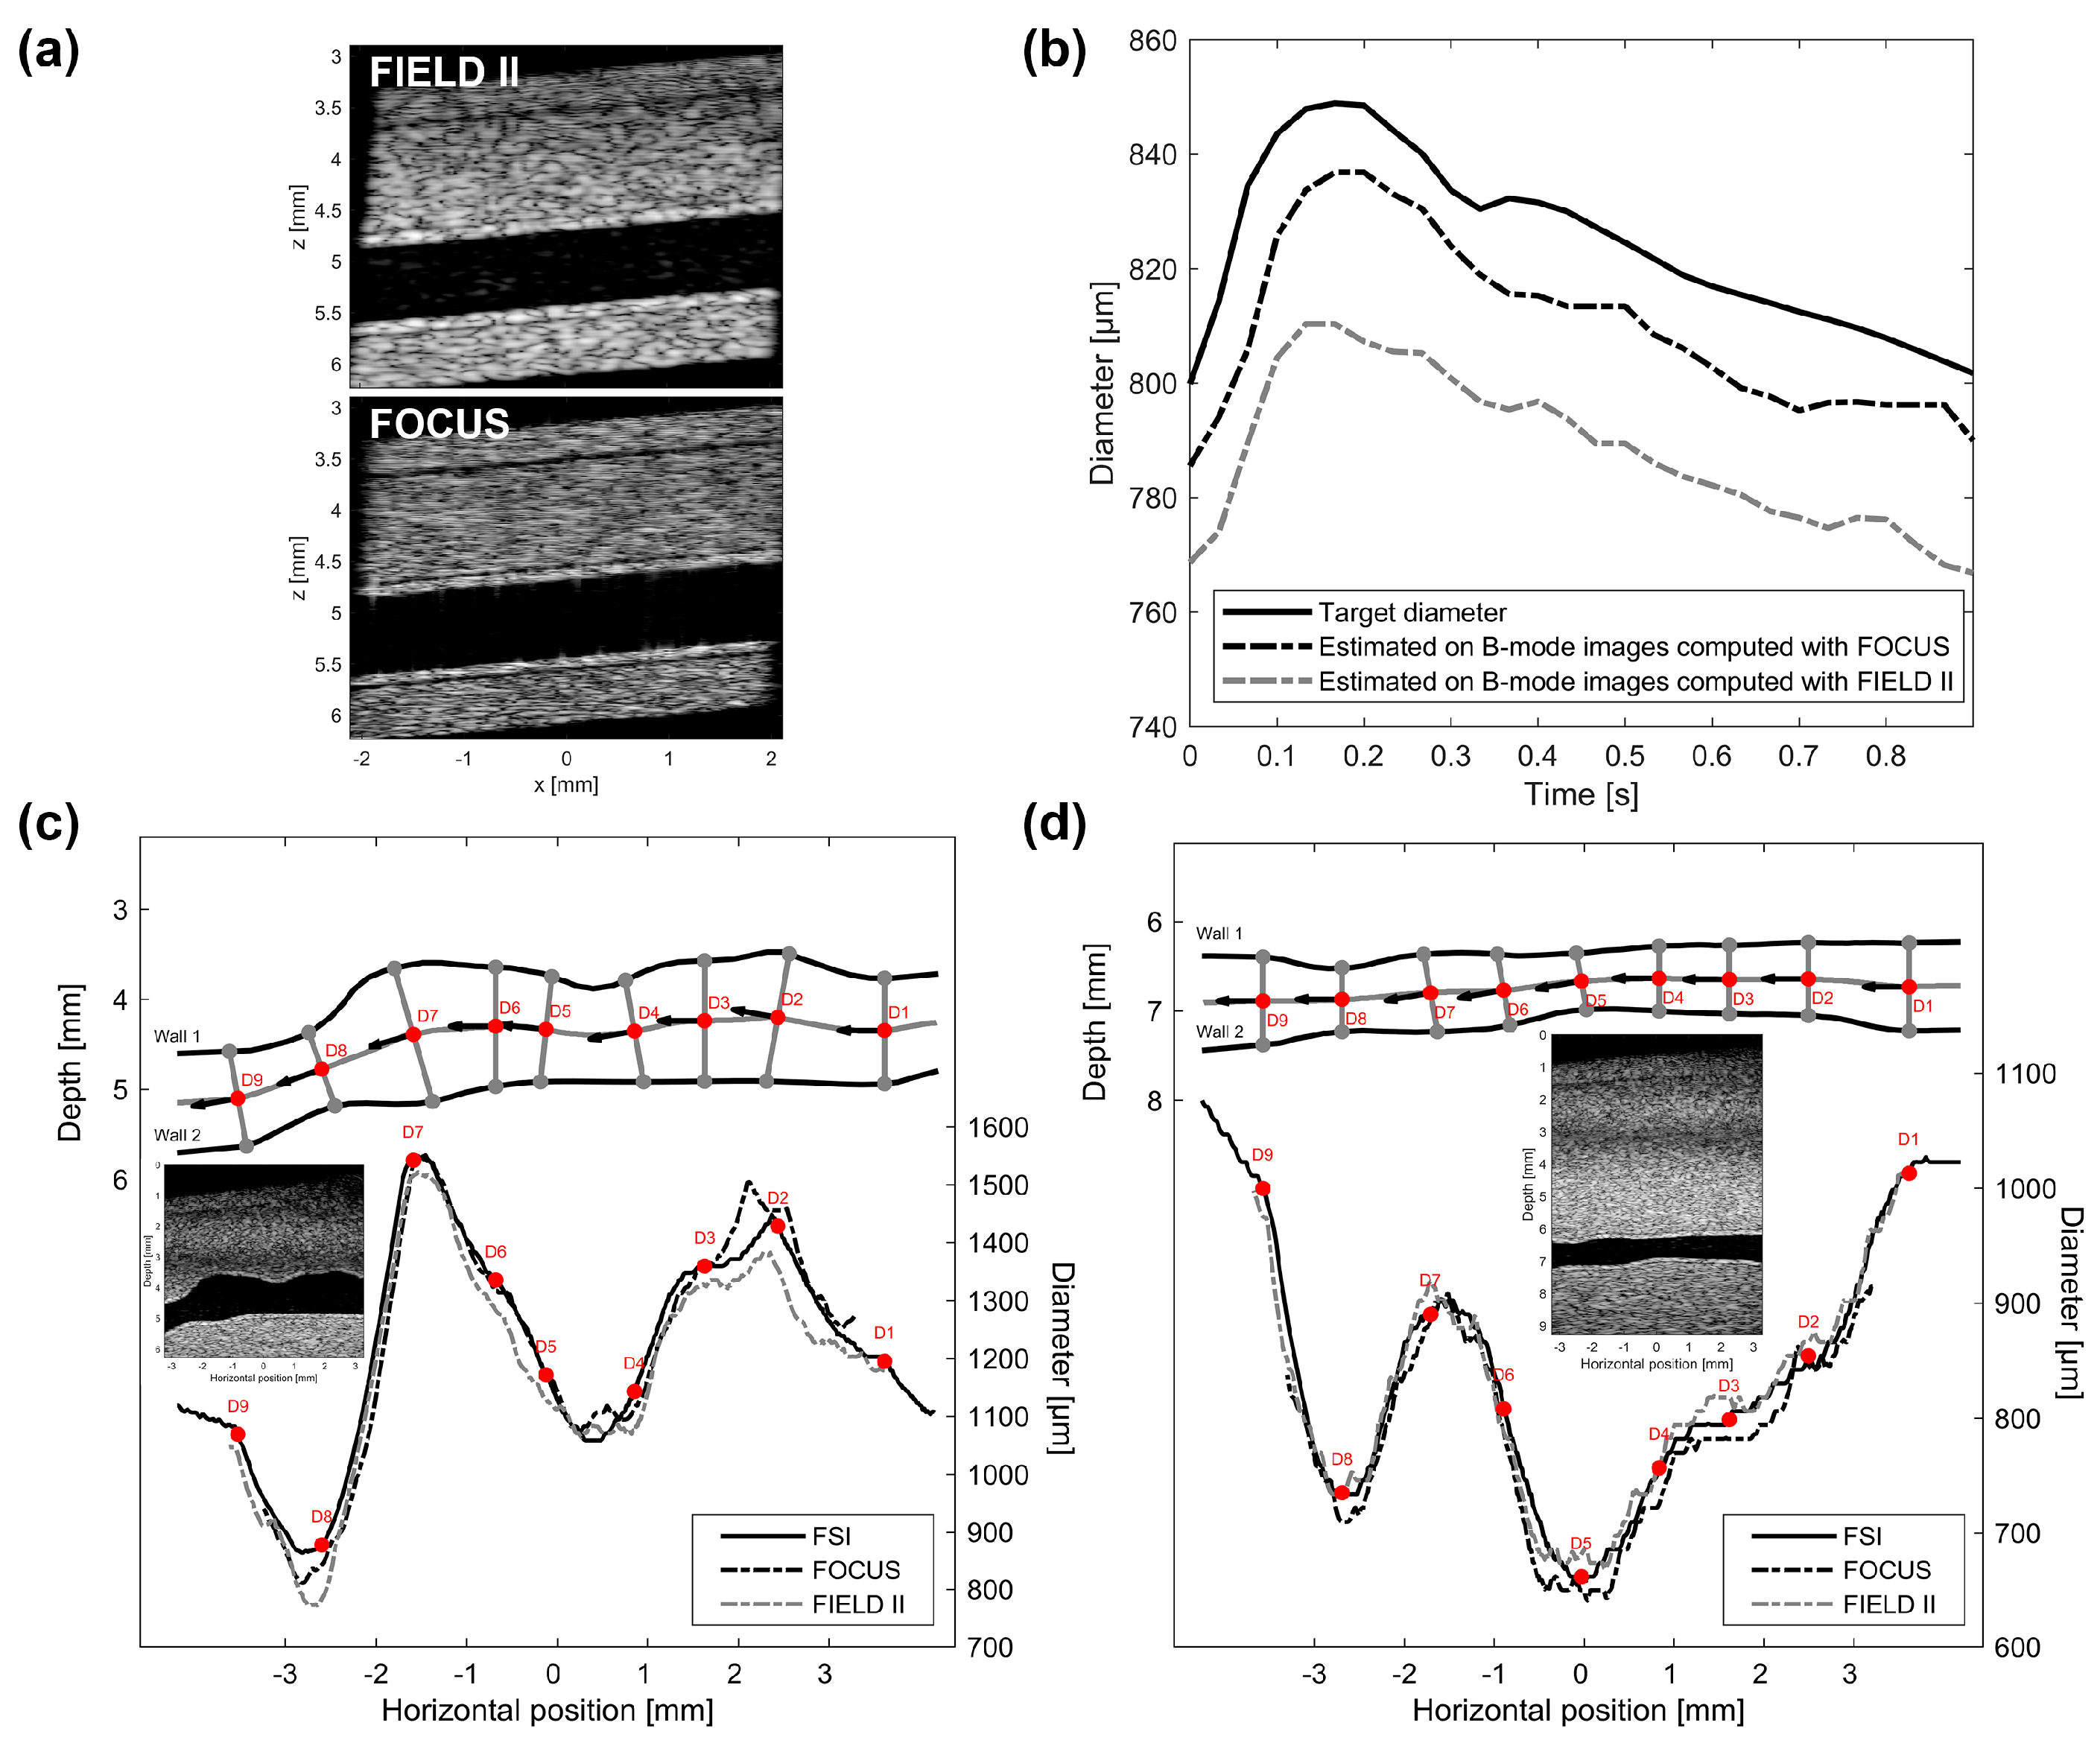
2.3.2. Validation of the Womersley Model
2.4. Model B: Model of Arterial Stenosis Induced by Vibrations
3. Results
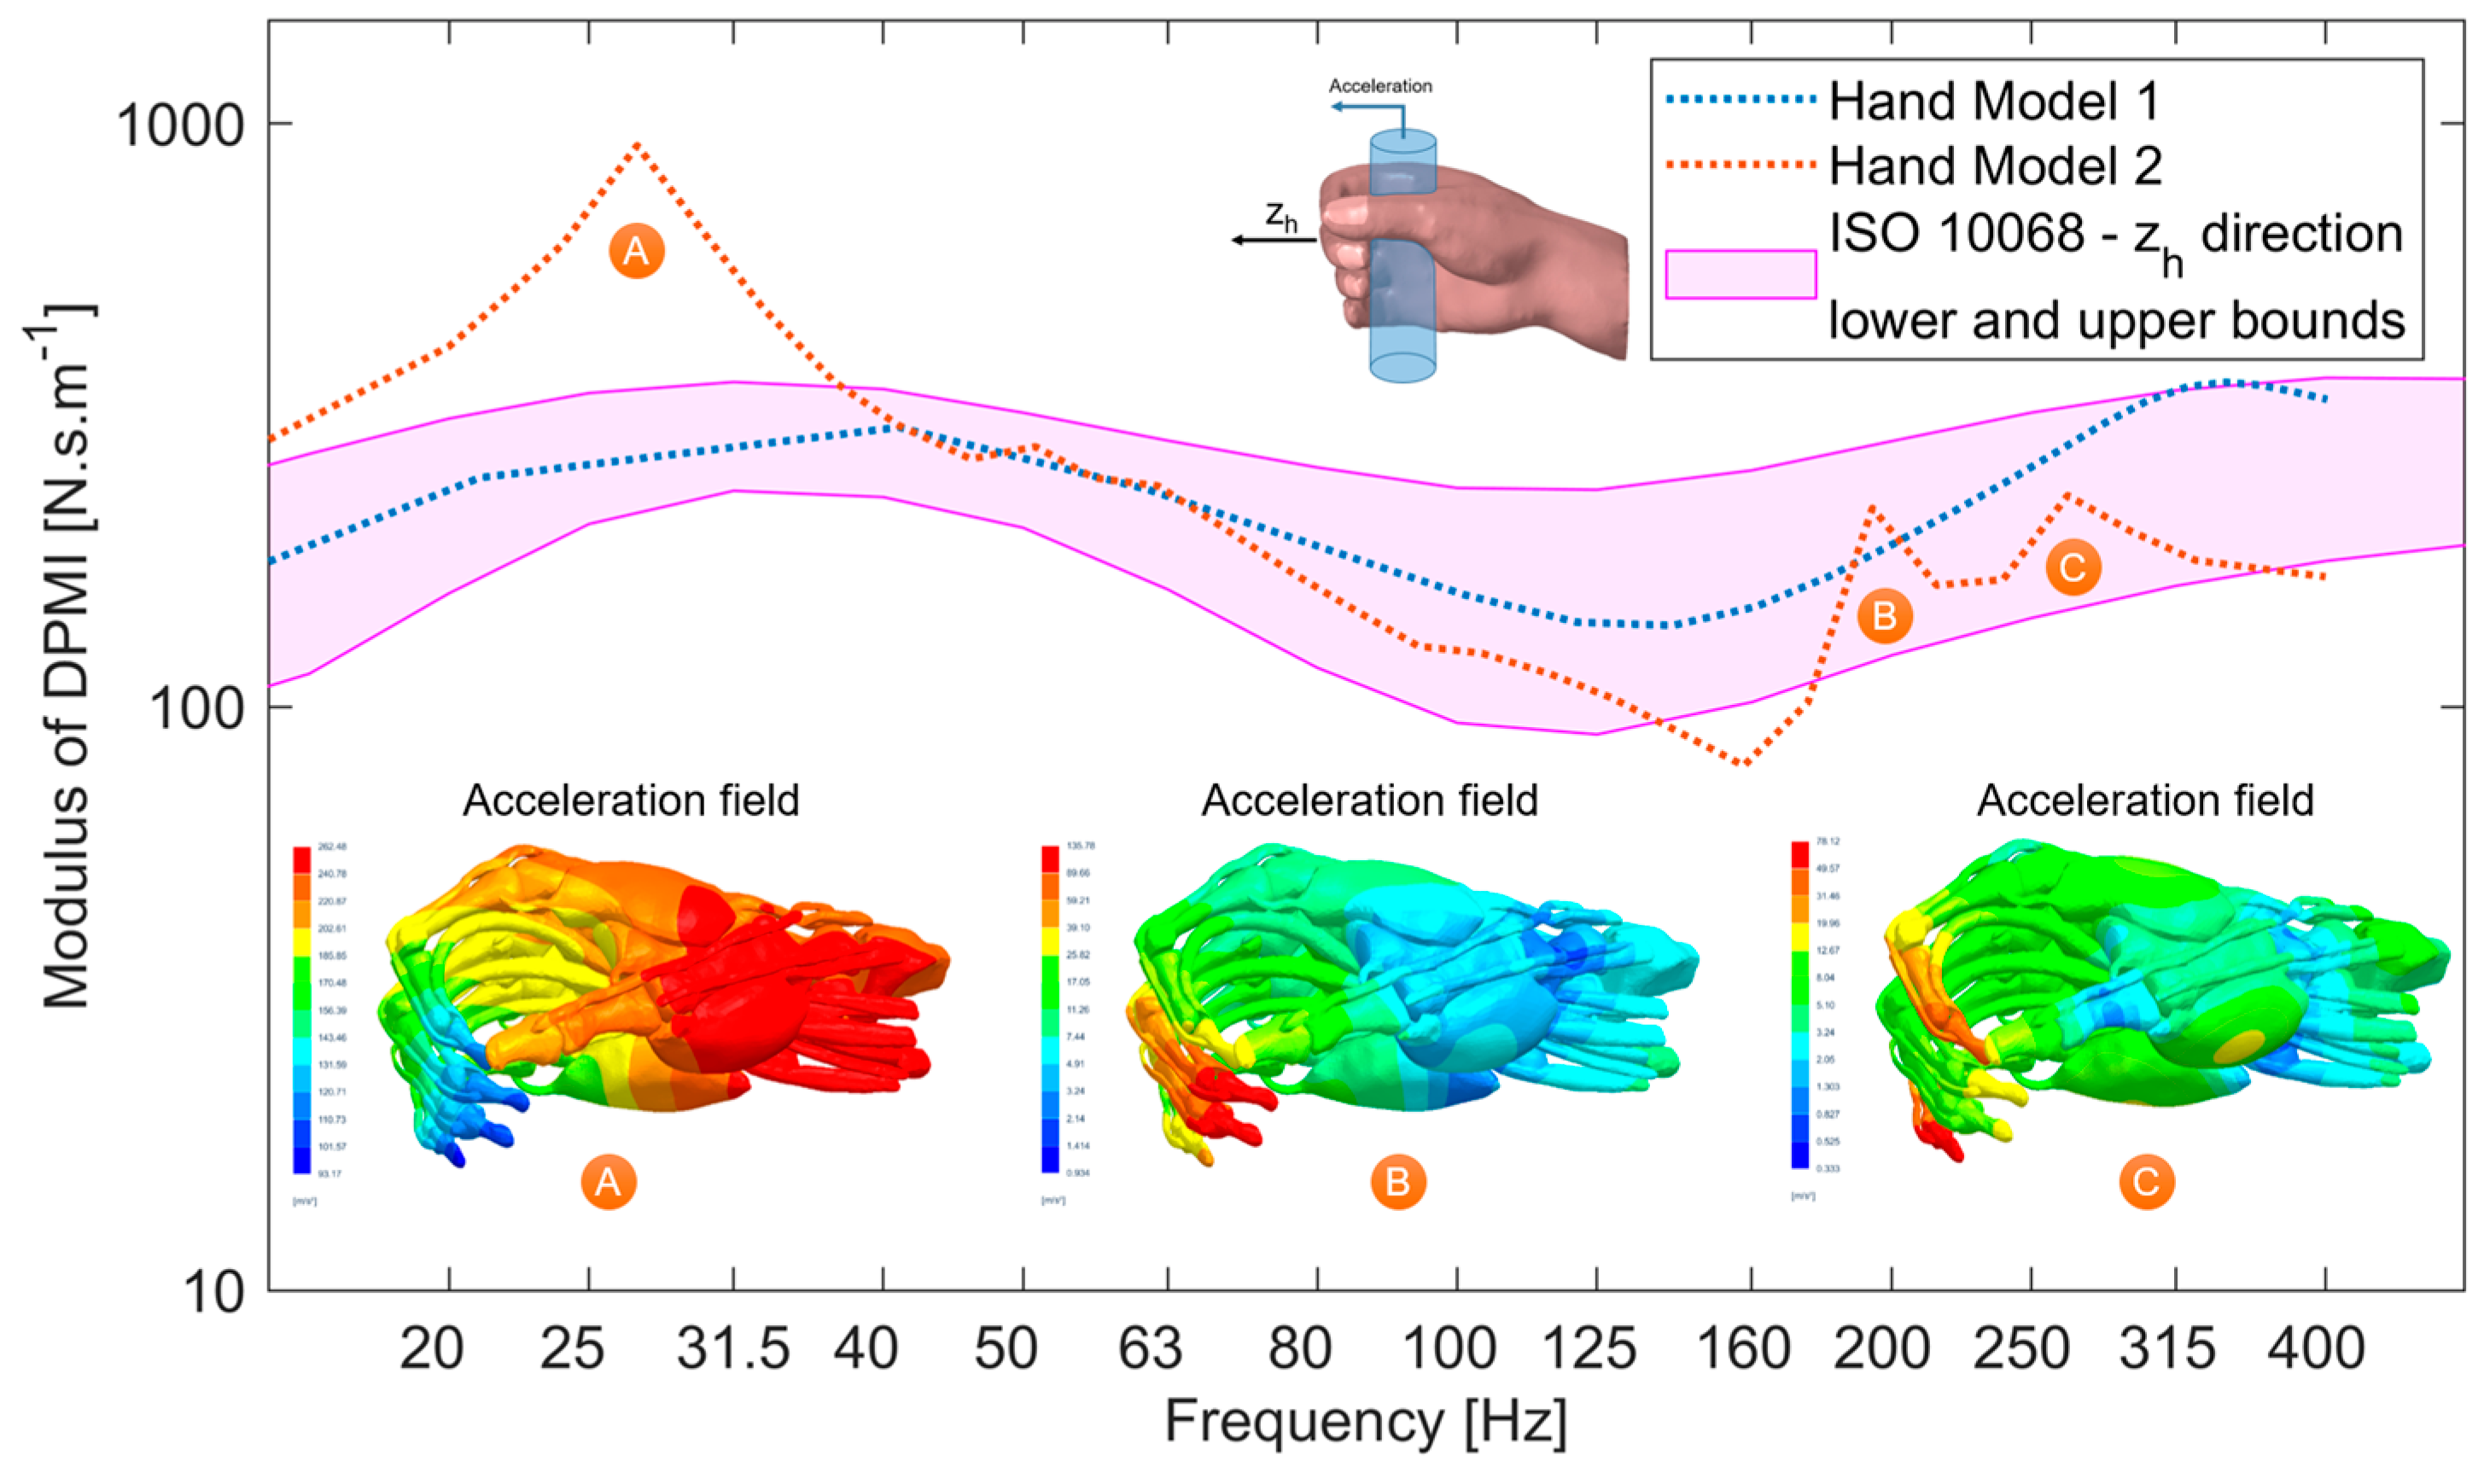
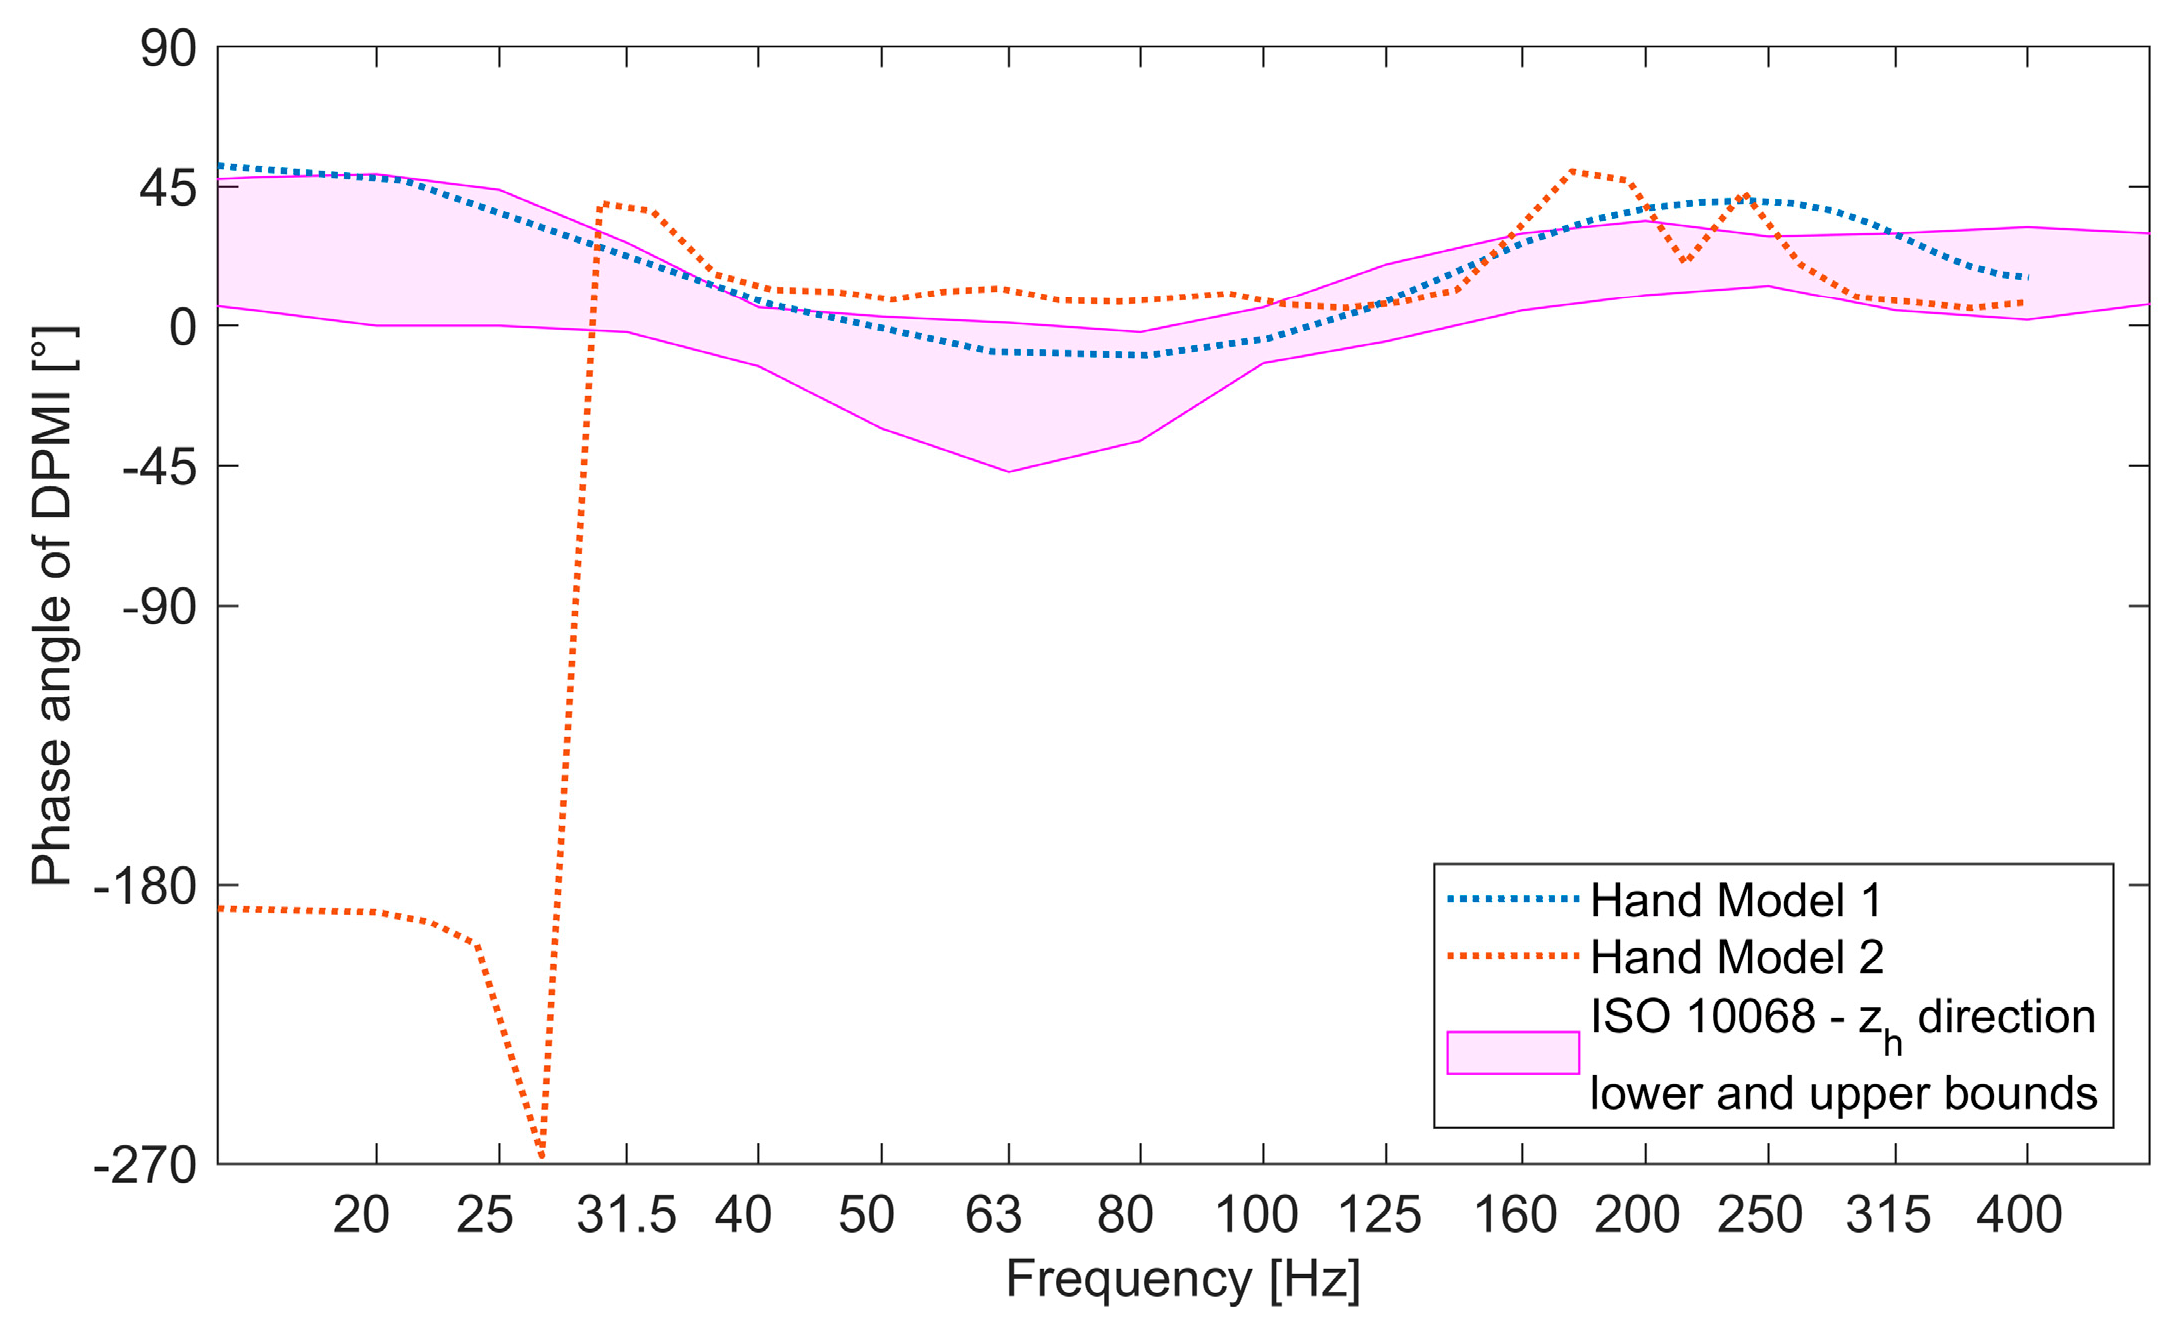
3.1. Hand Vibration
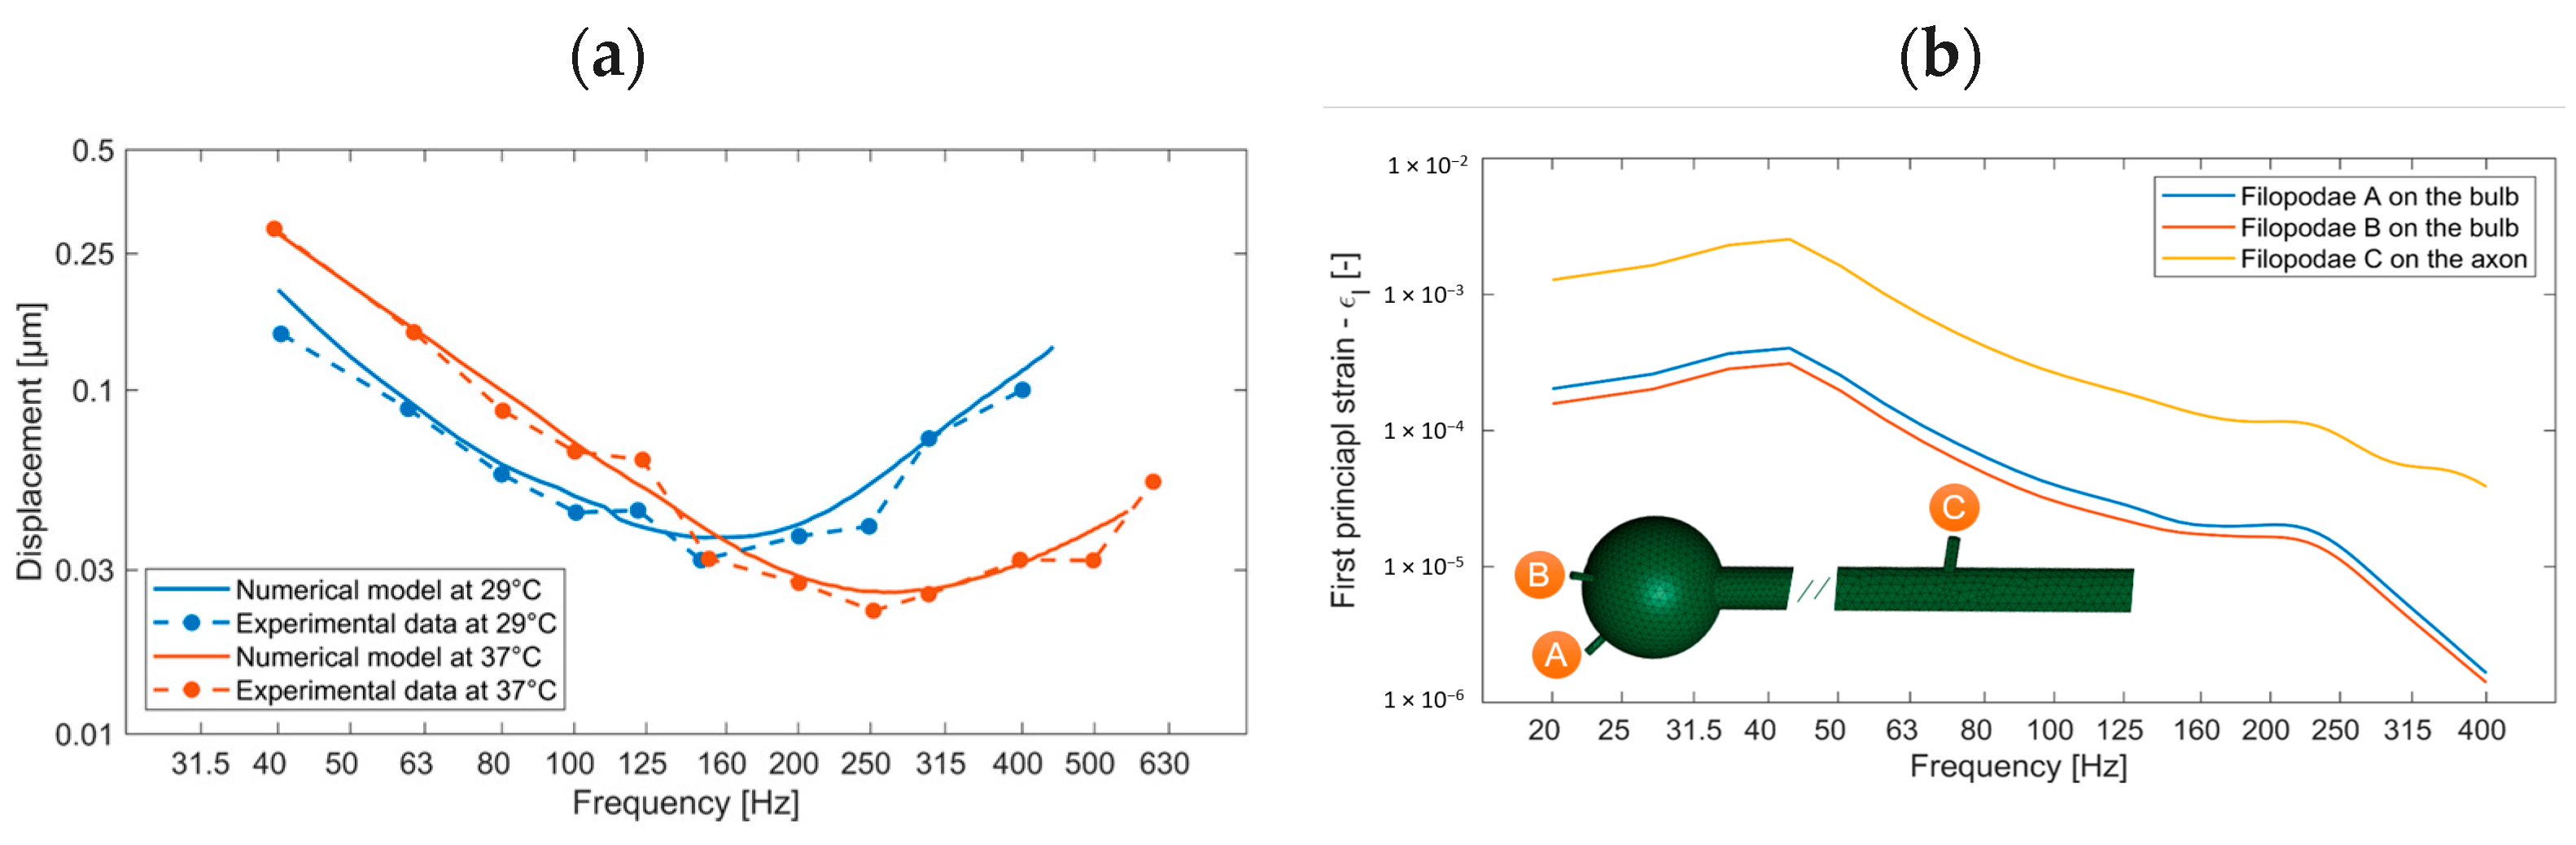
3.2. Pacinian Corpuscles
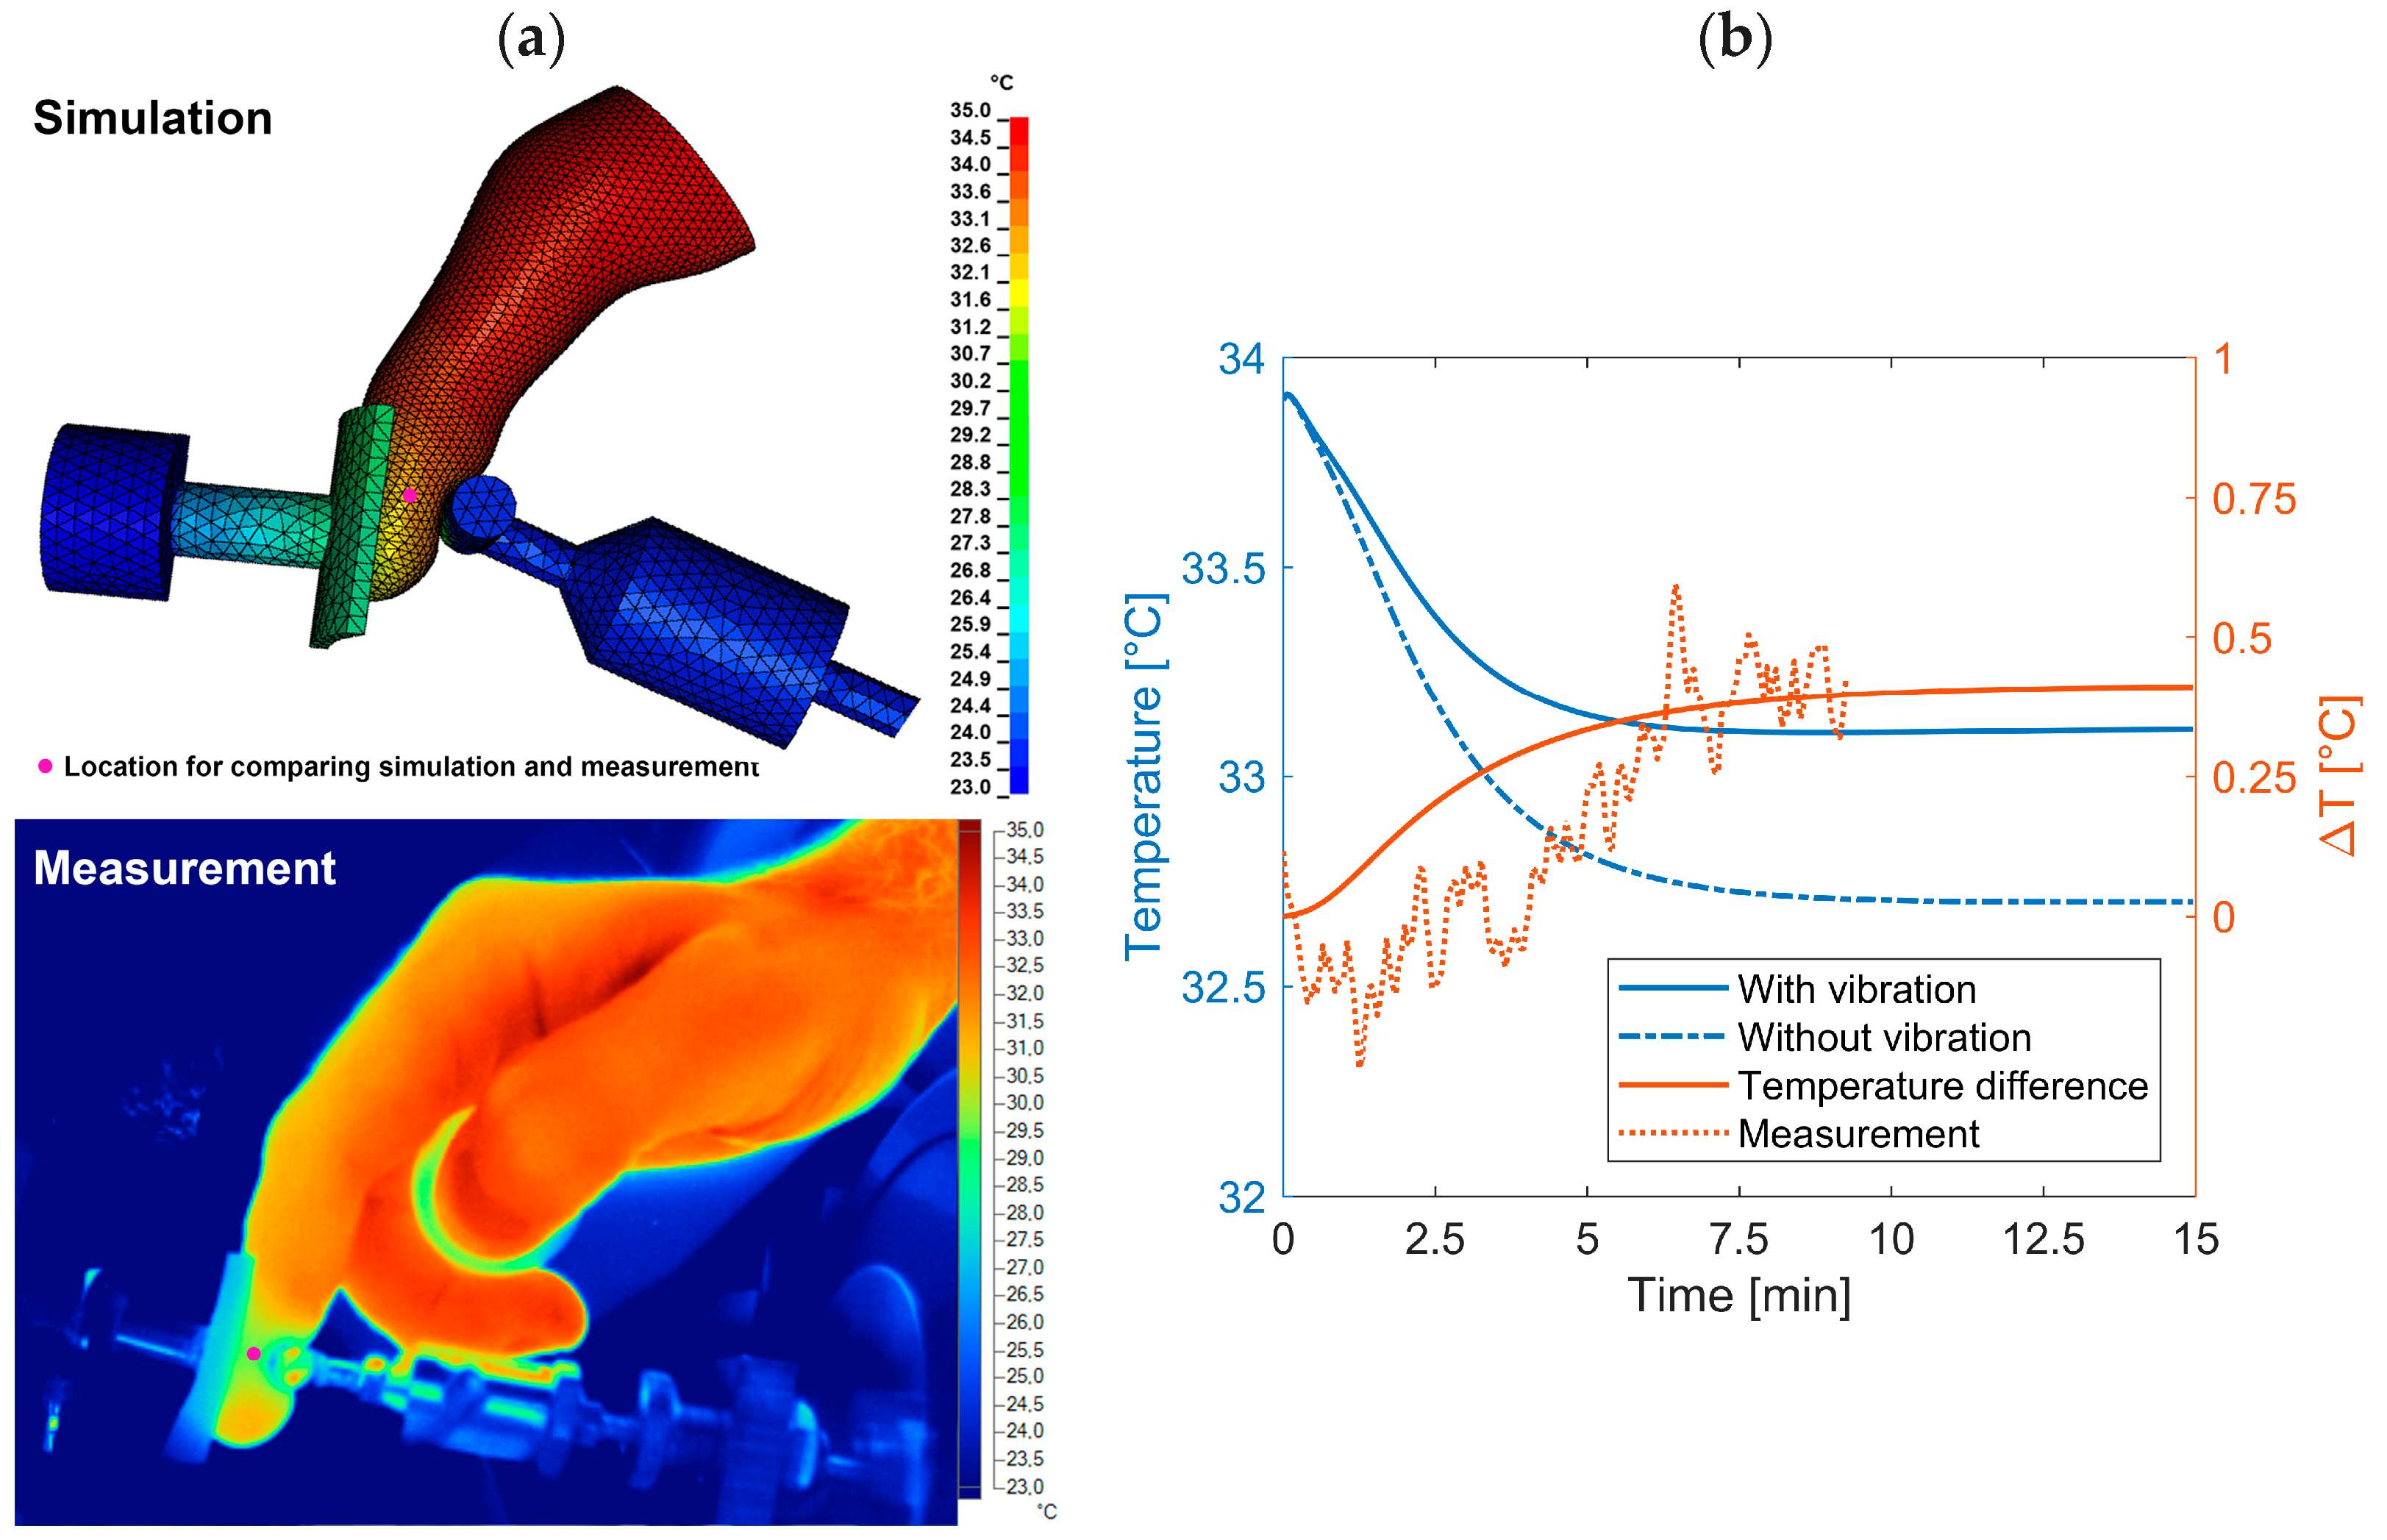
3.3. Heat
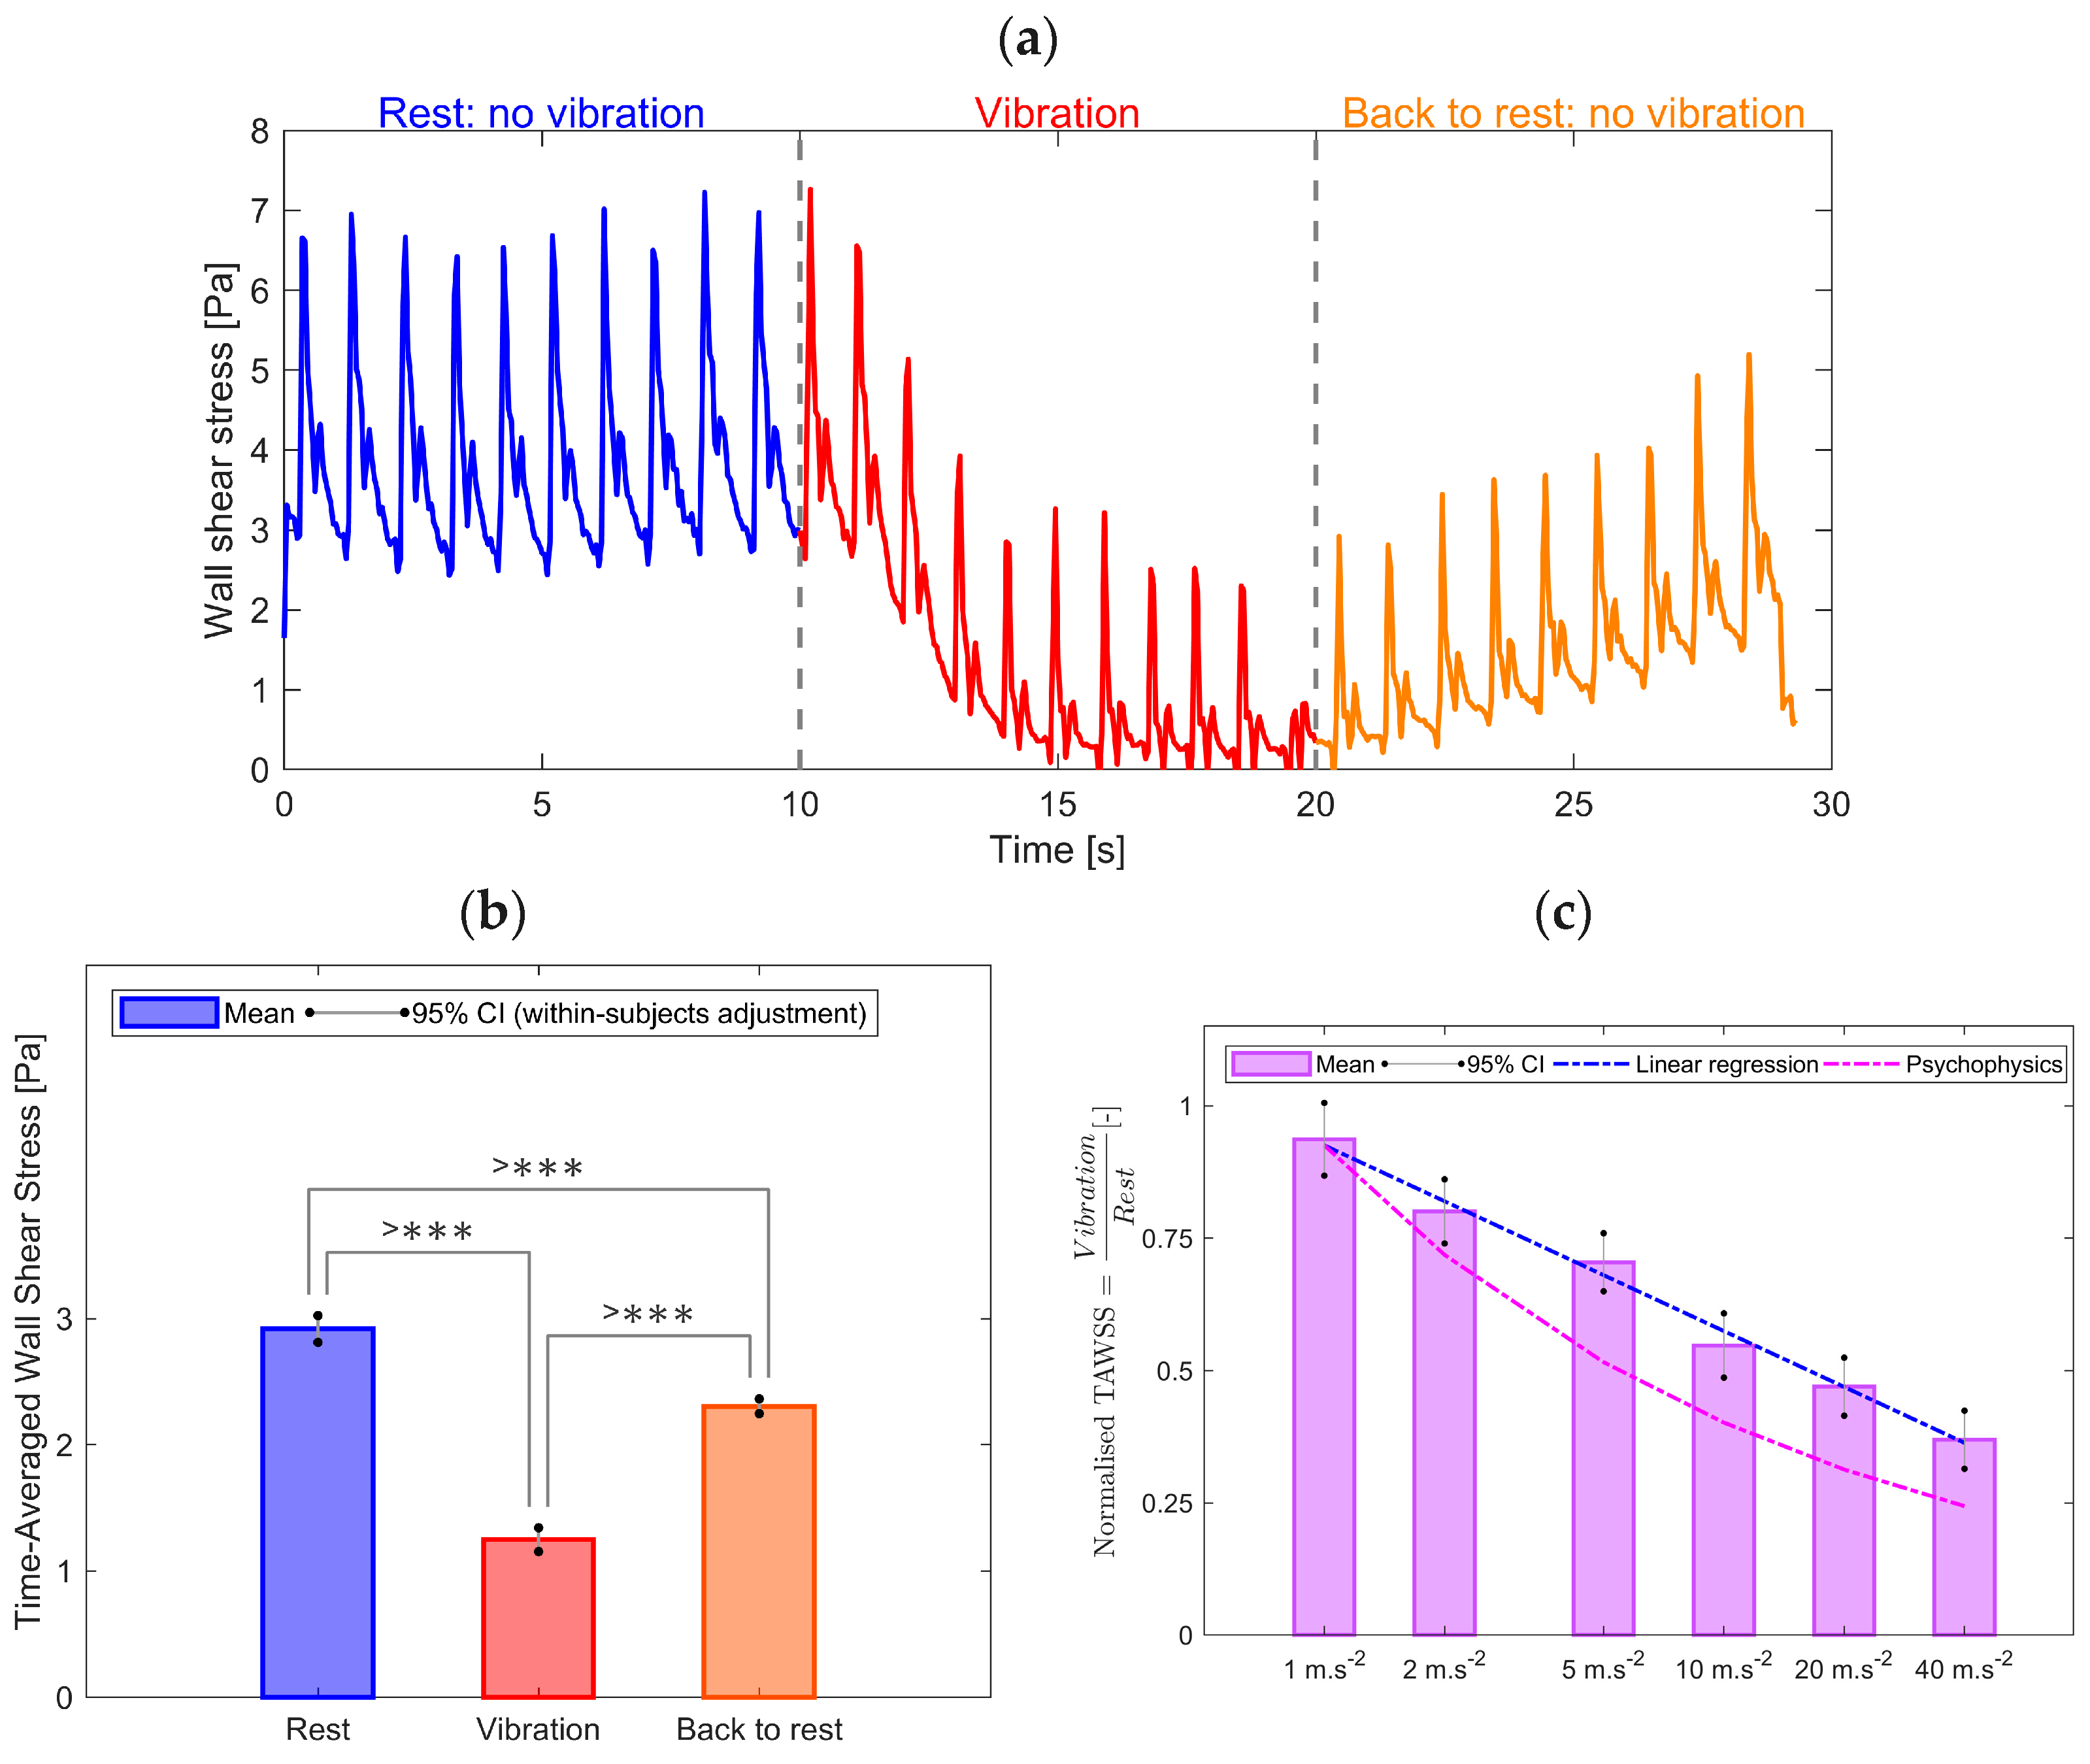
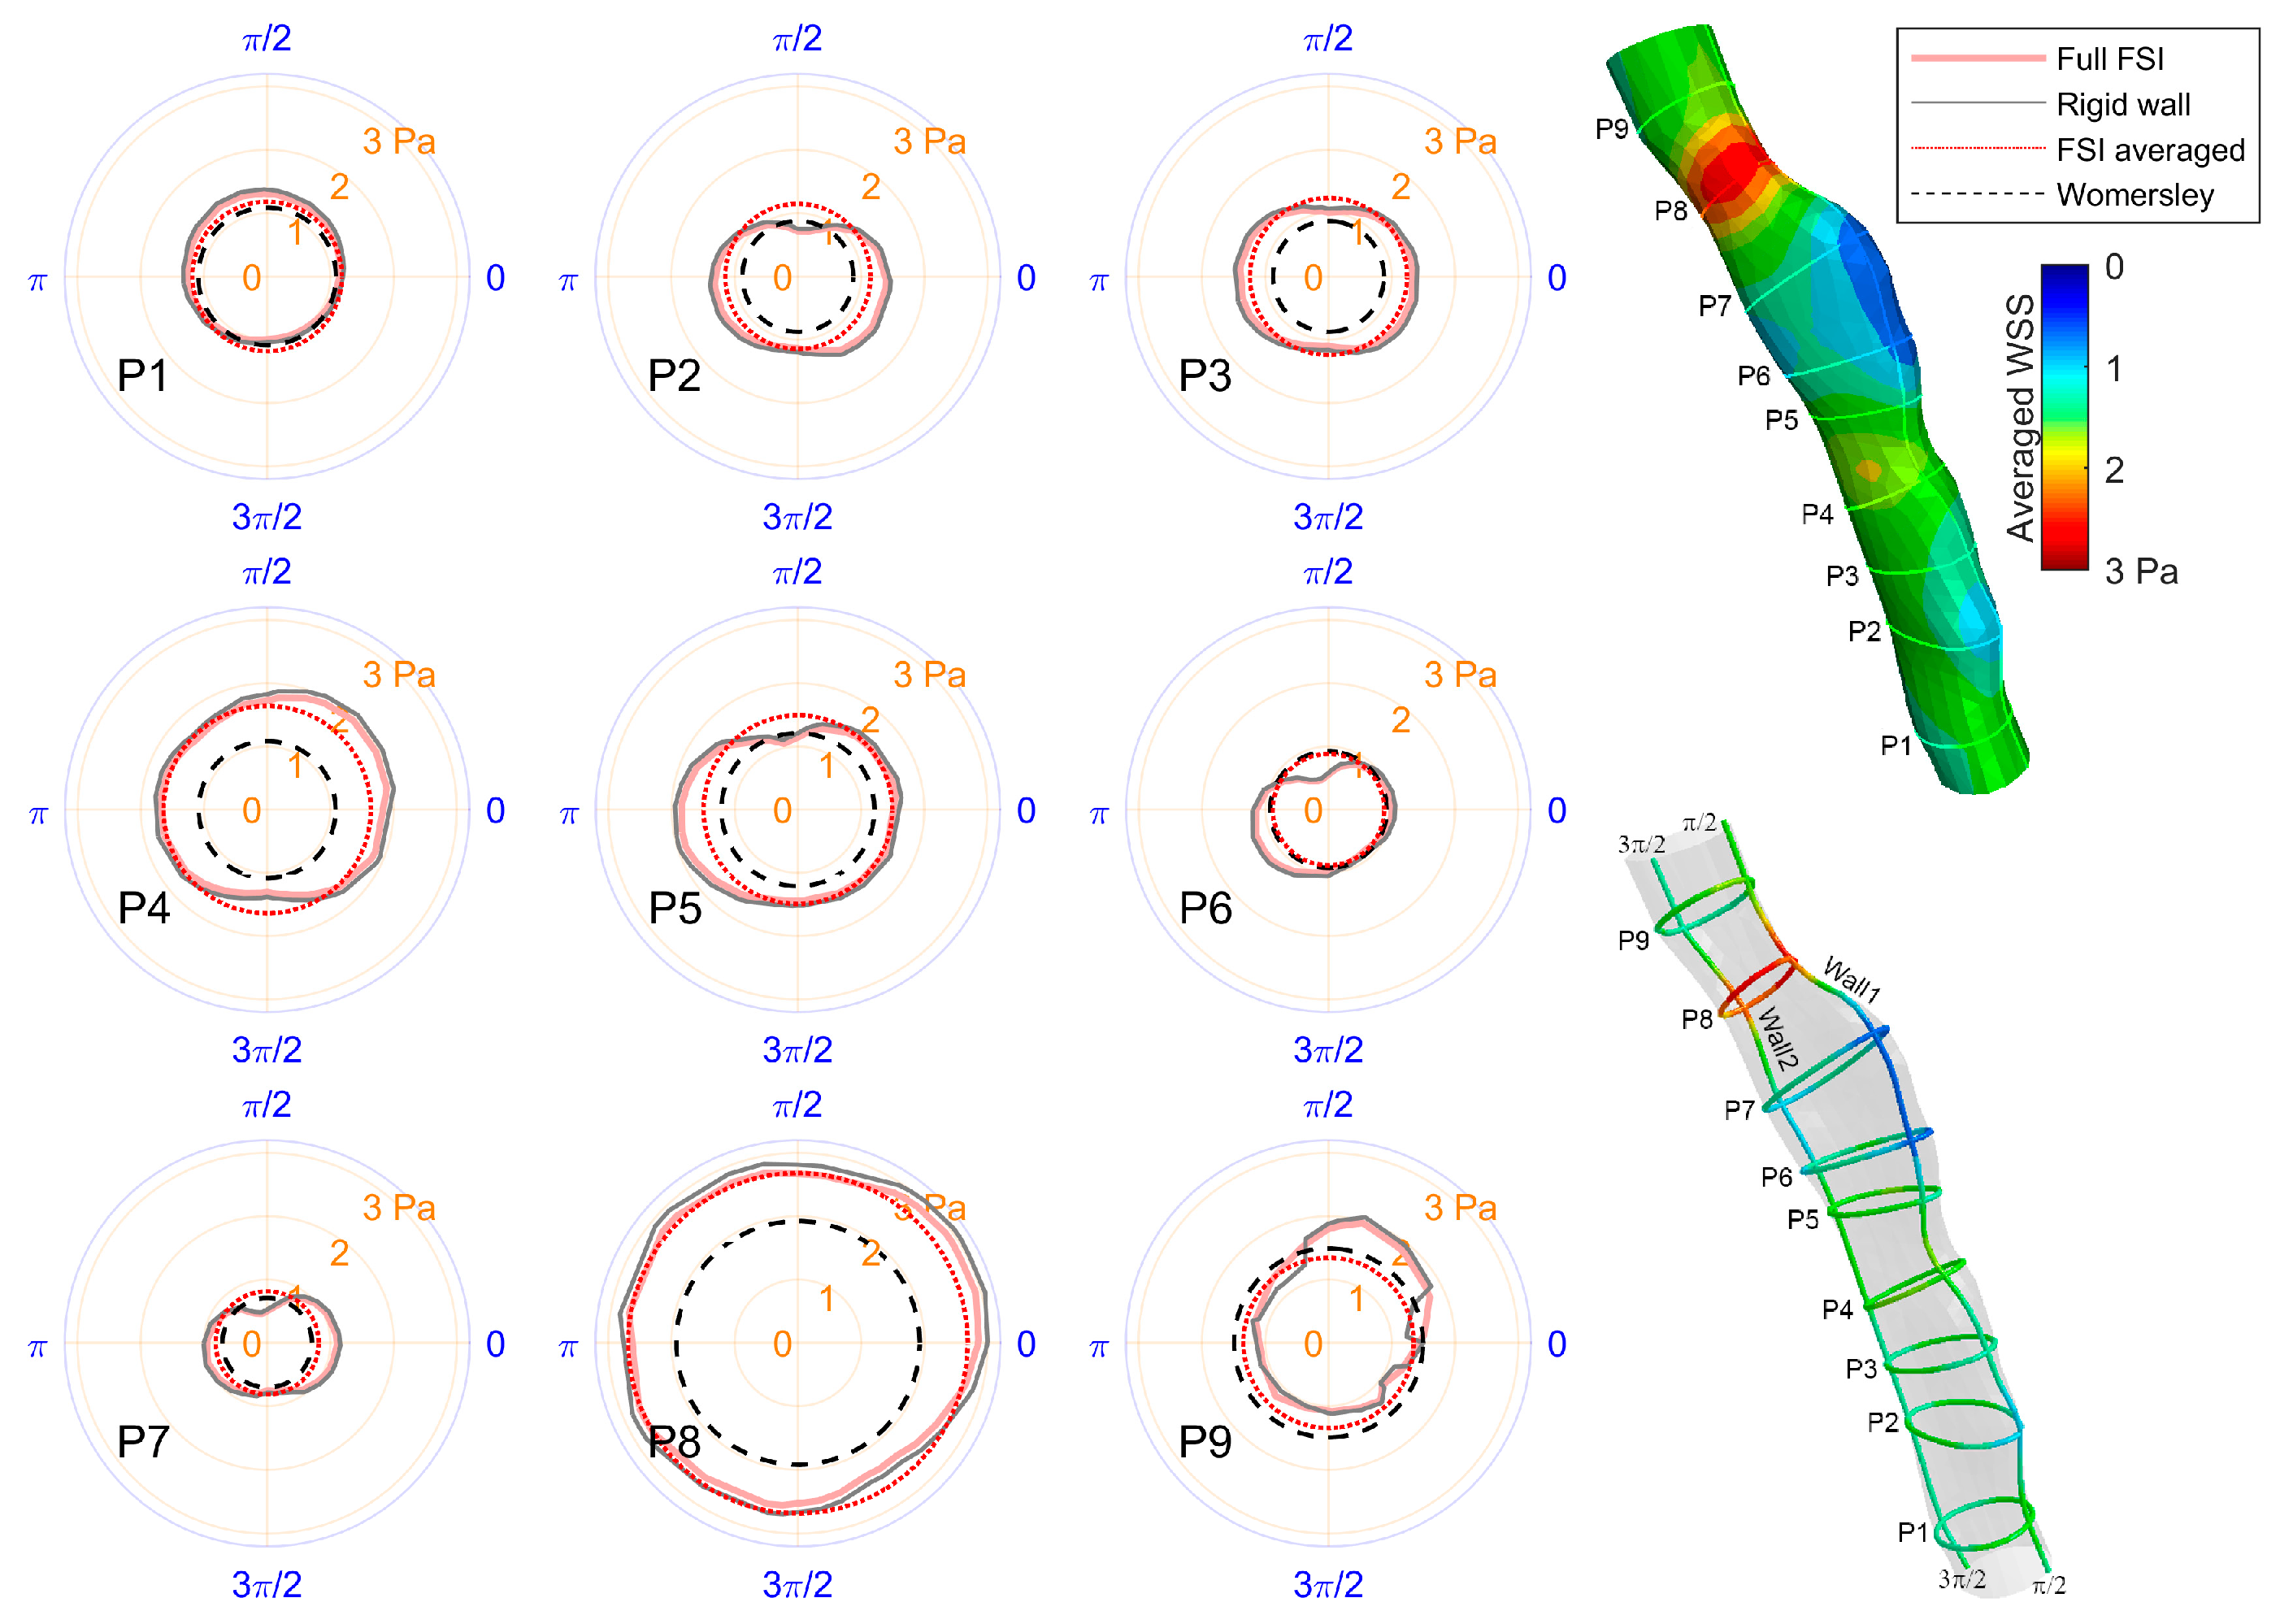
3.4. Short-Term Physiological Effect
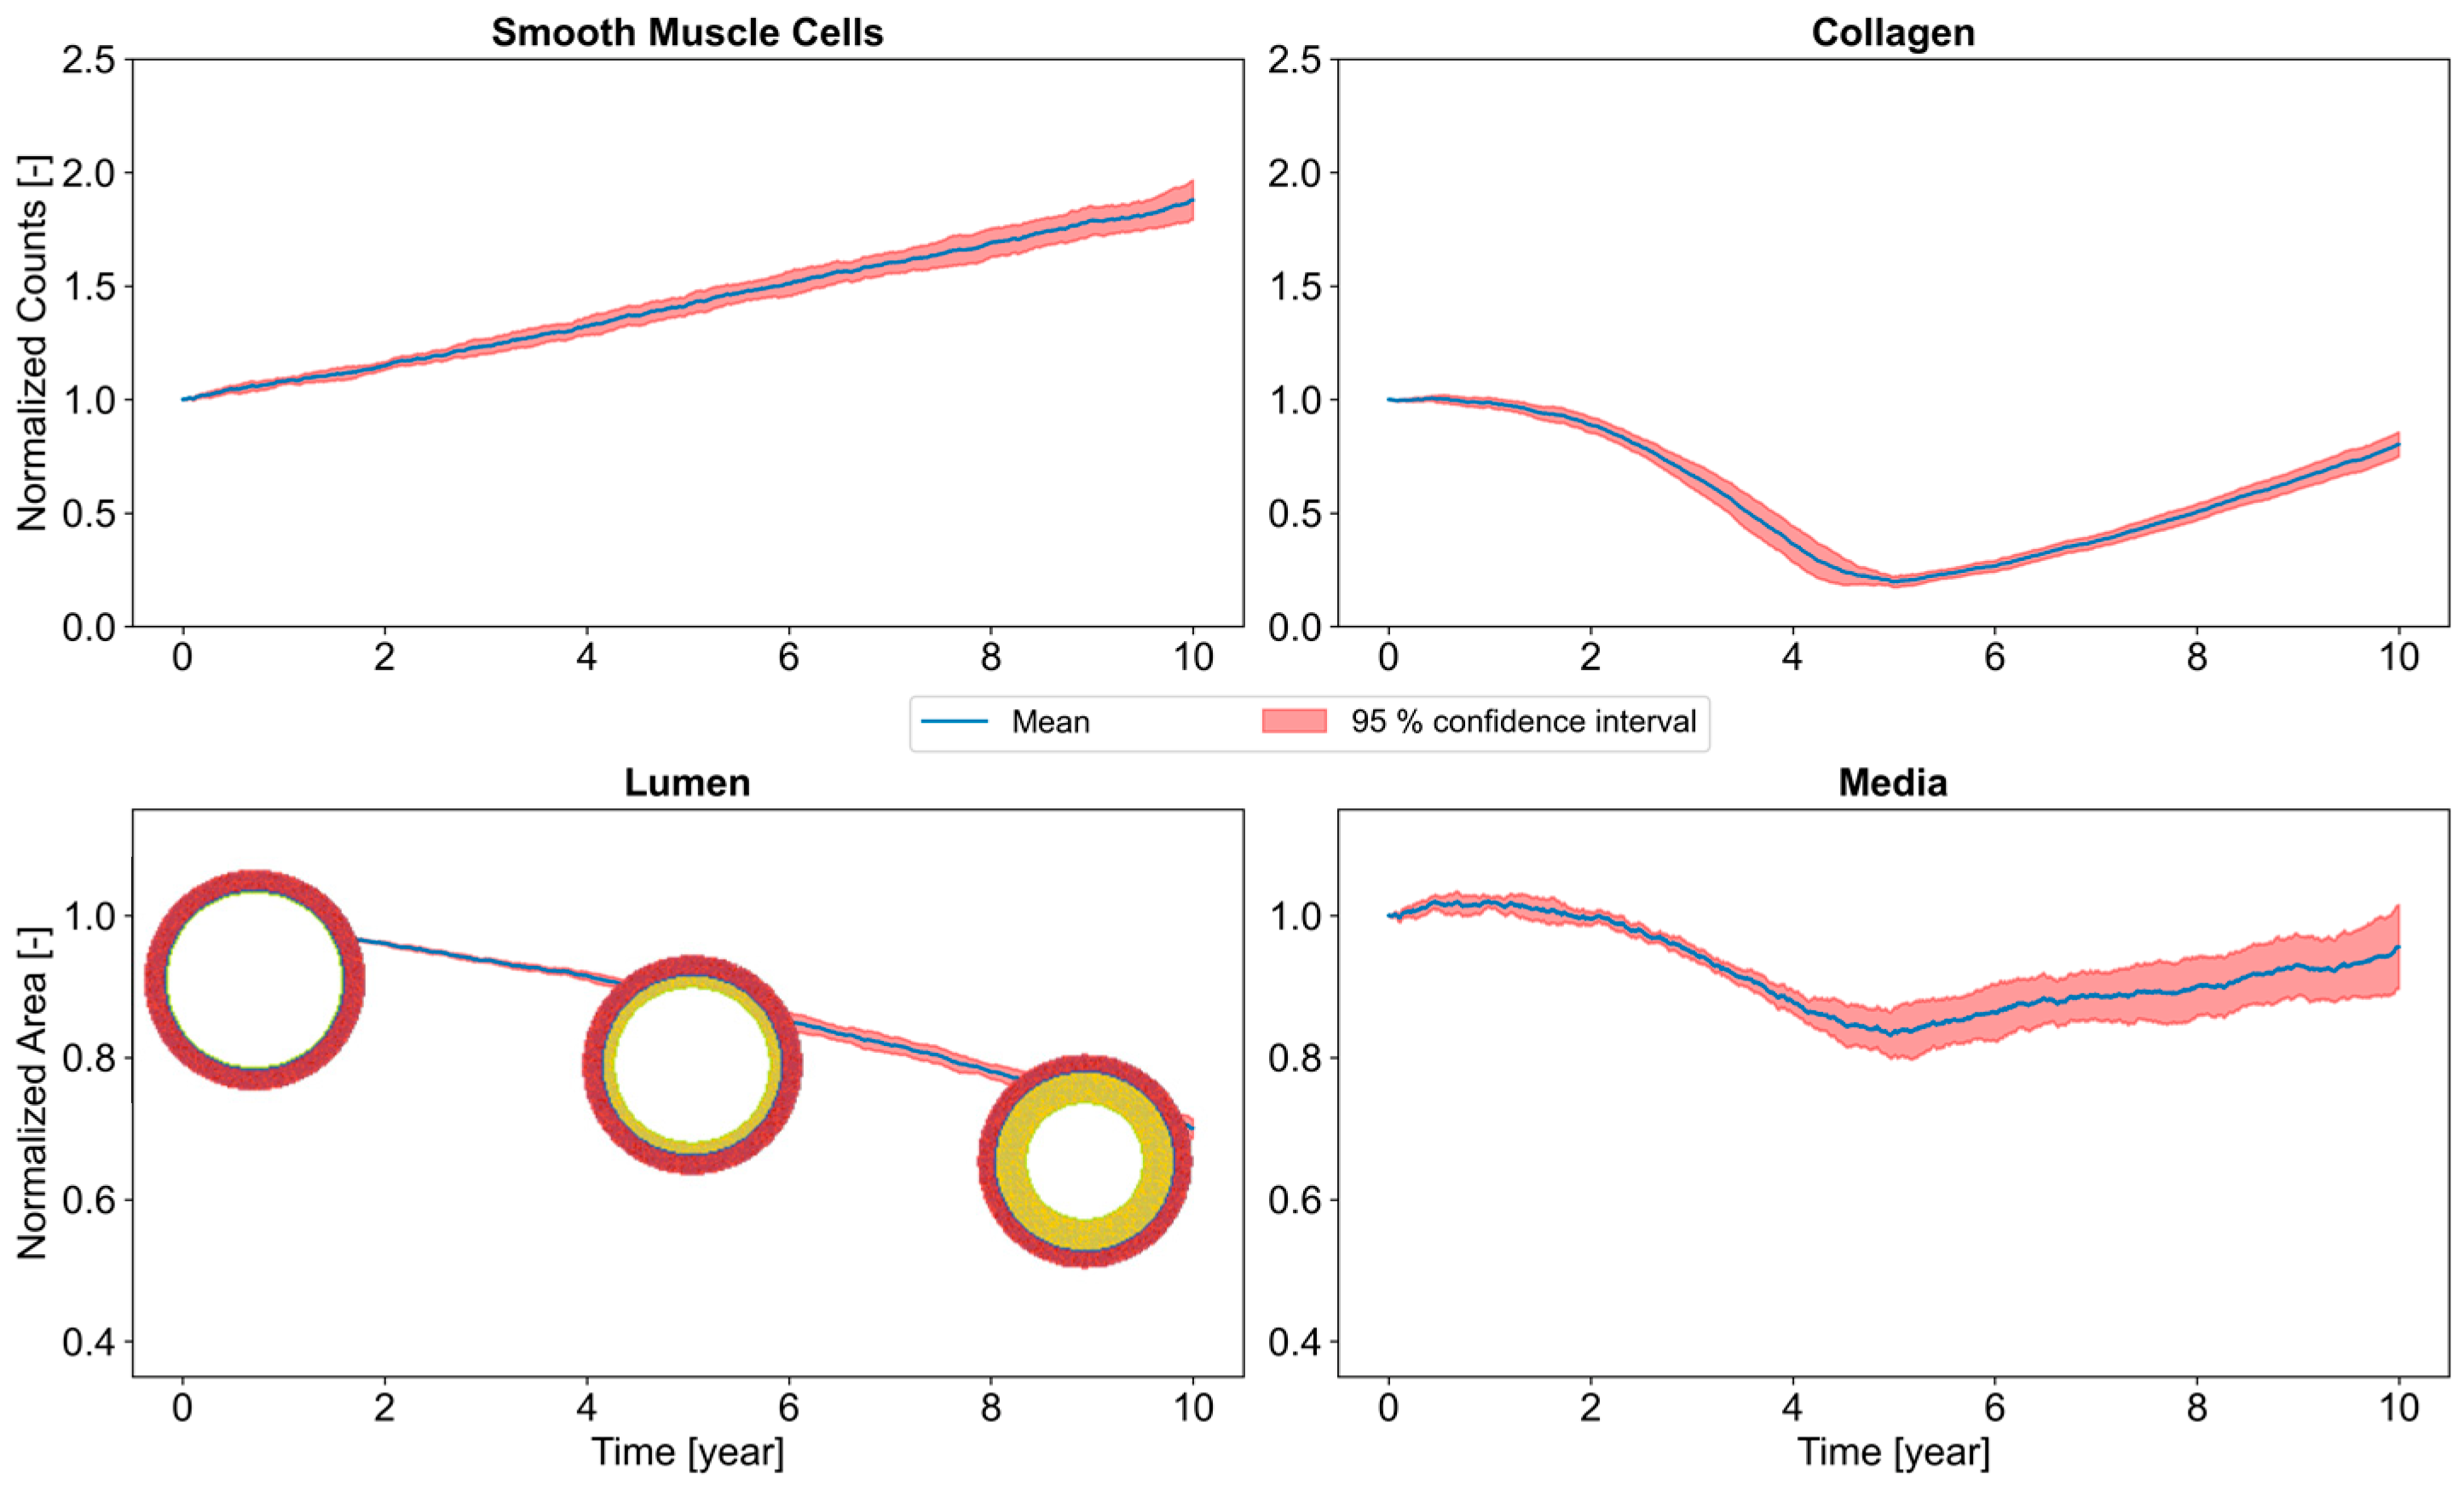
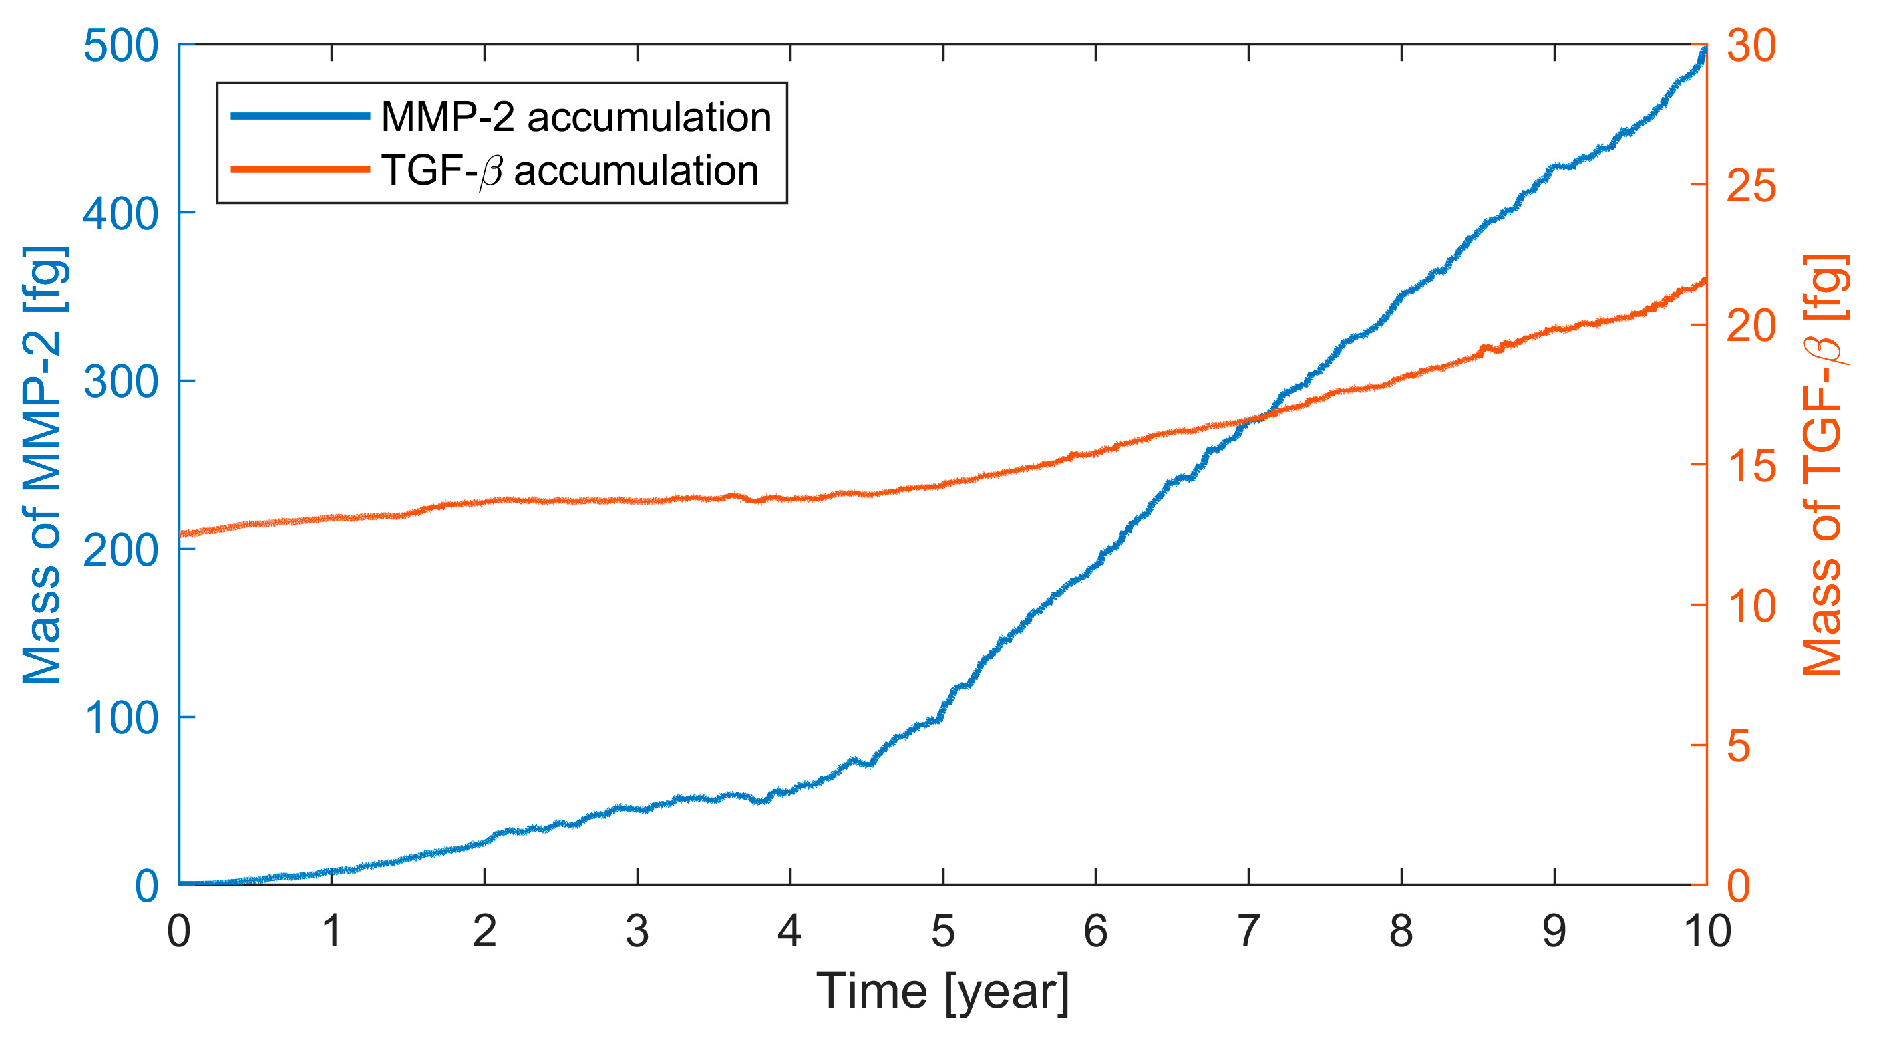
3.5. Long-Term Arterial Stenosis
4. Discussion
4.1. Thermomechanical Modeling
4.1.1. Hand Modeling
4.1.2. Pacinian Modeling
4.1.3. Temperature Modeling
4.2. Acute Exposure
4.3. Long-Term Exposure
5. Conclusions
- Vibrations significantly decrease blood/endothelium shearing stresses. This WSS is reduced by a factor of three for vibration of 40 m·s−2;
- The frequency of the vibrations does not influence this reduction. Thus, we propose to enlarge the current vascular filter [25] to the range [31–400 Hz]. This filter would have a weighting of 1 in this spectral range;
- The decrease in WSS is proportional to the logarithm of the amplitude of the vibration. It is possible to calculate the WSS caused by the vibrations by measuring the acceleration on the machine;
- Knowledge of the daily exposure (the model can take into account all types of exposure cycles) and the WSS (or similarly, the acceleration on the machine), the mechano-biological model permits calculating the degree of stenosis and therefore that of the disease for chronic exposure to vibrations. It is a new definition of vibratory dose;
- A candidate early biomarker acting as a precursor of VWF is proposed—MMP-2.
Supplementary Materials
Author Contributions
Funding
Institutional Review Board Statement
Informed Consent Statement
Data Availability Statement
Acknowledgments
Conflicts of Interest
Abbreviations
| VWF | Vibration White Finger |
| WSS | Wall Shear Stress |
| SMCs | Smooth Muscle Cells |
| EC | Endothelial Cells |
| ECM | Extra Cellular Matrix |
| PDGF | Platelet-Derived Growth Factor |
| TGF | Transforming Growth Factor |
| MMP | Matrix MetalloProteinase |
Appendix A. Construction of Hands Models, Boundary Conditions and Loading

Additional Results


| Mode at 28 Hz | Mode at 54 Hz | Mode at 82 Hz | Mode at 105 Hz |
|---|---|---|---|
| Abduction/Adduction of wrist | Abduction/Adduction of metacarpals | Bending/Extension of thumb | Bending/Extension of proximal phalanges and metacarpals |
 |  |  |  |
 |  |  |  |
| Mode at 155 Hz | Mode at 173 Hz | Mode at 259 Hz | Mode at 320 Hz |
| Bending/Extension of medial phalanges | Abduction/Adduction of medial phalanges | Bending/Extension of distal phalanges and mode of thenar and hypothenar eminences | Mode of the thenar and hypothenar eminences without bony modes |
 |  |  |  |
 |  |  |  |
References
- Parent-Thirion, A.; Vermeylen, G.; van Houten, G.; Lyly-Yrjänäinen, M.; Biletta, I.; Cabrita, J. Fifth European Working Conditions Survey: Overview Report; European Foundation for the Improvement of Living and Working Conditions: Luxembourg, 2012; ISBN 9789289710626. [Google Scholar]
- Matinet, B.; Rosankis, E.; Léonard, M. Enquête Sumer 2017. Les expositions aux risques professionnels. Les contraintes physiques. Synthèse Stat’ 2020, 33, 185–190. [Google Scholar]
- Griffin, M.J. Handbook of Human Vibration; Elsevier Academic Press: London, UK, 1996. [Google Scholar]
- Bovenzi, M. Medical aspects of the Hand-Arm vibration syndrome. Int. J. Ind. Ergon. 1990, 6, 61–73. [Google Scholar] [CrossRef]
- Matoba, T. Pathophysiology and clinical picture of hand-arm vibration syndrome in Japanese workers. Nagoya J. Med. Sci. 1994, 57, 19–26. [Google Scholar] [PubMed]
- FD CR 12349:1996; Mechanical Vibration-Guide to the Health Effects of Vibration on the Human Body. AFNOR: Paris, France, 1996.
- European Parliament. European Parliament Directive 2002/44/EC of the European Parliament and of the Council of 25 June 2002 on the minimum health and safety requirements regarding the exposure of workers to the risks arising from physical agents (vibration). Off. J. Eur. Communities 2002, L177, 13–19. [Google Scholar]
- NF EN ISO 5349-1:2001; Mechanical Vibration-Measurement and Evaluation of Human Exposure to Hand-Transmitted Vibration-Part 1: General Requirements. AFNOR: Paris, France, 2002.
- NF EN ISO 5349-2:2001; Mechanical Vibration-Measurement and Evaluation of Human Exposure to Hand-Transmitted Vibration-Part 2: Practical Guidance for Measurement at the Workplace. AFNOR: Paris, France, 2001.
- Donati, P.; Noël, C. Methods for estimating vibration exposure without measurement. In Proceedings of the 14th International Conference on Hand-Arm Vibration, Bonn, Germany, 21–24 May 2019; pp. 153–154. [Google Scholar]
- Bovenzi, M.; Griffin, M.J. Haemodynamic changes in ipsilateral and contralateral fingers caused by acute exposures to hand transmitted vibration. Occup. Environ. Med. 1997, 54, 566–576. [Google Scholar] [CrossRef]
- Bovenzi, M. A prospective cohort study of exposure-response relationship for vibration-induced white finger. Occup. Environ. Med. 2010, 67, 38–46. [Google Scholar] [CrossRef]
- Curry, B.D.; Govindaraju, S.R.; Bain, J.L.W.; Zhang, L.L.; Yan, J.G.; Matloub, H.S.; Riley, D.A. Evidence for frequency-dependent arterial damage in vibrated rat tails. Anat. Rec. Part A Discov. Mol. Cell. Evol. Biol. Off. Publ. Am. Assoc. Anat. 2005, 284, 511–521. [Google Scholar] [CrossRef]
- Gayraud, M. Raynaud’s phenomenon. Jt. Bone Spine 2007, 74, 1–8. [Google Scholar] [CrossRef] [PubMed]
- Lambova, S.; Kuzmanova, S. Pathogenesis of Raynaud’s phenomenon. Rheumatology 2005, 13, 62–65. [Google Scholar] [CrossRef]
- Shah, A. Traumatic Vasospastic Disease. In Raynaud’s Phenomenon: A Guide to Pathogenesis and Treatment; Wigley, F.M., Herrick, A.L., Flavahan, N.A., Eds.; Springer: New York, NY, USA, 2015; pp. 129–140. ISBN 9781493915255. [Google Scholar]
- Griffin, M.J.; Bovenzi, M.; Nelson, C.M. Dose-response patterns for vibration-induced white finger. Occup. Environ. Med. 2003, 60, 16–26. [Google Scholar] [CrossRef] [PubMed]
- Dong, R.G.; Welcome, D.E.; McDowell, T.W.; Wu, J.Z.; Schopper, A.W. Frequency weighting derived from power absorption of fingers-hand-arm system under z(h)-axis vibration. J. Biomech. 2006, 39, 2311–2324. [Google Scholar] [CrossRef] [PubMed]
- Krajnak, K.; Miller, G.R.; Waugh, S.; Johnson, C.; Li, S.; Kashon, M.L. Characterization of frequency-dependent responses of the vascular system to repetitive vibration. J. Occup. Environ. Med. 2010, 52, 584–594. [Google Scholar] [CrossRef] [PubMed]
- Bovenzi, M. Epidemiological Evidence for New Frequency Weightings of Hand-Transmitted Vibration. Ind. Health 2012, 50, 377–387. [Google Scholar] [CrossRef] [PubMed]
- Brammer, A.J.; Pitts, P.M. Frequency Weighting for Vibration-induced White Finger Compatible with Exposure-response Models. Ind. Health 2012, 50, 397–411. [Google Scholar] [CrossRef]
- Griffin, M.J. Frequency-dependence of Psychophysical and Physiological Responses to Hand-transmitted Vibration. Ind. Health 2012, 50, 354–369. [Google Scholar] [CrossRef]
- Krajnak, K.; Riley, D.A.; Wu, J.; Mcdowell, T.; Welcome, D.E.; Xu, X.S.; Dong, R.G. Frequency-dependent Effects of Vibration on Physiological Systems: Experiments with Animals and other Human Surrogates. Ind. Health 2012, 50, 343–353. [Google Scholar] [CrossRef]
- Pitts, P.M.; Mason, H.J.; Poole, K.A.; Young, C.E. Relative Performance of Frequency Weighting Wh and Candidates for Alternative Frequency Weightings for Predicting the Occurrence of Hand-transmitted Vibration-induced Injuries. Ind. Health 2012, 50, 388–396. [Google Scholar] [CrossRef]
- ISO/TR 18570:2017; Mechanical Vibration-Measurement and Evaluation of Human Exposure to Hand Transmitted Vibration-Supplementary Method for Assessing Risk of Vascular Disorders. AFNOR: Paris, France, 2017.
- Noël, C. A multi-scale approach for predicting acute and chronic effects of mechanical vibration on the digital vascular network. In Proceedings of the 7th American Conference on Human Vibration, Seattle, WA, USA, 13–15 June 2018; pp. 93–94. [Google Scholar]
- Birnstingl, M. The Raynaud syndrome. Postgrad. Med. J. 1971, 47, 297–310. [Google Scholar] [CrossRef][Green Version]
- Olsen, N.D. Hyperreacivity of the Central Sympathetic Nervous System in Vibration-Induced White Finger. Kurume Med. J. 1990, 37, S109–S116. [Google Scholar] [CrossRef]
- Toibana, N.; Ishikawa, N.; Sakakibara, H.; Yamada, S. Raynaud’s phenomenon of fingers and toes among vibration-exposed patients. Nagoya J. Med. Sci. 1994, 57, 121–128. [Google Scholar]
- Stoyneva, Z.; Lyapina, M.; Tzvetkov, D.; Vodenicharov, E. Current pathophysiological views on vibration-induced Raynaud’s phenomenon. Cardiovasc. Res. 2003, 57, 615–624. [Google Scholar] [CrossRef]
- Noël, C. Modeling the biodynamic response of a pre-loaded vibrated phalanx and preliminary results for a whole hand. In Proceedings of the 6th American Conference on Human Vibration, Milwaukee, WI, USA, 8–10 June 2016; pp. 21–22. [Google Scholar]
- Noël, C. Measuring dynamic stiffnesses of preloaded distal phalanges in vibration-Test bench validation and parameter study. Int. J. Ind. Ergon. 2017, 59, 64–79. [Google Scholar] [CrossRef]
- Noël, C. A three-dimensional visco-hyperelastic FE model for simulating the mechanical dynamic response of preloaded phalanges. Med. Eng. Phys. 2018, 61, 41–50. [Google Scholar] [CrossRef] [PubMed]
- Ye, Y.; Griffin, M.J. Reductions in finger blood flow induced by 125-Hz vibration: Effect of location of contact with vibration. Int. Arch. Occup. Environ. Health 2016, 89, 425–433. [Google Scholar] [CrossRef] [PubMed]
- Gemne, G. Pathophysiology of white fingers in workers using hand-held vibrating tools. Nagoya J. Med. Sci. 1994, 57, 87–97. [Google Scholar]
- Heinonen, E.; Färkkilä, M.; Forsström, J.; Antila, K.; Jalonen, J.; Korhonen, O.; Pyykkö, I. Autonomic neuropathy and vibration exposure in forestry workers. Br. J. Ind. Med. 1987, 44, 412–416. [Google Scholar] [CrossRef]
- Mano, T. Autonomic responses to environmental stimuli in human body. Nagoya J. Med. Sci. 1994, 57, 59–75. [Google Scholar]
- Sakakibara, H. Sympathetic responses to hand-arm vibration and symptoms of the foot. Nagoya J. Med. Sci. 1994, 57, 99–111. [Google Scholar]
- Ye, Y. Pacinian Channel Mediated Vasoconstriction in the Fingers during Vibration Exposure. Ph.D. Thesis, University of Southampton, Southampton, UK, 2013. [Google Scholar]
- Bovenzi, M.; Lindsell, C.J.; Griffin, M.J. Acute vascular responses to the frequency of vibration transmitted to the hand. Occup. Environ. Med. 2000, 57, 422–430. [Google Scholar] [CrossRef]
- Dobrin, P.B. Mechanical factors associated with the development of intimal and medial thickening in vein grafts subjected to arterial pressure. A model of arteries exposed to hypertension. Hypertension 1995, 26, 38–43. [Google Scholar] [CrossRef]
- Jackson, M.; Wood, N.B.; Zhao, S.; Augst, A.; Wolfe, J.H.; Gedroyc, W.M.W.; Hughes, A.D.; Thom, S.A.M.; Xu, X.Y. Low wall shear stress predicts subsequent development of wall hypertrophy in lower limb bypass grafts. Artery Res. 2009, 3, 32–38. [Google Scholar] [CrossRef] [PubMed]
- Glagov, S. Intimal hyperplasia, vascular remodeling, and the restenosis problem. Circulation 1994, 89, 2888–2891. [Google Scholar] [CrossRef] [PubMed]
- Poole, C.J.M.; Cleveland, T.J. Vascular hand-arm vibration syndrome-magnetic resonance angiography. Occup. Med. 2016, 66, 75–78. [Google Scholar] [CrossRef] [PubMed]
- Hashiguchi, T.; Yanagi, T.; Kinugawa, Y.; Sakakibara, H.; Yamada, S. Pathological Changes of Finger and Toe. Nagoya J. Med. Sci. 1994, 57, 2–6. [Google Scholar]
- Vuong, P.N.; Sir Berry, C. Effects of physical and chemical agents on vessels. In The Pathology of Vessels; Springer: Berlin, Germany, 2002; pp. 140–161. ISBN 9780874216561. [Google Scholar]
- Noel, C.; Settembre, N. A Test Setup for Measuring the Vibration Effects on Digital Arteries Vasoconstriction: A Preliminary Study. In Proceedings of the 52nd Human Response to Vibration Conference & Workshop, Cranfield University, Shrivenham, UK, 5–6 September 2017; pp. 202–209. [Google Scholar]
- Reda, M.; Noel, C.; Settembre, N.; Chambert, J.; Lejeune, A.; Jacquet, E.; Noel, C.; Settembre, N.; Chambert, J.; Lejeune, A.; et al. Agent-based modelling of the smooth muscle cells migration induced by mechanical vibration: A preliminary study. Comput. Methods Biomech. Biomed. Eng. 2020, 23, S255–S256. [Google Scholar] [CrossRef]
- Chim, H. Hand and Wrist Anatomy and Biomechanics: A Comprehensive Guide; Thieme: Stuttgart, Germany, 2017; ISBN 9783132053410. [Google Scholar]
- Verrillo, R.T. Investigation of Some Parameters of the Cutaneous Threshold for Vibration. J. Acoust. Soc. Am. 1962, 34, 1768–1773. [Google Scholar] [CrossRef]
- Verrillo, R.T. Vibrotactile sensitivity and the frequency response of the Pacinian corpuscle 1. Psychon. Sci. 1966, 4, 135–136. [Google Scholar] [CrossRef]
- Inman, D.R.; Peruzzi, P. The effects of temperature on the responses of Pacinian corpuscles. J. Physiol. 1961, 155, 280–301. [Google Scholar] [CrossRef]
- Bolanowski, S.; Verrilo, R. Temperature and Criterion Effects in Somatosensory Subsystem: A Neurophysiological and Psychophysical Study. J. Neurophysiol. 1982, 48, 836–855. [Google Scholar] [CrossRef]
- Pease, D.C.; Quilliam, T.A. Electron microscopy of the Pacinian corpuscle. J. Biophys. Biochem. Cytol. 1957, 3, 331–342. [Google Scholar] [CrossRef]
- Spencer, P.S.; Schaumburg, H.H. An ultrastructural study of the inner core of the Pacinian corpuscle. J. Neurocytol. 1973, 2, 217–235. [Google Scholar] [CrossRef] [PubMed]
- Bell, J.; Holmes, M. Model of the dynamics of receptor potential in a mechanoreceptor. Math. Biosci. 1992, 110, 139–174. [Google Scholar] [CrossRef]
- Feng, X.; Lu, T. Introduction to Skin Biothermomechanics and Thermal Pain; Springer: Berlin/Heidelberg, Germany, 2011; ISBN 9787030270771. [Google Scholar]
- Noël, C. Validation of a 3d visco-hyper-elastic finite element model for a pre-stressed vibrated distal forefinger phalanx: Mechanical and first thermal analysis. In Proceedings of the 13th International Conference on Han-Arm Vibration, Beijing China, 13–15 October 2015; pp. 85–86. [Google Scholar]
- Noël, C. B-Mode Cineloop and Pulsed Wave Doppler of the Proper Volar Digital Artery. Mendeley Data. 2021. Available online: https://doi.org/10.17632/7337g2p7t9tzt.1 (accessed on 21 March 2022).
- Womersley, J.R. Method for the calculation of velocity, rate of flow and viscous drag in arteries when the pressure gradient is known. J. Physiol. 1955, 127, 553–563. [Google Scholar] [CrossRef] [PubMed]
- Blake, J.R.; Meagher, S.; Fraser, K.H.; Easson, W.J.; Hoskins, P.R. A Method to Estimate Wall Shear Rate with a Clinical Ultrasound Scanner. Ultrasound Med. Biol. 2008, 34, 760–774. [Google Scholar] [CrossRef] [PubMed]
- Stefanovska, A.; Krošelj, P.; Bračič, M.; Strle, S. Reconstructing Cardiovascular Dynamics. IFAC Proc. Vol. 1997, 30, 7–12. [Google Scholar] [CrossRef]
- Söderström, T.; Stefanovska, A.; Veber, M.; Svensson, H. Involvement of sympathetic nerve activity in skin blood flow oscillations in humans. Am. J. Physiol.-Heart Circ. Physiol. 2003, 284, 1638–1646. [Google Scholar] [CrossRef]
- Nirala, N.; Periyasamy, R.; Kumar, A. Study of skin flow motion pattern using photoplethysmogram. Int. J. Adv. Intell. Paradig. 2020, 16, 241–264. [Google Scholar] [CrossRef]
- Zhang, Q.; Zhang, Y.; Zhou, Y.; Zhang, K.; Zhang, K.; Gao, L. An Ultrasound Simulation Model for the Pulsatile Blood Flow Modulated by the Motion of Stenosed Vessel Wall. Biomed Res. Int. 2016, 2016, 8502873. [Google Scholar] [CrossRef]
- Zhou, X.; Xia, C.; Stephen, G.; Khan, F.; Corner, G.A.; Hoskins, P.R.; Huang, Z. Investigation of Ultrasound-Measured Flow Velocity, Flow Rate and Wall Shear Rate in Radial and Ulnar Arteries Using Simulation. Ultrasound Med. Biol. 2017, 43, 981–992. [Google Scholar] [CrossRef][Green Version]
- Deng, L.; Zhang, Y.; Zhao, Z.; Zhang, K.; Hu, X.; Gao, L.; Liang, H.; Zhang, J. Ultrasound simulation model incorporating incident and reflected wave propagations along a common carotid artery. Comput. Biol. Med. 2019, 104, 267–277. [Google Scholar] [CrossRef]
- Noël, C.; Settembre, N. Assessing mechanical vibration-altered wall shear stress in digital arteries. J. Biomech. 2022, 131, 110893. [Google Scholar] [CrossRef] [PubMed]
- Noël, C. In Silico Ultrasound Phantoms for Mimicking the Proper Volar Forefinger Artery. Mendeley Data. 2021. Available online: https://data.mendeley.com/datasets/wzrr3t6nnz/4 (accessed on 21 March 2022).
- Charlton, P.H.; Harana, J.M.; Vennin, S.; Li, Y.; Chowienczyk, P.; Alastruey, J. Modeling arterial pulse waves in healthy aging: A database for in silico evaluation of hemodynamics and pulse wave indexes. Am. J. Physiol.-Heart Circ. Physiol. 2019, 317, H1062–H1085. [Google Scholar] [CrossRef]
- Epstein, F.H.; Gibbons, G.H.; Dzau, V.J. The emerging concept of vascular remodeling. N. Engl. J. Med. 1994, 330, 1431–1438. [Google Scholar] [CrossRef] [PubMed]
- Nerem, R.M.; Alexander, R.W.; Chappell, D.C.; Medford, R.M.; Varner, S.E.; Robert Taylor, W. The Study of the Influence of Flow on Vascular Endothelial Biology. Am. J. Med. Sci. 1998, 316, 169–175. [Google Scholar] [CrossRef] [PubMed]
- Hsieh, H.J.; Li, N.Q.; Frangos, J.A. Shear stress increases endothelial platelet-derived growth factor mRNA levels. Am. J. Physiol.-Heart Circ. Physiol. 1991, 260, 1–5. [Google Scholar] [CrossRef]
- Heydarkhan-Hagvall, S.; Chien, S.; Nelander, S.; Li, Y.C.; Yuan, S.; Lao, J.; Haga, J.H.; Lian, I.; Nguyen, P.; Risberg, B.; et al. DNA microarray study on gene expression profiles in co-cultured endothelial and smooth muscle cells in response to 4- and 24-h shear stress. Mol. Cell. Biochem. 2006, 281, 1–15. [Google Scholar] [CrossRef]
- Kona, S.; Chellamuthu, P.; Xu, H.; Hills, S.R.; Nguyen, K.T. Effects of Cyclic Strain and Growth Factors on Vascular Smooth Muscle Cell Responses. Open Biomed. Eng. J. 2009, 3, 28–38. [Google Scholar] [CrossRef][Green Version]
- Bayer, I.M.; Adamson, S.L.; Langille, B.L. Atrophic remodeling of the artery-cuffed artery. Arterioscler. Thromb. Vasc. Biol. 1999, 19, 1499–1505. [Google Scholar] [CrossRef][Green Version]
- Thorne, B.C.; Hayenga, H.N.; Humphrey, J.D.; Peirce, S.M. Toward a multi-scale computational model of arterial adaptation in hypertension: Verification of a multi-cell agent-based model. Front. Physiol. 2011, 2, 20. [Google Scholar] [CrossRef]
- Evans, D.J.W.; Lawford, P.V.; Gunn, J.; Walker, D.; Hose, D.R.; Smallwood, R.H.; Chopard, B.; Krafczyk, M.; Bernsdorf, J.; Hoekstra, A. The application of multiscale modelling to the process of development and prevention of stenosis in a stented coronary artery. Philos. Trans. R. Soc. A Math. Phys. Eng. Sci. 2008, 366, 3343–3360. [Google Scholar] [CrossRef]
- Boyle, C.J.; Lennon, A.B.; Early, M.; Kelly, D.J.; Lally, C.; Prendergast, P.J. Computational simulation methodologies for mechanobiological modelling: A cell-centred approach to neointima development in stents. Philos. Trans. R. Soc. A Math. Phys. Eng. Sci. 2010, 368, 2919–2935. [Google Scholar] [CrossRef] [PubMed]
- Holzapfel, G.A.; Ogden Editors, R.W. Biomechanics: Trends in Modeling and Simulation; Springer: Cham, Germany, 2017; ISBN 9783319414737. [Google Scholar]
- Reda, M.; Noel, C.; Settembre, N.; Chambert, J.; Lejeune, A.; Jacquet, E. Agent-based model of the vibration-induced intimal hyperplasia. Biomech. Model. Mechanobiol. 2022; submitted for publication. [Google Scholar]
- Reda, M.; Noel, C.; Settembre, N.; Chambert, J.; Lejeune, A.; Jacquet, E. Mechanobiological modelling of vibration-induced intimal hyperplasia: A coupled agent-based-finite element approach. Comput. Biol. Med. 2022; submitted for publication. [Google Scholar]
- ISO 10068; Mechanical Vibration and Shock-Mechanical Impedance of the Human Hand-Arm System at the Driving Point. AFNOR: Paris, France, 2012.
- Adewusi, S.; Thomas, M.; Vu, V.H.; Li, W. Modal parameters of the human hand-Arm using finite element and operational modal analysis. Mech. Ind. 2014, 15, 541–549. [Google Scholar] [CrossRef]
- Lundström, R.; Burström, L. Mechanical impedance of the human hand-arm system. Int. J. Ind. Ergon. 1989, 3, 235–242. [Google Scholar] [CrossRef]
- Xu, X.S.; Welcome, D.E.; McDowell, T.W.; Wu, J.Z.; Wimer, B.; Warren, C.; Dong, R.G. The vibration transmissibility and driving-point biodynamic response of the hand exposed to vibration normal to the palm. Int. J. Ind. Ergon. 2011, 41, 418–427. [Google Scholar] [CrossRef]
- Xu, X.S.; Dong, R.G.; Welcome, D.E.; Warren, C.; Mcdowell, T.W.; Wu, J.Z. Vibrations transmitted from human hands to upper arm, shoulder, back, neck, and head. Int. J. Ind. Ergon. 2017, 62, 1–12. [Google Scholar] [CrossRef]
- Dong, R.G.; Welcome, D.E.; McDowell, T.W.; Wu, J.Z. Biodynamic response of human fingers in a power grip subjected to a random vibration. J. Biomech. Eng. 2004, 126, 447–457. [Google Scholar] [CrossRef]
- Wu, J.Z.; Welcome, D.E.; McDowell, T.W.; Xu, X.S.; Dong, R.G. Modeling of the interaction between grip force and vibration transmissibility of a finger. Med. Eng. Phys. 2017, 45, 61–70. [Google Scholar] [CrossRef]
- Dong, R.G.; Welcome, D.E.; Xu, X.S.; Warren, C.; McDowell, T.W.; Wu, J.Z.; Rakheja, S. Mechanical impedances distributed at the fingers and palm of the human hand in three orthogonal directions. J. Sound Vib. 2012, 331, 1191–1206. [Google Scholar] [CrossRef][Green Version]
- Pan, D.; Xu, X.S.; Welcome, D.E.; McDowell, T.W.; Warren, C.; Wu, J.; Dong, R.G. The relationships between hand coupling force and vibration biodynamic responses of the hand-arm system. Ergonomics 2018, 61, 818–830. [Google Scholar] [CrossRef] [PubMed]
- Gennisson, J.L.; Deffieux, T.; Macé, E.; Montaldo, G.; Fink, M.; Tanter, M. Viscoelastic and anisotropic mechanical properties of in vivo muscle tissue assessed by supersonic shear imaging. Ultrasound Med. Biol. 2010, 36, 789–801. [Google Scholar] [CrossRef]
- Quindlen, J.C.; Barocas, V.H.; Flanders, M. A Multiphysics Model of the Pacinian Corpuscle. Integr. Biol. 2016, 396–397. [Google Scholar] [CrossRef] [PubMed]
- Quindlen, J.C. Mechano-to-Neural Transduction of the Pacinian Corpuscle; University of Minnesota: Minneapolis, MN, USA, 2017. [Google Scholar]
- Liu, Z.; Wu, C.T.; Ren, B.; Liu, W.K.; Grimes, R. Multiscale Simulations of Material with Heterogeneous Structures Based on Representative Volume Element Techniques. In Proceedings of the 15th International LS-DYNA Conference, Dearborn, MI, USA, 10–12 June 2009; pp. 1–10. [Google Scholar]
- Briant, L.J.B.; Paton, J.F.R.; Pickering, A.E.; Champneys, A.R. Modelling the vascular response to sympathetic postganglionic nerve activity. J. Theor. Biol. 2015, 371, 102–116. [Google Scholar] [CrossRef] [PubMed]
- Petiot, E.; Barrès, C.; Chapuis, B.; Julien, C. Frequency response of renal sympathetic nervous activity to aortic depressor nerve stimulation in the anaesthetized rat. J. Physiol. 2001, 537, 949–959. [Google Scholar] [CrossRef]
- Kamiya, A.; Michikami, D.; Iwase, S.; Mano, T. Decoding rule from vasoconstrictor skin sympathetic nerve activity to nonglabrous skin blood flow in humans at normothermic rest. Neurosci. Lett. 2008, 439, 13–17. [Google Scholar] [CrossRef]
- Hines, M.L.; Carnevale, N.T. The NEURON simulation environment. Neural Comput. 1997, 9, 1179–1209. [Google Scholar] [CrossRef] [PubMed]
- Bittar, E.E.; Willis, J.S. Advances in Molecular and Cell Biology-Volume 19: Thermobiology; JAI Press LTD: London, UK, 1997; ISBN 9780874216561. [Google Scholar]
- Lepock, J.R. How do cells respond to their thermal environment? Int. J. Hyperth. 2005, 21, 681–687. [Google Scholar] [CrossRef] [PubMed]
- Habash, R.W.Y.; Bansal, R.; Krewski, D.; Alhafid, H.T. Thermal Therapy, Part 1: An Introduction to Thermal Therapy. Crit. Rev. Biomed. Eng. 2006, 34, 459–489. [Google Scholar] [CrossRef]
- Daniel, R.M.; Peterson, M.E.; Danson, M.J.; Price, N.C.; Kelly, S.M.; Monk, C.R.; Weinberg, C.S.; Oudshoorn, M.L.; Lee, C.K. The molecular basis of the effect of temperature on enzyme activity. Biochem. J. 2010, 425, 353–360. [Google Scholar] [CrossRef]
- Mynard, J.P.; Wasserman, B.A.; Steinman, D.A. Errors in the estimation of wall shear stress by maximum Doppler velocity. Atherosclerosis 2013, 227, 259–266. [Google Scholar] [CrossRef]
- Stroev, P.V.; Hoskins, P.R.; Easson, W.J. Distribution of wall shear rate throughout the arterial tree: A case study. Atherosclerosis 2007, 191, 276–280. [Google Scholar] [CrossRef]
- Sakariassen, K.S.; Orning, L.; Turitto, V.T.; Sas, K.; Campo Zampo, S. The impact of blood shear rate on arterial thrombus formation. Future Sci. OA 2015, 1, 30. [Google Scholar] [CrossRef]
- Nichols, W.W.; O’Rourke, M.F.; Vlachopoulos, C.; Hoeks, A.P.; Reneman, R.S. McDonald’s Blood Flow in Arteries Theoretical, Experimental and Clinical Principles, 6th ed.; Hodder Arnold: London, UK, 2011; ISBN 9780340985014. [Google Scholar]
- Bovenzi, M.; Lindsell, C.J.; Griffin, M.J. Magnitude of acute exposures to vibration and finger circulation. Scand. J. Work. Environ. Health 1999, 25, 278–284. [Google Scholar] [CrossRef] [PubMed]
- Morioka, M.; Griffin, M.J. Magnitude-dependence of equivalent comfort contours for fore-and-aft, lateral and vertical hand-transmitted vibration. J. Sound Vib. 2006, 295, 633–648. [Google Scholar] [CrossRef]
- Harada, N.; Hirata, M.; Ishitake, T.; Yukinori Kume, Y.K.; Miyashita, K.; Sakakibara, H.; Syuji Satou, N.T.; Mahbub, H. Guidelines of the Japanese Research Society for Vibration Syndrome to Diagnose Hand-Arm Vibration Syndrome. In Proceedings of the 12th International Conference on Hand-Arm Vibration, Ottawa, ON, Canada, 13–17 June 2011; pp. 76–77. [Google Scholar]
- Honma, H.; Kobayashi, T.; Kaji, H. A Color Atlas of Circulation Disorders in Hand-Arm Vibration Syndrome; Iwamizawa Rosai Hospital, Labour Welfare Corporation: Iwamizawa, Japan, 2003.
- Kahaleh, B.; Mulligan-Kehoe, M.J. Mechanisms of Vascular Disease; University of Adelaide Press: Adelaide, Australia, 2012; ISBN 9781441957740. [Google Scholar]
- Hobeika, M.J.; Thompson, R.W.; Muhs, B.E.; Brooks, P.C.; Gagne, P.J. Matrix metalloproteinases in peripheral vascular disease. J. Vasc. Surg. 2007, 45, 849–857. [Google Scholar] [CrossRef] [PubMed]
- Mahor, D.; Kumari, V.; Vashisht, K.; Galgalekar, R.; Samarth, R.M.; Mishra, P.K.; Banerjee, N.; Dixit, R.; Saluja, R.; De, S.; et al. Elevated serum matrix metalloprotease (MMP-2) as a candidate biomarker for stable COPD. BMC Pulm. Med. 2020, 20, 302. [Google Scholar] [CrossRef]
- Lopez-Avila, V.; Spencer, J.V. Methods for Detection of Matrix Metalloproteinases as Biomarkers in Cardiovascular Disease. Clin. Med. Cardiol. 2008, 2, CMC.S484. [Google Scholar] [CrossRef]
- ISO 12052:2017; Health Informatics—Digital Imaging and Communication in Medicine (DICOM) including Workflow and Data Management. International Organization for Standardization: Geneva, Switzerland, 2017.
- Loizou, C.P.; Theofanous, C.; Pantziaris, M.; Kasparis, T. Despeckle filtering software toolbox for ultrasound imaging of the common carotid artery. Comput. Methods Programs Biomed. 2014, 114, 109–124. [Google Scholar] [CrossRef]
- Loizou, C.; Pattichis, C.S. Despeckle Filtering for Ultrasound Imaging and Video, Volume I: Algorithms and Software, Second Edition. Synth. Lect. Algorithms Softw. Eng. 2015, 7, 1–180. [Google Scholar] [CrossRef]
- Noble, J.A.; Boukerroui, D. Ultrasound image segmentation: A survey. IEEE Trans. Med. Imaging 2006, 25, 987–1010. [Google Scholar] [CrossRef]
- Giannoglou, G.D.; Chatzizisis, Y.S.; Koutkias, V.; Kompatsiaris, I.; Papadogiorgaki, M.; Mezaris, V.; Parissi, E.; Diamantopoulos, P.; Strintzis, M.G.; Maglaveras, N.; et al. A novel active contour model for fully automated segmentation of intravascular ultrasound images: In vivo validation in human coronary arteries. Comput. Biol. Med. 2007, 37, 1292–1302. [Google Scholar] [CrossRef] [PubMed]
- Withey, D.J.; Koles, Z.J. Review of Medical Image Segmentation: Methods and Available Software. Int. J. Bioelectromagn. 2008, 10, 125–148. [Google Scholar]
- Mahmood, N.H.; Supriyanto, E. Automatic Detection of Carotid Artery in Ultrasound Image using Tresholding Method. Int. J. Sci. Eng. Res. 2011, 2, 1–7. [Google Scholar]
- Molinari, F.; Pattichis, C.S.; Zeng, G.; Saba, L.; Acharya, U.R.; Sanfilippo, R.; Nicolaides, A.; Suri, J.S. Completely automated multiresolution edge snapper—A new technique for an accurate carotid ultrasound IMT measurement: Clinical validation and benchmarking on a multi-institutional database. IEEE Trans. Image Process. 2012, 21, 1211–1222. [Google Scholar] [CrossRef] [PubMed]
- Molinari, F.; Meiburger, K.M.; Zeng, G.; Acharya, U.R.; Liboni, W.; Nicolaides, A.; Suri, J.S. Carotid artery recognition system: A comparison of three automated paradigms for ultrasound images. Med. Phys. 2011, 39, 378–391. [Google Scholar] [CrossRef]
- Kumar, P.K.; Araki, T.; Rajan, J.; Laird, J.R.; Nicolaides, A.; Suri, J.S. State-of-the-art review on automated lumen and adventitial border delineation and its measurements in carotid ultrasound. Comput. Methods Programs Biomed. 2018, 163, 155–168. [Google Scholar] [CrossRef] [PubMed]
- León, B.; Morales, A.; Sancho-Bru, J. Chapter 5—The Model of the Human Hand. In From Robot to Human Grasping Simulation; Springer: Berlin/Heidelberg, Germany, 2014; p. 263. ISBN 9783319018324. [Google Scholar]
- Adewusi, S.; Rakheja, S.; Marcotte, P. Biomechanical models of the human hand-arm to simulate distributed biodynamic responses for different postures. Int. J. Ind. Ergon. 2012, 42, 249–260. [Google Scholar] [CrossRef]
- Adewusi, S.; Rakheja, S.; Marcotte, P.; Thomas, M. Distributed vibration power absorption of the human hand-arm system in different postures coupled with vibrating handle and power tools. Int. J. Ind. Ergon. 2013, 43, 363–374. [Google Scholar] [CrossRef]
- Payan, Y.; Ohayon, J. Biomechanics of Living Organs, 1st ed.; Inc, A.P., Ed.; Elsevier Science Publishing Co. Inc.: San Diego, CA, USA, 2017; ISBN 9780128040096. [Google Scholar]
- Gras, L.L.; Mitton, D.; Viot, P.; Laporte, S. Modelling of human muscle behaviour with a hyper-elastic constitutive law. Comput. Methods Biomech. Biomed. Eng. 2010, 13, 63–64. [Google Scholar] [CrossRef]
- Wu, J.Z.; Krajnak, K.; Welcome, D.E.; Dong, R.G. Analysis of the dynamic strains in a fingertip exposed to vibrations: Correlation to the mechanical stimuli on mechanoreceptors. J. Biomech. 2006, 39, 2445–2456. [Google Scholar] [CrossRef]
- Lakes, R.S.; Katz, J.L. Viscoelastic properties of wet cortical bone—III. A non-linear constitutive equation. J. Biomech. 1979, 12, 689–698. [Google Scholar] [CrossRef]


| Hand Model 1 | Hand Model 2 | |
|---|---|---|
| Model |  |  |
| Anatomical detail | Coarse | Fine |
| Number of nodes | 10,325 | 262,226 |
| Number of elements | 47,446 | 1,455,357 |
| Design | Literature data [33] | Segmentation of MRI images |
Publisher’s Note: MDPI stays neutral with regard to jurisdictional claims in published maps and institutional affiliations. |
© 2022 by the authors. Licensee MDPI, Basel, Switzerland. This article is an open access article distributed under the terms and conditions of the Creative Commons Attribution (CC BY) license (https://creativecommons.org/licenses/by/4.0/).
Share and Cite
Noël, C.; Settembre, N.; Reda, M.; Jacquet, E. A Multiscale Approach for Predicting Certain Effects of Hand-Transmitted Vibration on Finger Arteries. Vibration 2022, 5, 213-237. https://doi.org/10.3390/vibration5020014
Noël C, Settembre N, Reda M, Jacquet E. A Multiscale Approach for Predicting Certain Effects of Hand-Transmitted Vibration on Finger Arteries. Vibration. 2022; 5(2):213-237. https://doi.org/10.3390/vibration5020014
Chicago/Turabian StyleNoël, Christophe, Nicla Settembre, Maha Reda, and Emmanuelle Jacquet. 2022. "A Multiscale Approach for Predicting Certain Effects of Hand-Transmitted Vibration on Finger Arteries" Vibration 5, no. 2: 213-237. https://doi.org/10.3390/vibration5020014
APA StyleNoël, C., Settembre, N., Reda, M., & Jacquet, E. (2022). A Multiscale Approach for Predicting Certain Effects of Hand-Transmitted Vibration on Finger Arteries. Vibration, 5(2), 213-237. https://doi.org/10.3390/vibration5020014