Article

A Multiscale Approach for Predicting Certain Effects of Hand-Transmitted Vibration on Finger Arteries

1
Electromagnetism, Vibration, Optics Laboratory, Institut National de Recherche et de Sécurité (INRS), CEDEX, 54519 Vandœuvre-lès-Nancy, France
2
Department of Vascular Surgery, Nancy University Hospital, University of Lorraine, 54500 Vandœuvre-lès-Nancy, France
3
Department of Applied Mechanics, FEMTO-ST Institute, University Bourgogne Franche-Comté, 25000 Besançon, France
*
Author to whom correspondence should be addressed.
Vibration 2022, 5(2), 213-237; https://doi.org/10.3390/vibration5020014
Submission received: 24 December 2021 / Revised: 17 March 2022 / Accepted: 20 March 2022 / Published: 1 April 2022

Abstract

:
Prolonged exposure to strong hand-arm vibrations can lead to vascular disorders such as Vibration White Finger (VWF). We modeled the onset of this peripheral vascular disease in two steps. The first consists in assessing the reduction in shearing forces exerted by the blood on the walls of the arteries (Wall Shear Stress—WSS) during exposure to vibrations. An acute but repeated reduction in WSS can lead to arterial stenosis characteristic of VWF. The second step is devoted to using a numerical mechano-biological model to predict this stenosis as a function of WSS. WSS is reduced by a factor of 3 during exposure to vibration of 40 m·s−2. This reduction is independent of the frequency of excitation between 31 Hz and 400 Hz. WSS decreases logarithmically when the amplitude of the vibration increases. The mechano-biological model simulated arterial stenosis of 30% for an employee exposed for 4 h a day for 10 years. This model also highlighted the chronic accumulation of matrix metalloproteinase 2. By considering daily exposure and the vibratory level, we can calculate the degree of stenosis, thus that of the disease for chronic exposure to vibrations.

1. Introduction

1.1. Problem of Vibrations Transmitted to the Upper Limb

In France, 11.3% of employees in the private sector are exposed to vibrations transmitted to the upper limb [1,2]. Most professional sectors are concerned, such as construction and public works, forestry, foundries, mechanical workshops, agriculture, and the wood industry. Certain trades have a very high number of employees exposed to vibrations. For example, more than 85% of masons and automobile mechanics are exposed to the risk of hand–arm vibrations [2].
About 17% [2] of employees subjected to hand-transmitted vibrations have an exposure time of more than 10 h a week, and nearly 8% are exposed for more than 20 h a week. However, prolonged exposure to high levels of vibration can lead to several vascular, neurological, osteoarticular, and muscle–tendon disorders [3,4,5], designated by the generic term “vibration syndrome” [6]. In 2018 in France, 119 diseases were recognized by the social security system, representing a cost of EUR 7.8 million, i.e., about EUR 66 thousand per employee.
In order to create a minimum basis of protection for all European workers, the European Union introduced, through the directive 2002/44/CE of 25 June 2002 [7], regulatory obligations aimed at reducing the risk of vibrations to health and safety. This directive defines, in particular, the daily exposure standardized to an eight-hour reference period as an indicator to assess the risk and establish threshold values that should not be exceeded. This vibratory exposure is measured in conformity with standard ISO 5349 (parts 1 [8] and 2 [9]). For example, for a handheld vibrating machine, exposure can be quantified by measuring the acceleration on the handle of the machine. Exposure can also be assessed without direct measurement in the field using measurement databases or vibration emission values declared by the machine manufacturers [10]. Whatever type of assessment is carried out, the estimation of vibration exposure is calculated, directly or indirectly, from the root mean squared (rms) values of accelerations weighted by frequency, by the filtering defined in standard ISO 5349-1 [8].

1.2. Shortcomings in the Standardized Estimation of Vibration Exposure and Their Impact on Some Prevention Strategies

The estimation of vibration exposure using frequency-weighted accelerations is justified if the amplitude of the weighting filter mirrors the importance of each frequency in terms of pathological impact. However, several physiological, histological, and epidemiological studies [11,12,13] have highlighted that this filter underestimates the effect on the health caused by vibrations with a frequency higher than 50 Hz. Such vibrations are liable to cause angioneuronal disorders. In particular, they can lead to the development of vibration-induced Raynaud’s syndrome [14,15], i.e., Vibration White Finger (VWF) [16]. In French companies, more than three-quarters of employees exposed to hand–arm vibrations use handheld or hand-guided machines [2], generating vibrations of frequencies higher than 50 Hz. Thus, the probably excessive weighting of the ISO 5349 filter of frequencies higher than 50 Hz means that for most French workers exposed to hand–arm vibrations, the estimation of the vibration dose could underestimate the risk of occurrence of VWF due to vibration. Finally, the estimation of vibration exposure can conform to regulatory thresholds without, however, guaranteeing the protection desired for workers against this peripheral vascular disease.
Furthermore, the current standard ISO 5349 may have negative effects on the marketing of practical solutions for preventing vibration risk. Indeed, some antivibration devices are based on the use of damping materials that are efficient at high frequencies (>150 Hz). However, the considerable weighting of acceleration by the ISO 5349 filter at high frequencies often leads to almost the same regulatory weighted accelerations without, and with, antivibration systems, even when the latter are very efficient. Therefore, the interest for the manufacturers to develop this type of protection is very limited since they cannot propose a technical contribution demonstrated according to the terms of the regulations. Finally, all these protection devices are rarely found on the market, although they are susceptible to reducing the transmission of vibration energy between the vibrating machine and the upper limb in the spectral range of the vibrations responsible for vascular disorders.

1.3. Objectives

Many research studies have attempted to improve the standardized weighting filter in order to better take into account the vascular physiopathological effects caused by vibrations, but few studies have focused on how to calculate the daily vibration dose. These works are mainly based on epidemiological, histological, physiological, psychophysical, and biomechanical approaches [12,17,18,19,20,21,22,23,24]. Technical report ISO/TR 18570 [25] provides a synthesis of these different studies and defines an improved (but nonregulatory) methodology for estimating the risk of vascular vibration. More precisely, in this technical report, frequency weightings and exposure–response relationships were mainly carried out from biodynamic models and epidemiological studies, while physiological responses of humans or animals remain poorly used for this purpose. Therefore, we would like, in the long term, to define new frequency weightings based on physiological responses of humans and the exposure–response relationship stemming from biological modeling of the chronic mechanisms responsible for VWF. To the best of our knowledge, our current strategy is probably among the first approaches trying to link mechanical vibration, acute physiological induced responses, and chronic pathological effect for defining a potential, down the road, dose–effect relationship.
Hence, our objective is to propose an alternative method to the existing ones that relies on a multiscale mechano-biological approach in time and space [26]. This new approach consists in (i) identifying an acute physiological effect caused by vibrations, pertinent because these vibrations can cause, through chronic accumulation, the development of VWF, (ii) finding the relation between the vibration and this acute physiological effect, which would allow defining a weighting filter that better couples the physical and the physiological dimensions, and (iii) modeling a law of chronic accumulation of these repeated acute physiological effects. The ultimate aim is to define an exposure dose based on this law.

2. Materials and Methods

2.1. The Original Strategy Implemented

The physiopathology of vibration-induced Raynaud’s syndrome is very complex, highly multifactorial, and still remains poorly understood [15,16,27,28,29,30]. In a highly schematic and simplified way, we have modeled the development of Raynaud’s vibration syndrome in several stages, from which emerge two steps in time and space (Figure 1). Firstly, the vibrations transmitted to the upper limb by a vibrating machine propagate inside the soft tissue of the fingers and hand, generating thermomechanical effects such as the modification of the stress/deformation field, mechanical power dissipation, and local temperature [31,32,33]. These thermomechanical changes can then disturb the equilibrium of digital vasoregulation. This imbalance can result in the direct action of the vibrations on the arteries and the digital nervous network. It can also be indirect and involve certain mechanoreceptors and the central and peripheral nervous systems. These acute and repeated disturbances of different physiological parameters controlling vasoregulation can then accumulate chronically and lead to the occurrence of VWF. The exact mechanisms leading to permanent vascular changes still remain poorly understood [22,34].
In our study, we consider only the indirect neuronal mechanisms of the imbalance of vasoregulation. More specifically, since the 1980s [35,36,37,38] up to more recently [22,39], many studies have shown that the vibrations transmitted to the hand–arm system trigger a nervous response via certain mechanoreceptors (Pacinian corpuscle, Merkel, etc.). The sensitive neural impulses trigger, via the sympathetic nervous system, a neural response leading to the vasoconstriction of the vibrated and nonvibrated fingers. The consequence of this vasoconstriction is the reduction in the blood flow in the digital extremities [40].
We hypothesize that this reduction in blood flow modifies the shear stress exerted by the blood on the endothelium of the artery—the Wall Shear Stress (WSS). However, a chronic modification of hemodynamic factors leads to a vascular adaptation regulated by homeostatic mechanisms [41,42]. In particular, the reduction in shearing efforts, in the long term, results in the reduction in the arterial lumen and the thickness of the different layers of the arteries, in turn leading to arterial stenosis [43]. Angiographies [14,44] and histological analyses of biopsies [45,46] performed on patients suffering from VWF, moreover, revealed considerable arterial stenoses with a reduction in the arterial lumen sometimes exceeding 50%.
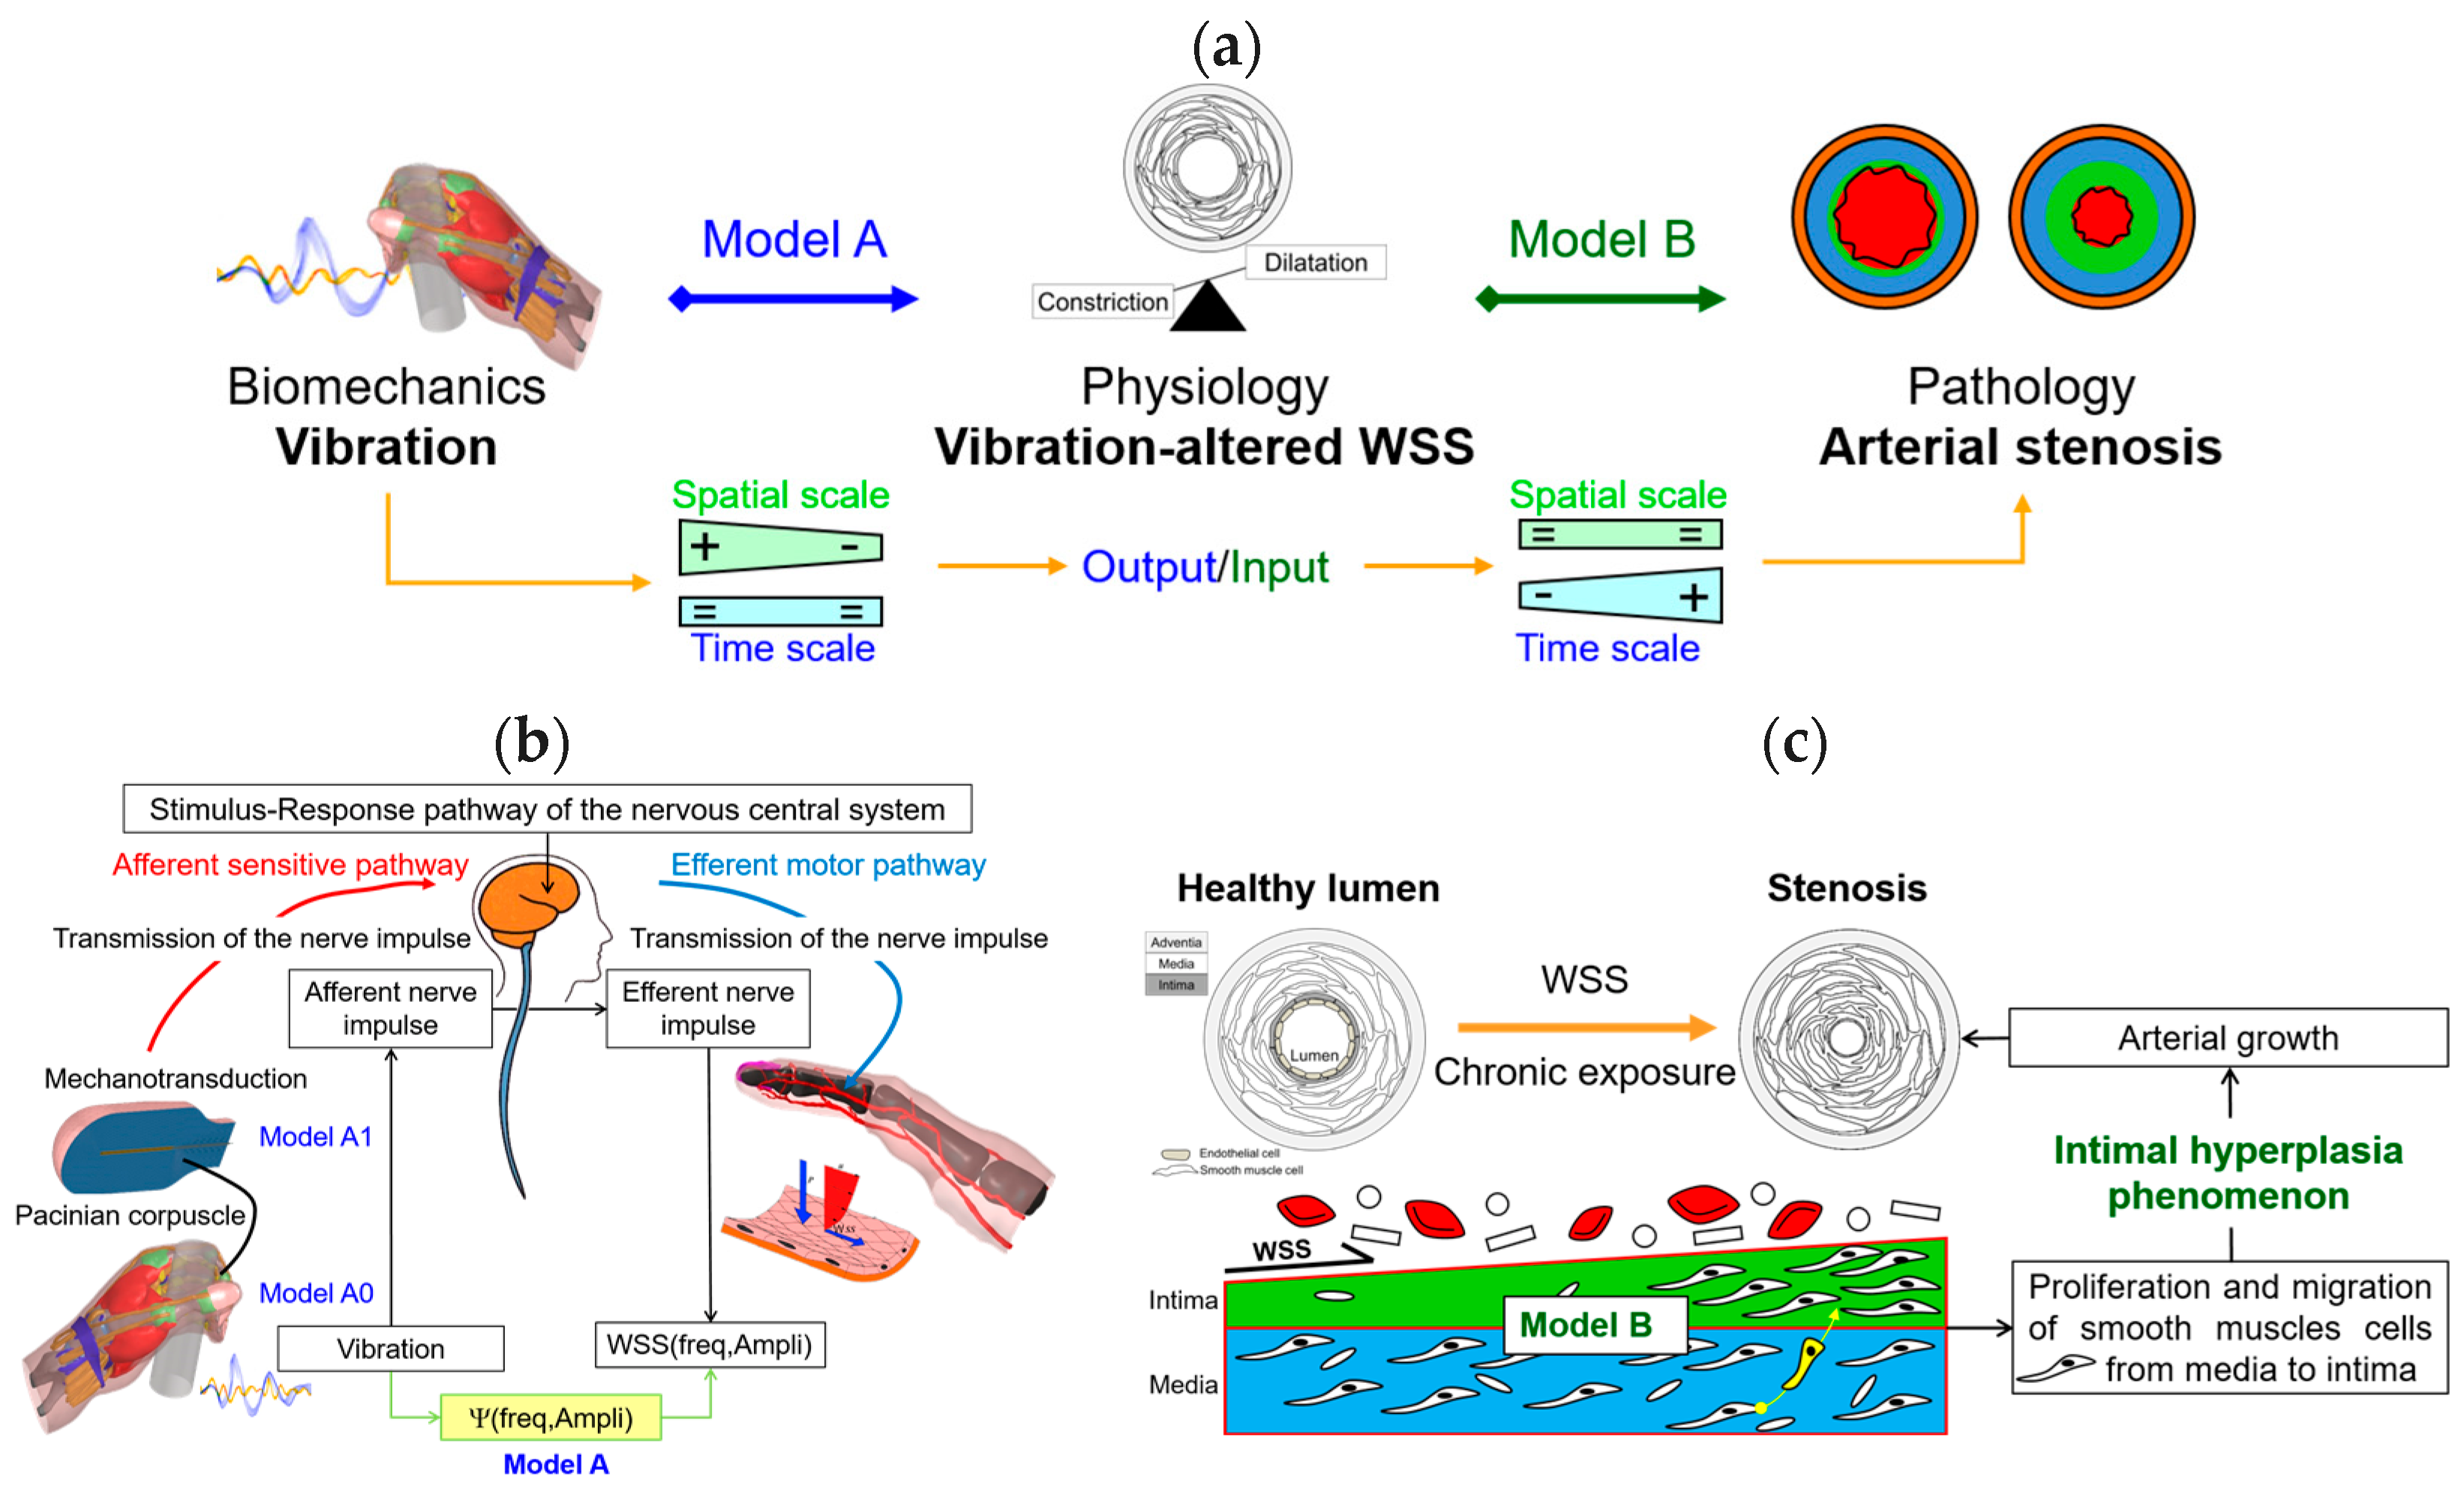
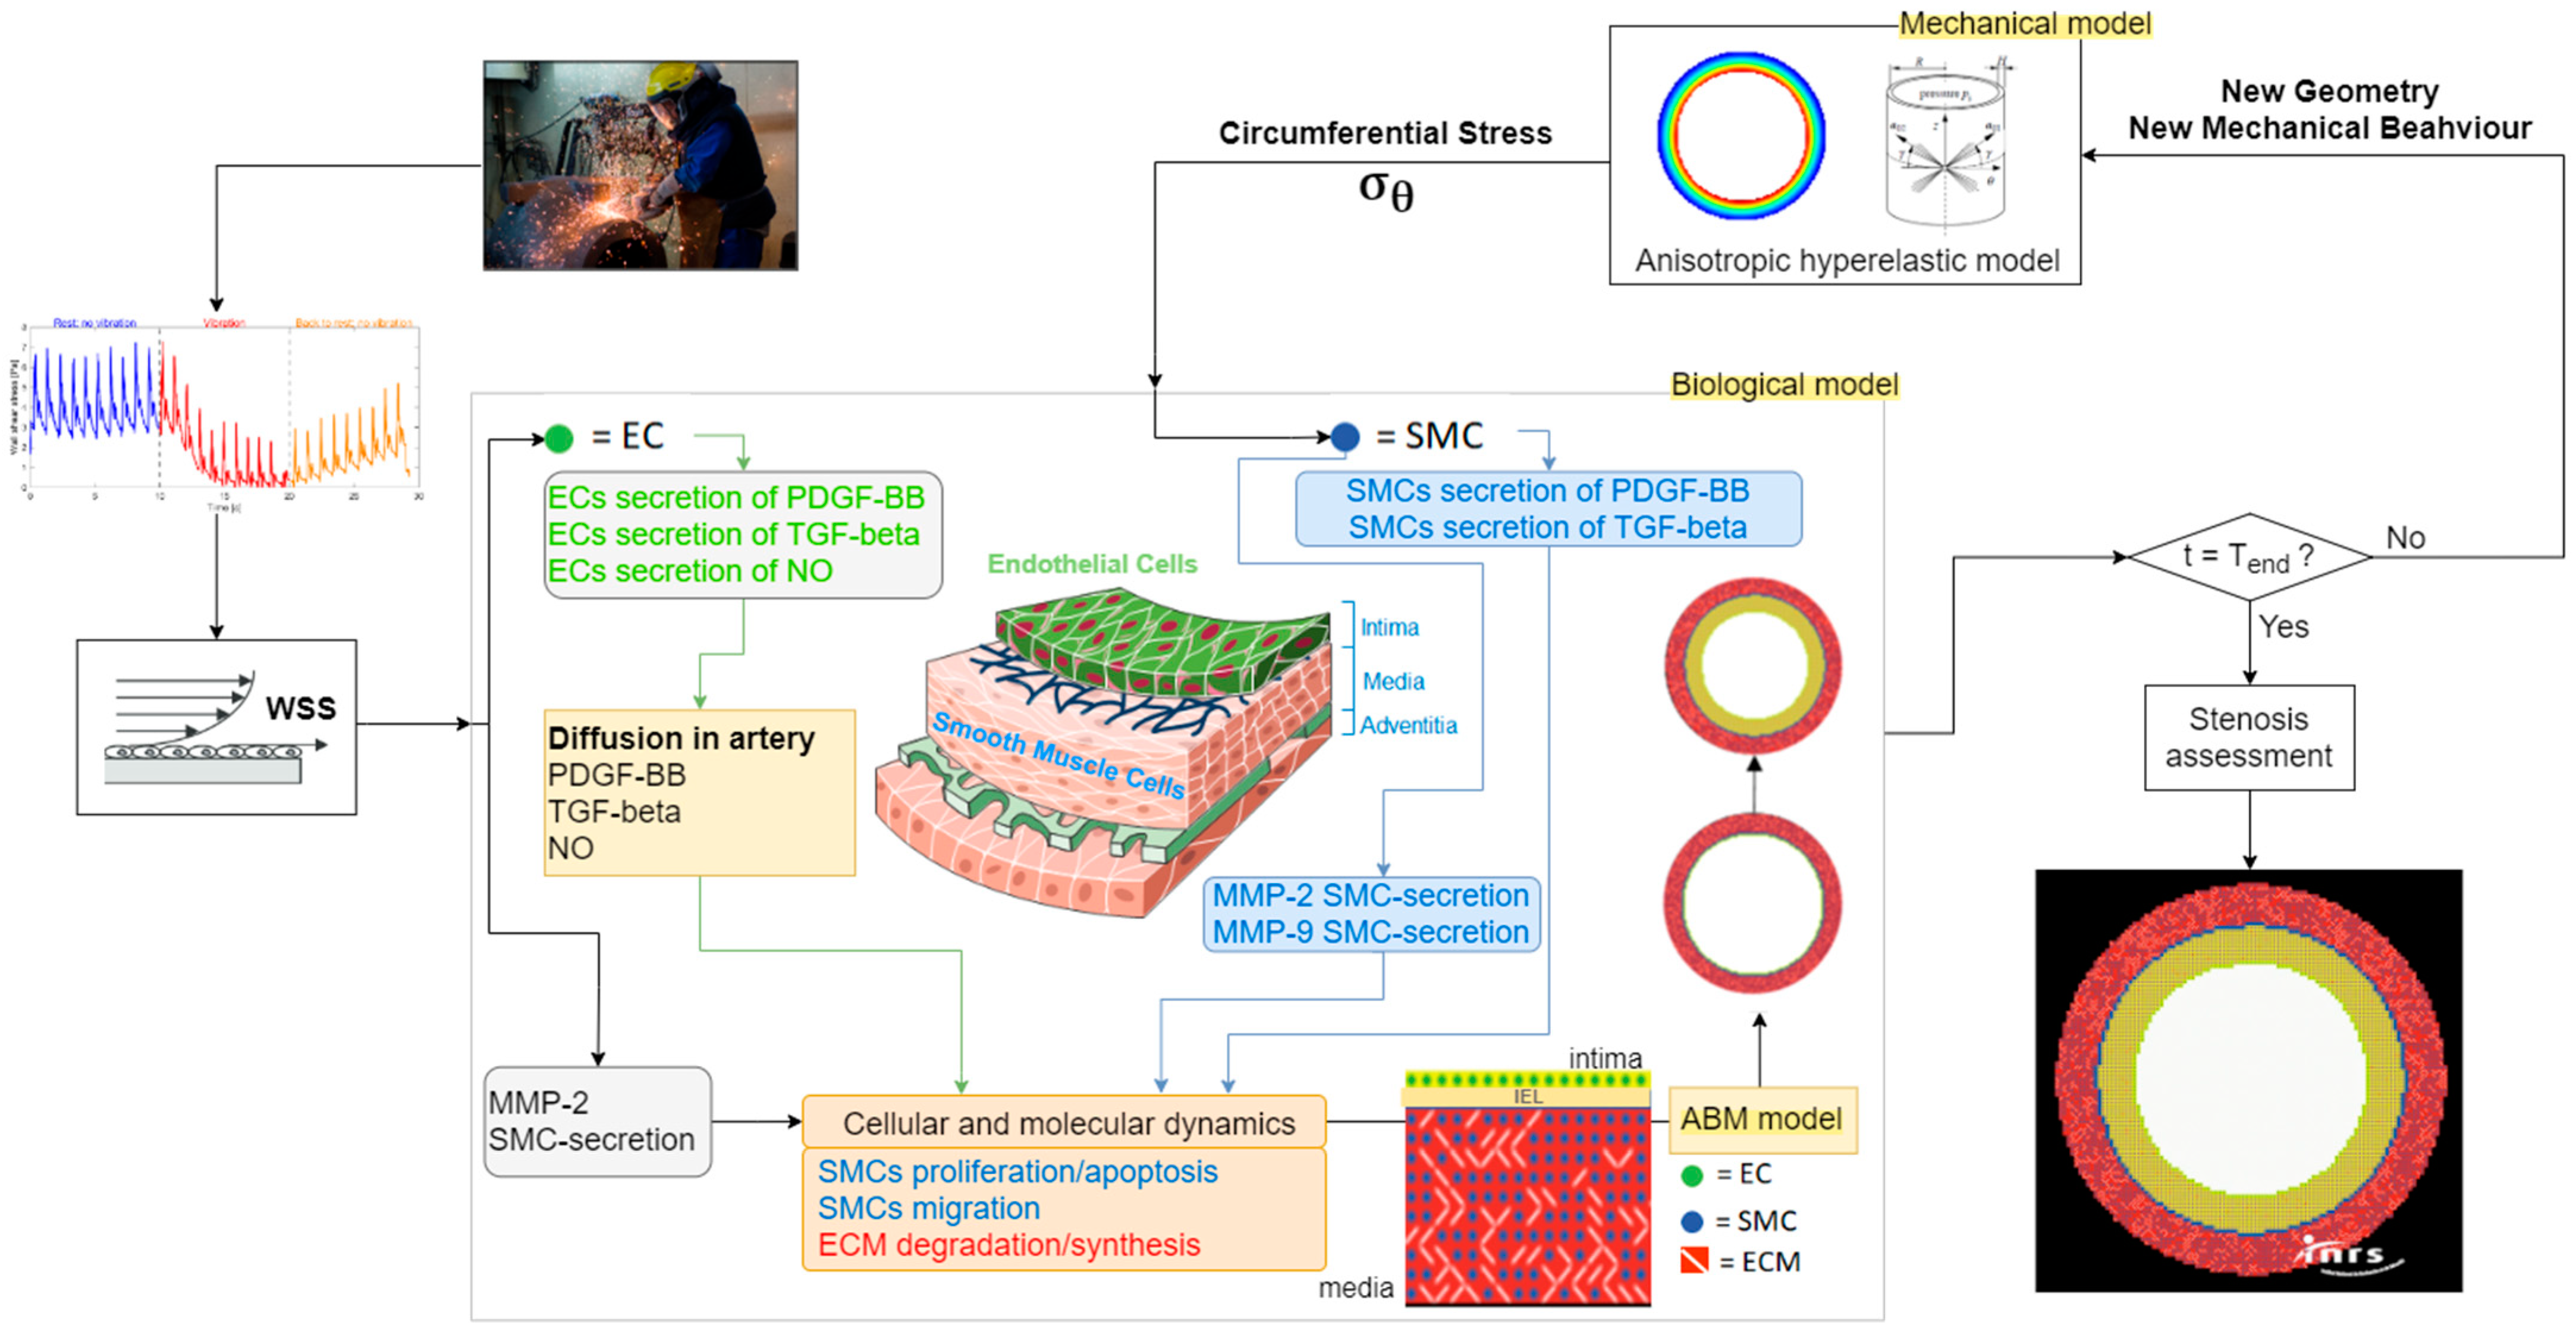
Thus, our model of the development of Raynaud’s vibration syndrome is based on two hypotheses: (i) vibrations can reduce the short-term blood/endothelium WSS in the digital arteries [47] and (ii) this chronic imbalance of vascular hemostasis can bring about arterial stenosis leading to VWF [48]. The final aim in this series of studies is to link the acceleration measured on the vibrating machine to the arterial stenosis caused by the vibrations transmitted to the hand–arm system. This research strategy can be viewed conceptually and schematically by two weakly coupled models: A and B (Figure 2a). The input of Model A is the acceleration emitted by the machine, and its output is the WSS induced by the vibrations. Model A links acutely mechanical vibration at the macroscopic scale (hand–arm scale) to physiological effects at the mesoscopic scale (WSS at the artery level). The vibration-altered WSS stemmed from complex cellular and molecular mechanisms. However, in Model A, we do not study such mechanisms, but we measure one of their physiological consequences at the artery level—vibration-altered WSS.
The input of Model B is the WSS, while its output is the reduction in the arterial lumen (stenosis) after chronic exposure to vibrations. Model B deals with chronic events of vascular biology at the cellular and molecular levels.
Regarding model A (Figure 2b), we propose a methodology for estimating the WSS caused by the vibrations. Thus, we obtain direct access to magnitude Ψ(freq, Ampli), which links the frequencies and amplitudes of the vibrations to the WSS. Model A can also be split into several intermediate steps (Figure 2b). In this study, we present the research studies performed for these two intermediate steps. The first concerns the biodynamic modeling of a hand gripping (without tightening) a vibrating handle (model A0). The second is devoted to modeling the mechanotransduction of Pacinian corpuscles (model A1). A thermomechanical model (model A2) of the temperature increase generated by the vibrations is also presented.
In the case of model B, we hypothesize that the arterial stenosis caused by the vibrations results from a phenomenon of intimal hyperplasia [46]. In this case, the arterial stenosis stems from the growth of the arterial walls caused by the proliferation and migration of the smooth muscle cells of the media to the intima (Figure 2c). Model B consists in modeling certain mechanisms of cell and molecular dynamics responsible for this intimal hyperplasia. This mechanobiological model couples the complex biomechanical behavior of the artery with vascular biological phenomena partially responsible for arterial growth.

2.2. Model A: Thermomechanics and Physiology

2.2.1. Model A0: Finite Element Model of a Hand Gripping a Handle

Two finite element models of the hand were developed (Table 1). Hand Model 1 is composed of 20 bones (the 14 bones of the phalanges, the 5 metacarpals, and 1 bone modeling the 8 carpal bones), the cartilage between the bones, and soft tissue representing the flesh [31]. Hand Model 2 contains the following anatomical elements: the skin, subcutaneous tissue (flesh), the 8 carpal bones, the 5 metacarpal bones, the 14 bones of the phalanges, the flexor and extensor tendons, the ligaments, the ligament tunnels, the cartilage, the joint capsules, the thenar and hypothenar eminences of the palm, the lumbrical and intraosseous muscles, and the fingernails [49]. The boundary conditions and loading of the models are described in Appendix A.

2.2.2. Model A1: Modeling the Mechanotransduction of Pacinian Corpuscles

Pacinian corpuscles are mechanoreceptors sensitive to vibrations at frequencies between 5 Hz and 1000 Hz, with a peak of sensitivity around 250 Hz [50,51] highly dependent on temperature [52,53]. They are composed (Figure 3a) of a lamellar capsule, a neurite (a dendrite), and an axon covered with myelin except at the Ranvier nodes [54,55]. Filopodia are arranged on the dendrite (cytoplasmic outgrowths). These filopodia are mechanical receptors where mechanotransduction takes place, that is to say, the conversion of mechanical stimuli into electrochemical activity. Mechanical vibration propagates from the external lamellae to the filopodia. The capsule, therefore, plays a role of a mechanical filter. The mechanical deformations at the base of the filopodia then generate electrochemical potentials called receptors that form a generating potential at the first Ranvier node. If this reaches a certain threshold, an action potential is generated. This nerve impulse then propagates from the Ranvier nodes along the axon to transmit information to the central nervous system.
We modeled these mechano-electrochemical couplings in four steps (Figure 3b): (i) The field of dynamic deformations calculated with model A0 is used to define a dynamic load on the external lamella of the Pacinian corpuscle. We used the theory of homogenization (multilevel finite element method FE2) to couple the dynamic response at the macroscopic scale of the hand to the more mesoscopic scale of the Pacinian corpuscles; (ii) A thermomechanical model of the Pacinian corpuscle is built. It links the movements of the external lamella of the Pacinian corpuscle to deformations on the filopodia; (iii) the mechanotransduction model of Bell & Holmes [56] is used to simulate a generating potential at the first Ranvier node from the deformations present; (iv) the simulation is completed by a model of nerve impulse conduction along the axiom.

2.2.3. Model A2: Temperature Induced by the Vibrations

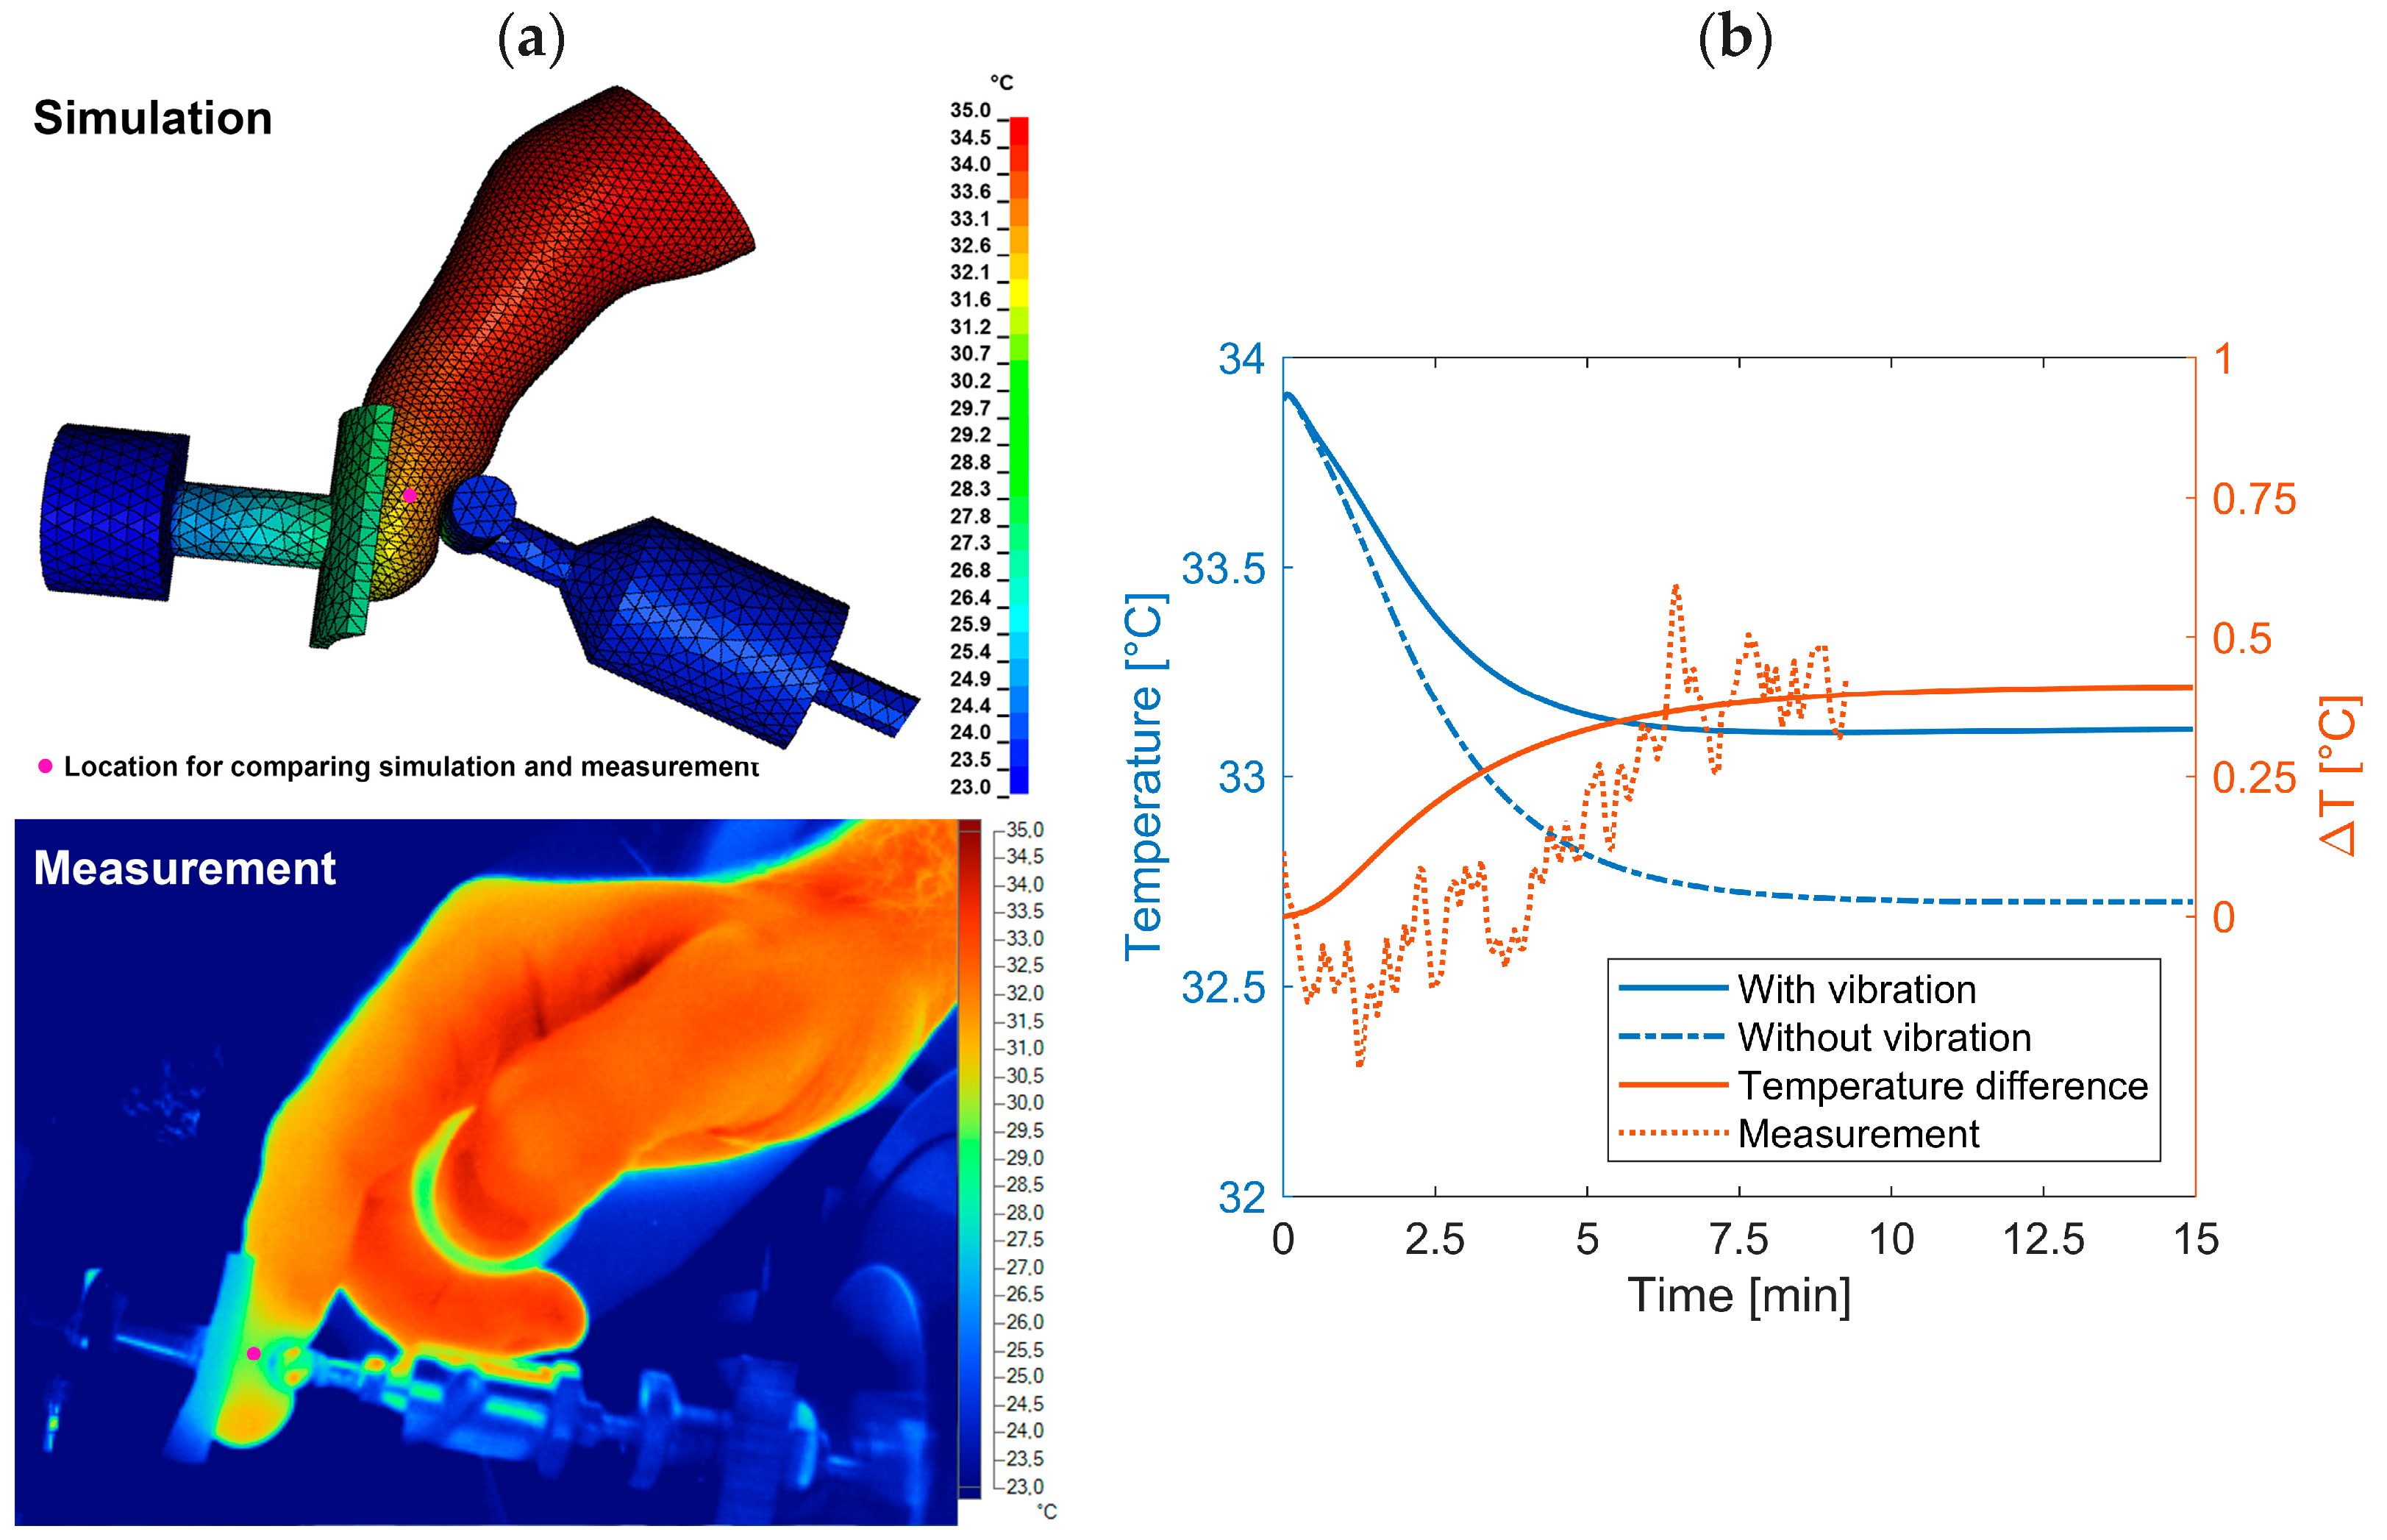
Transfers of heat in biological tissues can be modeled by generalizing the heat equation by adding supplementary terms linked to the heat generated by blood perfusion q p e r f and by the metabolism q m e t [57]. The viscous dissipation of vibration energy can also be taken into account in this generalized heat equation by including the quantity of external heat q e x t corresponding to the volume density of the power dissipated mechanically by the vibrations [58]. A heat model (Figure 4a) was built. The fall of the flow induced by the vibrations leads to a reduction in blood perfusion and of q p e r f . Our model can take this phenomenon into account. Furthermore, it can also simulate the influence of wearing a glove on the temperature field. This model reproduces the following experimental conditions (Figure 4b): a finger enters into contact with steel support, it is then compressed by a cylindrical indenter, and finally subjected to a vibration of 100 Hz at an amplitude of 40 m·s−2 rms (the vibration frequency and magnitude match one common vibration level (nonweighted) emitted by handheld machines in the field) for 20 min. An exposure time of 20 min was chosen to ensure that the finger surface temperature reached thermal equilibrium. The temperature measurements were performed on a volunteer in a climatic room at a constant temperature (23 ± 0.5 °C) following an adaptation time of 20 min. The subject was seated, their forearm resting on a support (Figure 4b), and the temperature was measured with a thermal camera, Fluke Ti400.

2.3. Model A: Effect of Vibrations on Blood/Endothelium Shearing Stress

2.3.1. Protocol

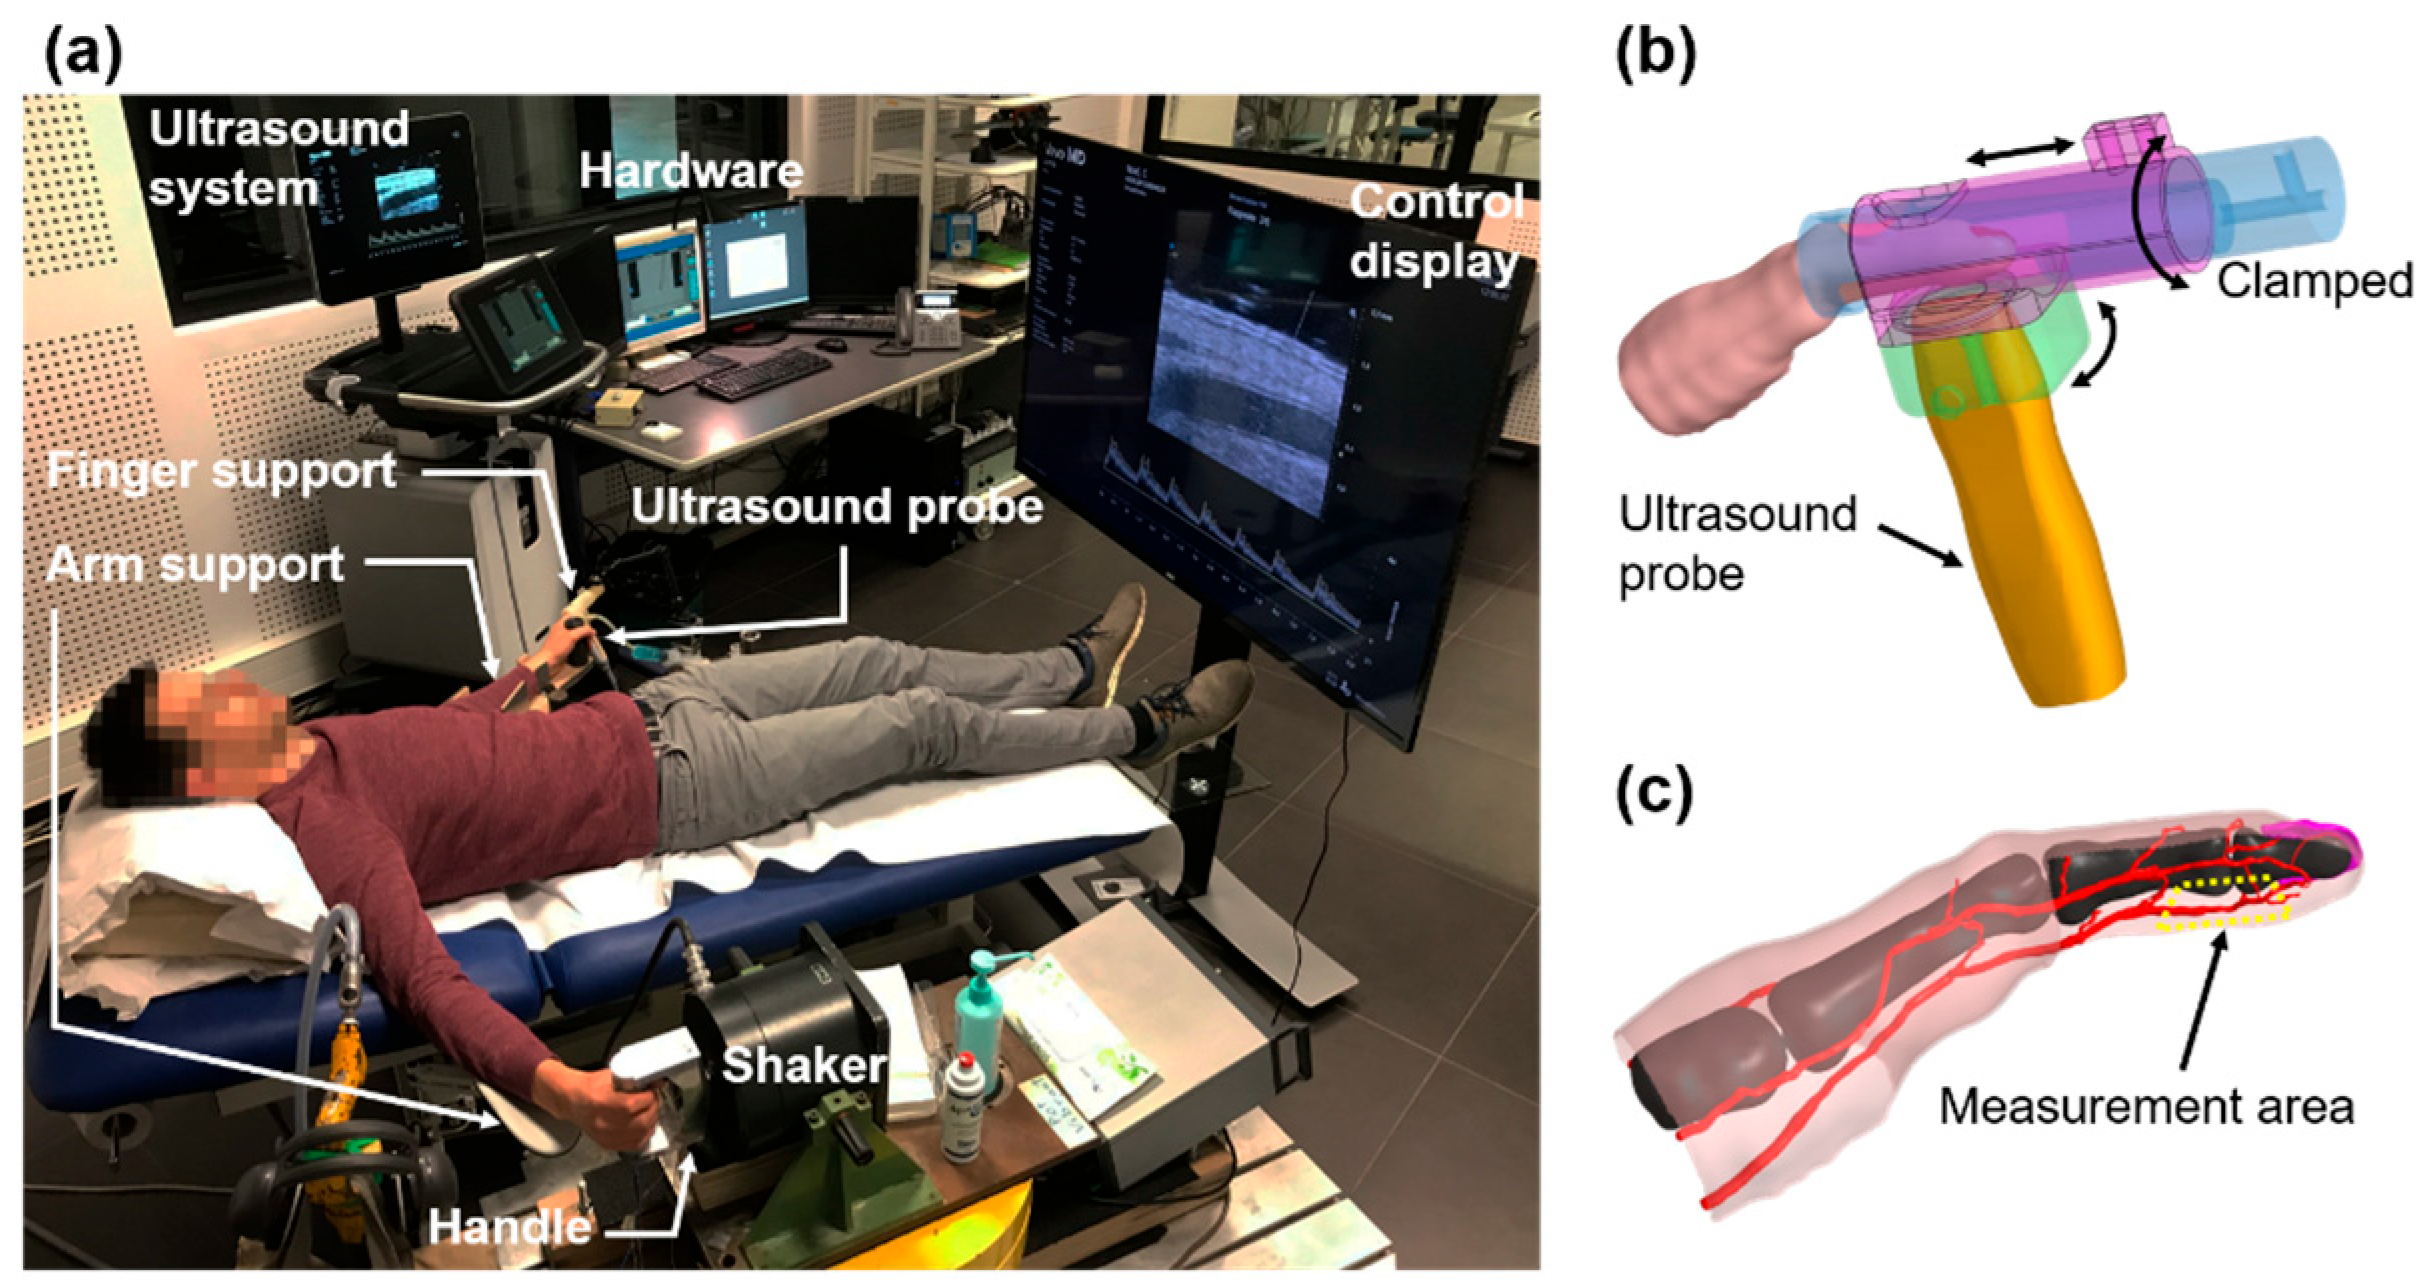
The experimental setup (Figure 5a) used to estimate the WSS comprised an ultrahigh-resolution ultrasound probe (UHF70®, Fujifilm VisualSonics, Toronto, ON, Canada) (central frequency 50 MHz) connected to an ultrasonic imager (Vevo MD®, Fujifilm VisualSonics, Toronto, ON, Canada). A finger and probe support were designed to precisely position the ultrasound probe (Figure 5b). Thus, the probe was oriented in order to image the proper volar digital artery around the inter-phalange joint of the left index finger (Figure 5c). The B-mode images and pulsed Doppler were recorded in DICOM® format [59]. The right hand lightly gripped a handle with a diameter of 40 mm fixed to a shaker whose acceleration was controlled by Matlab® (version R2021a, MathWorks, Natick, MA, USA)
The WSS was calculated using a Womersley mechanical model of pulsatile flows [60,61]. This model requires information on the radius of the artery and the maximum blood velocity. This velocity stems directly from the pulsed Doppler signal, whereas the radius is estimated from image processing developed specially by us for B-mode images of our ultrasound scanner (Supplementary Materials).
Twenty-four volunteers in good health and nonsmokers, aged from 19 to 39 years old (average age 25.1), participated in a WSS measurement campaign in a room at constant temperature (23 ± 0.5 °C). The protocol consisted of estimating the WSS for three consecutive phases of 10 s or 1 min each: (i) rest, (ii) exposure to vibrations, (iii) return to calm. The vibrations were pure harmonic for eight frequencies: 31, 63, 125, 160, 200, 250, 315, and 400 Hz at an amplitude of 40 m·s−2 rms (these vibration frequencies and this magnitude may match raw vibration levels (nonweighted) emitted by handheld machines in the field such as, for instance, sander, grinder, or chisel). For the frequency of 125 Hz (it typically matches the frequency emitted by rotary machines likely to be responsible for the onset of VWF), six amplitudes were tested: 1, 2, 5, 10, 20, and 40 m·s−2 rms. The data were processed by repeated measures ANOVA (10 s measure) and by Morlet wavelet analyses (1 min measure) [62,63,64].

2.3.2. Validation of the Womersley Model

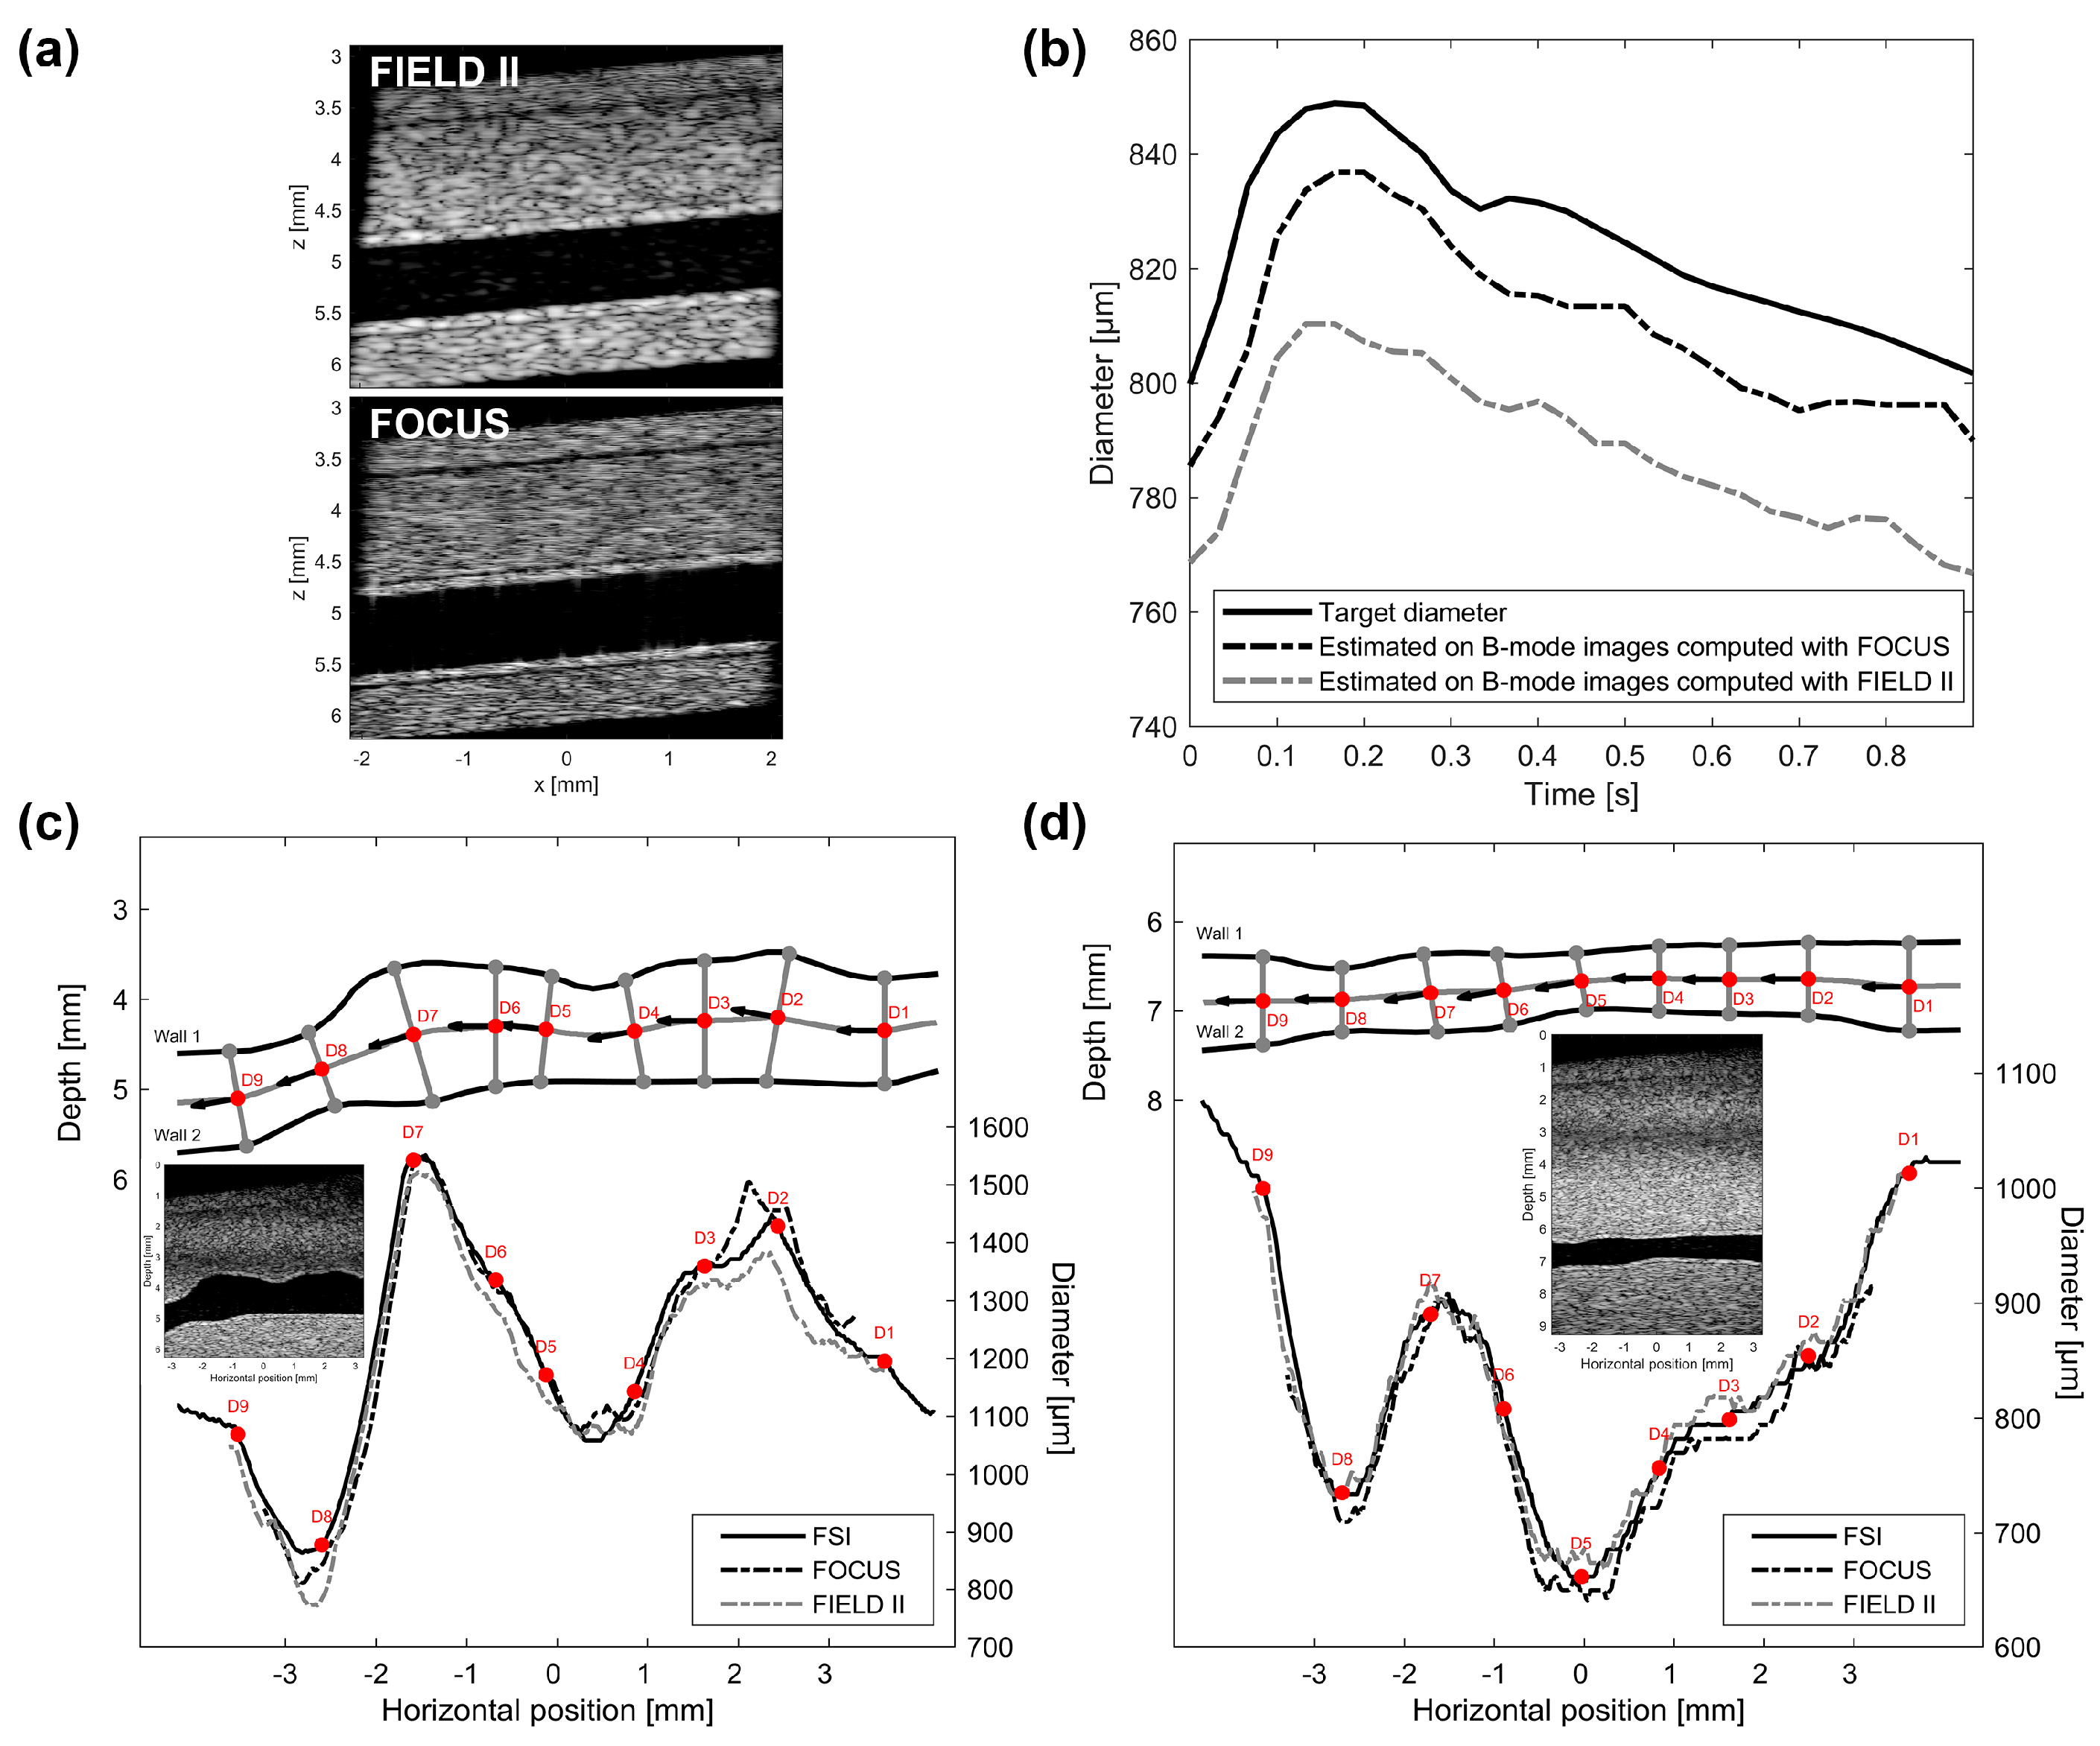
A numerical phantom of a cylindrical artery (Figure 6a) was implemented in Matlab® (version R2021a, MathWorks, Natick, MA, USA) using Field II, and Focus routines [65,66,67] were adapted to simulate the ultrasonic response of our ultrasound measurement probe [68,69]. The parameters of our diameter estimation algorithm were optimized on B-mode cineloops simulated using the acoustic propagation of diffusers mimicking a cylindrical artery (Figure 6a) with known diameter. This algorithm was then tested on phantoms of real arteries (Figure 6b) for two different cross sections corresponding to two slices imaged by the probe (these two representative slices were computed from the intersection of selected probe planes and the 3D geometry of the artery described below). The geometry of the artery and the surrounding tissues were obtained by segmentation of the MRI images obtained with a high spatial resolution 7-Tesla scanner (Magnetom Terra®, Siemens Healthineers, Siemens Healthcare GmbH, Erlangen, Germany) (Figure 7a).
The reference WSS was calculated from a model of fluid–structure interaction of the proper volar digital artery taking into account the surrounding tissue (Figure 7a). The physiological boundary conditions (Figure 7b) are: (i) at the artery inlet, a uniform pressure obtained from a database [70], and (ii) at the outlet, a pulsed blood velocity with a Poiseuille spatial profile. This velocity was measured with our ultrasound probe on a volunteer. The details of this model are available in our previous works [68]. The WSS calculated from the Womersley hypotheses was then compared to the reference WSS obtained from the fluid–structure interaction model.

2.4. Model B: Model of Arterial Stenosis Induced by Vibrations

The WSS plays an important role in arterial growth and remodeling (modification of the anisotropy of mechanical behavior) [71,72]. Indeed, these stresses partially regulate the vascular biology of the endothelial cells. More precisely, low shear stress can favor secretion by the endothelial cells (EC) of several mitogenic and chemotactic agents [73,74] such as Platelet-Derived Growth Factors—PDGF (PDGF is a growth factor that regulates cells growth and division). These agents can diffuse in the artery and regulate the proliferation and migration of smooth muscle cells (SMCs) and the dynamics of the extracellular matrix (ECM) composed of collagen and elastin in our model. A process of intimal hyperplasia can occur, leading to geometrical and structural changes of the intima and the media of the artery. The mechanical stresses inside the layers of the artery are then liable to undergo modification. These variations of stresses can, in turn, potentially influence the cellular and molecular dynamics of the artery’s components [75,76].
To simulate this process, we have built a mechano-biological model. It couples a model of vascular biology describing intimal hyperplasia with an anisotropic hyper-elastic mechanical model of the artery (Figure 8).
The input data are the WSS identified in Section 2.3. The WSS disturbs the basal productions by the EC of PDGF-BB (a type of PDGF), Transforming Growth Factor ((TGF-β), another growth factor), and nitric oxide (NO). The diffusion equation is then implemented to know the quantity of material of these three factors in the artery. This quantity of material and that of MMP-2 (Matrix MetalloProteinase 2) then affect the proliferation, apoptosis, and migration ofSMCs, and the degradation and synthesis of the ECM. MMP-2 is an enzyme involved in the breakdown of the ECM by catalyzing the cleavage of ECM proteins. The dynamics of the SMCs and ECM are modeled using a network agent method. These methods are particularly well-adapted tools for simulating the biological behaviors of vascular diseases [77,78,79]. A finite element calculation is performed on the new geometry of the artery by possibly taking into account its new components (number of SMCs, and quantity of ECM). The artery obeys an anisotropic hyperelastic behavior law HGO (Holzapfel–Gasser–Ogden) [80]. The mechanical stresses are calculated and reintroduced in the biological model since they regulate the PDGF-BB, TGF-β, and matrix metalloproteinase (MMP-2 and MMP-9). More details will be available soon in ongoing publications [81,82].

3. Results

3.1. Hand Vibration

The Driving Point Mechanical Impedance (DPMI) in direction zh, calculated for the two models, Hand Model 1 and Hand Model 2 (Figure 9), is close to the normalized DPMI of the hand–arm system [83]. The normalized DPMI characterizes the vibratory response of an average subject. Model 2, which is more detailed anatomically, shows three local maxima in the mechanical impedance at frequencies 28, 194, and 265 Hz.

3.2. Pacinian Corpuscles

Our mechano-electrochemical model of Pacinian corpuscles is compared (Figure 10a) to experimental data [53].
For each frequency of vibration excitation, we seek the minimum amplitude of harmonic displacement of the external layer of the Pacinian corpuscle that leads to a single nerve impulse during a time equal to the period of the vibration. The harmonic deformations of Hand Model 2 around a Pacinian corpuscle are injected into the finite element model of this Pacinian corpuscle by using the macroscopic and microscopic scale coupling methodology based on the FE2 method. The first main deformation (Figure 10b) is greater for the filopodium of the axon than for the bulb. These deformations reach a maximum around 40 Hz and a local maximum at 250 Hz.

3.3. Heat

The temperature fields were measured on the surface of the finger and simulated with and without vibration (Figure 11a). A measurement point (pink ellipse in Figure 11a) was selected to plot the temperatures as a function of time (Figure 11b). The increase in temperature generated by the vibrations was about 0.5 °C for both the simulation and the measure on the surface of the skin at this point.

3.4. Short-Term Physiological Effect

The reduction in WSS caused by the vibrations occurred a few seconds (2 s on average on the cohort) after starting the vibratory excitation (Figure 12a). After stopping the vibration, the WSS immediately began to increase but without reaching its basal level at the end of 10 s of measurement (Figure 12a).
From the statistical standpoint, the data were analyzed on the WSS averaged in each of the analysis time windows of 10 s. This magnitude is called Time-Averaged WSS and denoted TAWSS. The vibrations (at an amplitude set at 40 m·s−2) led to a statistically significant reduction in the TAWSS, whatever the frequency of the vibratory excitation (Figure 12b). The TAWSS fell from about 3 Pa to 1.2 Pa. This decrease was the same for the eight frequencies tested. The TAWSS normalized in relation to the basal state depended on the amplitude of the vibration (frequency set at 125 Hz) in a statistically significant way (p-value < 0.05). This normalized TAWSS obeyed a log2 linear regression law of the amplitude of the vibration possibly corrected by the age and mass of the forearm of the vibrated subject. The effect of the vibrations for exposures longer than one minute will be analyzed in an ongoing publication.
Our diameter calculation algorithm was used on the numerical cineloops of the cylindrical artery (Figure 13a). The error between the calculated diameter and the target diameter was 2% for Focus and 4% for Field II (Figure 13b). In the case of the real artery, the diameter estimation errors varied between 4% and 2% (Figure 13b–d).
The WSS computed with the Womersley hypothesis tended to underestimate the reference WSS, except in cutting path P9 (Figure 14). The mean error between the Womersley WSS and that of the fluid–structure model was 12%.

3.5. Long-Term Arterial Stenosis

The mechano-biological model was applied for an exposure of 4 h a day for 10 years to vibrations of an amplitude of 40 m·s−2. Thus, the arterial growth model was supplied by a WSS of 1.2 Pa (cf. previous section). All the magnitudes presented are normalized in comparison to the basal state. They are therefore equal to unity at the starting time.
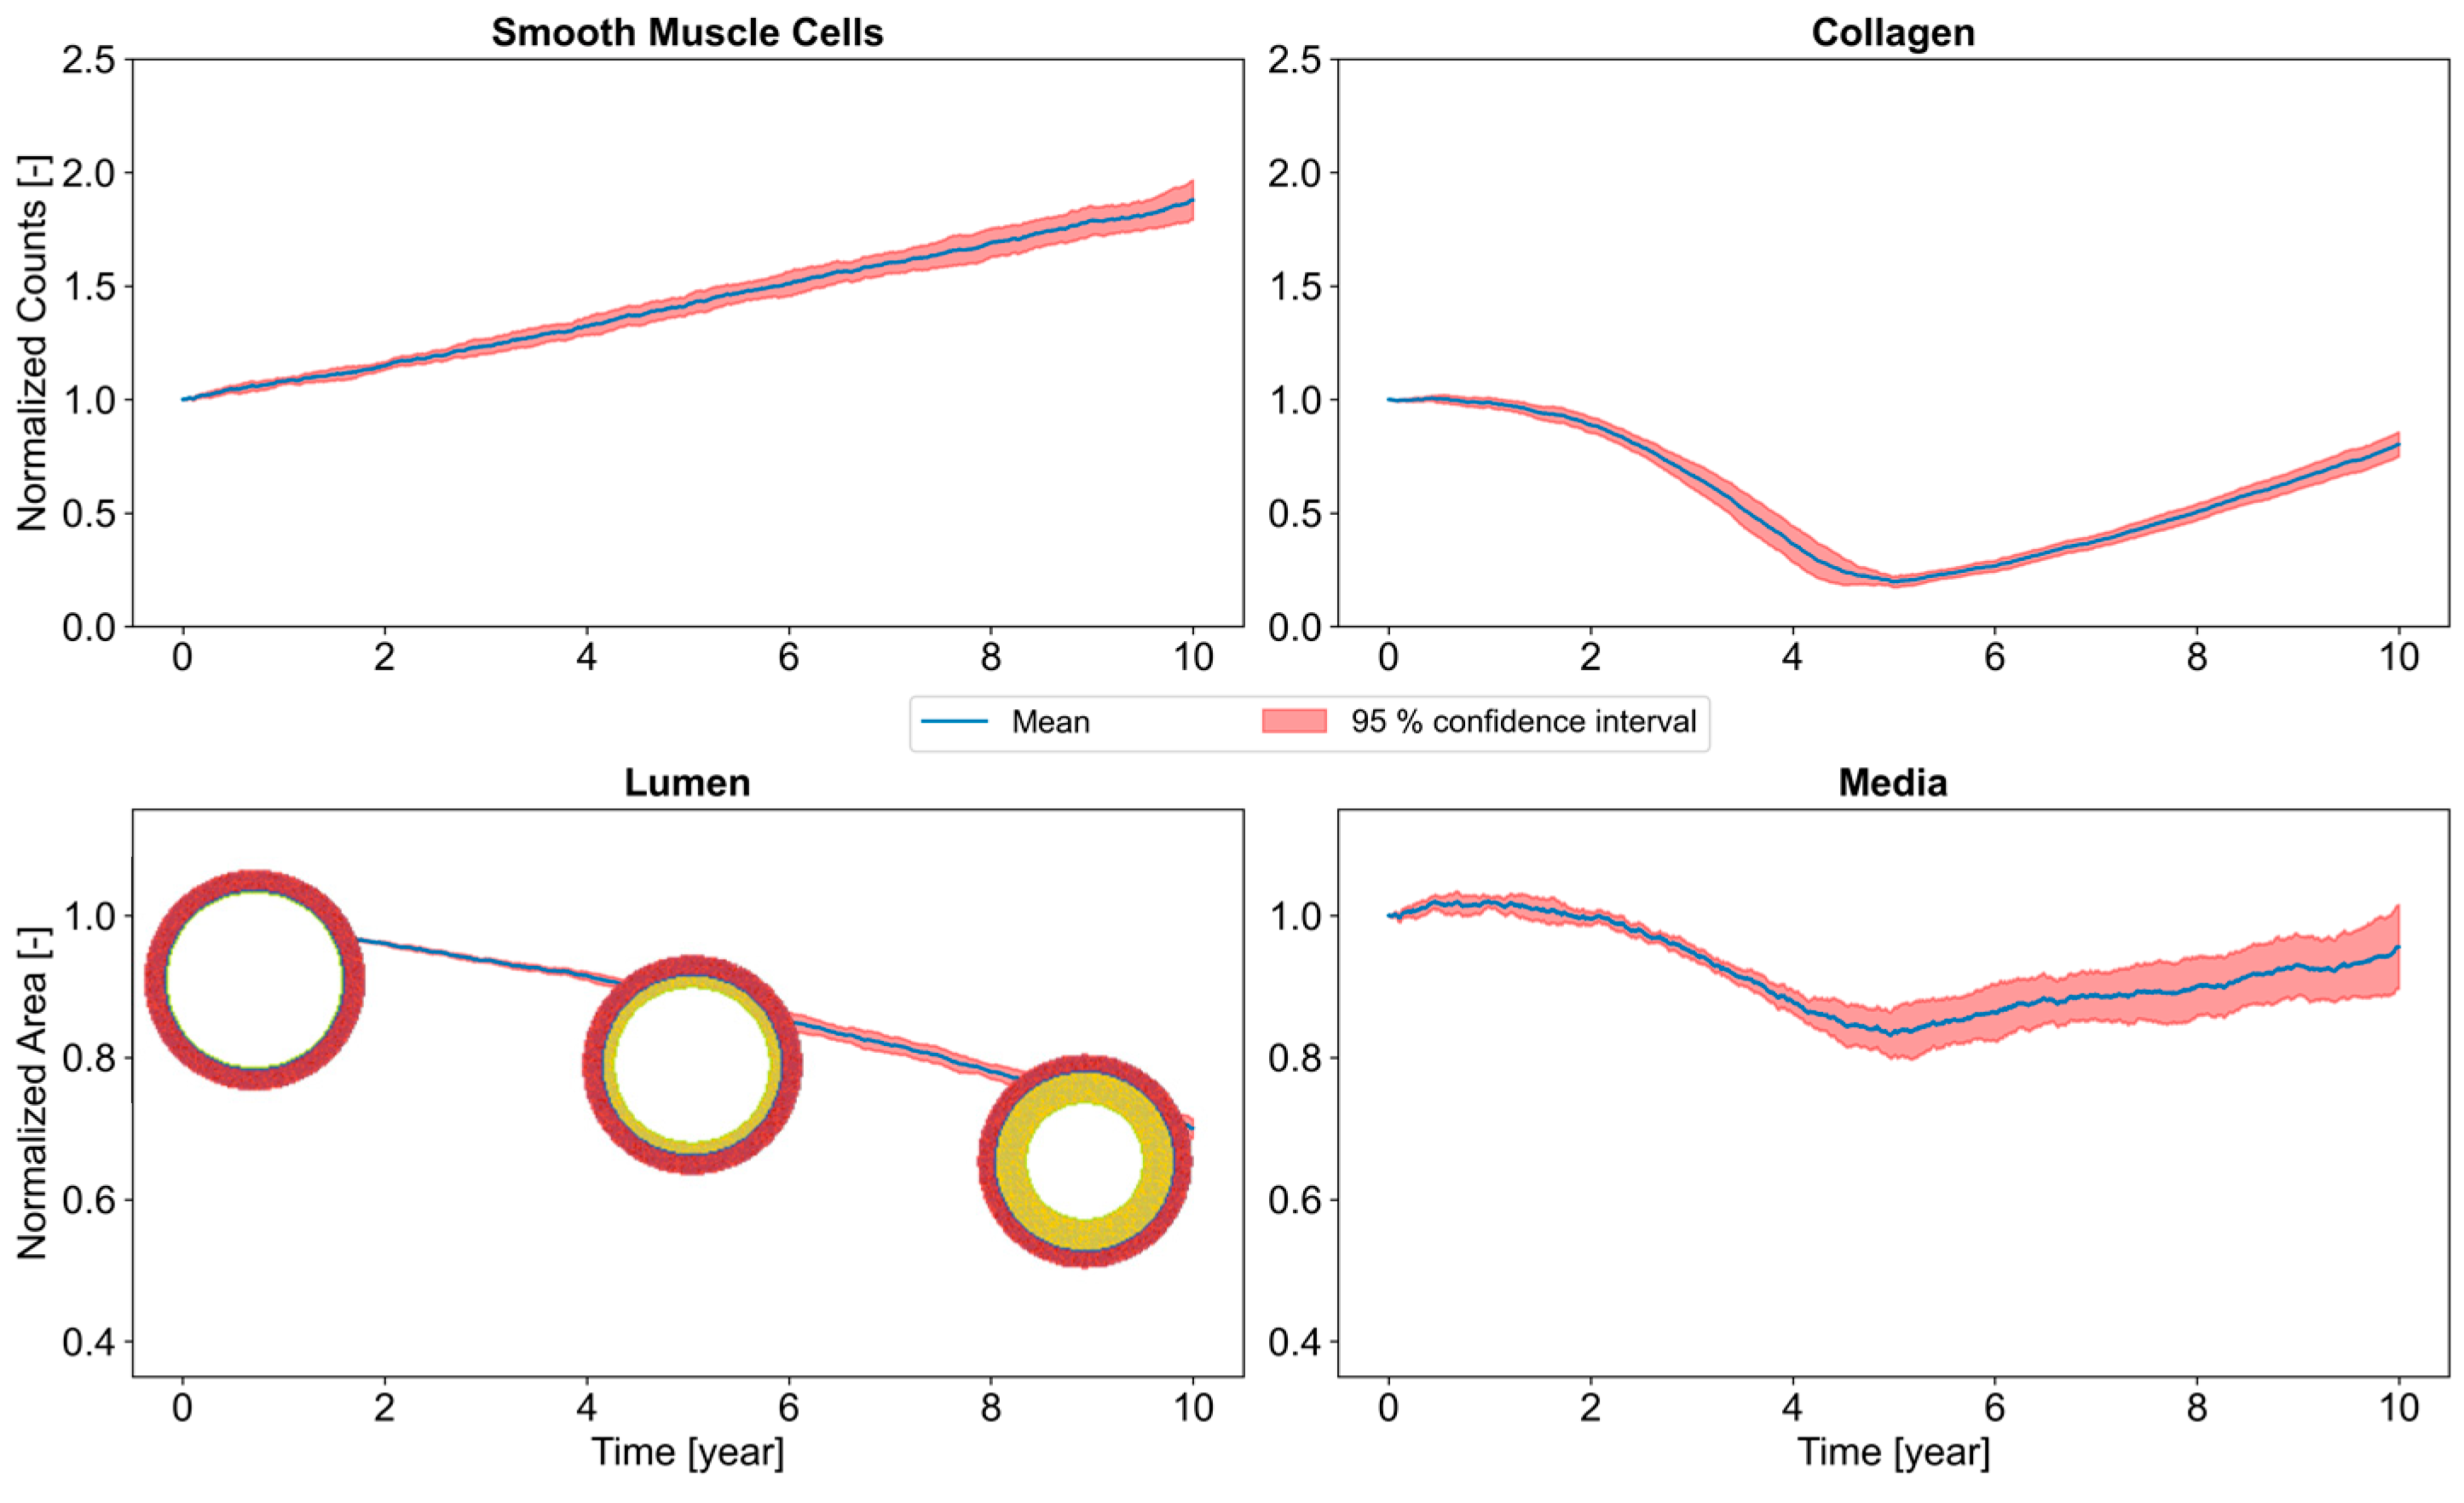
The number of Smooth Muscle Cells (SMCs) almost doubled at the end of 10 years (Figure 15). The total quantity (in the media and intima) of collagen decreased until five years of exposure then increased without reaching the basal value. The surface of the arterial lumen, which describes the degree of stenosis, continually decreased with exposure time. The reduction in this surface was 12% at 5 years and 30% at 10 years exposure. The surface of the media followed the same behavior as that of the quantity of collagen.
The mass of MMP-2 (Figure 16) accumulates continuously and considerably with exposure time, changing from the absence of MMP-2 initially to 500 femtograms (fg) at the end of 10 years. A change in the accumulation kinetics was observed at the end of 5 years’ exposure when the mass of MMP-2 increased more rapidly. TGF-β also accumulated as a function of exposure time, along with a change of kinetics at 5 years, but the increase in mass was more moderate (15 fg at initial state and about 22 fg at 10 years).

4. Discussion

The goal of this study was to define and deploy a research strategy aimed at identifying a more realistic vibration dose regarding its pathological consequences, especially against VWF. The strategy implemented for this purpose was split into two steps: (i) quantifying the short-term effect of vibrations on the reduction in blood/endothelium WSS and (ii) predicting chronic stenosis caused by these modifications of arterial hemodynamics since this stenosis is typical of VWF. The first step was itself split into two synergetic items: a finite element model of the thermomechanical response of a vibrated hand, and a model of the mechano-electrochemical response of Pacinian corpuscles. In the first step, we also directly quantified the relationship between the frequencies/amplitudes of the vibrations and the resulting reduction in WSS. We developed a mechano-biological model to predict the chronic arterial stenosis caused by these acute but repeated changes in arterial hemodynamics. This model coupled the anisotropic hyperelastic behavior of the artery with certain intimal hyperplasia mechanisms responsible for arterial growth.

4.1. Thermomechanical Modeling

4.1.1. Hand Modeling

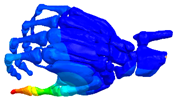
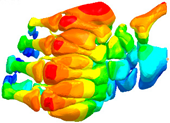
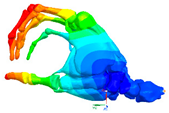
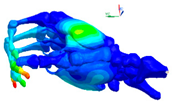
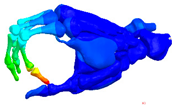
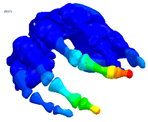
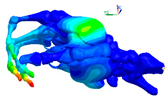
Two finite element models were developed for the response of a vibrated hand. They were compared (Figure 9) with the normalized impedance of the hand–arm system [83] in module (Figure 9) and phase (Figure A2). The two models were capable of reproducing the dynamic behavior (characterized here by the mechanical impedance) of an average subject. The phase of the simulated impedance also conformed to that of the normalized impedance. Thus, the viscous dissipation behavior laws of our models are likely well adapted for simulating the real dissipation of vibration energy. Hand Model 2 provided a finer analysis than Hand Model 1 since it took into account a larger number of additional anatomical elements. Hand Model 2 showed a high value of mechanical impedance at 28 Hz (the higher the mechanical impedance, the greater the force required to move the structure). A modal analysis (Table A1) showed a proper abduction/adduction mode of the wrist at this frequency. Abduction of the wrist means a radial deviation of the wrist, i.e., a movement towards the thumb. Whereas adduction of the wrist means an ulnar deviation of the wrist, i.e., a movement towards the little finger. Furthermore, the mechanical impedance showed a change of phase of 180° at this frequency (Figure A2), which therefore corroborates the presence of this mode in the harmonic response. The eigenmode (vibratory mode characterizing an oscillating system) of the wrist around 28 Hz was also measured or simulated in other studies [84,85]. Our modal analysis of Hand Model 2 highlighted the presence of solid poly-articulated modes of the torso, shoulder, and elbow between 1 Hz and 14 Hz. These frequencies of eigenmodes are consistent with those found in the literature [86,87]. Furthermore, in line with other works [88,89,90], we found eigenmodes of the fingers starting from 82 Hz for the thumb and 105 Hz for the other fingers. The anatomical details of our model permitted extracting information hitherto difficult to obtain. For example, an abduction/adduction mode of the metacarpals was observed for the first time around 54 Hz. Regarding the proper modes of the fingers, they ranged from 82 Hz to 259 Hz with, first of all, the modes of the proximal phalanges, then the medial ones, and, lastly, the coupled modes of the distal phalanges and the thenar and hypothenar eminence muscles. The modes of muscles without bony modes appeared preferentially above 259 Hz. The mode of the thenar eminence at 320 Hz is a characteristic example. We found the influence of this type of mode at frequencies 194 Hz and 265 Hz in the mechanical impedance (Figure 9) of Hand Model 2, for which the acceleration fields showed high levels of vibration for the distal phalanges and for the muscles. The muscles of the hand and particularly those of the thenar and hypothenar eminences, seemed to play an important role in the dynamic response of the hand to high frequencies. This is undoubtedly a new observation that, to our knowledge, has not been reported in the literature.
Although our model provides original information, there are paths of improvement. Indeed, this model does not take into account certain parameters such as gripping efforts or the active behavior of the muscles. These parameters may influence the dynamic behavior of the hand [91,92] and will be the subject of a new study.

4.1.2. Pacinian Modeling

The mechano-electrochemical model of the response of the Pacinian corpuscles is today validated with respect to the experiments reported in the literature [53]. These measurements consisted in measuring the nerve impulses of a Pacinian corpuscle when a movement was imposed on its external lamella. In this validation, the mechanical component was a simplified model of transfer function type between the displacement on the external surface of the Pacinian corpuscle and the deformation on the filopodia. The finite element model of the Pacinian corpuscle was validated in comparison to another semi-analytical model [93,94]. The localization method for changing from the macroscopic to the mesoscopic scale was verified on test cases [95]. To date, our model has not been fully validated due to a lack of data in the literature. Such validation would require defining a specific experimental protocol and measuring the nerve impulses directly on a subject [37,96,97,98] and no longer on a Pacinian corpuscle ex vivo. Furthermore, Bell and Holmes’ electrochemical model of nerve impulse generation could be improved by other approaches implementing complex neuronal behaviors [99].

4.1.3. Temperature Modeling

Our simulations of the temperature field generated by vibrations showed a moderate increase (0.5 °C) on the skin of the finger; it was higher inside the finger. For example, this increase was about 2 °C at the position of the maximum dissipated mechanical energy. These temperature variations could have an influence on the physiopathological mechanisms caused by the vibrations. Indeed, as all cells and organisms, the cells and different factors involved in the intimal hyperplasia process respond to supraoptimal (positive variance in comparison to the optimal physiological functioning temperature) or suboptimal (negative variance in comparison to the optimal physiological functioning temperature) temperatures via specific pathways as a function of the severity of the thermal stress imposed [100]. Thus, the local temperature generated by mechanical dissipation could potentially act on the physiopathological factors already mobilized by the vibrations. For example, at the cellular level, (even slight) changes of temperature influence cell activity, cell growth rate, macromolecular synthesis, cellular cycle (mitosis, apoptosis), etc. [101,102]. Temperature also has a considerable impact on enzymatic activity (MMP are enzymes) [103] and Pacinian corpuscles [52].

4.2. Acute Exposure

Regarding the digital arteries, the Womersley method underestimated the WSS by about 12% in comparison with that calculated from the hemodynamic model of an artery taking into account fluid–structure interactions. The gap between the Womersley method and the full fluid–structure interaction model was about 30% for the carotid artery [104], whereas it was only 12% and even 3% for the ulnar and radial arteries, respectively [66].
The WSS measured for the basal conditions without vibration was, on average, 3 Pa for the cohort. To our knowledge, there are no similar data in the literature specific to fingers. Nonetheless, this value is of the same magnitude as that measured on other sites of the arterial tree (brachial and femoral arteries, for example) [105,106,107]. Furthermore, this value of 3 Pa corresponds to that predicted by the WSS/diameter calculation chart established in [106], which predicted a value close to 3 Pa for an artery with a diameter of 1 mm (the average of our cohort was 0.8 mm). Regarding the vibration-altered WSS, to our knowledge, no other data are available in the literature with which our results can be compared. However, other studies have focused on a similar quantity, the blood flow reduction caused by the vibrations. This blood flow was measured by plethysmography. For example, one study [108] reported a 50% decrease in blood flow during acute exposure to vibrations of an amplitude of 40 m·s−2 at 125 Hz. Our study concludes a 60% reduction in WSS due to vibrations. What is more, we showed that the reduction in WSS was the same whatever the excitation frequency of the vibrations. This behavior was also observed for blood flow [40].
Regarding the effect of vibratory level, we showed that the relative reduction in WSS was proportional to the base-2 logarithm of the amplitude of the vibration at a given frequency of 125 Hz. We were able to plot the magenta curve in Figure 12c based on data on the subjective rating of vibration sensation as a function of vibration amplitude at 125 Hz [109] and by assuming that the decrease in WSS is proportional to this vibration sensation. This curve corresponds to the following hypothesis: the reduction in WSS is directly proportional to the vibration felt. Our measures showed that this hypothesis was not verified. Indeed, the law of vibration sensation is Steven’s type law (the sensation is the power of the vibration level), whereas our results highlighted a logarithmic relationship between the reduction in WSS and the amplitude.
Our WSS measures were performed for short vibration periods (10 s or 1 min). An additional study could be carried out to quantify the effect of vibrations for longer periods. However, such a campaign would be very complicated to perform in practice because of the difficulty for subjects to maintain a stable position for long periods. Furthermore, it should be noted that the WSS was measured only on the hand not exposed to vibrations; therefore, the variations of WSS on the exposed hand were not taken into account. In the field, when a worker is using a machine, the vibration-altered WSS might arise from both the direct disturbance of vibration on the digital arteries (we did not measure yet) and the indirect response of the central nervous system (we measured it). We scheduled other studies for measuring and modeling the alteration of the hemodynamic in the digital arteries when directly exited by vibrations. In this case, we would still be able to take into account in our chronic biological model both the direct disturbance of vibration on the digital arteries and the indirect response of the central nervous system. Indeed, our chronic stenosis model may be fed by any WSS values, whether they stem from direct, indirect, or both responses to vibrations.

4.3. Long-Term Exposure

The mechano-biological model was implemented for a specific case corresponding to chronic exposure to vibrations of an amplitude of 40 m·s−2 (WSS of 1.2 Pa) for 10 years (Figure 15 and Figure 16). The degree of arterial stenosis can be defined as the reduction in the arterial lumen. Thus, in the case presented, the degree of stenosis ranged from 12% at 5 years and 30% at 10 years exposure. The clinical diagnostic of VWF can be established either in a basic way (questionnaire, cold test, neurological examination, etc.) or by utilizing more specialized examinations such as angiography [110]. Honma et al. [111] proposed a classification of vascular injury by angiography: (i) type 0: healthy; (ii) disease type I: stenosis < 50%; (iii) disease type II: stenosis > 50%; (iv) disease type III: obstruction of the proper digital artery; (v) disease type IV: obstruction of the common artery or upstream. Thus, according to this classification, our model would lead to stenosis of type I for exposure to vibrations of 4 h a day for 10 years.
The reduction in collagen and the surface of the media up to five years of exposure can be explained by the action of MMP-2 that destroys the extracellular matrix to permit the migration of smooth muscle cells. From five years onwards, the collagen increases in the intima due to the considerable presence of smooth muscle cells that have migrated from the media to the intima; these cells produce more collagen when they are in the intima. The surface of the media increases after five years since the proliferation of smooth muscle cells exceeds those that migrate, so more cells remain in the media. These simulation results faithfully reproduce the mechanisms expected of intimal hyperplasia [112].
Furthermore, MMP-2 accumulates substantially in the artery (Figure 16). This enzyme could be a particularly interesting candidate biomarker for warning about and monitoring the evolution of VWF. Several studies have shown its interest in other vascular diseases [113,114] and its possible dosing in the blood [115].
Each of the biological mechanisms of our mechano-biological model has been validated by experiments at the cellular or molecular level taken from the literature or specifically implemented in the case of missing data. This model must now be validated experimentally on arteries ex vivo. Works in this direction have begun (CHARL test-bench: Hemodynamic characterization of arteries by laser now available at INRS). Furthermore, in our model, the mathematical relationships linking the WSS and the different factors involved in arterial growth remain identical during the living cycle of the artery. In reality, the release of the different factors involved in the intimal hyperplasia should be altered when arterial stenosis occurs. This is a serious limitation of our model.

5. Conclusions

To sum up, this study showed that:
  • Vibrations significantly decrease blood/endothelium shearing stresses. This WSS is reduced by a factor of three for vibration of 40 m·s−2;
  • The frequency of the vibrations does not influence this reduction. Thus, we propose to enlarge the current vascular filter [25] to the range [31–400 Hz]. This filter would have a weighting of 1 in this spectral range;
  • The decrease in WSS is proportional to the logarithm of the amplitude of the vibration. It is possible to calculate the WSS caused by the vibrations by measuring the acceleration on the machine;
  • Knowledge of the daily exposure (the model can take into account all types of exposure cycles) and the WSS (or similarly, the acceleration on the machine), the mechano-biological model permits calculating the degree of stenosis and therefore that of the disease for chronic exposure to vibrations. It is a new definition of vibratory dose;
  • A candidate early biomarker acting as a precursor of VWF is proposed—MMP-2.
Calculation charts of the degree of stenosis will be established as a function of the duration of daily and chronic exposure. Thus, we will be able to deduce the daily duration/chronic duration pairs that lead to a given level of stenosis and thus prevent the development of VWF.

Supplementary Materials

The following are available online at https://www.mdpi.com/article/10.3390/vibration5020014/s1, Workflow for the arterial diameter computation and maximum blood velocity extraction. References [116,117,118,119,120,121,122,123,124,125] are cited in the supplementary materials.

Author Contributions

Conceptualization, C.N. (all sections), N.S. (Section 2.3), M.R. (Section 2.4), and E.J. (Section 2.4); methodology, C.N. (all sections), N.S. (Section 2.3), M.R. (Section 2.4), and E.J. (Section 2.4); software, C.N. (all sections) and M.R. (Section 3.5); validation, C.N. (all sections), N.S. (Section 3.4), and E.J. (Section 3.5); formal analysis, C.N. (all sections), N.S. (Section 3.4), M.R. (Section 3.5), and E.J. (Section 3.5); investigation, C.N.; resources, C.N.; data curation, C.N.; writing—original draft preparation, C.N.; writing—review and editing, C.N. and M.R. (Section 2.4 and Section 3.5); visualization, C.N.; supervision, C.N. (all sections), N.S. (Section 2.3 and Section 3.4), and E.J. (Section 2.4 and Section 3.5); project administration, C.N. All authors have read and agreed to the published version of the manuscript.

Funding

This research received no external funding.

Institutional Review Board Statement

The study was conducted according to the guidelines of the Declaration of Helsinki and approved by the Institutional Review Board of the French National Agency for Medicines and Health Products (No. ID-RCB: 2018-A00614-651, 6 December 2018) and by the French National Ethical Research Committee (CPP 18 04 04, 6 December 2018).

Informed Consent Statement

Informed consent was obtained from all subjects involved in the study.

Data Availability Statement

B-mode cineloop and Pulsed Wave Doppler of the proper volar digital artery are available in Mendeley Data: https://data.mendeley.com/datasets/7g2p7t9tzt/1 (accessed on 21 March 2022). In silico ultrasound phantoms for mimicking the proper volar forefinger artery are available in Mendeley Data: https://data.mendeley.com/datasets/wzrr3t6nnz/4 (accessed on 21 March 2022).

Acknowledgments

The authors would like to thank the students: Anthoine Jury, Omar El Helou, Ibrahima Toure (Msc students), who contributed to the Pacinian corpuscle modeling. The authors are also gratefully indebted to their colleagues from INRS: Florence Oger and Nathalie Simenel, for their assistance in the administrative duties regarding the volunteers, Alexandre Klingler as an expert in vibration and ultrasound measurements, and Fabien Doffin for the mechanical design of the test-bench.

Conflicts of Interest

The authors declare no conflict of interest.

Abbreviations

The following abbreviations are used in this manuscript:
VWFVibration White Finger
WSSWall Shear Stress
SMCsSmooth Muscle Cells
ECEndothelial Cells
ECMExtra Cellular Matrix
PDGFPlatelet-Derived Growth Factor
TGFTransforming Growth Factor
MMPMatrix MetalloProteinase

Appendix A. Construction of Hands Models, Boundary Conditions and Loading
Hand Model 1 was built using anthropomorphic data found in the literature [33]. The geometry was produced with the Rhinoceros 3D® (version 3, Robert McNeel & Associates, Seattle, WA, USA) software, and the meshing was applied in Hypermesh® (version 12, Altair Engineering, Troy, MI, USA). For Hand Model 2, all the components modeled resulted from MRI sequences (Siemens 3T Skyra, Siemens Healthineers, Siemens Healthcare GmbH, Erlangen, Germany) of the right hand of a volunteer (age: 28 years old, height: 1.78 m, weight: 78 kg) who had not suffered any recent injury to their right hand. Segmentation was performed manually using the 3D slicer® software (http://www.slicer.org, accessed 21 March 2022) and the meshing in Hypermesh® (version 12, Altair Engineering, Troy, MI, USA).
The meshes of Hand Model 1 and Hand Model 2 correspond to a neutral position of the hand, i.e., for which there is almost no muscular activity [126]). Thus, in the initial configuration, in the absence of load, the stress field was assumed nil in the finite element models. For the two models, the average size of the tetrahedral meshes was in the region of 1 mm and fine enough to perform calculations up to 500 Hz [33]. These two meshes were coupled with a model of solid bodies representing the forearm, arm, and torso. The different solid body elements of the model were linked together by springs and dampers in tension/compression and bending [127,128]. The junction between the finite element meshing of Hand Model 1 and the poly-articulated solid body system was ensured by a spring and a damper. A rigid link was imposed for Hand Model 2.
The bones, tendons, ligaments, ligament tunnels, cartilage, joint capsules, and fingernails obeyed Zener’s viscoelastic law, whose parameters were taken from the literature [129]. The muscles [130] and skin [131] obey a QLV (Quasi Linear Viscoelasticity) type viscoelastic behavior law. In this law, the hyperelastic part is an Ogden law, and the viscous dissipation obeys a Prony law. The soft tissues have a more complex visco-hyperelastic behavior obtained from our previous works [33]. This original law of type QLV makes use of a hyperfoam hyperelastic law and relaxation spectra called Box Spectrum [132].
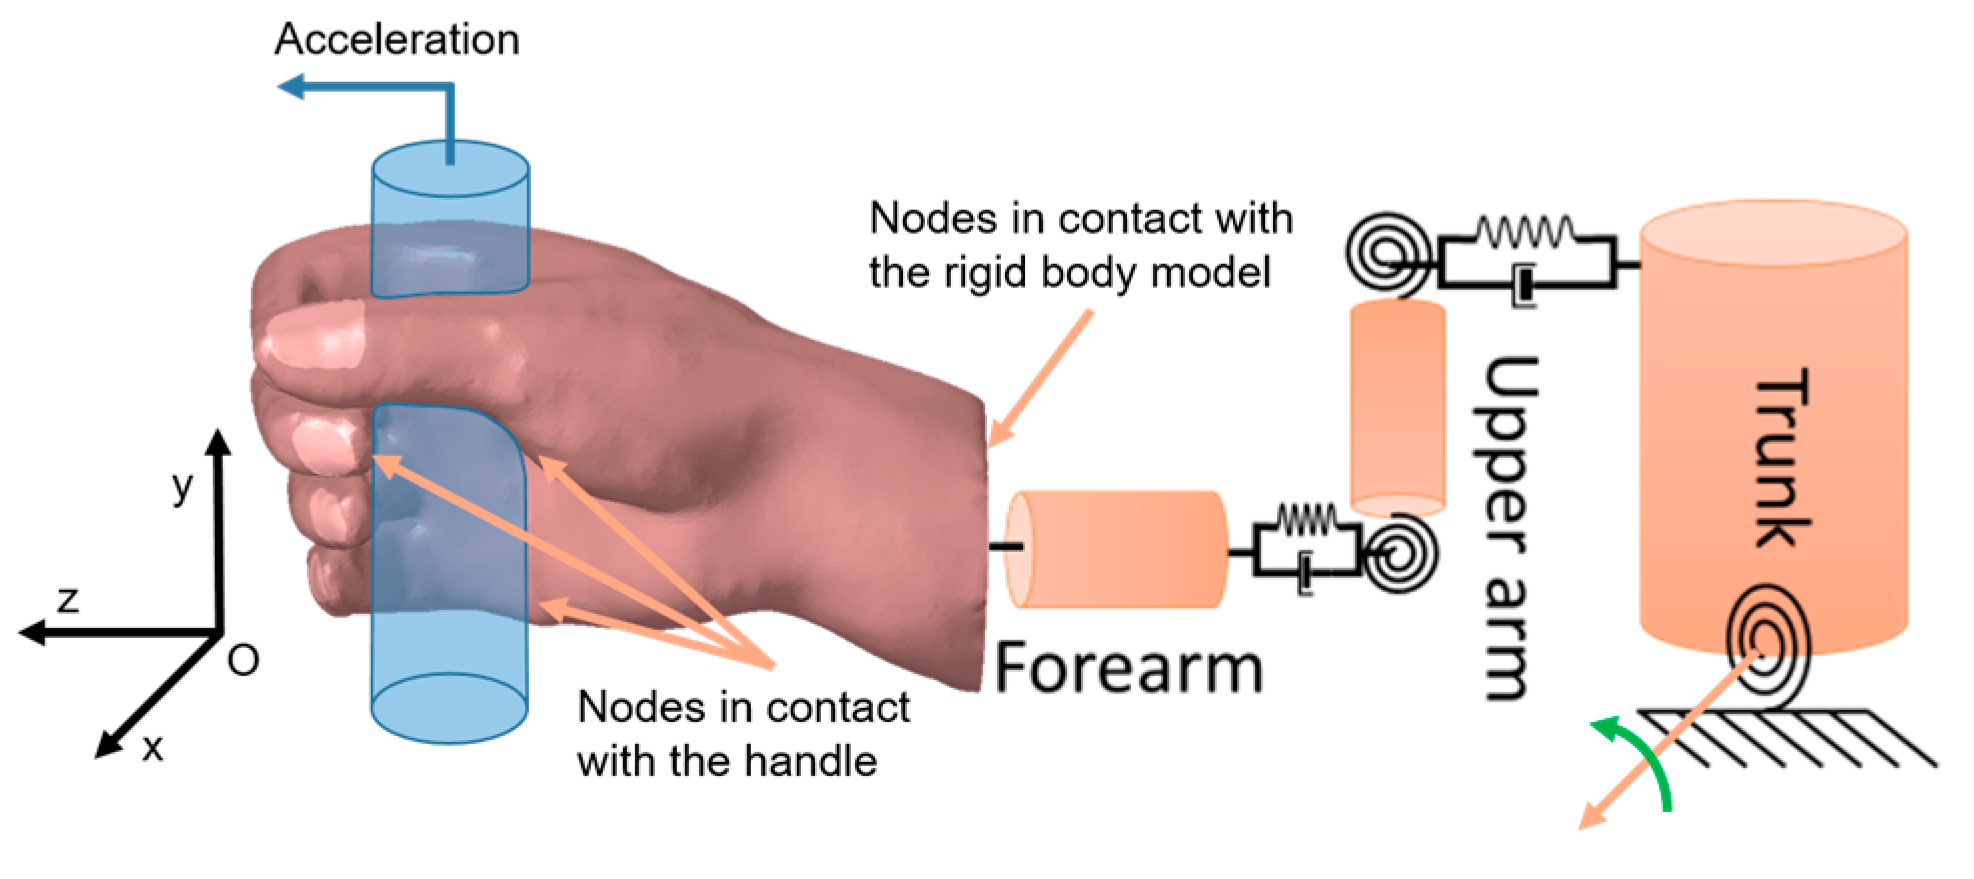
Regarding the two models, the three translations and two rotations of the torso base are fixed. The rotation around axis O x is free (Figure A1). A set of nodes at the end of each hand is rigidly linked to the solid body model. The nodes in contact with the handle are rigidly fixed to it. The hand is in contact with the handle without tightening. The handle is subjected to a harmonic acceleration in direction O z (Figure A1) at a constant amplitude of 40 m·s−2 in the frequency band [1–400 Hz]. The simulations are performed in the spectral domain by direct calculation (no modal superposition) of the dynamic response by inverting a matrix system at each frequency. The simulations are performed with the finite element software Samcef® (version 2020, Siemens Digital Industries Software, Munich, Germany) and LS-Dyna® (version 11, Ansys/LST, Livermore, CA, USA).
Figure A1. Boundary conditions and loading of the finite element models.
Vibration 05 00014 g0a1

Additional Results

Figure A2. The phase of Driving Point Mechanical Impedance (DPMI) in direction zh. Comparison of Hand Model 1 and Hand Model 2 with standard ISO 10068 [83].
Vibration 05 00014 g0a2
Table A1. Eigenfrequencies and eigenmodes of the hand.
Mode at 28 HzMode at 54 HzMode at 82 HzMode at 105 Hz
Abduction/Adduction of wristAbduction/Adduction of metacarpalsBending/Extension of thumbBending/Extension of proximal phalanges and metacarpals
Vibration 05 00014 i001 Vibration 05 00014 i002 Vibration 05 00014 i003 Vibration 05 00014 i004
Vibration 05 00014 i005 Vibration 05 00014 i006 Vibration 05 00014 i007 Vibration 05 00014 i008
Mode at 155 HzMode at 173 HzMode at 259 HzMode at 320 Hz
Bending/Extension of medial phalangesAbduction/Adduction of medial phalangesBending/Extension of distal phalanges and mode of thenar and hypothenar eminencesMode of the thenar and hypothenar eminences without bony modes
Vibration 05 00014 i009 Vibration 05 00014 i010 Vibration 05 00014 i011 Vibration 05 00014 i012
Vibration 05 00014 i013 Vibration 05 00014 i014 Vibration 05 00014 i015 Vibration 05 00014 i016

References

  1. Parent-Thirion, A.; Vermeylen, G.; van Houten, G.; Lyly-Yrjänäinen, M.; Biletta, I.; Cabrita, J. Fifth European Working Conditions Survey: Overview Report; European Foundation for the Improvement of Living and Working Conditions: Luxembourg, 2012; ISBN 9789289710626. [Google Scholar]
  2. Matinet, B.; Rosankis, E.; Léonard, M. Enquête Sumer 2017. Les expositions aux risques professionnels. Les contraintes physiques. Synthèse Stat’ 2020, 33, 185–190. [Google Scholar]
  3. Griffin, M.J. Handbook of Human Vibration; Elsevier Academic Press: London, UK, 1996. [Google Scholar]
  4. Bovenzi, M. Medical aspects of the Hand-Arm vibration syndrome. Int. J. Ind. Ergon. 1990, 6, 61–73. [Google Scholar] [CrossRef]
  5. Matoba, T. Pathophysiology and clinical picture of hand-arm vibration syndrome in Japanese workers. Nagoya J. Med. Sci. 1994, 57, 19–26. [Google Scholar] [PubMed]
  6. FD CR 12349:1996; Mechanical Vibration-Guide to the Health Effects of Vibration on the Human Body. AFNOR: Paris, France, 1996.
  7. European Parliament. European Parliament Directive 2002/44/EC of the European Parliament and of the Council of 25 June 2002 on the minimum health and safety requirements regarding the exposure of workers to the risks arising from physical agents (vibration). Off. J. Eur. Communities 2002, L177, 13–19. [Google Scholar]
  8. NF EN ISO 5349-1:2001; Mechanical Vibration-Measurement and Evaluation of Human Exposure to Hand-Transmitted Vibration-Part 1: General Requirements. AFNOR: Paris, France, 2002.
  9. NF EN ISO 5349-2:2001; Mechanical Vibration-Measurement and Evaluation of Human Exposure to Hand-Transmitted Vibration-Part 2: Practical Guidance for Measurement at the Workplace. AFNOR: Paris, France, 2001.
  10. Donati, P.; Noël, C. Methods for estimating vibration exposure without measurement. In Proceedings of the 14th International Conference on Hand-Arm Vibration, Bonn, Germany, 21–24 May 2019; pp. 153–154. [Google Scholar]
  11. Bovenzi, M.; Griffin, M.J. Haemodynamic changes in ipsilateral and contralateral fingers caused by acute exposures to hand transmitted vibration. Occup. Environ. Med. 1997, 54, 566–576. [Google Scholar] [CrossRef] [Green Version]
  12. Bovenzi, M. A prospective cohort study of exposure-response relationship for vibration-induced white finger. Occup. Environ. Med. 2010, 67, 38–46. [Google Scholar] [CrossRef]
  13. Curry, B.D.; Govindaraju, S.R.; Bain, J.L.W.; Zhang, L.L.; Yan, J.G.; Matloub, H.S.; Riley, D.A. Evidence for frequency-dependent arterial damage in vibrated rat tails. Anat. Rec. Part A Discov. Mol. Cell. Evol. Biol. Off. Publ. Am. Assoc. Anat. 2005, 284, 511–521. [Google Scholar] [CrossRef]
  14. Gayraud, M. Raynaud’s phenomenon. Jt. Bone Spine 2007, 74, 1–8. [Google Scholar] [CrossRef] [PubMed]
  15. Lambova, S.; Kuzmanova, S. Pathogenesis of Raynaud’s phenomenon. Rheumatology 2005, 13, 62–65. [Google Scholar] [CrossRef] [Green Version]
  16. Shah, A. Traumatic Vasospastic Disease. In Raynaud’s Phenomenon: A Guide to Pathogenesis and Treatment; Wigley, F.M., Herrick, A.L., Flavahan, N.A., Eds.; Springer: New York, NY, USA, 2015; pp. 129–140. ISBN 9781493915255. [Google Scholar]
  17. Griffin, M.J.; Bovenzi, M.; Nelson, C.M. Dose-response patterns for vibration-induced white finger. Occup. Environ. Med. 2003, 60, 16–26. [Google Scholar] [CrossRef] [PubMed]
  18. Dong, R.G.; Welcome, D.E.; McDowell, T.W.; Wu, J.Z.; Schopper, A.W. Frequency weighting derived from power absorption of fingers-hand-arm system under z(h)-axis vibration. J. Biomech. 2006, 39, 2311–2324. [Google Scholar] [CrossRef] [PubMed]
  19. Krajnak, K.; Miller, G.R.; Waugh, S.; Johnson, C.; Li, S.; Kashon, M.L. Characterization of frequency-dependent responses of the vascular system to repetitive vibration. J. Occup. Environ. Med. 2010, 52, 584–594. [Google Scholar] [CrossRef] [PubMed] [Green Version]
  20. Bovenzi, M. Epidemiological Evidence for New Frequency Weightings of Hand-Transmitted Vibration. Ind. Health 2012, 50, 377–387. [Google Scholar] [CrossRef] [PubMed] [Green Version]
  21. Brammer, A.J.; Pitts, P.M. Frequency Weighting for Vibration-induced White Finger Compatible with Exposure-response Models. Ind. Health 2012, 50, 397–411. [Google Scholar] [CrossRef] [Green Version]
  22. Griffin, M.J. Frequency-dependence of Psychophysical and Physiological Responses to Hand-transmitted Vibration. Ind. Health 2012, 50, 354–369. [Google Scholar] [CrossRef] [Green Version]
  23. Krajnak, K.; Riley, D.A.; Wu, J.; Mcdowell, T.; Welcome, D.E.; Xu, X.S.; Dong, R.G. Frequency-dependent Effects of Vibration on Physiological Systems: Experiments with Animals and other Human Surrogates. Ind. Health 2012, 50, 343–353. [Google Scholar] [CrossRef] [Green Version]
  24. Pitts, P.M.; Mason, H.J.; Poole, K.A.; Young, C.E. Relative Performance of Frequency Weighting Wh and Candidates for Alternative Frequency Weightings for Predicting the Occurrence of Hand-transmitted Vibration-induced Injuries. Ind. Health 2012, 50, 388–396. [Google Scholar] [CrossRef] [Green Version]
  25. ISO/TR 18570:2017; Mechanical Vibration-Measurement and Evaluation of Human Exposure to Hand Transmitted Vibration-Supplementary Method for Assessing Risk of Vascular Disorders. AFNOR: Paris, France, 2017.
  26. Noël, C. A multi-scale approach for predicting acute and chronic effects of mechanical vibration on the digital vascular network. In Proceedings of the 7th American Conference on Human Vibration, Seattle, WA, USA, 13–15 June 2018; pp. 93–94. [Google Scholar]
  27. Birnstingl, M. The Raynaud syndrome. Postgrad. Med. J. 1971, 47, 297–310. [Google Scholar] [CrossRef] [Green Version]
  28. Olsen, N.D. Hyperreacivity of the Central Sympathetic Nervous System in Vibration-Induced White Finger. Kurume Med. J. 1990, 37, S109–S116. [Google Scholar] [CrossRef]
  29. Toibana, N.; Ishikawa, N.; Sakakibara, H.; Yamada, S. Raynaud’s phenomenon of fingers and toes among vibration-exposed patients. Nagoya J. Med. Sci. 1994, 57, 121–128. [Google Scholar]
  30. Stoyneva, Z.; Lyapina, M.; Tzvetkov, D.; Vodenicharov, E. Current pathophysiological views on vibration-induced Raynaud’s phenomenon. Cardiovasc. Res. 2003, 57, 615–624. [Google Scholar] [CrossRef]
  31. Noël, C. Modeling the biodynamic response of a pre-loaded vibrated phalanx and preliminary results for a whole hand. In Proceedings of the 6th American Conference on Human Vibration, Milwaukee, WI, USA, 8–10 June 2016; pp. 21–22. [Google Scholar]
  32. Noël, C. Measuring dynamic stiffnesses of preloaded distal phalanges in vibration-Test bench validation and parameter study. Int. J. Ind. Ergon. 2017, 59, 64–79. [Google Scholar] [CrossRef] [Green Version]
  33. Noël, C. A three-dimensional visco-hyperelastic FE model for simulating the mechanical dynamic response of preloaded phalanges. Med. Eng. Phys. 2018, 61, 41–50. [Google Scholar] [CrossRef] [PubMed]
  34. Ye, Y.; Griffin, M.J. Reductions in finger blood flow induced by 125-Hz vibration: Effect of location of contact with vibration. Int. Arch. Occup. Environ. Health 2016, 89, 425–433. [Google Scholar] [CrossRef] [PubMed]
  35. Gemne, G. Pathophysiology of white fingers in workers using hand-held vibrating tools. Nagoya J. Med. Sci. 1994, 57, 87–97. [Google Scholar]
  36. Heinonen, E.; Färkkilä, M.; Forsström, J.; Antila, K.; Jalonen, J.; Korhonen, O.; Pyykkö, I. Autonomic neuropathy and vibration exposure in forestry workers. Br. J. Ind. Med. 1987, 44, 412–416. [Google Scholar] [CrossRef] [Green Version]
  37. Mano, T. Autonomic responses to environmental stimuli in human body. Nagoya J. Med. Sci. 1994, 57, 59–75. [Google Scholar]
  38. Sakakibara, H. Sympathetic responses to hand-arm vibration and symptoms of the foot. Nagoya J. Med. Sci. 1994, 57, 99–111. [Google Scholar]
  39. Ye, Y. Pacinian Channel Mediated Vasoconstriction in the Fingers during Vibration Exposure. Ph.D. Thesis, University of Southampton, Southampton, UK, 2013. [Google Scholar]
  40. Bovenzi, M.; Lindsell, C.J.; Griffin, M.J. Acute vascular responses to the frequency of vibration transmitted to the hand. Occup. Environ. Med. 2000, 57, 422–430. [Google Scholar] [CrossRef] [Green Version]
  41. Dobrin, P.B. Mechanical factors associated with the development of intimal and medial thickening in vein grafts subjected to arterial pressure. A model of arteries exposed to hypertension. Hypertension 1995, 26, 38–43. [Google Scholar] [CrossRef]
  42. Jackson, M.; Wood, N.B.; Zhao, S.; Augst, A.; Wolfe, J.H.; Gedroyc, W.M.W.; Hughes, A.D.; Thom, S.A.M.; Xu, X.Y. Low wall shear stress predicts subsequent development of wall hypertrophy in lower limb bypass grafts. Artery Res. 2009, 3, 32–38. [Google Scholar] [CrossRef] [PubMed] [Green Version]
  43. Glagov, S. Intimal hyperplasia, vascular remodeling, and the restenosis problem. Circulation 1994, 89, 2888–2891. [Google Scholar] [CrossRef] [PubMed] [Green Version]
  44. Poole, C.J.M.; Cleveland, T.J. Vascular hand-arm vibration syndrome-magnetic resonance angiography. Occup. Med. 2016, 66, 75–78. [Google Scholar] [CrossRef] [PubMed] [Green Version]
  45. Hashiguchi, T.; Yanagi, T.; Kinugawa, Y.; Sakakibara, H.; Yamada, S. Pathological Changes of Finger and Toe. Nagoya J. Med. Sci. 1994, 57, 2–6. [Google Scholar]
  46. Vuong, P.N.; Sir Berry, C. Effects of physical and chemical agents on vessels. In The Pathology of Vessels; Springer: Berlin, Germany, 2002; pp. 140–161. ISBN 9780874216561. [Google Scholar]
  47. Noel, C.; Settembre, N. A Test Setup for Measuring the Vibration Effects on Digital Arteries Vasoconstriction: A Preliminary Study. In Proceedings of the 52nd Human Response to Vibration Conference & Workshop, Cranfield University, Shrivenham, UK, 5–6 September 2017; pp. 202–209. [Google Scholar]
  48. Reda, M.; Noel, C.; Settembre, N.; Chambert, J.; Lejeune, A.; Jacquet, E.; Noel, C.; Settembre, N.; Chambert, J.; Lejeune, A.; et al. Agent-based modelling of the smooth muscle cells migration induced by mechanical vibration: A preliminary study. Comput. Methods Biomech. Biomed. Eng. 2020, 23, S255–S256. [Google Scholar] [CrossRef]
  49. Chim, H. Hand and Wrist Anatomy and Biomechanics: A Comprehensive Guide; Thieme: Stuttgart, Germany, 2017; ISBN 9783132053410. [Google Scholar]
  50. Verrillo, R.T. Investigation of Some Parameters of the Cutaneous Threshold for Vibration. J. Acoust. Soc. Am. 1962, 34, 1768–1773. [Google Scholar] [CrossRef]
  51. Verrillo, R.T. Vibrotactile sensitivity and the frequency response of the Pacinian corpuscle 1. Psychon. Sci. 1966, 4, 135–136. [Google Scholar] [CrossRef] [Green Version]
  52. Inman, D.R.; Peruzzi, P. The effects of temperature on the responses of Pacinian corpuscles. J. Physiol. 1961, 155, 280–301. [Google Scholar] [CrossRef] [Green Version]
  53. Bolanowski, S.; Verrilo, R. Temperature and Criterion Effects in Somatosensory Subsystem: A Neurophysiological and Psychophysical Study. J. Neurophysiol. 1982, 48, 836–855. [Google Scholar] [CrossRef]
  54. Pease, D.C.; Quilliam, T.A. Electron microscopy of the Pacinian corpuscle. J. Biophys. Biochem. Cytol. 1957, 3, 331–342. [Google Scholar] [CrossRef] [Green Version]
  55. Spencer, P.S.; Schaumburg, H.H. An ultrastructural study of the inner core of the Pacinian corpuscle. J. Neurocytol. 1973, 2, 217–235. [Google Scholar] [CrossRef] [PubMed]
  56. Bell, J.; Holmes, M. Model of the dynamics of receptor potential in a mechanoreceptor. Math. Biosci. 1992, 110, 139–174. [Google Scholar] [CrossRef]
  57. Feng, X.; Lu, T. Introduction to Skin Biothermomechanics and Thermal Pain; Springer: Berlin/Heidelberg, Germany, 2011; ISBN 9787030270771. [Google Scholar]
  58. Noël, C. Validation of a 3d visco-hyper-elastic finite element model for a pre-stressed vibrated distal forefinger phalanx: Mechanical and first thermal analysis. In Proceedings of the 13th International Conference on Han-Arm Vibration, Beijing China, 13–15 October 2015; pp. 85–86. [Google Scholar]
  59. Noël, C. B-Mode Cineloop and Pulsed Wave Doppler of the Proper Volar Digital Artery. Mendeley Data. 2021. Available online: https://doi.org/10.17632/7337g2p7t9tzt.1 (accessed on 21 March 2022).
  60. Womersley, J.R. Method for the calculation of velocity, rate of flow and viscous drag in arteries when the pressure gradient is known. J. Physiol. 1955, 127, 553–563. [Google Scholar] [CrossRef] [PubMed]
  61. Blake, J.R.; Meagher, S.; Fraser, K.H.; Easson, W.J.; Hoskins, P.R. A Method to Estimate Wall Shear Rate with a Clinical Ultrasound Scanner. Ultrasound Med. Biol. 2008, 34, 760–774. [Google Scholar] [CrossRef] [PubMed]
  62. Stefanovska, A.; Krošelj, P.; Bračič, M.; Strle, S. Reconstructing Cardiovascular Dynamics. IFAC Proc. Vol. 1997, 30, 7–12. [Google Scholar] [CrossRef]
  63. Söderström, T.; Stefanovska, A.; Veber, M.; Svensson, H. Involvement of sympathetic nerve activity in skin blood flow oscillations in humans. Am. J. Physiol.-Heart Circ. Physiol. 2003, 284, 1638–1646. [Google Scholar] [CrossRef]
  64. Nirala, N.; Periyasamy, R.; Kumar, A. Study of skin flow motion pattern using photoplethysmogram. Int. J. Adv. Intell. Paradig. 2020, 16, 241–264. [Google Scholar] [CrossRef]
  65. Zhang, Q.; Zhang, Y.; Zhou, Y.; Zhang, K.; Zhang, K.; Gao, L. An Ultrasound Simulation Model for the Pulsatile Blood Flow Modulated by the Motion of Stenosed Vessel Wall. Biomed Res. Int. 2016, 2016, 8502873. [Google Scholar] [CrossRef] [Green Version]
  66. Zhou, X.; Xia, C.; Stephen, G.; Khan, F.; Corner, G.A.; Hoskins, P.R.; Huang, Z. Investigation of Ultrasound-Measured Flow Velocity, Flow Rate and Wall Shear Rate in Radial and Ulnar Arteries Using Simulation. Ultrasound Med. Biol. 2017, 43, 981–992. [Google Scholar] [CrossRef] [Green Version]
  67. Deng, L.; Zhang, Y.; Zhao, Z.; Zhang, K.; Hu, X.; Gao, L.; Liang, H.; Zhang, J. Ultrasound simulation model incorporating incident and reflected wave propagations along a common carotid artery. Comput. Biol. Med. 2019, 104, 267–277. [Google Scholar] [CrossRef]
  68. Noël, C.; Settembre, N. Assessing mechanical vibration-altered wall shear stress in digital arteries. J. Biomech. 2022, 131, 110893. [Google Scholar] [CrossRef] [PubMed]
  69. Noël, C. In Silico Ultrasound Phantoms for Mimicking the Proper Volar Forefinger Artery. Mendeley Data. 2021. Available online: https://data.mendeley.com/datasets/wzrr3t6nnz/4 (accessed on 21 March 2022).
  70. Charlton, P.H.; Harana, J.M.; Vennin, S.; Li, Y.; Chowienczyk, P.; Alastruey, J. Modeling arterial pulse waves in healthy aging: A database for in silico evaluation of hemodynamics and pulse wave indexes. Am. J. Physiol.-Heart Circ. Physiol. 2019, 317, H1062–H1085. [Google Scholar] [CrossRef]
  71. Epstein, F.H.; Gibbons, G.H.; Dzau, V.J. The emerging concept of vascular remodeling. N. Engl. J. Med. 1994, 330, 1431–1438. [Google Scholar] [CrossRef] [PubMed]
  72. Nerem, R.M.; Alexander, R.W.; Chappell, D.C.; Medford, R.M.; Varner, S.E.; Robert Taylor, W. The Study of the Influence of Flow on Vascular Endothelial Biology. Am. J. Med. Sci. 1998, 316, 169–175. [Google Scholar] [CrossRef] [PubMed]
  73. Hsieh, H.J.; Li, N.Q.; Frangos, J.A. Shear stress increases endothelial platelet-derived growth factor mRNA levels. Am. J. Physiol.-Heart Circ. Physiol. 1991, 260, 1–5. [Google Scholar] [CrossRef]
  74. Heydarkhan-Hagvall, S.; Chien, S.; Nelander, S.; Li, Y.C.; Yuan, S.; Lao, J.; Haga, J.H.; Lian, I.; Nguyen, P.; Risberg, B.; et al. DNA microarray study on gene expression profiles in co-cultured endothelial and smooth muscle cells in response to 4- and 24-h shear stress. Mol. Cell. Biochem. 2006, 281, 1–15. [Google Scholar] [CrossRef]
  75. Kona, S.; Chellamuthu, P.; Xu, H.; Hills, S.R.; Nguyen, K.T. Effects of Cyclic Strain and Growth Factors on Vascular Smooth Muscle Cell Responses. Open Biomed. Eng. J. 2009, 3, 28–38. [Google Scholar] [CrossRef] [Green Version]
  76. Bayer, I.M.; Adamson, S.L.; Langille, B.L. Atrophic remodeling of the artery-cuffed artery. Arterioscler. Thromb. Vasc. Biol. 1999, 19, 1499–1505. [Google Scholar] [CrossRef] [Green Version]
  77. Thorne, B.C.; Hayenga, H.N.; Humphrey, J.D.; Peirce, S.M. Toward a multi-scale computational model of arterial adaptation in hypertension: Verification of a multi-cell agent-based model. Front. Physiol. 2011, 2, 20. [Google Scholar] [CrossRef] [Green Version]
  78. Evans, D.J.W.; Lawford, P.V.; Gunn, J.; Walker, D.; Hose, D.R.; Smallwood, R.H.; Chopard, B.; Krafczyk, M.; Bernsdorf, J.; Hoekstra, A. The application of multiscale modelling to the process of development and prevention of stenosis in a stented coronary artery. Philos. Trans. R. Soc. A Math. Phys. Eng. Sci. 2008, 366, 3343–3360. [Google Scholar] [CrossRef]
  79. Boyle, C.J.; Lennon, A.B.; Early, M.; Kelly, D.J.; Lally, C.; Prendergast, P.J. Computational simulation methodologies for mechanobiological modelling: A cell-centred approach to neointima development in stents. Philos. Trans. R. Soc. A Math. Phys. Eng. Sci. 2010, 368, 2919–2935. [Google Scholar] [CrossRef] [PubMed] [Green Version]
  80. Holzapfel, G.A.; Ogden Editors, R.W. Biomechanics: Trends in Modeling and Simulation; Springer: Cham, Germany, 2017; ISBN 9783319414737. [Google Scholar]
  81. Reda, M.; Noel, C.; Settembre, N.; Chambert, J.; Lejeune, A.; Jacquet, E. Agent-based model of the vibration-induced intimal hyperplasia. Biomech. Model. Mechanobiol. 2022; submitted for publication. [Google Scholar]
  82. Reda, M.; Noel, C.; Settembre, N.; Chambert, J.; Lejeune, A.; Jacquet, E. Mechanobiological modelling of vibration-induced intimal hyperplasia: A coupled agent-based-finite element approach. Comput. Biol. Med. 2022; submitted for publication. [Google Scholar]
  83. ISO 10068; Mechanical Vibration and Shock-Mechanical Impedance of the Human Hand-Arm System at the Driving Point. AFNOR: Paris, France, 2012.
  84. Adewusi, S.; Thomas, M.; Vu, V.H.; Li, W. Modal parameters of the human hand-Arm using finite element and operational modal analysis. Mech. Ind. 2014, 15, 541–549. [Google Scholar] [CrossRef]
  85. Lundström, R.; Burström, L. Mechanical impedance of the human hand-arm system. Int. J. Ind. Ergon. 1989, 3, 235–242. [Google Scholar] [CrossRef]
  86. Xu, X.S.; Welcome, D.E.; McDowell, T.W.; Wu, J.Z.; Wimer, B.; Warren, C.; Dong, R.G. The vibration transmissibility and driving-point biodynamic response of the hand exposed to vibration normal to the palm. Int. J. Ind. Ergon. 2011, 41, 418–427. [Google Scholar] [CrossRef]
  87. Xu, X.S.; Dong, R.G.; Welcome, D.E.; Warren, C.; Mcdowell, T.W.; Wu, J.Z. Vibrations transmitted from human hands to upper arm, shoulder, back, neck, and head. Int. J. Ind. Ergon. 2017, 62, 1–12. [Google Scholar] [CrossRef] [Green Version]
  88. Dong, R.G.; Welcome, D.E.; McDowell, T.W.; Wu, J.Z. Biodynamic response of human fingers in a power grip subjected to a random vibration. J. Biomech. Eng. 2004, 126, 447–457. [Google Scholar] [CrossRef]
  89. Wu, J.Z.; Welcome, D.E.; McDowell, T.W.; Xu, X.S.; Dong, R.G. Modeling of the interaction between grip force and vibration transmissibility of a finger. Med. Eng. Phys. 2017, 45, 61–70. [Google Scholar] [CrossRef]
  90. Dong, R.G.; Welcome, D.E.; Xu, X.S.; Warren, C.; McDowell, T.W.; Wu, J.Z.; Rakheja, S. Mechanical impedances distributed at the fingers and palm of the human hand in three orthogonal directions. J. Sound Vib. 2012, 331, 1191–1206. [Google Scholar] [CrossRef] [Green Version]
  91. Pan, D.; Xu, X.S.; Welcome, D.E.; McDowell, T.W.; Warren, C.; Wu, J.; Dong, R.G. The relationships between hand coupling force and vibration biodynamic responses of the hand-arm system. Ergonomics 2018, 61, 818–830. [Google Scholar] [CrossRef] [PubMed]
  92. Gennisson, J.L.; Deffieux, T.; Macé, E.; Montaldo, G.; Fink, M.; Tanter, M. Viscoelastic and anisotropic mechanical properties of in vivo muscle tissue assessed by supersonic shear imaging. Ultrasound Med. Biol. 2010, 36, 789–801. [Google Scholar] [CrossRef]
  93. Quindlen, J.C.; Barocas, V.H.; Flanders, M. A Multiphysics Model of the Pacinian Corpuscle. Integr. Biol. 2016, 396–397. [Google Scholar] [CrossRef] [PubMed]
  94. Quindlen, J.C. Mechano-to-Neural Transduction of the Pacinian Corpuscle; University of Minnesota: Minneapolis, MN, USA, 2017. [Google Scholar]
  95. Liu, Z.; Wu, C.T.; Ren, B.; Liu, W.K.; Grimes, R. Multiscale Simulations of Material with Heterogeneous Structures Based on Representative Volume Element Techniques. In Proceedings of the 15th International LS-DYNA Conference, Dearborn, MI, USA, 10–12 June 2009; pp. 1–10. [Google Scholar]
  96. Briant, L.J.B.; Paton, J.F.R.; Pickering, A.E.; Champneys, A.R. Modelling the vascular response to sympathetic postganglionic nerve activity. J. Theor. Biol. 2015, 371, 102–116. [Google Scholar] [CrossRef] [PubMed] [Green Version]
  97. Petiot, E.; Barrès, C.; Chapuis, B.; Julien, C. Frequency response of renal sympathetic nervous activity to aortic depressor nerve stimulation in the anaesthetized rat. J. Physiol. 2001, 537, 949–959. [Google Scholar] [CrossRef]
  98. Kamiya, A.; Michikami, D.; Iwase, S.; Mano, T. Decoding rule from vasoconstrictor skin sympathetic nerve activity to nonglabrous skin blood flow in humans at normothermic rest. Neurosci. Lett. 2008, 439, 13–17. [Google Scholar] [CrossRef]
  99. Hines, M.L.; Carnevale, N.T. The NEURON simulation environment. Neural Comput. 1997, 9, 1179–1209. [Google Scholar] [CrossRef] [PubMed]
  100. Bittar, E.E.; Willis, J.S. Advances in Molecular and Cell Biology-Volume 19: Thermobiology; JAI Press LTD: London, UK, 1997; ISBN 9780874216561. [Google Scholar]
  101. Lepock, J.R. How do cells respond to their thermal environment? Int. J. Hyperth. 2005, 21, 681–687. [Google Scholar] [CrossRef] [PubMed]
  102. Habash, R.W.Y.; Bansal, R.; Krewski, D.; Alhafid, H.T. Thermal Therapy, Part 1: An Introduction to Thermal Therapy. Crit. Rev. Biomed. Eng. 2006, 34, 459–489. [Google Scholar] [CrossRef]
  103. Daniel, R.M.; Peterson, M.E.; Danson, M.J.; Price, N.C.; Kelly, S.M.; Monk, C.R.; Weinberg, C.S.; Oudshoorn, M.L.; Lee, C.K. The molecular basis of the effect of temperature on enzyme activity. Biochem. J. 2010, 425, 353–360. [Google Scholar] [CrossRef]
  104. Mynard, J.P.; Wasserman, B.A.; Steinman, D.A. Errors in the estimation of wall shear stress by maximum Doppler velocity. Atherosclerosis 2013, 227, 259–266. [Google Scholar] [CrossRef] [Green Version]
  105. Stroev, P.V.; Hoskins, P.R.; Easson, W.J. Distribution of wall shear rate throughout the arterial tree: A case study. Atherosclerosis 2007, 191, 276–280. [Google Scholar] [CrossRef]
  106. Sakariassen, K.S.; Orning, L.; Turitto, V.T.; Sas, K.; Campo Zampo, S. The impact of blood shear rate on arterial thrombus formation. Future Sci. OA 2015, 1, 30. [Google Scholar] [CrossRef] [Green Version]
  107. Nichols, W.W.; O’Rourke, M.F.; Vlachopoulos, C.; Hoeks, A.P.; Reneman, R.S. McDonald’s Blood Flow in Arteries Theoretical, Experimental and Clinical Principles, 6th ed.; Hodder Arnold: London, UK, 2011; ISBN 9780340985014. [Google Scholar]
  108. Bovenzi, M.; Lindsell, C.J.; Griffin, M.J. Magnitude of acute exposures to vibration and finger circulation. Scand. J. Work. Environ. Health 1999, 25, 278–284. [Google Scholar] [CrossRef] [PubMed] [Green Version]
  109. Morioka, M.; Griffin, M.J. Magnitude-dependence of equivalent comfort contours for fore-and-aft, lateral and vertical hand-transmitted vibration. J. Sound Vib. 2006, 295, 633–648. [Google Scholar] [CrossRef] [Green Version]
  110. Harada, N.; Hirata, M.; Ishitake, T.; Yukinori Kume, Y.K.; Miyashita, K.; Sakakibara, H.; Syuji Satou, N.T.; Mahbub, H. Guidelines of the Japanese Research Society for Vibration Syndrome to Diagnose Hand-Arm Vibration Syndrome. In Proceedings of the 12th International Conference on Hand-Arm Vibration, Ottawa, ON, Canada, 13–17 June 2011; pp. 76–77. [Google Scholar]
  111. Honma, H.; Kobayashi, T.; Kaji, H. A Color Atlas of Circulation Disorders in Hand-Arm Vibration Syndrome; Iwamizawa Rosai Hospital, Labour Welfare Corporation: Iwamizawa, Japan, 2003.
  112. Kahaleh, B.; Mulligan-Kehoe, M.J. Mechanisms of Vascular Disease; University of Adelaide Press: Adelaide, Australia, 2012; ISBN 9781441957740. [Google Scholar]
  113. Hobeika, M.J.; Thompson, R.W.; Muhs, B.E.; Brooks, P.C.; Gagne, P.J. Matrix metalloproteinases in peripheral vascular disease. J. Vasc. Surg. 2007, 45, 849–857. [Google Scholar] [CrossRef] [PubMed] [Green Version]
  114. Mahor, D.; Kumari, V.; Vashisht, K.; Galgalekar, R.; Samarth, R.M.; Mishra, P.K.; Banerjee, N.; Dixit, R.; Saluja, R.; De, S.; et al. Elevated serum matrix metalloprotease (MMP-2) as a candidate biomarker for stable COPD. BMC Pulm. Med. 2020, 20, 302. [Google Scholar] [CrossRef]
  115. Lopez-Avila, V.; Spencer, J.V. Methods for Detection of Matrix Metalloproteinases as Biomarkers in Cardiovascular Disease. Clin. Med. Cardiol. 2008, 2, CMC.S484. [Google Scholar] [CrossRef] [Green Version]
  116. ISO 12052:2017; Health Informatics—Digital Imaging and Communication in Medicine (DICOM) including Workflow and Data Management. International Organization for Standardization: Geneva, Switzerland, 2017.
  117. Loizou, C.P.; Theofanous, C.; Pantziaris, M.; Kasparis, T. Despeckle filtering software toolbox for ultrasound imaging of the common carotid artery. Comput. Methods Programs Biomed. 2014, 114, 109–124. [Google Scholar] [CrossRef]
  118. Loizou, C.; Pattichis, C.S. Despeckle Filtering for Ultrasound Imaging and Video, Volume I: Algorithms and Software, Second Edition. Synth. Lect. Algorithms Softw. Eng. 2015, 7, 1–180. [Google Scholar] [CrossRef]
  119. Noble, J.A.; Boukerroui, D. Ultrasound image segmentation: A survey. IEEE Trans. Med. Imaging 2006, 25, 987–1010. [Google Scholar] [CrossRef] [Green Version]
  120. Giannoglou, G.D.; Chatzizisis, Y.S.; Koutkias, V.; Kompatsiaris, I.; Papadogiorgaki, M.; Mezaris, V.; Parissi, E.; Diamantopoulos, P.; Strintzis, M.G.; Maglaveras, N.; et al. A novel active contour model for fully automated segmentation of intravascular ultrasound images: In vivo validation in human coronary arteries. Comput. Biol. Med. 2007, 37, 1292–1302. [Google Scholar] [CrossRef] [PubMed]
  121. Withey, D.J.; Koles, Z.J. Review of Medical Image Segmentation: Methods and Available Software. Int. J. Bioelectromagn. 2008, 10, 125–148. [Google Scholar]
  122. Mahmood, N.H.; Supriyanto, E. Automatic Detection of Carotid Artery in Ultrasound Image using Tresholding Method. Int. J. Sci. Eng. Res. 2011, 2, 1–7. [Google Scholar]
  123. Molinari, F.; Pattichis, C.S.; Zeng, G.; Saba, L.; Acharya, U.R.; Sanfilippo, R.; Nicolaides, A.; Suri, J.S. Completely automated multiresolution edge snapper—A new technique for an accurate carotid ultrasound IMT measurement: Clinical validation and benchmarking on a multi-institutional database. IEEE Trans. Image Process. 2012, 21, 1211–1222. [Google Scholar] [CrossRef] [PubMed]
  124. Molinari, F.; Meiburger, K.M.; Zeng, G.; Acharya, U.R.; Liboni, W.; Nicolaides, A.; Suri, J.S. Carotid artery recognition system: A comparison of three automated paradigms for ultrasound images. Med. Phys. 2011, 39, 378–391. [Google Scholar] [CrossRef]
  125. Kumar, P.K.; Araki, T.; Rajan, J.; Laird, J.R.; Nicolaides, A.; Suri, J.S. State-of-the-art review on automated lumen and adventitial border delineation and its measurements in carotid ultrasound. Comput. Methods Programs Biomed. 2018, 163, 155–168. [Google Scholar] [CrossRef] [PubMed]
  126. León, B.; Morales, A.; Sancho-Bru, J. Chapter 5—The Model of the Human Hand. In From Robot to Human Grasping Simulation; Springer: Berlin/Heidelberg, Germany, 2014; p. 263. ISBN 9783319018324. [Google Scholar]
  127. Adewusi, S.; Rakheja, S.; Marcotte, P. Biomechanical models of the human hand-arm to simulate distributed biodynamic responses for different postures. Int. J. Ind. Ergon. 2012, 42, 249–260. [Google Scholar] [CrossRef]
  128. Adewusi, S.; Rakheja, S.; Marcotte, P.; Thomas, M. Distributed vibration power absorption of the human hand-arm system in different postures coupled with vibrating handle and power tools. Int. J. Ind. Ergon. 2013, 43, 363–374. [Google Scholar] [CrossRef]
  129. Payan, Y.; Ohayon, J. Biomechanics of Living Organs, 1st ed.; Inc, A.P., Ed.; Elsevier Science Publishing Co. Inc.: San Diego, CA, USA, 2017; ISBN 9780128040096. [Google Scholar]
  130. Gras, L.L.; Mitton, D.; Viot, P.; Laporte, S. Modelling of human muscle behaviour with a hyper-elastic constitutive law. Comput. Methods Biomech. Biomed. Eng. 2010, 13, 63–64. [Google Scholar] [CrossRef]
  131. Wu, J.Z.; Krajnak, K.; Welcome, D.E.; Dong, R.G. Analysis of the dynamic strains in a fingertip exposed to vibrations: Correlation to the mechanical stimuli on mechanoreceptors. J. Biomech. 2006, 39, 2445–2456. [Google Scholar] [CrossRef]
  132. Lakes, R.S.; Katz, J.L. Viscoelastic properties of wet cortical bone—III. A non-linear constitutive equation. J. Biomech. 1979, 12, 689–698. [Google Scholar] [CrossRef]
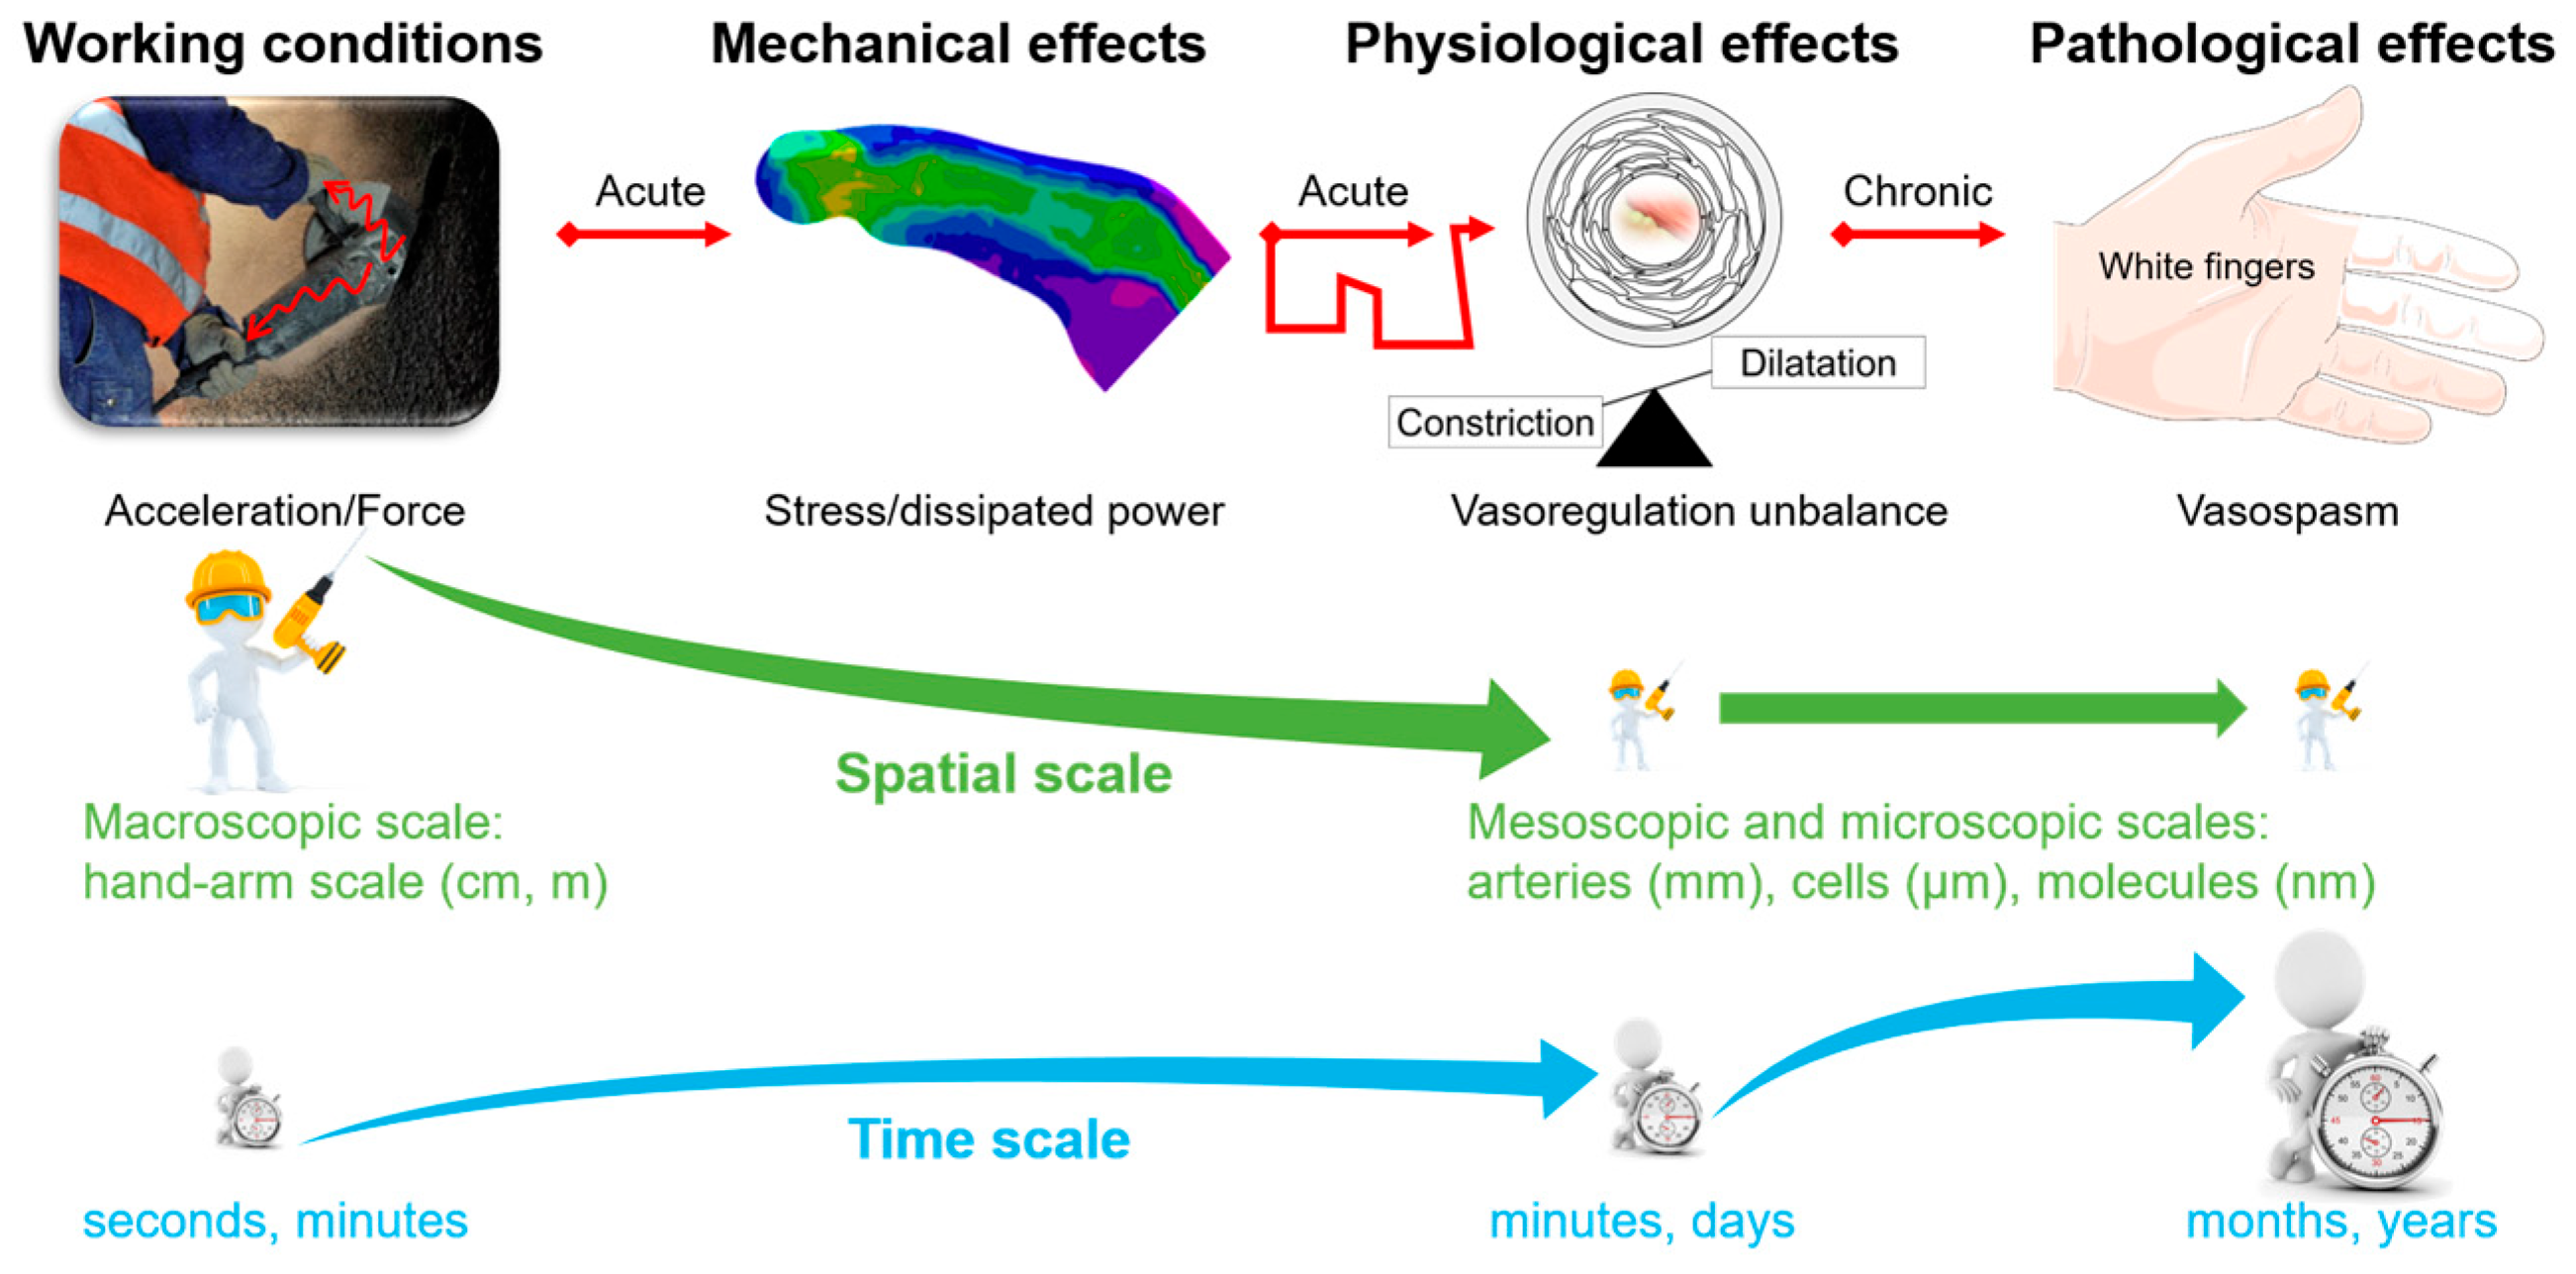
Figure 1. Simplified overall view of the development of vibration-induced Raynaud’s syndrome: from working conditions to pathological consequences, passing via mechanical and physiological effects.
Vibration 05 00014 g001
Figure 2. (a) Diagram of our original strategy; (b) details of model A; (c) details of model B.
Vibration 05 00014 g002
Figure 3. (a) Structure of a Pacinian corpuscle; (b) model of mechano-electrochemical couplings.
Vibration 05 00014 g003
Figure 4. Thermal model and the adapted experimental setup. (a) modeling; (b) apparatus.
Vibration 05 00014 g004
Figure 5. Experimental setup: (a) overall view; (b) positioning support of the ultrasound probe; (c) measurement area corresponding to the proper volar digital artery of the left index finger.
Vibration 05 00014 g005
Figure 6. Geometries and scatterers used for computing the numerical ultrasound phantoms: (a) cylindrical basic artery; (b) true artery with two imaging sections, from [68].
Vibration 05 00014 g006
Figure 7. (a) Workflow for the mesh construction showing the RMI images, segmentation, meshing, and cutting stages; (b) pressure inlet and velocity outlet physiological boundary conditions, and clamped bone, from [68].
Vibration 05 00014 g007
Figure 8. Synthesis of the mechano-biological model developed to simulate harmful arterial stenosis.
Vibration 05 00014 g008
Figure 9. The module of the Driving Point Mechanical Impedance (DPMI) in direction zh. Comparison of Hand Models 1 and 2 with standard ISO 10068 [83]. The acceleration fields in the hands shown at the bottom of the figure correspond to the frequencies A, B, and C shown in the top half of the figure.
Vibration 05 00014 g009
Figure 10. (a) Mechano-electrochemical response of Pacinian corpuscles; (b) main maximum deformations on the three filopodia after coupling the macroscopic and microscopic scales.
Vibration 05 00014 g010
Figure 11. Comparison between simulation/measure of the increase in temperature induced by the vibrations. The calculation performed with the basal rate of blood perfusion; (a) temperature field; (b) temperature simulated with and without vibration and vibration-induced increase in temperature simulated and measured for a given position (pink ellipse).
Vibration 05 00014 g011
Figure 12. (a) Example of reduction in WSS caused by vibrations on a volunteer; (b) statistical synthesis of the influence of vibration (>*** means p-value < 0.0001); (c) statistical synthesis of the influence of the amplitude of vibration.
Vibration 05 00014 g012
Figure 13. Diameter computation; (ab) cylindrical artery: (a) B-mode images simulated with Field II and Focus; (b) comparison between the target and Field II/Focus diameters over a cardiac cycle; (c,d) comparison between the diameters computed with the fluid–structure Interaction (FSI) model and Field II/Focus for the true artery; (c) slice 1; (d) slice 2.
Vibration 05 00014 g013
Figure 14. Polar representation of the time-averaged WSS computed from the full FSI, rigid wall, and Womersley models for nine Womersley cutting paths defined from slice 2.
Vibration 05 00014 g014
Figure 15. The number of smooth muscle cells (SMCs) and quantity of collagen, normalized surfaces or arterial lumen, and the media for exposure to vibrations for 4 h a day as a function of years’ exposure. The geometry of the artery is given in the initial state and at the end of 5 and 10 years of exposure.
Vibration 05 00014 g015
Figure 16. Accumulation of MMP-2 and TGF-β as a function of time of exposure to vibrations.
Vibration 05 00014 g016
Table 1. The two finite element models developed.
Hand Model 1Hand Model 2
Model Vibration 05 00014 i017 Vibration 05 00014 i018
Anatomical detailCoarseFine
Number of nodes10,325262,226
Number of elements47,4461,455,357
DesignLiterature data [33]Segmentation of MRI images
Publisher’s Note: MDPI stays neutral with regard to jurisdictional claims in published maps and institutional affiliations.