1. Introduction
Sand surfacing is seen on different sports such as, beach volleyball [
1], equine racing [
2,
3] and greyhound racing [
4,
5,
6]. The mechanical properties of the sand surface not only determines the performance of an athlete, be they human or a tetrapod, but also as an important injury contributing factor [
7,
8]. There is still a significant gap in understanding the behaviour of sand surface under impact load [
9,
10]. Accordingly, understanding the mechanical properties of sand surface, variables that alter the sand surface dynamic behavior, and methods to measure these variables, are of paramount importance.
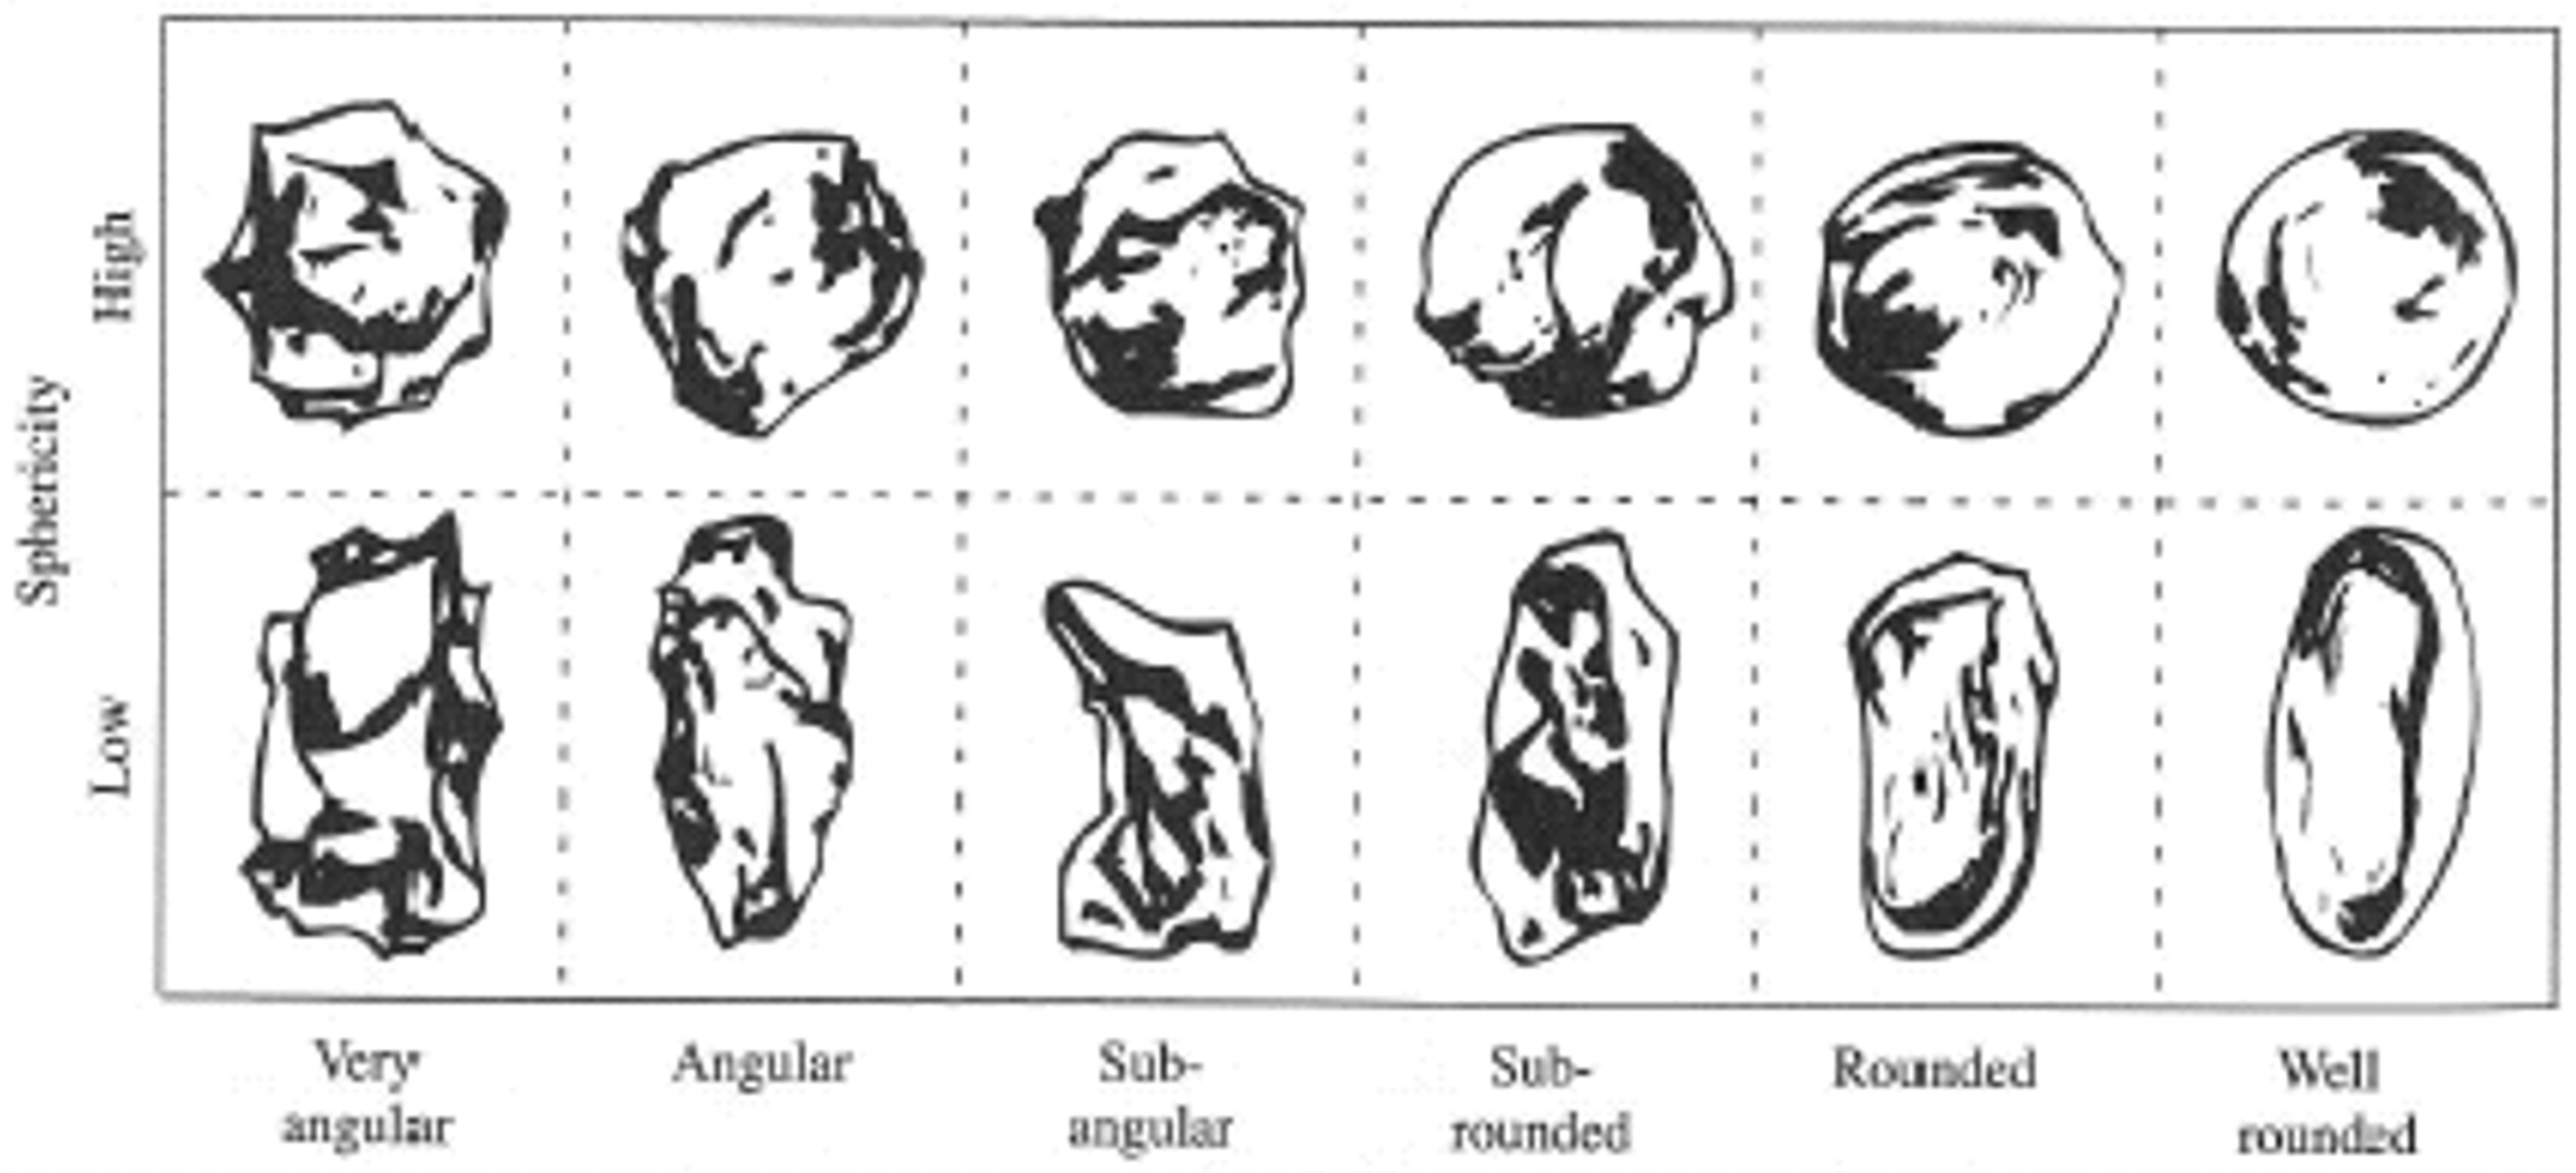
The characteristics of the sand are identified through the shape, size and percentage of the sand particles. The shape of the sand particles can vary from a ‘very angular’ to a ‘well rounded’ shape [
11] and is a key influence on the dynamic behaviour of the sand [
12]. There are two key variables used to classify sand particles, namely ‘roundedness’ and ‘sphericity’ [
13].
Figure 1 provides a pictorial representation of the various sand particle shapes. As much as roundedness is desirable in terms of the impact attenuation properties, angularity is not. When the particles are very angular, they tend to pack tightly as the sharp corners interlock and will resist the movement of the particles when subjected to an impact. In contrast, well-rounded particles tend to smoothly transit, or flow, to different locations upon impact [
14].
The amount of water retained on the sand (the sand moisture contents) and the compaction rate (sand density), also determine the sand surface dynamic behavior [
15,
16]. Accordingly, in a sport arena, where it is assumed the characteristics of the sand is controlled, the sand moisture content and density should be measured and compared against the safety benchmarks (The safety benchmark differs depending on the industry.) to avoid injuries. However, current safety benchmark, mainly those used in racing greyhound’s arena, are not backed-up with science and research and are solely based on the experience of the track curators [
2,
17].
An example of investigation on the effect on the sand moisture content and density on sports arena is a work conducted by Holt et al. [
3], where the effect of sand moisture levels and rates of compaction of two different drainage systems (Limestone gravel and permavoid
drainage), on the dynamic performance of synthetic equestrian surfaces (93.84% sand, 5.15% fibre and 1.01% binding polymer) was studied. They used the Orono Biomechanical Surface Tester (OBST) [
18], a 2.25 kg Clegg hammer [
19] and a 30 kg traction device equipped with a horseshoe. The OBST, which simulates the collision of horse forelegs and the ground, was dropped four times on each surface for each treatment. The Clegg hammer was dropped four times based on the protocol recommended by ASTM Standard [
20]. A 30 kg traction device, which was also used to measure the traction of the surface, was dropped once in four different locations of the test chamber for each treatment from a height of 200 mm.
Thiel et al. [
1] mainly focused on the dry sand and designed a penetrometer to measure the stiffness of beach dry sand in-situ. To validate their method, their results were compared with that of a in-laboratory study, where the penetrometer test were conducted on a sand box [
21]. It is claimed that their results are similar to the in-lab study and their method can be used to measure the stiffness coefficient of the sand, prior to a sporting event on the dry sand.
Force transducer, mainly the wearable sensor, are extensively used for gait analysis as they are cheap, easy to use, and user friendly [
22]. Therefore, inertial inertial measurement units (IMU) have been used in different applications, mainly in clinical setting for gait analysis [
22].
IMU technology can be also used to study the limb-surface interaction. In a recent studies conducted by the same author of this work, a single IMU was used to study the impact of different sports surfacing (grass vs wet sand) on the locomotion dynamics of galloping greyhounds [
4,
5,
6]. Details of the most recent work [
4] are discussed in the following sections. Worsey et al. [
16], also used IMU technology (9 degrees of freedom (DOF) inertial-magnetic sensors, incorporating an 16 G-accelerometer, gyroscope, and magnetometer) to compare athletes running over three different surfacing (running track, hard sand, and soft sand). The purpose of this work was to provide more insight on a previously observed fact that athletes alter their gait mechanics to accommodate different running surfaces [
23].
Mathematical modelling, mainly Spring-Loaded-Inverted-Pendulum (SLIP) models, firstly introduce by Blickhan et al. [
24] are extensively used for gait analysis in different fields of science and engineering. SLIP models are simple and easy to interpret, yet provide substantial information about the under-studied subjects [
24]. There are numerous off-the-shelf SLIP models, which one can modify based on their application. For instance, a SLIP model of a greyhound galloping on sport sand surfacing was modelled to study the effect of the sand surface with different moisture content levels and rate of compaction on the canine locomotion dynamics [
25]. The results showed that small changes in sand surface mechanical properties can significantly affect the amount of force acting on the greyhound hind-leg which well correlates with the high rate of hind-leg severe injuries in this industry.
It was discussed previously that the ideal track surface should have enough impact attenuation properties to damp the initial impact shock, as well as providing enough traction for a stable gallop [
26,
27,
28]. The surface with ideal mechanical properties has a low amount of energy loss and low impact acceleration (G
) when the foot comes into contact with the surface. The low energy loss, would also increase the performance of the animal in the race [
29].
The surface with high performance was associated with a higher risk of injuries. By contrast, the surface with impact attenuation properties tended to increase the muscular effort of the runner which affected their running performance [
2].
The low density of the sand or the rates of compaction are also associated with the low rates of injury [
30]. In practice, For sand sport surfacing, ’harrowing’ is suggested, which can reduce the density or the rates of surface compaction [
31]. However, a very low density surface may have a detrimental effect on locomotion efficiency as it affects the support needed for grip and propelling the body forward [
2].
Surface traction is another variable identifying a safe surface composition. High traction will increase the bending moment applied to the bones, mainly the tarsal bones, and increase the risk of injuries [
7]. However, not enough traction, usually seen in drier sands, will cause the surface not to sufficiently support the limb during the stance. Accordingly, as suggested by Holt et al. [
3], increasing the moisture content of the sand while keeping its density low would result in a surface ideal in both race performance and injury reduction [
3]. Overall, apart from acting as a supporting surface, the sand layer also acts as an energy absorbing layer to mitigate the impact shock. The optimal condition of the sand layer should have enough energy absorbing capacity (reflected as energy loss and contact time) while providing acceptable surface traction [
32,
33].
Contact time is another critical variable that affects the safety performance of the surface. The shorter the contact time, the higher the risk of injuries, because of an increased load rate to the musculoskeletal system [
34,
35]. Accordingly, this variable is considered as one of the primary safety thresholds in different applications such as playground surfacing tests [
36,
37].
The purpose of this work is to introduce methods to study the dynamic behaviour of athletic sand surfaces, with the aim of improving athletes performance while minimising the risk of injuries. The methods introduced here were originally designed for greyhound racing arenas but are adaptable to other sports such as horse racing [
3], beach relay and sand volleyball [
1].
2. Materials and Methods
2.1. A Drop Test to Study the Dynamic Behaviour of the Sport Sand Surfaces
It is discussed above that the sand characteristics contribute to the dynamic behaviour of the sand, mainly under impact loads. Below the sand particle sizes and percentages recommended for greyhound racing arena are given in
Table 1.
The sample was taken from a typical greyhound racing arena. The sample was then oven dried for 24 h based on the AS 1289 Part 2.1.1 Standard [
38]. As per the Standard, the sand sample should be heated up in an oven, between 105 to 110
for 16 to 24 h.
The sample was then loaded on the sieve shaker. The procedure adopted for this test was following the AS 1289 Part 3.6.1 2009 Standard [
38]. To do so a sieve shaker, model EFL 2000, was used. As per the Standard, the size of the sieve tray was selected from 4.75 mm to 75
m. The procedure was done as such the EFL 2000 were not overloaded. In the case of any sieve being overloaded, the overloaded sieve sample was further sieved into two or more portions. The sieve shaker was set to shake for a time duration in between 5–10 min so that the sand was completely separated according to their sizes. The same procedure was repeated for 6 samples of soil.
The calculations for generating the grading curve plots, which is based on AS 1289 Part 3.6.1 2009 Standard [
38] is given below Equations (1) and (2):
Once the percent retained is calculated. The cumulative percent retained for each sieve tray is calculated by adding the percent retained from the largest size sieve to the current size sieve, and then the percentage of the sand passing through the current sieve size can be obtained through Equation (
3):
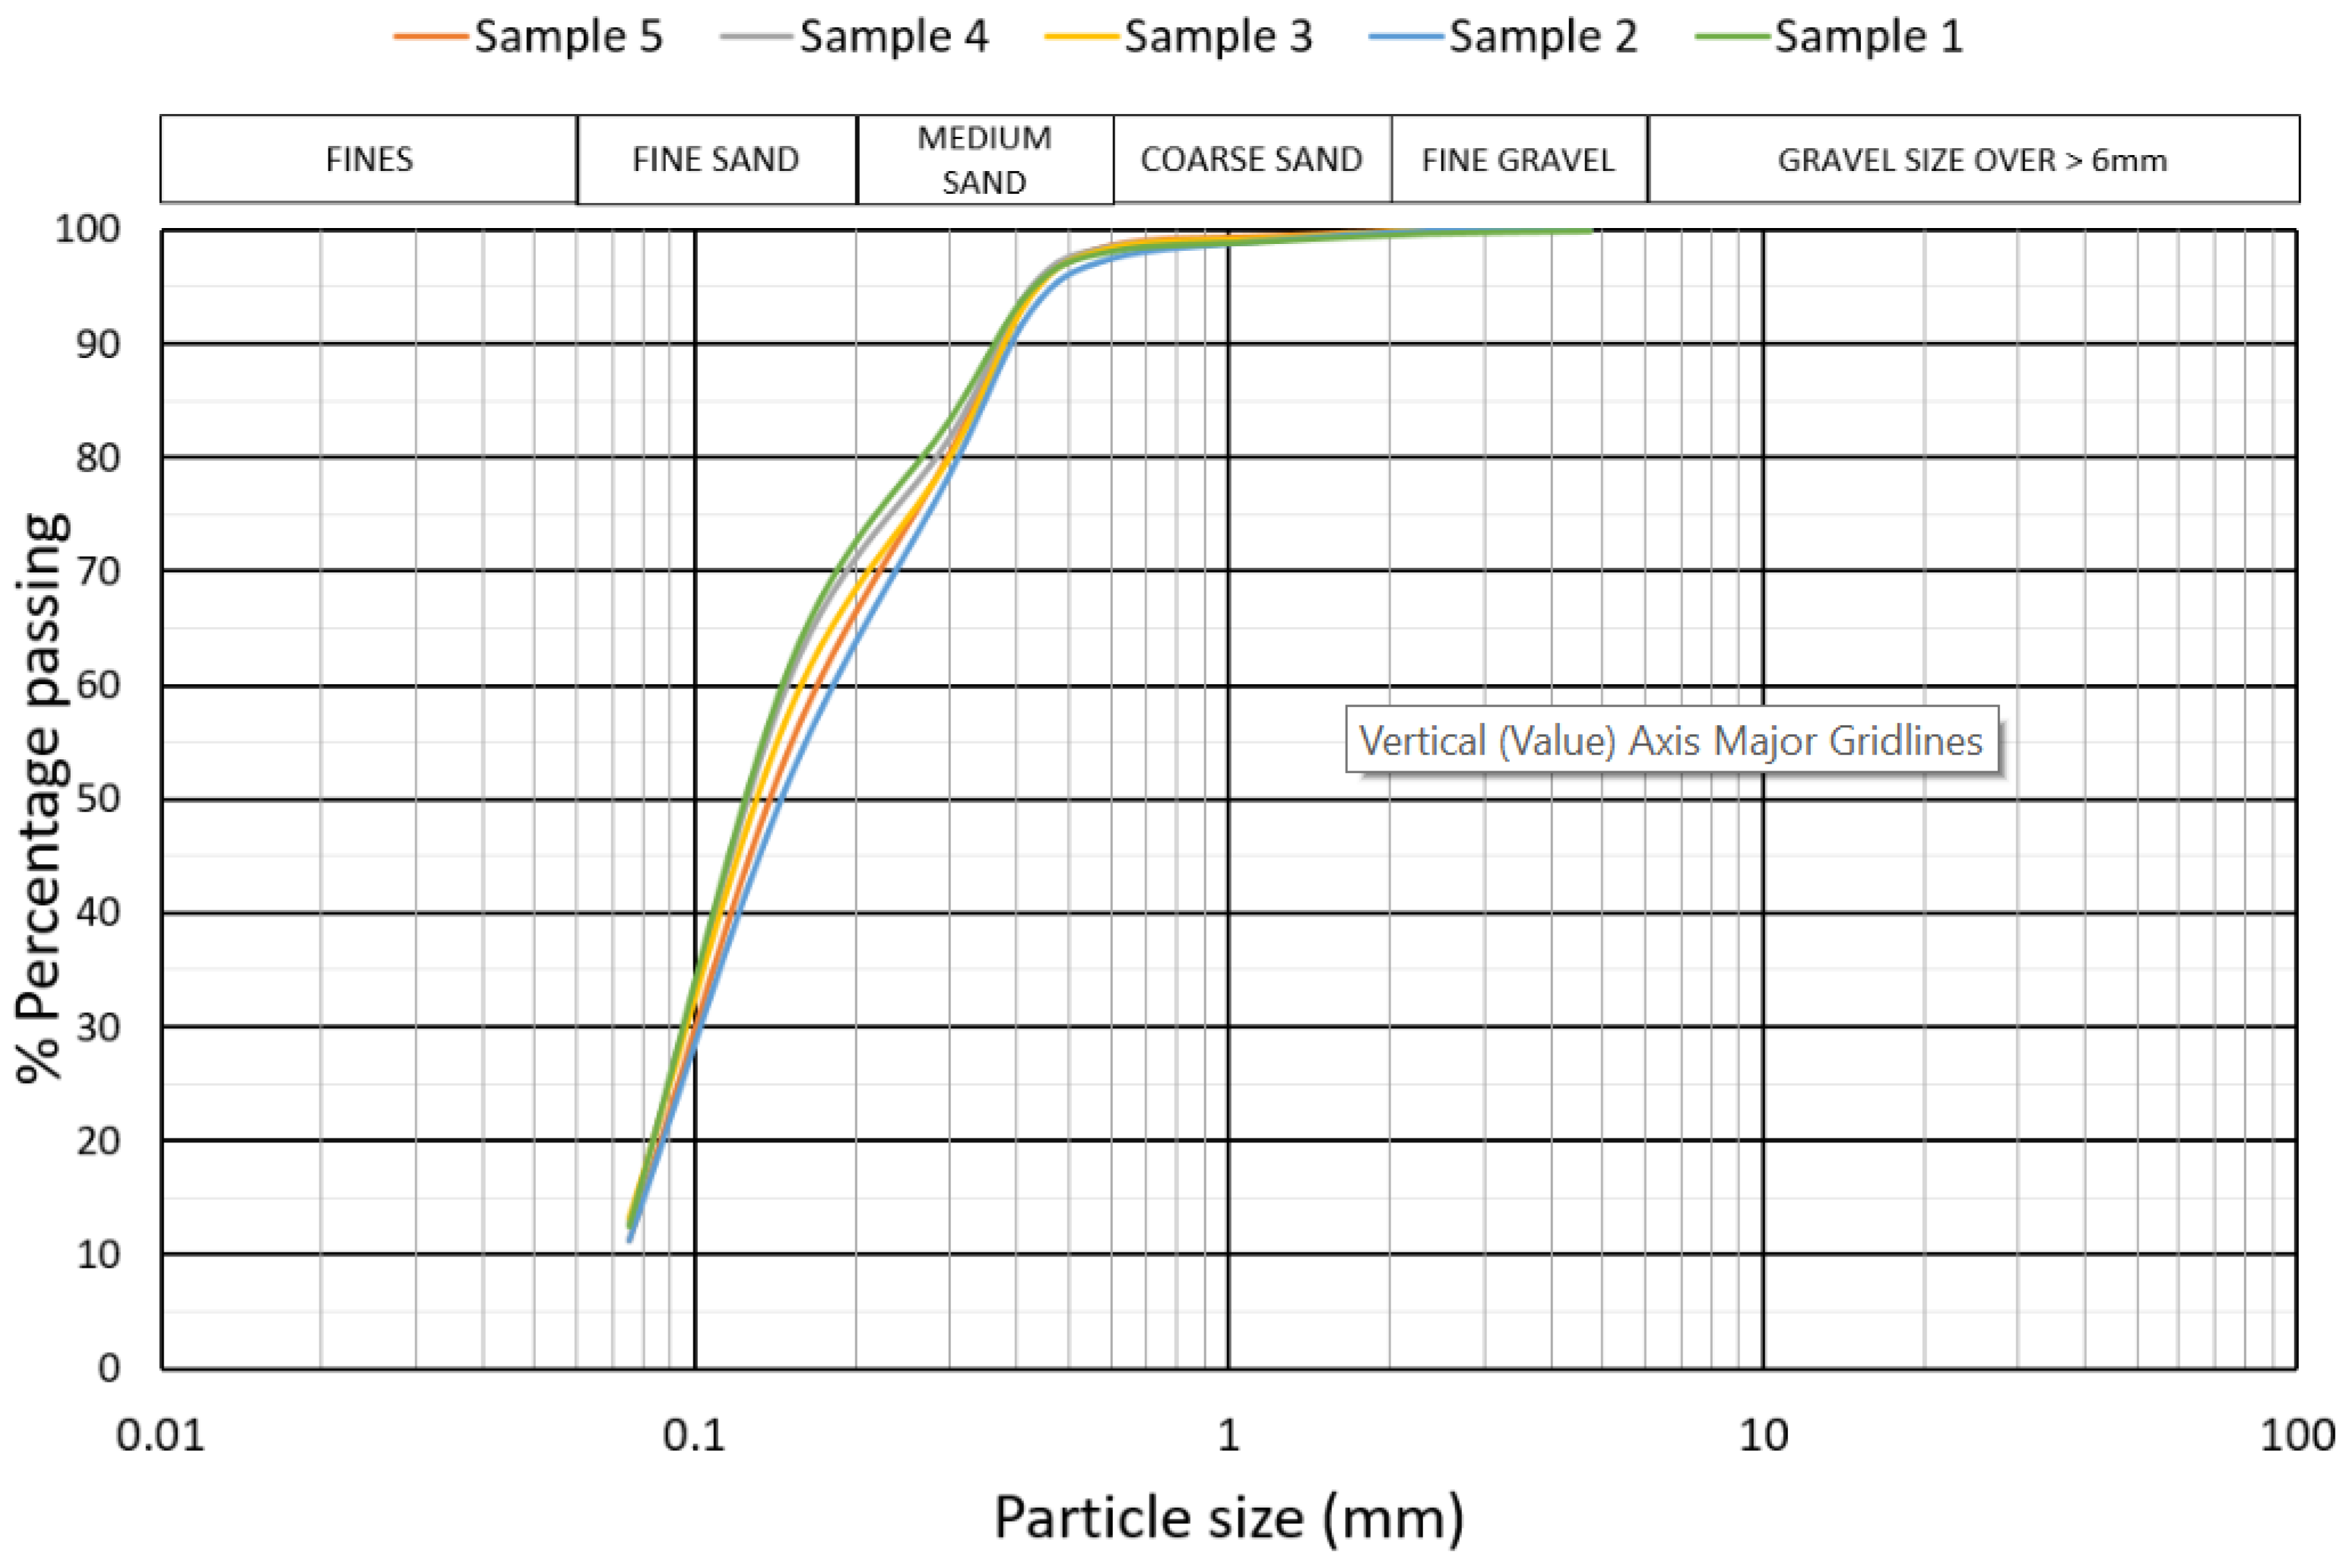
The sand grading curve is plotted and given in
Figure 2. The cumulative percent passing is plotted against the sieve size (in logarithmic scale).
The soil grading curve given above proved the fact that the soil used in the greyhound racing track is loamy sand, combination of sand with traces of clay [
39]. The slight difference in each test can be attributed to the loss of soil during the test and therefore caution should be taken while conducting the test.
The sand moisture content and compaction rate are two important parameters that alter the mechanical behaviour of the sand. To study the effect of these two parameters on the dynamic behavior of the sand, collected from a typical sport arena (in our case, it was collected from a typical greyhound racing arena), an impact test which complies with AS 1289 Part 2.1.1 Standard [
38], can be applied.
To perform the impact test, a conventional Clegg hammer was modified, by mounting two calibrated laboratory-grade Endevco high-G accelerometers. Adding the high-G precision accelerometers allowed a higher degree of experimental accuracy than that offered by the standard Clegg hammer. The reliability of the system was tested in previous studies on children’s playgrounds for impact attenuation of surfacing [
36,
37].
The dynamic behaviour of the sand sample was studied by analysing the impact data, namely the maximum acceleration (G
), the maximum rate of change of acceleration (Jerk) (J
), the impact duration (contact time), and the energy loss. Before treating the sand sample, it should be again air or oven dried. The AS 1289 Part 2.1.1 Standard [
38] is used to dry the sand sample. Based on the Standard, the sand sample was heated up in an oven, between 105 to 110
for 16 to 24 h.
The effect of three moisture levels—dry (12%), medium to ideal (17%), and ideal (20%); and three rates of compaction: low traffic (1.35 g/cm
), medium traffic (1.45 g/cm
), and high traffic (1.55 g/cm
), on the dynamic behaviour of the sand sample, were studied. The density of the sand to replicate the traffic condition of the surface was previously used by Holt et al. [
3].
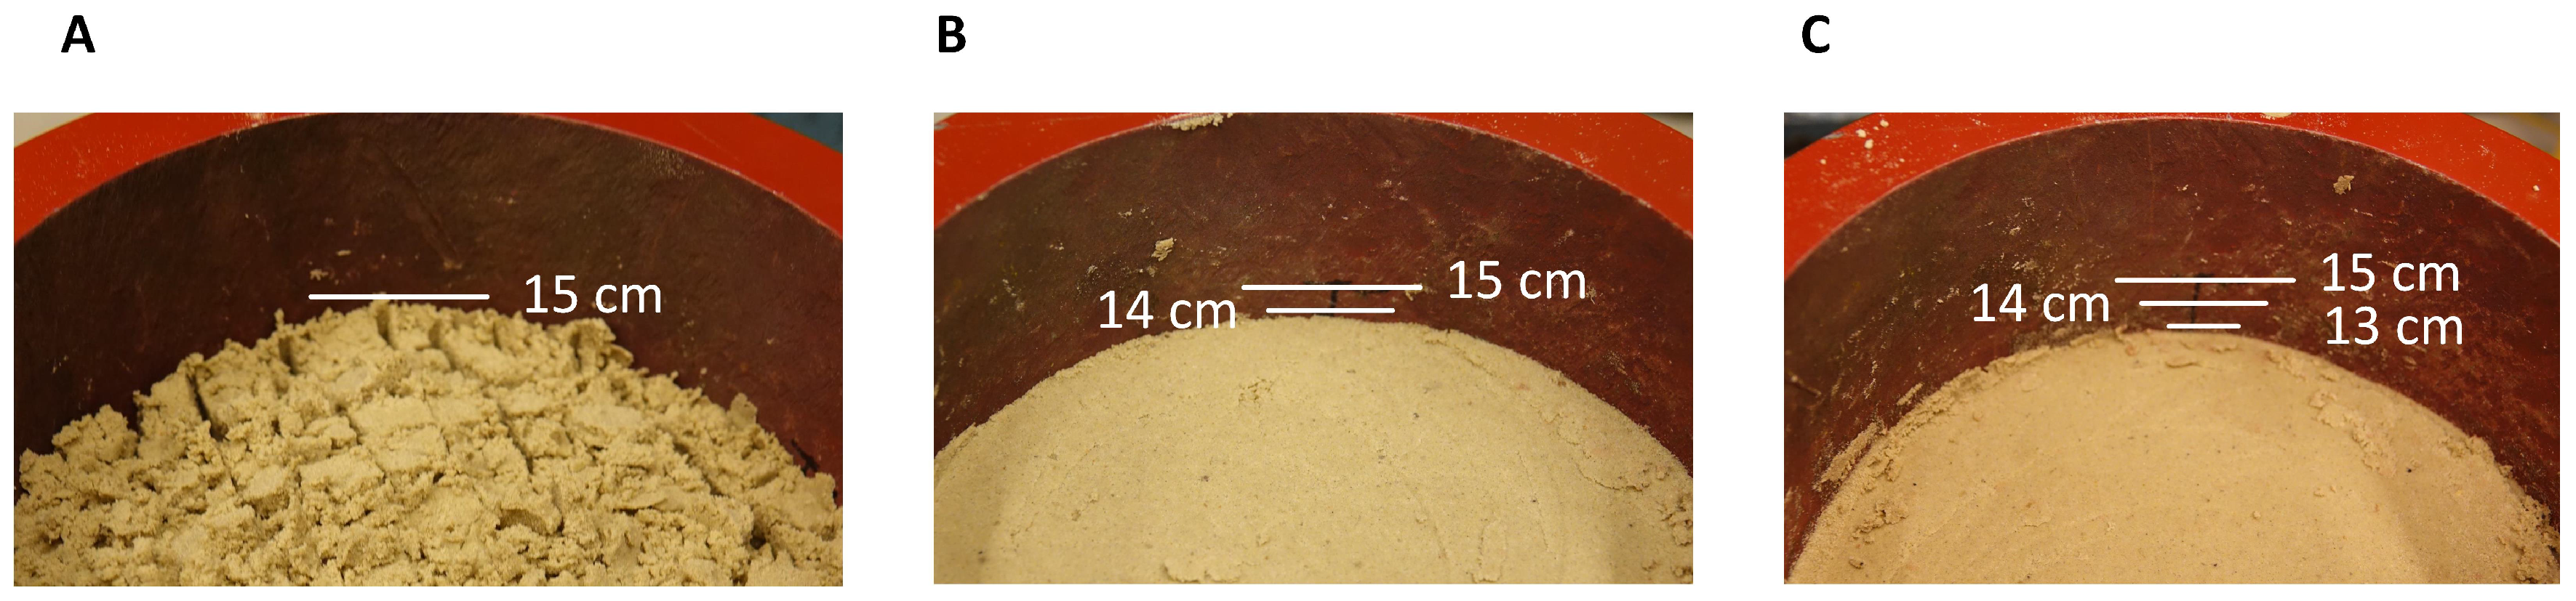
For all three conditions, we used a cylindrical container with an inner diameter of 15.6 cm. The sand was filled at 3.0 cm increments until reaching the depth of 12.0 cm. The applied tampering here was manual. Preferably, the tamper should be equipped with an accelerometer which can provide a measure of the applied force. However, achieving a certain depth was the only possible control we could apply. The average of sand density (the mass of the sand sample divided by its volume) for the simulated traffic conditions was also calculated and given as follows:
Low traffic condition: The top 3.0 cm layer was raked. The average of sand sample density for all moisture contents was 1.35 g/cm
. This traffic condition is pictured in
Figure 3A.
Medium traffic condition: The top 3 cm top layer was struck with a tamper to achieve the depth of 14 cm. The average of sand sample density for all moisture contents was 1.45 g/cm
. This traffic condition is pictured in
Figure 3B.
High traffic condition: The top 3 cm top layer was struck with a tamper to achieve the depth of 13 cm. The average of sand sample density for all moisture contents was 1.55 g/cm
. This traffic condition is pictured in
Figure 3C.
After preparing the sand sample, an impact attenuation test, which complied with the ASTM-F3146 Standard [
20], was conducted from three different heights, namely: 400 mm, 500 mm and 600 mm. Based on the Standard, the test was repeated four times from each height, and the maximum value was reported that is, the maximum value for G
, J
and contact time. After the fourth drop at each height in the same location, the sand sample was reconstructed to avoid the effect of over compacting of the lower layers on the results. The impact attenuation data were then post-processed using LabVIEW software and plotted in MATLAB R18. An ANOVA test (two-factor with replication) was conducted. Values of
p ≤ 0.05 were considered statistically significant. The experimental setup is illustrated below in
Figure 4.
2.2. Pre-Surface Condition Data to Test Whether There Is a Correlation with Injuries
It is argued above that the sand moisture content and density affect the dynamics behavior of sports sand surfaces. It is also seen in a mathematical model of greyhounds that subtle changes in these two values significantly change the forces exposed to animals limb (mainly the hind-leg) [
25]. Accordingly, measures should be in-place to correlate the sports sand surfacing moisture content and firmness with the probability of the injuries, which is also advised for other sport arenas, such as horse racing [
40].
In Australian greyhound racing industry the sand moisture content and firmness are measured using a portable moisture meter (The instrument to measure track moisture content is typically the TDR 350 Soil Moisture Meter which measures the Volumetric Water Content of the sand as a percentage of retained moisture.) and penetrometer device (The instrument to measure track firmness is usually the FieldScout TruFirm turf firmness meter. The unit on measurement is depth of travel in either inches or mm.). Twenty-four readings are taken at 8 equidistant positions around the track and 3 locations across the track. The three locations across the track are 0.5 m from the inner rail, middle of the track and 0.5 m from the outside rail. These data mUst be collected pre-race, based on the compulsory minimum standards. The moisture content range should fall within the 26.0–33.6%. The sand firmness value should fall within the sand firmness range 15–40 mm. Both values are subjective to the type of the sand used in the sport arena.
In this section, surface condition data for a de-identified greyhound racing track are analysed for a duration of one year, July 2019 to July 2020, when an increase in the rate of catastrophic incidents was observed. The hypothesis was that the moisture and firmness range would not fall within the recommended range.
Moreover, any inconsistency on the track surface is dangerous and can cause an injury [
8,
26,
28] as the greyhound is not capable of adjusting its gait based on changing surface conditions [
27]. Apart from assessing whether the moisture and firmness data fall within the recommended range, the fluctuation between inside and middle track readings should be calculated at different vicinity of the track. It is hypothesised that high fluctuation in theses values suggests irregular surface properties, which might contribute to injuries.
The injury heat-map (the approximate locations on each track for each race distance where clusters of injuries occurred) are generated, based on the injury data provided from the industry, race video and the Stewart reports, and given in the later section. This would assist in finding a correlation between the surface condition data and locations of the track with high rate of injuries.
2.3. Use of Accelerometry to Study the Limb-Surface Interactions of Sprinters
Accelerometry or in other words use of accelerometer to record the locomotion dynamics of athletes are gaining attention as they are cheap, user friendly and provides fundamental information about the gaits. They are usually attached to subject joints and fused with each other for post-processing. In this section, the most recent accelerometry study on racing greyhounds is reviewed [
4].
To study the effect of surface compliance on the galloping dynamics of racing greyhounds, an IMU, equipped with tri-axis accelerometer (sampling rate of 185 Hz, was used on two tracks), was used to measure the associated galloping accelerations in racing greyhounds. It was hypothesised the greyhound galloping dynamics are different on different surface types (sand surface vs grass surface).
The Anterior-Posterior (fore-aft) and Dorsal-ventral signals (vertical) acceleration signals, recorded via the IMU, were analysed, to see whether the surface type affect the locomotion dynamics of greyhounds. To do so, signals of galloping on straight sections of the sport arena, are compared with each other.
The recorded Dorsal-Ventral acceleration due to hind-leg strikes was more than triple that of the fore-leg strikes (15 G vs. 5 G). These results were in consistent with the role of hind-legs in powering the locomotion as well as their higher rates of injuries than fore-legs.
The mechanical properties of the sand and grass surface, mainly the impact deceleration (G
) measured via a Clegg hammer of the sand surface were three times higher than that of the grass track [
4]. Accordingly, it was expected to see higher acceleration on running on the sand surfacing than the grass one. However, the IMU data (the average of peaks of dorsal-ventral and anterior-posterior acceleration) for sand versus grass surfaces were not significantly different.
There might be different reason associated to the observed results that is, not significant difference in IMU signals despite the significant difference on surface type. Firstly, the IMU in this study is mounted on animal’s neck (
Figure 5a) and the signals would be damped while traveling through the body of the animal. Ideally, the IMU should be attached on animal’s foot to sense the real impact load. Secondly, the applied signal processing method in this work are those usually used for linear time-series signals. It is hypothesised that applying nonlinear-time-series-analysis would identify different features in galloping over sand and grass. These methods are currently under the investigation by the same author of this work.
2.4. Results and Discussion
2.5. A Drop Test to Study the Dynamic Behaviour of the Sport Sand Surfaces
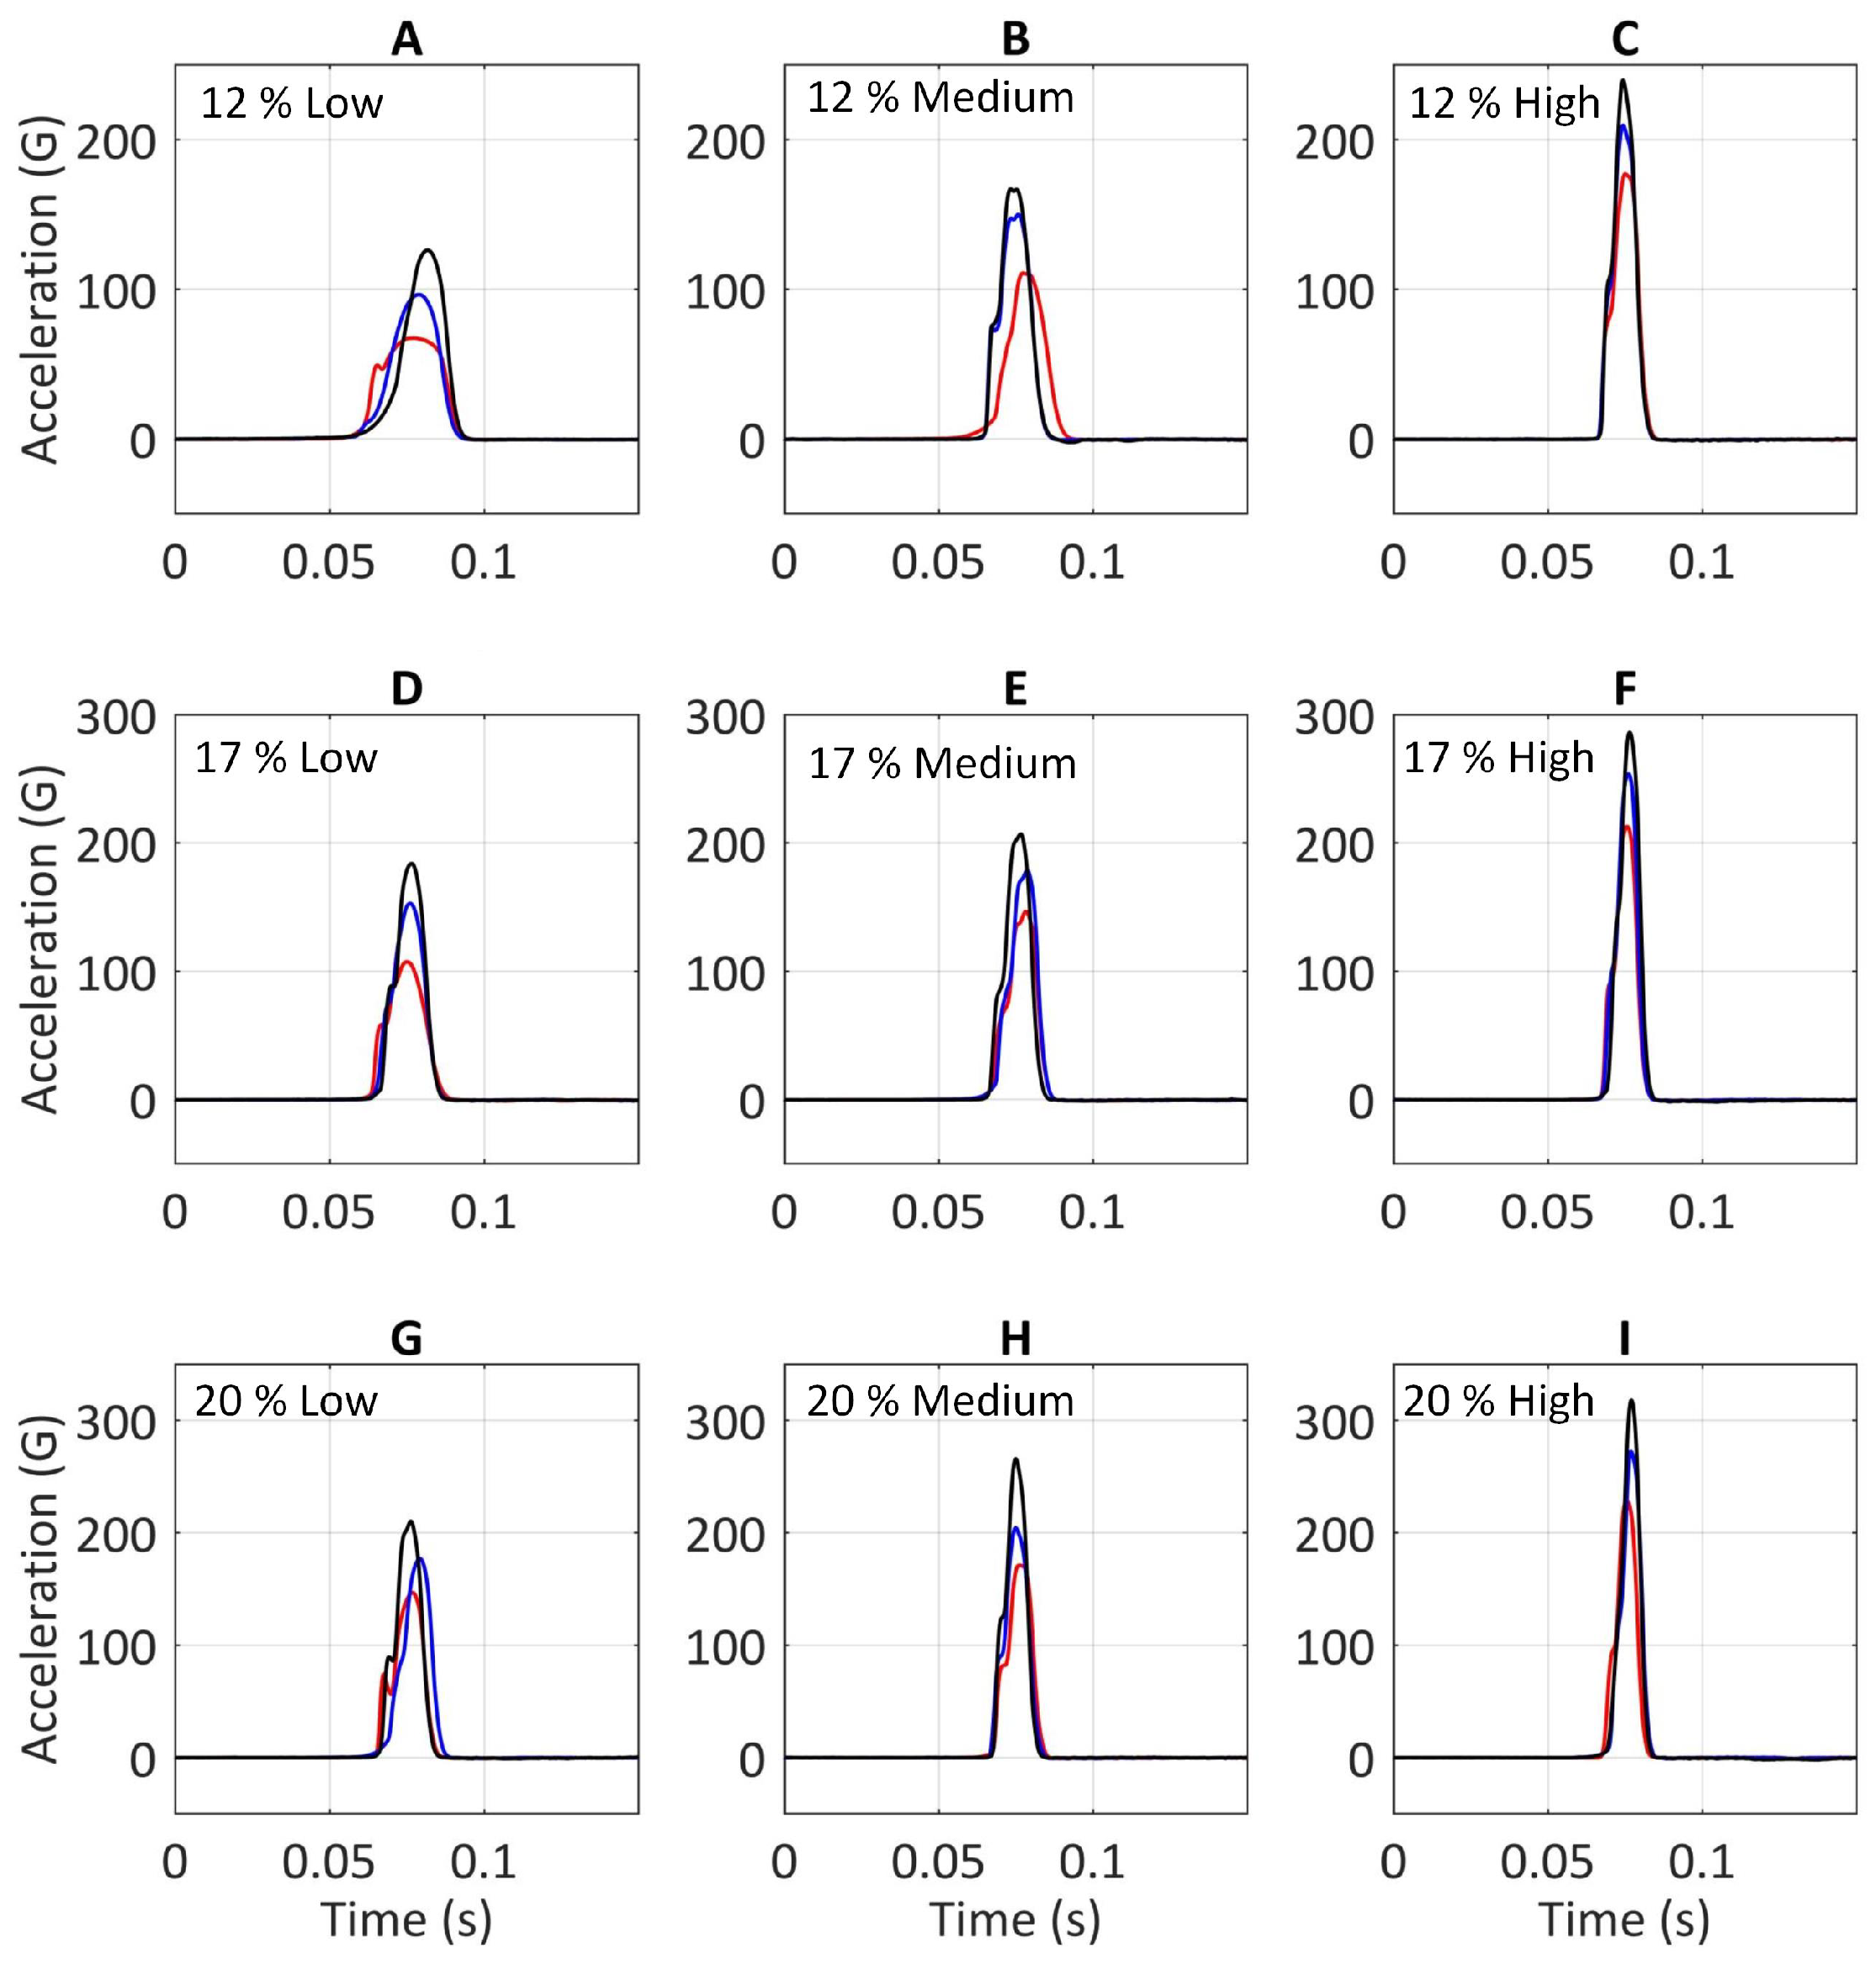
Figure 6A–I shows the impact acceleration versus time of the sand sample with three different moisture levels and rates of compaction. The peak of each impact acceleration is the maximum acceleration (G
). The red, blue and black lines represent 400 mm, 500 mm and 600 mm drop heights, respectively.
The main observation from
Figure 6 and impact data given in
Table 2 is that, regardless of the moisture content, increasing the compaction rate of the sand sample, has resulted in an significant increase in the G
[
p = 0.0003 F = 12.9], J
[
p = 0.00001 F = 22.6] and Contact time [
p = 0.023 F = 4.6].
The same effect is also seen when the moisture content is increased (while the sand density is kept constant), mainly when the moisture level increased from 12% to 17%, which was statistically significant [p = 0.054 F = 4.21].
Increasing the drop height increased the velocity at the time of the impact and the higher the initial impact velocity, the higher the value of the G
. This reveals the rate dependency of the sand [
29].
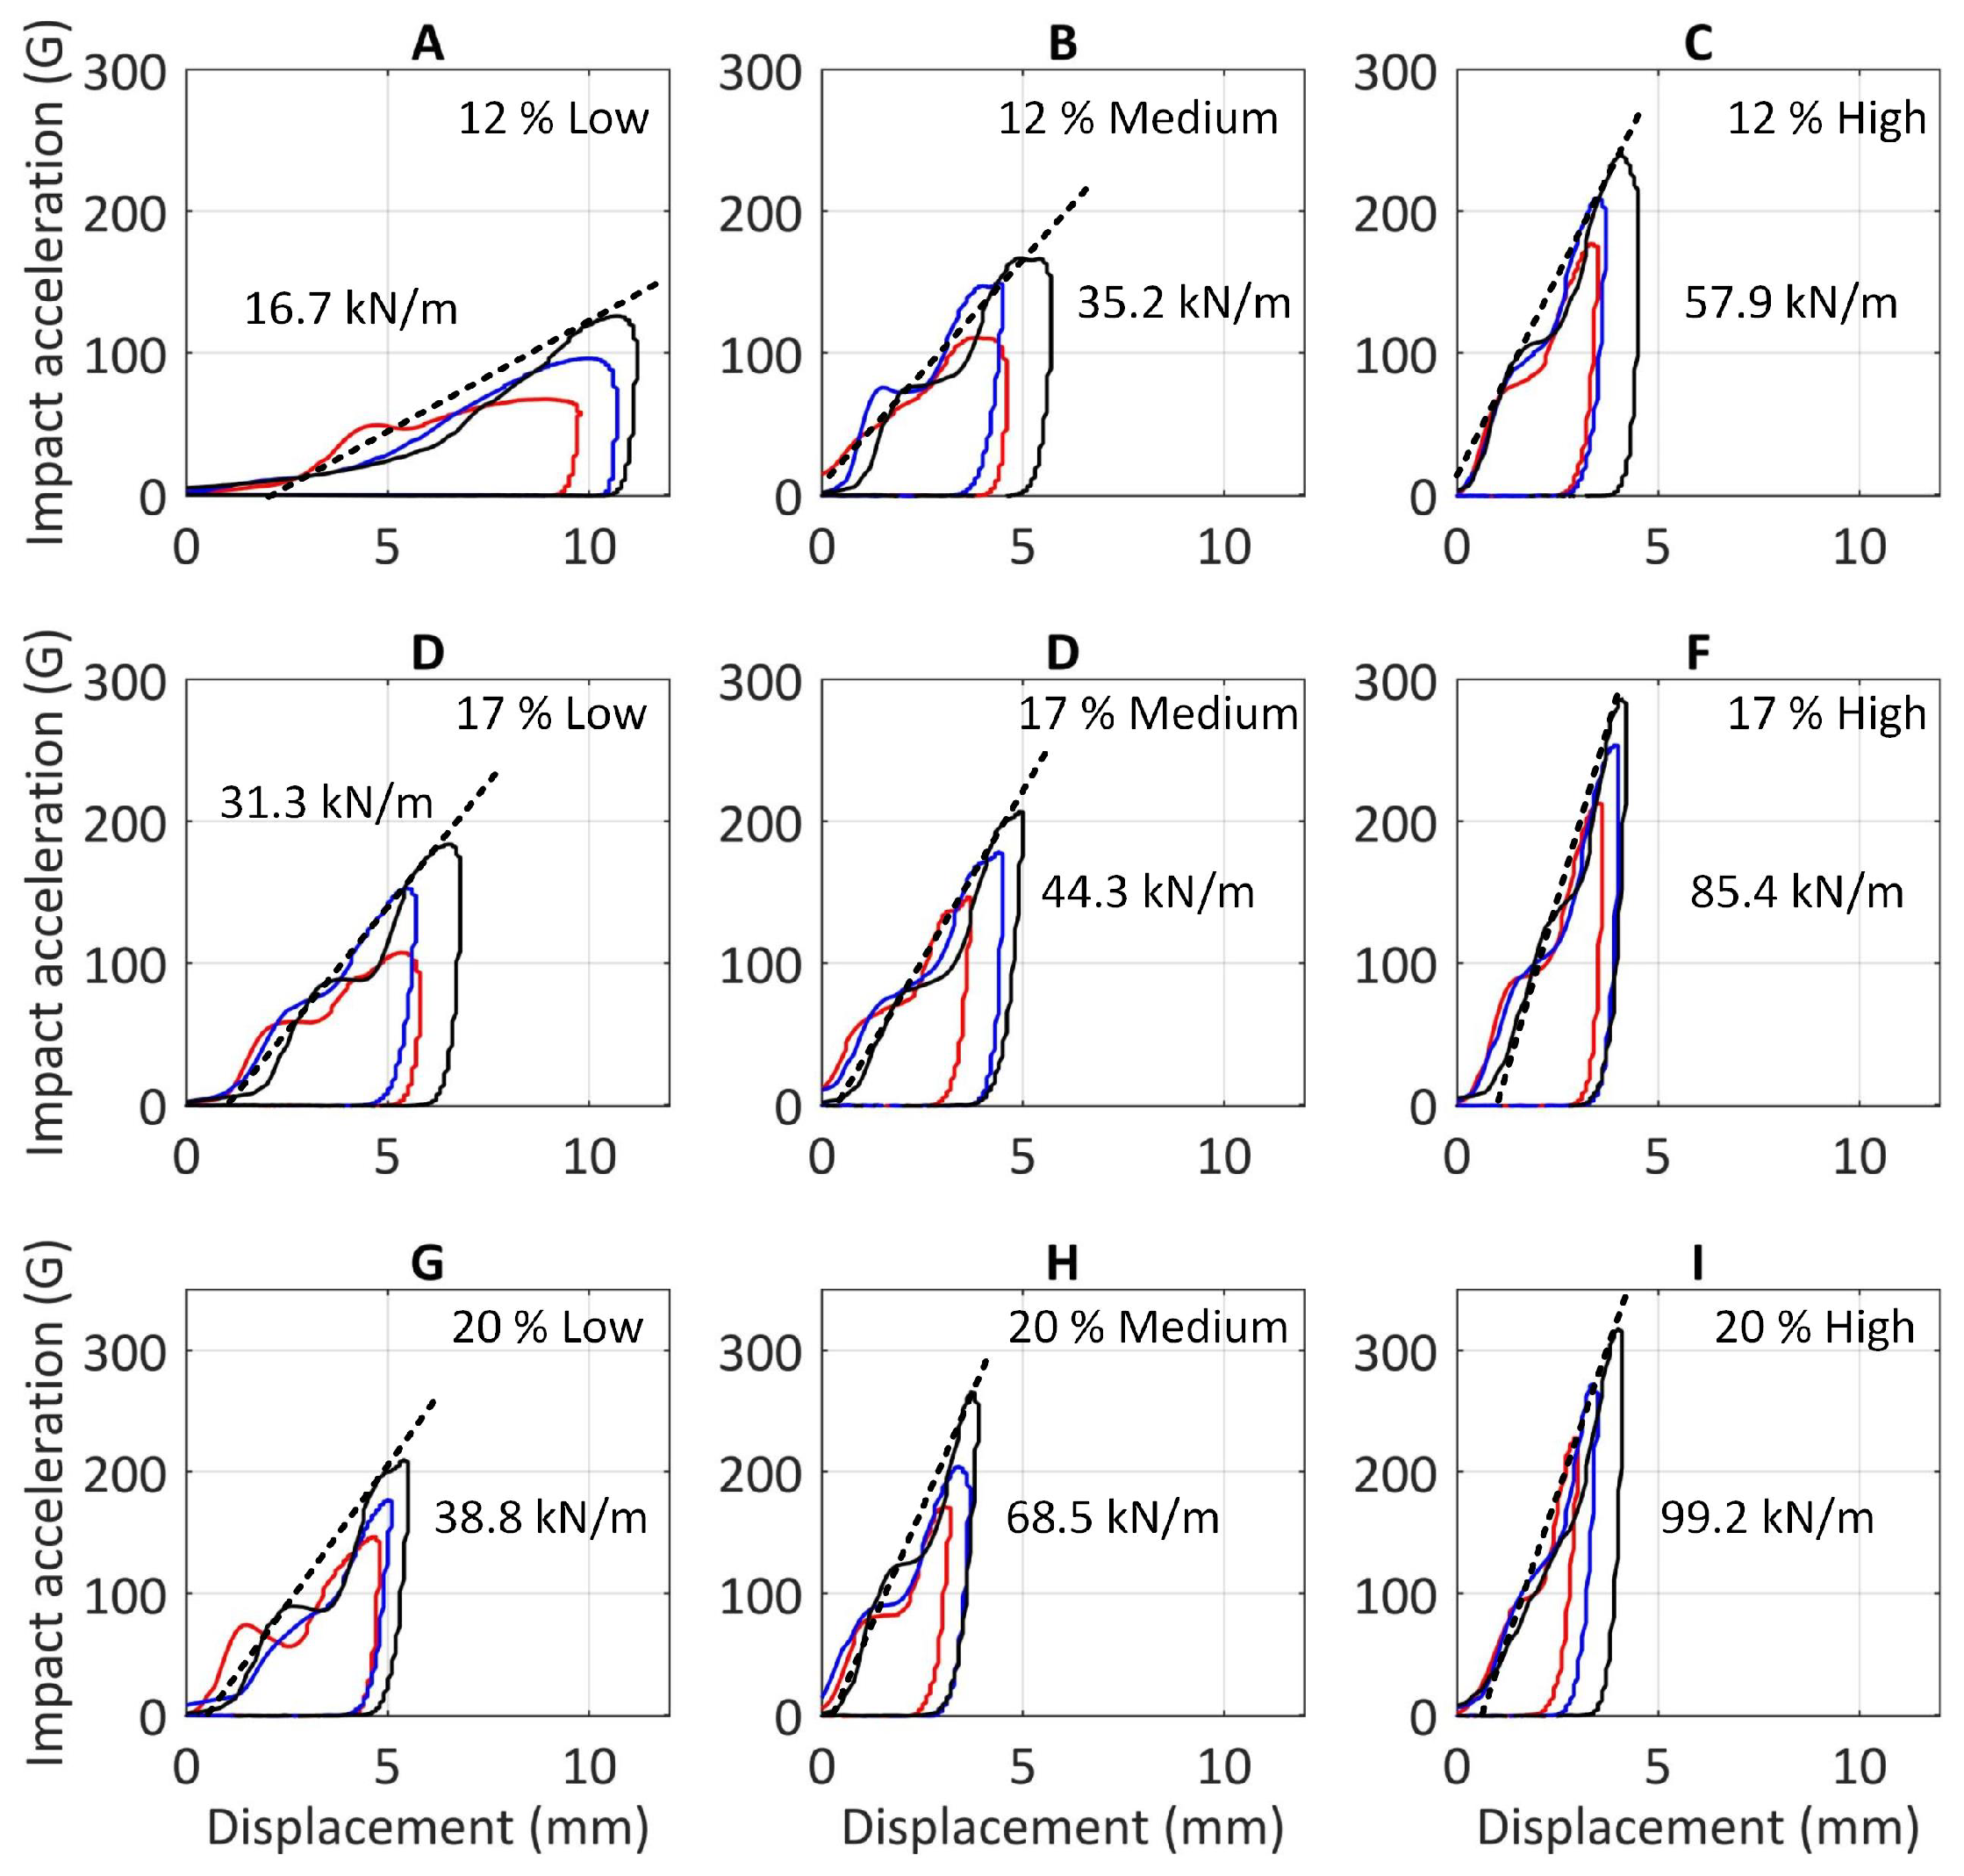
Figure 7A–I shows load-deformation plots of the sand sample with three different moisture levels and rates of compaction. The slopes of the fitted dashed lines to the loading phases of the superimposed plots is the stiffness coefficient of the sand sample (based on the method adopted by Aerts & Clercq [
42] in analysing the performance of athletic shoes with hard and soft soles). The red, blue and black lines represent 400 mm, 500 mm and 600 mm drop heights, respectively.
To see whether the moisture content affects the stiffness coefficient of the sand, sand sample with the same density but different moisture content were compared with each other. It is observed that increasing the moisture contents (Here after moisture content) within a 12–20% range, increases the stiffness coefficient.
In the low traffic condition, this increase is 87% when the water content is changed from 12% to 17%, and only 24% when it is changed from 17% to 20%. In the medium traffic condition, this increase is 26% when the water content is changed from 12% to 17% and 55% when the moisture content increases from 17% to 20%. Similarly, in the high traffic condition altering the moisture content from 12% to 17% increases the stiffness by 47% and increasing the water content from 17% to 20%, increases the stiffness coefficient by 16%. This behaviour suggest there is a nonlinear positive relationship between the moisture content and the stiffness coefficient.
To see whether the sand density affect the stiffness coefficient of the sand sample, the samples stiffness coefficient are compared with each other while keeping the moisture content constant.
For a sand sample with 12% moisture content, the stiffness coefficient increases up to 95% and 84%, as the rate of compaction is altered from the low to medium traffic condition and from medium to high traffic condition, respectively. For a sand sample with 17% moisture, this increase is up to 41% and 92%, as the sand samples are compacted from the low to medium traffic condition and from the medium to high traffic condition, respectively. For a sand sample with 20% moisture content, this increase is up to 76% and 45% increase, as the sand samples are compacted from the low to medium traffic condition and from medium to high traffic condition, respectively.
Increasing the sand density increases the stiffness coefficient of the samples. This is because when increasing the sand density, the interlock between sand particles will increase, hence increasing the stiffness [
43].
The moisture content and traffic conditions of the sand samples, G
, J
, contact time (ms), energy loss (by calculating the area under the load-deformation plots), and the calculated stiffness coefficients (K), are tabulated in below
Table 2.
In the provided results in
Table 2, the contact time was not affected by the moisture level of the sand samples, but it significantly decreased with increases of the density of the sample. Thus, low to medium density of the sand sample was found to provide the favourable range of contact time with regards to injury prevention.
It is observed that altering the moisture content, significantly increased the G and J with no substantial change seen in the contact time. Moreover, the rates of compaction significantly increased all the impact data. It is also argued that the high G and J and short contact time were associated with high injury rate. Accordingly, comparing all the impact data it seems that the sand sample with 20% moisture content in a low traffic condition resulted in the most favourable behaviour with regards to both the injury prevention and race performance. The sand sample in this condition had the lowest energy loss compared to all other cases. The contact time was also in the favourable range as mentioned above. Finally, the G and J values were relatively low.
2.6. Use of Pre-Surface Condition Data to See If They Correlate with Injuries
The first step to analyse whether sand moisture content and firmness data correlate with the injury, for those race events with catastrophic incidents, the range for moisture content and the range for sand firmness were checked to see if they all fall within the recommended range. It is hypothesised that sand moisture and firmness range should not fall within the recommended range.
The second step to analyse whether sand moisture content and firmness data correlate with the injury, the fluctuation between the inside and middle track data (both moisture content and firmness values) should be calculated and compared with the overall fluctuation between the inside and middle track readings. It is hypothesised that any noticeable fluctuation between the inside and middle track readings contribute to injuries. To test this hypothesis, the injury location of the catastrophic incidents, determined using the injury heat-map given in
Figure 8, were compared with high fluctuation arenas and the results are provided below.
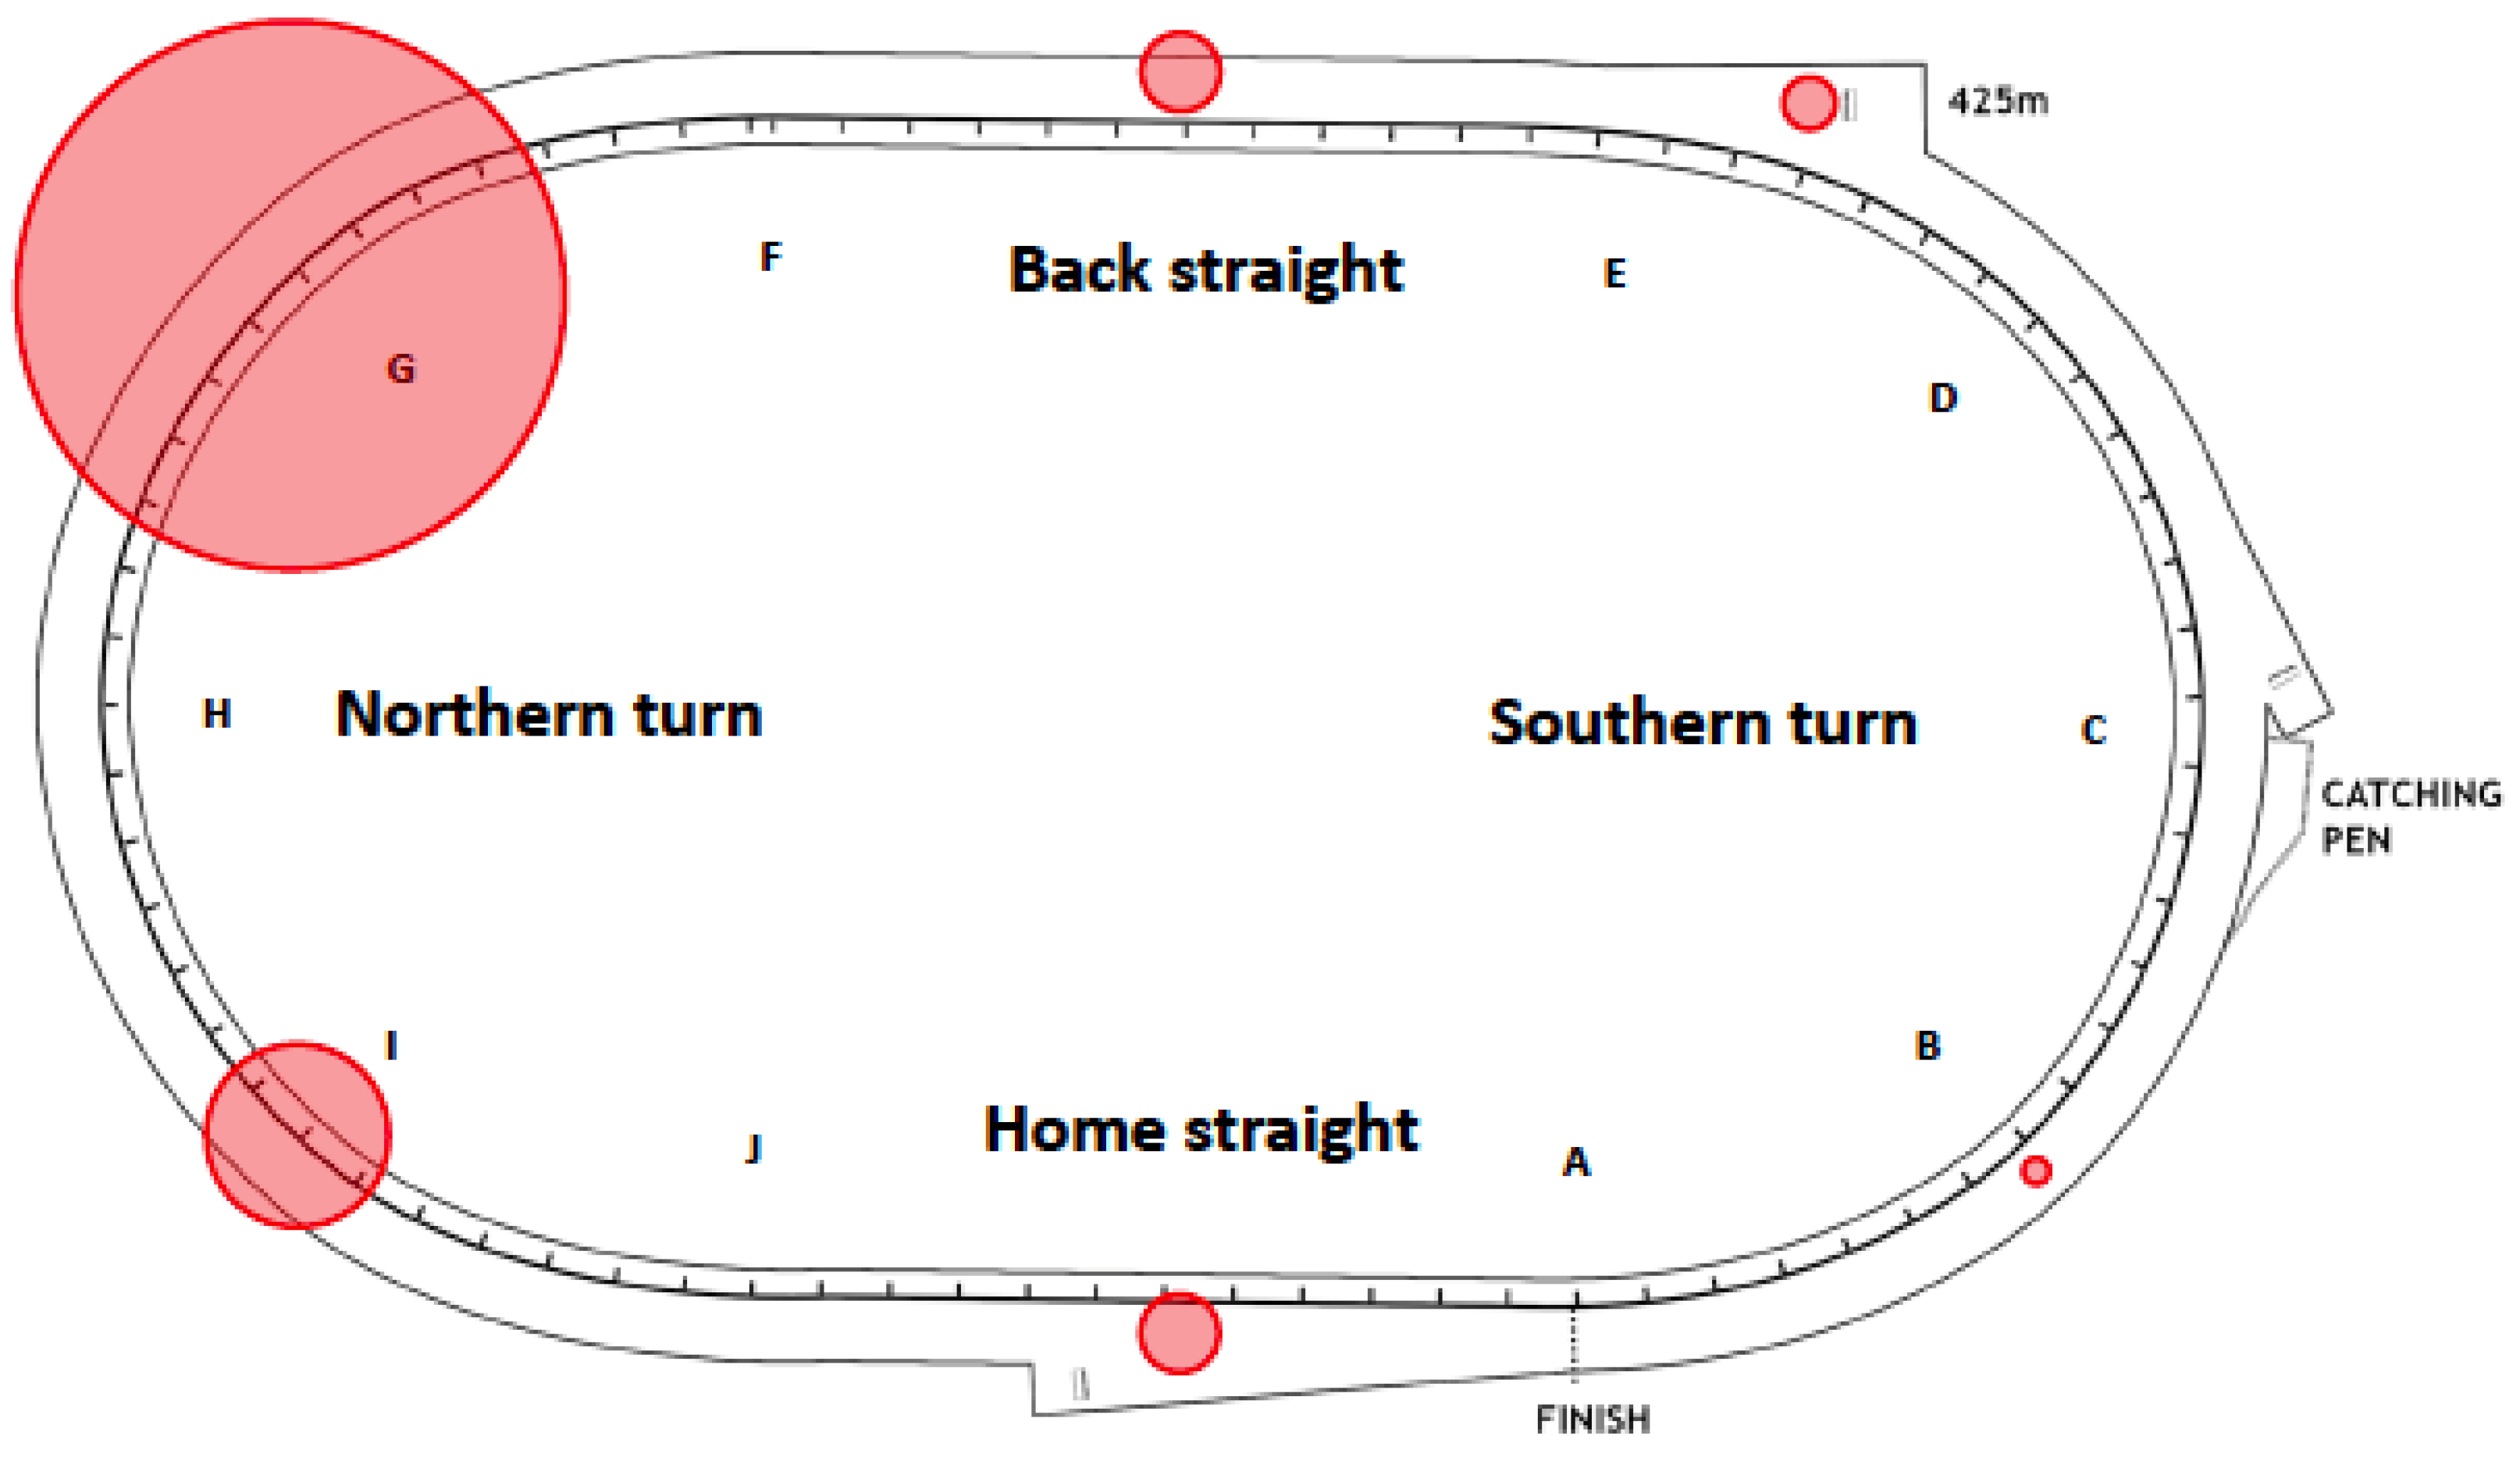
A de-identified track heat map is presented in
Figure 8. This heat map was generated using race videos, the Steward’s reports and the injury data recorded by on-track veterinarians. The red circles on heat map represent the number of injuries at each specific injury location around the track. The larger the radius on the heat map, the higher the injury rate. It should be noted that only catastrophic incidents resulting in death were used to generate the injury heat-map.
The injury location, the sand surface moisture content range, the sand firmness value range, and the high fluctuation vicinity on the track are given in below
Table 3.
Comparing the injury heat-map with
Table 3 the injury heat-map correlates with the high fluctuation areas. The fluctuation between inside and middle track moisture of approximately 80% of the catastrophic injuries had the highest percentage at the injury vicinity among other locations of the track; The sand moisture content of approximately 80% of the races with catastrophic injuries fell within the recommended range. The sand firmness data of all (those that were available) of the races with catastrophic injuries fell within the recommended range.
Having high fluctuation between the inside and the middle track surface properties would expose trailing greyhounds to a running surface with different properties as they tend to jostle and change direction to avoid bumping and checking. Any sudden change in the surface condition will contribute to injuries.
The main maintenance practice which can assist in having a homogeneous surface condition is called harrowing. The depth and frequency of the harrowing practice is subjective to the sport arena, frequency of races and trials, season of the year, weather condition and rain fall, and more importantly, should be accompanied with an appropriate irrigation management. As discussed above, the sand moisture content and density are two important factors affecting the dynamic of the race track. It is also seen that, a relatively wet (20% for the under-studied sand in the laboratory condition) sand with low-traffic condition (3 cm raked top layer) was ideal in terms of both performance and safety. Accordingly, it is recommended that the harrowing should be conducted on a regular basis and with sufficient depth on a surface which is consistently irrigated through an appropriate irrigation system.


