1. Introduction
The role of nonlinearity in structural vibration is becoming increasingly important for modern lightweight and flexible structures, and vibrations involving more complex phenomena such as backlash and freeplay [
1]. The experimental characterisation of a nonlinear structure is a challenging process, particularly for multiple degree of freedom and continuous structures. Despite attracting much attention from academia, there is much work needed to create processes that can achieve this in timescales suitable for industry, in a manner comparable to that achieved using modal analysis for structures where linearity can be assumed [
2]. If this is not addressed, there is a danger that the increasing power of analytical and numerical models to predict nonlinear behaviour will not be matched by systematic means of validating these models, limiting the extent to which these models can be used in critical applications such as aerospace.
Some consensus on how a nonlinear testing and identification procedure should be structured is emerging [
3,
4], and this general process can be summarised in the following stages:
Detect the presence of nonlinearity, and establish the need for a nonlinear approach.
Characterise the form of the nonlinearity (This may also include finding its location within the structure [
2,
5]).
Identify the coefficients that parametrise nonlinearity to give an optimal fit to experimental data.
Evaluate the quality of the fitted model and make predictions with it.
Stage 3 of this process can be particularly time consuming, and considering the test procedure itself is key to making the identification more efficient. The aim is a testing procedure which, when aligned with a suitable identification method, yields the best possible model, with the minimum time and effort. However the method must remain robust in the presence of as many nonlinear phenomena, such as bifurcations, non-unique responses to forcing, aperiodic and chaotic responses as possible.
Current approaches include subspace methods using broadband signals [
6]. Another approach is Nonlinear Phase Resonance Testing, which seeks to directly observe underlying conservative Nonlinear Normal Modes (NNMs), detected by choosing a forcing amplitude and frequency that achieves a quadrature phase based on the fundamental harmonic [
7,
8,
9]. Typically, the excitation frequency is varied whilst the forcing amplitude is kept constant, until the required resonance condition is achieved This method is augmented with a resonant decay test stage, where the manifold of the damped NNM is observed as the amplitude decays to zero [
10].
Many other methods are based on what is referred to herein as a ‘pointwise’ approach. This consists of capturing a series of discrete data points, each taken from an observed steady state of forced vibration of the system under consideration. The most widely used of these is the stepped sine method, which consists of exciting the structure with a harmonic force with given amplitude at a series of different frequencies, in order to construct a pseudo-FRF of the response (Note that this is not a true FRF because it is not independent of response or forcing amplitude). This has been shown to work well in many cases [
11], and gives results that are easy to interpret. However, it can be time consuming to resolve a desired force amplitude to sufficient accuracy; this usually requires multiple iterations of a feed forward control method. Furthermore, it is typically necessary to run sweeps in both increasing and decreasing directions of frequency to reveal multiple responses. The process also can be particularly slow in the vicinity of bifurcations, in the authors’ experience. A further issue with this method is that there is no guarantee that a particular amplitude of forcing will be sufficient to show significant nonlinear effects, and several sweeps at different amplitudes may be necessary to capture sufficient data.
The introduction of feedback control has opened new possibilities, with the advent of Control Based Continuation methods. Here, feedback control allows stabilisation of unstable responses and prevents issues such as unwanted drop down events. An algorithm seeks a reference response signal that requires a control signal within a tolerance of zero, so that the feedback control can be said to have a non-invasive effect on the structural response [
12,
13,
14,
15,
16]. The approach can be adapted to make it seek an NNM response of the underlying structure [
14], or in the presence of modal reactions it can trace out a region of responses through multiple sweeps in terms of forcing amplitude, which are applied at multiple frequencies [
15].
Another approach, which has been adapted from methods in electrical engineering, uses a Phase Locked Loop (PLL) control strategy to ensure that the response remains in quadrature with the forcing [
17]. The phase controller ensures that the phase remains in resonance while the amplitude is varied. The combined controller and experiment effectively become an autoresonant system at an NNM response of the underlying system, and the frequency can be extracted from this response.
A further important classification in experimental methods is in their approach to higher harmonics in forcing and response. In a shaker driven vibration experiment on a nonlinear structure, higher harmonics are a natural consequence of the nonlinearity; even if the voltage signal to the shaker is monoharmonic, the nonlinear structure will produce a multiharmonic response, and its interactions with the shaker will produce harmonics in the force signal. In many works, the effects of higher harmonics are assumed to be weak and are neglected, and this approach seems robust in the absence of modal interactions, such as in the recent work of Karaaǧaçli and Özgüven which describes a response amplitude controlled FRF procedure to give a series of apparently linear responses that may be combined to view the nonlinearity [
18]. There is an advantage to assuming that forcing is monoharmonic where this is reasonable; not least because this lends itself to human interpretation through responses that are analogous to the FRF plots widely used in linear vibration. However, if a fully automated approach to system identification is sought, this benefit is trivial, and there are further problems. Firstly Ehrhardt and Allen show that multiharmonic forcing is necessary to track the NNM when modes are interacting [
19], and in [
20] the present authors show that the obtained response is significantly affected if the higher forcing harmonics are not controlled on an internally resonant structure. Secondly, if it is decided that the force input to a structure must be monoharmonic, there can be substantial experimental time incurred in feed forward control processes that ensure this [
20,
21]. (Note that an exception to this is when excitation hardware has been specifically designed to control this, such as the ‘scotch yoke’ apparatus used by Virgin [
22].) Therefore, a multiharmonic approach can save time in a nonlinear testing process, and reach response conditions that are otherwise unavailable, and we should consider the higher harmonics as an additional source of information rather than a problem to be eradicated, particularly in the case of structures with modal interactions. A further issue that must be considered in the testing of structures with combination resonances is the potential for responses that are isolated from other response branches, so called isolas [
20,
23,
24].
A generalisation that can be applied to many of the approaches above is that they consider the experimental system as being embedded within a black box mathematical function, which links properties of some input parameters to some output parameters, and numerical techniques are then applied to ensure a certain condition is met. For example, to obtain a pure cosine signal, the voltage signal sent to the shaker can be represented by a vector of Fourier coefficients
, resulting in a Force signal
at the point of excitation for a given fundamental frequency (Of course, a one to one mapping and excitation is not strictly true for the experiment, for example the structure will respond differently on different response branches, but it can be assumed within a local region of response). In order to achieve a purely monoharmonic input, a function
is solved for
, where
is the desired force input of the form
, where
is the required monoharmonic amplitude. In CBC testing, a similar presentation can be made for the Fourier coefficients of the control signal, which must all be set to within a small tolerance of zero. Clearly, the choice of such an equation is limited only by imagination, but in order to optimise a testing process we should consider this judiciously to ensure a rapid testing process that leads to the data of most interest for identification purposes.
This work proposes a passive stepwise testing method that seeks a desired degree of resonance between forcing and response at every datum point, by solving an equation to reach a target value of resonance. The indicator of resonance is given by the Power Based Mode Indicator Function (PBMIF) proposed by Peter and Leine [
17].
The method is a passive method, and therefore will be unreliable in the vicinity of fold bifurcations, due to the possibility of jump phenomena disrupting the search for the test condition. For this reason, the method does not directly seek to replicate the Nonlinear Normal Mode response, but instead drives towards points in its vicinity, equivalent to the region between the so called half-power points in linear harmonic vibration responses [
2]. In this manner, the process automatically seeks data that is more revealing of the underlying nonlinear normal modes than a traditional stepped sine method. Although a perfect Nonlinear Normal Mode replication is not achieved, the degree of resonance is sufficient to achieve high amplitude responses that exercise nonlinear effects. The resulting data are suitable for use in a Harmonic Balance based identification process such as described by Yasuda et al., in [
25] (This approach was applied in [
21] and identified underlying modal frequencies and nonlinearity well despite quite arbitrary assumptions about the form of stiffness and mass matrices). Furthermore, the method works on multiple harmonics of the fundamental forcing frequency, and is therefore suitable for structures with complex modal interactions. The method is presented with experimental examples on a beam with a 3:1 internal resonance.
The paper proceeds as follows;
Section 2 describes how the idea of phase can be generalised to give the degree of resonance of multiharmonic signals, and how we calculate this.
Section 3 then describes how a feed forward testing algorithm can be designed to automatically seek a desired degree of resonance in a test structure, then
Section 4 describes how a programmatically controlled sweep can be devised to extract resonant controlled data. The experimental hardware is described in
Section 5, and results are discussed in
Section 6. Finally, conclusions and future work are presented in
Section 7.
2. Generalising Phase for Multiharmonic Excitation
Phase is a widely used concept to understand the degree of resonance in linear systems and systems operating at a single frequency, but becomes less intuitive when considering multiharmonic forcing and response. This section explains how an indication of the degree of resonance can be given for multiharmonic forcing and response.
In order to derive a multiharmonic phase condition, firstly consider the net external work done by a single shaker upon the system over one cycle of a response with period
T, given by:
where
f is the force and
x is the displacement at the location of forcing in the same direction as
f. Equation (
2) represents energy that is dissipated by the system over a cycle because the total energy level of the conservative elements within the system cannot vary from one cycle to the next if the motion is periodic. The force
f and velocity
can be expressed as follows
where it is clear that the coefficients
are those of a Fourier series, truncated to the
nth harmonic. Note that constant terms in signals have been neglected in Equation (
3) without loss of generality.
The response of each signal can therefore be summarised by vectors of these Fourier coefficients:
Substitution of Equation (
3) into Equation (
2) and application of orthogonality shows that the cycle work can also be expressed as
If the system is not in perfect resonance, some of the force applied to it will be driving the conservative elements in the system, and this force will make no contribution to the cycle work
W. By contrast, if a system is in perfect resonance (i.e., the response is identical to the underlying conservative NNM), all force applied to the system will result in work that is dissipated over a period. The work that would result if the system was indeed at perfect resonance can be quantified in both time and frequency domains as follows:
This would occur if all force and velocity harmonics were perfectly in phase. Therefore a definition of forced resonance, generalised to multiharmonic signals, is when .
An indicator may be defined that expresses how close to a resonant condition the current forced response is:
which is identical to the Power Based Modal Indicator Function (PBMIF) described in more detail in [
17], albeit defined here in terms of work rather than power, and using real instead of complex vectors. This value will range from 0 if the system is completely away from resonance (for example, a quasistatic response) to 1 if the NNM is being perfectly reproduced (If Ψ is negative it indicates that the shaker is extracting energy from the system, indicating that the underlying system was self exciting somehow, a situation we neglect for now and focus purely on positively damped structures). Note that throughout this work, the PBMIF is evaluated using all of the first 5 harmonics, regardless of any further truncation applied to the input harmonics.
If Ψ, it indicates that 50% of the shaker power is being dissipated, a situation equivalent to exciting a linear system at its half power frequencies. However, the analogy to half power should be made with care. For a linear system, any monoharmonic excitation will achieve a half power (Ψ = 0.5) if and only if the system is excited at the half power frequency. For a smooth nonlinear system under monoharmonic forcing, there will be a range of frequencies at which half power can be achieved, but only if the forcing amplitude and response are at particular values for a given frequency. For a nonlinear system with multiharmonic forcing, even at a single frequency there will generally be range of possible excitations to give half power, or any other chosen value of the PBMIF except 1. For example, if the amplitude of forcing at the fundamental frequency is changed so that the PBMIF increases, a change may be made at some other harmonic that reduces the PBMIF to compensate, and in this way the PBMIF can be maintained at a constant value for a range of different excitations. The exception to this is when the PBMIF is 1; in this case, only a very particular forcing and response will exist that can achieve this at a given frequency, because this defines the underlying Nonlinear Normal Mode.
3. Feedforward Control of Resonance
The test process here is passive, in the sense that it does not feature feedback control. Therefore, it cannot directly control either the force or the response signals to the system. However, the voltage signal
z sent to the shaker amplifier can be controlled, and it may also be represented by a vector of Fourier components
, following the convention used in Equation (
4).
If it is assumed that no bifurcations are encountered, the force and response vectors may be assumed to be functions of
, and consequently the PBMIF is also a function of
. A target function can therefore be defined as
where
is any desired value of the PBMIF. Note that, as discussed in the previous section, the solutions of this equation will not in general be unique.
If all required quantities are extracted from the experiment automatically, the zeroes of Equation (
8) can be found with Newton–Raphson methods, with the experiment effectively forming the unknown function. One problem is that the function is very slow to evaluate, because it must wait for the system under test to settle to its steady state response after each input signal update. In addition, the Newton–Raphson method requires a Jacobian, which in the absence of knowledge of the underlying function, must be calculated with
n perturbations to the input vector, where
n is the length of the input vector, to create a finite difference approximation. In this work, the perturbations are a positive change to each Fourier component equal to 5% of the overall magnitude of the voltage vector. To reduce the testing time, a full finite difference calculation for the Jacobian is only performed on the first solver iteration, and every 5th iteration afterwards. On all other iterations, a Broyden update to the Jacobian is used, which makes use of the data point just captured to refine the Jacobian, in a similar manner to that described in [
13].
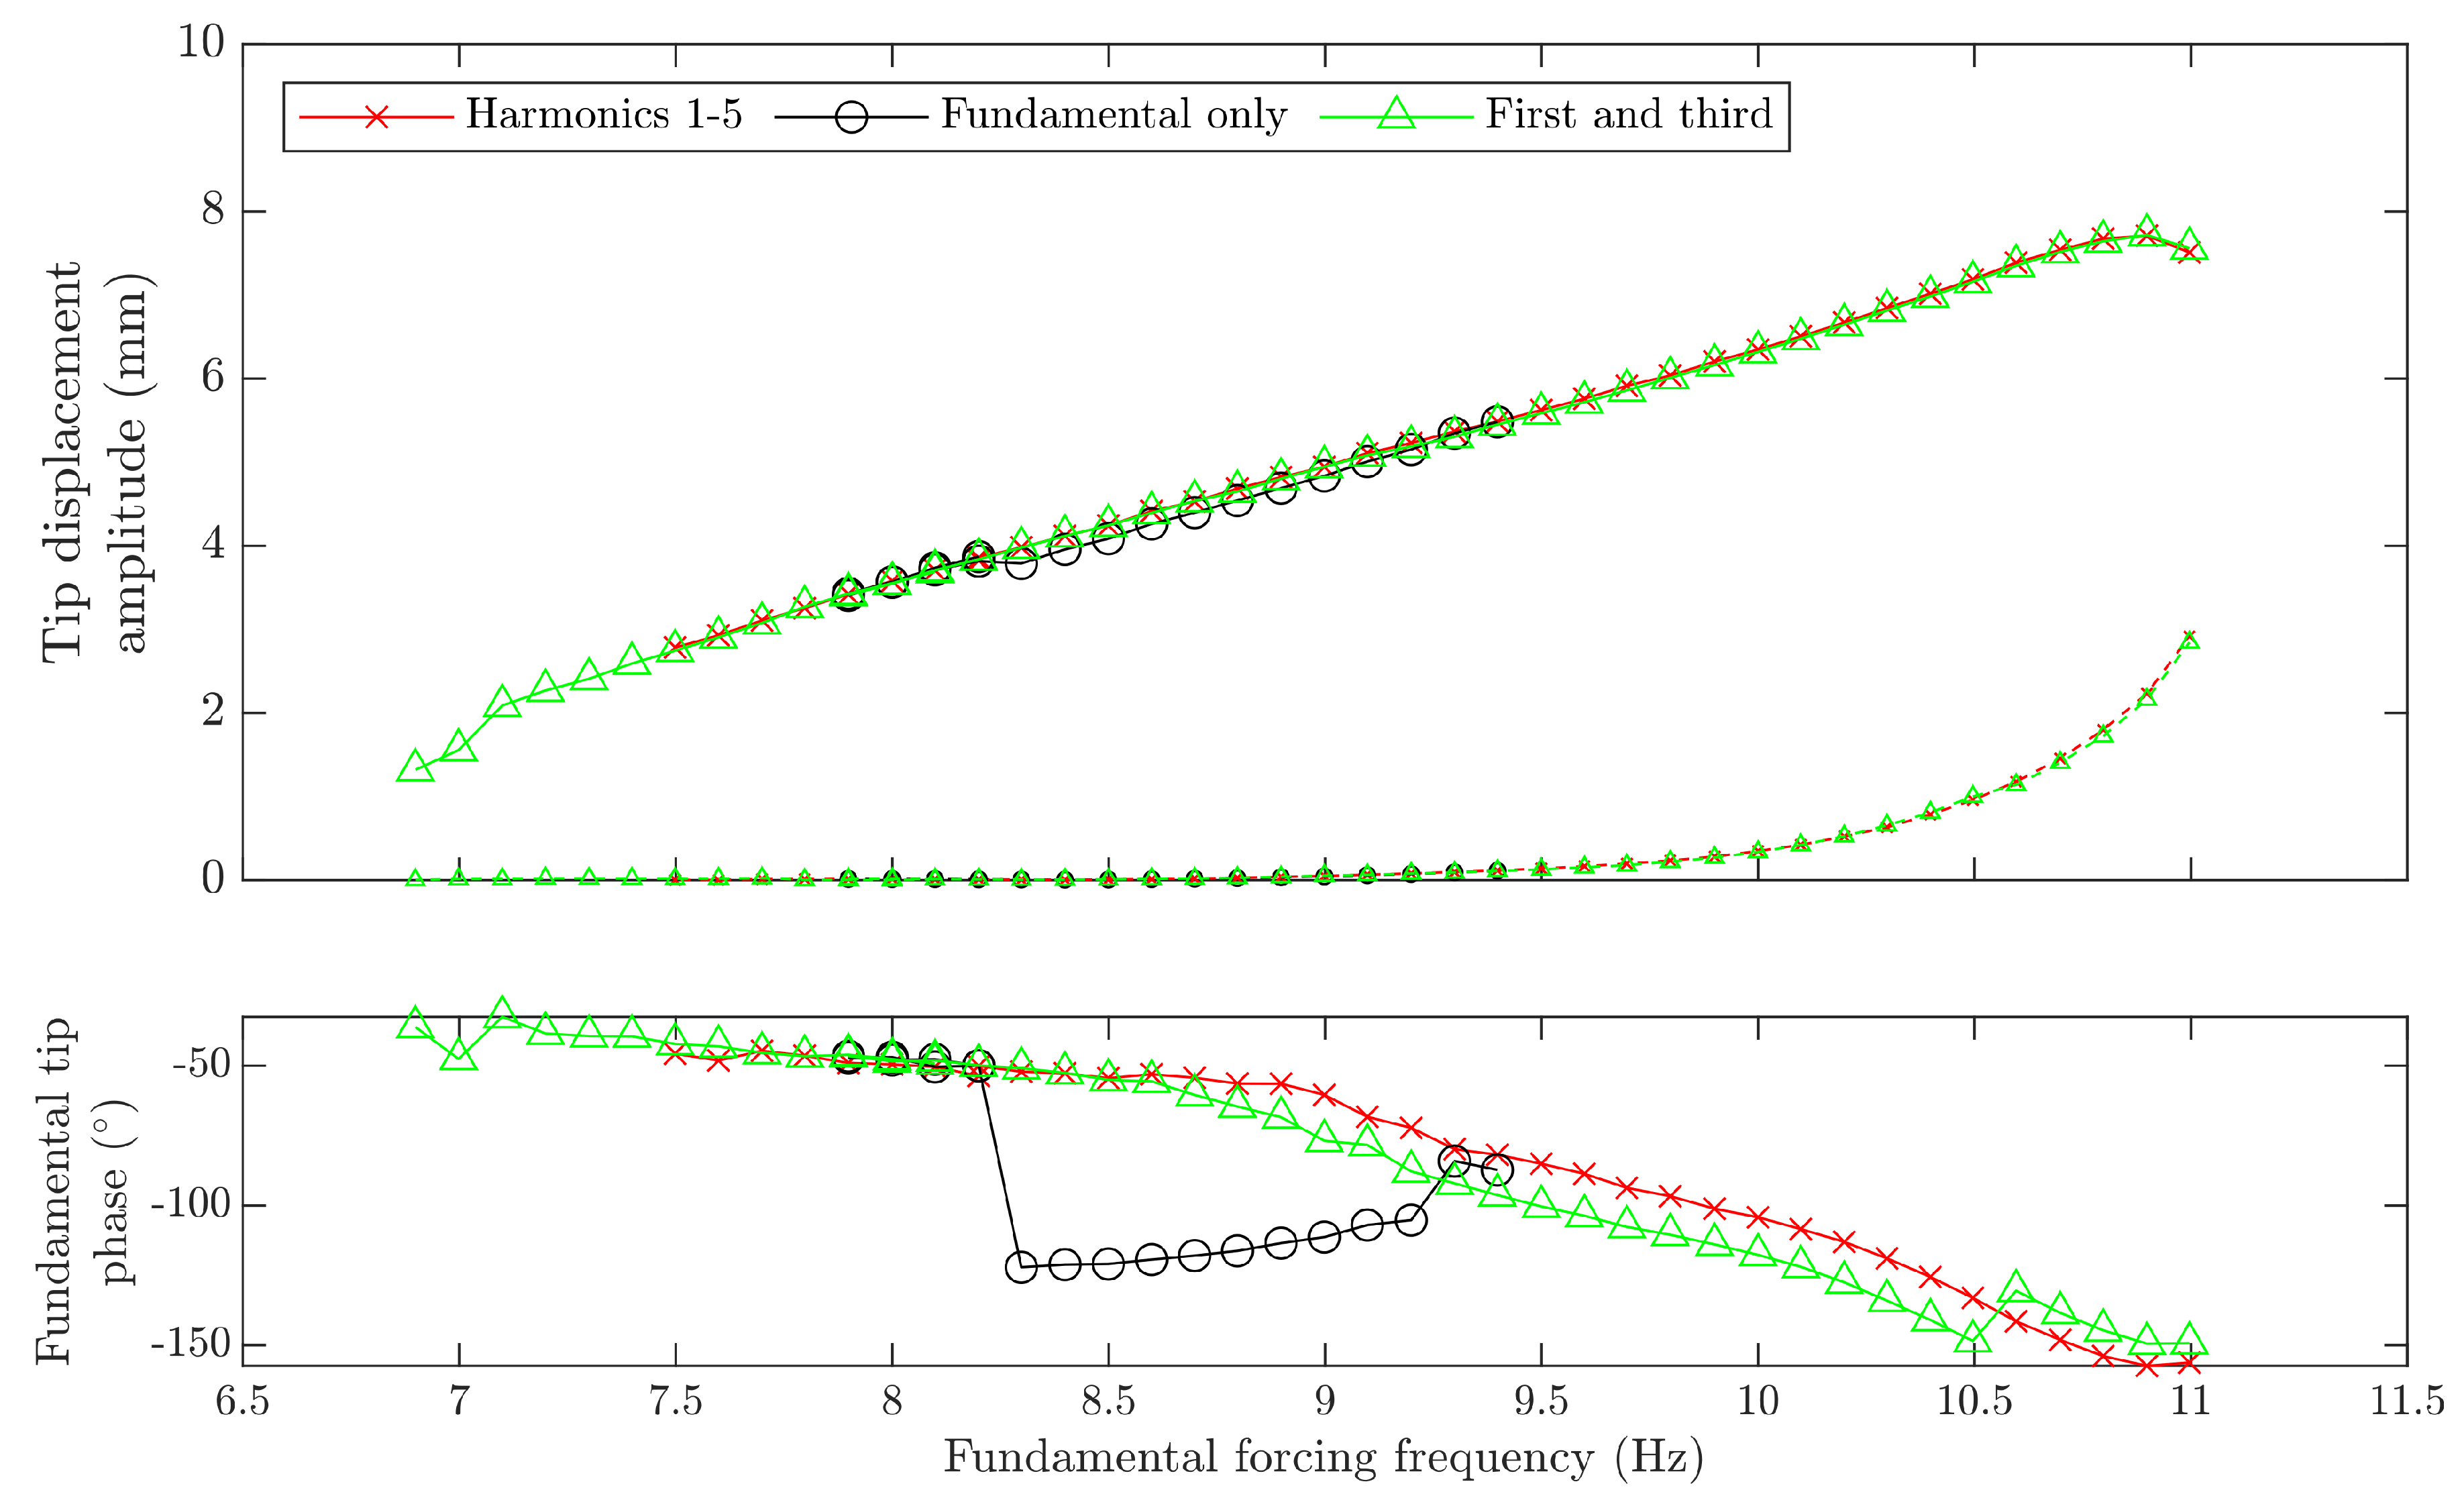
Another means of reducing the time needed to solve Equation (
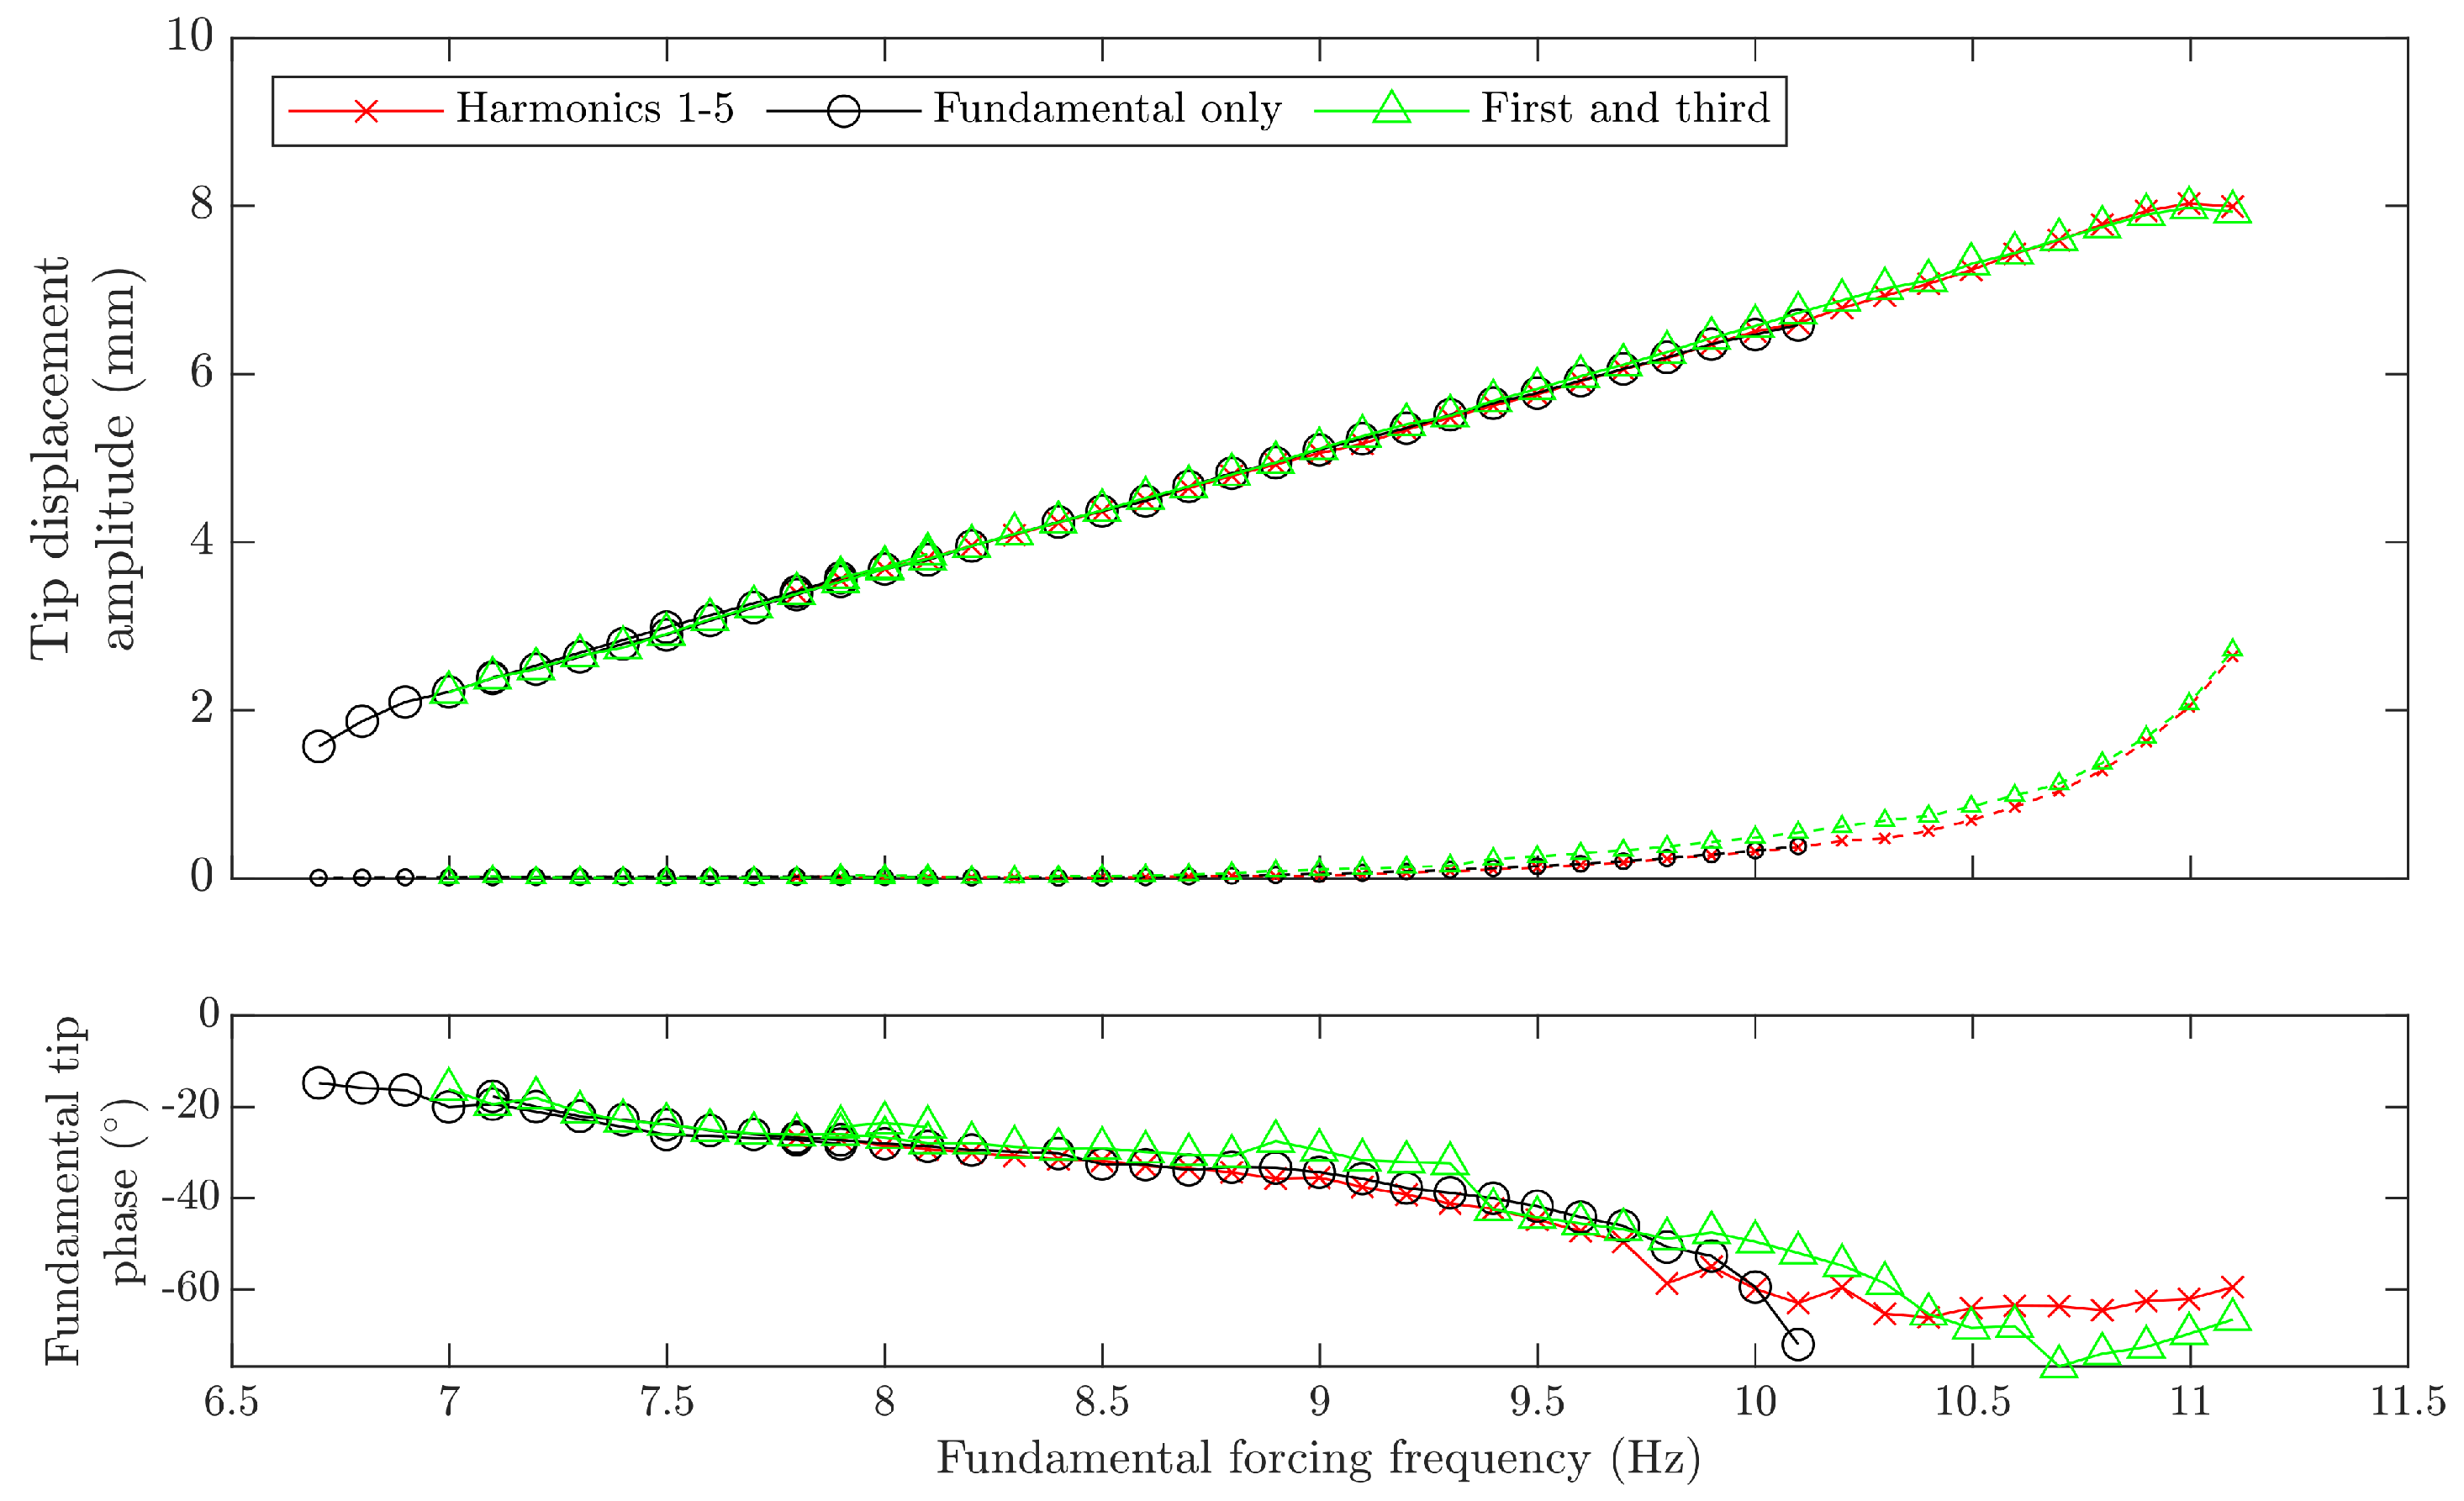
8) is to reduce the size of vectors, by omitting harmonics other than those known to participate in resonance. For example, if it is known that the structure has a 3:1 internal resonance, the vectors can omit all but the fundamental and third harmonic components and still capture most behaviour of interest. This provides a significant increase in the speed of testing, with little apparent loss of accuracy, something that is validated in
Section 6.4. Therefore, this approach is used throughout this work unless otherwise stated.
A final way to reduce the size of the problem is to note that the fundamental phase of the problem is not important. Therefore, we can always choose the input voltage to have zero phase, i.e., set , removing an unknown from . The phase of outputs makes no difference if the PBMIF is being considered, but if force is being controlled, can be zeroed simply by time shifting all Fourier components in the forcing and response, and this means that no solution steps are required to zero this numerically, without any loss of generality.
Choosing
to obtain resonance may seem desirable, however there is no guarantee this can be reached with single point forcing. Furthermore, this would often mean that the system is responding in the vicinity of a dropdown event, and a passive method has no means of preventing accidental dropdowns in the response. Therefore, choosing
to be a lower value gives a greater chance of success; note that a range of data with
would give data between the half power points in a linear system, sufficient to capture modal data using methods such as circle fit with good accuracy [
2]. By extension, it is expected that such highly resonant data are invaluable to understand resonant behaviour and identify properties in a nonlinear structure. However, due to amplitude dependency and mode interaction, it is anticipated that a much greater volume of experimental data would be required for the nonlinear system, and the requirements and procedure for fully identifying a structure such as presented in this work remain an open question.
Figure 1 summarises the resonant control process used at each given frequency point. At each frequency, after the response seems to have settled, a forcing period of data is obtained and the target function
is evaluated. If the result is within a tolerance, the point is accepted. Otherwise, a further Newton–Raphson step is applied to update
, iteratively until tolerance is achieved, using Broyden updates or finite difference calculations to establish or update the Jacobian as shown in
Figure 1.
Finally, note that if we wish to compare this method to a classical stepped sine with a purely monoharmonic input, it is simply necessary to replace the definition of the target function
with the left hand side of (
1), and the same procedure as depicted in
Figure 1 still applies.
7. Conclusions and Future Work
This work has demonstrated a passive multiharmonic testing process for internally resonant responses of nonlinear structures, that automatically seeks a desired degree of resonance, as part of a programmatically controlled sweep. It has shown how this can lead to high amplitude, resonant and feature-rich data more efficiently than traditional force controlled or monoharmonic stepped sine approaches.
It was also seen that the ideal degree of resonance to target was not necessarily the highest possible, if the aim was to reach high amplitudes, although if a near NNM response is required then higher is clearly better. It was also seen that, if the form of combination is known, only varying the specific harmonics in the excitation that correspond to this resonance gave similar results to control all of the first five harmonics. However, choosing to just excite at just a single frequency locates fewer responses, although the test can run more rapidly, and there is less chance of spurious solutions.
The highly programmable nature of the hardware setup being used opens up many possibilities that may be exploited, and this work has only just begun to explore these. Future work will consider the use of more sophisticated means of exploring the resonant response space, such as path following, rather than the current process which is currently based on constant size frequency steps.
A further area to consider is the best way for the sweep to detect resonance and switch to a resonance control algorithm. Firstly, it was found that the method of waiting for a certain resonance threshold under voltage excitation was quite a noisy indicator, and the resonant solutions would begin at quite different frequencies on different sweeps, so more robust indicators should be sought. Secondly, the work has proceeded with the advantage of the authors’ prior knowledge of the 3 to 1 internal resonance—the ideal resonance indicator would reveal this (or any other combination) automatically. This information would be useful both for identifying reduced order modelling approaches and for identifying the optimal truncation of the excitation vector. The richness of data already used in the process, including the Jacobian of the response properties, should give scope to achieve this.
Despite the improvement over conventional stepped sine testing, this process is still very slow and inefficient. So while one objective is to make it faster, an alternative strategy is to extract more value from the data that is collected. The richness of data collected, including time based transient data gathered during settling, should be exploited further, and perhaps used to produce detailed predictions for when bifurcations occur.
Finally, the authors could certainly be accused of ‘marking their own homework’ at this stage, considering that the method is applied to a well known structure specifically designed to produce many of the behaviours seen. As methods develop, they will need to be validated against a much wider variety of testbeds and real industrial structures.


