Article

Research on the Response Regularity of Smoke Fire Detectors Under Typical Interference Conditions in Ancient Buildings

1
School of Fire Protection Engineering, China People’s Police University, Langfang 065000, China
2
State Key Laboratory of Fire Science, University of Science and Technology of China, Heifei 230026, China
3
Chaoyang Buddhist Culture Museum, Chaoyang 122000, China
4
Chaoyang City 329 Broadcast Station, Chaoyang 122000, China
*
Author to whom correspondence should be addressed.
Fire 2025, 8(8), 315; https://doi.org/10.3390/fire8080315
Submission received: 30 June 2025 / Revised: 1 August 2025 / Accepted: 6 August 2025 / Published: 7 August 2025
(This article belongs to the Special Issue Fire Detection and Public Safety, 2nd Edition)

Abstract

Point-type smoke fire detectors have become one of the most commonly used technical means in the fire detection systems of ancient buildings. However, in practical applications, their performance is easily affected by special environmental interference factors. Therefore, in this study, a full-scale experimental scene of an ancient building with a typical flush gable roof structure was taken as the research object, and the differential influence laws of three typical interference sources, namely wind speed, water vapor, and incense burning, on the response times of point-type smoke detectors were quantified. Moreover, the prediction models of the alarm time of the detectors under the three interference conditions were established. The results indicate the following: (1) Within the range of experimental conditions, there is a quantitative relationship between the detector response delay and the type of interference source: the delay time shows a nonlinear positive correlation with the wind speed/water vapor interference gradient, while it exhibits a threshold unimodal change characteristic with the burning incense interference gradient; (2) under interference conditions, the detector response delay varies depending on the type of fire source: the detector has the best detection stability for smoldering smoke from a smoke cake, while it has the lowest detection sensitivity for smoldering smoke from a cotton rope. Moreover, the influence of wind speed interference is weaker than that of water vapor or smoke from burning incense, and the difference is the greatest in the wood block smoldering condition. (3) Construct a detector alarm time prediction model under three types of interference conditions, where the wind speed, water vapor, and burning incense interference conditions conform to third-order polynomial functions, Sigmoid functions, and fourth-order polynomial functions, respectively.

1. Introduction

Ancient buildings refer to all kinds of buildings and structures that possess both a cultural relic value and historical value [1]. As a precious and non-renewable cultural heritage, they contain rich historical and artistic values. However, considering the uniqueness of ancient buildings in terms of layout, structure, cultural relic value, religious beliefs, as well as their fire characteristics and current fire management situation, ancient buildings are constantly exposed to significant fire risks. The extremely high fire hazard has always been a major challenge in the protection of ancient buildings [2]. In recent years, there have been frequent fires in ancient buildings, causing irreparable cultural losses. For instance, on 15 April 2019, a fire broke out at the Notre-Dame Cathedral in Paris, France, resulting in the destruction of the roof and the spire, and causing severe damage to the entire building [3]; on 5 February 2023, a fire broke out at the Mingyue Buddhist Temple in Melbourne, completely destroying the main hall of the temple and severely damaging its structural integrity [4]; on 24 July 2023, a fire broke out in the Great Buddha Hall of Dafosi Temple in Shandan County, Gansu Province, causing severe damage to the seven-story wooden structure of the Great Buddha Hall [5]; and on 2nd May 2024, a fire broke out in the auditorium of the former location of Henan University’s Preparatory School for Studying Abroad in Europe, causing the roof to largely collapse [6]. Therefore, in the face of the frequent and severe fires occurring in ancient buildings worldwide, how to efficiently and promptly detect and sense fires in ancient buildings has become a key issue that urgently needs to be addressed in the field of cultural relic building protection.
Currently, fire detection technology has become a crucial means for reducing fire-related losses. It mainly includes various methods such as smoke detection [7], temperature detection [8,9], flame detection [10], and image monitoring detection [11]. Among them, smoke detection mainly achieves the corresponding detection and warning functions through smoke fire detectors. However, many smoke fire detectors often suffer from various interference sources such as water vapor, burning incense smoke, and environmental wind speed in practical applications, resulting in frequent false alarms or missed alarms [12,13,14]. Therefore, numerous scholars have conducted in-depth research on the response performance of detectors under interference conditions. Chai et al. [15] employed the Mie scattering theory and innovatively adopted the blue light tube technology, which solved the problem of insufficient sensitivity of traditional infrared detectors to small particle-sized smoke. Combined with the backward optical labyrinth design, it significantly enhanced the detector’s ability to identify dust and water mist. Philipp et al. [16] developed a dual-wavelength three-angle detection system based on infrared and green light, achieving the precise classification of smoke particles through multi-dimensional scattering signal analysis. Fu et al. [17] distinguished and selected the response performance of fire detectors based on the specific characteristics of different ancient building sites and the requirements for fire detection, thereby responding quickly and accurately to the fire. Jeong J et al. [18] utilized a fire detection and classification method based on a single ultraviolet signal (SimUV Net) to achieve the short-term and accurate identification of multiple types of fires (liquid, gas fires) and non-fire sources (such as candles, cigarettes, and heaters), providing a lightweight solution for the early warning of fires in complex scenarios. In summary, current research mainly focuses on the qualitative analysis of the classification, recognition, and performance optimization design of detectors for fire smoke, dust, water mist, and other non-fire smoke. However, the quantitative analysis of the alarm response regularity of detectors under the influence of typical interference factors in the actual environment of ancient buildings is still blank. In light of this situation, the response regularity of point-type smoke detectors under typical interference conditions of ancient buildings were studied on the full-scale experimental platform of ancient buildings with a flush gable roof structure, aiming at quantifying the alarm response regularity of smoke detectors under typical interference conditions of ancient buildings. By building a prediction model of detector alarm time under experimental interference conditions, this alarm time prediction model not only achieves a paradigm shift from qualitative analysis to quantitative prediction but also conducts a detailed analysis of the prediction error of alarm time under different interference conditions. It plays a significant role in promoting research on the performance optimization of detectors. This fills the gap in the response regularity of smoke and fire detection in complex environments in ancient architecture, providing an important experimental basis and theoretical support for optimizing detector performance and designing environmental adaptability.

2. Materials and Methods

2.1. Characteristics of Fire Sources, Selection of Detectors, and Analysis of Interference Sources in Ancient Building Fires

2.1.1. Analysis of Fire Source Characteristics and Detector Selection in Ancient Buildings

The interiors of ancient buildings usually contain, display, or store a large number of combustible items of various materials, resulting in a complex variety of fire sources. Whether it is the roof, the beam and column framework, or the doors, windows and indoor furnishings such as furniture and collections, most of them are mainly made of wood [19]. Wood, as an inflammable material, has a complex combustion process, which can be divided into three stages: thermal decomposition, flaming combustion, and flameless combustion. During the thermal decomposition stage of wood, smoke is produced [20]. Furthermore, in ancient buildings, a large amount of textiles and fabrics are often used for decoration, such as curtains, carpets, wall hangings, etc. [21,22]. These items are highly flammable. Once they come into contact with heat sources or fire sources, they are prone to cause smoldering or open flame combustion. Most of them will produce a large amount of smoke during the smoldering stage [20]. Meanwhile, there are also other combustible materials in the ancient buildings, and their smoldering or burning process will also produce a large amount of smoke [20,21].
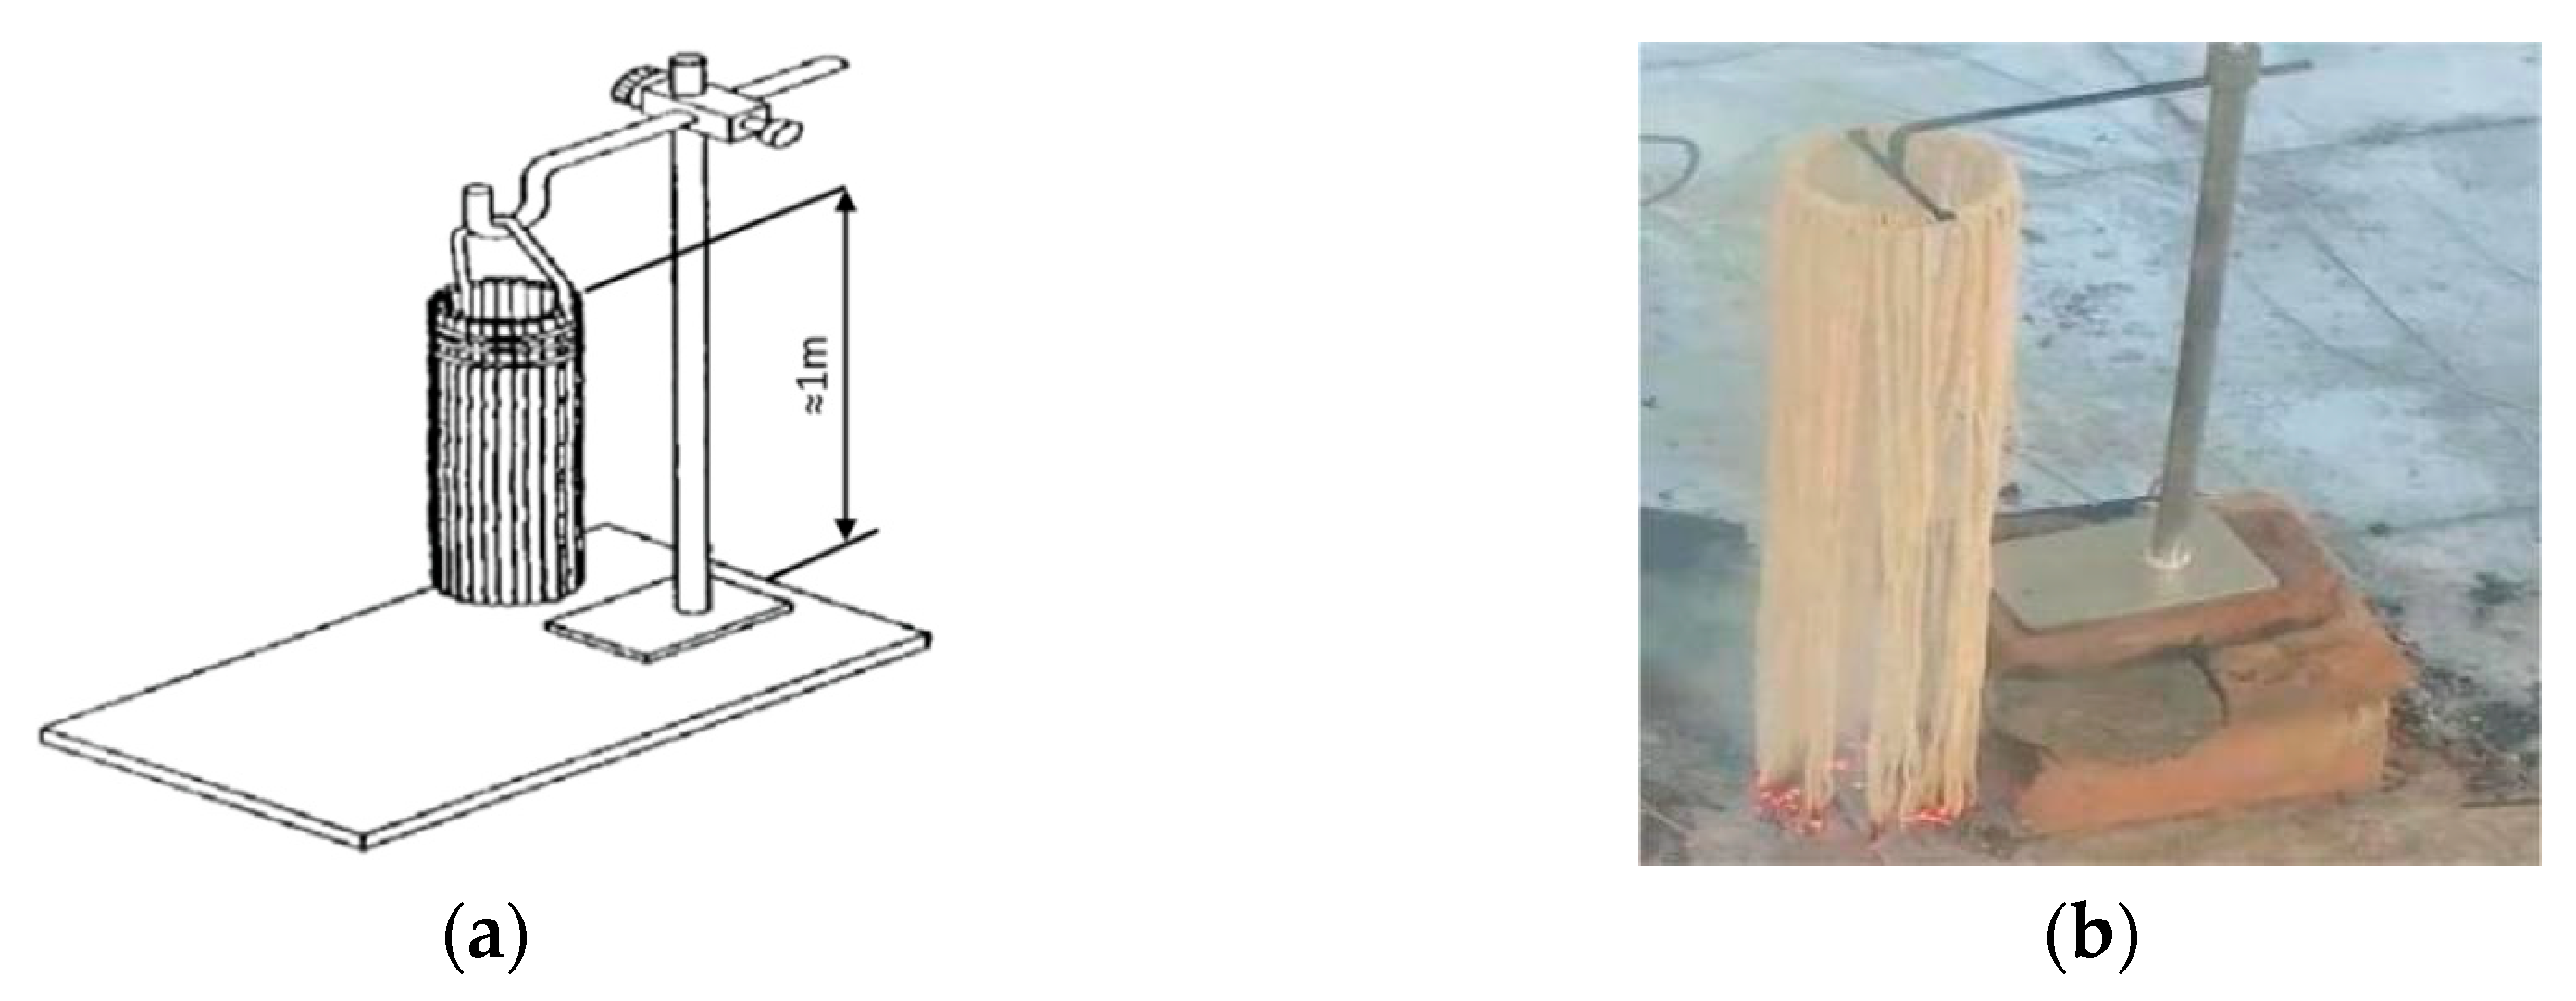
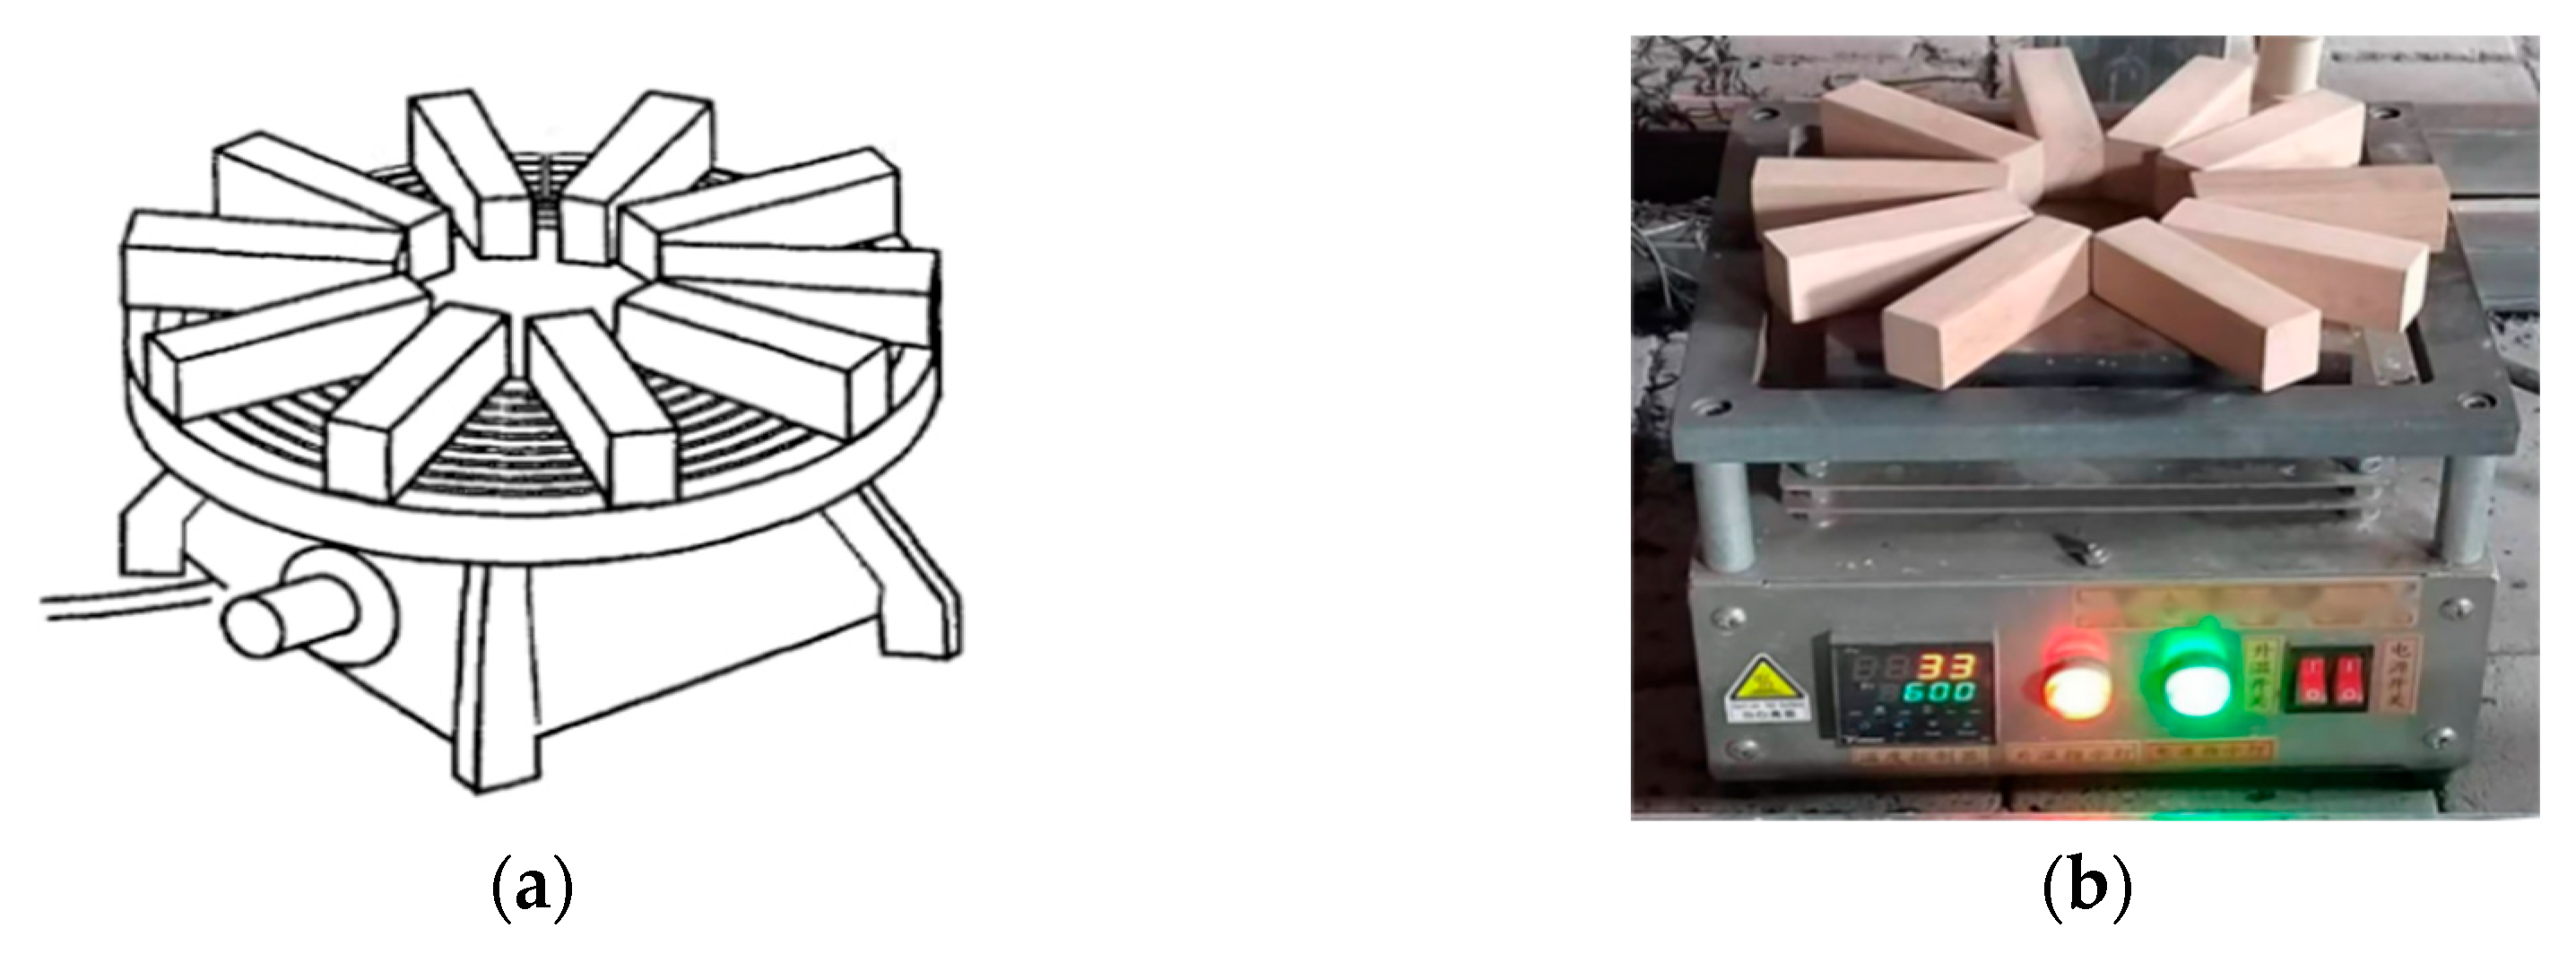
Based on the analysis of the types of fire sources in the aforementioned ancient building fire incidents, a total of three types of fire sources were selected, namely wood block smoldering, cotton rope smoldering, and smoke cake smoldering. Wood block smoldering was selected to simulate the brick and wood structure of the building itself, as well as the fire and combustion of wooden items such as tables, chairs, furniture, screens, and display cabinets displayed indoors; cotton rope smoldering was selected to simulate the fire and combustion of cotton items such as carpets, silk, fabrics, calligraphy, and paintings in ancient architectural interiors; additionally, smoke cake smoldering was selected as the control and validation combustion source for the experiment.
Based on this, in response to the prevention and control needs for fire hazards of combustible materials within ancient buildings, the structural features and types, characteristics and combustion forms of the internal materials of ancient buildings should be taken into account. Meanwhile, in accordance with the relevant technical standards such as the Chinese national standard GB50116-2013 Design Code for Automatic Fire Alarm Systems [23], etc., the point-type photoelectric smoke fire detector was selected as the main research object. Point-type photoelectric smoke fire detectors are particularly suitable for ancient buildings with room heights greater than 8 m and not exceeding 12 m. Therefore, they are widely used in ancient building fire detection. According to the field survey, the detectors arranged in the Zhonghe Hall of the Forbidden City are point-type smoke fire detectors, which are installed on the ceiling with a spacing of 5.5 m, for a total of 9 detectors; both the Yin’an hall and the Jiale Hall of Prince Gong’s mansion are equipped with 5 and 10 point-type smoke and fire detectors, respectively, in the way of ceiling mounting; and the dressing hall of Youshun Temple is also equipped with 3 point-type smoke and fire detectors in the way of ceiling mounting.

2.1.2. Analysis of Typical Interference Sources in Fire Detection of Ancient Buildings

The interior environment of ancient buildings is complex and diverse, and there are multiple interference sources for point-type smoke fire detectors. The ambient wind speed will change the movement trajectory and diffusion speed of flue gas and then affect the alarm response time of the detector [24,25]. The water vapor generated in high humidity environments will reduce the sensitivity of the detector, especially in ancient buildings in the southern and coastal areas [23,26,27]. The particles produced by burning incense in religious places are similar to fire smoke in optical characteristics, which is easy to cause a false alarm and the false alarm of a point-type smoke detector [26,27]. Domestic and international scholars have conducted relevant studies on the impact of different interference sources on fire detection. Chen et al. [12] revealed the interference mechanism of traditional sacrificial activities in religious buildings on smoke detectors by comparing the response performance of the same detector under the interference environment of four standard test fires, incense, butter lamps, and so on. Taehoon K et al. [28] explored the influence of the flow of wind speed generated by different installation positions of the air purifier (top row and front row) on the response time of the smoke detector. Li [29] proposed the optimization scheme of installing a gravity drainage device based on the real-time monitoring data of temperature and humidity in light of the equipment failure caused by the reverse flow of condensate in a pavilion of the Palace Museum.
The wind speed, humidity, and burning incense granule data of typical ancient buildings such as the National Palace Museum of China, Prince Gong’s Mansion, and Youshun Temple in Liaoning Province were collected. Some field survey data are shown in Table 1.
The quantitative analysis results of the above interference sources show that the main interference sources in the point-type smoke fire detection of ancient buildings are environmental wind speed, water vapor and incense smoke. The experimental simulation methods and interference gradient setting ranges of the three interference sources are as follows:
  • Indoor environmental wind speed interference
A multi-frequency adjustable fan is selected as the device for generating wind speed disturbance. By adjusting the fan’s gear position, different wind speed disturbance gradient conditions can be quantitatively controlled. Based on field research data, the main variable values for wind speed interference sources are set to 0.15 m/s, 0.20 m/s, and 0.25 m/s, respectively.
2.
Environmental water vapor interference
The experiment uses a humidity generator to simulate different water vapor humidity interference conditions and achieves quantitative control of water vapor interference through gear adjustment. Due to the equipment defect of the humidity generator, and based on the survey data, the variable values of the water vapor interference sources were, respectively, set at 69% RH, 76% RH, and 85% RH.
3.
Incense smoke and dust interference
The experiment selected pollution-free sandalwood as the interference source, and based on the principle of shading rate measurement, established a quantitative control method for burning incense smoke by calibrating the shading rate produced by different quantities of sandalwood. Based on the limitation of the fixed number of incense burning roots, the disturbance source variables of incense burning smoke are set to 1.2 %obs/m, 2.8 %obs/m, and 4.5 %obs/m, respectively.

2.2. Experimental Plan Design

2.2.1. Fire Source Working Conditions Design

The fire source conditions are designed in accordance with the Chinese national standard GB 4715-2024 Point type Smoke Fire Detector [30]. The specific test fire source materials and specifications are shown in Table 2.
The arrangement and ignition methods of three types of test fires, namely smoke cake smoldering, cotton rope smoldering, and wooden block smoldering, strictly follow the requirements of the corresponding standard test fires in the Chinese national standard GB4715-2024 Point type Smoke Fire Detector [30]. It is worth noting that the smoke cakes used in the experiment were mainly composed of wood chips, potassium nitrate, ammonium nitrate, and resin, which is why they produced white smoke during smoldering. The cotton rope is mainly composed of natural cellulose fibers. The main components of the wood block include cellulose, lignin, hemicellulose, and a certain amount of water.
By contrast, the pyrolysis process of the wood block used in the experiment has distinct stage characteristics [20]:
  • When heated to 110 °C, the first stage is the evaporation of water, and a small amount of resin is also vaporized.
  • At 130 °C, the wood block begins to decompose, and the main products of the decomposition are H2O and CO2.
  • At temperatures ranging from 220 to 250 °C, the wood block begins to change color and undergo carbonization. The cellulose is decomposed, resulting in the formation of CO, H2, and CxHy (hydrocarbons).
  • At 300 °C, a vigorous thermal decomposition occurs, causing the physical structure to break down, making the volatile substances easier to escape through the surface of the carbonized layer.
  • As the carbonization depth increases, the cracks gradually widen, resulting in the “map crack” phenomenon.
The specific working condition design and actual test conditions are shown in Figure 1, Figure 2 and Figure 3, respectively.

2.2.2. Full-Scale Experimental Platform Construction

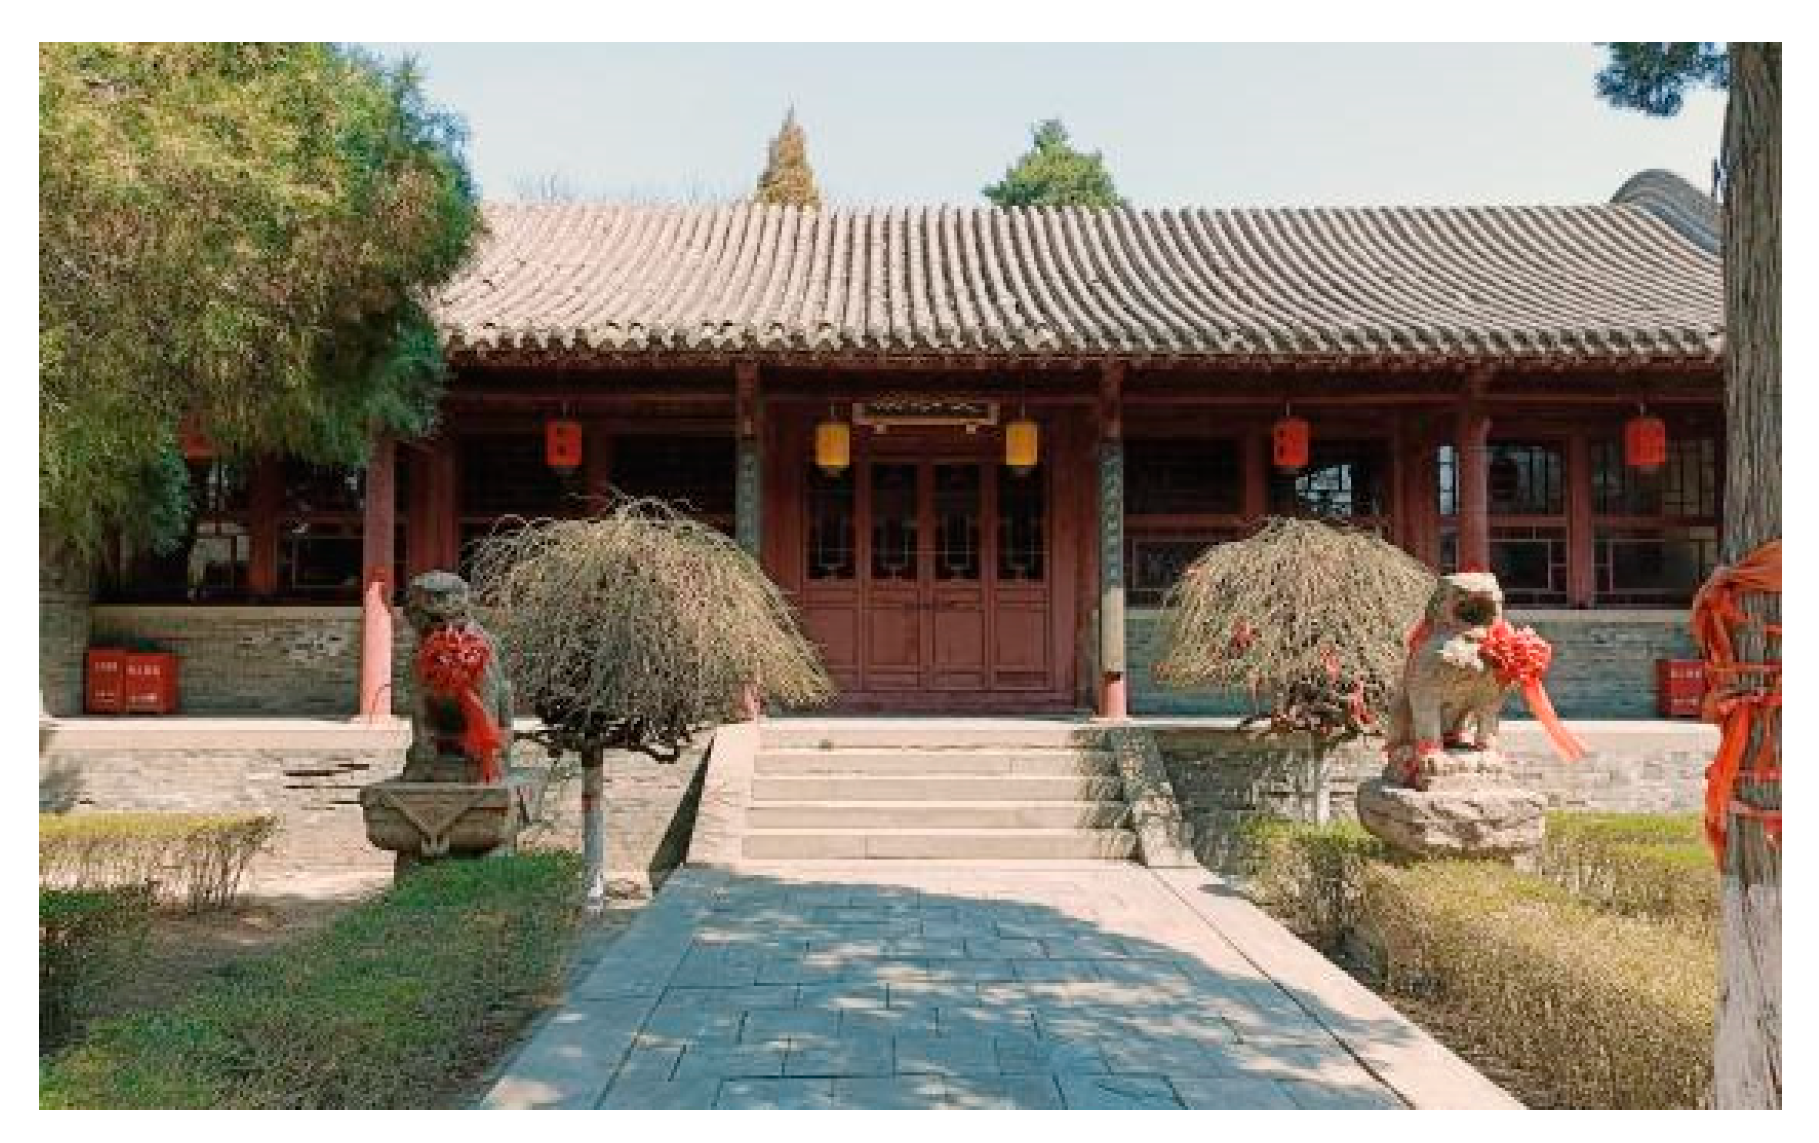
Using the changing hall in Youshun Temple, Chaoyang City, Liaoning Province, a national key cultural relic protection unit in China, as the experimental scene, a full-scale experimental platform was built on site. The changing hall is a typical Tibetan Buddhist temple in the form of a flush gable roof structure, with a length of 16.6 m, a width of 8.9 m, and a height of about 5.3 m from the main ridge to the ground. The flush gable roof structure has only two front and rear slopes, and the left and right gable walls intersect the roof. All the wooden beams are sealed in the gable. The structural appearance is shown in Figure 4.
The specific experimental platform is built as follows:
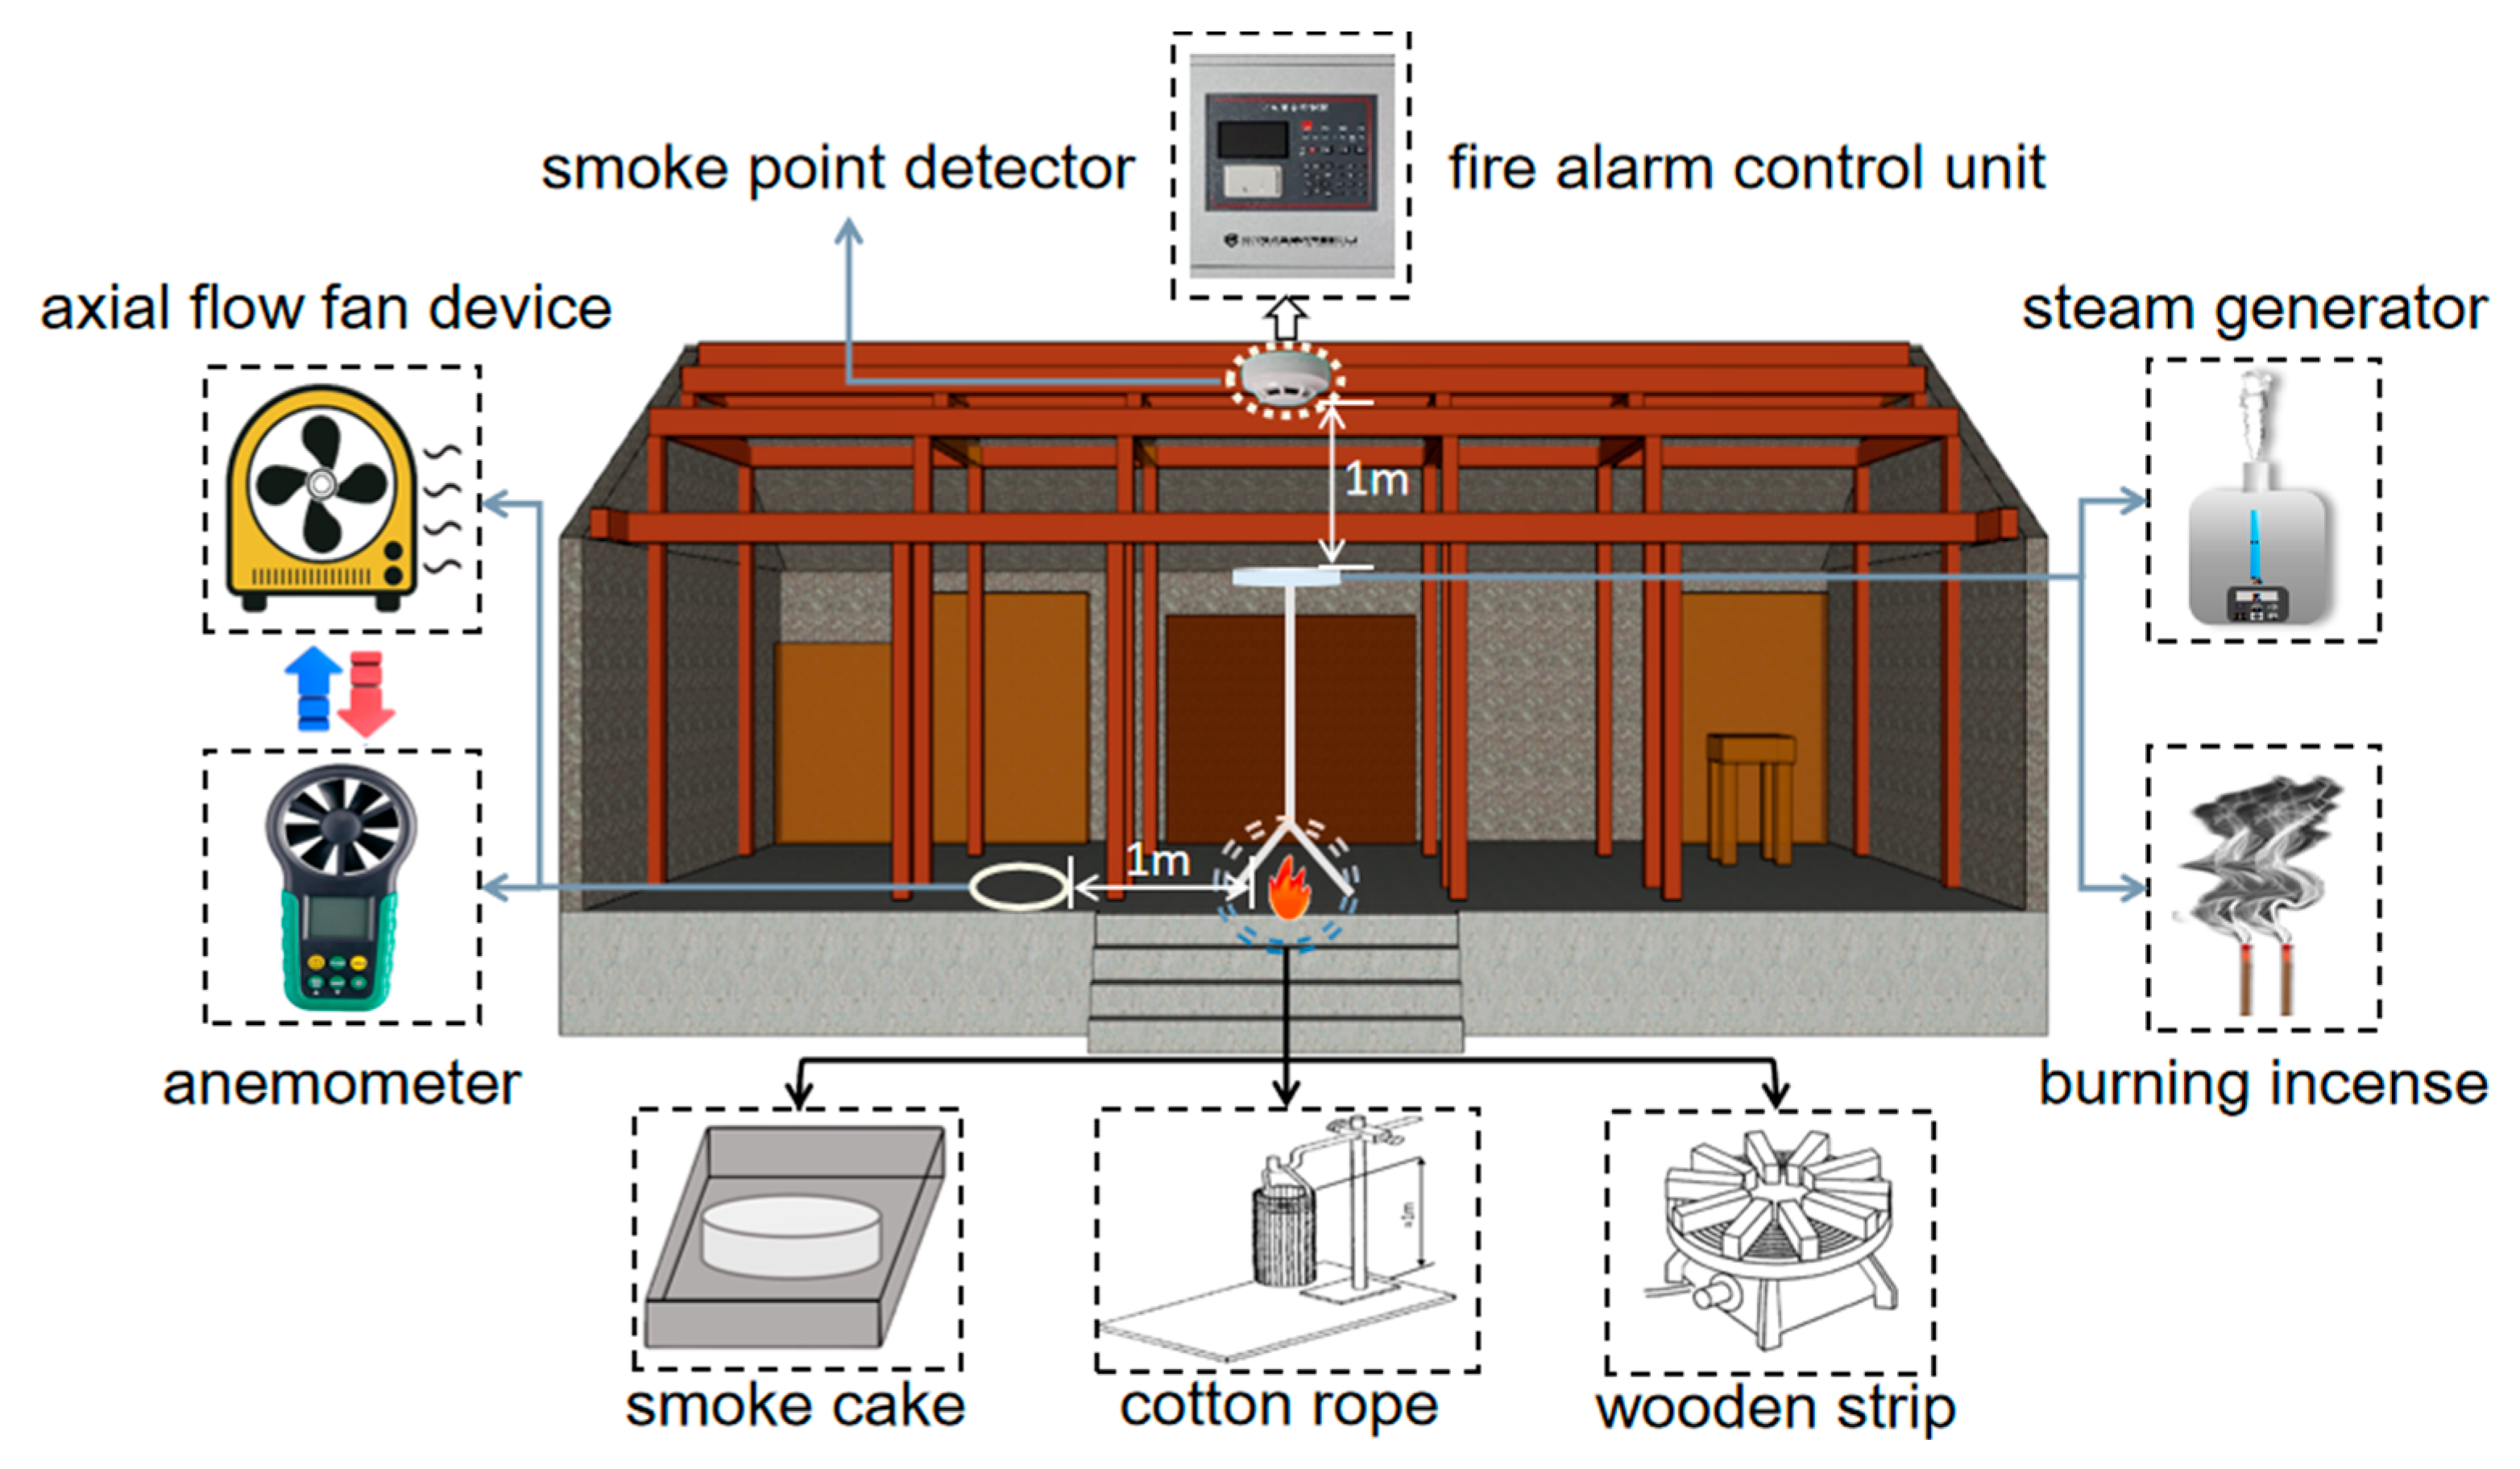
  • Fix the point-type smoke fire detector in the middle of the roof ridge of the changing room, with the smoke chamber facing vertically downward, and use a fire alarm controller compatible with the detector. Connect the devices with a dedicated signal line to complete data collection and transmission;
  • The location of the fire source is set on the ground directly below the point-type smoke detector;
  • The multi-frequency adjustable fan is set on the ground at a horizontal distance of 1 m from the fire source; the incense interference source and the water vapor humidity generation device are set 1 m directly below the detector. The specific experimental platform scenario is shown in Figure 5.

2.2.3. Design of Experimental Working Conditions

The principle of experimental design is based on the control variable method, which quantitatively changes a single interfering factor while keeping other conditions consistent. The experiment specifically includes three types of test fire sources, conducted under conditions of no interference and three categories of interference sources (wind speed, water vapor, and incense smoke). Each type of interference source is set with three variable value gradients, while the three standard test fire experiments under no interference conditions serve as the control group. Therefore, a total of 30 operating conditions were co-constructed (3 blank control group experiments and 27 experiments under different interference conditions), with each set of conditions repeated 3 times, resulting in a total of 90 groups. The standard deviation of the alarm time data from each of the three parallel experiments in each group was calculated, and the calculated standard deviations were all less than 10% of the average value (specific range: 3.2–6.7%). This indicates that the data dispersion is small, the experimental data have a good repeatability and reliability, and the average value can be directly taken as the analysis data. The specific experimental conditions are shown in Table 3.

2.3. Experimental Data Research and Analysis Methods

2.3.1. Alarm Delay Time Calculation Method

Based on Section 2.2.3, the average alarm times of the fire detectors for three sets of parallel tests under each experimental condition were calculated, with the average value representing the actual alarm time of the detectors for each group of test conditions. That is, the alarm times of the detectors analyzed in this document are all the average values of three sets of parallel tests. At the same time, the calculation of the alarm delay time is as follows:
T x = T n T 0
In the formula
  • T x —Alarm delay time (s);
  • T n —Alarm time of fire detectors under different gradient interference conditions (s);
  • T 0 —Alarm time of the fire detector under non-interference conditions (s).

2.3.2. The Construction Procedure and Quantitative Analysis Method of the Alarm Time Prediction Model

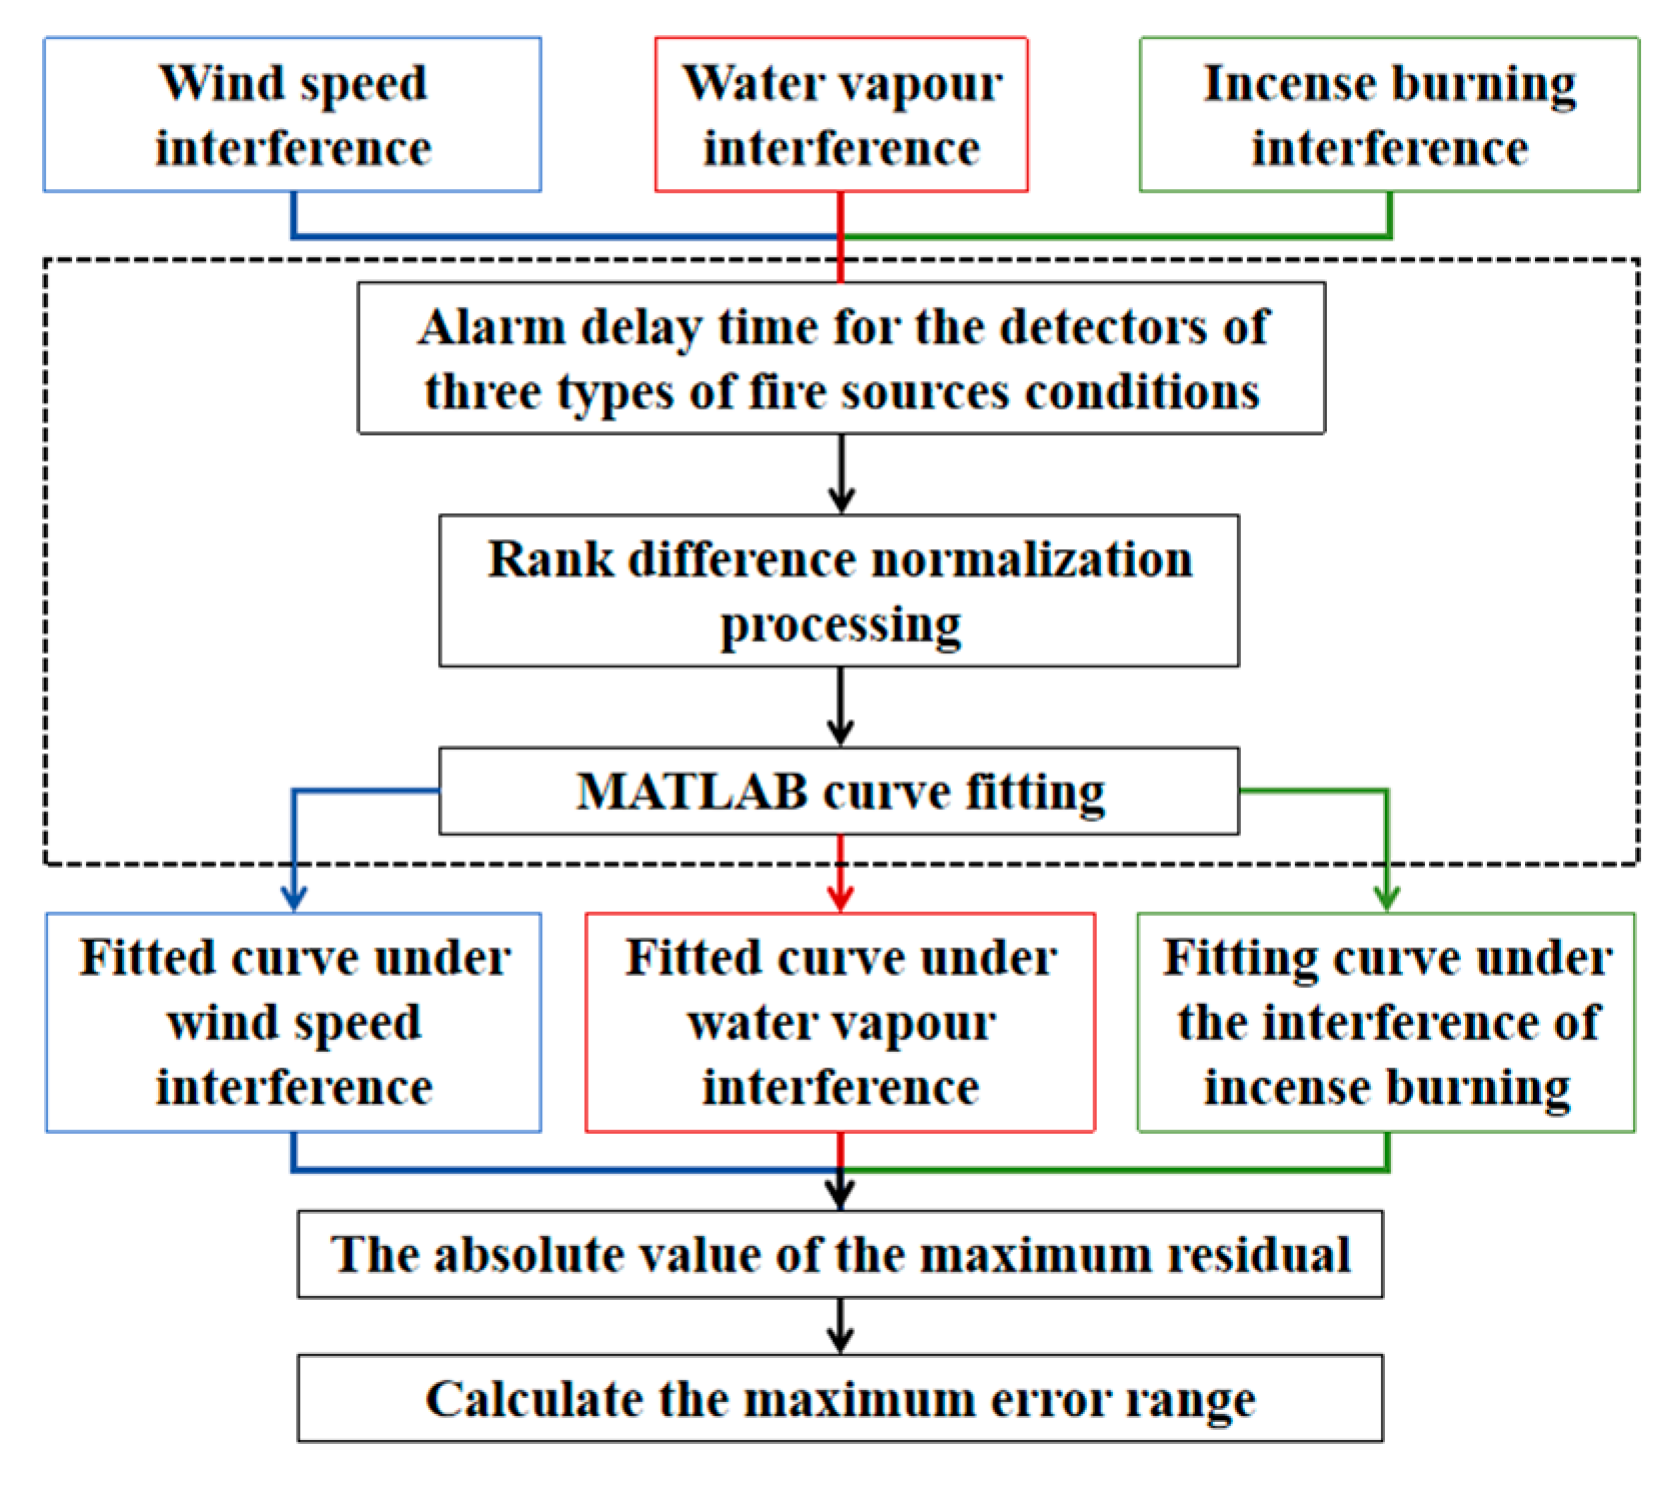
Meanwhile, based on the numerical analysis software MATLAB(2023a), the detectors’ alarm response data for three types of fire sources under the conditions of wind speed, water vapor, and burning incense interference were analyzed through fitting. Subsequently, an alarm time prediction model was constructed. The steps of the construction process are shown in Figure 6.
  • To mitigate the impact of baseline alarm times across different fire source conditions under interference-free scenarios on the calculation of detector alarm delay times, the data were normalized. Nine data sets were constructed based on the alarm delay time data of the three types of ignition source conditions under the three types of interference conditions (including the data under the condition of an interference gradient of 0, i.e., the condition of no interference), and the alarm delay time under the condition of no interference was defined as 0 s. Use the extreme value normalization method to standardize each data group. The formula is as follows [31]:
T a = T x T m i n T m a x T m i n
In the formula
  • T a —Standardized alarm delay time (s);
  • T x —Alarm delay time (s);
  • T m a x —Maximum alarm delay time (s);
  • T m i n —Minimum alarm delay time for 0.
2.
Perform data fitting processing on the standardized alarm delay time data under the same interference condition.
3.
Based on the fitting curve data and experimental raw data, calculate the maximum absolute residual value of the fitting result using the following formula [32]:
R m a x = m a x y i y i ^
In the formula
  • R m a x —Maximum absolute residual value of data fitting;
  • y i —Actual data values of the i-th experiment (s);
  • y i ^ —The predicted values obtained by fitting the model in the i-th experiment (s).
4.
Based on Formula (3), calculate the maximum error of the detector’s alarm delay time (the maximum error of the detector’s actual alarm time).
Based on this, the alarm response time regularity of the detectors under different interference conditions for the three types of fire sources are analyzed. And three prediction models for the alarm time of the detector under different interference conditions were constructed. The formula of the fitting function corresponding to each alarm time prediction model is as follows:
  • Third-order polynomial function:
    y = a x 3 + b x 2 + cx + d
  • Sigmoid function:
    y = 1 1 + e k ( x x 0 )
  • Fourth-order polynomial function:
    y = a x 4 + b x 3 + c x 2 + d x + e

2.3.3. The Calculation and Analysis Method for the Degree of Influence of Interference Conditions

In order to further analyze the differences in the impact of various interference conditions on the alarm response time of fire detectors among three typical fire sources in ancient buildings, quantitatively calculating the degree of the delay in alarm time caused by three types of interference sources under different gradient conditions in same fire source scenarios thus characterizes the differentiated impact of different interference sources on the response characteristics of the detectors under the same fire source conditions. Based on experimental conditions design, three datasets are constructed using the three different fire source conditions—smoke cake smoldering, cotton rope smoldering, and wood block smoldering—as the classification method. The alarm time delay degree was calculated for each data group, respectively, and the formula can be expressed as [28]:
ω = T x T 0 · 100 %
In the formula
  • ω —Degree of delay in fire detector alarm time (%);
  • T x —Alarm delay time (s);
  • T 0 —Alarm time of fire detectors under non-interference conditions (s).

3. Results

In 90 groups of experiments, under the condition of 85% RH humidity interference, the smoke cake smoldering condition detector experienced false alarms, and under the condition of 76% RH humidity interference, the cotton rope smoldering condition detector also experienced false alarms. The specific false alarm times are shown in Figure 7.
From Figure 6, it can be seen that under the 85% RH humidity interference condition, the smoldering condition detector for the smoke cake experiences a false alarm 6 s after the start of the humidifying device, while under the 76% RH humidity interference, the smoldering condition detector for the cotton rope experiences a false alarm 10 s after the humidifying device starts. Parallel tests were conducted on the two sets of experimental conditions that had false alarms, and no false alarms occurred.
Based on Section 2.3, the alarm response time regularity of the detectors under different interference conditions for the three types of fire sources are analyzed. And three prediction models for the alarm time of the detector under different interference conditions were constructed.

3.1. Alarm Response Regularity and Time Prediction Models of Detectors Under Wind Speed

3.1.1. Analysis of Response Regularity

The alarm times of fire detectors for smoke cake smoldering, cotton rope smoldering, and wood block smoldering under non-interference conditions and under different gradients of wind speed interference conditions are shown in Figure 8. The visualization of the alarm delay time for three types of fire source conditions under wind speed interference is shown in Figure 9.
Based on the analysis results of the experimental data in Figure 8 and Figure 9, it can be seen that under wind speed disturbance conditions of 0.15 m/s, 0.20 m/s, and 0.25 m/s, the alarm time of fire detectors varies with different degrees of delay among the three types of fire source conditions. The specific regularities are as follows:
  • Under the three types of fire source conditions, the initial rise time of the smoke concentration in smoke detectors and the alarm delay time both exhibit a nonlinear proportional relationship with the gradient of wind speed disturbance. As the wind speed disturbance gradient increases, the initial rise in smoke concentration detected by the smoke detector takes longer, and the alarm delay time increases. Compared with the other two fire source conditions, the effect of the gradient change in wind speed disturbance on the initial rise in the smoke concentration under the condition of wood block smoldering is relatively small.
  • Under wind speed interference conditions, the alarm delay times for three types of fire source detectors are as follows: cotton rope smoldering (39–91 s) > smoke cake smoldering (25–53 s) > wood block smoldering (8–29 s). Further analysis indicates that the application of wind speed promotes the pyrolysis process of the wood block and the volatilization rate of its smoke, and this promoting effect can effectively counteract the inhibiting effect of wind speed on the vertical spread of smoke, thereby somewhat alleviating the impact of wind speed on the delay in alarm time of the fire detectors.

3.1.2. Construction of Alarm Time Prediction Model

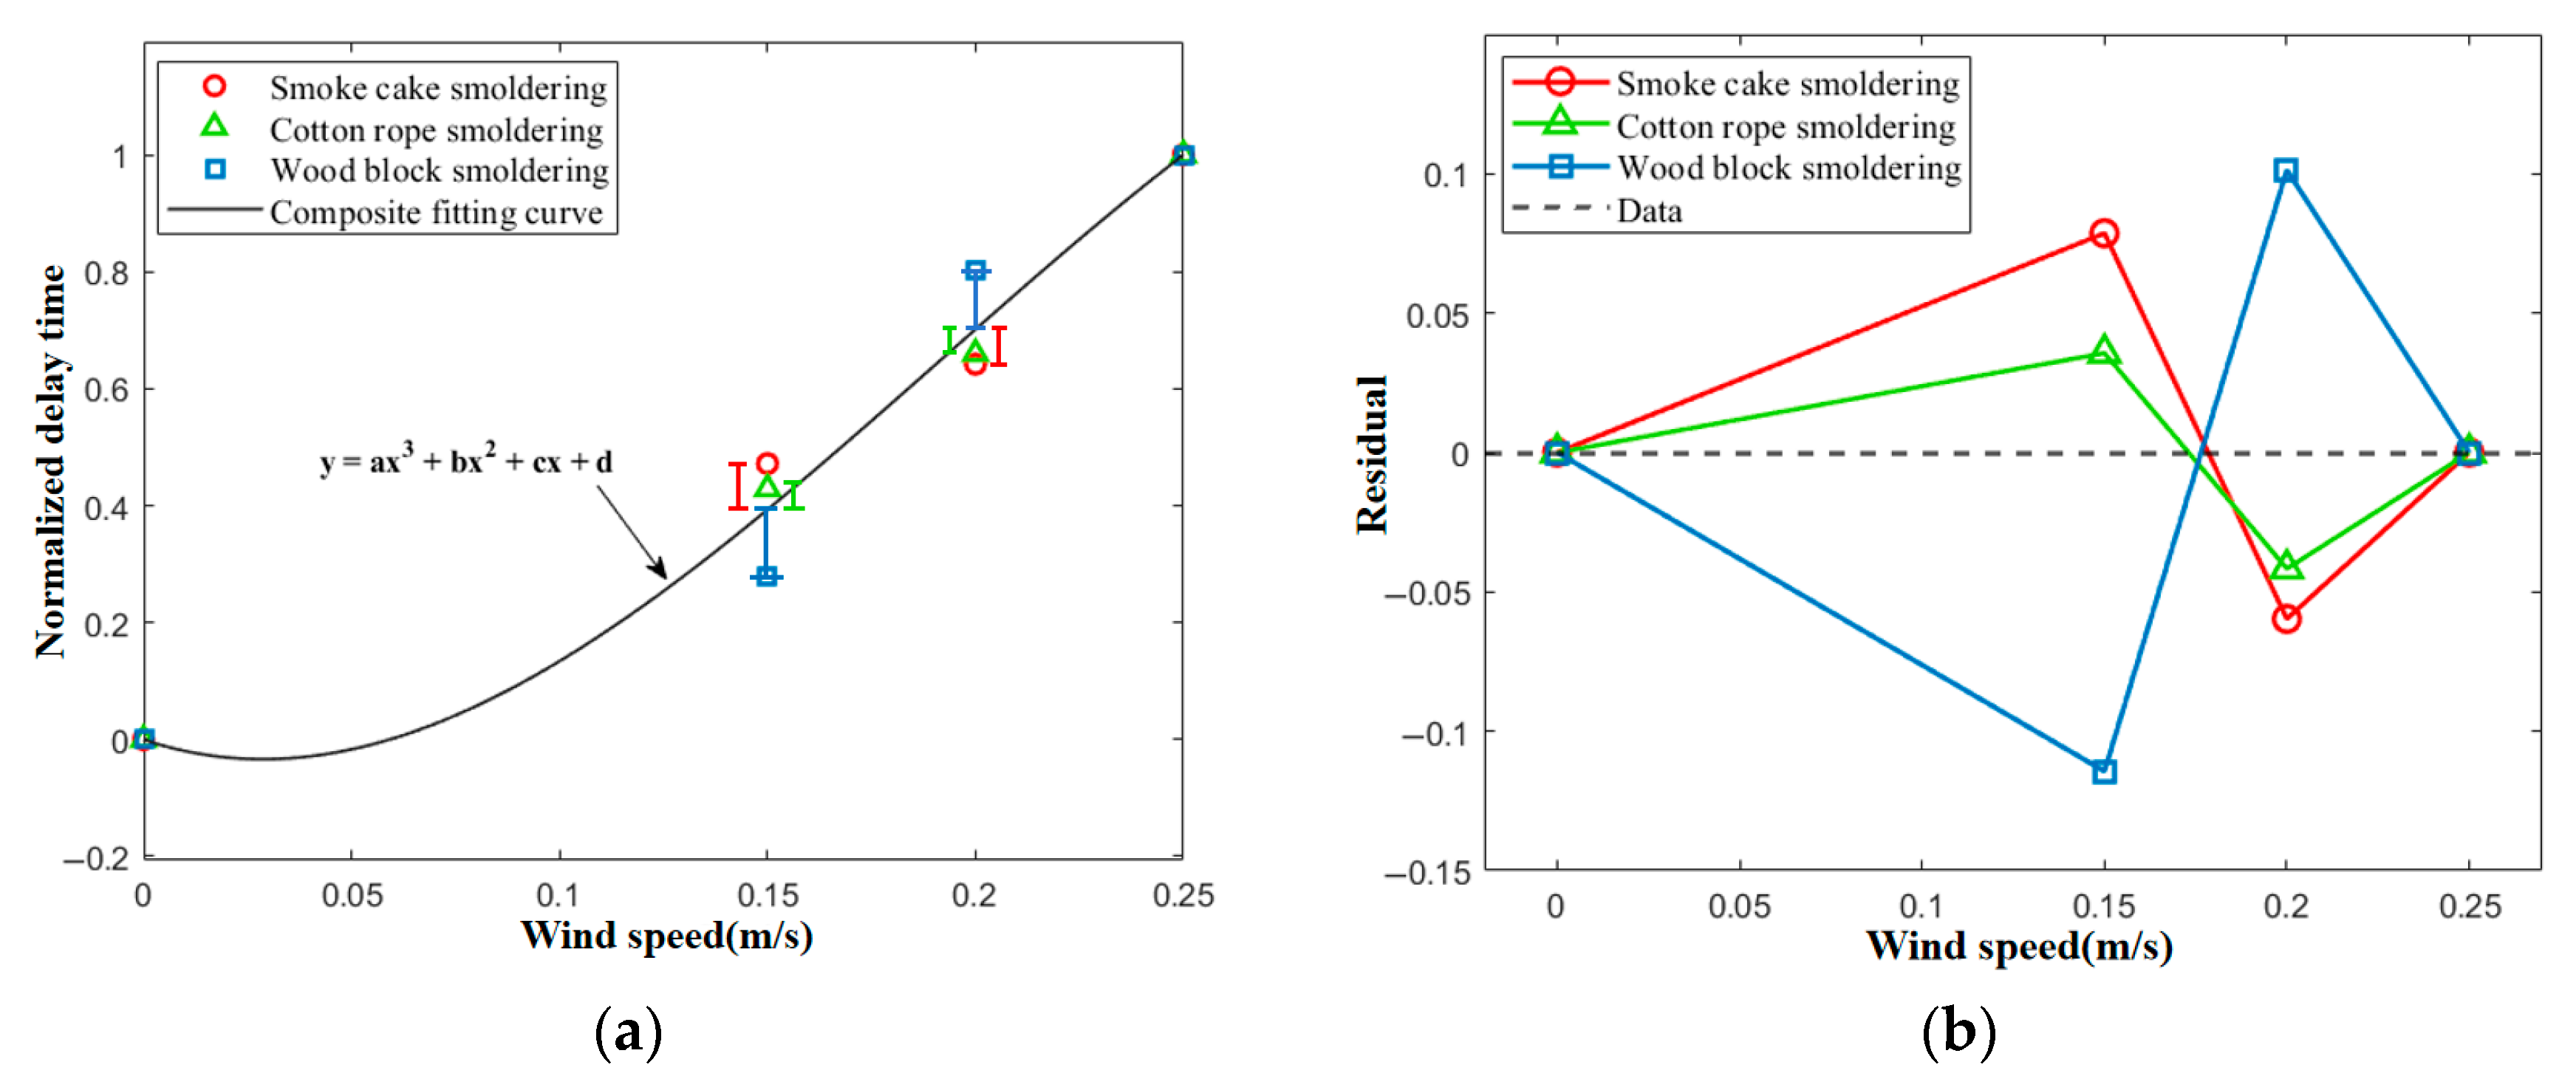
Carry out a fitting analysis on the above data and construct a prediction model for the alarm time of the detector. The fitting curves and fitting residuals of the standardized alarm delay times for the three types of fire source conditions under wind speed interference are shown in Figure 10.
The fitting results indicate that the fitting relationship between the normalized alarm delay time data of the detector under three types of fire source conditions and the wind speed interference condition is a third-order polynomial function (as in Formula (4)). Assign parameters to the fitting curve of the data as follows: a = −78.9; b = 45.3; c = −2.4028; and d = 0. Based on the fitting curve, the fitting degree R2, maximum residual, and alarm delay time error analysis were performed on the data under different fire source conditions, as shown in Table 4.
Analysis of Table 4 shows that the fitting curve of this function has a good fitting effect on the alarm delay time data for three types of fire source conditions, with R2 values all greater than 0.97; in all fire source conditions under wind speed interference, the prediction error of the detector alarm delay time is controlled within the range of 5.7 s.

3.2. Alarm Response Regularity and Time Prediction Models of Detectors Under Water Vapor

3.2.1. Analysis of Response Regularity

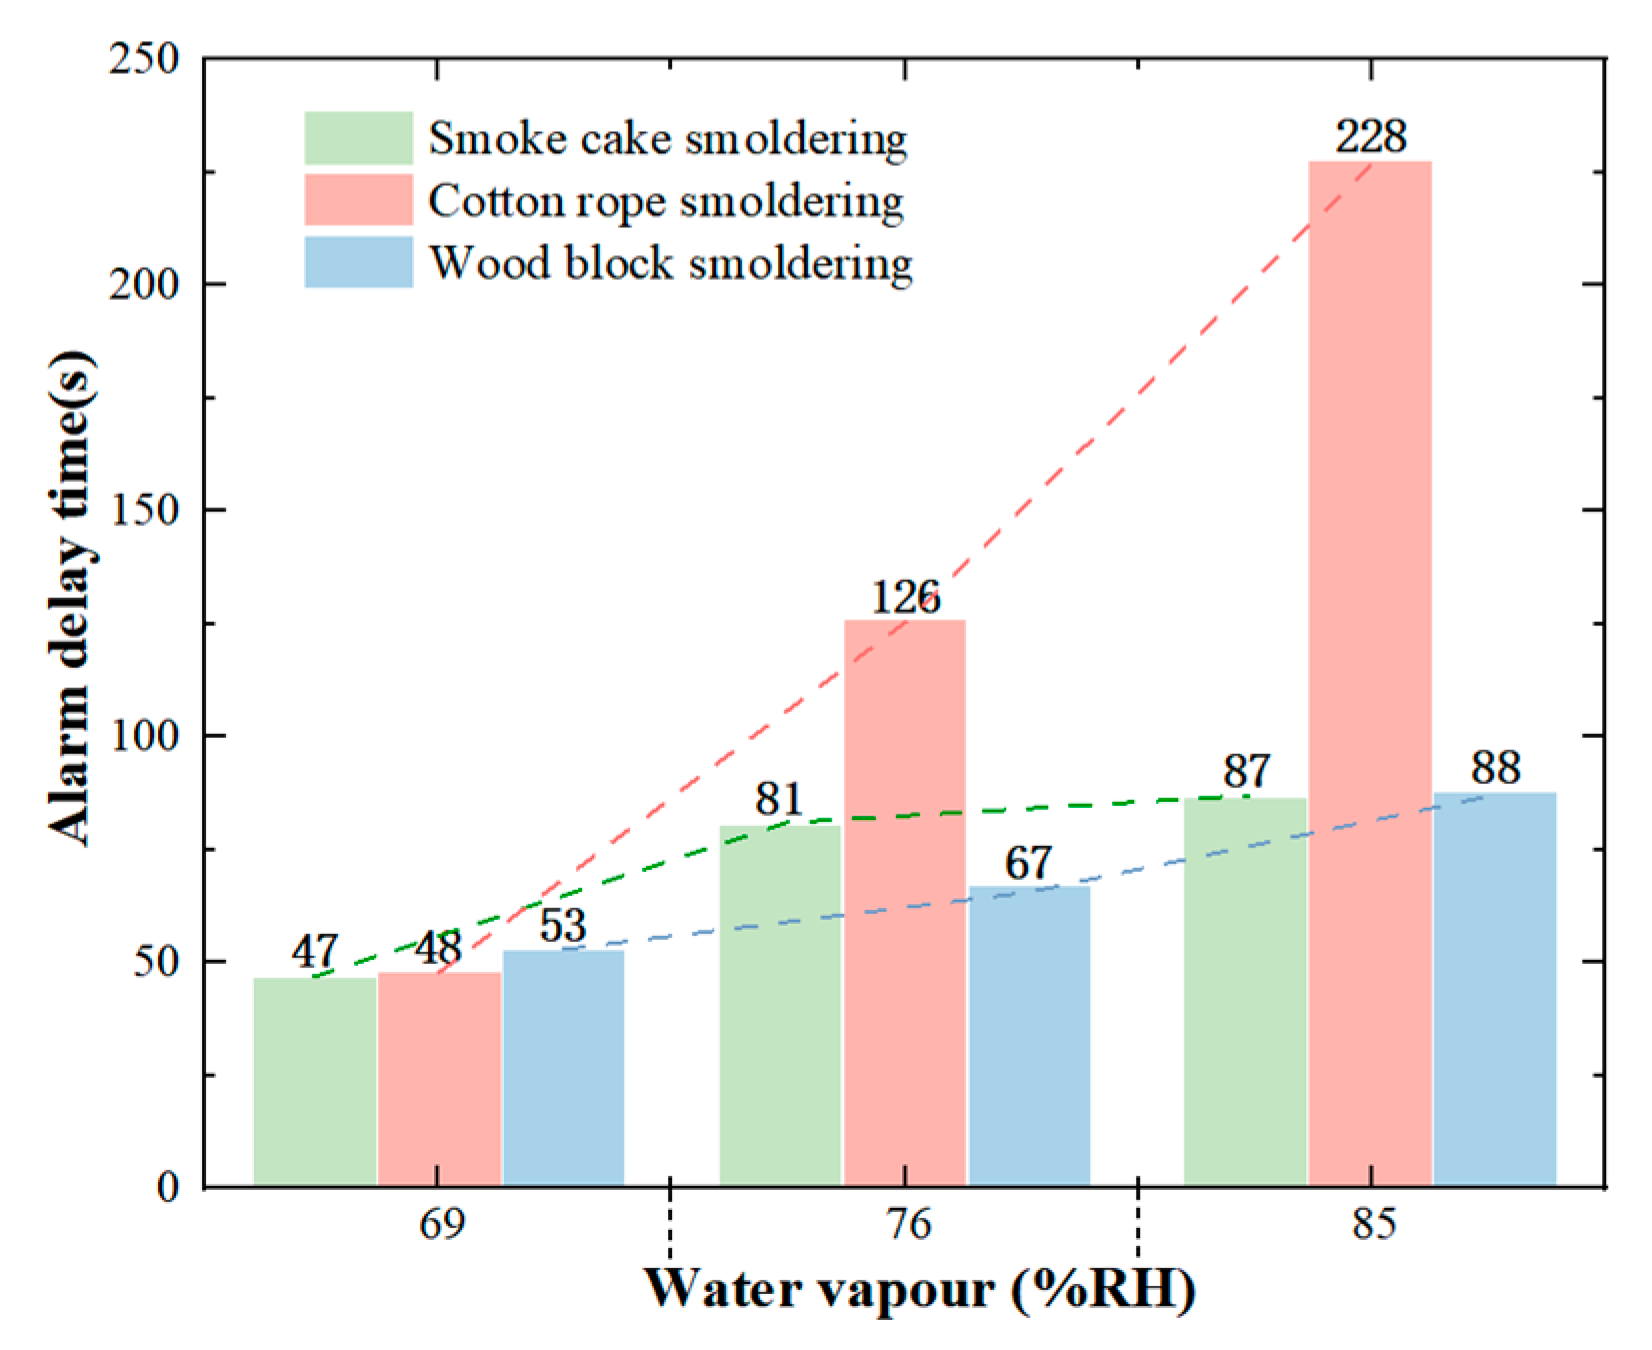
The alarm times of fire detectors for smoke cake smoldering, cotton rope smoldering, and wood block smoldering under non-interference conditions and under different gradients of water vapor interference conditions are shown in Figure 11. The visualization of the alarm delay time for three types of fire source conditions under water vapor interference is shown in Figure 12.
Through the analysis of the experimental data in Figure 11 and Figure 12, it can be seen that under the conditions of 69% RH, 76% RH, and 85% RH water vapor interference the alarm times of fire detectors will be delayed to varying degrees under the three types of fire source conditions. The specific regularities are as follows:
  • Under three types of fire source conditions, the initial rise time of smoke concentrations in the smoke detector and the alarm delay time are positively correlated with the gradient of water vapor interference. That is, as the gradient of water vapor interference increases, the initial rise time of the smoke concentration in the smoke detector is prolonged and the alarm delay time increases.
  • Under conditions of water vapor interference, the degree of impact of different interference gradient levels on the alarm delay time of three types of fire source condition detectors varies. The alarm delay times for the three types of fire source condition detectors are as follows: cotton rope smoldering (48–228 s) > wooden block smoldering (53–88 s) > smoke cake smoldering (47–87 s).

3.2.2. Construction of Alarm Time Prediction Model

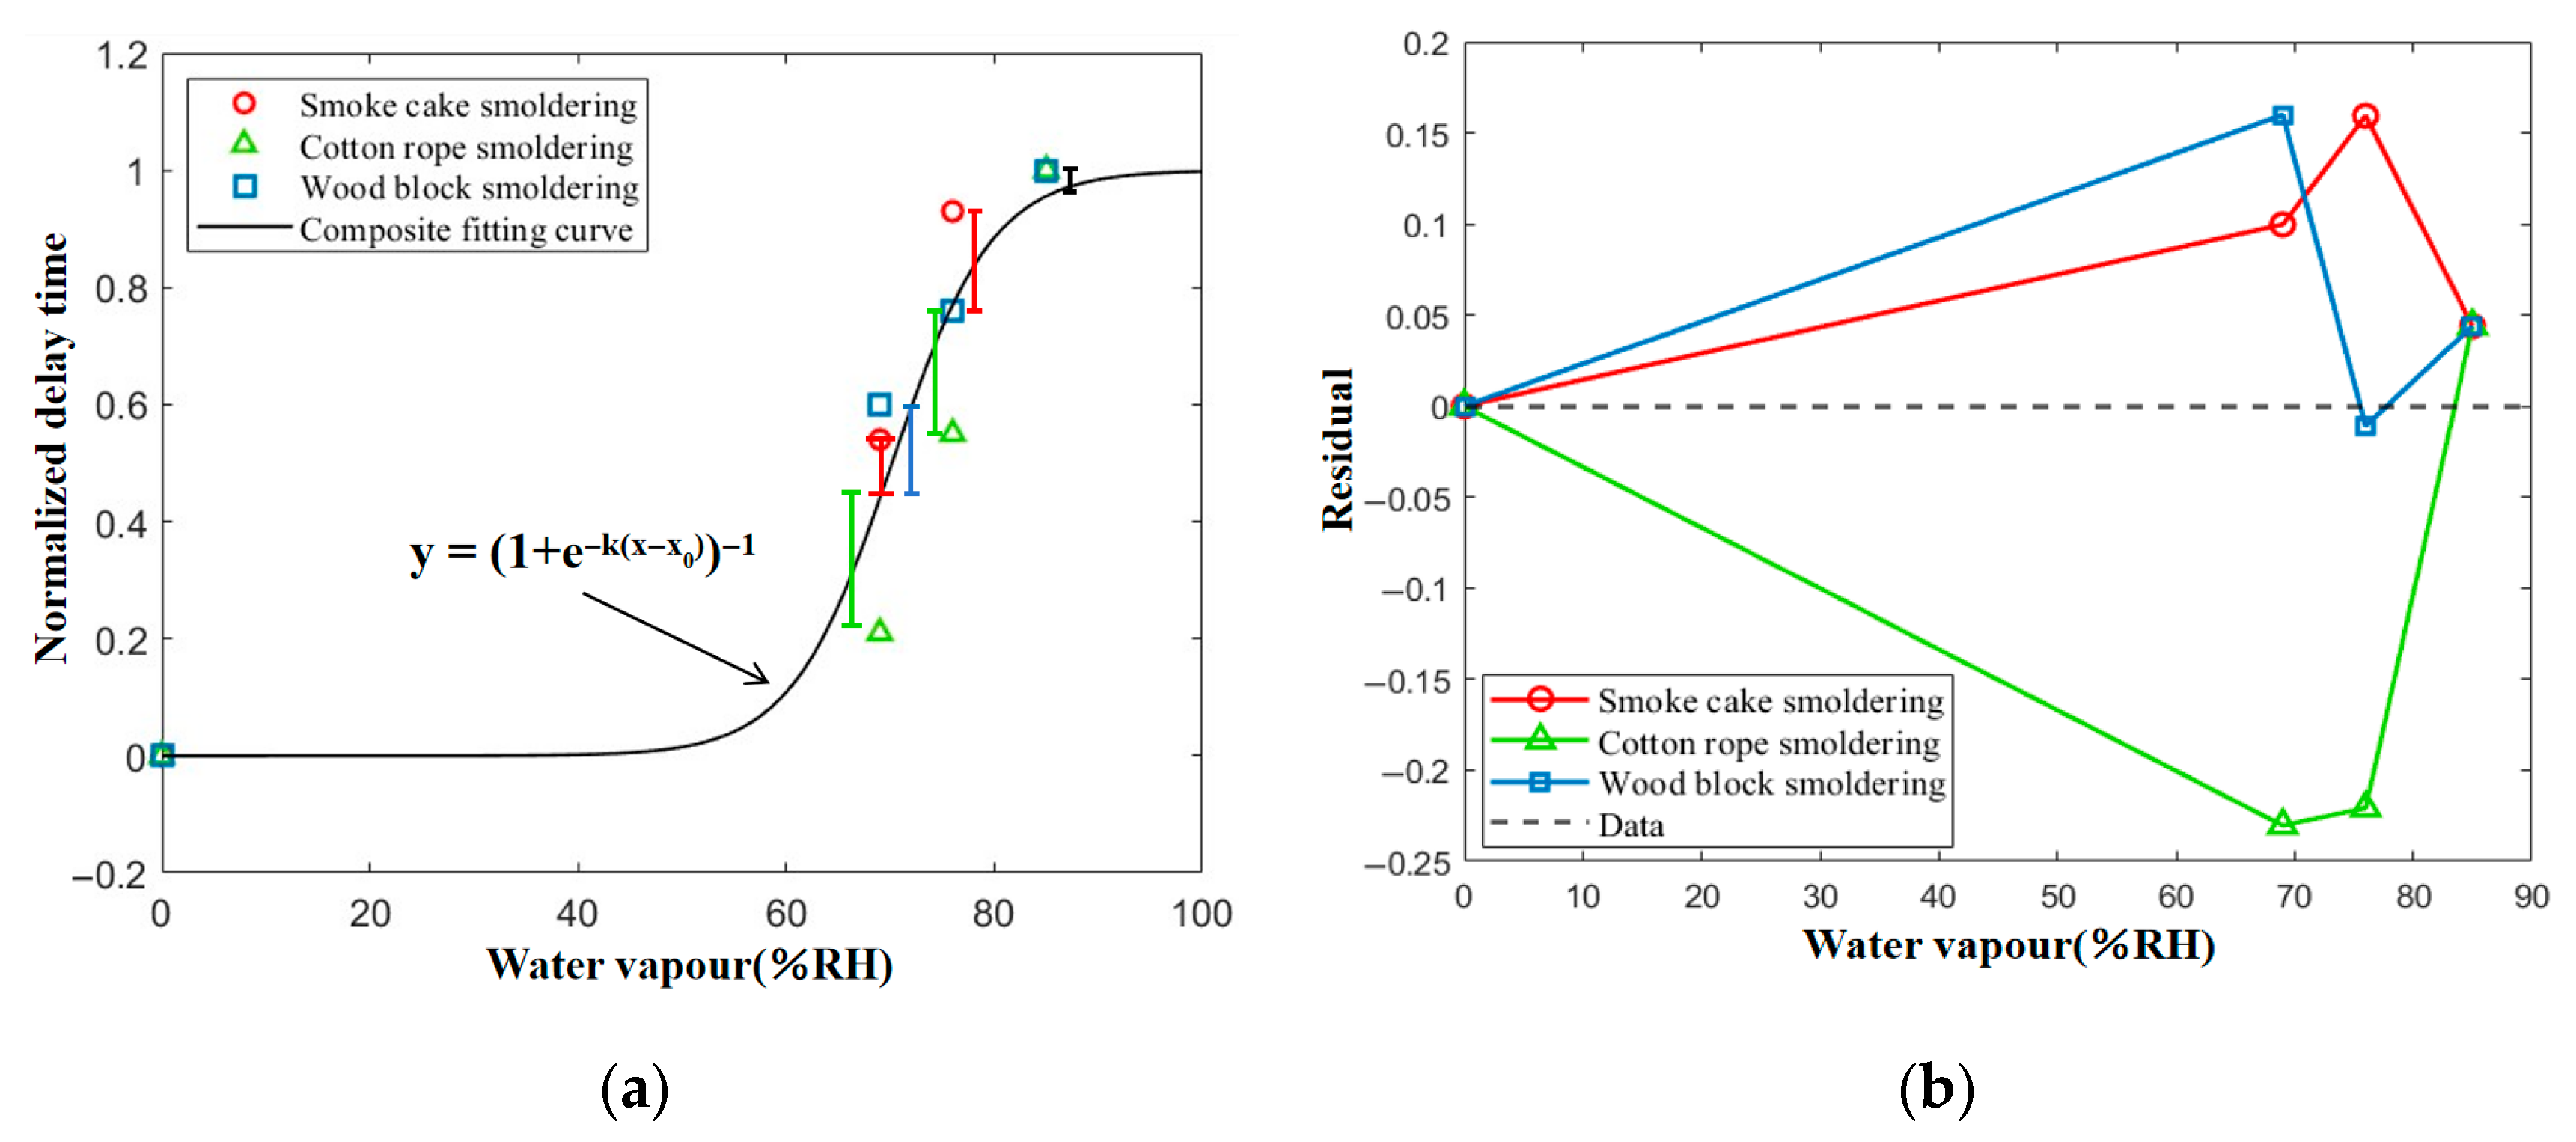
The fitting curves and fitting residuals of the standardized alarm delay times for the three types of fire source conditions under water vapor interference are shown in Figure 13.
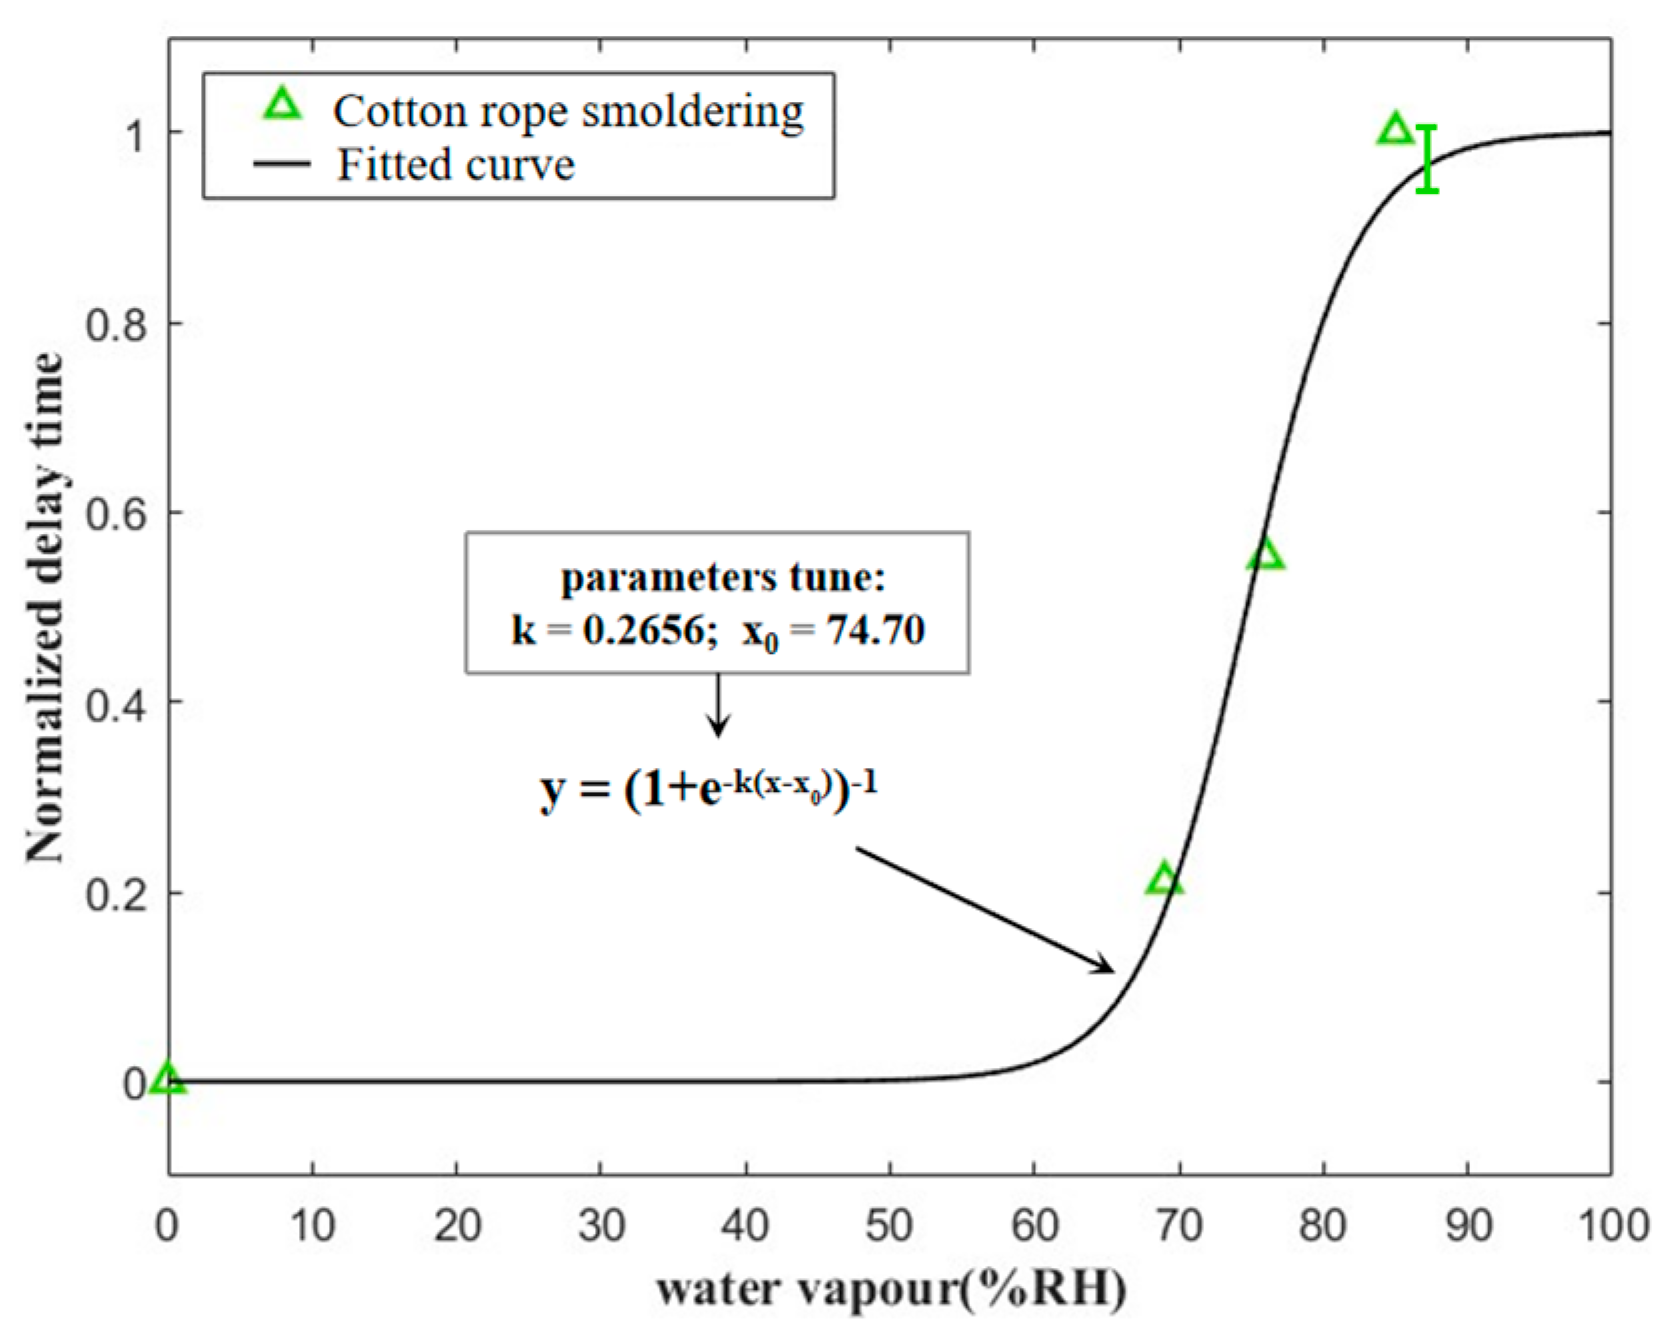
The fitting results indicate that the fitting relationship between the standardized alarm delay time data of the detector under three types of fire source conditions and the water vapor interference conditions is a Sigmoid function (as in Formula (5)). Assign parameters to the fitting curve of the data as follows: k = 0.2075; x 0 = 70.16 . Based on the fitting curve, the fitting degree R2, maximum residual, and alarm delay time error analysis were performed on the data under different fire source conditions, as shown in Table 5.
According to Table 5, the fitting curve of the Sigmoid function has a fitting degree R2 > 0.94 for the alarm delay time data of smoke cake smoldering and wood block smoldering conditions, indicating a good fitting effect. The prediction error of the detector alarm delay time is controlled within 14 s. However, for the alarm delay time data of cotton rope smoldering fire source conditions, the fitting degree R2 = 0.8188 is relatively poor. Therefore, the k and x0 parameters in the Sigmoid function are adjusted to repair the fitting effect. After further fitting and analyzing the delayed alarm data of the cotton rope smoldering condition detector using the Sigmoid function, the slope parameter k = 0.2656 and the center point x0 = 74.70 were adjusted. The adjusted fitting curve is shown in Figure 14.
After adjusting the parameters, the fitting degree R2, maximum residual, and maximum error of the alarm delay time data fitting curve of the cotton rope smoldering condition detector under water vapor interference conditions are shown in Table 6.
According to Table 6’s analysis, after parameter adjustment, the fitting curve of the alarm delay time data of the cotton rope smoldering condition detector under water vapor interference conditions has a fitting degree of R2 = 0.99, which is good and similar to the other two fire source conditions. The prediction error of the detector alarm delay time is controlled within 14 s.

3.3. Alarm Response Regularity and Time Prediction Models of Detectors Under Burning Incense

3.3.1. Analysis of Response Regularity

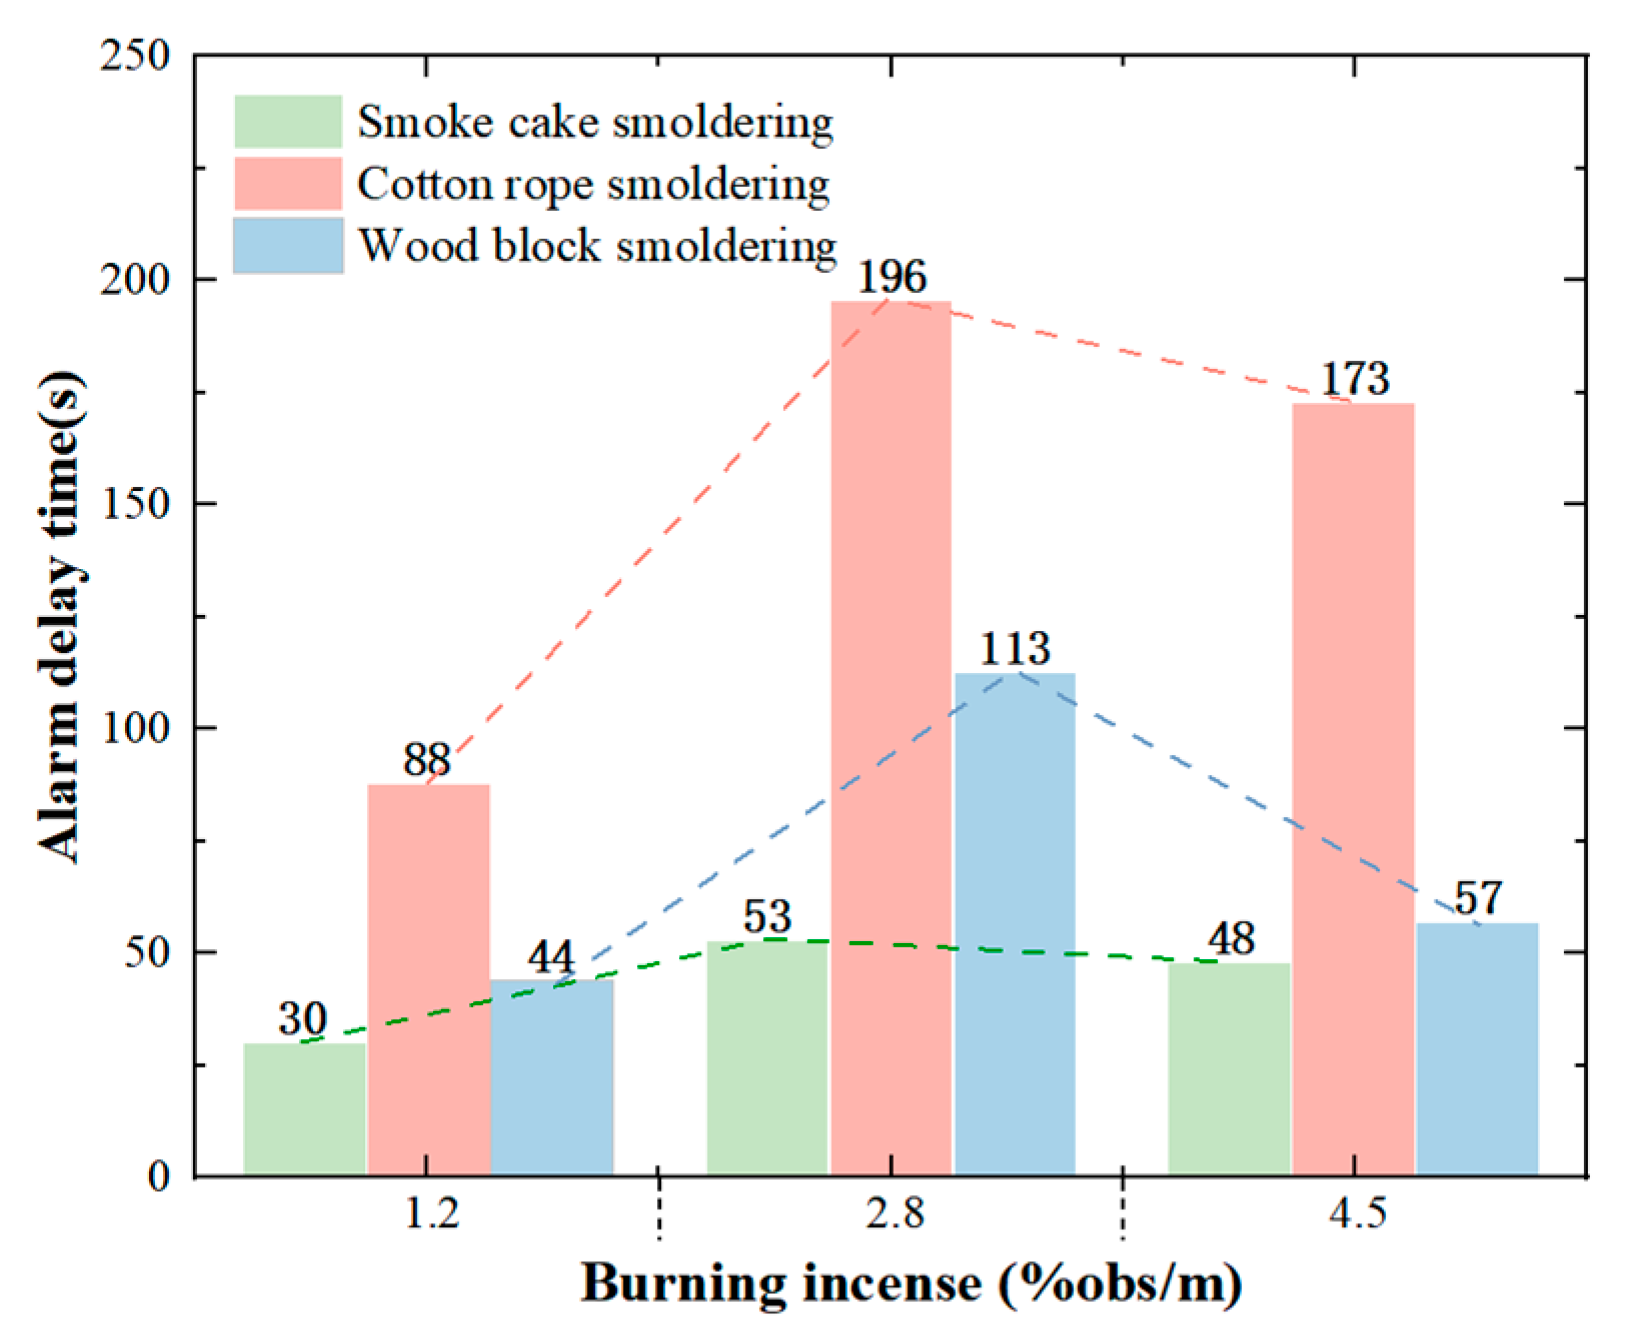
The alarm times of fire detectors for smoke cake smoldering, cotton rope smoldering, and wood block smoldering under non-interference conditions and under different gradients of burning incense interference conditions are shown in Figure 15. The visualization of the alarm delay time for three types of fire source conditions under burning incense interference is shown in Figure 16.
Analyzing the experimental data from Figure 15 and Figure 16 shows that under three types of fire source conditions, different gradient burning incense interference conditions will delay the alarm time of the fire detectors. The specific regularities are as follows:
  • Under three types of fire source conditions, the initial rise time of the smoke concentration detected by the smoke detector and the alarm delay time both exhibit a unimodal variation trend with the increase in interference from the burning incense, but the overall response shows a delay. It indicates that the interference of burning incense has a nonlinear effect on the alarm performance of the detector, with a critical interference threshold point. Before this point, an increase in the amount of interference will lead to a greater delay in the alarm; beyond this point, further increases in interference may actually shorten the alarm delay time.
  • Under burning incense interference conditions, there are significant differences in the alarm delay times of fire detectors under different fire source operating conditions. The alarm delay times for the three types of fire source condition detectors are as follows: cotton rope smoldering (88–196 s) > wood block smoldering (44–113 s) > smoke cake smoldering (30–53 s).

3.3.2. Construction of Alarm Time Prediction Model

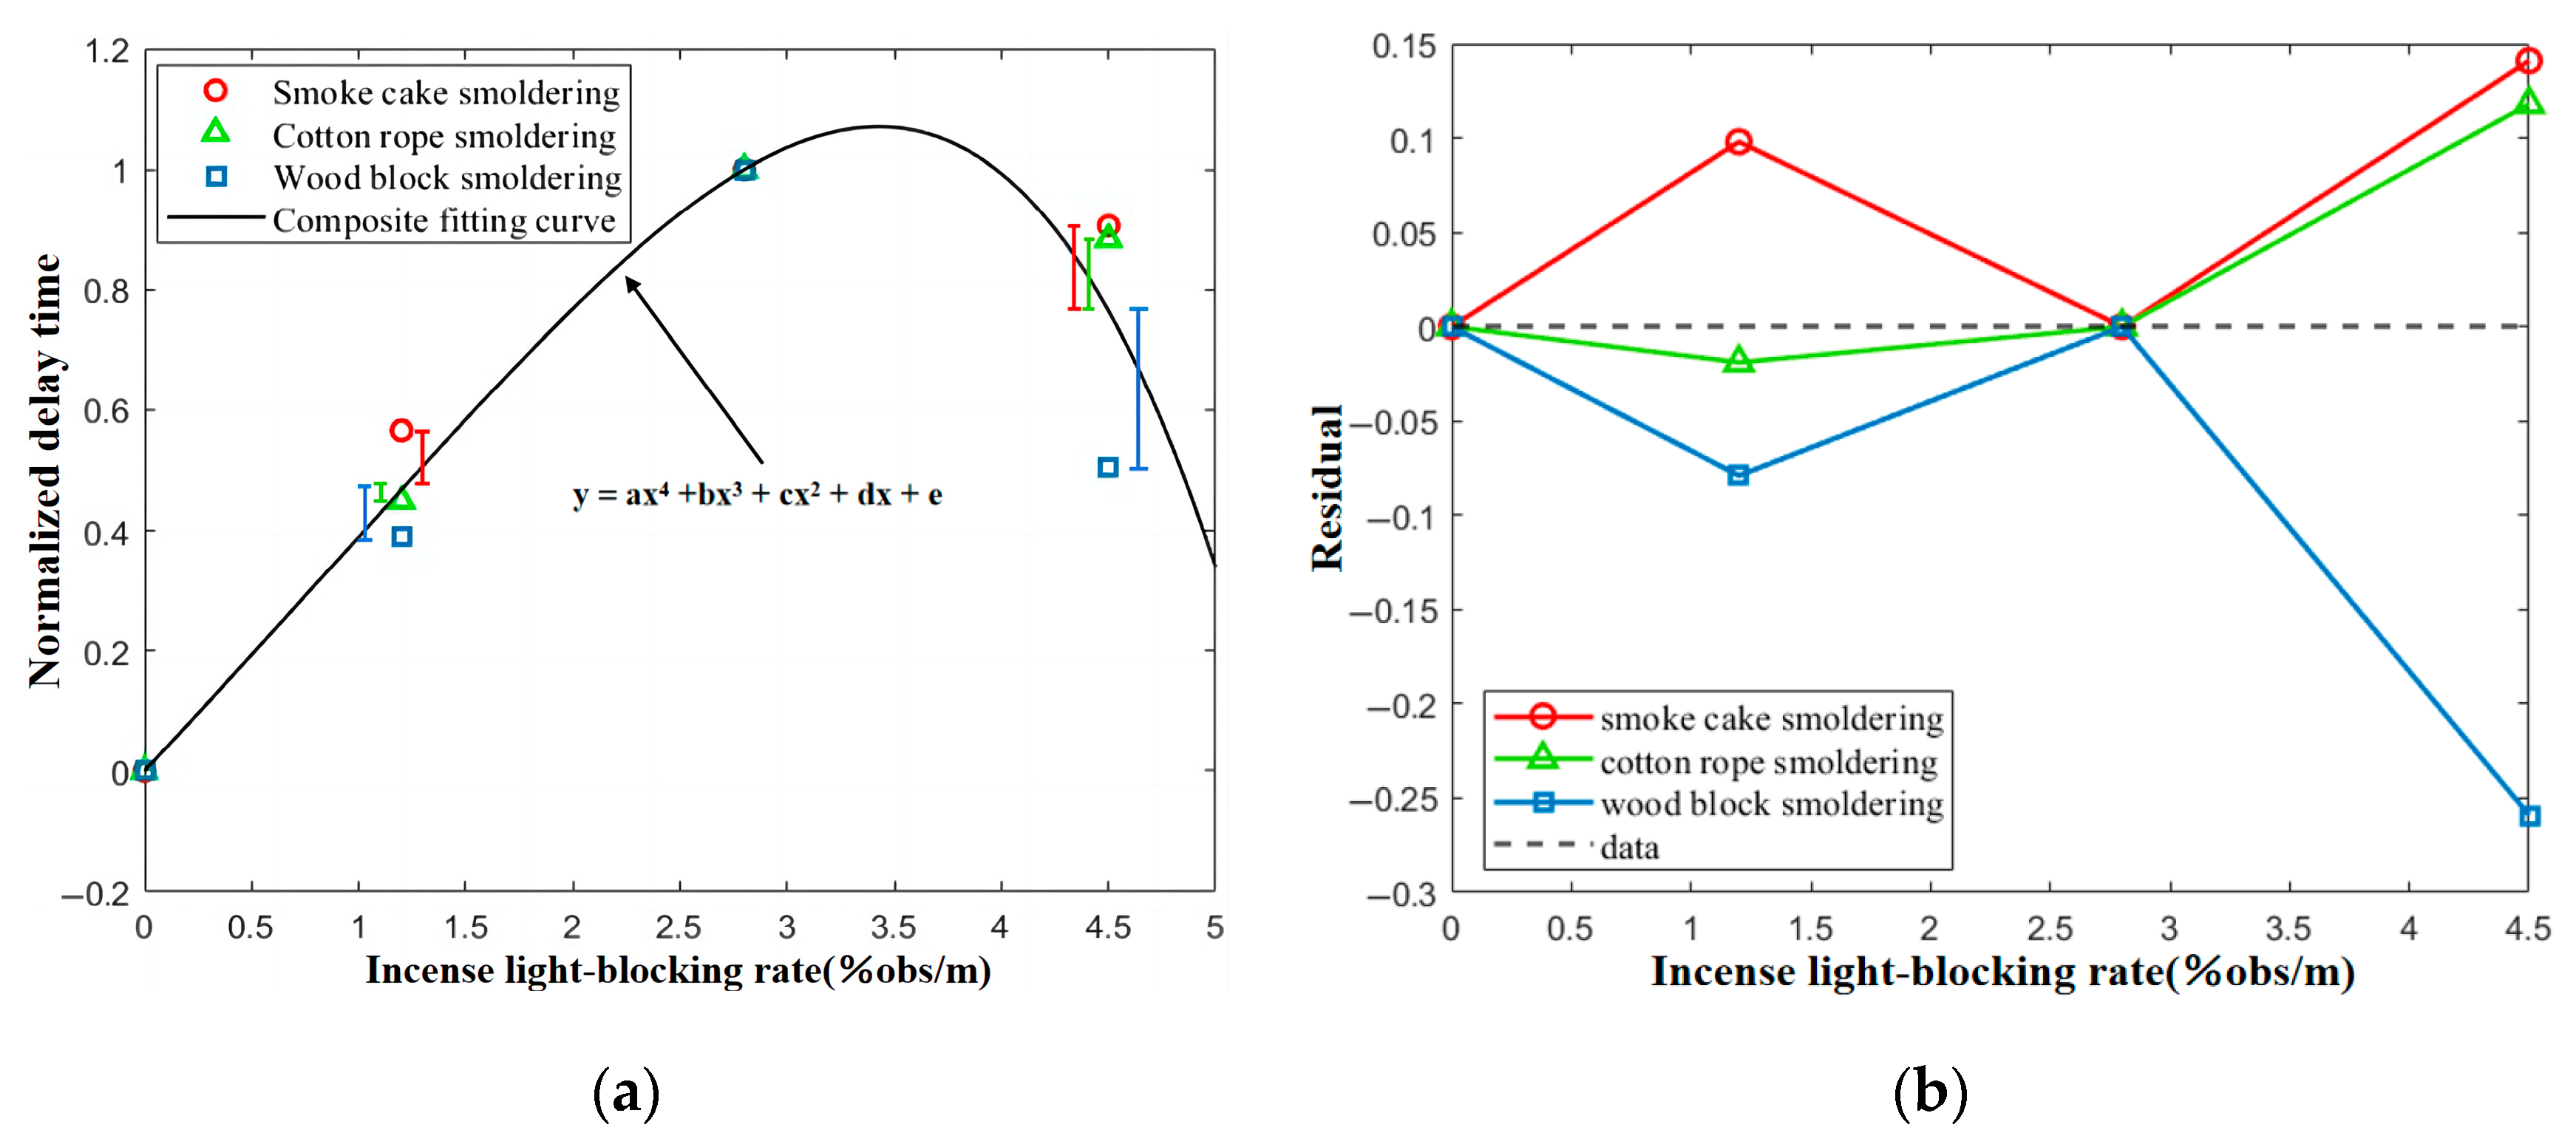
The fitting curves and fitting residuals of the standardized alarm delay times for the three types of fire source conditions under burning incense interference are shown in Figure 17.
The fitting results indicate that the fitting relationship between the standardized alarm delay time data of the detector under three types of fire source conditions and the combustion interference conditions is a fourth-order polynomial function (as in Formula (6)). Assign parameters to the fitting curve of the data as follows: a = −0.0041; b = 0.0079; c = 0; d = 0.3858; and e = 0. Based on the parameter assignment, a fitting curve was fitted to analyze the fitting degree R2, maximum residual, and alarm delay time error of the data under different fire source conditions, as shown in Table 7.
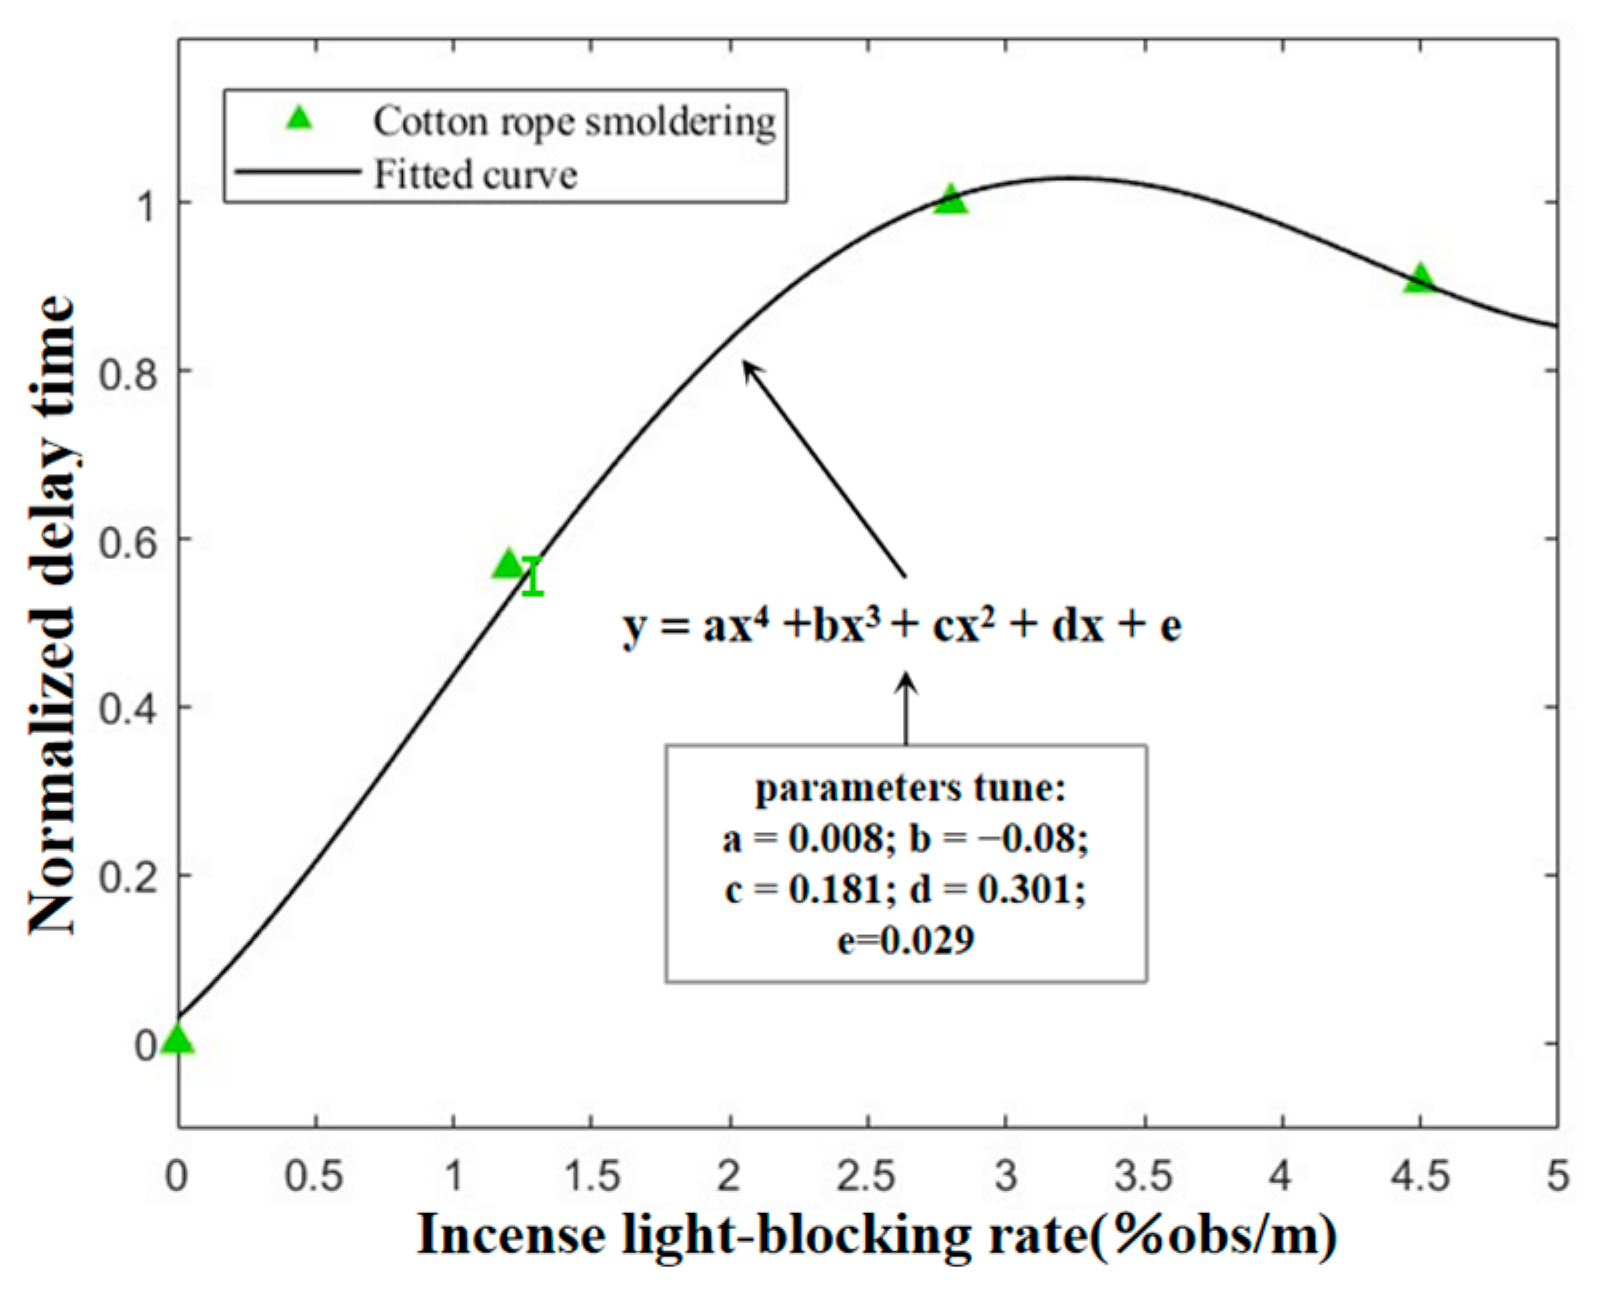
According to Table 7’s analysis, the parameter assignment fitting curve has a fitting degree R2 > 0.96 for the alarm delay time data of smoke cake smoldering and cotton rope smoldering conditions, indicating a good fitting effect. The prediction error of the alarm delay time of the smoke cake smoldering condition detector is controlled within 7.5 s; although the fitting degree R2 of the cotton rope smoldering condition is greater than 0.98 and the fitting effect is good, the prediction error of the detector alarm delay time is still as high as 23.0 s due to the base effect of the detector alarm time under non-interference conditions. Therefore, further parameter optimization is needed to minimize the error. In addition, the fitting degree of the alarm delay time data for the wood block smoldering fire source condition is R2 = 0.9265, which is relatively poor. Therefore, for the wood block smoldering condition, it is also necessary to adjust the parameters a, b, c, d, and e in the fourth-degree polynomial function to reduce the prediction error of the detector alarm delay time. The optimization and fitting of delayed alarm data for cotton rope smoldering and wood block smoldering condition detectors are as follows:
  • Adjust the fitting parameters for cotton rope smoldering conditions as follows: a = 0.008; b = −0.08; c = 0.181; d = 0.301; e = 0.029, that is: y = 0.008x4 + (−0.08x3) + 0.181x2 + 0.301x + 0.029;
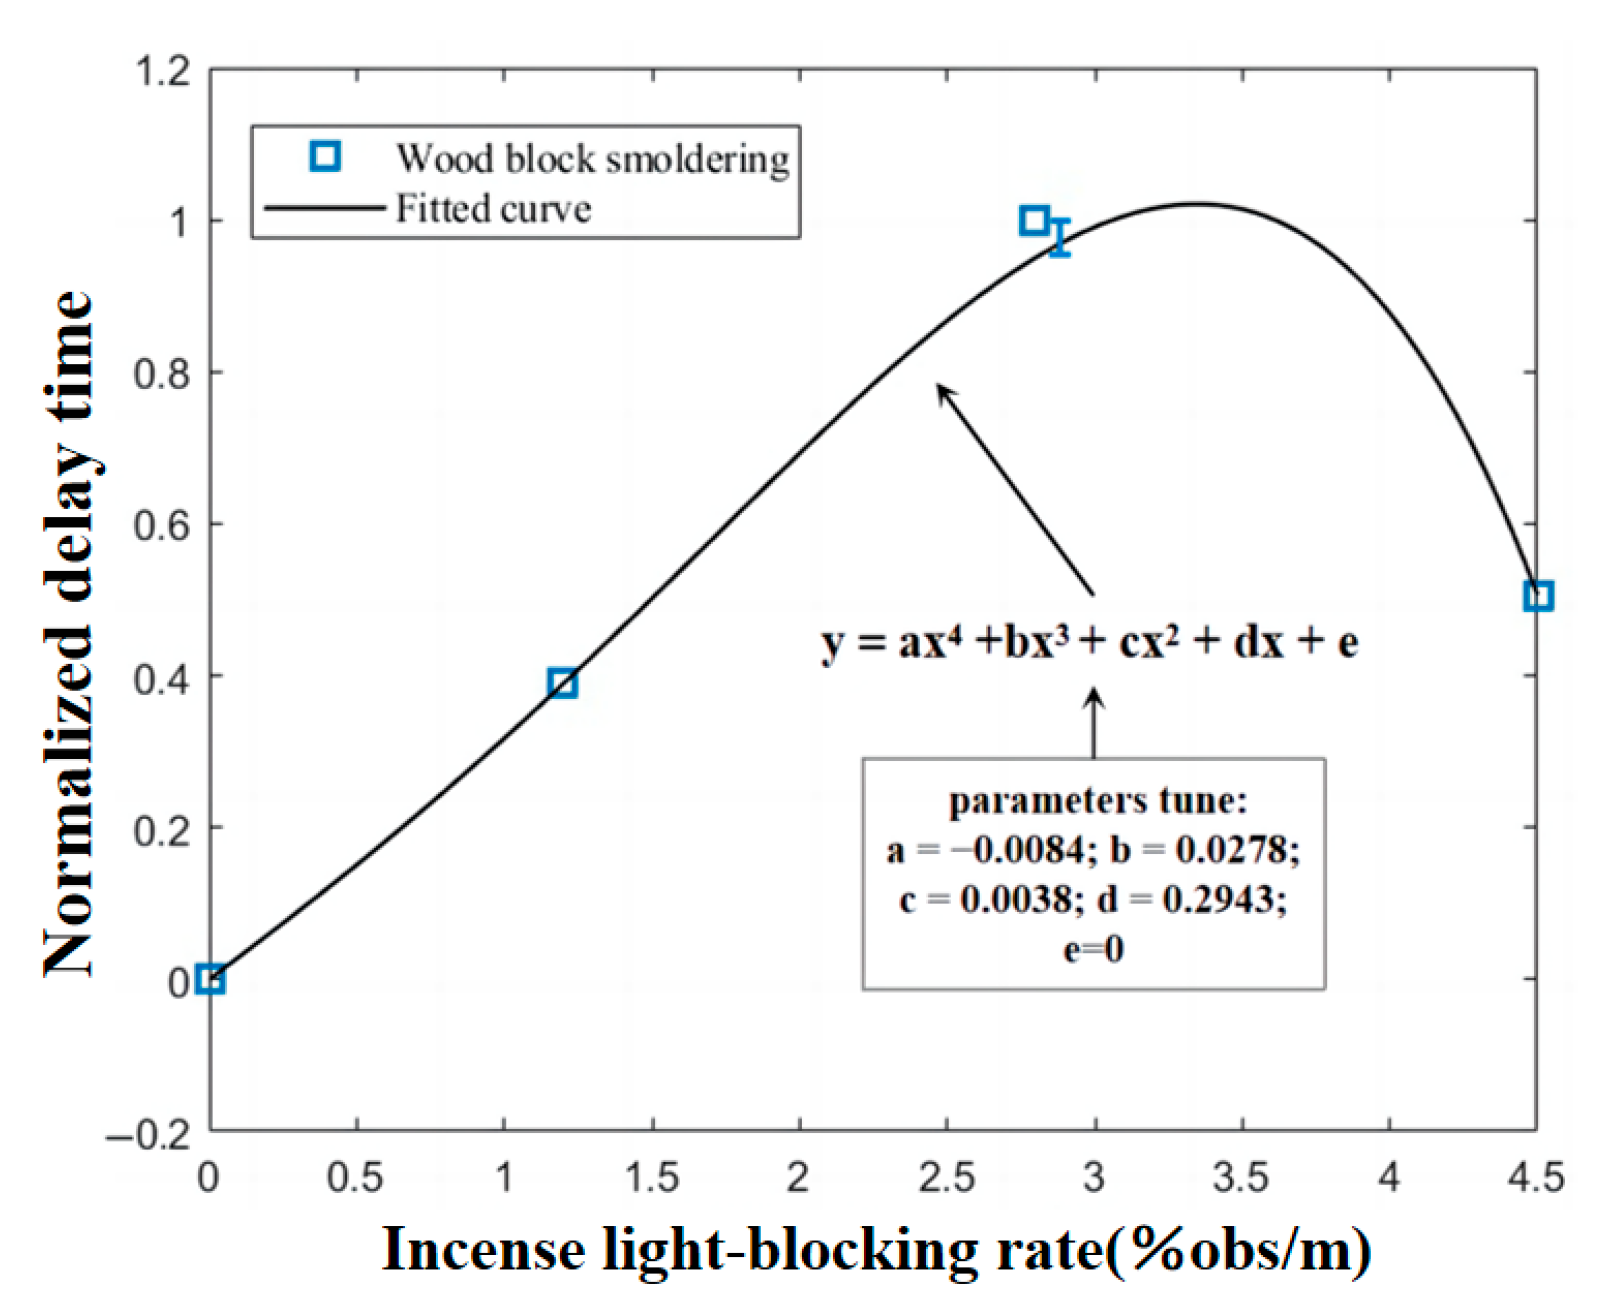
  • Adjust the fitting parameters for wood block smoldering conditions as follows: a = −0.0084; b = 0.0278; c = 0.0038; d = 0.2943; e = 0, that is: y = −0.0084x4 + 0.0278x3 + 0.0038x2 + 0.2943x.
The fitting curves of the adjusted cotton rope smoldering and wood block working conditions are shown in Figure 18 and Figure 19, respectively.
After adjusting the parameters, the fitting degree R2, maximum residual, and maximum error of the alarm delay time data fitting curve of the cotton rope smoldering and wood block smoldering condition detectors under the condition of burning incense interference are shown in Table 8.
According to Table 8’s analysis, after parameter adjustment, the fitting curve of the alarm delay time data for cotton rope smoldering and wood block smoldering under the condition of burning incense interference has a fitting degree of R2 > 0.99, indicating a good fitting effect. The prediction error of the detector alarm delay time is controlled within the range of 7.4 s and 5.7 s, respectively.
In summary, a comprehensive analysis of the detector alarm data under three types of interference conditions shows that, compared to the other two types of fire sources, the cotton rope smoldering fire source has the longest alarm delay time for fire detectors under three different interference source conditions, indicating that among the three types of fire sources, the sensitivity of fire detectors to the smoke characteristic parameters generated by cotton rope smoldering is the lowest. In addition, among the three types of fire source conditions, the overall average delay time of the fire detectors under the smoldering condition of the smoke cake is the shortest, indicating that the fire detectors have the best detection stability for the smoke generated by the smoldering of the smoke cake.
Furthermore, three prediction models for the alarm time of the detector under different interference conditions were constructed:
  • Under wind speed interference conditions, the normalized alarm delay time data of detectors for three types of fire source conditions are well fitted by a third-order polynomial function (as in Formula (4)), and the fitting curve is highly consistent with the actual data. After parameter assignment, the prediction error of the detector alarm delay time under all operating conditions is controlled within 5.7 s.
  • Under the condition of water vapor interference, the fitted curve conforms to the Sigmoid function (as in Formula (5)). Among them, the fitting effect of cotton rope smoldering conditions was poor. Parameter optimization was carried out, and the prediction error under all conditions was ultimately controlled within 14 s.
  • Under the condition of burning incense interference, the fitted curve conforms to a fourth-order polynomial function (as in Formula (6)). Among them, the residuals of cotton rope smoldering and wood block smoldering conditions are relatively large. After parameter optimization and application, the prediction error under all conditions is controlled within 7.5 s.

3.4. Comprehensive Analysis of the Impact Degree of Different Interferences

From Section 3.1, it can be seen that the T0 values under the three conditions of smoke cake smoldering, cotton rope smoldering, and wood block smoldering are 40 s, 42 s, and 473 s, respectively. Therefore, based on Equation (7), the impact of different interference sources on the alarm response delay of the detector under three types of fire source conditions is visualized, as shown in Figure 20.
  • Under the condition of smoke cake smoldering, the influence of wind speed and incense burning interference on the detector alarm delay time is relatively similar. The impact of three interference conditions on the alarm time delay of the detector is as follows: water vapor interference > burning incense interference > wind speed interference.
  • In the case of smoldering conditions of the cotton rope, the alarm response time of fire detectors is significantly affected by various sources of interference. Among them, the influence of wind speed and water vapor interference conditions on the alarm delay time of the detector is significantly different. The impact of three interference conditions on the alarm time delay of the detector is as follows: water vapor interference > burning incense interference > wind speed interference.
  • In the case of smoldering conditions of the wood block, the alarm response time of fire detectors is relatively less affected by various interference sources. The impact of three interference conditions on the alarm time delay of the detector is as follows: burning incense interference > water vapor interference > wind speed interference.
A comprehensive analysis shows that, compared to the other two types of interference conditions, the wind speed interference condition has the least impact on the alarm delay of the detectors under the three fire source conditions. It indicates that in application scenarios where three types of interferences coexist, particulate interference sources in the environment (such as water vapor particles, smoke from burning incense, etc.) should be given priority in consideration for point-type smoke detectors.

4. Discussion

Through full-scale experiments, this study quantified for the first time the response regularity of point-type smoke detectors under typical interference sources in ancient buildings (wind speed, moisture, and incense burning), filling the research gap in the response characteristics of smoke detectors in the complex environments of ancient buildings. In addition, based on a further fitting analysis of the experimental data, a prediction model for the alarm time of the detectors under three types of interference conditions was established, providing a theoretical basis for the performance optimization of the fire detection system in ancient buildings. Based on the above research findings, the limitations of the current study are pointed out, and constructive suggestions are provided for how future research can be expanded.

4.1. Limitations

Due to the limitations of the experimental conditions, this study may have the following limitations:
  • In terms of architectural structure, the research results may only be applicable to ancient buildings with a flush gable roof shape;
  • The gradient ranges of the three typical interference sources—wind speed, water vapor, and burning incense—are limited by the equipment but have covered the majority of the effects of actual environmental interference conditions on the alarm response characteristics of the detector. However, for certain special environmental conditions, full coverage cannot be achieved;
  • In this study, only point-type smoke fire detectors were used for the experiments. The conclusions drawn may not be applicable to other types of detectors, and the applicability of these conclusions to other types of detectors needs to be verified.

4.2. Prospects

In response to these limitations, the future research directions include the following:
  • To verify the universality of the research conclusions, the scope of the study was expanded to include different architectural styles such as hip roofs and duo-pan roofs. Through comparative experiments, the influence laws of various interference conditions on smoke diffusion and detector response under different roof structures were revealed, and a more universally applicable fire detection optimization model for multiple building types was constructed.
  • Future research should further expand the monitoring of the actual environmental parameters of ancient buildings, including key indicators such as humidity, wind speed, and the concentration of smoke and dust particles. The experimental equipment should be upgraded to cover a wider range of interference source gradients, and a more comprehensive study should be conducted to explore the influence laws of various interference conditions on the alarm response of the detector. In addition, in-depth research should be carried out on the alarm response mechanism of the detector under the coupling and synergy effect of multiple interference sources, and an alarm time prediction model under composite interference conditions should be established.
  • Future research will expand to comparative tests of multiple types of fire detectors to investigate the differences in the applicability of different types of detectors (such as linear beam smoke detectors, aspirating-type, and composite-type) under typical interference sources in ancient buildings. This will help verify the universality of the conclusions and establish corresponding alarm time prediction models.

5. Conclusions

This research focuses on the response patterns of point-type smoke detectors in typical interference conditions of ancient buildings with a flush gable roof. Through full-scale experiments in the field, it analyzed the alarm response regularity of the detectors under different gradient effects of three typical interference sources: wind speed, water vapor, and smoke from burning incense. It also constructed prediction models for the alarm response time of the detectors under these three types of typical interference conditions. The main conclusions are as follows:
  • Under typical interference conditions, the detector alarms may have false alarms. The overall accuracy rate of the detector alarms is approximately 97.8%. Apart from false alarms, in the three types of fire source conditions, the response characteristics of the initial increase in smoke concentration and the alarm delay time of the smoke detector are as follows: they show a nonlinear positive correlation with the increase in the wind speed and water vapor interference gradient, and they present a single-peak change characteristic with the increase in incense interference quantity.
  • Within the experimental conditions, there are significant differences in the alarm delay time under different fire source conditions under interference conditions. The promoting effect of wind speed on the pyrolysis process of wood blocks partially counteracted its interfering effect, minimizing the influence of wind speed on the delay time of the wood block smoldering condition; the delay time of the cotton rope smoldering condition was the longest under all interference conditions, while the average delay time of the smoke cake smoldering condition was the shortest, indicating that the detector had the lowest sensitivity to the smoke gas of the cotton rope smoldering and the optimal detection stability for the smoke gas of the smoke cake smoldering. Based on this, it is suggested that in ancient buildings with a large amount of cotton and linen textiles, the performance of point-type smoke fire detectors for these materials should be particularly optimized.
  • Among the three types of interference conditions, the wind speed interference condition has the least impact on the alarm delay of the detector under the three types of fire source conditions. This indicates that in the application scenarios where all three types of interferences exist simultaneously, point-type smoke detectors should first consider the influence of environmental particulate interference sources (such as water vapor particles, smoke from burning incense, etc.) and then consider the wind speed interference.
  • Develop a prediction model for the detector alarm time for three types of fire source conditions: Under wind speed interference, the fitting curve conforms to a cubic polynomial function (as in Formula (4)), and the prediction error is controlled within 5.7 s; under water vapor interference, the fitting curve conforms to the Sigmoid function (as in Formula (5)) after parameter optimization, and the prediction error is controlled within 14 s; and under incense burning interference, it conforms to a quartic polynomial function (as in Formula (6)) after parameter optimization and application, and the prediction error is controlled within 7.5 s.
Although full-scale experiments have limitations, their results still have a significant reference value. They can provide key experimental support for the performance optimization and improvement design of point-type fire detectors for ancient buildings and also offer a scientific basis for comparable research under different fire source characteristics and interference environments.

Author Contributions

Conceptualization, Y.X. and L.L.; methodology, Y.X. and S.Z.; software, Y.X.; validation, L.L., D.L. and W.C.; formal analysis, Y.X.; investigation, L.L., Y.H. and D.L.; resources, D.L.; data curation, Y.X., Y.Y. and S.Z.; writing—original draft preparation, Y.X.; writing—review and editing, L.L.; visualization, Y.X. and C.L.; supervision, W.C.; project administration, D.L.; funding acquisition, L.L. All authors have read and agreed to the published version of the manuscript.

Funding

This research was funded by the university-level key research project “Intelligent evaluation and early warning Technology of Fire Risk based on Big Data Analysis” of China People’s Police University, subject number ZDZX202102.

Data Availability Statement

The original contributions presented in this study are included in the article. Further inquiries can be directed to the corresponding author.

Acknowledgments

The authors would like to thank the anonymous reviewers for their valuable comments and suggestions.

Conflicts of Interest

The authors declare that the research was conducted in the absence of any commercial or financial relationships that could be construed as a potential conflict of interest.

References

  1. Zhang, Z.J.; Mei, X.J. Fire Protection of Ancient Buildings; Chemical Industry Press: Beijing, China, 2010. [Google Scholar]
  2. Wu, X.S. Practice and Reflection on Fire Protection of Cultural Relics and Ancient Buildings. China Emerg. Rescue 2022, 5, 79–83. [Google Scholar]
  3. Gou, B.Y.; Wu, B.; Ma, Y.F.; Su, J.L.; Jia, Z.P. Numerical Simulation of Notre-Dame Cathedral Fire Based on Simtec. Fire Sci. Technol. 2020, 39, 49–51. [Google Scholar]
  4. Toutiao. Australia News: Sudden Fire Breaks Out at Melbourne Buddhist Temple Mingyue Lay Buddhist Forest. Available online: https://www.toutiao.com/article/7196845331399574049/ (accessed on 6 February 2023).
  5. Sina Finance. Jiangsu News Broadcast: Gansu Shandan Reports Fire Incident at Great Buddha Hall of Dafo Temple. Available online: https://finance.sina.com.cn/wm/2023-07-25/doc-imzcwsyt7965875.shtml (accessed on 25 July 2023).
  6. Xinhua Net. Investigation Results of Fire Accident at Henan University Minglun Campus Released: 48 Individuals Held Accountable. Available online: https://www.xinhuanet.com/legal/20250125/2f884c5d64304ffdbd5d535826bdb1a9/c.html (accessed on 25 January 2025).
  7. Stand-Alone Photoelectric Smoke Fire Detector and Alarm. Fire Tech. Prod. Inf. 2017, 7, 92–93.
  8. Yoon, G.Y.; Han, H.S.; Mun, S.Y.; Park, C.H.; Hwang, C.H. DB Construction of Activation Temperature and Response Time Index for Domestic Fixed-temperature Heat Detectors in Ceiling Jet Flow. Fire Sci. Eng. 2020, 34, 35–42. [Google Scholar] [CrossRef]
  9. Sun, B.C.; Lin, T.J.; Guo, X.P.; Xiao, X. Application of infrared thermal imaging fire detection technology in oil-immersed transformers of nuclear power plants. Fire Sci. Technol. 2020, 39, 1529–1531. [Google Scholar]
  10. Zhou, Y.; Liu, G.; Xie, G. Flame detection method and application based on RGB-HSI model and initial flame growth characteristics. J. Phys. Conf. Ser. 2024, 2752, 012231. [Google Scholar] [CrossRef]
  11. Ma, Q.; Jiang, H.R.; Wang, K.; Wang, B.; Ding, L.; Ji, J. Optimization of Outdoor Image-Based Fire Detector Arrangement for Ancient Building Complexes. J. Tsinghua Univ. (Sci. Technol.) 2025, 65, 625–633. [Google Scholar]
  12. Zhong, C.; Li, X.; Liu, X.; Ding, H. Experimental study on interference source of smoke fire detector in religious building environment. IOP Conf. Ser. Earth Environ. Sci. 2020, 585, 012079. [Google Scholar] [CrossRef]
  13. Li, L.M.; Song, L.W.; Mei, Z.B.; Zhang, X. Experimental Study on Anti-Dust Pollution Performance of Photoelectric Smoke Fire Detectors. Fire Saf. Today 2022, 7, 5–8. [Google Scholar]
  14. Li, R.; Zhang, X.Q.; He, Y.J.; Lin, T.J.; Li, Y. Design of Anti-Condensation Device for Photoelectric Smoke Detectors in Nuclear Power Plants. Instrum. User 2019, 26, 71–73. [Google Scholar]
  15. Chai, X.F.; Zhang, Q. Research on Blue Light Detection Technology for Photoelectric Smoke Detectors. In Proceedings of the 2014 Annual Conference on Fire Science and Technology of China Fire Protection Association, Shanghai, China, 16 September 2014; China Fire Protection Association: Beijing, China, 2014; p. 5. [Google Scholar]
  16. Philipp, J.B.; Kirbach, K.; Hofmann, M.; Hppfe, A.; Schank, M.; Behrens, R.; Schultze, T. False alarm resisting smoke detector for mobility application. In Proceedings of the 16th International Conference on Automatic Fire Detection, Hyattsville, MD, USA, 12–14 September 2017. [Google Scholar]
  17. Fu, C.; Luo, H. Reflections on Fire Detection in Ancient Buildings. Electrotech Appl. 2021, 40, 92–95. [Google Scholar]
  18. Jeong, J.; Baik, S.; Yoon, H.; Kim, J.H. SimUV-Net: A novel approach for UV signal-based fire detection and classification leveraging supervised contrastive learning. Expert Syst. Appl. 2025, 277, 127120. [Google Scholar] [CrossRef]
  19. Zheng, G.K. Fire Behavior Analysis and Structural Fire Resistance Performance Study of Timber-Brick Ancient Buildings. Master’s thesis, Chang’an University, Xi’an, China, 2020. [Google Scholar] [CrossRef]
  20. Dong, X.L. Fire Combustion Science; People’s Public Security University of China Press: Beijing, China, 2014. [Google Scholar]
  21. Turns, S.R. An Introduction to Combustion. Yao, Q.; Li, S.Q.; Wang, Y., Translators; Tsinghua University Press: Beijing, China, 2009. [Google Scholar]
  22. Dong, J. Analysis of Fire Risk and Firefighting Strategies for Ancient Buildings. Constr. Eng. Des. 2024, 22, 32–35. [Google Scholar]
  23. GB 50116-2013; Code for Design of Automatic Fire Alarm Systems. Ministry of Housing and Urban-Rural Development of the People’s Republic of China, General Administration of Quality Supervision, Inspection and Quarantine of the People’s Republic of China, China Planning Press: Beijing, China, 2013.
  24. Liu, H.; Li, T.; Zhong, C. Research on Fire Prevention Technology for Ancient Buildings Based on BIM and Simulation Technology. Fire Sci. Technol. 2023, 42, 1228–1232. [Google Scholar]
  25. NFPA 72; National Fire Alarm and Signaling Code Handbook. National Fire Protection Association: Quincy, MA, USA, 2016.
  26. Li, K.; Liu, G.; Yuan, H.; Chen, Y.; Dai, Y.; Meng, X.; Huang, L. Dual-Wavelength Smoke Detector Measuring Both Light Scattering and Extinction to Reduce False Alarms. Fire 2023, 6, 140. [Google Scholar] [CrossRef]
  27. Wang, W.Q.; Pan, G.; Liu, X.L.; Wang, Y.Y.; Liu, Y.B.; Liu, B.; Jiang, L. Multi-angle Scattering Characteristic of test Fire Smoke and Typical Interference Aerosol. Procedia Eng. 2011, 11, 466–472. [Google Scholar] [CrossRef]
  28. Taehoon, K.; Yongjoo, K.; Dongho, R. The Effect of Air Purifier on Smoke Detector Revealed by Fire Dynamics Simulation. Sustainability 2022, 14, 2259. [Google Scholar] [CrossRef]
  29. Li, Y. Study on Condensate Water Issues in Fire Alarm Systems for Imperial Palace-Style Ancient Building Preservation. Water Resour. Archit. Eng. 2024, 22, 10–16. [Google Scholar]
  30. GB 4715-2024; Point-Type Smoke Fire Detectors. State Administration for Market Regulation of the People’s Republic of China, Standardization Administration of the People’s Republic of China, Standards Press of China: Beijing, China, 2024.
  31. Nawar, N.; Stow, D.A.; Riggan, P.; Tissell, R.; Sousa, D.; Jennings, M.K.; Wolden, L. Influences of Tree Mortality on Fire Intensity and Burn Severity for a Southern California Forest Using Airborne and Satellite Imagery. Fire 2025, 8, 144. [Google Scholar] [CrossRef]
  32. Kouassi, J.-L.; Wandan, N.; Mbow, C. Predictive Modeling of Wildfire Occurrence and Damage in a Tropical Savanna Ecosystem of West Africa. Fire 2020, 3, 42. [Google Scholar] [CrossRef]
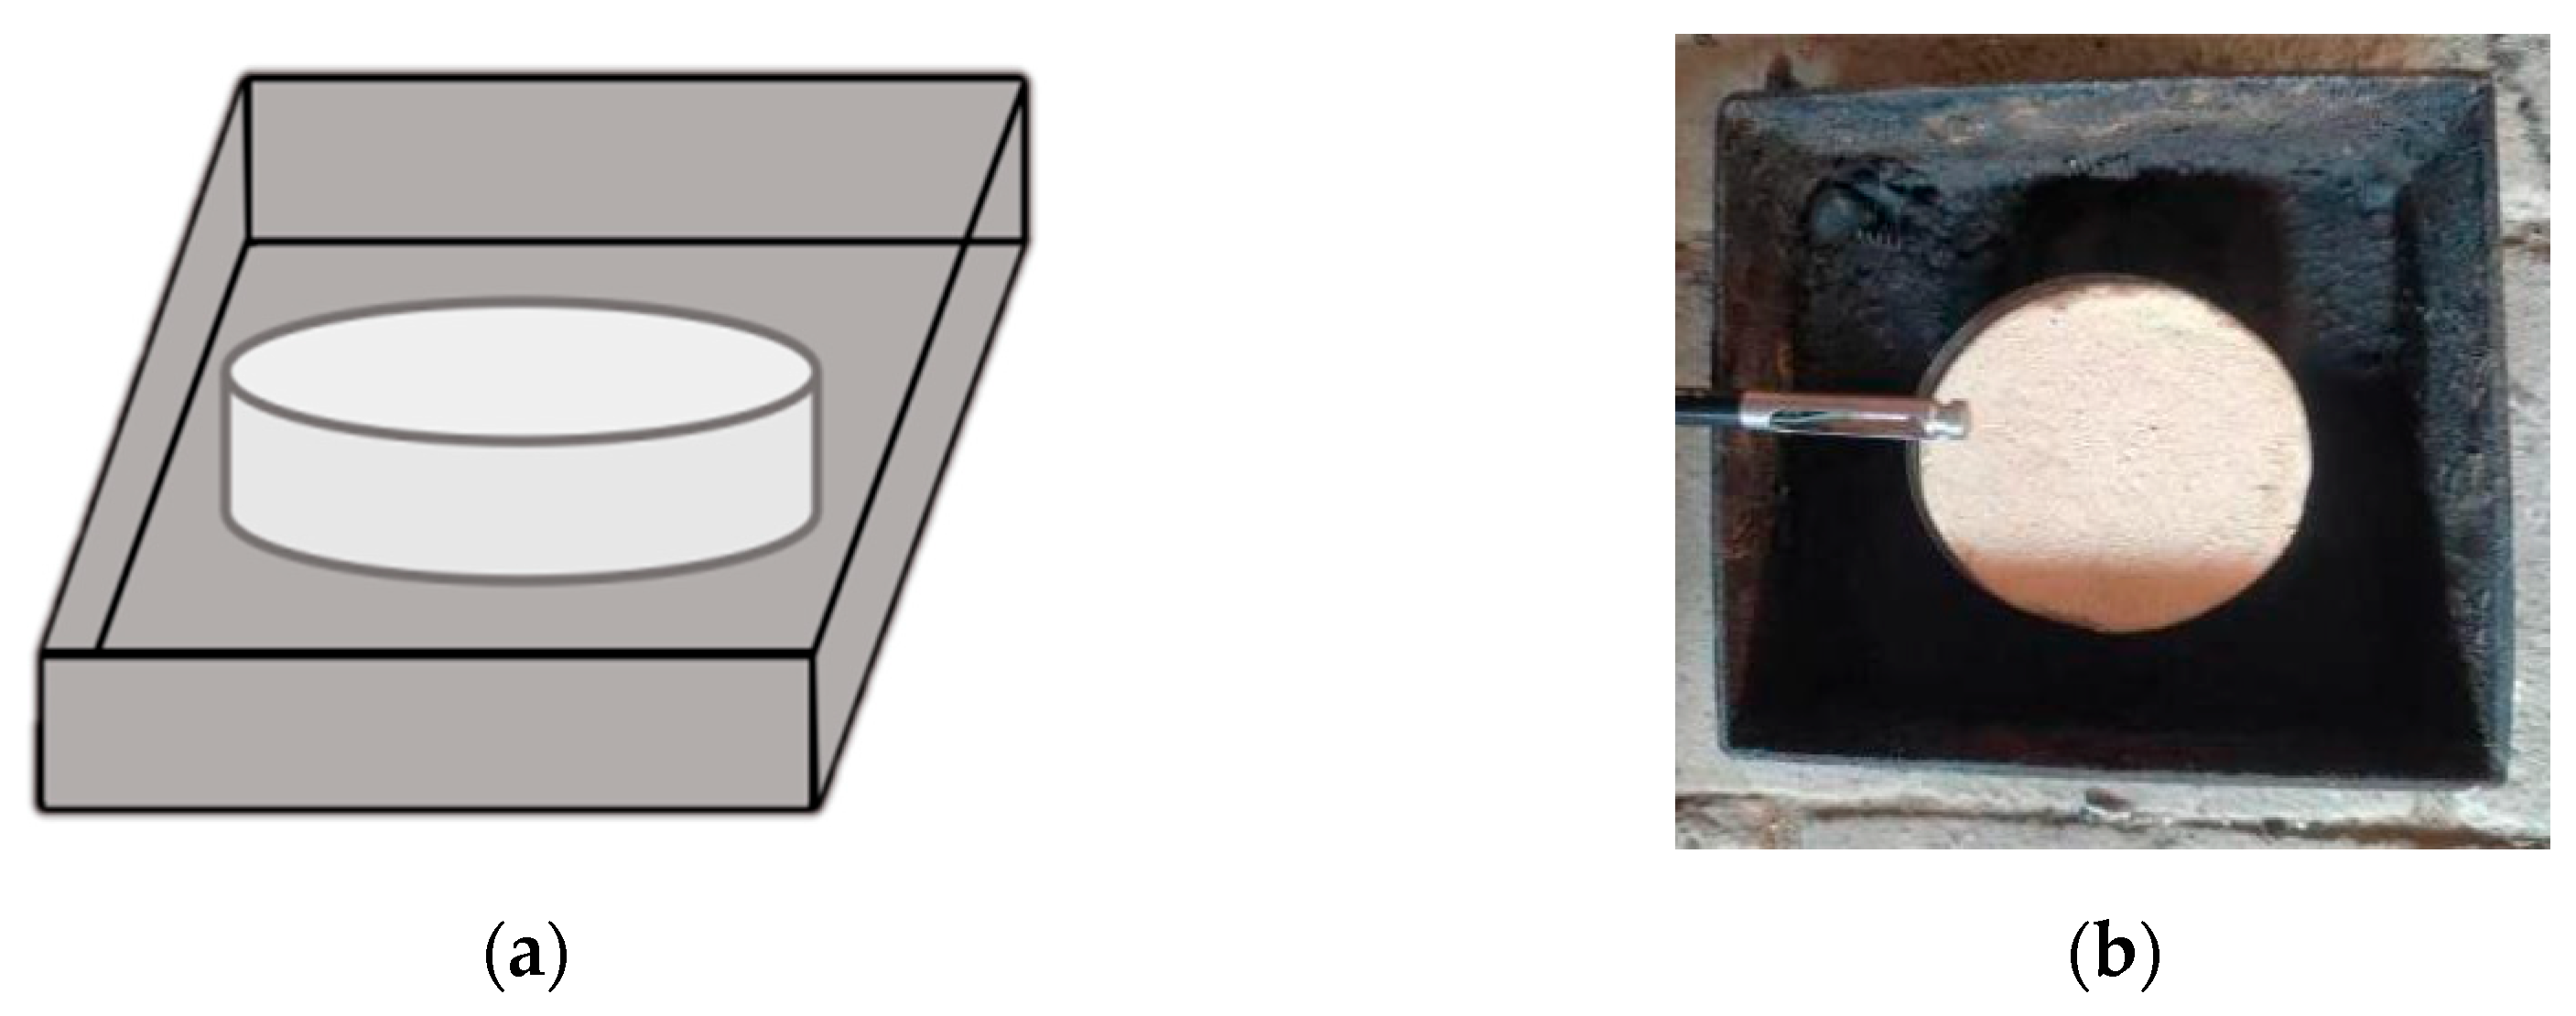
Figure 1. Design and actual test condition diagrams of smoke cake smoldering conditions: (a) design diagram of smoke cake smoldering working condition; (b) actual test condition diagram of smoke cake smoldering.
Fire 08 00315 g001
Figure 2. Design and actual test condition diagrams of cotton rope smoldering conditions: (a) design diagram of cotton rope smoldering working condition; (b) actual test condition diagram of cotton rope smoldering.
Fire 08 00315 g002
Figure 3. Design and actual test condition diagrams of wood block smoldering conditions: (a) design diagram of wood block smoldering working condition; (b) actual test condition diagram of wood block smoldering.
Fire 08 00315 g003
Figure 4. The external appearance of the Youshun Temple changing hall.
Fire 08 00315 g004
Figure 5. Full-size test platform scene.
Fire 08 00315 g005
Figure 6. Data fitting flowchart.
Fire 08 00315 g006
Figure 7. Visualization of the detector’s false alarm times under different gradients of water vapor interference conditions for cotton rope and smoke cake fire sources.
Fire 08 00315 g007
Figure 8. Detector alarm times under three types of fire source conditions with interference-free and different gradients of wind speed interference: (a) smoke cake smoldering condition; (b) cotton rope smoldering condition; and (c) wood block smoldering condition.
Fire 08 00315 g008
Figure 9. Visual representation of the alarm delay time for three types of fire source conditions under wind speed interference.
Fire 08 00315 g009
Figure 10. Fitting curve and fitting residual diagram of standardized delay time data under wind speed interference: (a) data fitting curve; (b) fitting residual.
Fire 08 00315 g010
Figure 11. Detector alarm times under three types of fire source conditions with interference-free and different gradients of water vapor interference: (a) smoke cake smoldering condition; (b) cotton rope smoldering condition; and (c) wood block smoldering condition.
Fire 08 00315 g011
Figure 12. Visual representation of the alarm delay time for three types of fire source conditions under water vapor interference.
Fire 08 00315 g012
Figure 13. Fitting curve and fitting residual diagram of standardized delay time data under water vapor interference: (a) data fitting curve; (b) fitting residual.
Fire 08 00315 g013
Figure 14. Fitting diagram of normalized delay time data after parameter tuning for cotton rope smoldering conditions under water vapor interference.
Fire 08 00315 g014
Figure 15. Detector alarm times under three types of fire source conditions with interference-free and different gradients of burning incense interference: (a) smoke cake smoldering condition; (b) cotton rope smoldering condition; and (c) wood block smoldering condition.
Fire 08 00315 g015
Figure 16. Visual representation of the alarm delay time for three types of fire source conditions under burning incense interference.
Fire 08 00315 g016
Figure 17. Fitting curve and fitting residual diagram of standardized delay time data under burning incense interference: (a) data fitting curve; (b) fitting residual.
Fire 08 00315 g017
Figure 18. Fitting diagram of normalized delay time data after parameter tuning for cotton rope smoldering conditions under burning incense interference.
Fire 08 00315 g018
Figure 19. Fitting diagram of normalized delay time data after parameter tuning for wood block smoldering conditions under burning incense interference.
Fire 08 00315 g019
Figure 20. Influence of different interference sources on detector alarm delay under three fire source conditions: (a) smoke cake smoldering condition; (b) cotton rope smoldering condition; and (c) wood block smoldering condition.
Fire 08 00315 g020
Table 1. Partial field investigation interference source data table.
PlaceWind Speed (m/s)Humidity (% RH)Burning Incense Granule (%obs/m 1)
The Taihe Hall of the Forbidden City0.12–0.3164.5–77.5
Prince Gong’s Mansion Jiale Hall0.09–0.2553.3–70.9
Yousun Temple Changing Hall0.21–0.3459.2–76.20.9–5.3
1 %obs/m is the unit for obscuration (light attenuation rate), representing the percentage reduction in light intensity after the light travels a 1 m distance in a smoke environment.
Table 2. Reference table for test fire source materials and specifications.
Name of Experimental Fire SourceExperimental Fire Source MaterialExperimental Fire Source Specifications
Smoke cake smolderingSmoke cake1 piece with a diameter of approximately 7 cm
Cotton rope smolderingClean and dry cotton rope90 pieces are 80 cm long and weigh 3 g
Wood block smolderingBeech stick (with a moisture content of approximately 5%)10 pieces, each with dimensions of 75 mm × 25 mm × 20 mm
Table 3. Summary of experimental conditions.
Serial NumberType of Interference SourceInterference Source Variable ValueInterference Source Arrangement LocationExperimental Fire Types
1Interference-freeInterference-free/Smoke cake smoldering
Cotton rope smoldering
Wood block smoldering
2Wind speed0.15 m/sOn the ground, 1 m horizontal distance from the fire source
30.20 m/s
40.25 m/s
5Water vapor69% RH1 m below the detector
676% RH
785% RH
8Burning incense smoke1.2 %obs/m1 m below the detector
92.8 %obs/m
104.5 %obs/m
Table 4. Fitting degree and error table of alarm delay time data for three types of fire source conditions under wind speed interference conditions.
Fire Source ConditionR2The Absolute Value of the Maximum ResidualMaximum Error of Alarm
Delay Time (s)
Smoke cake smoldering0.9960.051 (x = 0.15)2.7 s
Cotton rope smoldering0.9930.063 (x = 0.15)5.7 s
Wood block smoldering0.9740.121 (x = 0.20)3.5 s
Table 5. Fitting degree and error table of alarm delay time data for three types of fire source conditions under water vapor interference conditions.
Fire Source ConditionR2The Absolute Value of the Maximum ResidualMaximum Error of Alarm
Delay Time (s)
Smoke cake smoldering0.94100.1593 (x = 76)13.8 s
Cotton rope smoldering0.81880.2303 (x = 69)52.8 s
Wood block smoldering0.94950.1597 (x = 69)14.0 s
Table 6. Fitting degree and error table of the cotton rope smoldering working condition fitting curve under water vapor interference conditions after adjusting parameters.
Fire Source ConditionR2The Absolute Value of the Maximum ResidualMaximum Error of Alarm
Delay Time (s)
Cotton rope smoldering0.99000.0610(x = 85)13.9 s
Table 7. Fitting degree and error table of alarm delay time data for three types of fire source conditions under burning incense interference conditions.
Fire Source ConditionR2The Absolute Value of the Maximum ResidualMaximum Error of Alarm
Delay Time (s)
Smoke cake smoldering0.96880.1410 (x = 4.5)7.5 s
Cotton rope smoldering0.98530.1180 (x = 4.5)23.0 s
Wood block smoldering0.92650.2590 (x = 4.5)29.3 s
Table 8. Fitting degree and error table of fitting curves for cotton rope smoldering and wood block smoldering conditions under the interference of burning incense after parameter tuning.
Fire Source ConditionR2The Absolute Value of the Maximum ResidualMaximum Error of Alarm
Delay Time (s)
Cotton rope smoldering0.9960.0377(x = 1.2)7.4 s
Wood block smoldering0.99510.0500(x = 2.8)5.7 s
Disclaimer/Publisher’s Note: The statements, opinions and data contained in all publications are solely those of the individual author(s) and contributor(s) and not of MDPI and/or the editor(s). MDPI and/or the editor(s) disclaim responsibility for any injury to people or property resulting from any ideas, methods, instructions or products referred to in the content.