Article

Mapping Delayed Canopy Loss and Durable Fire Refugia for the 2020 Wildfires in Washington State Using Multiple Sensors

by
Anika M. Anderson
1,2,*,
Meg A. Krawchuk
2,
Flavie Pelletier
1 and
Jeffrey A. Cardille
1
1
Department of Natural Resource Sciences and Bieler School of Environment, McGill University, Montréal, QC H3A 0G4, Canada
2
College of Forestry, Oregon State University, Corvallis, OR 97331, USA
*
Author to whom correspondence should be addressed.
Fire 2025, 8(6), 230; https://doi.org/10.3390/fire8060230
Submission received: 3 May 2025 / Revised: 29 May 2025 / Accepted: 4 June 2025 / Published: 11 June 2025

Abstract

Fire refugia are unburned and low severity patches within wildfires that contribute heterogeneity that is important to retaining biodiversity and regenerating forest following fire. With increasingly intense and frequent wildfires in the Pacific Northwest, fire refugia are important for re-establishing populations sensitive to fire and maintaining resilience to future disturbances. Mapping fire refugia and delayed canopy loss is useful for understanding patterns in their distribution. The increasing abundance of satellite data and advanced analysis platforms offer the potential to map fire refugia in high detail. This study uses the Bayesian Updating of Land Cover (BULC-D) algorithm to map fire refugia and delayed canopy loss three years after fire. The algorithm compiles Normalized Burn Ratio data from Sentinel-2 and Landsat 8 and 9 and uses Bayes’ Theorem to map land cover changes. Four wildfires that occurred across Washington State in 2020 were mapped. Additionally, to consider the longevity of ‘durable’ fire refugia, the fire perimeters were analyzed to map delayed canopy loss in the years 2021–2023. The results showed that large losses in fire refugia can occur in the 1–3 years after fire due to delayed effects, but with some patches enduring.

1. Introduction

Wildfires in the Pacific Northwest of the United States are becoming increasingly intense and frequent compared to past decades, through links to climate change, drought, management legacies, and the suppression of historical fire regimes [1,2]. The Pacific Northwest supports a diversity of ecosystems with different fire regimes, from dry mixed-conifer forests that historically experienced frequent low- and mixed-severity fire to moister westside forests where moderately frequent mixed-severity fire and infrequent high-severity fire contribute to varied landscapes [3,4,5]. Recent fires in both moist and dry forests have resulted in large patches of high severity fire [1,4]. Fire refugia, which are defined as “landscape elements that remain unburned or minimally affected by fire” [6], are important for retaining heterogeneity and biodiversity, including providing seed sources for the regeneration of seed-obligate species, acting as important post-fire wildlife habitat, and bolstering resilience to disturbance. Delayed canopy loss can result from direct fire injury or indirect delayed effects in the years after a fire [7,8]. Delayed canopy loss can be representative of delayed tree mortality and affects how much forest persists in the years and decades after a fire. Thus, mapping the distribution and abundance of fire refugia and quantifying delayed canopy loss in characterizations of fire refugia are important for forest planning, conservation, and adaptation in fire-prone landscapes.
Satellite data can be used to map forest cover change, or lack thereof, after fire. Strategies to detect wildfire effects primarily use the differenced Normalized Burn Ratio (dNBR), a ratio of wavelengths representing vegetation cover and soil exposure, where NBR is compared across years [9]. Differencing approaches can be applied using a variety of calculations and a variety of time periods pre- and post-fire [10,11,12]. The same principles that apply to mapping wildfire mosaics with remotely sensed images apply to mapping fire refugia, where locations are identified within a fire perimeter that have limited change in NBR from pre- to post- fire. Delayed canopy loss can make the mapping of fire refugia challenging, as damage from the fire may not immediately kill the canopy and/or tree [13]. Trees that appear to have survived the fire may die a few years after the fire, meaning that fire maps created the year of the fire may overestimate the area of fire refugia, and tracking canopy loss in subsequent years is necessary to quantify ‘durable’ fire refugia.
The ability to map fire effects and fire refugia from satellites can be influenced by the frequency with which fire footprints can be observed with sufficient resolution in clear images. Some coarse-resolution satellite imagery (notably, VIIRS and MODIS [14]) provide data that is daily or hourly, but their resolution is too large for smaller fires [14] and for identifying fire refugia [15]. Alternatively, fine-resolution data collected by drones can provide detailed information about burned areas but can be much more costly to acquire and process than satellite data. Medium-resolution satellites provide more detailed imagery and the opportunity for repeat observation since they pass over any given site every few days to weeks. Each of the two Sentinel-2 satellites passes over a given site every 10 days, whereas Landsat 8 and Landsat 9 pass every 16 days [16]; however, cloud cover and smoke can still obstruct satellite imagery of land cover, reducing the amount of usable data. However, combining data across these satellite sources can increase the frequency of data for a given site (Appendix B). Analysis of fire refugia using information from multiple moderate-resolution satellites provides a rich opportunity that balances adequate spatial resolution and a frequent overpass rate for landscape assessments.
The Bayesian Updating of Land Cover algorithm (BULC) combines evidence from multiple sensors and considers the history of a pixel within a time series to determine if there was a change in the landscape based on Bayesian statistics. Bayes’ theorem is useful for addressing noise in the data and ensuring changes are only identified with sufficient evidence. The algorithm has so far been used to identify fire and cropland changes [17,18,19,20]. Cardille and Fortin [17] demonstrated how BULC works by mapping the wildfires in Quebec that occurred in the summer of 2013 [17], and Pelletier et al. [18] used BULC to track intra- and inter-year changes from wildfires across Canada for the summer of 2019. The algorithm was also used by Xiong et al. [19] to track cropland expansion in Zambia from 2000 to 2015, while Lee et al. [20] showed how the algorithm could combine satellite data of different spatial resolutions to develop a time series of deforestation from 1986 to 2000 in Mato Grosso, Brazil. BULC-D, by considering NBR time series, presents a new method for identifying fire refugia, as most studies that map the distribution of fire refugia use dNBR [21,22,23] or RdNBR [24,25], besides those that use the LandTrendr algorithm [26,27,28].
Few studies have quantified delayed canopy loss after fire in western North America using satellite data [7,8]. We focused here on delayed canopy loss instead of delayed tree mortality because the loss of canopy cover is a more direct representation of what is identifiable by satellite remote sensing in the years post-fire. Mapping delayed canopy loss is important for determining if and how fire refugia persist, because trees that survive one year post-fire may succumb to injury or additional stressors in addition to fire, such as drought or insects and pathogens [7,29]. Reilly et al. [8] and Busby et al. [7] both examined post-fire tree mortality five years after fire in the western U.S. using slightly different analysis strategies and employed fine-resolution satellite imagery to validate their results. Reilly et al. [8] assembled stacks of NBR images for six wildfires across California, Oregon, and Washington and calculated the relative changes in NBR for each of the five years post-fire compared to the year before the fire. To accurately represent the change in post-fire tree cover, they randomly selected points across the study fires to visually inspect forest cover and then developed a logistic regression classifier to predict delayed mortality. This extra step allowed them to assess the relationship between NBR decline and visual canopy cover, using NBR decline as a proxy for delayed mortality [8]. Busby et al. [7] compared maps of tree cover derived from NDVI at one year and five years post-fire to examine the spatial extent and patterns of delayed mortality, along with an analysis of the potential drivers of delayed mortality, including burn severity, climate moisture deficit, soil water holding capacity, and topography. They found that burn severity was the strongest factor controlling delayed mortality, thus higher burn severity can be indicative of higher delayed mortality [7].
Both Reilly et al. [8] and Busby et al. [7] used an NBR composite image for each year, which can be simple and effective but could miss within-year changes and trends in NBR. The BULC-D algorithm generates maps of tree cover changes post-fire built from data across a season (instead of a single image) to show long-term trends in NBR [17]. This could be particularly important for analyzing fire refugia because the process of delayed mortality happens over time and may be difficult to capture in a single NBR image. The algorithm also fits an expectation curve to the NBR data for the forest before the change, which is unique because this reflects the seasonal changes in leaf cover. By building an expectation curve, the algorithm addresses the ‘background’ seasonal changes in forest cover to identify only changes in forest cover resulting from disturbance. The advantages of combining time series data from multiple sensors, the use of a seasonal curve fitted to NBR data, and decision making through Bayes’ theorem to reduce noise, are useful for tracking landscape-level changes in forest cover.
Here, we demonstrate how the Bayesian Updating of Land Cover algorithm (BULC-D) can be used to map burn scars and post-fire forest cover changes including post-fire delayed canopy loss. The objectives of the study are to (1) map four wildfires that occurred across Washington State in 2020 using BULC-D, (2) map delayed canopy loss in the three years after each fire, and (3) quantify the remaining persistent forest cover as durable fire refugia.

2. Materials and Methods

Our study included four fires that occurred in Washington State in the western United States during the 2020 fire season. We mapped fires using the Bayesian Updating of Land Cover (BULC-D) algorithm, with three main sections of analysis: (1) immediate forest cover change due to fire, (2) delayed canopy loss in the three years after the fire, and (3) durable fire refugia three years after a fire. First, we explain the BULC-D algorithm, then how the maps produced by this algorithm were used to identify immediate forest cover change, delayed canopy loss, and durable fire refugia within wildfire perimeters. Finally, an accuracy assessment was conducted using Sentinel-2 and Landsat imagery to validate the results.

2.1. Material Section

2.1.1. Study Area

To explore the potential of BULC-D for mapping fire refugia, analyses of four wildfires in Washington in the 2020 wildfire season were conducted. We previously identified wildfires in the Pacific Northwest, delineated by the National Interagency Fire Center [30], that had a large percentage of ‘no change’ area in 2020 (>30% of the burned area), and we analyzed these wildfires in the subsequent years to examine delayed canopy loss. The 30% ‘no change’ area threshold determined based on our observations and the existing literature [24,26,27,28] was a good starting point for exploring delayed canopy loss effects. Fire behavior and effects are complex and not homogeneous across the Pacific Northwest [6], so we chose to examine four fires (Figure 1, Table 1) that occurred in forest ecosystems in the North Cascades, West Cascades, East Cascades, and the Okanogan Level III Ecoregions [31] to explore this variability.
The 2020 wildfire season in the Pacific Northwest was particularly intense compared to past fire seasons. Hot and dry conditions and large amounts of fuel in this productive region allowed ignited fires to expand quickly, particularly on Labor Day weekend when there was a strong east wind event that aided fire spread [33]. The ecosystems in which the four fires burned are all conifer-dominated forests, but they vary in species composition, climate, and fire ecology. There are important differences in moisture and vegetation moving west to east across the ecoregions where the study fires occurred, from the North and West Cascades to the East Cascades and to the Okanogan. The North Cascades receive 152–406 cm of precipitation per year [34], the West Cascades 140–156 cm per year, the East Cascades 305 cm per year at the crest of the Cascades to less than 74 cm per year in the Columbia basin [35], and the Okanogan 36–61 cm per year [36]. The forest burned by the Downey Creek Fire in the North Cascades is dominated by Abies amabilis, Tsuga heterophylla, and Pseudotsuga menziesii [37]. The forest burned by the Big Hollow Fire in the West Cascades is similar, consisting mostly of Tsuga heterophylla and Pseudotsuga menziesii, with some Thuja plicata and Abies grandis [38]. The Chikamin Fire in the East Cascades involved a forest of Pinus ponderosa, Pseudotsuga menziesii, and patches of Picea engelmannii and Abies lasiocarpa [39,40]. The Downey Creek and Chikamin Fires occurred at a relatively close distance to each other but have quite different vegetation because of orographic lifting that makes the west side wet and the rain shadow effect that makes the east side dry. The Kewa Field Fire happened in the Okanogan forest, which contains Pinus ponderosa and Pseudotsuga menziesii [41]. The vegetation was identified using LANDFIRE Existing Vegetation Type data [42]. Although we only looked at four fires across Washington, the selection allowed us to look at fires on the West and East sides of the Cascades, whose forests have different vegetation, climate, and fire behavior.

2.1.2. Image Data

The images used in the analysis were accessed through Google Earth Engine [43]. To identify forest cover change or delayed canopy loss due to fires in 2020–2023, surface reflectance images were used from Landsat-8, Landsat-9, and Sentinel-2 from the years 2017 to 2023 as described below. To capture images during the potential fire season and show typically snow-free ground, images were collected between 10 April (day 100) and 27 October (day 300) to be considered in the analysis. Images with less than 70% cloud cover per scene were retained; within those images, pixels labeled as cloud-contaminated were discarded using the QA band (Landsat) and s2cloudless algorithm (Sentinel-2) [44].
For each image used in the analysis, the Normalized Burn Ratio (NBR) was calculated at a resolution of 30m using the near-infrared (Landsat Band 4; Sentinel-2 Band 8) and short-wave infrared bands (Landsat Band 7; Sentinel-2 Band 12). NBR values tend to be high for healthy vegetation and low for unhealthy vegetation, recently burned or harvested areas, or bare ground [9]. The NBR expectation time series was built using three years of imagery prior to the 2020 fire year (Figure 2c). The NBR for the target year was calculated for every image of the study area acquired in 2020 during the same day range (Figure 2d). Additional target years after the fire year were studied to detect delayed effects (Figure 2e).

2.2. Methods

2.2.1. Bayesian Updating of Land Cover (BULC-D)

BULC-D [18] is a version of the BULC [17,45] algorithm that uses Bayesian logic to track potential land cover changes by looking at differences between the expected and observed values of relevant band indices. The algorithm builds an expectation of a value (here, NBR) in a pre-change period, fits a sinusoidal curve to the data, and compares values from a period in which change potentially occurred against that expectation. For every NBR target value, a z-score is calculated to compare the target value to the expectation [18]. Using Bayes’ Theorem, a running set of probabilities is calculated based on every new image’s estimated z-score. Three probabilities are tracked that, when summed, total 1: (1) probability that the NBR is stable, (2) probability that the NBR has decreased, and (3) probability that the NBR has increased. In a given target period, an increase in NBR over time is interpreted as the growth of forest, a decrease as a change that could be fire, harvest, or delayed mortality, and NBR values that stay the same are considered ‘no change’. To confidently detect a change, BULC-D accumulates evidence of change throughout a time period, estimating throughout a target season whether NBR values in a target year differ consistently and significantly enough to be labeled as change. Here, an estimated probability of decreased NBR greater than 0.5 was used as the threshold for the evidence of change.
As an example, Figure 2 shows the Downey Creek Fire, which started on 16 August 2020 on the Mt. Baker–Snoqualmie National Forest in Washington [46]. The small amplitude in the sinusoidal wave (Figure 2c), shown for just one 30 m pixel, is a typical seasonal pattern in stable coniferous forests in the study area. For this particular pixel, the change in NBR did not happen in the 2020 fire year but instead in 2021. In 2020, the NBR time series closely followed the expectation, as represented by the fitted curve for 2017–2019 (Figure 2d); NBR values in 2021 dropped below the fitted curve (Figure 2e). The consistently lower signal in 2021 was strong evidence of a change in NBR; BULC-D mapped the pixel as having no change in 2020 and a very high probability of change in 2021. The delayed decrease in NBR in this and other pixels within the demarcated fire perimeter was visible in the maps: the map for the end of 2020 showed the pixel in white (stable) (Figure 2a); in the 2021 map, the pixel was mapped in deep pink, indicating a very high probability of decreased NBR relative to the 2017–2019 baseline. Note that because BULC-D tracks the probability of stable or decreased NBR, the more ‘pure’ a color is, the more confident the system is in the assessment. Outside the fire perimeter, BULC-D suggested that there was slight evidence of change in isolated pixels (the mottled appearance of areas to the west and southeast), while suggesting strong evidence (in deep pink) of additional disturbances outside the stated fire perimeters in this time frame.

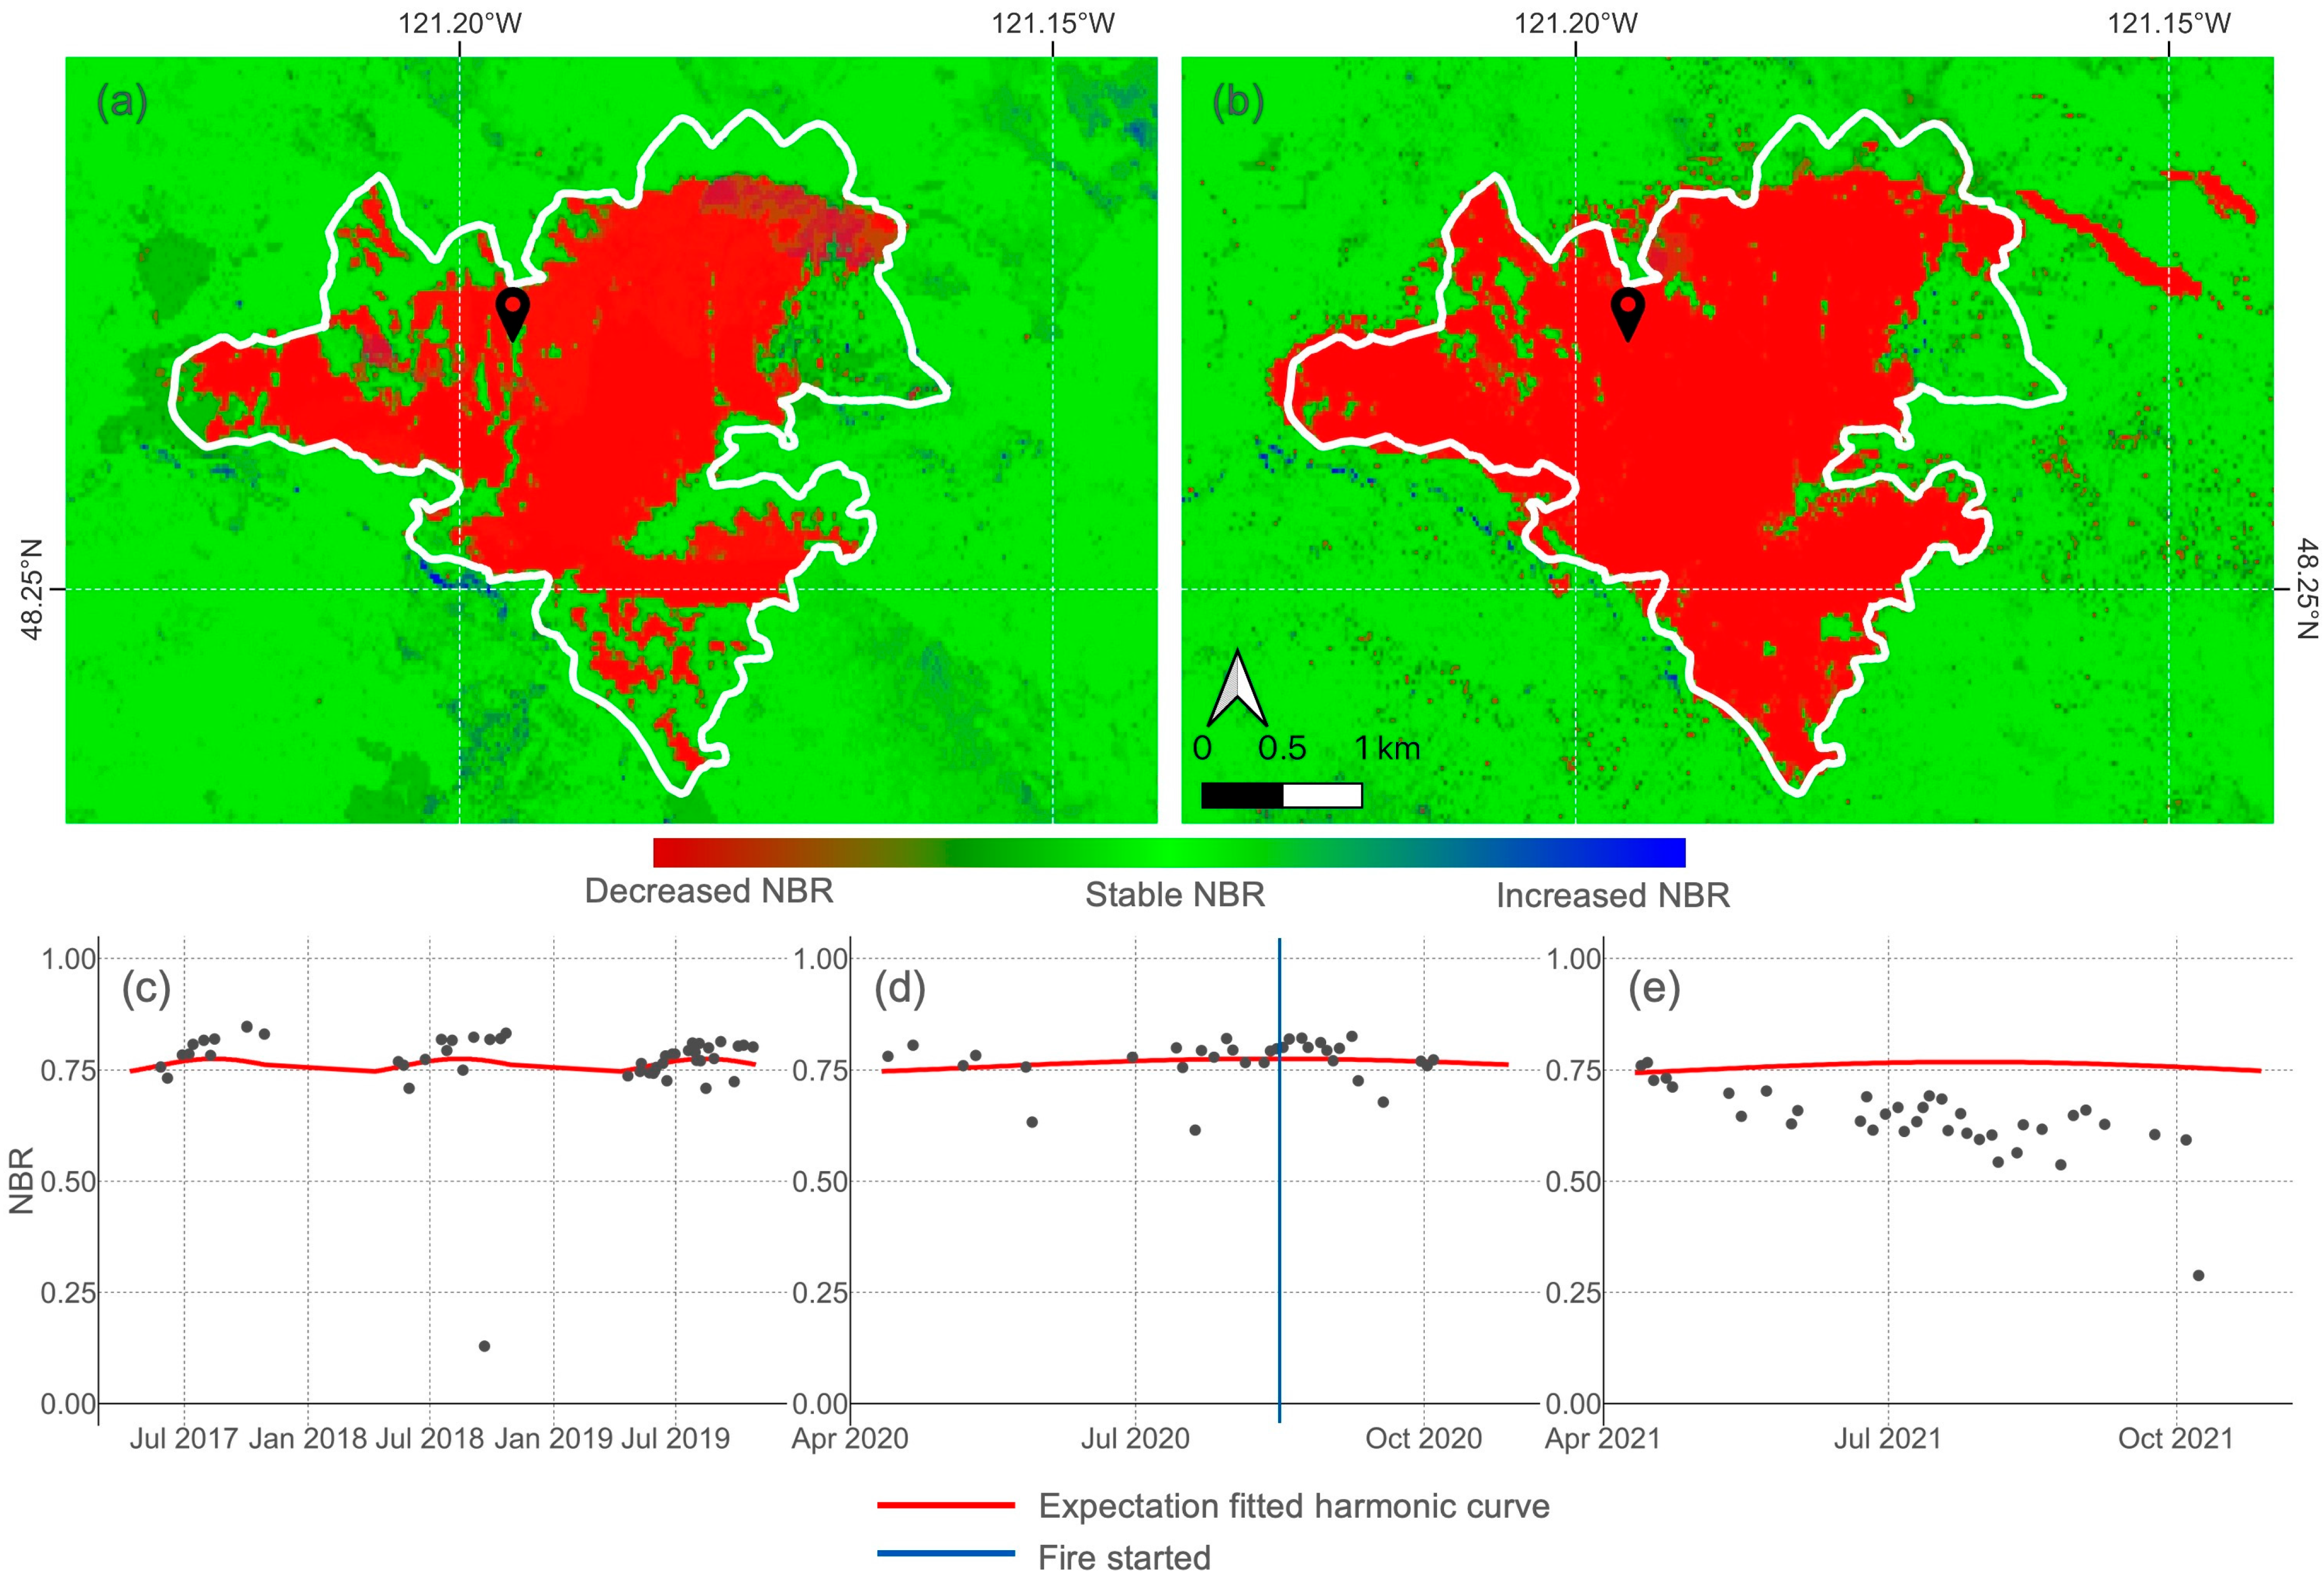
2.2.2. Mapping Forest Cover Change in the Year of the Fire

Each wildfire was identified with the wildfire perimeters from the National Interagency Fire Center [30], and the area was assessed with BULC-D with a threshold for probability of change set to 0.5, using imagery data from Landsat 8 and Sentinel-2. Each wildfire was tested starting with baseline expectation and target periods set as the 100–300th day of the year (10 April–27 October) to coincide with the active fire season. This date range was adjusted for the Chikamin Fire that occurred at high elevations in the Washington Cascades where the snowpack does not melt until June or July and forms again in early fall. Additionally, the baseline cloud cover threshold was set to <70 percent but raised to <80 percent for the Chikamin and Kewa Field Fires to allow for more data points.
After the identification of candidate-changed pixels with BULC-D, we used an additional filtering method on those pixels to ensure we focused on pixels that had been forested before their NBR values decreased following fire activity. For a pixel to be classified as ‘forest change’, its NBR value needed to be above 0.35 during the pre-fire expectation period and below 0.35 for the post-fire target period. Pixels with an NBR value that changed from above to below 0.35 were assumed to represent canopy loss that could be anywhere on a spectrum from partial mortality to bare soil. The NBR threshold of 0.35 was chosen through visual inspection by comparing the area mapped as forest cover with different NBR thresholds to the satellite imagery in Google Earth. With this threshold, we captured canopy loss from high-, moderate-, or even low-severity fire [9]. For our purpose of identifying crown fires that had a long-term impact on trees, we did not include understory changes in our analysis and interpretation. Our resulting map shows the mosaic of fire effects.

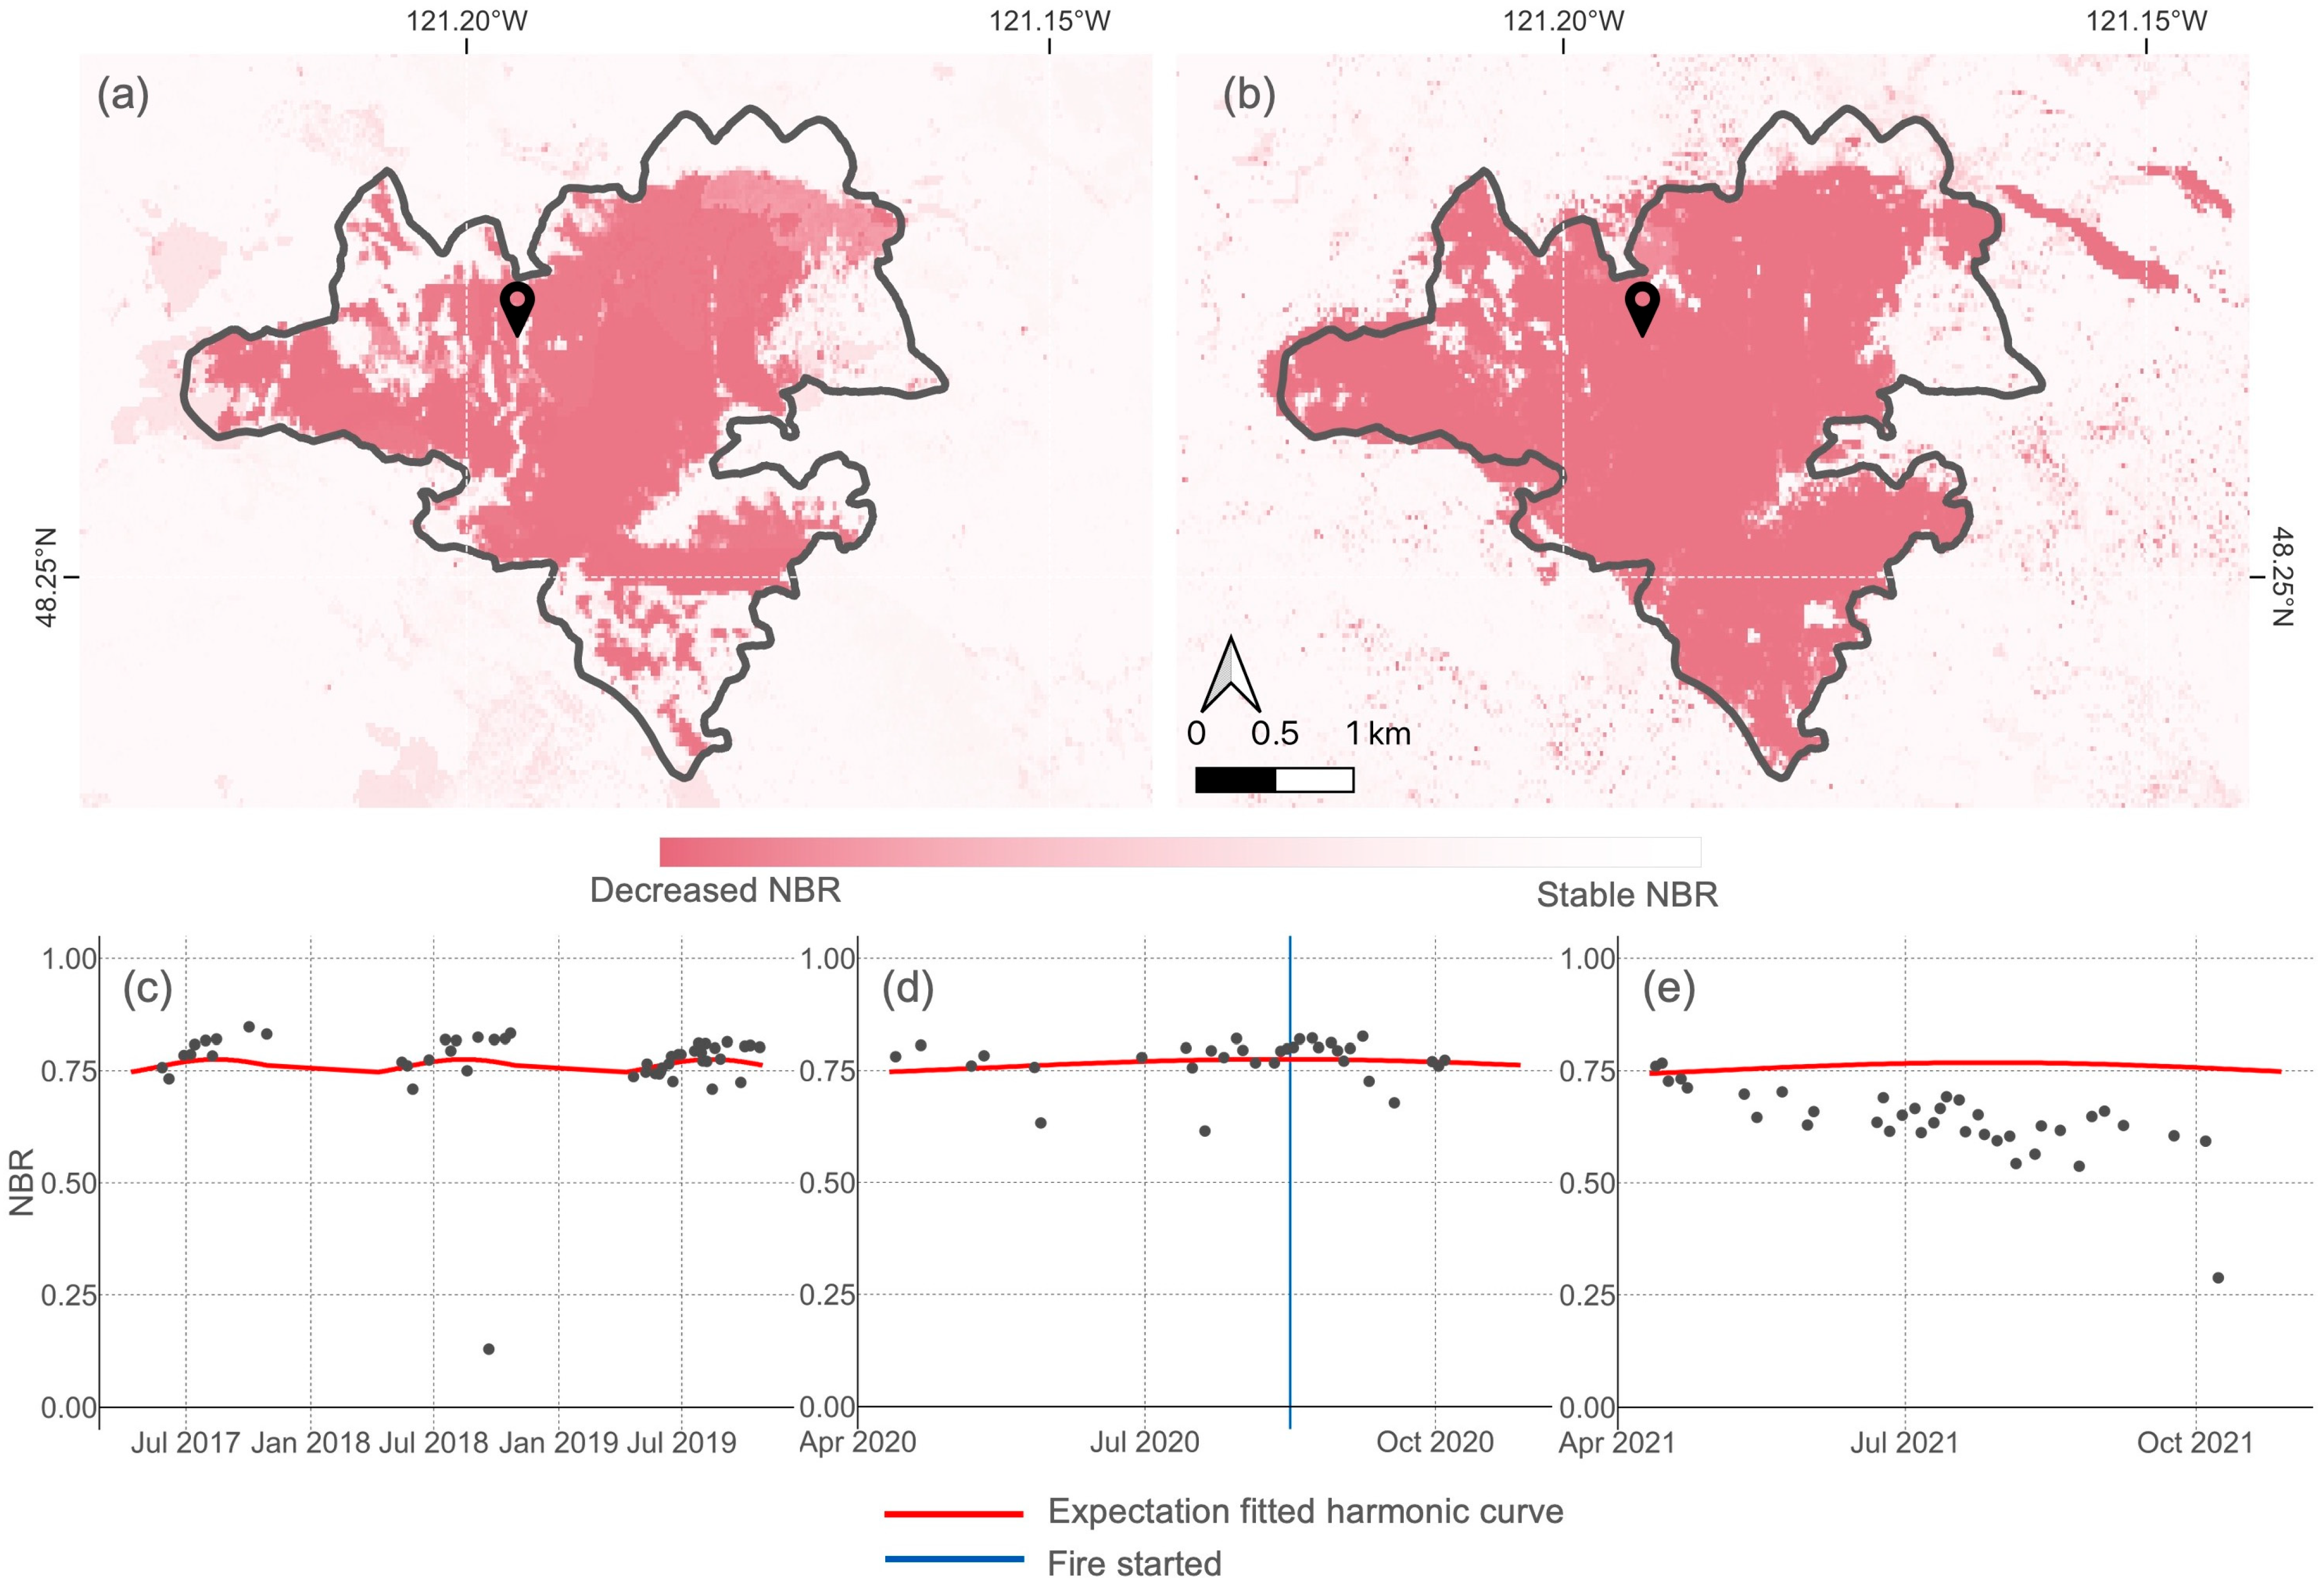
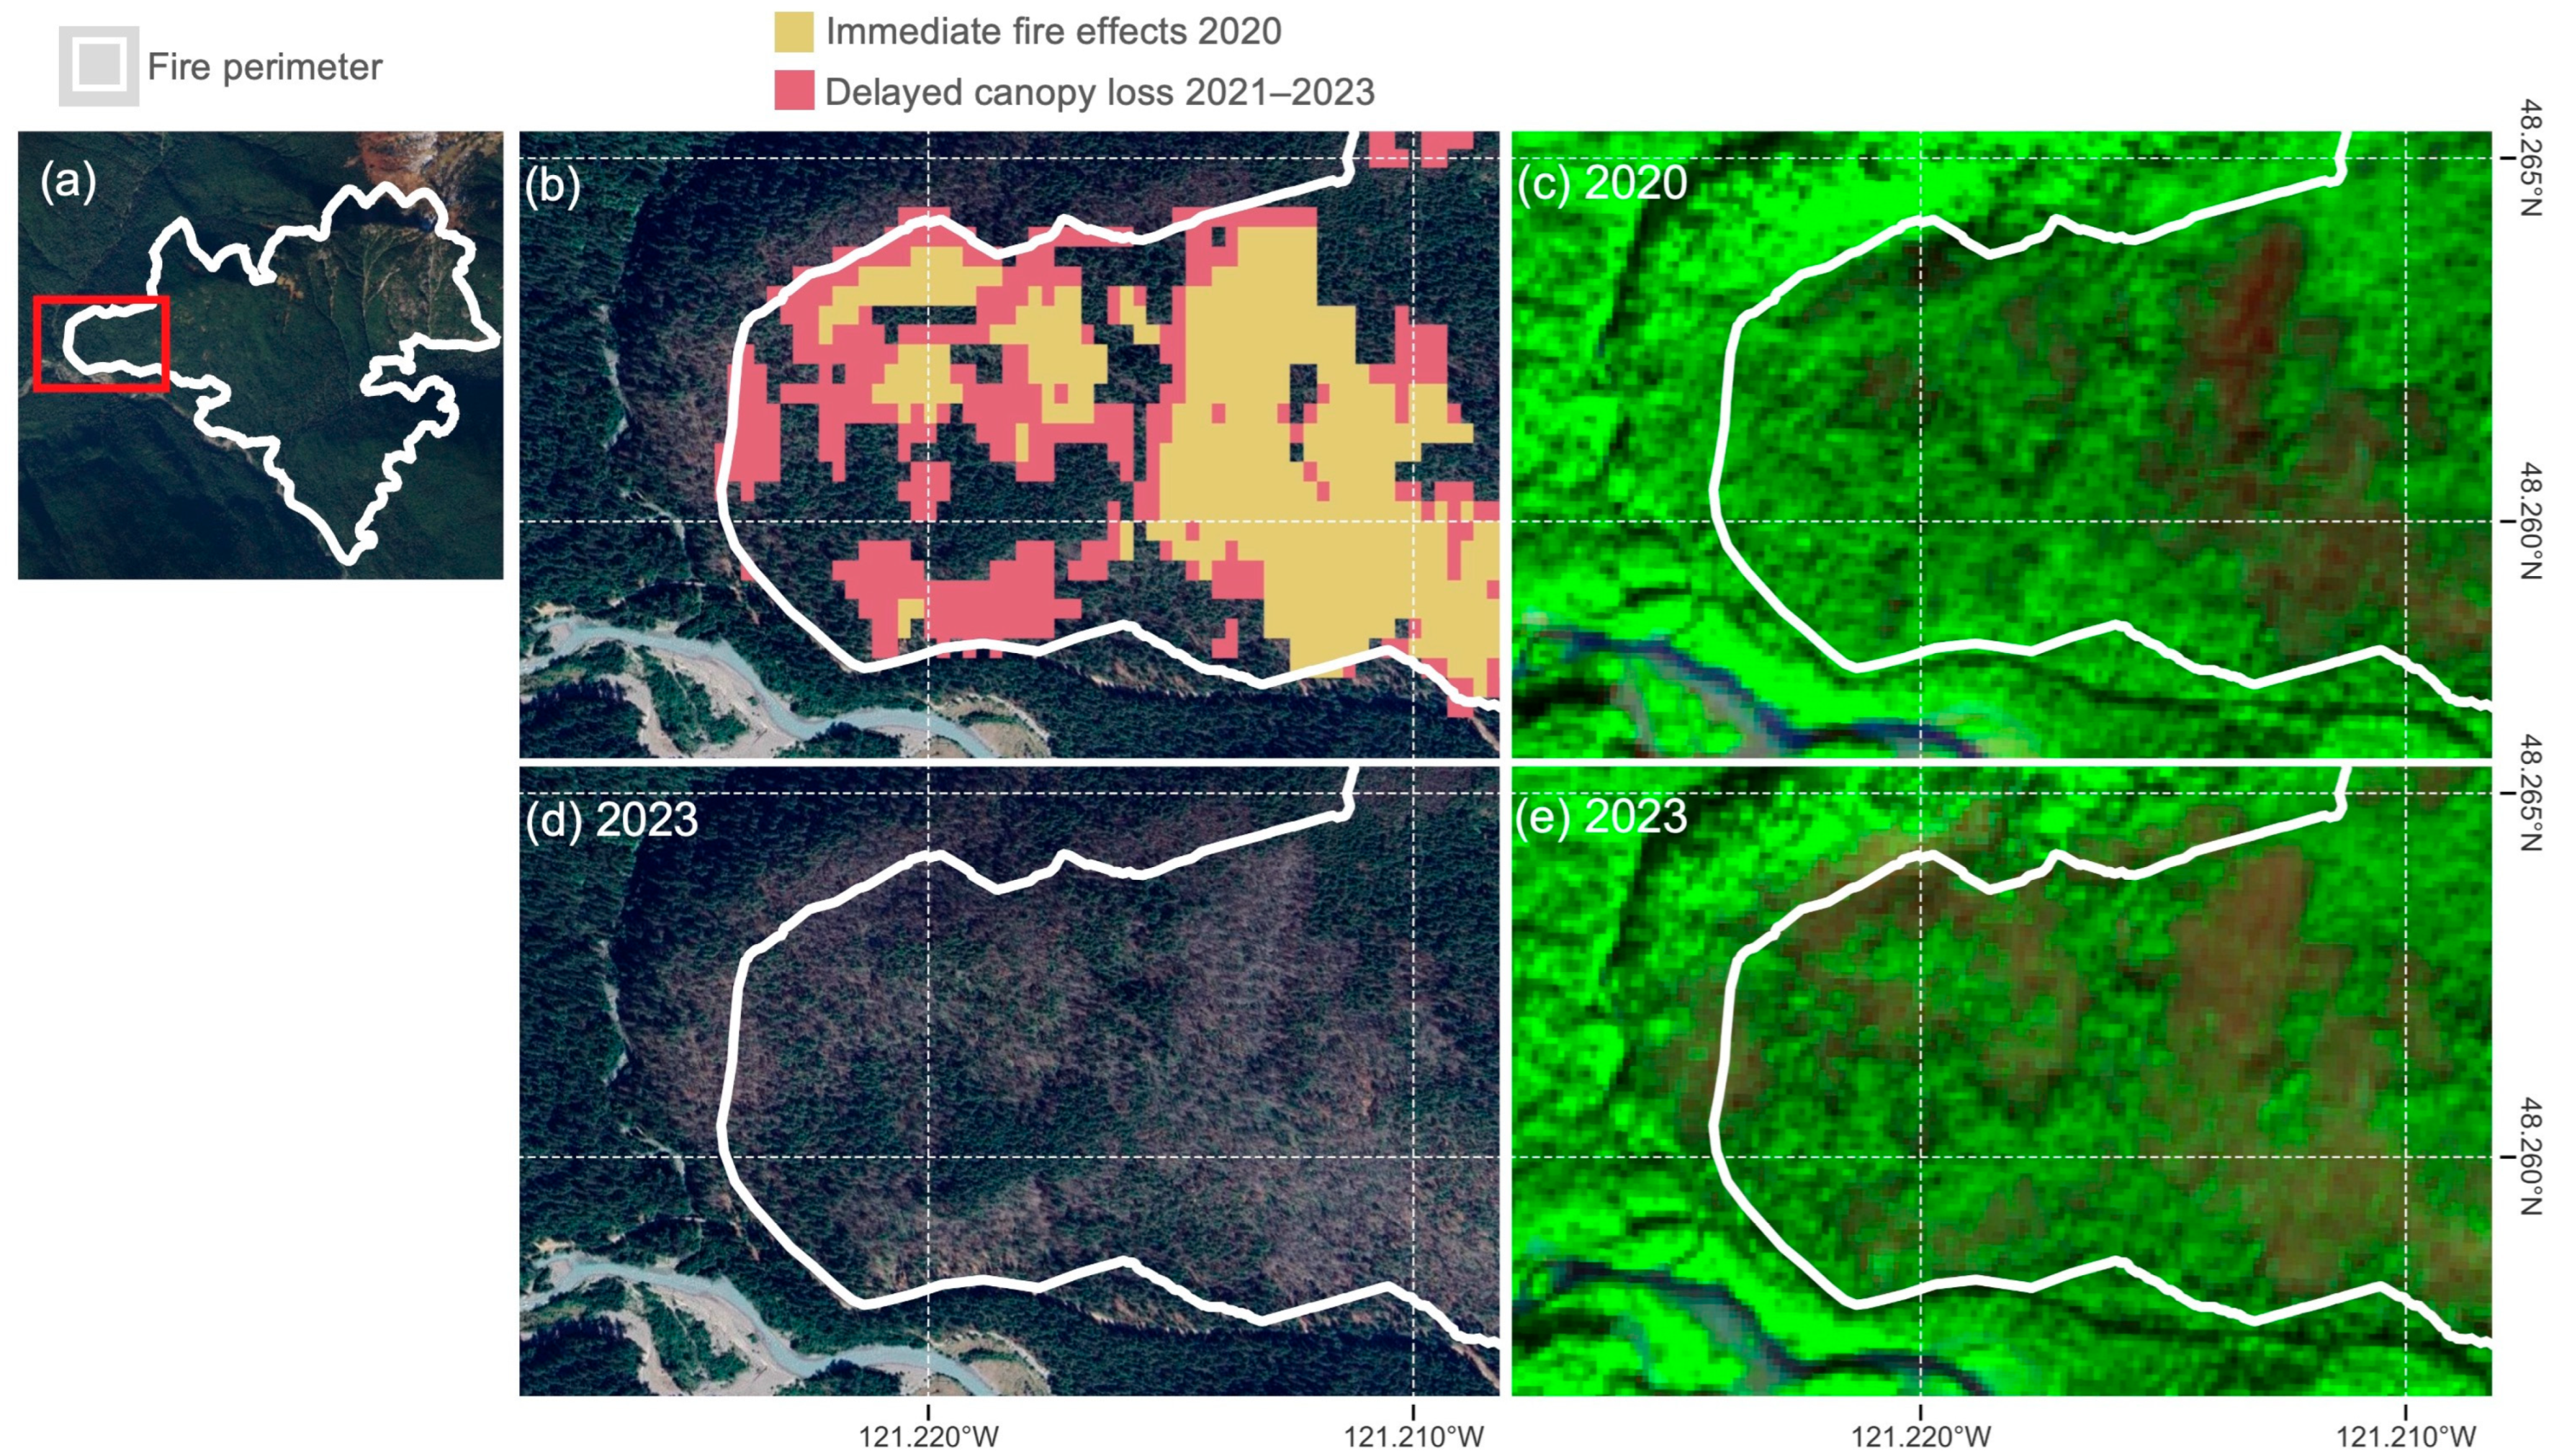
2.2.3. Mapping Delayed Canopy Loss

We used the procedure we developed for mapping forest cover in 2020 (immediately post-fire) to map continued post-fire changes in the years 2021–2023 to capture second-order fire effects and the ecosystem response related to delayed canopy loss. The expectation years (2017–2019) were compared to each target year of 2021, 2022, and 2023. For each post-fire year, we wanted to know how the surface reflectance compared to the pre-fire condition; if there was a change, we interpret this as a delayed canopy loss. As with the one-year analysis of the 2020 fires, the expectation and target date parameters and cloud cover threshold were adjusted to obtain fitted curves that adequately captured the change from the fire. The same NBR filter was applied to identify pixels that changed from above to below 0.35 so that only a change from forest was identified. The goal was to isolate additional temporal changes linked to delayed canopy loss. We mapped change that happened in 2021 but not in 2020 (year-1 delayed canopy loss), change that happened in 2022 but not 2020 or 2021 (year-2 delayed canopy loss), and change that happened in 2023 but not in 2020, 2021, or 2022 (year-3 delayed canopy loss). Changes we have identified here as delayed canopy loss may, in fact, be representative of salvage logging [47], new wildfires, or other post-fire disturbances instead of natural tree mortality processes. Our goal was to demonstrate the potential for BULC-D to be used for these types of change detection research questions rather than to validate specific changes due to delayed canopy loss, salvage logging, wildfires, or other post-fire management actions.

2.2.4. Mapping Durable Refugia

To identify durable fire refugia patches within a wildfire perimeter, we determined the area forested before the fire. During the expectation period (2017–2019), pixels within the wildfire perimeter with a mean value of NBR > 0.35 were identified as pre-fire forest cover. The NBR threshold, chosen through visual inspection as mentioned above, could be adjusted in subsequent analyses for different forest types or other land covers. For forests in Washington, we found this threshold to be appropriate, particularly when looking at the Chikamin Fire, which occurred at high elevation. However, the threshold was imperfect and likely missed a few trees that would act as seed sources. The pixels categorized as ‘no change’ via BULC-D within the fire perimeters (fire refugia) and with an associated NBR remaining above 0.35 may have included unburned locations or locations where surface fires burned at low severity under the canopy. Patches of low-severity fire can be included as fire refugia because, as remaining forest cover, they serve about the same ecological function as unburned patches and because it can be difficult to spectrally distinguish between low-severity fires and unburned forest [6].
The map of pre-fire forest cover was compared to the maps of change in the year of the fire (2020) and the subsequent years (2021, 2022, and 2023) to assess potential delayed canopy loss. The maps of tree mortality across the four years were compiled into a composite image. The composite mortality map was subtracted from the map of pre-fire forest cover to represent durable fire refugia. The proportion of area within the wildfire perimeters attributed to change in the year of the fire, delayed canopy loss, durable refugia, and non-forest were each calculated using a pixel count operation (Google Earth Engine scripts found in Appendix A).

2.2.5. Accuracy Assessment

The assessment of the composite maps aimed to determine the accuracy of two different classes (change and timing of change). First, the change class had two possibilities, burned (indicated by any forest cover change) or unburned, and second, the timing assigned to canopy loss had another two possibilities, immediate fire effects and delayed canopy loss. The composite fire maps were evaluated using a stratified random sampling approach as detailed in Olofsson et al. [48]. The area within each fire perimeter was stratified into five non-overlapping strata associated with the year of forest cover change: no change, 2020, 2021, 2022, and 2023. We initially determined that a sample size of 400 would be appropriate based on recommendations from Olofsson et al. [48] and assigned a minimum of 25 samples per stratum to guarantee the proper sampling of rare classes (i.e., tree mortality class 2023). The remaining samples were distributed proportionally to the size of the stratum. Given that the no change and 2020 strata represented 85% of the study area, most sample pixels were allocated to those two strata. Additionally, the minimum distance between sample pixels was fixed to ≥500 m to avoid spatial autocorrelation.
To evaluate sample pixels, two trained interpreters, without prior knowledge of the map classes, interpreted high-resolution imagery (Google Earth and Planet) as well as Landsat and Sentinel-2 time series to determine if the sample was unburned or burned and, in the latter case, assign a year when canopy loss could be visually confirmed. For each pixel, an interpreter also recorded if the pixel was treed and a confidence level (1–5) associated with the attributes. If the pixel was not treed (i.e., in a previously harvested clearing) or if the confidence level was low (<3), the sample was discarded.
The accuracies of the change detection and the timing assigned to canopy loss were assessed using distinct confusion matrices that included unbiased changed area estimates, unbiased estimates of the overall, user’s, and producer’s accuracies, and 95% confidence intervals following Stehman [49].

3. Results

3.1. Assessment of Burned Maps

For the assessment, the sample size was initially set to 400; however, 357 sample points were retained to calculate the unbiased estimates of accuracies. Many of the discarded sample points were linked to low confidence attributes, especially in the year of tree mortality. A small proportion of sample points were discarded after mortality was confirmed to be caused by an unrelated wildfire in 2022 (four sample points) or salvage logging (three sample points) and therefore unrelated to the fires analyzed. For pixels that experienced canopy loss in the years post-fire, it was often a challenge to convincingly assign a year to the canopy loss as we created the reference set.
In Table 2, the accuracy assessment indicated that the approach using BULC-D produced reliable change maps (unburned and burned) with an overall accuracy of 0.903 (±0.016, 95–confidence interval), a user’s accuracy of 0.987 (±0.006), and a producer’s accuracy of 0.839 (± 0.024) for the burned class, which indicates that the maps wrongly classified burned area as unburned (9.1% of the total area). The timing of the canopy loss detection had an overall accuracy of 0.854 (±0.020). The user’s accuracy was higher for the immediate fire effects class (0.960 ± 0.020) than for the delayed canopy loss class (0.619 ± 0.046) (Table 3). Estimated proportions of the area indicated that 11.8% of the changed area that was mapped as delayed canopy loss should have been mapped as immediate fire effects.
To illustrate the accuracy of the change detection, we looked at the Downey Creek Fire that burned in the North Cascades. The area where the fire happened was well-forested prior to the event (Figure 3a). Most of the affected area was burned in 2020, with some delayed canopy loss on the edges of the fire in the subsequent years (Figure 3b). The comparison between Sentinel-2 composite images from immediately after the fire in 2020 (Figure 3c) and from 2023 (Figure 3e) shows how delayed canopy loss continues to affect the forested area in the years following the fire.

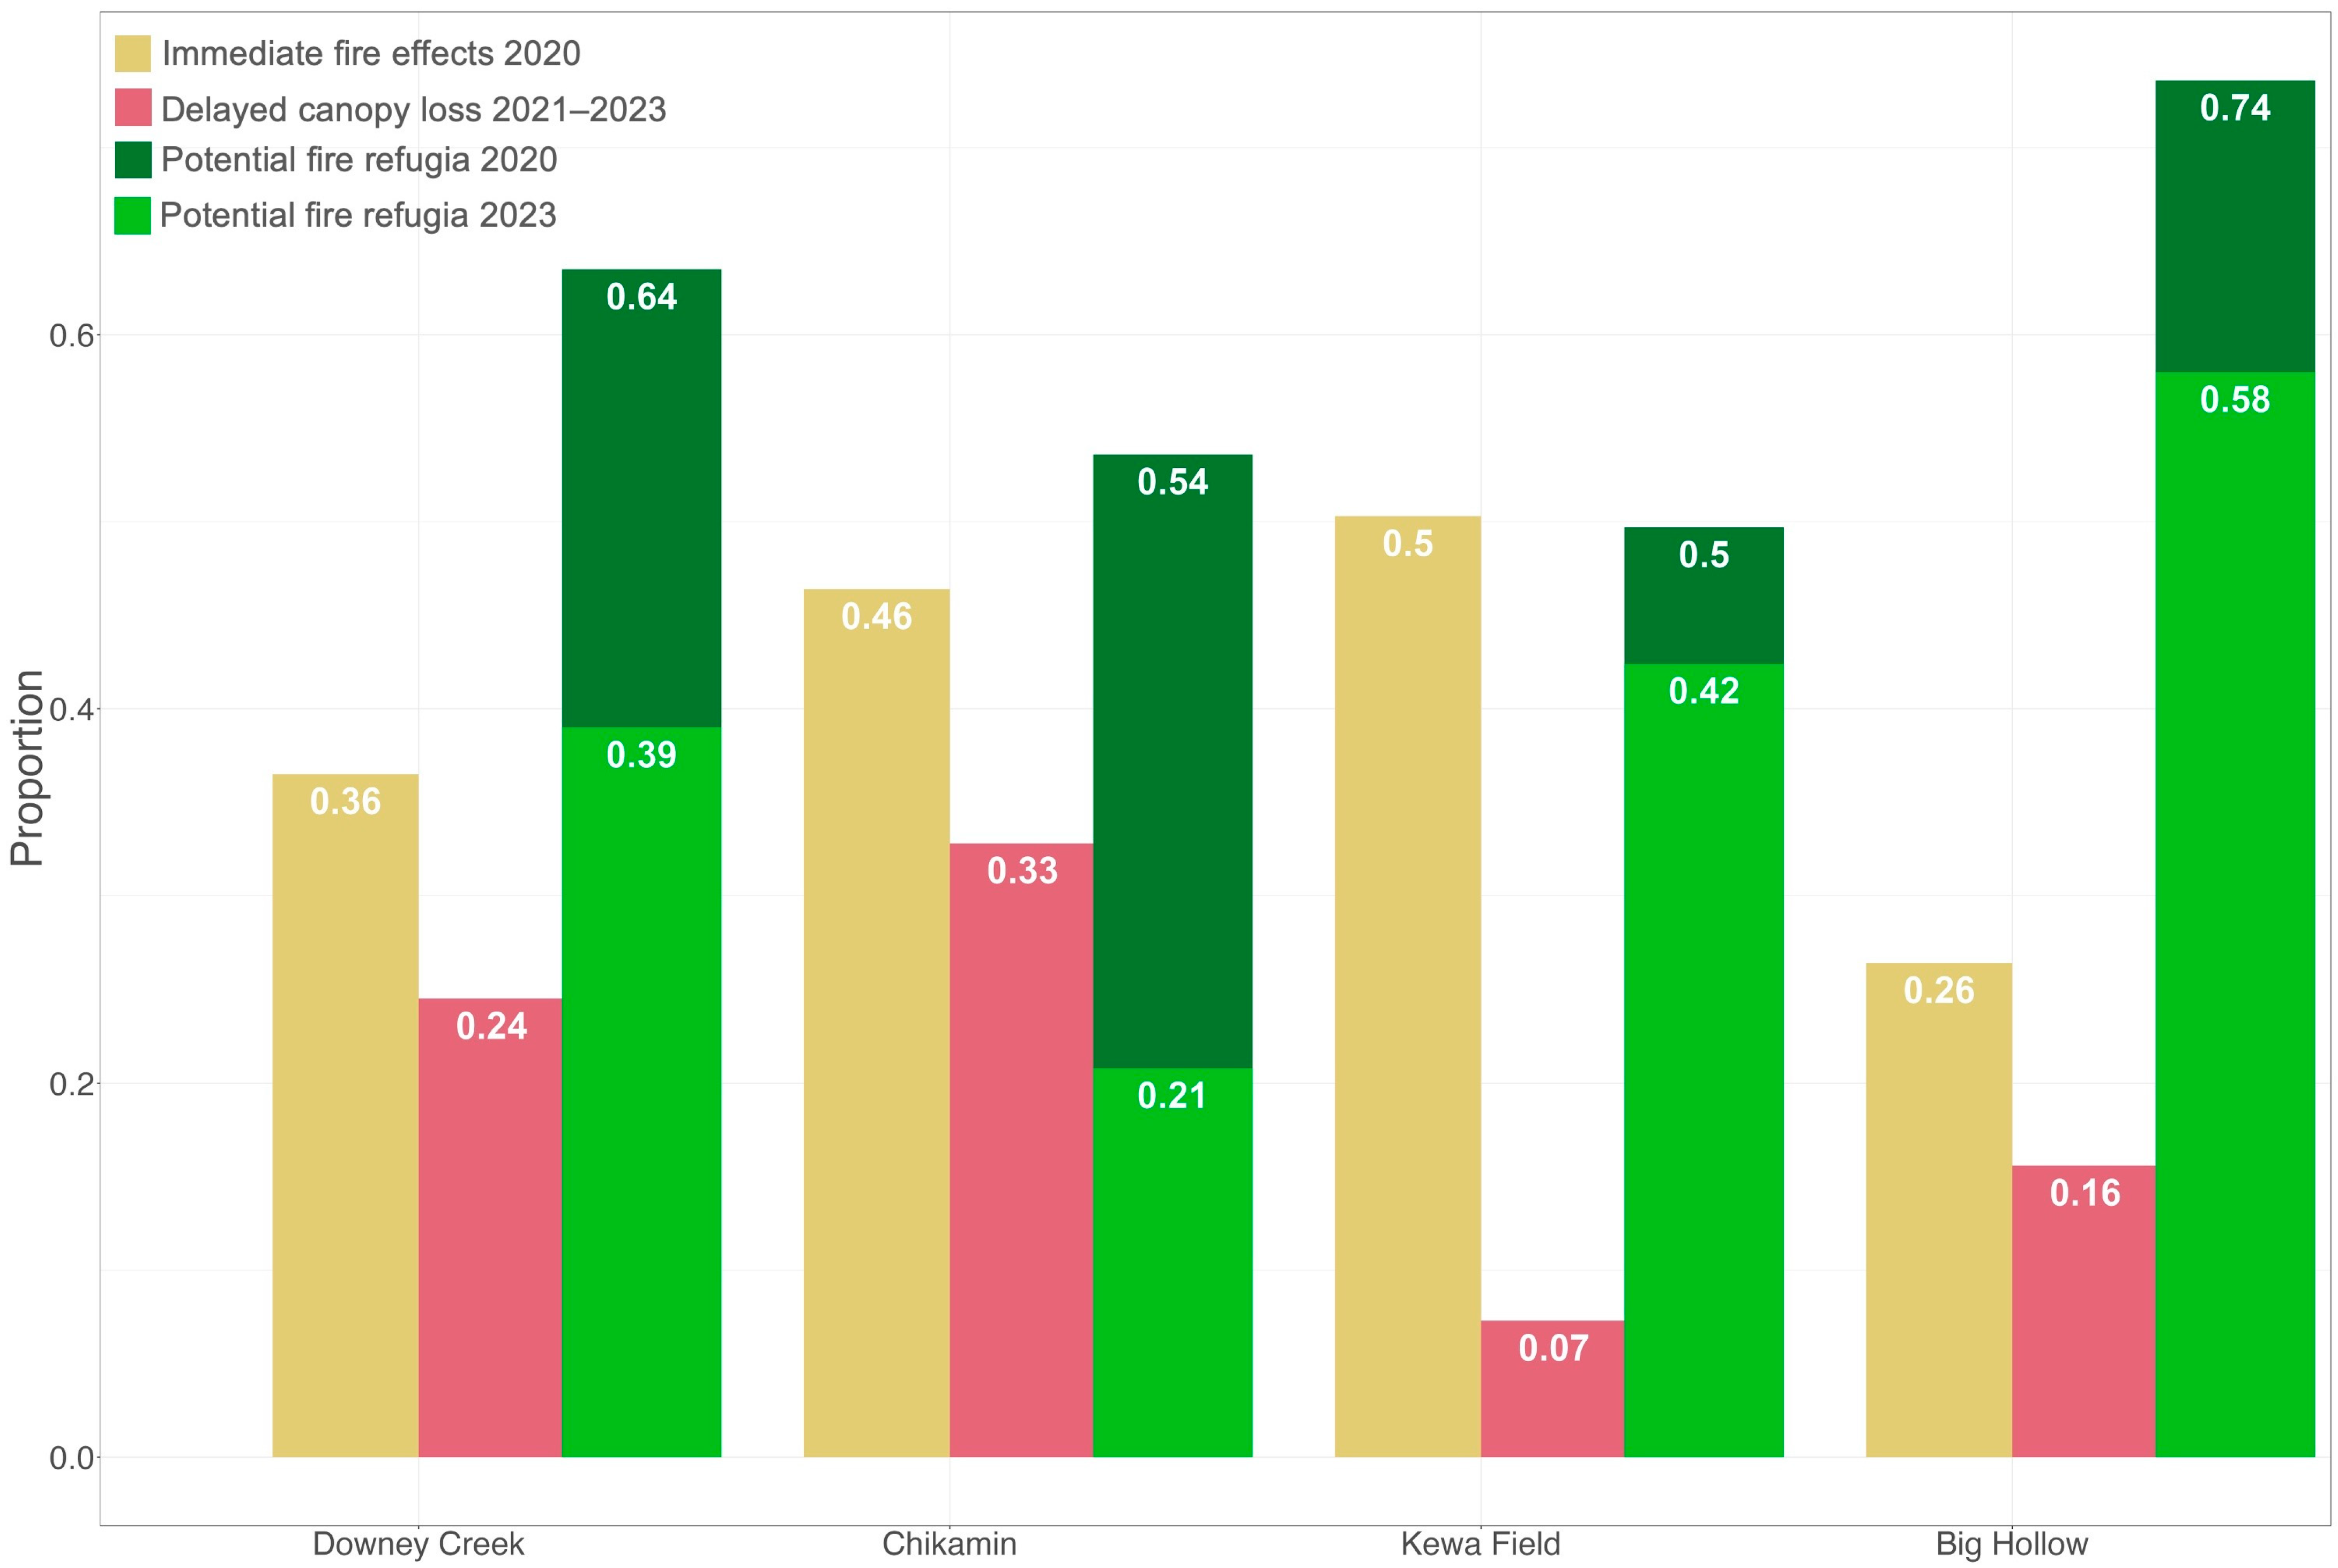
3.2. Maps of Yearly Tree Mortality and Durable Refugia

Substantial changes in canopy cover occurred both in 2020, the year of the fires, and in the following years, from 2021 to 2023. The proportion of immediate fire effects on the pre-fire forest cover ranged from 26% (Big Hollow Fire) to 50% (Kewa Field Fire) (Figure 4). Large areas experienced delayed canopy loss in 2021–2023, ranging from 7% (Kewa Field Fire) to 33% (Chikamin Fire). By 2023, the proportions of enduring refugia were variable, ranging from 21% (Chikamin Fire) to 58% (Big Hollow Fire) of the pre-fire forest cover. Due to the large delayed canopy losses, there was also a loss of refugia from 2020 to 2023. For example, in 2020 the Downey Creek Fire had 64.0% of its pre-fire forest cover classified as potential refugia, but by 2023 the potential refugia percentage was down to 39%.
We assumed that the forest cover changes in 2021–2023 within the wildfire perimeter were due to delayed canopy loss. In the three years after a fire, delayed canopy loss generally expanded outwards from the interior of each fire or at least occurred at the outer edge of what BULC-D had classified as ‘change’ in the previous year. The Downey Creek Fire was an obvious example of this pattern (Figure 5a). The central part of the fire was mapped as immediate fire effects in 2020, and the delayed canopy loss in 2021–2023 appears along the edges of the immediate fire effects. The remaining forest cover, which was classified as potential durable refugia, was largely found at the edges of the fire, although there were patches surrounded by burned area, resulting in a heterogeneous landscape. The Chikamin Fire (Figure 5b) was much patchier than the Downey Creek Fire (Figure 5a), but the delayed canopy loss still happened in pixels adjacent to the change in the previous years. As a reminder, the unburned area inside the fire perimeter was not necessarily marked as fire refugia if the NBR was not considered forest cover (NBR > 0.35). This was the case for the Chikamin (Figure 5b) and the Kewa Field (Figure 5c) Fires that contained large areas without forest cover.

4. Discussion

Our results show complex patterns of fire refugia and delayed canopy loss in the years after fire. In mapping delayed effects, we found that fire refugia may shrink over time along edges in the three years after fire, consistent with Busby et al. [7] and Reilly et al. [8]. There were also large losses in fire refugia from 2020 to 2023 due to delayed effects. Thus, mapping refugia in the year of the fire as well as delayed effects is important to portray the full spectrum of spatiotemporal changes in forest cover post-fire. As managers plan for recovery and resilience, BULC-D could be a useful tool for tracking the dynamics of fire refugia.

4.1. Tracking Delayed Canopy Loss

Trees often experience delayed canopy loss in the years after a wildfire, showing postponed instead of immediate effects [13]. This means that patches that appear as unburned or low severity in the year of the fire may not actually represent durable fire refugia, as the trees die when the damage from the fire slowly kills them, often in association with other stressors, such as drought or insects [29]. As such, mapping canopy cover only in the year of the fire may overestimate fire refugia within the wildfire perimeter. The results from analyzing four 2020 fires in the period 2021–2023 suggest that this may be an important pattern, as canopy losses in these years ranged from 7% (Kewa Field Fire) to 33% (Chikamin Fire) of the pre-fire forest cover, with an average of 20%, which is similar to the findings by Dyer et al. [51]. Past studies using remote sensing techniques have also indicated that there can be substantial delayed canopy loss even five years after fire [7,8], and this mortality may be driven by burn severity [7].
For all four fires, there were large decreases in canopy cover from 2021 to 2023, but some of this could be a delayed detection instead of delayed canopy loss, as indicated by the accuracy assessment. To detect a change in forest cover, BULC-D usually requires more than one NBR value that deviates from the expectation curve. In our analysis, the expectation NBR time series was fitted only with data from the summer season, because this is when wildfires occur and when leaf cover most closely follows a sinusoidal curve. However, when a fire occurs late in the summer, for example, just before the first snowfall, as in the Big Hollow and Kewa Field Fires, fewer post-fire images are available, which limits the ability of the algorithm to detect a change. Therefore, lower NBR values calculated from one or two post-fire images may not offer enough information for BULC-D to detect a change in forest cover in the year of the fire. Changes are detected the following year, but this is a delayed detection of the change in forest cover that occurred in the late summer. Although a known limitation, extending the analysis window past the first snow was infeasible with optical images due to snow’s high NBR values that do not behave according to the summer-season expectation. Snow limitations were particularly challenging with the Chikamin Fire because it occurred at high elevations. Thus, given the limited options for analysis past the first snowfall, there could have been an overestimation of the delayed canopy loss in the following season.
Although we have assumed that the canopy losses within the wildfire perimeter in 2021–2023 were due to delayed canopy loss, some changes were due to salvage logging and additional wildfires, as was confirmed during the accuracy assessment. Following a wildfire, damaged trees may be removed to recover some economic value from timber units and to protect the public from hazardous trees, a practice conducted by land managers or private companies [47]. The Kewa Field Fire was on land managed by the Confederated Tribes of the Colville Reservation, and a map of their salvage logging [52] showed that operations were conducted on land that was classified as changed by BULC-D, which was further confirmed during the accuracy assessment. The Chikamin and Downey Creek Fires happened in national forests [46,53], and the Big Hollow Fire happened in national forests and on state lands [54], where the U.S. Forest Service and the Washington Department of Natural Resources sometimes perform salvage logging after wildfires [47]. Although no salvage logging was identified for these specific fires during the accuracy assessment, there is always a possibility of such activity happening, which highlights the importance of rapidly mapping fire refugia to minimize the loss of these important landscape elements in supporting post-fire ecosystem functions [6]. Future research might consider how to distinguish change from wildfire and change from salvage logging, as the impact on the ecosystem varies depending on the disturbance. Salvage logging usually occurs in distinct units, while wildfire is patchy, which can help with visual interpretation of BULC-D maps; however, the algorithm itself has not been developed to automate the distinction between the two types of forest cover changes.

4.2. Do Fire Refugia Endure in the Years After Fire?

While the initial patches of fire refugia contribute to ecosystem recovery in the immediate post-fire environment, they may not continue to function as refugia due to delayed mortality, limiting their ability to provide longer-term functions such as shaded habitat and a continued seed source to surrounding areas [7]. Our analysis found that fire refugia endured in the three years after fire, but their size decreased over time. For example, in the Chikamin Fire (Figure 4), the potential refugia shrunk from 54% in 2020 to only 21% of the pre-fire forest cover by 2023. This was the most extreme example, as the loss of potential refugia was somewhat variable among the four fires. Nevertheless, the substantial losses in potential refugia are consistent with Busby et al. [7], who noticed that, although some forest refugia patches did not change in size, some small patches disappeared and many large patches shrank along their edges. Dyer et al. [51] also found that large patches were more resilient than smaller ones.
The drivers of delayed canopy loss and delayed mortality can include additional stressors that overlap with the fire disturbance. During the era of anthropogenic climate change, drought stress, reburns, and invasive species may exacerbate the initial effects of wildfire and create unique and unexpected changes in fire refugia that are difficult to predict [6]. Fire refugia are already dynamic landscape features that can be unpredictable under a changing climate. Although our study found that some patches of fire refugia can endure three years after fire, this finding only applies to the short term. Research is needed on how forests respond to overlapping disturbances and how anthropogenic climate change may affect the longevity of fire refugia.

4.3. Observations of Fire Refugia Spatial Patterns

Fire refugia occur in a patchy and dynamic distribution, driven by fuels, topography, and moisture, which affect fire behavior, as well as through the influence of fire operations [6,55]. Past research has found that refugia are often located in riparian areas or adjacent to fire breaks like roads or rocks because these features slow or stop fire spread [6,28]. To clarify, we considered durable refugia and not persistent refugia—persistent refugia are those patches of forest that survive through multiple fire events and often can be predicted from drivers like topographic templates and temperature [27]. However, the location of fire refugia can be stochastic and hard to predict due to sudden changes in weather during the fire, resulting in ephemeral refugia and adding to the patchiness in forest cover left by wildfire [6]. Increased soil moisture and topographic features like northern-facing slopes and valley bottoms have been found to be indicators of where fire refugia often occur [26,55].
As part of this study, we looked at the spatial patterns of refugia. The Downey Creek Fire had a large central portion that lost canopy cover in 2020, with an enduring canopy along the edges of the fire (Figure 5a). By comparison, the Chikamin Fire was much patchier, with refugia patches far within the perimeter and not just along the outside of the fire (Figure 5d). This difference in patchiness could be due to the vegetation and topography, which can drive fire spread and fire effects [26,55]. For the fires we analyzed, fuel continuity may have played a role in the distribution of fire refugia. The Downey Creek Fire occurred in an almost entirely forested landscape at a lower elevation than the Chikamin Fire. Therefore, the presence of fuel was continuous, with fewer potential breaks in the Downey Creek Fire. For the Chikamin Fire, which occurred at high elevations, the forest was already patchy before the fire, contributing to patchy fuel breaks. Meanwhile, the Kewa Field Fire was on forest managed for timber land, so it is logical that the change in 2020 happened in one large and relatively homogeneous patch (Figure 5b). We cannot extrapolate these patterns to entire ecoregions, but it is important to recognize that each fire occurred in a slightly different vegetation setting. The spatial pattern is also relevant to what we consider refugia. Fire refugia are often referred to as ‘unburned islands’ [6], thus there is the question of whether what was classified along the edges of the Downey Creek Fire was truly refugia.
The differences in forest types that burned in each fire can also help to explain the patterns in delayed canopy loss and the potential refugia seen in the maps. Dyer et al. [51] found that fire-intolerant species experienced more delayed canopy loss than fire-tolerant and -resistant species. The Downey Creek Fire and the Big Hollow Fire (respectively 24% and 16% delayed mortality) both burned in forests to the west of the crest of the Cascades that had more dense and moist forest types, including the common trees Tsuga heterophylla and Abies amabilis, which are relatively fire-intolerant, and Pseudotsuga menziesii, which is somewhat fire-adapted [5,34,35]. These two fires can be compared to the three fires mapped by Reilly et al. [8] for delayed mortality effects and burn severity in the West Cascades in Oregon and Washington, which all had similar species composition. They found that fires in the West Cascades had greater delayed effects compared to the East Cascades, Klamath-Siskiyous, and Sierra Nevada, which they speculated could be because the fire-intolerant trees typical of the West Cascades are more susceptible to crown scorch and thus delayed mortality [8]. Our results showed large areas of delayed canopy loss after fire in the West Cascades and North Cascades but also in the East Cascades and Okanogan, despite these being drier forest types that are potentially more fire-adapted [36]. Indeed, the Kewa Field Fire had the smallest proportion of delayed canopy loss (7%) and occurred in the driest region of the areas studied, the Okanogan [36], where the common trees Pinus ponderosa [5] and Pseudotsuga menziesii [5,36] are fire-adapted. Although the Okanogan forest historically experienced regular fires, management for timber resulted in a homogeneous and dense forest that is primed to burn [36]. Therefore, although the dry Okanogan forest could be more resilient to fire and delayed fire effects, the changes in the fire regime due to timber management could explain why there were still large areas of delayed canopy loss after the Kewa Field Fire.
Burn severity also plays a role in the pattern of delayed fire effects and refugia. Dyer et al. [51] reported that delayed mortality was more frequent in low and moderate burn severity areas and that fires that initially burned at high severity with little refugia left behind eventually lost a significant part of the remaining refugia. These findings were not reflected for the fires in this study that were mostly low and moderate burn severity based on MTBS [32] values, i.e., the Big Hollow and Kewa Field Fires, which had the lowest proportion of delayed canopy loss. Regarding the second part of the statement on high-severity fires—the Downey Creek and Chikamin Fires had the largest proportion of high burn severity—the remaining refugia areas within those fires were not small but did decrease by a large proportion. These results are more aligned with the findings of Busby et al. [7], who concluded that burn severity was strongly associated with delayed mortality, i.e., high-severity patches had more prevalent delayed mortality and compounding effects with climate moisture deficits. These mixed results highlight the complexity of burn severity as a driver of refugia, as more variables such as species life stage and forest type must be considered to understand what remains following a fire.

4.4. Limitations

Our analysis was from a landscape scale; however, with such a coarse resolution and broad extent, fire refugia and delayed canopy loss patterns could have been missed. A key limitation of studies that only use satellite data for identifying fire refugia is that the resolution is not high enough to identify very small refugia [15]. The highest resolution data that are easily available are from Sentinel-2 and have a spatial resolution of 10 m [56]. This means that fire refugia smaller than 100 m2, consisting of perhaps only a few trees, may not be identified by satellite data, especially if most of the pixel area was burned. Small refugia have been studied for specific organisms, revealing that patches smaller than the resolution of satellite data can play a crucial role in the survival of individual species after a fire [15]. The coarse resolution of satellite data may therefore inhibit the detection of important patches.
While performing the accuracy assessment, assigning the exact year of change for delayed effects was challenging. Given this challenge, we chose to map delayed effects for three years instead of producing year-by-year maps. Thus, for both manual inspection and mapping with BULC-D, precise thresholds for NBR decrease would likely need to be set to consistently identify the exact year when the canopy was lost due to delayed effects. However, the nature of delayed canopy loss is such that the NBR decreases gradually over time [7], so quantifying the change in NBR over several years may be a more useful goal for future research instead of identifying the precise year of change.

5. Conclusions

As wildfires become increasingly intense and severe in the Pacific Northwest, the ability to map wildfires and fire refugia with satellite data is useful for forest management and adaptation and to manage forest regeneration and resilience goals following fire. Fire refugia that persist in these patches are important for the re-establishment of the surrounding forest, supporting biodiversity and resilience to disturbance. The results of this study showed that the proportion of fire refugia for the 2020 fire season, calculated using the BULC-D algorithm with Landsat and Sentinel-2 imagery, ranged from 15.7% to 52.6% of the fire perimeters. These results were consistent with previous research on the area of refugia within wildfires and demonstrated that BULC-D can be used to identify patterns of delayed canopy loss and fire refugia. The mapping of recent fires may fail to fully capture the extent of fire refugia because of delayed canopy loss. This work is part of a growing body of research about delayed changes in forest cover after fire using validated methods.
This study is a starting point for exploring how BULC-D can be used to map wildfire severity mosaics, delayed canopy loss, and fire refugia, as well as other landscape disturbances. The algorithm can help us to better understand the complex dynamics of fire refugia and delayed canopy loss, drought, and insect mortality, as ecological disturbances and anthropogenic climate change affect forests in the Pacific Northwest.

Author Contributions

Conceptualization, A.M.A. and J.A.C.; Data curation, A.M.A.; Formal analysis, A.M.A.; Funding acquisition, J.A.C.; Investigation, A.M.A.; Methodology, A.M.A., F.P. and J.A.C.; Validation, F.P.; Resources, J.A.C.; Software, J.A.C.; Supervision, M.A.K. and J.A.C.; Writing—original draft, A.M.A.; Writing—review and editing, A.M.A., M.A.K. and F.P. All authors have read and agreed to the published version of the manuscript.

Funding

Funding for Dr Jeffrey A. Cardille was provided by the US Government interagency SilvaCarbon program and the Natural Sciences and Engineering Research Council of Canada (NSERC). Dr Meg Krawchuk is funded by Oregon State University.

Institutional Review Board Statement

Not applicable.

Informed Consent Statement

Not applicable.

Data Availability Statement

National Interagency Fire Center WFIGS Interagency Fire Perimeters https://data-nifc.opendata.arcgis.com/datasets/nifc::wfigs-interagency-fire-perimeters. Areas calculated by BULC-D in Google Earth Engine. https://drive.google.com/file/d/101CTixp-LlMZY0LQ2BNQO8gO-ttIujek/view?usp=sharing (accessed on 1 May 2023).

Acknowledgments

The project is the result of my undergraduate honors thesis and as such I would like to thank my parents Debbie and John Anderson for their support of my studies.

Conflicts of Interest

The authors declare no conflicts of interest.

Appendix A. Google Earth Engine Scripts

Appendix B. Supplementary Figures

Figure A1. The same values from the selected pixel in Figure 2 colored by sensor. On the left, the expectation built from the three years before the fire, and on the right, NBR values throughout the 2020 fire year.
Fire 08 00230 g0a1
Figure A2. The same as Figure 2, but with increased NBR shown. Note that because BULC-D tracks the three probabilities (decreased, stable, increased) as vectors that sum to 1, any given pixel is a blend of the colors red, green, and blue. In this context, the more ‘“pure’” a color is, the more confident the system is in the assessment. We present maps here in red/green because this is the native color ramp for BULC-D. We recognize this color scheme can be challenging for some readers.
Fire 08 00230 g0a2

References

  1. Higuera, P.E.; Abatzoglou, J.T. Record-Setting Climate Enabled the Extraordinary 2020 Fire Season in the Western United States. Glob. Change Biol. 2021, 27, 1–2. [Google Scholar] [CrossRef] [PubMed]
  2. Halofsky, J.E.; Peterson, D.L.; Harvey, B.J. Changing Wildfire, Changing Forests: The Effects of Climate Change on Fire Regimes and Vegetation in the Pacific Northwest, USA. Fire Ecol. 2020, 16, 4. [Google Scholar] [CrossRef]
  3. Johnston, J.D.; Schmidt, M.R.; Merschel, A.G.; Downing, W.M.; Coughlan, M.R.; Lewis, D.G. Exceptional Variability in Historical Fire Regimes across a Western Cascades Landscape, Oregon, USA. Ecosphere 2023, 14, e4735. [Google Scholar] [CrossRef]
  4. Spies, T.A.; Hessburg, P.F.; Skinner, C.N.; Puettmann, K.J.; Reilly, M.J.; Davis, R.J.; Kertis, J.A.; Long, J.W.; Shaw, D.C. Old Growth, Disturbance, Forest Succession, and Management in the Area of the Northwest Forest Plan. Synth. Sci. Inf. Land Manag. Northwest For. Plan Area 2018, 966, 95–243. [Google Scholar] [CrossRef]
  5. Stevens, J.T.; Kling, M.M.; Schwilk, D.W.; Varner, J.M.; Kane, J.M. Biogeography of Fire Regimes in Western U.S. Conifer Forests: A Trait-Based Approach. Glob. Ecol. Biogeogr. 2020, 29, 944–955. [Google Scholar] [CrossRef]
  6. Meddens, A.J.H.; Kolden, C.A.; Lutz, J.A.; Smith, A.M.S.; Cansler, C.A.; Abatzoglou, J.T.; Meigs, G.W.; Downing, W.M.; Krawchuk, M.A. Fire Refugia: What Are They, and Why Do They Matter for Global Change? BioScience 2018, 68, 944–954. [Google Scholar] [CrossRef]
  7. Busby, S.; Evers, C.; Holz, A. Patterns, Drivers, and Implications of Postfire Delayed Tree Mortality in Temperate Conifer Forests of the Western United States. Ecosphere 2024, 15, e4805. [Google Scholar] [CrossRef]
  8. Reilly, M.J.; Zuspan, A.; Yang, Z. Characterizing Post-Fire Delayed Tree Mortality with Remote Sensing: Sizing up the Elephant in the Room. Fire Ecol. 2023, 19, 64. [Google Scholar] [CrossRef]
  9. Key, C.H.; Benson, N.C. Landscape Assessment (LA); USDA Forest Service, Rocky Mountain Research Station: Ogden, UT, USA, 2006. [Google Scholar]
  10. Miller, J.D.; Thode, A.E. Quantifying Burn Severity in a Heterogeneous Landscape with a Relative Version of the Delta Normalized Burn Ratio (dNBR). Remote Sens. Environ. 2007, 109, 66–80. [Google Scholar] [CrossRef]
  11. Kennedy, R.E.; Yang, Z.; Cohen, W.B. Detecting Trends in Forest Disturbance and Recovery Using Yearly Landsat Time Series: 1. LandTrendr—Temporal Segmentation Algorithms. Remote Sens. Environ. 2010, 114, 2897–2910. [Google Scholar] [CrossRef]
  12. Cardil, A.; Mola-Yudego, B.; Blázquez-Casado, Á.; González-Olabarria, J.R. Fire and Burn Severity Assessment: Calibration of Relative Differenced Normalized Burn Ratio (RdNBR) with Field Data. J. Environ. Manag. 2019, 235, 342–349. [Google Scholar] [CrossRef] [PubMed]
  13. Angers, V.A.; Gauthier, S.; Drapeau, P.; Jayen, K.; Bergeron, Y. Tree Mortality and Snag Dynamics in North American Boreal Tree Species after a Wildfire: A Long-Term Study. Int. J. Wildland Fire 2011, 20, 751–763. [Google Scholar] [CrossRef]
  14. NASA Earth Science Data Systems. FIRMS Frequently Asked Questions|Earthdata. Available online: https://www.earthdata.nasa.gov/data/tools/firms/faq (accessed on 28 February 2024).
  15. Blomdahl, E.M.; Kolden, C.A.; Meddens, A.J.H.; Lutz, J.A. The Importance of Small Fire Refugia in the Central Sierra Nevada, California, USA. For. Ecol. Manag. 2019, 432, 1041–1052. [Google Scholar] [CrossRef]
  16. NASA Earth Science Data Systems. Harmonized Landsat and Sentinel-2 (HLS)|Earthdata. Available online: https://www.earthdata.nasa.gov/esds/harmonized-landsat-sentinel-2 (accessed on 16 October 2023).
  17. Cardille, J.A.; Fortin, J.A. Bayesian Updating of Land-Cover Estimates in a Data-Rich Environment. Remote Sens. Environ. 2016, 186, 234–249. [Google Scholar] [CrossRef]
  18. Pelletier, F.; Cardille, J.A.; Wulder, M.A.; White, J.C.; Hermosilla, T. Inter- and Intra-Year Forest Change Detection and Monitoring of Aboveground Biomass Dynamics Using Sentinel-2 and Landsat. Remote Sens. Environ. 2024, 301, 113931. [Google Scholar] [CrossRef]
  19. Xiong, S.; Baltezar, P.; Crowley, M.A.; Cecil, M.; Crema, S.C.; Baldwin, E.; Cardille, J.A.; Estes, L. Probabilistic Tracking of Annual Cropland Changes over Large, Complex Agricultural Landscapes Using Google Earth Engine. Remote Sens. 2022, 14, 4896. [Google Scholar] [CrossRef]
  20. Lee, J.; Cardille, J.A.; Coe, M.T. Agricultural Expansion in Mato Grosso from 1986–2000: A Bayesian Time Series Approach to Tracking Past Land Cover Change. Remote Sens. 2020, 12, 688. [Google Scholar] [CrossRef]
  21. Kolden, C.A.; Lutz, J.A.; Key, C.H.; Kane, J.T.; van Wagtendonk, J.W. Mapped versus Actual Burned Area within Wildfire Perimeters: Characterizing the Unburned. For. Ecol. Manag. 2012, 286, 38–47. [Google Scholar] [CrossRef]
  22. Meddens, A.J.H.; Kolden, C.A.; Lutz, J.A. Detecting Unburned Areas within Wildfire Perimeters Using Landsat and Ancillary Data across the Northwestern United States. Remote Sens. Environ. 2016, 186, 275–285. [Google Scholar] [CrossRef]
  23. Mackey, B.; Lindenmayer, D.; Norman, P.; Taylor, C.; Gould, S. Are Fire Refugia Less Predictable Due to Climate Change? Environ. Res. Lett. 2021, 16, 114028. [Google Scholar] [CrossRef]
  24. Walker, R.B.; Coop, J.D.; Downing, W.M.; Krawchuk, M.A.; Malone, S.L.; Meigs, G.W. How Much Forest Persists Through Fire? High-Resolution Mapping of Tree Cover to Characterize the Abundance and Spatial Pattern of Fire Refugia Across Mosaics of Burn Severity. Forests 2019, 10, 782. [Google Scholar] [CrossRef]
  25. Lesmeister, D.B.; Davis, R.J.; Sovern, S.G.; Yang, Z. Northern Spotted Owl Nesting Forests as Fire Refugia: A 30-Year Synthesis of Large Wildfires. Fire Ecol. 2021, 17, 32. [Google Scholar] [CrossRef]
  26. Meigs, G.W.; Dunn, C.J.; Parks, S.A.; Krawchuk, M.A. Influence of Topography and Fuels on Fire Refugia Probability under Varying Fire Weather Conditions in Forests of the Pacific Northwest, USA. Can. J. For. Res. 2020, 50, 636–647. [Google Scholar] [CrossRef]
  27. Downing, W.M.; Meigs, G.W.; Gregory, M.J.; Krawchuk, M.A. Where and Why Do Conifer Forests Persist in Refugia through Multiple Fire Events? Glob. Change Biol. 2021, 27, 3642–3656. [Google Scholar] [CrossRef]
  28. Meigs, G.W.; Krawchuk, M.A. Composition and Structure of Forest Fire Refugia: What Are the Ecosystem Legacies across Burned Landscapes? Forests 2018, 9, 243. [Google Scholar] [CrossRef]
  29. Krawchuk, M.A.; Meigs, G.W.; Cartwright, J.M.; Coop, J.D.; Davis, R.; Holz, A.; Kolden, C.; Meddens, A.J. Disturbance Refugia within Mosaics of Forest Fire, Drought, and Insect Outbreaks. Front. Ecol. Environ. 2020, 18, 235–244. [Google Scholar] [CrossRef]
  30. National Interagency Fire Center. WFIGS Current Interagency Fire Perimeters. Available online: https://data-nifc.opendata.arcgis.com/datasets/nifc::wfigs-current-interagency-fire-perimeters/about (accessed on 21 September 2023).
  31. DNR. Ecoregions of the Pacific Northwest. Available online: https://data-wadnr.opendata.arcgis.com/datasets/3b9362e8f29e465a985aa8ddc8de2d86_0/about (accessed on 17 February 2024).
  32. MTBS Project (USDA Forest Service/U.S. Geological Survey). MTBS Data Access: Burned Areas Boundaries Dataset; USDA Forest Service: Washington, DC, USA, 2021. [Google Scholar]
  33. Reilly, M.J.; Zuspan, A.; Halofsky, J.S.; Raymond, C.; McEvoy, A.; Dye, A.W.; Donato, D.C.; Kim, J.B.; Potter, B.E.; Walker, N.; et al. Cascadia Burning: The Historic, but Not Historically Unprecedented, 2020 Wildfires in the Pacific Northwest, USA. Ecosphere 2022, 13, e4070. [Google Scholar] [CrossRef]
  34. Iachetti, P.; Floberg, J.; Wilhere, G.; Ciruna, K.; Markovic, D.; Lewis, J.; Heiner, M.; Kittel, G.; Crawford, R.; Farone, S. North Cascades and Pacific Ranges Ecoregional Assessment, Volume 1-Report; Nature Conservancy of Canada: Victoria, BC, Canada, 2006. [Google Scholar]
  35. Popper, K.; Wilhere, G.; Schindel, M.; VanderSchaaf, D.; Skidmore, P.; Stroud, G.; Crandall, J.; Kagan, J.; Crawford, R.; Kittel, G. The East Cascades—Modoc Plateau and West Cascades Ecoregional Assessments; The Nature Conservancy: Portland, OR, USA, 2007. [Google Scholar]
  36. Pryce, B.; Iachetti, P.; Wilhere, G.; Ciruna, K.; Floberg, J.; Crawford, R.; Dye, R.; Fairbarns, M.; Farone, S.; Ford, S. Okanagan Ecoregional Assessment, Volume 1-Report; Nature Conservancy of Canada: Victoria, BC, Canada, 2006. [Google Scholar]
  37. Chappell, C. North Pacific Dry-Mesic Silver Fir-Western Hemlock-Douglas-Fir Forest|NatureServe Explorer. Available online: https://explorer.natureserve.org/Taxon/ELEMENT_GLOBAL.2.769632/North_Pacific_Dry-Mesic_Silver_Fir-Western_Hemlock-Douglas-fir_Forest (accessed on 1 February 2024).
  38. Kittel, G.; Chappell, C. North Pacific Maritime Dry-Mesic Douglas-Fir-Western Hemlock Forest|NatureServe Explorer. Available online: https://explorer.natureserve.org/Taxon/ELEMENT_GLOBAL.2.738966/North_Pacific_Maritime_Dry-Mesic_Douglas-fir-Western_Hemlock_Forest (accessed on 1 February 2024).
  39. Northern Rocky Mountain Dry-Mesic Montane Mixed Conifer Forest|NatureServe Explorer. Available online: https://explorer.natureserve.org/Taxon/ELEMENT_GLOBAL.2.722868/Northern_Rocky_Mountain_Dry-Mesic_Montane_Mixed_Conifer_Forest (accessed on 1 February 2024).
  40. Rocky Mountain Subalpine Mesic-Wet Spruce-Fir Forest and Woodland|NatureServe Explorer. Available online: https://explorer.natureserve.org/Taxon/ELEMENT_GLOBAL.2.722843/Rocky_Mountain_Subalpine_Mesic-Wet_Spruce-Fir_Forest_and_Woodland (accessed on 1 February 2024).
  41. Hood, S.M.; Harvey, B.J.; Fornwalt, P.J.; Naficy, C.E.; Hansen, W.D.; Davis, K.T.; Battaglia, M.A.; Stevens-Rumann, C.S.; Saab, V.A. Fire Ecology of Rocky Mountain Forests. In Fire Ecology and Management: Past, Present, and Future of US Forested Ecosystems; Greenberg, C.H., Collins, B., Eds.; Managing Forest Ecosystems; Springer International Publishing: Cham, Switzerland, 2021; Volume 39, pp. 287–336. ISBN 978-3-030-73266-0. [Google Scholar]
  42. Geological Survey; USDA LANDFIRE: LANDFIRE Existing Vegetation Type Layer. Available online: https://www.landfire.gov/viewer/ (accessed on 1 May 2023).
  43. Gorelick, N.; Hancher, M.; Dixon, M.; Ilyushchenko, S.; Thau, D.; Moore, R. Google Earth Engine: Planetary-Scale Geospatial Analysis for Everyone. Remote Sens. Environ. 2017, 202, 18–27. [Google Scholar] [CrossRef]
  44. Braaten, J.; Schwehr, K.; Ilyushchenko, S. More Accurate and Flexible Cloud Masking for Sentinel-2 Images. Google Earth Earth Engine 2020. [Google Scholar]
  45. Fortin, J.A.; Cardille, J.A.; Perez, E. Multi-Sensor Detection of Forest-Cover Change across 45 Years in Mato Grosso, Brazil. Remote Sens. Environ. 2020, 238, 111266. [Google Scholar] [CrossRef]
  46. USFS Mt. Baker-Snoqualmie National Forest—Alerts & Closures. Available online: https://www.fs.usda.gov/wps/portal/fsinternet3/cs/detail/mbs/alerts-notices/ (accessed on 30 January 2024).
  47. Prestemon, J.P.; Holmes, T.P. Timber Salvage Economics. The Economics of Forest Disturbances: Wildfires, Storms, and Invasive Species; Springer: Berlin/Heidelberg, Germany, 2008; pp. 167–190. [Google Scholar]
  48. Olofsson, P.; Foody, G.M.; Herold, M.; Stehman, S.V.; Woodcock, C.E.; Wulder, M.A. Good Practices for Estimating Area and Assessing Accuracy of Land Change. Remote Sens. Environ. 2014, 148, 42–57. [Google Scholar] [CrossRef]
  49. Stehman, S.V. Estimating Area and Map Accuracy for Stratified Random Sampling When the Strata Are Different from the Map Classes. Int. J. Remote Sens. 2014, 35, 4923–4939. [Google Scholar] [CrossRef]
  50. Incident Table. Available online: http://inciweb.nwcg.gov/accessible-view (accessed on 30 March 2023).
  51. Dyer, A.S.; Busby, S.; Evers, C.; Reilly, M.; Zuspan, A.; Holz, A. Post-Fire Delayed Tree Mortality in Mesic Coniferous Forests Reduces Fire Refugia and Seed Sources. Landsc. Ecol. 2025, 40, 101. [Google Scholar] [CrossRef]
  52. Confederated Tribes of the Colville Reservation Forestry—Kewa Fields Fire Salvage Map. Available online: https://www.colvilletribes.com/forestry (accessed on 31 October 2023).
  53. Okanogan-Wenatchee National Forest—Alerts & Closures. Available online: https://www.fs.usda.gov/wps/portal/fsinternet3/cs/detail/okawen/alerts-notices/ (accessed on 31 October 2023).
  54. Wildfire Division. Wildfire Season 2020; Washington Department of Natural Resources: Washington, DC, USA, 2020. [Google Scholar]
  55. Krawchuk, M.A.; Haire, S.L.; Coop, J.; Parisien, M.-A.; Whitman, E.; Chong, G.; Miller, C. Topographic and Fire Weather Controls of Fire Refugia in Forested Ecosystems of Northwestern North America. Ecosphere 2016, 7, e01632. [Google Scholar] [CrossRef]
  56. European Space Agency. Spatial—Resolutions—Sentinel-2 MSI—User Guides—Sentinel Online. Available online: https://copernicus.eu/user-guides/sentinel-2-msi/resolutions/spatial (accessed on 2 April 2023).
Figure 1. The four wildfires from the 2020 fire season that were analyzed using BULC-D and their locations within the level III ecoregions [30,31].
Fire 08 00230 g001
Figure 2. The Downey Creek Fire started on 16 August 2020 [45]. The maps of change in 2020 (a) and 2021 (b) indicated that the canopy loss expanded from 2020 to 2021. The expectation built from the three years prior to the fire (c) indicated a very stable, high NBR through the years. NBR values throughout the 2020 fire year (d) were similar and did not indicate a change in that pixel. During the 2021 growing season, (e) NBR values slowly decreased in comparison with the expectation for a healthy stand, which suggests delayed canopy loss. For ease of viewing, the map only shows the probability of stable or decreased NBR; the same figure including the probability of increased NBR can be found in Appendix B.
Fire 08 00230 g002
Figure 3. Enlarged area of the Downey Creek Fire (a) showing the mosaic of immediate fire effects and delayed canopy loss (b). The 2020 Sentinel-2 post-fire composite image shows the burned area immediately after the fire (c), while the 2023 high-resolution Google Earth image (d) and Sentinel-2 composite image (e) show the delayed canopy loss that happened between 2021 and 2023. The Sentinel-2 images are short-wave false color composites using bands B12, B8, and B4.
Fire 08 00230 g003
Figure 4. The Downey Creek, Chikamin, Kewa Field, and Big Hollow Fires occurred in the 2020 wildfire season [50]. In each fire, the forest cover endured (fire refugia) or changed immediately following the fire or progressively (delayed canopy loss) in different proportions calculated based on the BULC-D algorithm. For all fires, the proportion of potential refugia in 2020 decreased compared to the potential refugia at the end of the 2023 growing season.
Fire 08 00230 g004
Figure 5. Maps of immediate fire effects, delayed canopy loss, and potential durable refugia for four fires that occurred in 2020: Downey Creek (a), Chikamin (b), Kewa Field (c), and Big Hollow (d).
Fire 08 00230 g005
Table 1. The start date, area, and Monitoring Trends in Burn Severity (MTBS) values [32] for the four 2020 wildfires analyzed. Please note, MTBS values may not add to the area within the fire perimeter, as some of the area may fall in the non-processing area mask.
FireStart DateArea Within National Interagency Fire Center Perimeter (ha)MTBS Burn Severity
Unburned to LowLowModerateHigh
Big Hollow Fire8 September 202098142076435615081874
Chikamin Fire31 July 202078679242282183
Downey Creek Fire16 August 2020937200236221280
Kewa Field Fire7 September 20204 7766312934860351
Table 2. Confusion matrix of estimated proportions of area for the change detection assessment.
Reference
UnburnedBurnedTotalUser’s AccuracyProducer’s AccuracyOverall Accuracy
Unburned0.4270.0910.5180.825 ± 0.0300.985 ± 0.0070.903 ± 0.016
Burned0.0060.4750.4820.987 ± 0.0060.839 ± 0.023
Total0.4340.5661.000
Table 3. Confusion matrix of estimated proportions of area for the timing of canopy loss assessment.
Reference
Immediate Fire EffectsDelayed Canopy LossTotalUser’s
Accuracy
Producer’s AccuracyOverall Accuracy
Immediate fire effects0.6630.0280.6910.960 ± 0.0200.849 ± 0.0160.854 ± 0.020
Delayed canopy loss0.1180.1910.3090.619 ± 0.046 0.873 ± 0.055
Total0.7810.2191.000
Disclaimer/Publisher’s Note: The statements, opinions and data contained in all publications are solely those of the individual author(s) and contributor(s) and not of MDPI and/or the editor(s). MDPI and/or the editor(s) disclaim responsibility for any injury to people or property resulting from any ideas, methods, instructions or products referred to in the content.

