Article

Experimental Study on Working Characteristics of Microwave-Assisted Spark Plug Igniter

1
Aviation Engineering School, Air Force Engineering University, Xi’an 710038, China
2
School of Energy and Power Engineering, Xi’an Jiaotong University, Xi’an 710043, China
*
Author to whom correspondence should be addressed.
Fire 2025, 8(6), 231; https://doi.org/10.3390/fire8060231
Submission received: 1 March 2025 / Revised: 26 May 2025 / Accepted: 27 May 2025 / Published: 12 June 2025

Abstract

In this paper, a study on the working characteristics of microwave-assisted spark plug igniter was carried out. Experiments were carried out in a vacuum chamber to investigate the effects of microwave feeding with different parameters on the spark plug discharge process, breakdown voltage, average power, discharge spectral intensity, and characteristic temperature of the discharge plasma under different ambient pressures (0.1 MPa at atmospheric pressure and 0.05 MPa at low pressure). The results show that the breakdown voltage decreased by 15.2% and the average power of discharge increased by 49% when the microwave pulse peak power increased from 0 W to 200 W under a low-pressure environment; meanwhile, the breakdown voltage decreased by 10.8% and the average power increased by 23% under an atmospheric-pressure environment. When the microwave pulse frequency was increased from 1 kHz to 10 kHz, the breakdown voltage further decreased by 15.2% in a low-voltage environment, but there was no significant effect on the average power. The plasma characteristic temperature rose significantly with the peak power: the electron temperature rose from 1.961 eV to 2.154 eV with the power at atmospheric pressure, and the vibrational and rotational temperatures also increased significantly.

Graphical Abstract

1. Introduction

The traditional ignition technology of the aero-engine is to use spark plug discharge to produce an electric spark to ignite the oil–gas mixture. However, the ignition boundary of this ignition method is narrow and is greatly affected by the flight speed and altitude of the aircraft. Once the engine stops at high altitude, it is difficult to start the second ignition, and it is necessary to descend in flight altitude in order to ignite successfully. In recent years, microwave plasma ignition technology has been gradually developed, in which microwave-assisted spark plug ignition has combined the advantages of traditional spark plug and plasma ignition technology, as well as has strong practicability.
The research on microwave-assisted spark plug ignition started early in foreign countries. The University of California, Berkeley, the Imagineering Company of Japan, and the Korea Advanced Science and Technology Research Institute have carried out a series of numerical simulation and experimental studies on microwave-assisted spark plug ignition.
In 2009, Yuji Ikeda et al. [1], of Imagineering Company of Japan, proposed a new technology using spark discharge and microwaves to generate plasma, that is, using microwave-assisted spark plug discharge to generate plasma. Microwave-enhanced plasma ignition increases the lean burn limit of gasoline from 19.3 to 24.1.
In 2011, Defilippo et al. [2] of the University of California, Berkeley, USA, carried out gasoline lean-burn ignition experiments on a single-cylinder engine using coupled spark plugs made by the Imagineering Company of Japan. Microwave feeding accelerated the formation of the initial ignition core and quickly reached the critical flame size.
In 2013, Wolk et al. [3], of the University of California, Berkeley, used a constant volume bomb with a volume of 1.45 L to study the ignition and combustion characteristics of methane and air when subjected to traditional spark plug and microwave-assisted spark plug ignition modes under different ambient pressures and different mixture equivalence ratios.
In 2016, Joonsik Hwang et al. [4] of the Korea Advanced Science and Technology Research Institute conducted an experimental study on the effect of microwave radiation plasma ignition on the development of acetylene–air mixed gas flow flame using a constant volume combustion bomb with a volume of 1.4 L.
In 2016, Srinivas Padala et al. [5] used the schlieren technique to study the effect of microwave-assisted plasma ignition on unsteady, expanded, and a premixed propane–air flame under different mixture equivalence ratios and different microwave radiation times in a roof-shaped constant volume combustor.
Chinese researchers started their research on microwave-assisted spark plug ignition relatively late. Zhang, X. et al. [6,7,8] carried out a series of numerical simulations and experimental studies on microwave-assisted spark plug ignition. Their experimental results show that the enhancement of microwave ignition mainly promotes the development of the initial fire nucleus, and microwaves have no significant effect on the flame propagation at the later stage. Wang Zhihao et al. [9] conducted an experimental study of methanol under different environmental factors and microwave parameters, and the results show that increasing microwave power and microwave frequency both help the ignition of methanol. Furthermore, the delayed feed of microwaves has a better enhancement effect on the ignition of methanol compared with the early feed of microwaves. Liu Chaohui et al. [10] innovatively introduced an electrical diagnostic system to diagnose electrical properties during the microwave-assisted ignition process, and, from the perspective of microwave energy flow, they also explored the influence of microwave characteristics on the microwave-assisted ammonia/hydrogen fuel ignition process, where they found that the range of the ignition equivalence ratio can be further expanded and the hydrogen doping ratio can be further reduced.
Previous studies have mostly focused on the single-factor effects of microwaves on the combustion process, while the coupling mechanism between microwave parameters and ignition characteristics has not been systematically revealed. With the development of aircraft to high-altitude and high-speed extreme environments, the lack of ignition reliability of traditional spark plugs at low pressures is becoming increasingly prominent. Although microwave-assisted ignition technology has shown significant potential by enhancing the plasma energy density, there is still a research gap in its quantitative influence on the ignition characteristics of multi-physics field coupling. Moreover, especially in low-pressure environments, the microwave parameters on the discharge dynamics and the plasma energy distribution of the regulation mechanism need to be explored in depth.
In this study, the coaxial semiconductor spark plug was taken as an object, and a high-precision electrical diagnostic system and a multi-dimensional analysis technique of plasma spectrum were innovatively integrated to realize the synchronous capture of the voltage/current waveforms of the discharge process and the characteristic temperature of the plasma. By constructing a vacuum experimental silo to simulate the low-pressure environment at a height of 10–15 km, the dynamic effects of the microwave pulse peak power and frequency on the breakdown voltage, average power, and plasma spectral intensity were systematically studied. Moreover, the quantitative regulation law of microwave energy injection on the spark plug discharge in multiple phases under the low-pressure condition was revealed, which will lay a foundation for the subsequent research on the ignition performance of microwave-assisted spark plug igniters.

2. Experimental System

2.1. Experimental Test System for the Discharge Characteristics of the Igniter

Figure 1 is a schematic diagram of the experimental test system for the discharge characteristics of a microwave-assisted spark plug igniter, which is mainly composed of a coaxial semiconductor spark plug, igniter drive power supply, microwave source, coaxial connection line, monopole antenna, ignition coil, voltage and current probe, oscilloscope, vacuum pump, and vacuum experimental chamber. As can be seen from Figure 1, the microwave power supply is connected to the monopole antenna installed on the spark plug through a coaxial connection cable, and the positive and negative poles of the spark plug drive power supply are connected to the ignition coil through an aviation plug. In order to measure the voltage signal of the spark plug, the high-voltage end of the ignition coil is connected with the anode of the spark plug and connected with the high-voltage probe, which transmits the measured voltage signal to the fourth channel of the oscilloscope for acquisition. In order to measure the current signal of the spark plug, the shell of the ignition coil is connected with the cathode of the spark plug to form a loop, the current ring of the current probe is fixed on the circuit, and the current probe transmits the measured current signal to the first channel of the oscilloscope for acquisition.
In the experiment, the discharge system consists of a driving power supply, an ignition coil, and a coaxial semiconductor spark plug. The driving power supply of the igniter adopts the DC stabilized power supply (RXN-3010D) produced by Zhaoxin Company (Shenzhen, China). The input voltage of the power supply is 220 V, the maximum output voltage is 30 V, and the output voltage is adjusted to 27 V when working. The ignition coil uses the DH-6 ignition coil used in the aero-engine, the discharge frequency is 400–800 Hz, and the energy storage energy is 50 mJ. The coaxial semiconductor spark plug is composed of cathode, anode, and interelectrode semiconductor materials. The maximum outer diameter is 12 mm and the pole spacing is 1.7 mm.
The microwave transmission system was composed of a 2.45 GHz high-precision pulsed microwave source (Anhui Kuyi Electromagnetic Technology Co., Ltd. (Ma’anshan, China)), an RG142 coaxial radio frequency cable, and a custom-designed monopole antenna (TE Connectivity, Galway, Ireland). The microwave source, driven by a field-effect transistor (FET), generated rectangular pulses with adjustable peak power (0–200 W), frequency (1–10 kHz), and duty cycle (0.1–0.9), featuring a rise time of <50 ns. The monopole antenna was embedded into the sidewall of the spark plug cathode and connected to the coaxial cable via an impedance matching network, ensuring efficient coupling of microwave energy into the discharge gap. A RG142 coaxial radio frequency cable with a characteristic impedance of 50 Ω was utilized to connect the microwave source to the monopole antenna. The system standing wave ratio was calibrated using a vector network analyzer, with the VSWR maintained below 1.5, to ensure efficient microwave energy transmission to the spark plug discharge region. An LC compensation circuit was integrated at the antenna terminal to suppress the reflected power, achieving a measured reflection coefficient of less than 5%.
Figure 2a shows the vacuum chamber used in the experiment, which was designed and made by the laboratory, and the lowest negative pressure that could be realized was 0.06 MPa. The vacuum pump (Figure 2b) uses a single-phase double-valued capacitor motor with a power of 370 W, a speed of 1400 r/min, and a frequency of 50 Hz.

2.2. Experimental Test System for the Spectral Characteristics of the Igniter

The experimental test system for the emission spectrum characteristics of the microwave-assisted spark plug igniter is shown in Figure 3. It is mainly composed of a coaxial semiconductor spark plug, DC power supply, microwave source, coaxial connection line, monopole antenna, ignition coil, vacuum pump, vacuum chamber, computer, optical fiber collimating mirror, and a spectrometer.

3. Experimental Results and Discussion

3.1. Discharge Characteristics of the Microwave-Assisted Spark Plug Igniter

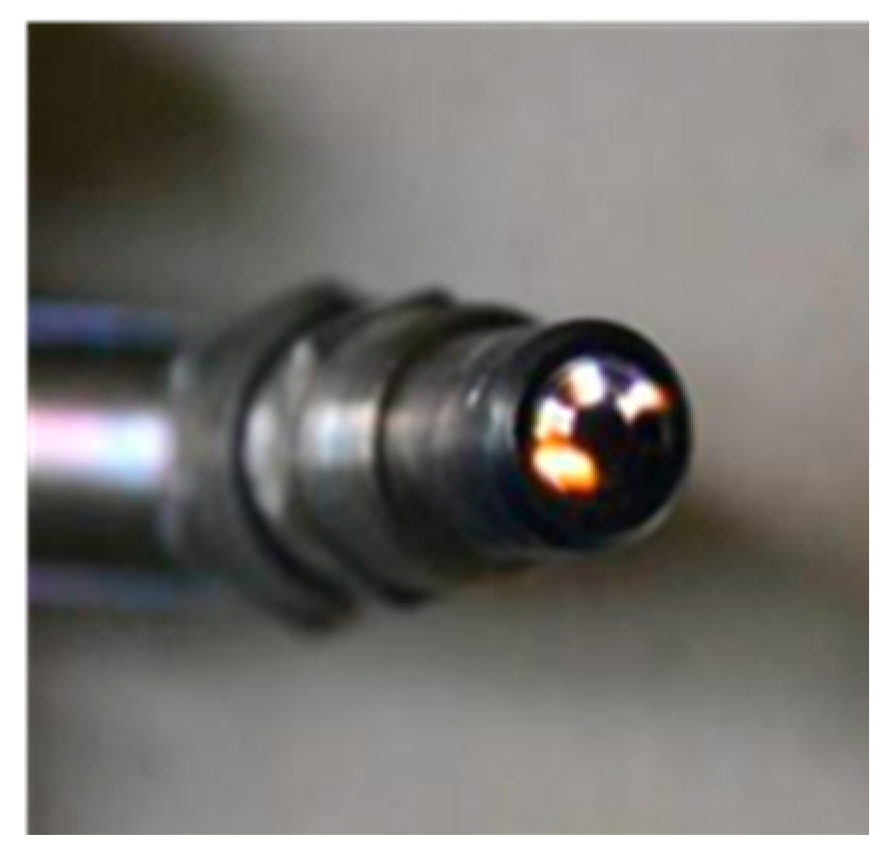
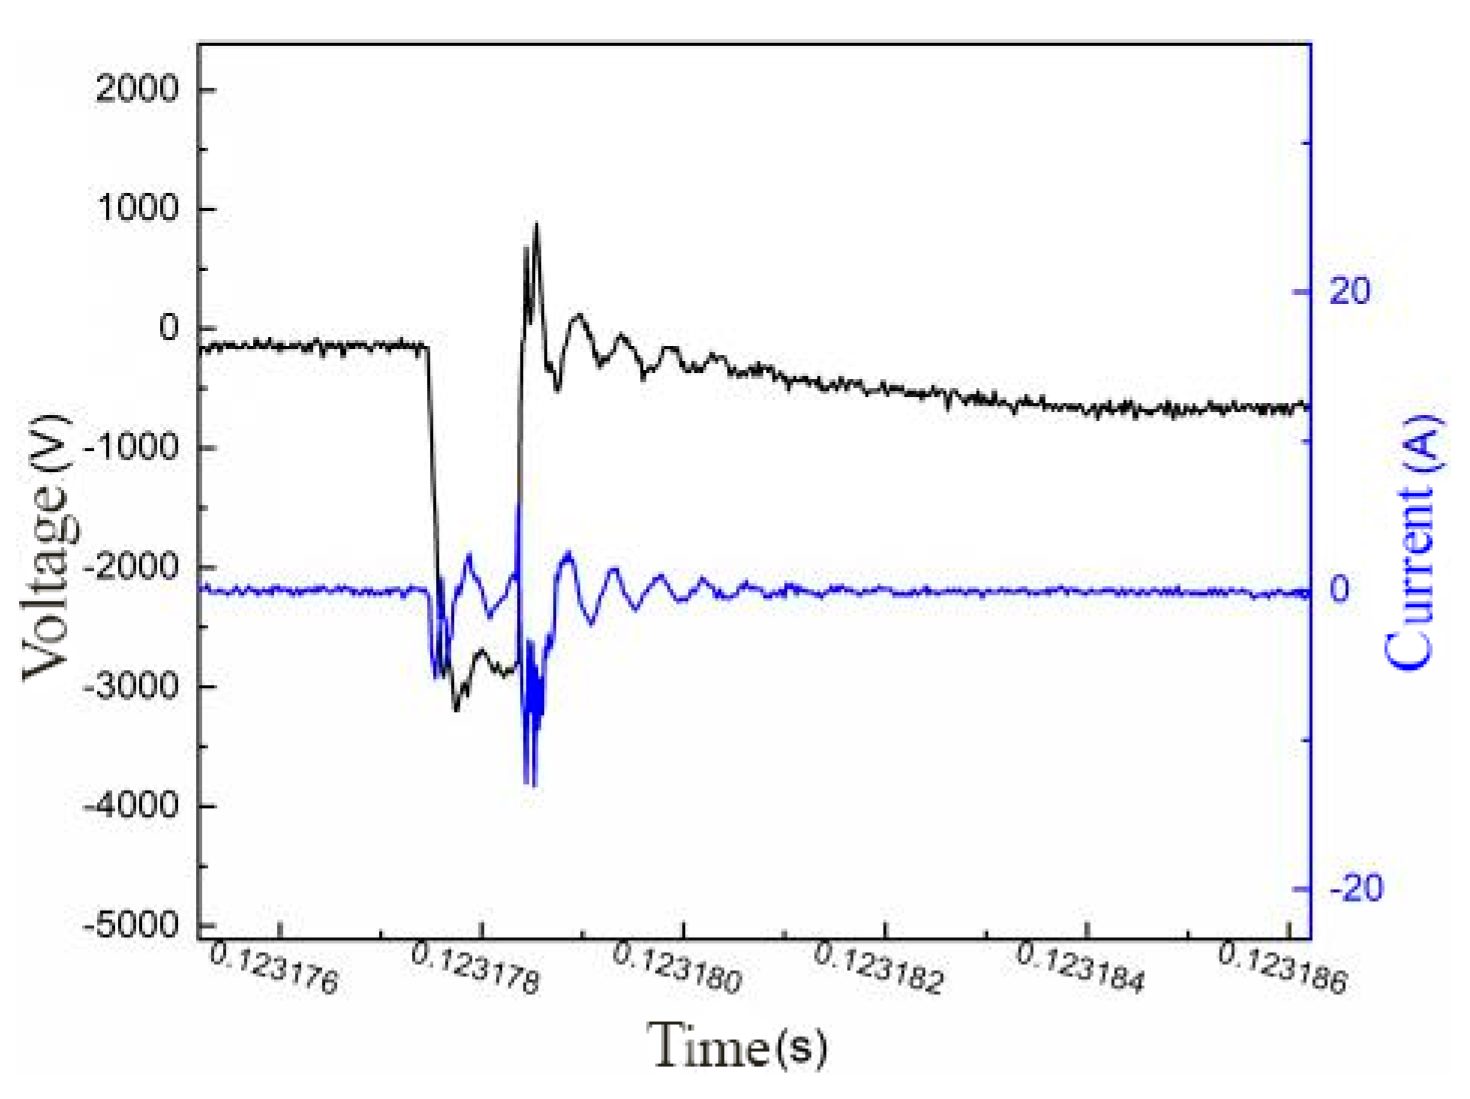
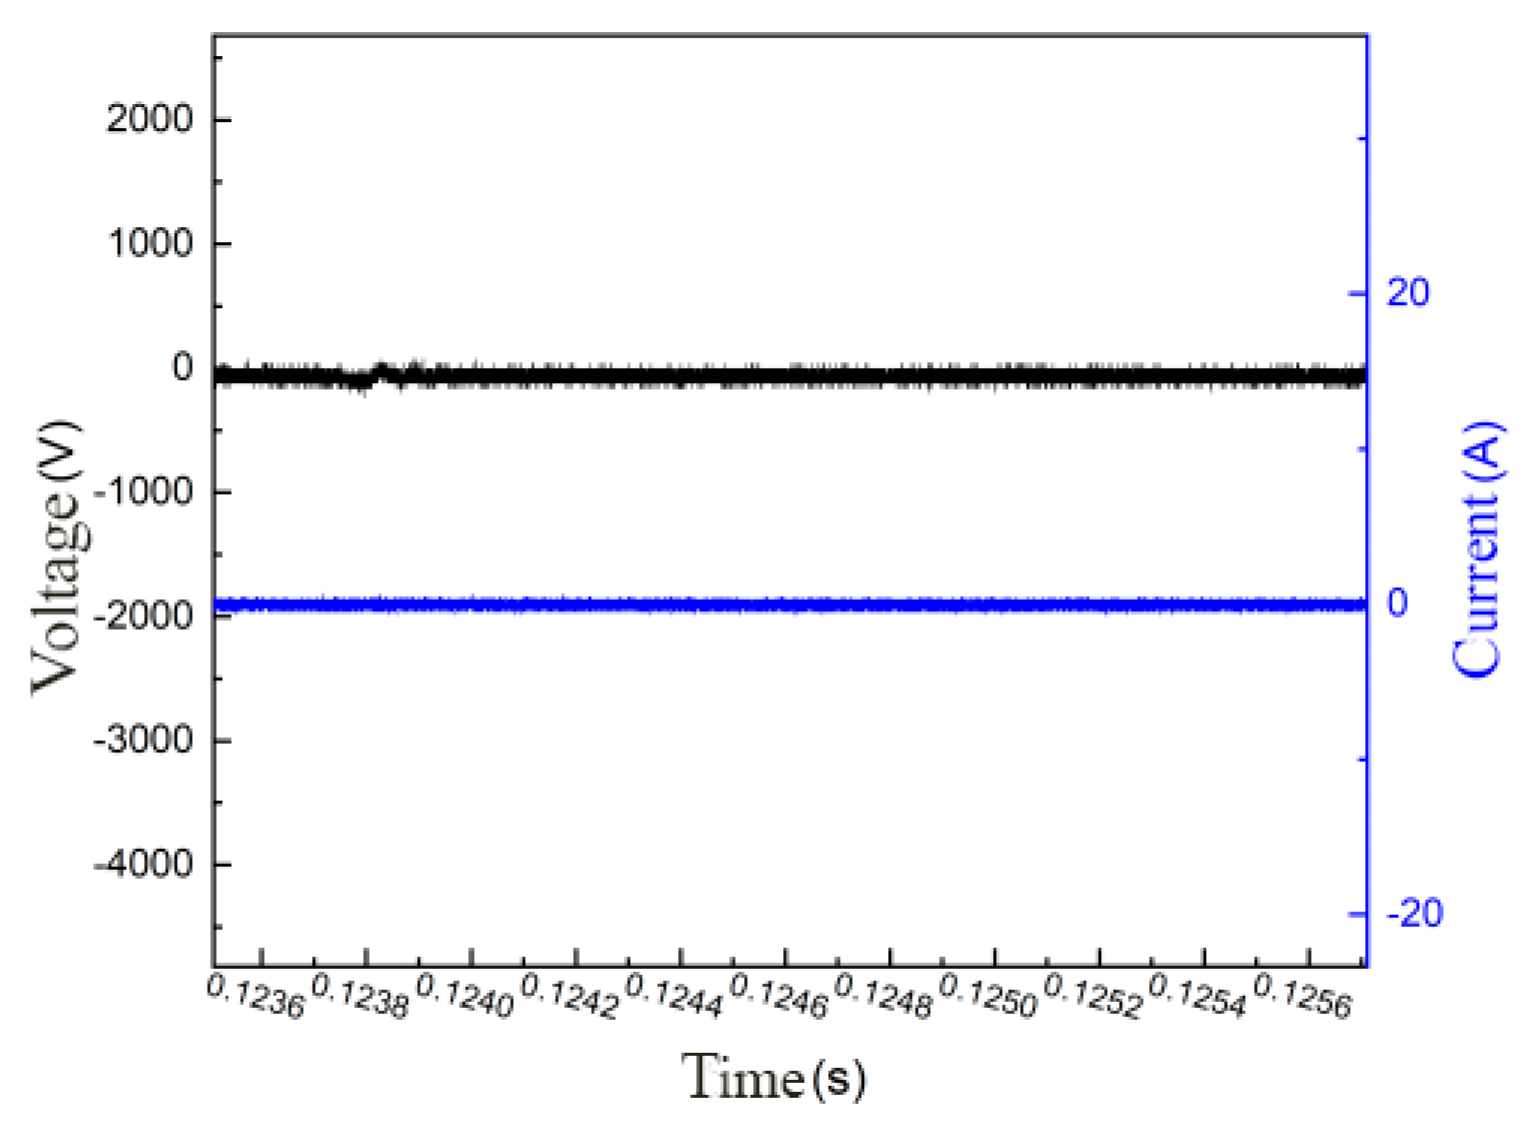
3.1.1. Analysis of Discharge Process

The discharge characteristic is the basic characteristic—which mainly refers to the variation of basic parameters such as the voltage, current, and power during the discharge of the igniter (which are affected by the working environment of the igniter)—of the microwave-assisted spark plug igniter. In order to explore the influence of microwaves on the discharge characteristics of a coaxial semiconductor spark plug, this chapter studies the effect of microwaves with different power and frequencies on the discharge characteristics of a coaxial semiconductor spark plug. In Figure 4, the voltage and current waveform of the igniter discharge process when the output voltage of the coaxial semiconductor spark plug drive power supply is Uride 27 V and the output current is Iride 3.5 A are shown. It can be seen from the waveform that the discharge process of the coaxial semiconductor spark plug was a periodic process. The initial voltage was maintained near zero and the current was zero. After a period of time, the voltage suddenly rose to about 2~3 kV, reaching the breakdown condition, and the cathode and anode of the igniter broke through the air medium to form an electric spark. At this time, the current value rose sharply, and it then fell back down again quickly and was then maintained near zero. The energy stored in the ignition coil did not dissipate immediately after a single breakdown; as such, the voltage value did not remain near zero after breakdown but fluctuated. When the voltage value met the breakdown condition again, the cathode and anode of the igniter broke down and the current value rose sharply again and then fell back to zero; as such, there is the possibility of multiple breakdowns in a discharge cycle. Figure 5 shows a picture of the electric spark produced by a discharge breakdown of the coaxial semiconductor spark plug.
According to its characteristics, the discharge process of the coaxial semiconductor spark plug was divided into three stages: the breakdown process, the energy dissipation process, and the energy storage process. These three stages correspond to the formation, re-formation and preparation of the igniter spark, which can completely reflect the working process of the coaxial semiconductor spark plug. Taking a certain discharge cycle of the coaxial semiconductor spark plug drive power supply with an output voltage of 27 V and a current of 3.5 A as an example, the three processes of igniter discharge were analyzed.
In Figure 6, the voltage and current waveforms of the breakdown process of a certain discharge cycle of the coaxial semiconductor spark plug drive power supply when the output voltage is 27 V and the current is 3.5 A are shown. At the end of the energy storage process, the voltage dropped suddenly at first, and a potential difference of about 3 kV was formed between the cathode and the anode of the spark plug. At the same time, the current also dropped suddenly and began to oscillate. The voltage value fell back and oscillated rapidly after maintaining about 1 μs around 3 kV. The current value reached the maximum at the moment when the voltage value fell back, and it then oscillated with the voltage oscillation until the breakdown process ended. In this process, the peak value of the voltage sudden drop was defined as the breakdown voltage, and it can be seen that the whole breakdown process could only maintain 3~4 μs.
In Figure 7, the voltage and current waveforms of the energy dissipation process of a certain discharge cycle of the coaxial semiconductor spark plug drive power supply with an output voltage of 27 V and a current of 3.5 A are shown. It can be seen from Figure 7 that, when the breakdown process is over, the voltage value begins to fluctuate. Moreover, when the second breakdown occurred, the voltage value dropped suddenly and the current value rose sharply from zero, but its absolute value was less than the current value at the first breakdown; however, then the current value quickly fell back to zero. In the process of energy dissipation, it was possible for it to breakdown again only when the voltage rose or dropped abruptly. The whole process of energy dissipation maintained about 240 μs and then entered the energy storage process.
After the end of the energy dissipation process, the driving power supply of the coaxial semiconductor spark plug entered a period of energy storage, during which the voltage and current values of the igniter were maintained around 0, as shown in Figure 8.

3.1.2. The Effect of Microwaves on the Discharge Process Under Different Environmental Pressures

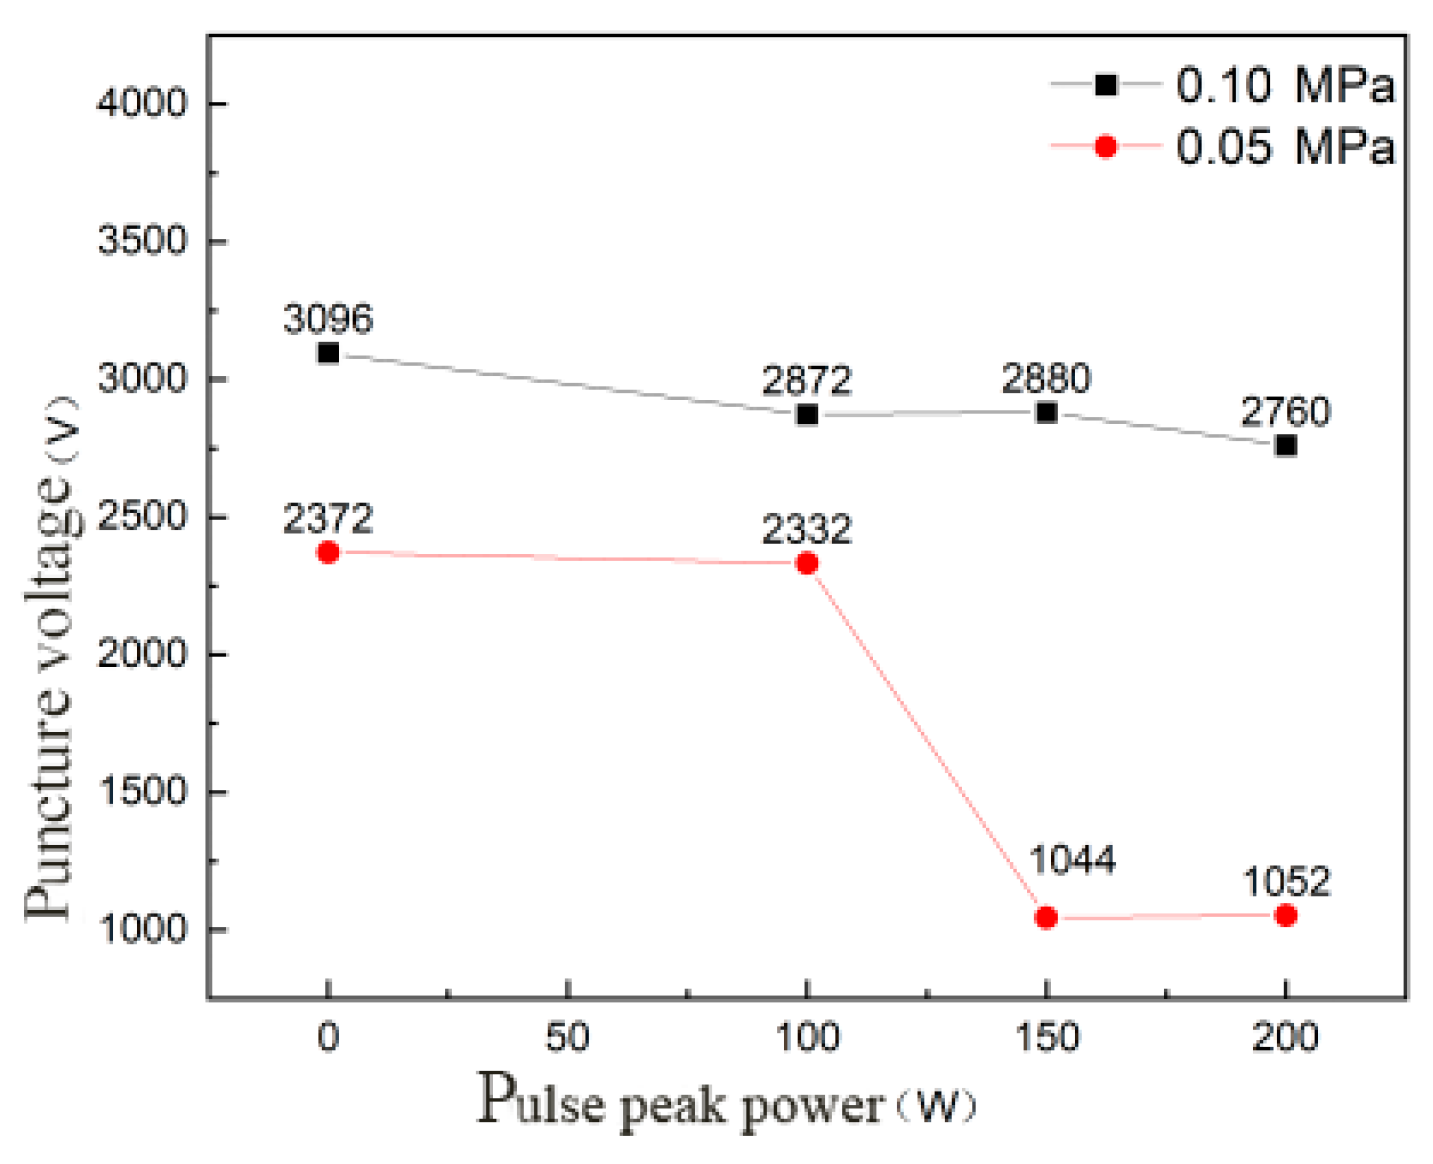
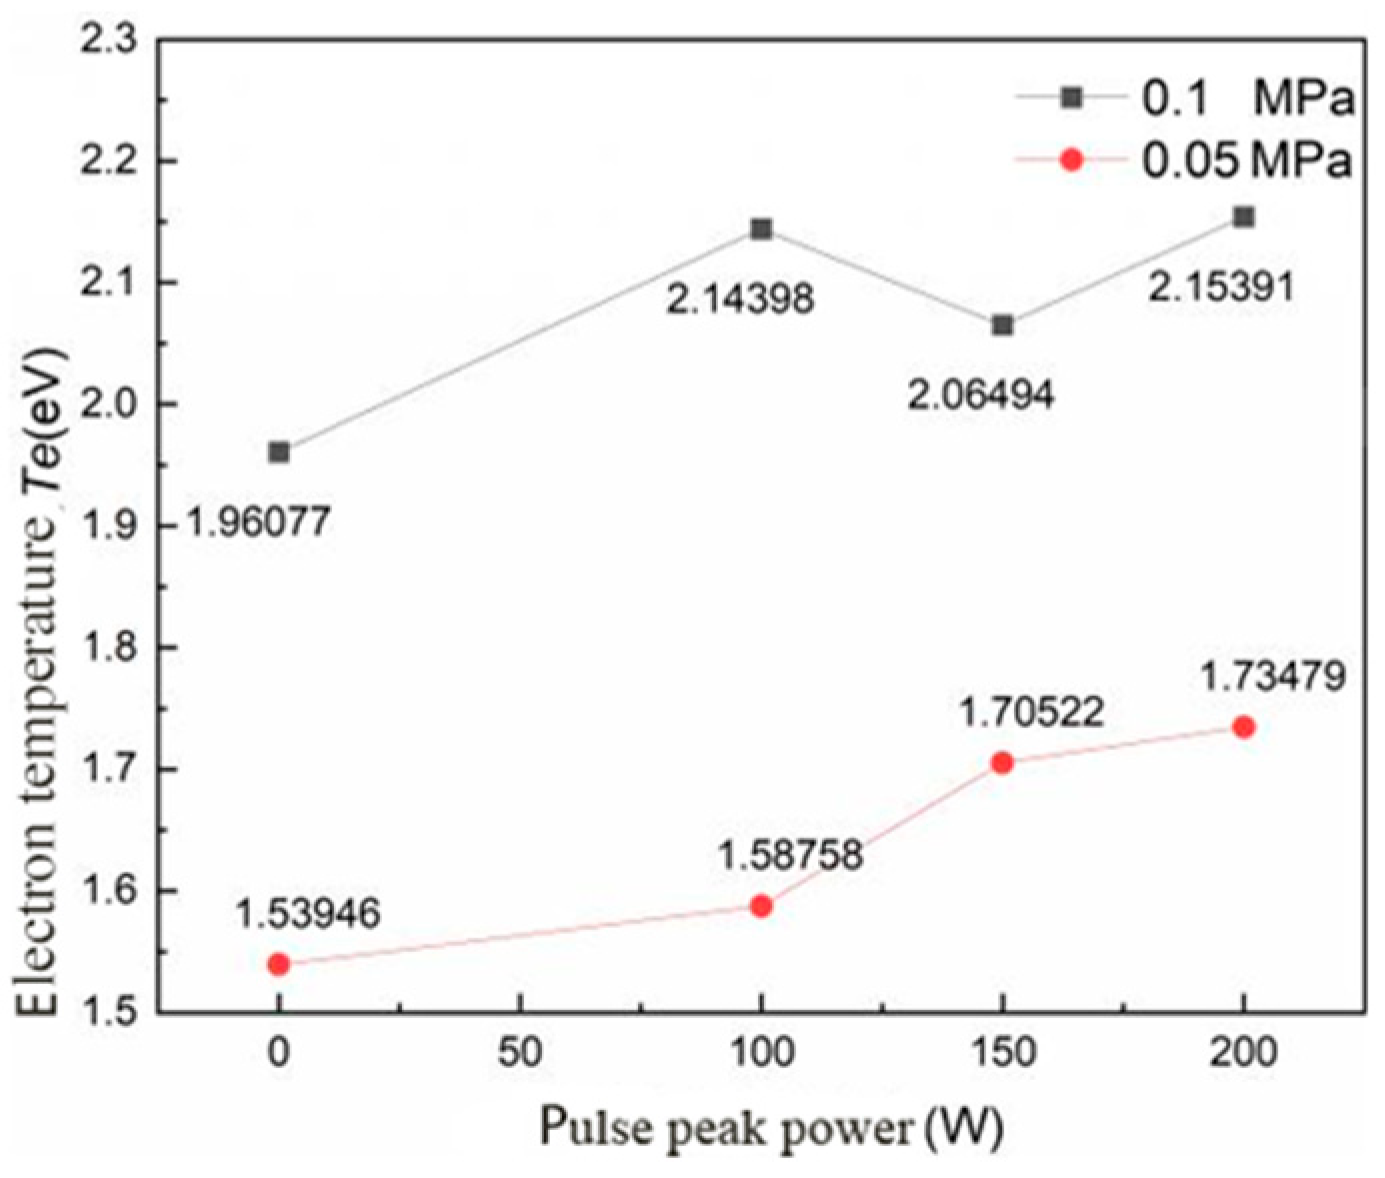
Effect of Pulse Peak Power on the Discharge Process
In order to study the effect of microwaves on the discharge process of the coaxial semiconductor spark plug under different power, we kept the output voltage of spark plug drive power UAV at 27 V and the current at an Imax 3.5 A constant. We then changed the pulse peak power P of the microwave power supply to 0 W, 100 W, 150 W, and 200 W under the condition of ambient pressure P0 = 0.1 MPa and 0.05 MPa. Next, we kept the frequency of the microwave pulse f = 10 kHz and the duty cycle 0.5 constant. The voltage and current waveforms of the coaxial semiconductor spark plugs were recorded, and the changing rules of related parameters were obtained. In the course of the experiment, there was a certain randomness in the discharge process of the coaxial semiconductor spark plug; as such, in order to accurately obtain the variation of the breakdown voltage and the average power of the spark plug with the pulse peak power, the voltage and current data of several groups of discharge cycles obtained under the same working condition were averaged to improve the credibility of the experimental results.
As shown in Figure 9, the breakdown voltage curve of the coaxial semiconductor spark plug under different ambient pressure shows that, in the case of an ambient pressure p = 0.1 MPa with an increase in pulse peak power, the breakdown voltage of spark plug decreased gradually. When the pulse peak power was 0 W, the breakdown voltage was 3096 V; when the pulse peak power was 200 W, the breakdown voltage was 2760 V, the relative reduction is 10.8%, and the regularity was not particularly obvious. When the ambient pressure p = 0.05 MPa was applied, when the pulse peak power was 100 W, the breakdown voltage of the spark plug did not change much compared with the pulse peak power of 00:00. However, when the pulse peak power increased to 150 W, the breakdown voltage of the spark plug decreased rapidly, and the relative reduction was 55.2%. When the pulse peak power increased to 200 W, the breakdown voltage of the spark plug did not change much. Comparing the breakdown voltage of the spark plug under ambient pressures p = 0.1 MPa and p = 0.05 MPa, it was found that the breakdown voltage of the spark plug in a low-voltage environment was evidently lower than that in an atmospheric-pressure environment.
According to reference [9], when the coaxial semiconductor spark plug discharges along the surface, one or more conductors are formed in the semiconductor medium under the action of an applied voltage. When a certain current flows through it, the resistance decreases and the current density increases. When the current density increases to a certain value, an “avalanche” capacitive discharge is formed. At the same time, the heating and discharge of the semiconductor surface will ionize the surrounding gas medium, resulting in arc discharge. When the ambient pressure increases, the resistance of the gas around the semiconductor increases, and the heat and discharge on the semiconductor surface are not enough to ionize the surrounding gas medium; as such, a higher applied voltage is needed. Therefore, when the ambient pressure is P0 = 0.1 MPa, the breakdown voltage of the spark plug is evidently higher than that of the ambient pressure P0 = 0.05 MPa. As the coaxial semiconductor spark plug is accompanied by the breakdown process of the gas medium in the discharge process, according to the Townsend discharge theory, the external electric field will promote the gas discharge breakdown; as such, it will have a certain impact on the breakdown voltage of the spark plug. When the microwave is emitted to the semiconductor region, a strong electric field will be formed around the semiconductor material, which makes the gas breakdown easier; as such, the breakdown voltage of the spark plug decreases with the increase in the pulse peak power, and the effect of the microwave is more obvious in low-pressure environments.
The process of electric spark discharge is the process of a semiconductor spark plug conducting work and outputting energy, and an important parameter reflecting the performance of the igniter is the discharge power of the igniter. In each discharge cycle of the spark plug, the voltage and current waveform is not a stable value, so its power is not a stable value (but this constantly changes with the changes in voltage and current). In order to reflect the work capacity of the spark plug as a whole, the average power P 1 ¯ of the whole discharge process of the spark plug is selected as a reference. First of all, the voltage and current values collected at each moment are multiplied to obtain the instantaneous power P1, and the instantaneous power is integrated with the time to obtain the work change in the spark plug in the whole discharge process. Figure 10 shows the change in the spark plug discharge power consumption at ambient pressure p = 0.1 MPa and microwave pulse peak power PW. It can be seen that there is an approximate linear relationship between the spark plug power consumption and the progression of time. By linearly fitting the power consumption curve over a period of time, the slope of the power consumption curve with time is obtained, thus determining the average power P 1 ¯ of the spark plug in the discharge process.
Figure 11 shows the average power change curve of the coaxial semiconductor spark plug discharge process under different environmental pressures and different microwave pulse peak powers. It can be seen from Figure 11 that, with the increase in pulse peak power, the average discharge power of coaxial semiconductor spark plug increased gradually. When the ambient pressure was p = 0.1 MPa and the microwave pulse peak power was 0 W, the average discharge power of the spark plug was P 1 ¯ = 21.94 W. When the microwave pulse peak power was 200 W, the average discharge power P 1 ¯ = 26.98 W of the spark plug was relatively increased by 23%. When the ambient pressure was p = 0.05 MPa and the microwave pulse peak power was 0 W, the average discharge power of the spark plug was P 1 ¯ = 22.16 W. When the microwave pulse peak power was 200 W, the average discharge power P 1 ¯ = 33.20 W of the spark plug was relatively increased by 49%. The work conducted by the spark plug is mainly reflected in the breakdown discharge; as such, the increase in the average discharge power of the spark plug shows that, in the discharge process of the spark plug, the decrease in the breakdown voltage increases the number of breakdown of the igniter and the work performed by the spark plug. The ignition performance of the spark plug is thus improved.
Based on the above analysis, the influence of the microwave pulse peak power on the discharge process of coaxial semiconductor spark plug can be summarized as follows: with an increase in the microwave pulse peak power, the breakdown voltage of the spark plug decreases and the average discharge power of spark plug increases gradually, and the change is more significant in a low-voltage environment.
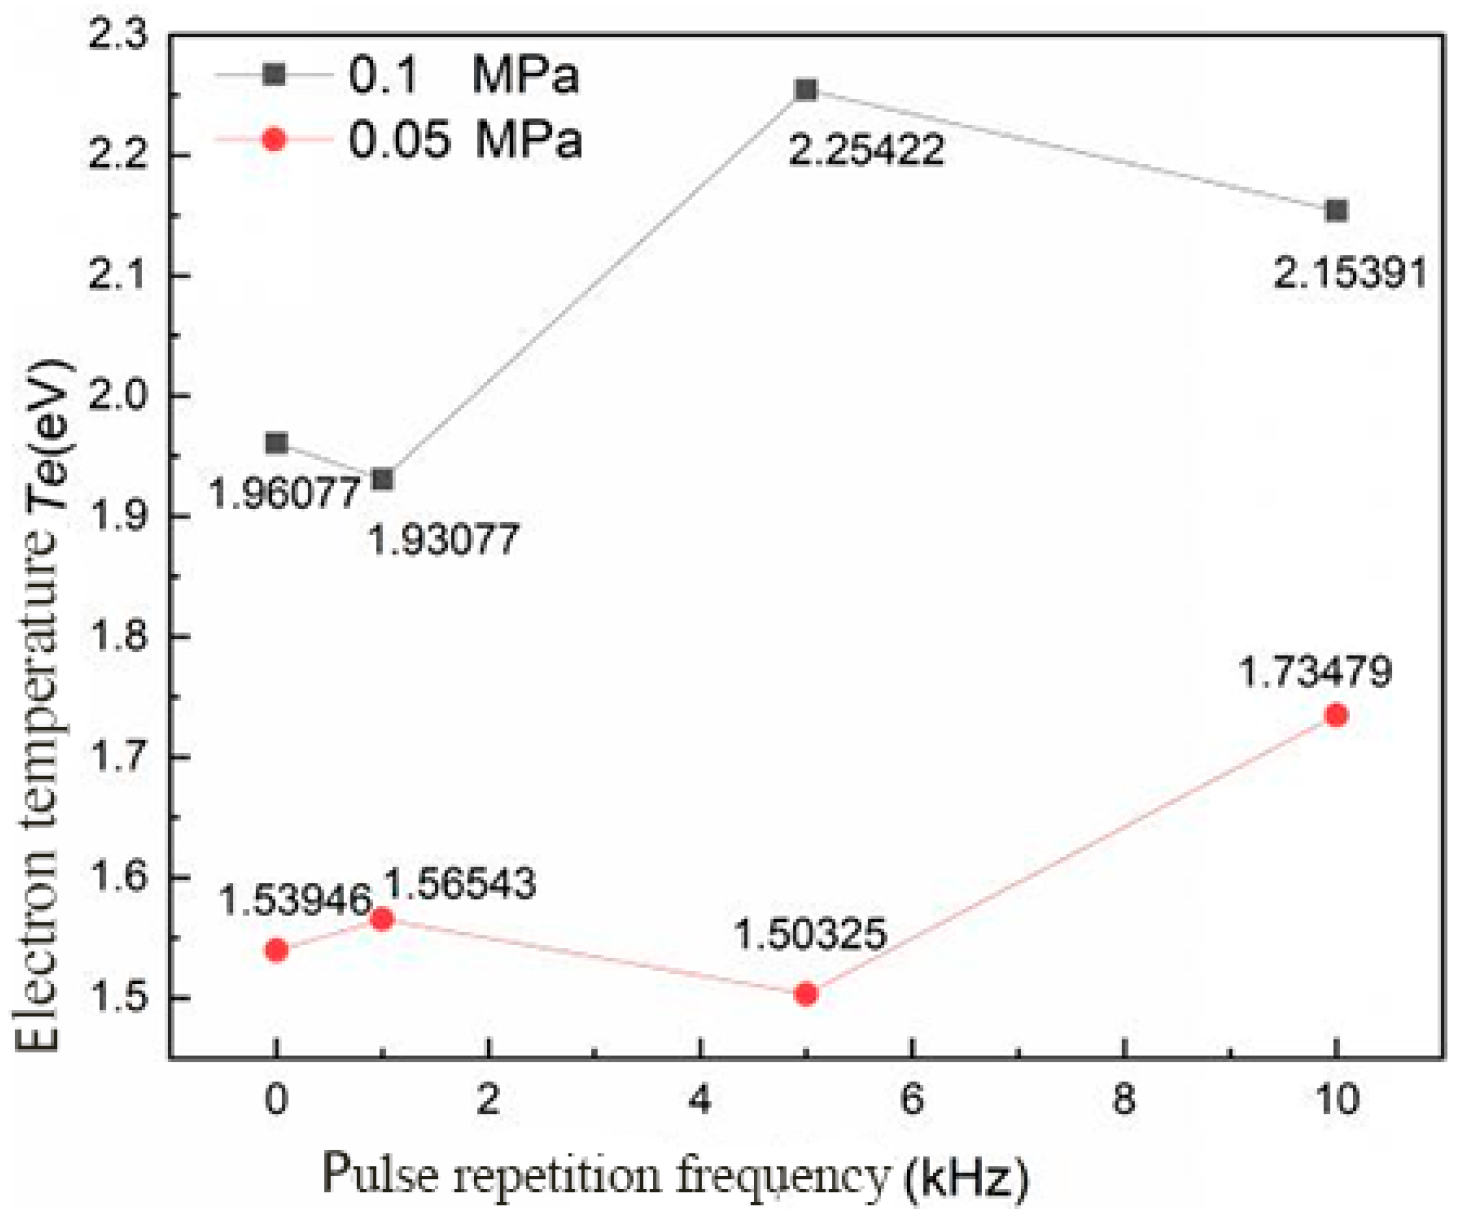
Effect of Pulse Frequency on Discharge Process
In order to study the effect of microwaves on the discharge process of a coaxial semiconductor spark plug under different pulse frequencies, the output voltage of the igniter drive power supply was kept constant. Under the condition of ambient pressures p = 0.1 MPa and 0.05 MPa, the pulse frequency f of the microwave power supply was changed to 1 kHz, 3 kHz, 5 kHz, 7 kHz, and 10 kHz; the peak power of the microwave pulse was 200 W; and the duty cycle is 0.5. The voltage and current waveforms of the coaxial semiconductor spark plugs were recorded, and the changing rules of related parameters were obtained.
As shown in Figure 12, the breakdown voltage of the coaxial semiconductor spark plug varied with the pulse frequency under different ambient pressures. It can be seen that, in the case of ambient pressure p = 0.1 MPa, the breakdown voltage of the spark plug decreased with the increase in microwave pulse frequency. When the microwave pulse frequency f = 1 kHz, the breakdown voltage was 2832 V. When the microwave pulse frequency f = 10 kHz, the breakdown voltage was 2760 V and the relative reduction was 2.5%. When the ambient pressure was p = 0.05 MPa, the breakdown voltage of spark plug decreased with the increase in microwave pulse frequency. When the microwave pulse frequency f = 1 kHz, the breakdown voltage was 1240 V. When the microwave pulse frequency f = 10 kHz, the breakdown voltage was 1052 V and the relative reduction was 15.2%. Generally speaking, with the increase in microwave pulse frequency, the breakdown voltage of the spark plug decreased gradually, and the relative reduction was larger in a low-voltage environment (whether in low-voltage environments or in an atmospheric-pressurized environment). When the microwave pulse frequency increases gradually, the discharge time of the coaxial semiconductor spark plug is more likely to coincide with the duration of the strong electric field; as such, the breakdown voltage decreases with the increase in the microwave pulse frequency.
In Figure 13, the average power change curve of the discharge process of coaxial semiconductor spark plugs under different microwave pulse frequencies is shown. It can be seen from Figure 13 that the average discharge power of the coaxial semiconductor spark plugs does not change significantly with an increase in microwave pulse frequency. Limited by the pulse frequency range of the microwave source used, the change step size and frequency range set in the experiment were small; as such, the average power of the coaxial semiconductor spark plug discharge process did not change much.
Based on the above analysis, the influence of the microwave pulse frequency on the discharge process of a coaxial semiconductor spark plug can be summarized as follows: with the increase in microwave pulse frequency, the breakdown voltage of spark plug decreases with an increase in the microwave pulse frequency, and the average discharge power has no obvious change when the output voltage of driving power is 27 V and current is 3.5 A.

3.2. Spectral Characteristics of the Microwave-Assisted Spark Plug Igniter

When an atom or molecule transitions from a high-energy excited state to a ground state or a lower excited state, the excess energy is emitted in the form of photons, thus forming an emission spectrum [10]. The excited state energy levels of different ions are different, so the emission spectra are also different; as such, the types and spatial distribution of excited particles in plasma can be determined according to the emission spectra. At the same time, many important information can be obtained from the emission spectrum, such as the electron temperature, which can be obtained according to the change in the relative spectral line intensity [11]. The electron density can be obtained using the Stark effect of the linear spectrum [12], the ion temperature can be calculated according to the Doppler broadening of the spectral line, and the rotational temperature can be obtained by calculating the spectral line intensity [13,14]. Therefore, it is of great significance to study the emission spectrum of the spark produced by the spark plug discharge breaking down the working gas of the medium.
In the microwave-assisted spark plug igniter, a large number of excited particles are formed mainly through the excitation and collision of electrons—that is, through gas discharge, electrons obtain energy from the electric field and accelerate continuously, colliding gas molecules so as to excite or ionize gas molecules and produce new excited state particles, thereby resulting in a sharp increase in the number of excited particles (microwave feeding can greatly promote the process).

3.2.1. Discharge Emission Spectrum Analysis

During the discharge of the microwave-assisted spark plug igniter, electric spark plasma will be produced, which will ignite the oil–gas mixture. Although the ignition is caused by it, the expansion of the plasma group produced by the spark discharge is controlled by the non-thermal mechanism. In order to test the spectral characteristics of the microwave-assisted spark plug igniter, the emission spectrum of the igniter was analyzed. The effects of different microwave pulse peak power and microwave pulse frequency on the spectral characteristics of spark plug were studied under atmospheric pressure and low pressure. The microwave pulse peak power was 100 W, 150 W, and 200 W, and the microwave pulse frequency was 1 kHz, 5 kHz, and 10 kHz. The output voltage of spark plug drive power supply was 27 V and the output current was 3.5 A. The vacuum pump was used to pump the air out of the vacuum chamber so that the internal pressure was 0.05 MPa. When the experiment was carried out under atmospheric pressure, the cover of the vacuum chamber was opened to communicate with the external air to create an atmospheric environment. The spectral characteristics of the microwave-assisted spark plug igniter are shown in Table 1.
The emission spectral intensity of the spark plug discharge under different operating conditions is shown in Figure 14a,b. Figure 14a,b also show the relationship between the emission spectral intensity and microwave pulse peak power under different ambient pressures. Figure 14c,d show the relationship between the emission spectral intensity and microwave pulse frequency under different environmental pressures. It can be seen from Figure 14 that, no matter what the environmental pressure is, the microwave feed will increase the emission intensity of the spark plug discharge spectrum to a certain extent, and this emission spectrum contains many active particles, such as nitrogen ions, excited nitrogen molecules, oxygen atoms, etc. With the increase in the peak power of the microwave pulse, the emission spectrum intensity of the spark plug discharge increased gradually. However, with an increase in the microwave pulse frequency, the emission spectrum intensity of spark plug discharge did not clearly change. It can also be seen that, in a low-pressure environment, the emission spectral intensity of the spark plug discharge with microwaves was brighter than that without microwaves; meanwhile, in the atmospheric environment, there was no significant difference before and after the application of microwaves. As in a low-voltage environment, the electrons accelerated by electric field collide with gas molecules more effectively because of their longer average free path, resulting in more active particles. These phenomena show that microwave feeding can excite more active particles near the spark plug electrode and promote the combustion chemical reaction.

3.2.2. Characteristic Temperature of the Igniter Discharge Plasma

The characteristic temperature of the plasma indicates the energy distribution of the plasma, which is an important characteristic parameter, including the electron temperature (Te), rotation temperature (Trot), vibration temperature (Tvib), and translational temperature (Ttrans), of the plasma. When the plasma is in an equilibrium state, the energy of Te = Tvib = Trot = Ttrans, and non-equilibrium plasma varies greatly among different degrees of freedom, which means Te > Tvib > TrotTtrans. The main advantage of using non-equilibrium plasma to enhance combustion was established in [15]: a large number of high-energy electrons are produced by discharge under the excitation of external electric field, and the energy is transferred to other degrees of freedom through the collision excitation of high-energy electrons. The energy exchange rate between the translational degrees of freedom between electrons and molecules is very slow; as such, most of the energy is used to excite the internal degrees of freedom of molecules, which results in the difference between different degrees of freedom of energy. Showing the characteristic of non-equilibrium, as the difference of rotational energy levels between molecules is small and the energy balance time between rotational temperature and translational temperature is very short, the rotational temperature cannot be used as non-thermally active particles to accelerate the chemical reaction process. In addition, the rotational temperature is small, which is approximately equal to the atmospheric temperature. Moreover, it cannot play a role in non-equilibrium plasma-enhanced combustion. The vibration temperature is different from the rotation temperature, and the energy balance time of the vibration degree of freedom, the rotational degree of freedom, and the translational degree of freedom are longer, so the particles in an excited state of vibration can accumulate in space. These particles also participate in the physical and chemical process of plasma, and there is enough of them to play a key role in the process of plasma-enhanced combustion.
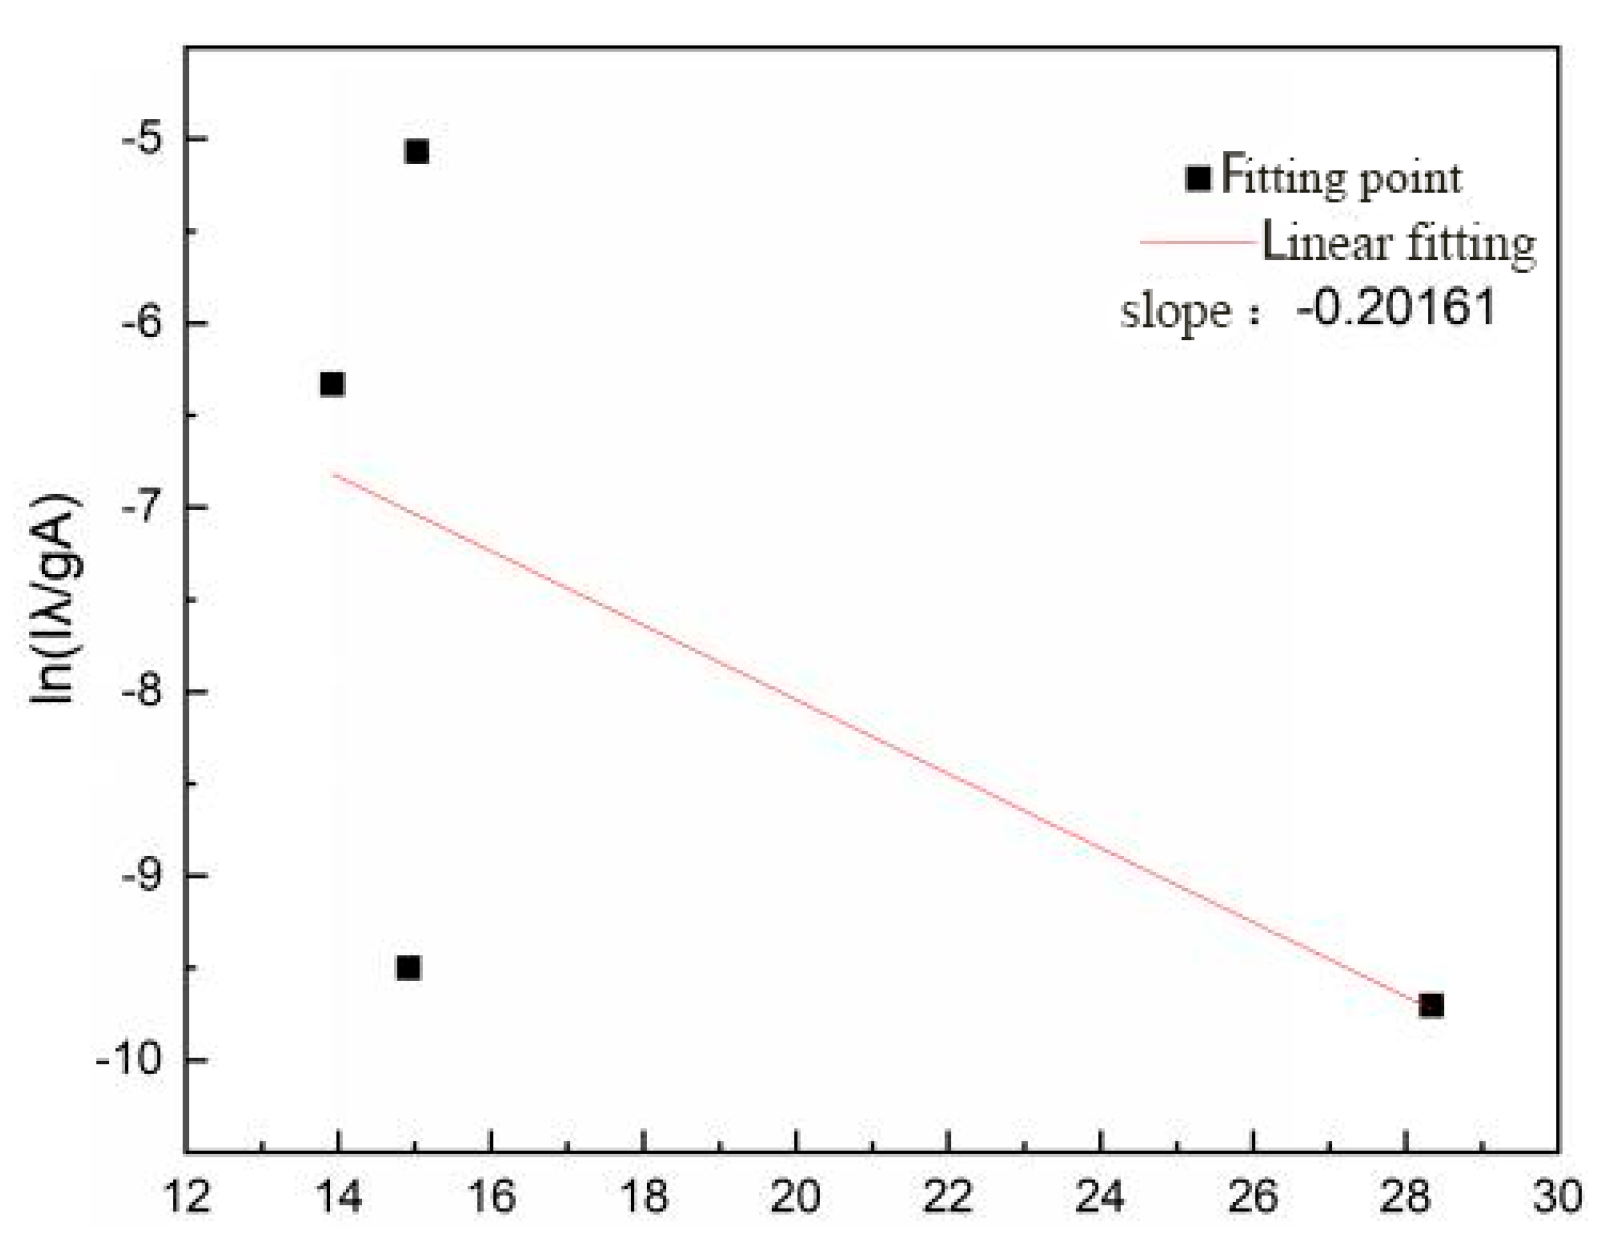
Electron Temperature of the Igniter Discharge
The electron temperature was used to characterize the degree of the freedom energy excited by the electrons in the plasma. The particle excitation process caused by electron collision in reactive plasma is mainly related to the electron temperature. The electron energy level distribution of the plasma in the local equilibrium state conforms to the Boltzmann statistical law. The electron excitation temperature is used to characterize the population of the energy level of the electronic state, which is approximately equal to the electron temperature. When the population of the particles in the excited state of a certain energy level reaches the collision excitation equilibrium with the electrons in the energy range, the density ni of the i level is given by Boltzmann distribution [16,17,18].
n m n = g m Z T exp E m k T e x c ,
n = n = i n n i ,
Z T = n = i n g i exp E i k T e x c .
In the formula, nm is the particle number density at m level; n is the total particle number density and the degeneracy of the energy level on gm; Z(T) is the partition function; Em is the excitation energy at the upper level; k is the Boltzmann constant; and Texc is the electron excitation temperature, which is approximately regarded as the electron temperature.
The relative emission spectral intensity can be calculated by Formula (4).
I n m = A n m h ν n m 4 π n n l .
In the formula, Inm is the emission spectral intensity of the transition from the upper level n to the lower level m; Anm is the transition probability of the upper level n to the lower level m; h is the Planck constant; vnm is the frequency of the upper level n to the lower level m transition; nn is the particle density of the upper level; and l is the thickness of the plasma in the measuring direction.
Formula (5) is derived from the combination of Formulas (1) and (4), such that ln I i λ i g i A i is in y coordinates and Ei is in x coordinates. The slope is obtained by fitting the Boltzmann curve to be the electron temperature Te. Figure 15 shows the Boltzmann curve of the electron temperature Te.
ln I i λ i g i A i = E i k T e x c + C .
In order to calculate the electron temperature, the spectral line intensities at wavelengths of 381 nm, 427 nm, 392.1 nm, and 409.6 nm were selected. As shown in Figure 15, when the microwave pulse peak power was 200 W and the microwave pulse frequency was f = 10 kHz, the electron temperature Boltzmann curve of the spark plug discharge plasma was fitted with a slope of −0.20161 and the calculated electron temperature was 2.154 eV.
As shown in Figure 16, the electron temperature of the igniter discharge plasma varied with the peak power of microwave pulse under different pressure conditions. With the increase in the peak power of microwave pulse, the electron temperature of the igniter discharge showed an upward trend whether it was under low pressure or atmospheric pressure. Under normal pressure, the electron temperature was 1.961 eV when the peak power of microwave pulse was 0 W, and the electron temperature rose to 2.154 eV when the peak power of microwave pulse was 200 W. In the low-voltage environment, the electron temperature was 1.539 eV when the microwave pulse peak power was 0 W, and the electron temperature rose to 1.735 eV when the microwave pulse peak power was 200 W. The higher the peak power of the microwave pulse, the greater the electric field intensity in the discharge area of the igniter, and this increased the energy density in the discharge area, which is beneficial to the acceleration of electrons (making them high-energy electrons).
As shown in Figure 17, the electron temperature of the igniter discharge plasma varied with the microwave second pulse frequency under different pressure environments. With the increase in microwave pulse frequency, the change in the electron temperature of the igniter discharge did not show an obvious rule whether under low pressure or atmospheric pressure. According to the classical theory, the molecular emission spectral line comes from the change in the molecular electric dipole moment [16]. In the experiment, electrons collided with other particles due to the acceleration of electric field, which led to a change in the molecular electric dipole moment. This meant that the change in pulse frequency had little effect on the change in electronic state.
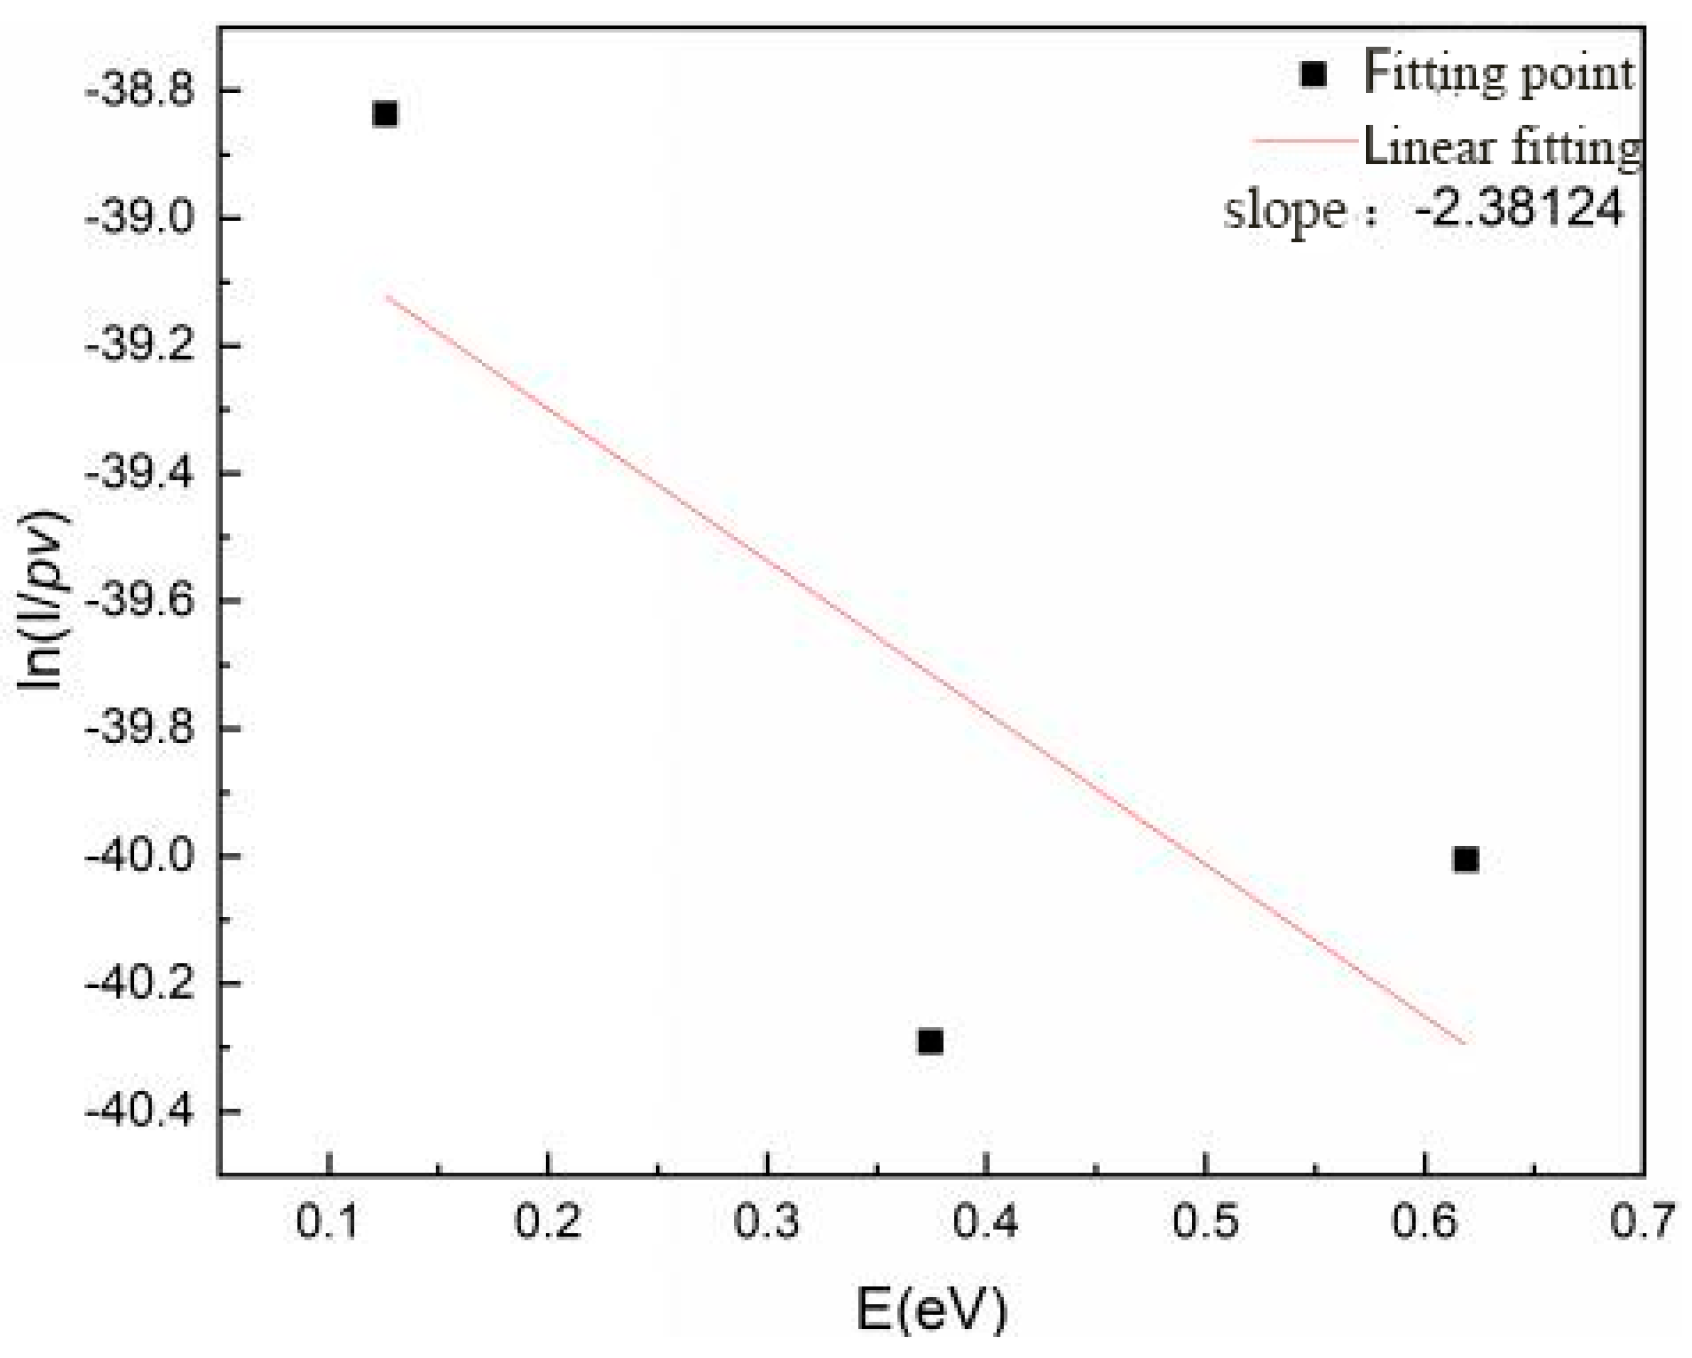
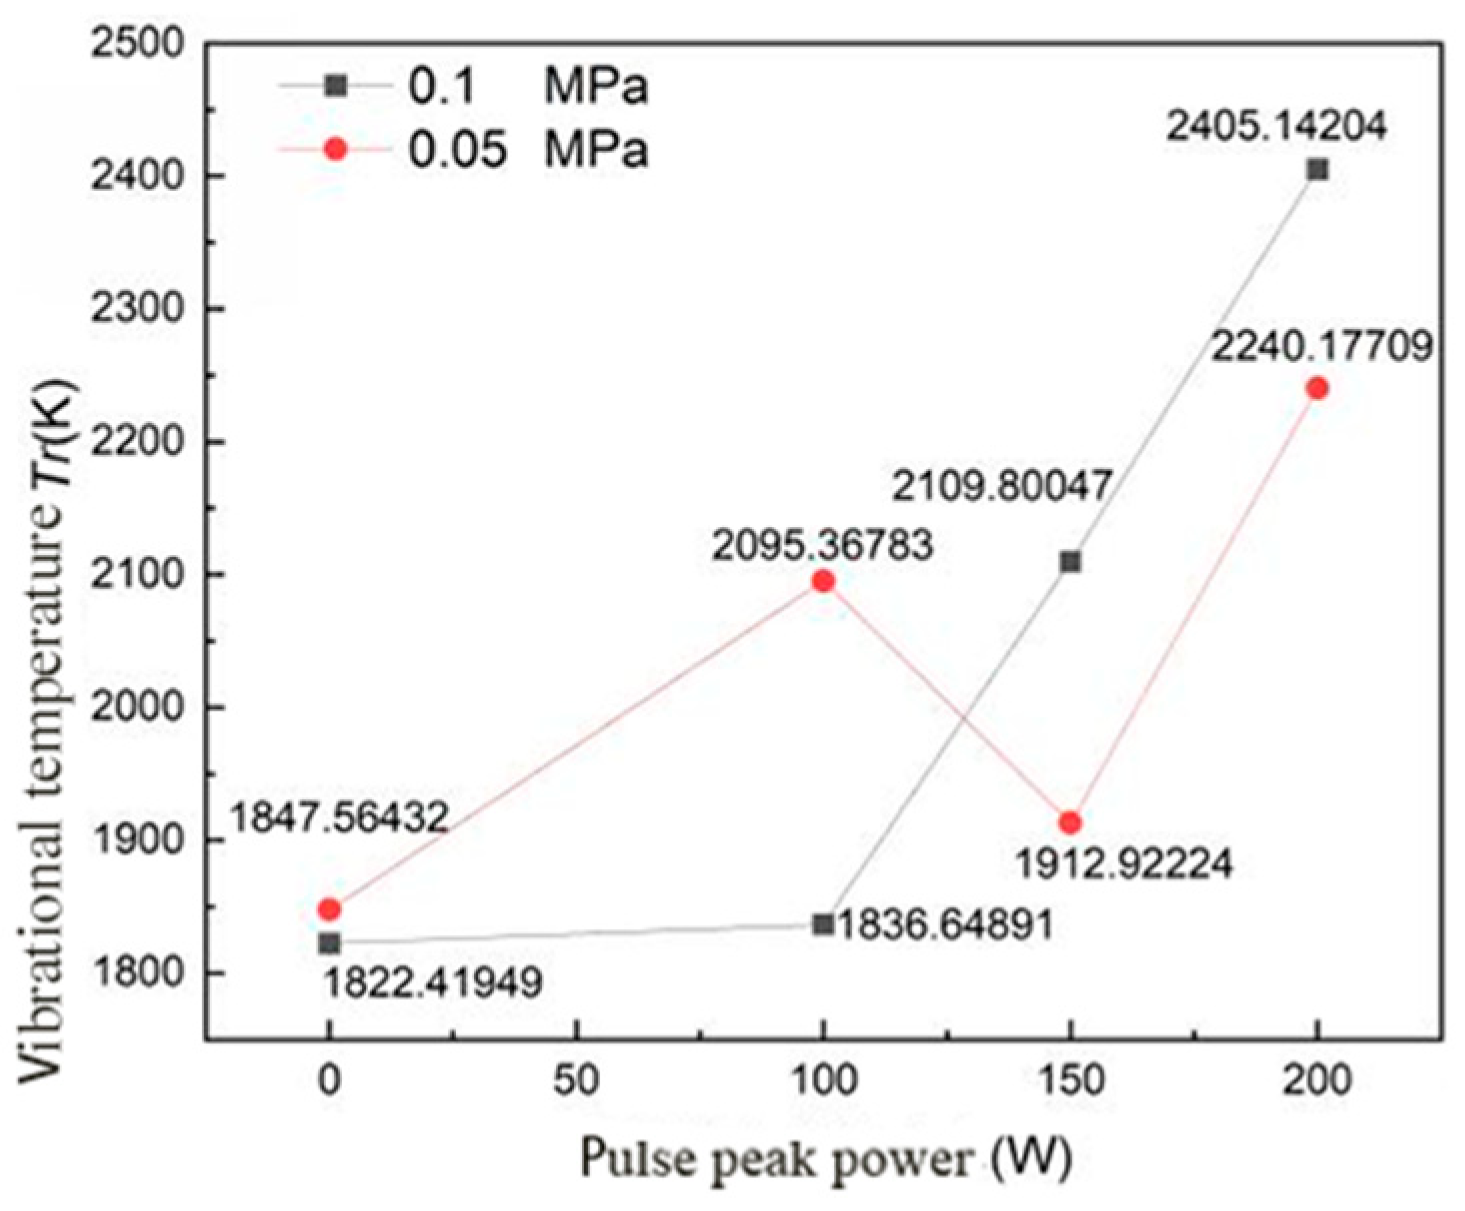
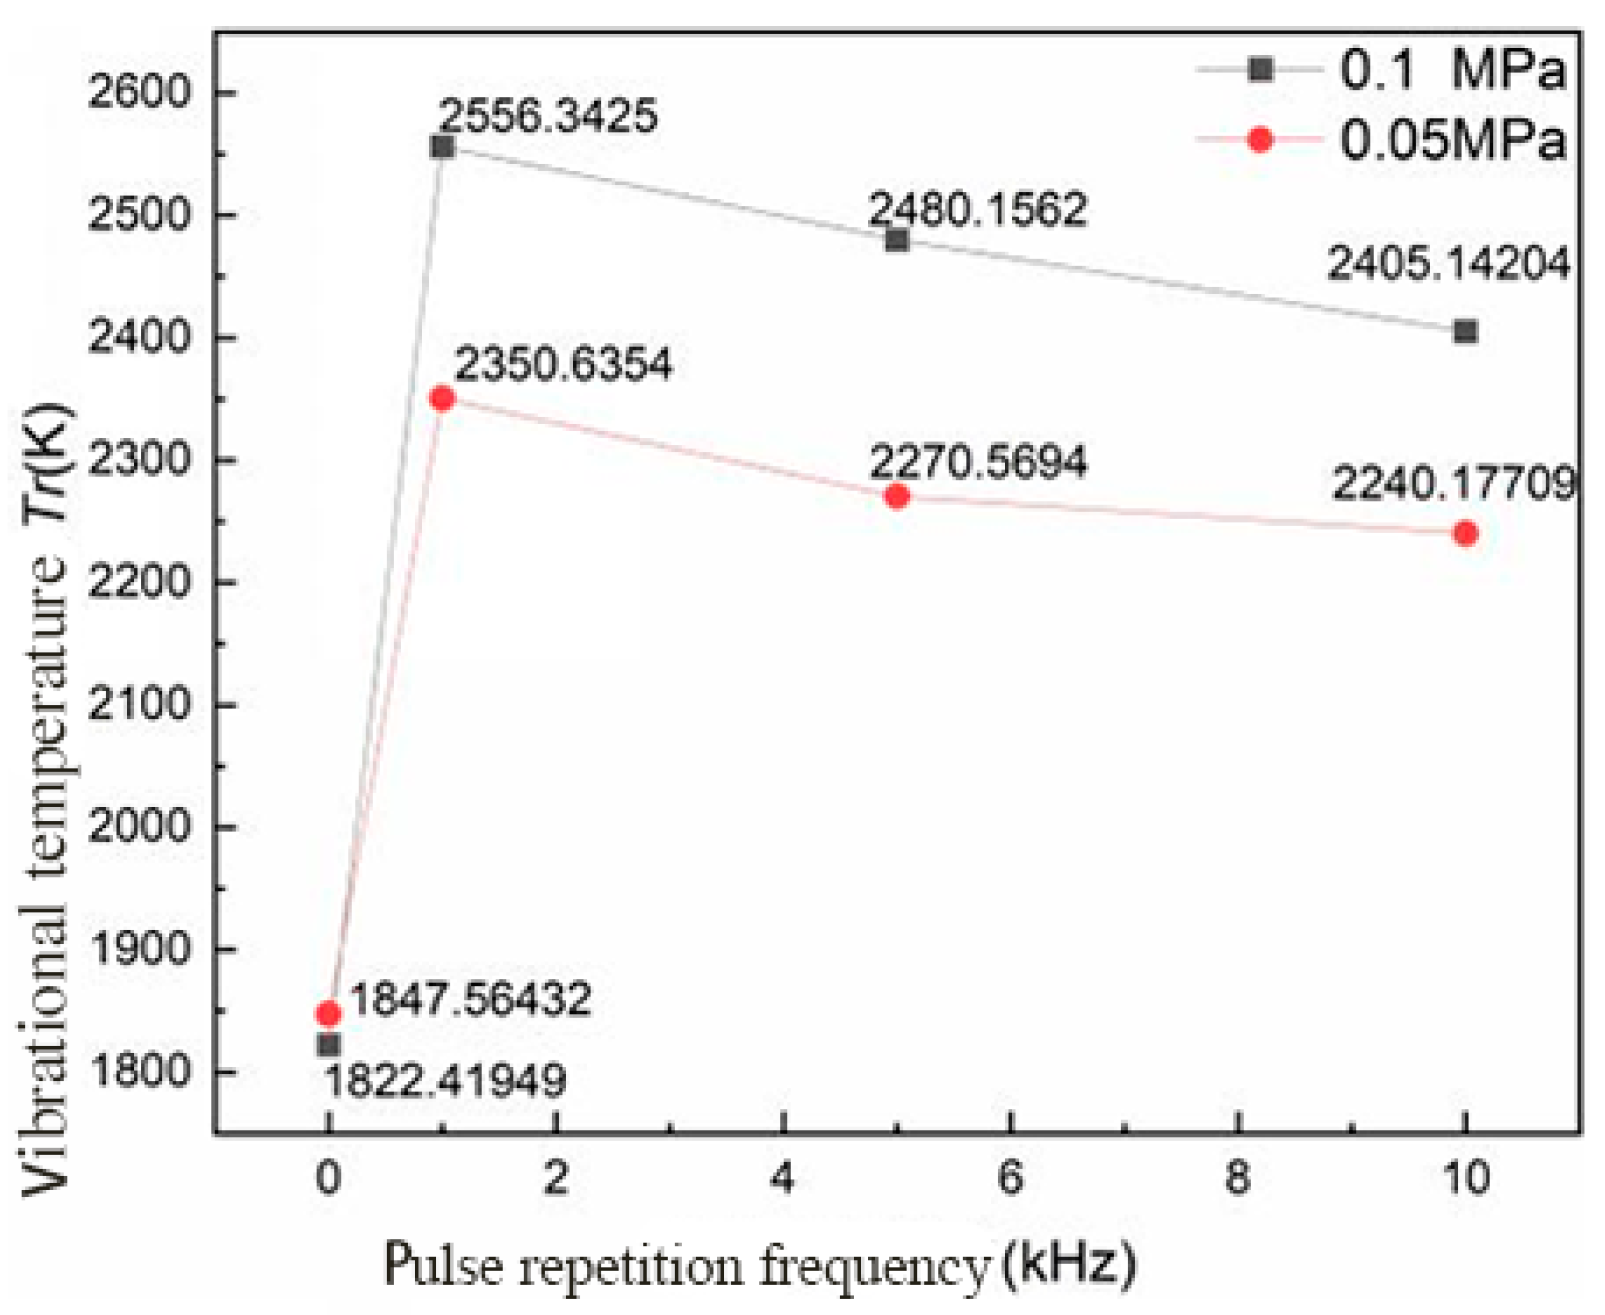
Vibration Temperature of the Discharge Plasma of Igniter
The vibrational temperature of the molecule is related to the exchange in electron energy. The vibrational temperature characterizes the excitation intensity of the vibrational energy level molecules of the non-equilibrium plasma, and the vibrational excited molecules can accelerate the chemical reaction. Different vibrational energy levels of the second positive band system N2(C3Πu→B3Πg) of the nitrogen molecule were selected to calculate the vibrational temperature [17], as shown in the following formula:
I ν ν = h c ν ν ν p ν ν N ν .
In the formula, v′ is the upper state vibration energy level, v″ is the lower state vibration energy level, h is the Planck constant, c is the speed of light, vvv is the frequency of the transition from the upper-state vibration energy level v′ to the lower-state vibration energy level, pvv is the transition probability from the upper-state vibration energy level v′ to the lower-state vibration energy level, and Nv is the molecular population of the upper state vibration energy level.
E ν = ω e ν + 1 2 ω e x e ν + 1 2 2 + ω e y e ν + 1 2 3 + .
In the formula, Eν is the vibrational energy of the upper state molecule, and, for the vibrational constant of the second positive band system of nitrogen molecule, the vibrational constant was ω e ω e x e ω e y e , ωe = 2035.1 cm−1, ωexe = 17.08 cm−1, so only the first two terms could be used to calculate the vibrational energy of the upper state molecule.
The population of the upper state molecules was in accordance with the Boltzmann distribution and satisfied the following relationship:
N ν = N 0 exp E ν k T v .
After simultaneous Expressions (6)–(8), the following relations were obtained:
ln I ν ν ν ν ν p ν ν = E ν k + C ,
where k is the Boltzmann constant. The value of ln I ν ν ν ν ν p ν ν is the y axis and the value of Ev’ is the x axis. The slope was obtained by fitting the Boltzmann curve to be the vibrational temperature Tv of the molecule.
The relative emission spectral intensities of the vibrational transitions of the second positive band system N2(C3Πu→B3Πg) of the nitrogen molecules were calculated according to the relative emission spectral intensities of the vibrational transitions of the second positive band system of nitrogen molecules, which were (ν′→ν″: 4→2, λ = 295.32 nm), (ν′→″: 3→1, λ = 296.2 nm), and (ν′→″: 2→1, λ = 313.6 nm), respectively. As shown in Figure 18, when the peak power of microwave pulse was 200 W and the pulse frequency was f = 10 kHz, the vibration temperature Boltzmann curve of spark plug discharge plasma was fitted with a slope of −2.38124 and the calculated electron temperature was 4873.93 K.
The variation curve of the vibration temperature of the spark plug discharge plasma with the peak power of a microwave pulse under different ambient pressures is shown in Figure 19. It can be seen from Figure 19 that the vibration temperature of the spark plug discharge plasma increased with an increase in the microwave pulse peak power regardless of whether it was under low pressure or atmospheric pressure. Under atmospheric pressure, the vibration temperature was 4396.71 K when the peak power of microwave pulse was 0 W, and the vibration temperature rose to 4873.93 K when the peak power of microwave pulse was 200 W. In a low-pressure environment, the vibration temperature was 3172.15 K when the microwave pulse peak power was 0 W, and it rose to 3480.53 K when the microwave pulse peak power was 200 W. It can be seen that the variation of the vibration temperature with the microwave pulse peak power was similar to that of the electron temperature with the microwave pulse peak power, indicating that the formation of vibrational, excited nitrogen molecules is inseparable from the collision of free electrons. Free electrons accelerate in a strong electric field and, in the collision with nitrogen molecules, the kinetic energy of free electrons is converted into the vibrational energy of nitrogen molecules; as such, there is an increase in microwave peak power. When the electron temperature increases, the kinetic energy of the free electron increases, which makes the nitrogen molecule reach the vibrational excited state in the collision with the nitrogen molecule; as such, the vibration temperature increases.
The variation curve of the plasma vibration temperature of a spark plug discharge with microwave pulse frequency under different ambient pressures is shown in Figure 20. It can be seen from Figure 20 that, with the increase in microwave pulse frequency, the change in the vibration temperature of the spark plug discharge plasma did not show evident regularity whether under low pressure or atmospheric pressure. When studying the effect of the microwave pulse frequency on the electron temperature of the spark plug discharge plasma, it was found that the change in microwave pulse frequency had no substantial effect on the electron temperature. As the electron temperature characterizes its collision ability with gas molecules, the microwave pulse frequency also had no substantial effect on the vibrational temperature of nitrogen molecules.
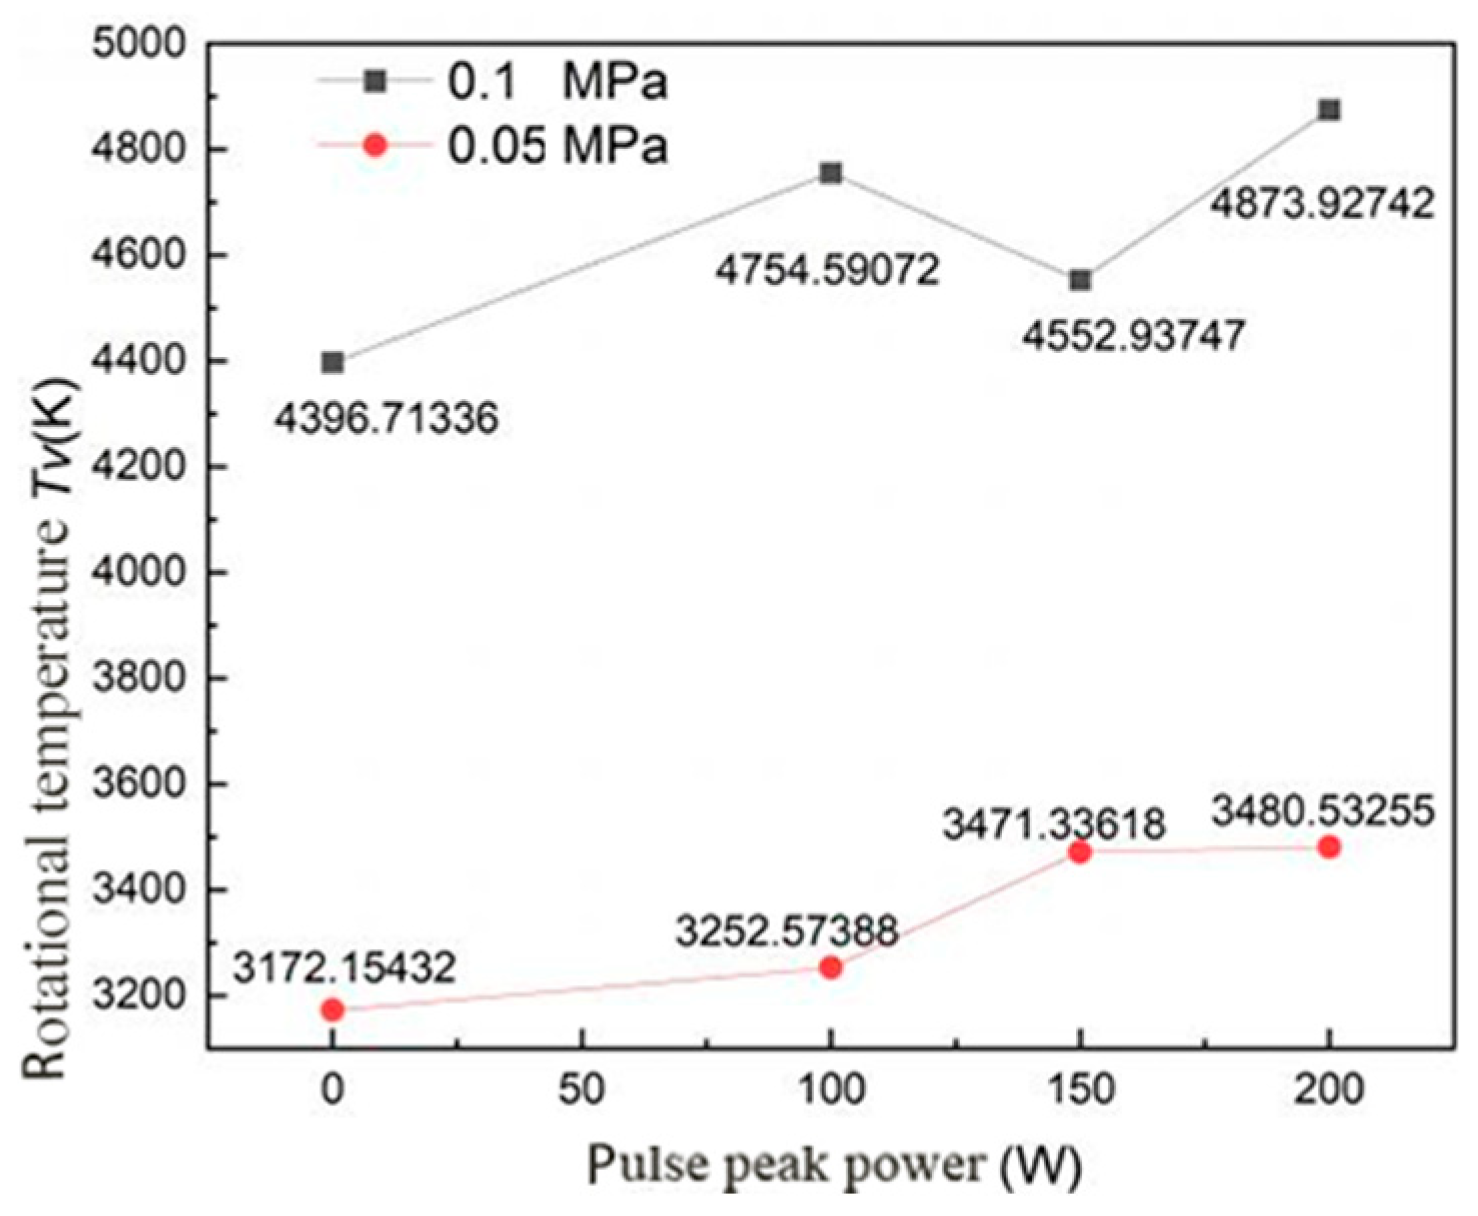
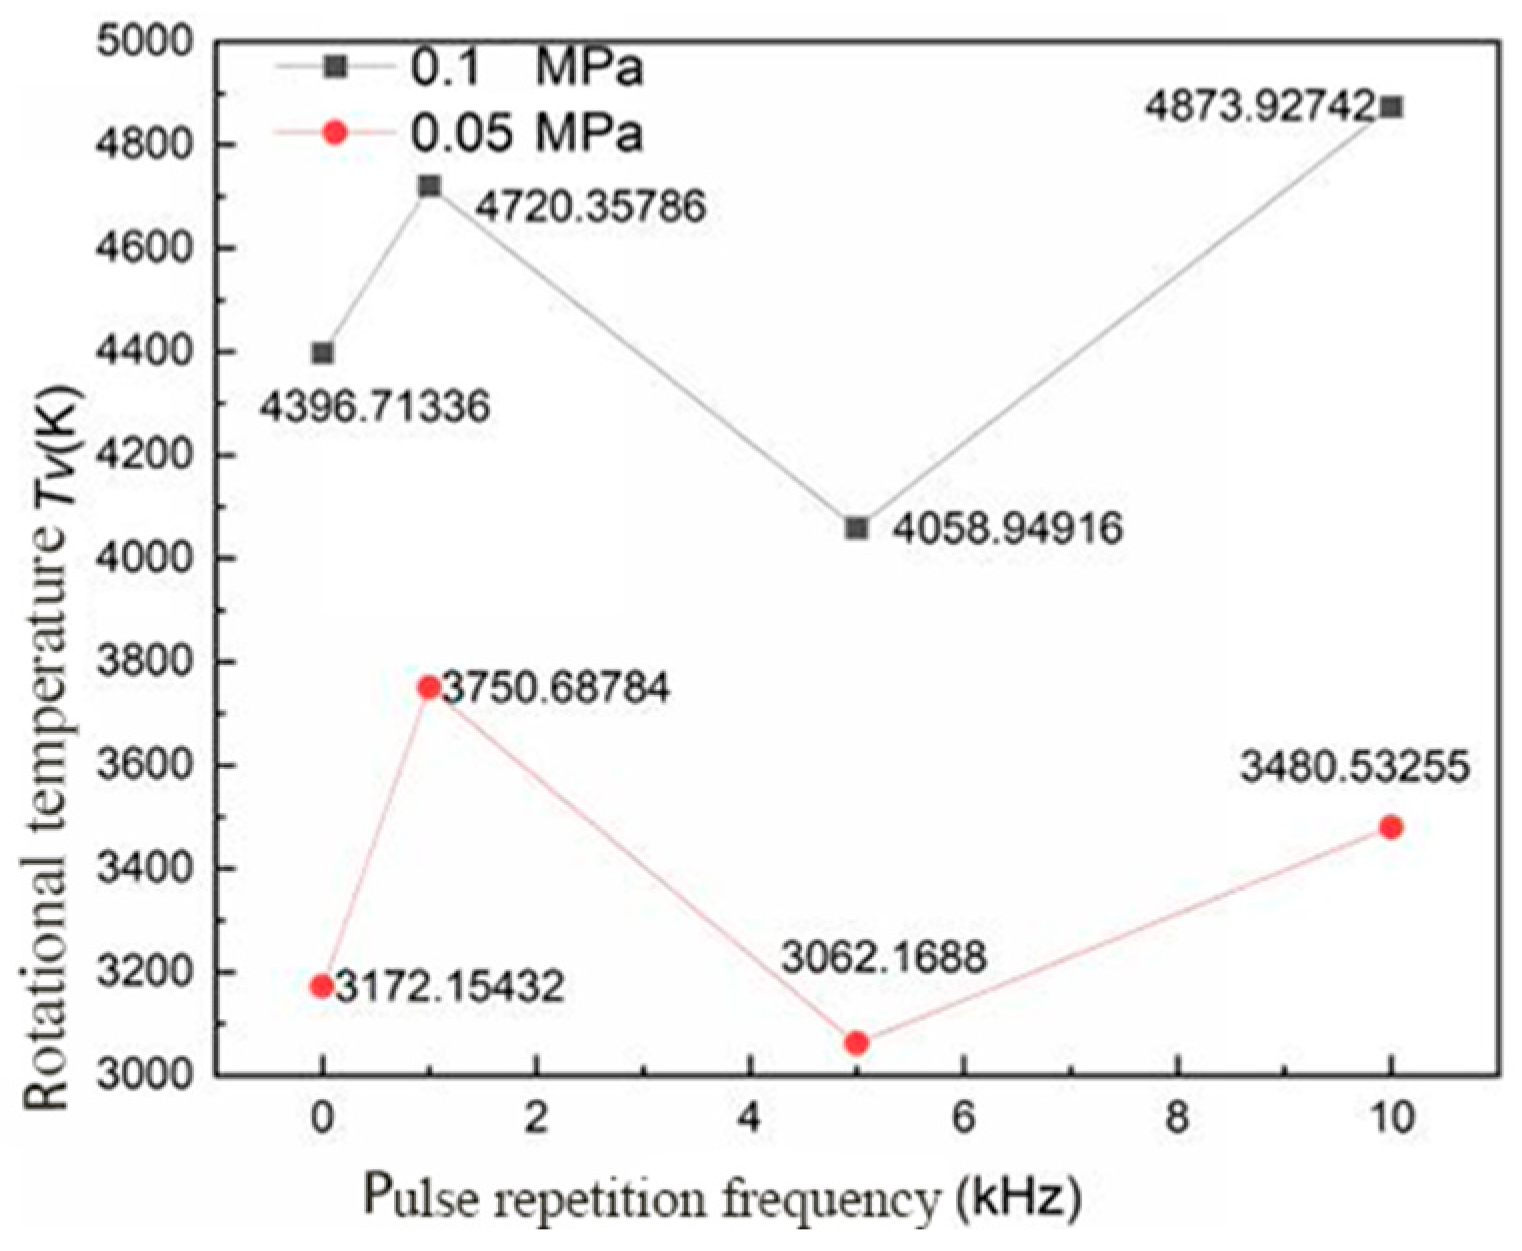
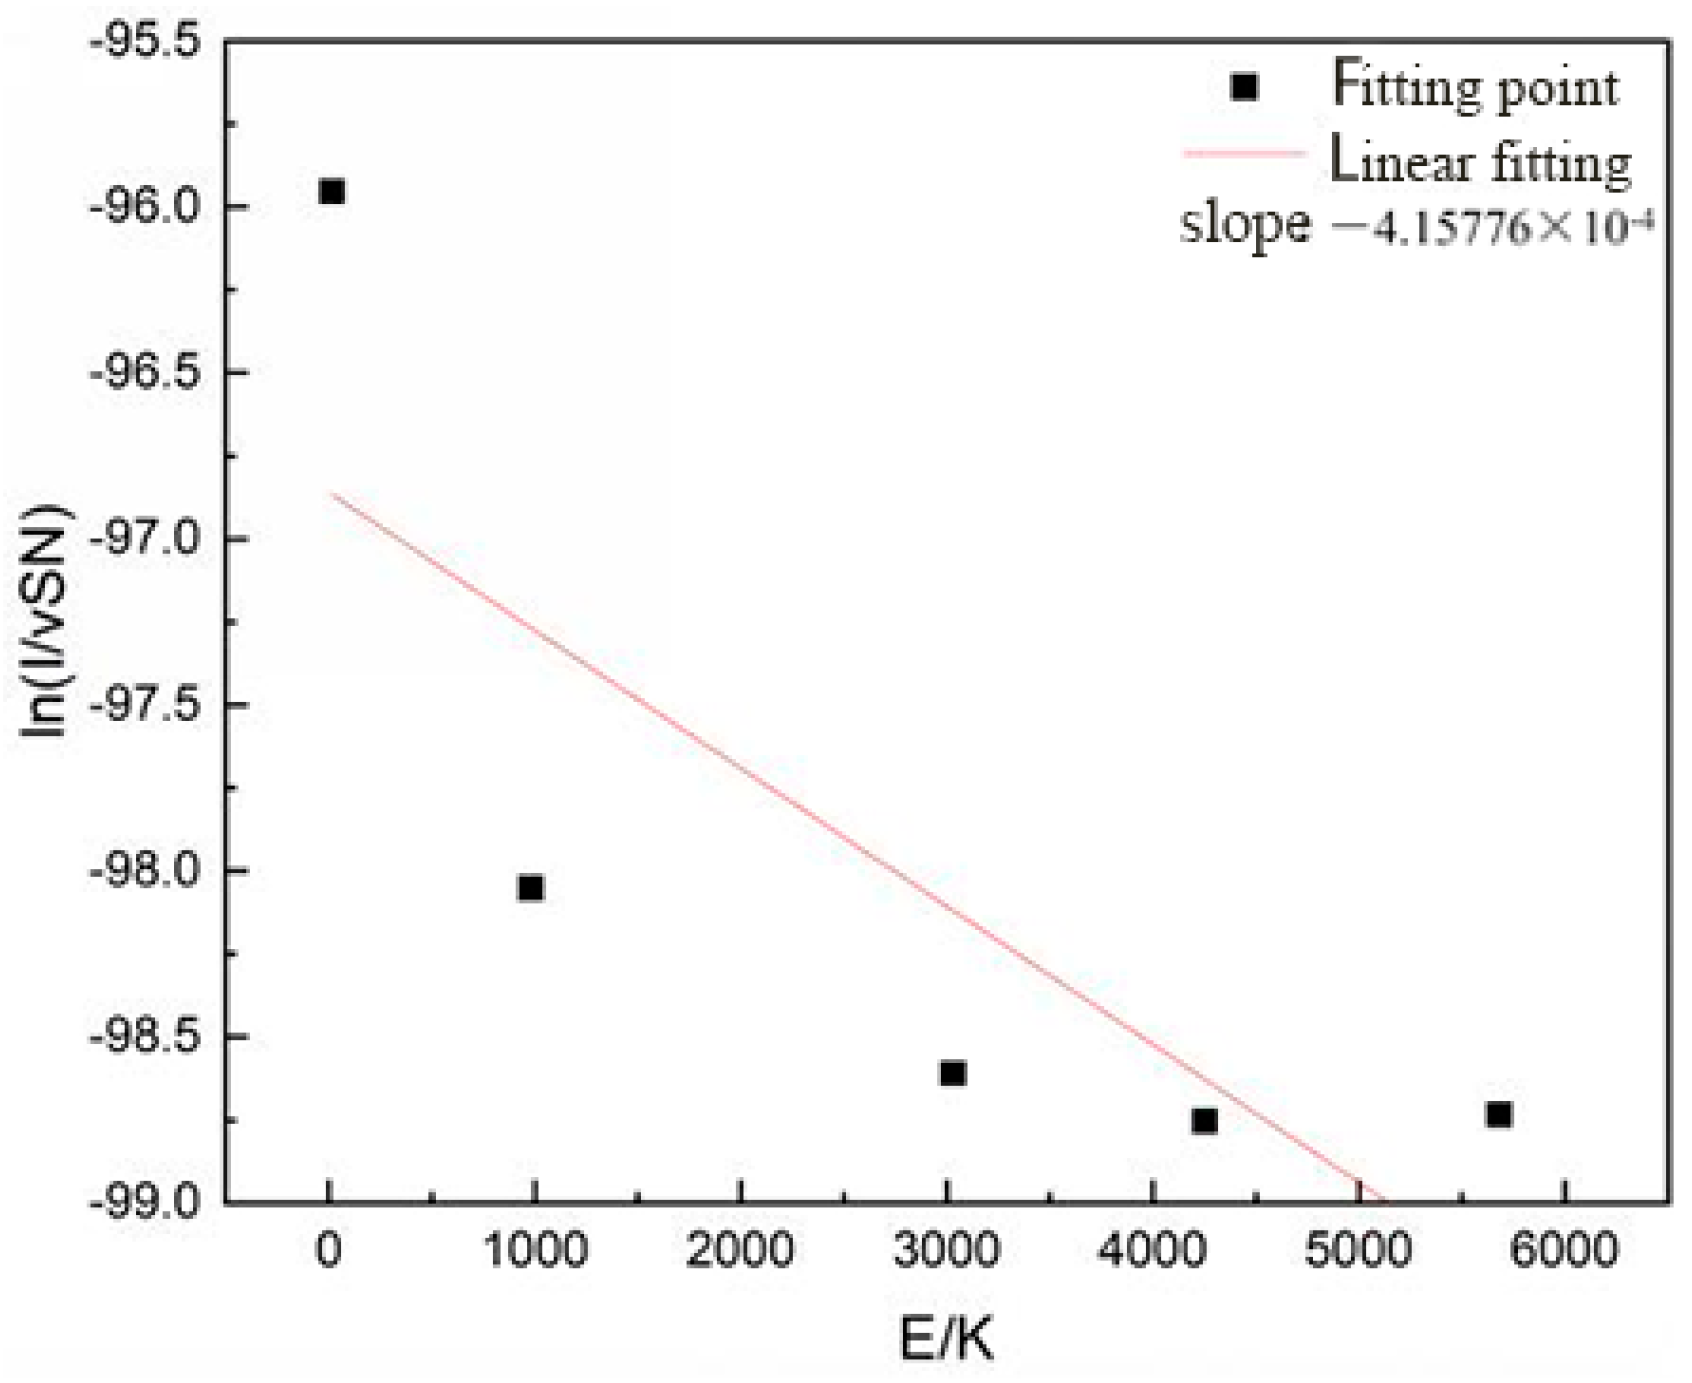
Rotational Temperature of Discharge Plasma of Igniter
The rotational temperature characterizes the energy of the rotational degrees of freedom in the plasma. As the equilibrium time between the rotational temperature and the translational temperature is short, the equilibrium can be achieved quickly; as such, the rotational temperature can be approximately regarded as the gas temperature. The rotational temperature [18] from the same electronic energy level and molecular vibrational energy level in the thermal equilibrium can be approximately calculated using Formula (10).
ln I J J ν J J 3 S J J g J = B ν J J + 1 h c k T r + C .
In the formula, J′ is the rotational energy level of the upper state; J is the rotational energy level of the lower state; IJJ is the spectral intensity of the transition from the upper rotational energy level to the lower rotational energy level; vJJ is the frequency of the transition from the upper rotational energy level to the lower rotational energy level; SJJ is the Honl–London factor; gJ is the degeneracy of the upper rotational energy level; Bv is the molecular rotation constant of the upper vibrational energy level; h is the Planck constant; k is the Boltzmann constant; c is the speed of light; and Tr is the rotational temperature.
Let the value of the ln I J J ν J J 3 S J J g J curve be the y axis and the value of the B ν J J + 1 h c k curve of the molecule be the x coordinate. The slope obtained by fitting the Boltzmann curve is the rotational temperature Tr of the molecule.
The rotational temperature was calculated according to the rotational energy level band of the first negative band system of the nitrogen ions N2+(B2Σu+→X2Σg+) (vibrational energy level ν′→″: 0→0). The relative emission spectral intensities were calculated for the upper-state energy levels J′ = 2, 18, 32, 38, and 44, as well as for the lower-state energy levels J″ = 3, 19, 33, 39, and 45, for the selected P-branch rotation spectra. As shown in Figure 21, the rotational temperature Boltzmann curve of the spark plug discharge plasma was −4.158 × 10⁻⁴ when the microwave peak power was 200 W, the pulse frequency was f = 10 kHz, and the calculated rotational temperature was 2405 K.
As shown in Figure 22, the rotation temperature of the spark plug discharge plasma varied with the peak power of microwave pulse under different ambient pressures. As can be seen from Figure 22, with the increase in the peak power of microwave pulse, the rotation temperature of spark plug discharge plasma showed an upward trend in both low-pressure and atmospheric-pressure environments. Under atmospheric pressure, the rotation temperature was 1822.42 K when the peak power of microwave pulse was 0 W, and it rose to 2405.14 K when the peak power of microwave pulse was 200 W. In the low-voltage environment, the rotation temperature was 1847.56 K when the microwave pulse peak power was 0 W, and the rotation temperature rose to 2240.18 K when the microwave pulse peak power was 200 W. It can be seen that the rotation temperature increased gradually with the increase in the microwave pulse peak power, and this was because the rotation temperature of the nitrogen molecular ions could be approximately considered to be equal to the atmospheric temperature—that is, the ion temperature, molecular rotation temperature and molecular translation temperature were the same. When the microwave pulse peak power was larger, the energy density near the spark plug electrode was higher, the plasma absorbed more microwave energy, and the rotation temperature increased gradually.
As shown in Figure 23, the rotation temperature of the spark plug discharge plasma varied with the microwave pulse frequency under different ambient pressures. It can be seen from Figure 23 that, with an increase in the microwave pulse frequency, the rotation temperature of spark plug discharge plasma decreased with an increase in the microwave pulse frequency whether at low pressure or atmospheric pressure. This occurred because the larger the microwave pulse width is, the lower the microwave pulse frequency is, and, when the microwave pulse width is infinite, the higher the energy absorbed by the plasma is, and the higher the rotation temperature is. The plasma reaches the state of thermal equilibrium in the process of absorbing energy and heat exchange with the outside world, and the rotation temperature then reaches the highest value.

4. Conclusions

The working characteristics of the microwave-assisted spark plug igniter were carried out in a vacuum experimental chamber, and the voltage, current, and intensity of the emission spectrum of the microwave-assisted spark plug igniter were measured under different ambient pressures. Moreover, the characteristic temperatures of the igniter’s plasma generated by the igniter’s discharge of the air were calculated, and the influences of the frequency of the microwave pulses and the peak power of the microwave pulses on the breakdown voltage, the average power, and the characteristic temperature of the plasma generated by the igniter’s discharge of the spark plug were studied. The effects of the microwave pulse frequency and microwave pulse peak power on the breakdown voltage, average power, and the characteristic temperature of the discharged plasma during spark plug discharge were investigated.
(1)
The peak microwave power significantly optimizes the discharge efficiency in low-pressure environments. In low-pressure environments, when the peak microwave power is increased from 0 W to 200 W, the breakdown voltage decreases by 15.2% and the average discharge power increases by 49%. At atmospheric pressure, the trend is similar but smaller, with a 10.8% decrease in breakdown voltage and a 23% increase in power. This difference stems from the prolongation of the electron mean free range in the low-pressure environment. Moreover, the microwave-induced strong electric field further promotes gas ionization, thus significantly reducing the breakdown energy threshold and improving the energy conversion efficiency.
(2)
Limited modulation of energy transfer by microwave frequency. Although the frequency increase can further reduce the low-voltage breakdown, the effect on the average power was weak. Combined with spectral analysis, it was found that the frequency change led to only <5% fluctuation in the intensity of the plasma emission spectrum, indicating that the microwave energy transfer is more dependent on the peak power than on the pulse timing. This phenomenon implies that power enhancement should be the core in the design of a high-altitude ignition system, and frequency optimization can be used as an auxiliary adjustment means.
(3)
The increase in microwave peak power significantly improves the characteristic plasma temperature: the electron temperature rises from 1.96 eV to 2.15 eV at atmospheric pressure, indicating that the increase in high-energy-electron density strengthens the dissociation of molecules and the generation of free radicals; the vibrational temperature rises from 4397 K to 4874 K, reflecting the accumulation of vibrationally excited particles, which is conducive to the triggering of chain reactions; the rotational temperature rises from 1822 K to 2405 K, which is close to the gas advection temperature and is favorable for chain reaction triggering; and the rotation temperature jumps from 1822 K to 2405 K, which is close to the gas advection temperature, indicating that the microwave energy is rapidly thermalized through the rotation mode.
It is noteworthy that an increase in frequency leads to a decrease in the rotation temperature (e.g., 5% at 10 kHz), suggesting that short pulses enhance the transient strength of the electric field but weaken the ability of sustained energy injection.
In the future, we will extend the study to the ignition experiment of an aviation kerosene–air mixture under turbulent conditions and construct a multi-physics field coupling model to accurately predict the interaction mechanism of the microwave–plasma–combustion, and we will continue to study the quantitative factors of the influence of different parameters and environmental conditions on the operating characteristics of microwave ignition so as to be able to realize how to achieve the optimal operating characteristics under different given conditions.

Author Contributions

Conceptualization, H.Z.; Methodology, H.Z. and N.J.; Software, C.F.; Validation, C.F. and N.J.; Formal analysis, Z.Z.; Investigation, Z.Z.; Data curation, C.F.; Writing—original draft, C.F.; Writing—review & editing, H.Z. and Z.L.; Visualization, Z.Z. and Z.L.; Supervision, H.Z. and N.J.; Project administration, H.Z.; Funding acquisition, H.Z. All authors have read and agreed to the published version of the manuscript.

Funding

This research was funded by The Project Supported by Natural Science Basic Research Plan in Shaanxi Province of China, grant number 2020JM-349.

Data Availability Statement

The original contributions presented in this study are included in the article. Further inquiries can be directed to the corresponding author.

Conflicts of Interest

The authors declare no conflict of interest.

Nomenclature

The main experimental parameters:
WaCombustion chamber air flow rate
WfJet fuel supply flow rate
αExcess air coefficient
TMixture temperature
TeElectronic temperature
TrotTurning temperature
TvibVibration temperature
TtransTranslational temperature
PMicrowave pulse peak power
fMicrowave pulse frequency

References

  1. Ikeda, Y.; Nishiyama, A.; Kaneko, M. Microwave Enhanced Ignition Process for Fuel Mixture at Elevated Pressure of 1 MPa: Aiaa Aerospace Sciences Meeting Including the New Horizons Forum & Aerospace Exposition. In Proceedings of the 47th AIAA Aerospace Sciences Meeting including The New Horizons Forum and Aerospace Exposition, Orlando, FL, USA, 5–8 January 2009. [Google Scholar]
  2. Wolk, B.; DeFilippo, A.; Chen, J.Y.; Dibble, R.; Ikeda, Y. Stability Limit Extension of a Wet Ethanol-fueled SI Engine using a Microwave-assisted Spark. Adv. Automob. Eng. 2015, 4, 123. [Google Scholar] [CrossRef]
  3. Wolk, B.; Defilippo, A.; Chen, J.Y.; Dibble, R.; Nishiyama, A.; Ikeda, Y. Enhancement of flame development by microwave-assisted spark ignition in constant volume combustion chamber. Combust. Flame 2013, 160, 1225–1234. [Google Scholar] [CrossRef]
  4. Hwang, J.; Bae, C.; Park, J.; Choe, W.; Cha, J.; Woo, S. Microwave-assisted plasma ignition in a constant volume combustion chamber. Combust. Flame 2016, 167, 86–96. [Google Scholar] [CrossRef]
  5. Padala, S.; Nishiyama, A.; Ikeda, Y. Flame size measurements of premixed propane-air mixtures ignited by microwave-enhanced plasma. Proc. Combust. Inst. 2016, 36, 4113–4119. [Google Scholar] [CrossRef]
  6. Zhang, X.; Wang, Z.; Zhou, D.; Wu, H.; Cheng, X.; Jin, B.; Chen, J.-Y. Strengthening effect of microwave on spark ignited spherical expanding flames of methane-air mixture. Energy Convers. Manag. 2020, 224, 113368. [Google Scholar] [CrossRef]
  7. Zhang, X.; Wang, Z.; Wu, H.; Zhou, D.; Huang, S.; Cheng, X.; Chen, J.Y. Combustion and Flame Experimental study of microwave assisted spark ignition on expanding C2H2-Air spherical flames. Combust. Flame 2020, 222, 111–122. [Google Scholar] [CrossRef]
  8. Zhang, X.; Wang, Z.; Huang, S.; Wu, H.; Jin, B.; Cheng, X. Effect of microwave-assisted ignition on premixed spherical flame of methane. J. Intern. Combust. Engines 2020, 38, 38–45. [Google Scholar]
  9. Wang, Z. Research on Methanol Ignition Characteristics Based on Microwave-Assisted Ignition. Master’s Thesis, Huazhong University of Science and Technology, Wuhan, China, 2022. [Google Scholar]
  10. Liu, C. Research on Microwave-Assisted Ammonia/Hydrogen Fuel Ignition Based on Microwave Energy Flow. Master’s Thesis, Huazhong University of Science and Technology, Wuhan, China, 2023. [Google Scholar] [CrossRef]
  11. Alder, J.; Mermet, J. A spectroscopic study of some radio frequency mixed gas plasmas. Spectrochim. Acta Part B At. Spectrosc. 1973, 28, 421–433. [Google Scholar] [CrossRef]
  12. Furuta, N.; Nojiri, Y.; Fuwa, K. Spatial profile measurement of electron number densities and analyte line intensities in an inductively coupled plasma. Spectrochim. Acta Part B At. Spectrosc. 1985, 40, 423–434. [Google Scholar] [CrossRef]
  13. Dong, L.; Ran, J.; Yin, Z.; Mao, Z. Electron excitation temperature in atmospheric pressure argon dielectric barrier discharge. Spectrosc. Spectr. Anal. 2005, 25, 1184–1186. (In Chinese) [Google Scholar]
  14. Dong, L.; Liu, F.; Li, S.; Ran, J.; He, Y.; Li, X.; Pang, X. Molecular vibrational temperature in atmospheric pressure argon/air dielectric barrier discharge. Spectrosc. Spectr. Anal. 2006, 26, 802–804. (In Chinese) [Google Scholar]
  15. Starikovskiy, A.; Nickolay, A. Plasma-assisted ignition and combustion. Prog. Energy Combust. Sci. 2013, 39, 61–110. [Google Scholar] [CrossRef]
  16. Laux, C. Optical Diagnostics and Radiative Emission of Air Plasmas. Ph.D. Thesis, Stanford University, Stanford, CA, USA, 1993. [Google Scholar]
  17. Wu, A.; Zhang, H.; Li, X.; Lu, S.Y.; Du, C.M.; Yan, J.H. Spectroscopic diagnostics of rotating gliding arc plasma codriven by a magnetic field and tangential flow. IEEE Trans. Plasma Sci. 2014, 42, 3560–3568. [Google Scholar] [CrossRef]
  18. Zhang, S.; Wang, W.; Jia, L.; Liu, Z.; Yang, Y.; Dai, L. Rotational, Vibrational, and Excitation Temperatures in Bipolar Nanosecond-Pulsed Diffuse Dielectric-Barrier-Discharge Plasma at Atmospheric Pressure. IEEE Trans. Plasma Sci. 2013, 41, 350–354. [Google Scholar] [CrossRef]
Figure 1. Discharge characterization test system.
Fire 08 00231 g001
Figure 2. (a) Vacuum experimental chamber. (b) Vacuum pump.
Fire 08 00231 g002
Figure 3. The spectral characteristic testing system.
Fire 08 00231 g003
Figure 4. The voltage and current waveforms of the coaxial semiconductor spark plugs during discharge.
Fire 08 00231 g004
Figure 5. Discharge process photos of the coaxial semiconductor spark plugs.
Fire 08 00231 g005
Figure 6. The voltage and current waveforms of the coaxial semiconductor spark plug breakdown process.
Fire 08 00231 g006
Figure 7. The voltage and current waveform of the energy dissipation process of the coaxial semiconductor spark plug.
Fire 08 00231 g007
Figure 8. The voltage and current waveforms of the coaxial semiconductor spark plug energy storage process.
Fire 08 00231 g008
Figure 9. The variation curve of the breakdown voltage with the pulse peak power under different ambient pressures.
Fire 08 00231 g009
Figure 10. Linear fitting of the power consumption during the discharge of coaxial semiconductor spark plugs.
Fire 08 00231 g010
Figure 11. The variation curve of the spark plug discharge average power with the microwave pulse peak power under different ambient pressures.
Fire 08 00231 g011
Figure 12. The variation curve of the spark plug breakdown voltage with a microwave pulse frequency under different ambient pressures.
Fire 08 00231 g012
Figure 13. The variation curve of the average discharge power of spark plug with a microwave pulse frequency under different ambient pressures.
Fire 08 00231 g013
Figure 14. The emission spectral intensity of the spark plugs under different working conditions: (a) The environmental pressure was 0.1 MPa. (b) The environmental pressure was 0.05 MPa. (c) The environmental pressure was 0.1 MPa. (d) The environmental pressure was 0.05 MPa.
Fire 08 00231 g014
Figure 15. The Boltzmann curve of electron temperature Te.
Fire 08 00231 g015
Figure 16. The variation of the electron temperature with the pulse peak power under different ambient pressures.
Fire 08 00231 g016
Figure 17. The electron temperature varied with pulse frequency under different ambient pressures.
Fire 08 00231 g017
Figure 18. The Boltzmann curve of the vibration temperature Tv of the spark plug discharge plasma.
Fire 08 00231 g018
Figure 19. The variation of the vibration temperature of the spark plug discharge plasma with a pulse peak power under different ambient pressures.
Fire 08 00231 g019
Figure 20. The variation of the vibration temperature of the spark plug discharge plasma with a microwave pulse frequency under different ambient pressures.
Fire 08 00231 g020
Figure 21. The Boltzmann curve of the rotational temperature Tr of the spark plug discharge plasma.
Fire 08 00231 g021
Figure 22. The variation curve of the rotation temperature of the spark plug discharge plasma with the microwave pulse peak power under different ambient pressures.
Fire 08 00231 g022
Figure 23. The variation of the rotation temperature of the spark plug discharge plasma with the microwave pulse frequency under different ambient pressures.
Fire 08 00231 g023
Table 1. The experimental working condition table of the spectral characteristics of the microwave-assisted spark plug igniter.
Environmental Pressure0.05 MPa0.1 MPa
Peak Power
100 W1 kHz1 kHz
5 kHz5 kHz
10 kHz10 kHz
150 W1 kHz1 kHz
5 kHz5 kHz
10 kHz10 kHz
200 W1 kHz1 kHz
5 kHz5 kHz
10 kHz10 kHz
Disclaimer/Publisher’s Note: The statements, opinions and data contained in all publications are solely those of the individual author(s) and contributor(s) and not of MDPI and/or the editor(s). MDPI and/or the editor(s) disclaim responsibility for any injury to people or property resulting from any ideas, methods, instructions or products referred to in the content.

