Article

Study of Temperature Distribution in U-Shaped Underwater Tunnel Fires Under the Influence of Induced Airflow

1
School of Safety Engineering, China University of Mining and Technology, Xuzhou 221116, China
2
Pei County Fire and Rescue Detachment, Xuzhou 221600, China
*
Author to whom correspondence should be addressed.
Fire 2025, 8(5), 185; https://doi.org/10.3390/fire8050185
Submission received: 3 April 2025 / Revised: 23 April 2025 / Accepted: 5 May 2025 / Published: 7 May 2025
(This article belongs to the Special Issue Modeling, Experiment and Simulation of Tunnel Fire)

Abstract

:
Compared to a single horizontal or inclined tunnel, a U-shaped underwater tunnel combines both types. If such tunnels catch fire, the resulting scenarios will lead to varying intensities of induced airflow, which significantly impact the internal heat transfer mechanisms. This study numerically simulated the effects of varying induced airflow strengths on the heat transfer proportion and temperature distribution within the tunnel. Key variables including the inclination angle of tunnel sections, the heat release rate (HRR) of the fire source, and its distance to the tunnel opening were systematically investigated. The results indicate that when the fire is in the horizontal tunnel section, the primary factor affecting the temperature field distribution is the HRR of the fire. As the fire source moves toward the inclined tunnel section, a transition to strong induced airflow occurs above the corner at low angles of inclination. As the slope increases, the transition position shifts downstream, toward the lower side of the corner. At this point, the tunnel is affected by strong induced airflow. Using dimensionless analysis, models were developed for temperature field distribution under strong and weak induced airflow, guiding underwater tunnel spray activation temperature and firefighting and rescue efforts.

1. Introduction

As the Chinese economy rapidly expands and urbanization accelerates, the development of underground spaces within the city has grown, and the number of rail transit projects under construction has continued to rise. The structural integrity of tunnel linings may be compromised by high temperatures generated by flames during a fire. Extensive research has been carried out to examine temperature distribution ( T ) in tunnel fire scenarios. Alpert et al. researched the theory of a ceiling jet and established a temperature variation model after fully considering the impact of the convective heat transfer and the wall friction, proposing the classical fire plume model [1]. Li and Ingason et al. suggested that longitudinal ventilation has a significant impact on the flame tilt angle and the smoke transport characteristics within the tunnel, and they analyzed the connection between maximum excess temperature and mass flow rate for two cases, natural and mechanical ventilation, respectively, differentiated by the dimensionless wind speed, which has been continuously validated and used in subsequent research [2,3]. In addition to the traditional horizontal ceiling, there has also been extensive study of temperature distributions under inclined ceilings [4,5,6,7,8]. Ji et al. found that the smoke layer upstream of the fire source is parallel to the horizontal plane, while the smoke layer downstream of the fire source is parallel to the inclined ceiling. A temperature prediction model was proposed [9]. Fan et al. analyzed how the angle of slope affects the smoke backflow length during steady-state conditions and found that enhancing the length or decreasing the inclination angle can reduce the backflow length of smoke [10]. However, in these studies, the fire source was always positioned at the center of the tunnel, without considering the effect of its longitudinal position. Building on this research, several scholars have investigated the impact of the longitudinal position of the fire source on the temperature field within the tunnel. He et al. found that when the fire source is close to the tunnel side, the temperature decays rapidly, and the longitudinal temperature exhibits an arctangent function distribution [11]. Huang et al. discovered that as the fire shifts toward tunnel’s one side, the flame tilts downstream, with the tilt angle gradually increasing. The location of T m a x on the tunnel ceiling moves to the downstream of the tunnel [12]. In recent years, as urban tunnels have extended into deep underground areas and beneath rivers and lakes, their geometrical configurations have become increasingly complex to accommodate challenging geological conditions. For T-shaped tunnels, Chen et al. conducted scaled model experiments to investigate the effect of fire-source location on the temperature distribution. The tunnel was divided into the increasing region and the stable region, and a corresponding critical velocity prediction model was proposed [13]. Li et al. use d numerical simulations and found that the volume of smoke entering the tunnel branch primarily depends on the thickness and temperature of the main tunnel smoke flow. Research on V-shaped tunnels has also been increasing [14]. Qie et al. conducted small-scale experiments and found that, for a 20 MW fire, the smoke could be effectively controlled when the exhaust rate was within the range of 140–160 m3/s [15]. Lu et al. used numerical simulations to analyze the influence of water mist on the temperature distribution in V-shaped tunnel fires. The tunnel was divided into three zones: the double-slope control zone, the transition zone, and the single-slope control zone. An improved temperature prediction model was also proposed [16].
In previous studies, research has generally focused separately on the structural characteristics of the tunnel or the fire-source characteristics. Recently, research on special tunnel configurations has primarily focused on T-shaped and V-shaped tunnels, while studies on U-shaped tunnels remain relatively limited. Whether for horizontal or inclined ceilings, as the fire source moves towards one side of the tunnel, openings on both sides of the tunnel will supply fresh air to the tunnel, and as the fire source approaches one opening, the induced airflow gradually increases. However, this transition typically occurs when the fire source is about 40–50 m from the opening [11]. In U-shaped underwater tunnels, the previous predictive models for horizontal/inclined ceilings are no longer applicable. These type of tunnels are constructed with sinking tubes [17]. From a structural perspective, U-shaped tunnels contain both horizontal and inclined sections, with a relatively long overall length. There is an angle between the horizontal and inclined sections, and if the fire is located far from the tunnel opening, high-temperature smoke is likely to accumulate at the angle within the tunnel. From a fire behavior perspective, as the fire source moves toward one opening, the upstream and downstream regions near the opening are more strongly influenced by the stack effect. Compared to the critical transition points in horizontal tunnels, which occur around 40–50 m from the tunnel opening, the critical transition in U-shaped tunnels may shift. Therefore, analyzing changes in heat transfer mechanisms and smoke spread in such tunnels, and developing predictive models for temperature distribution, is crucial for fire safety design and emergency response.

2. Numerical Simulation
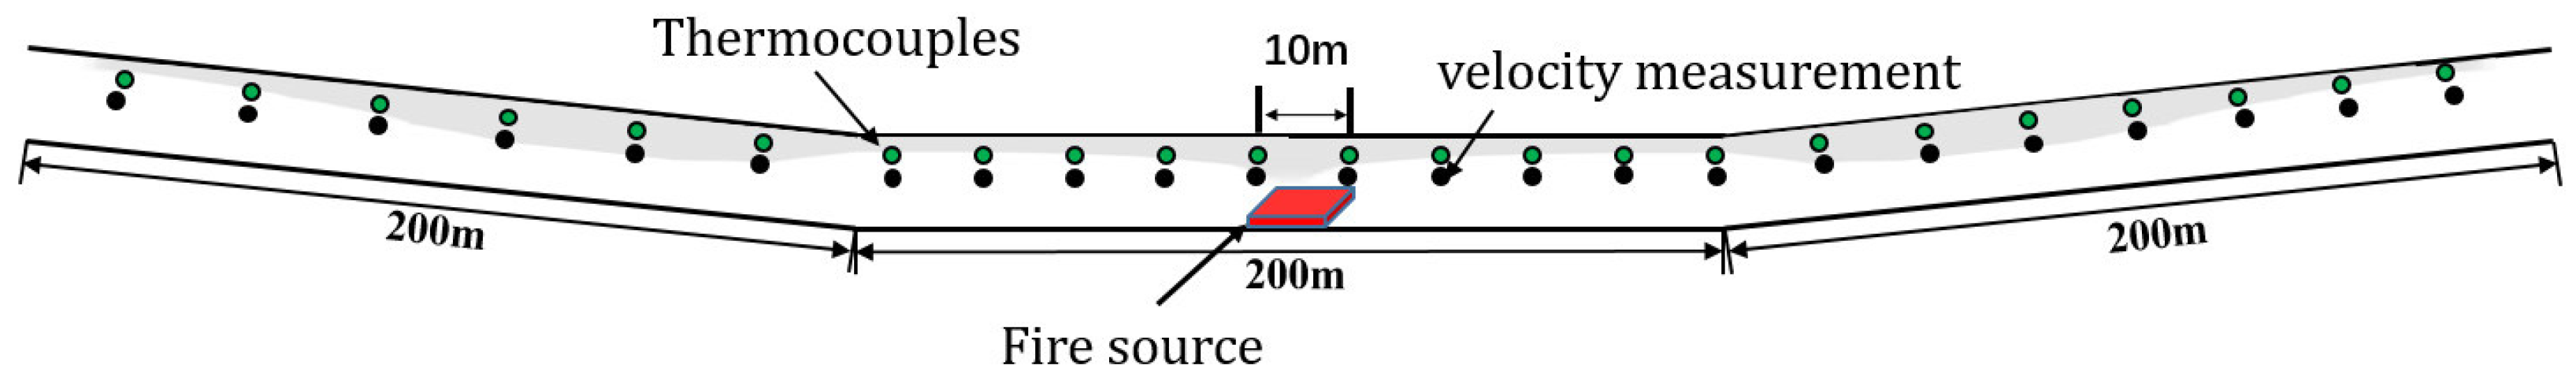
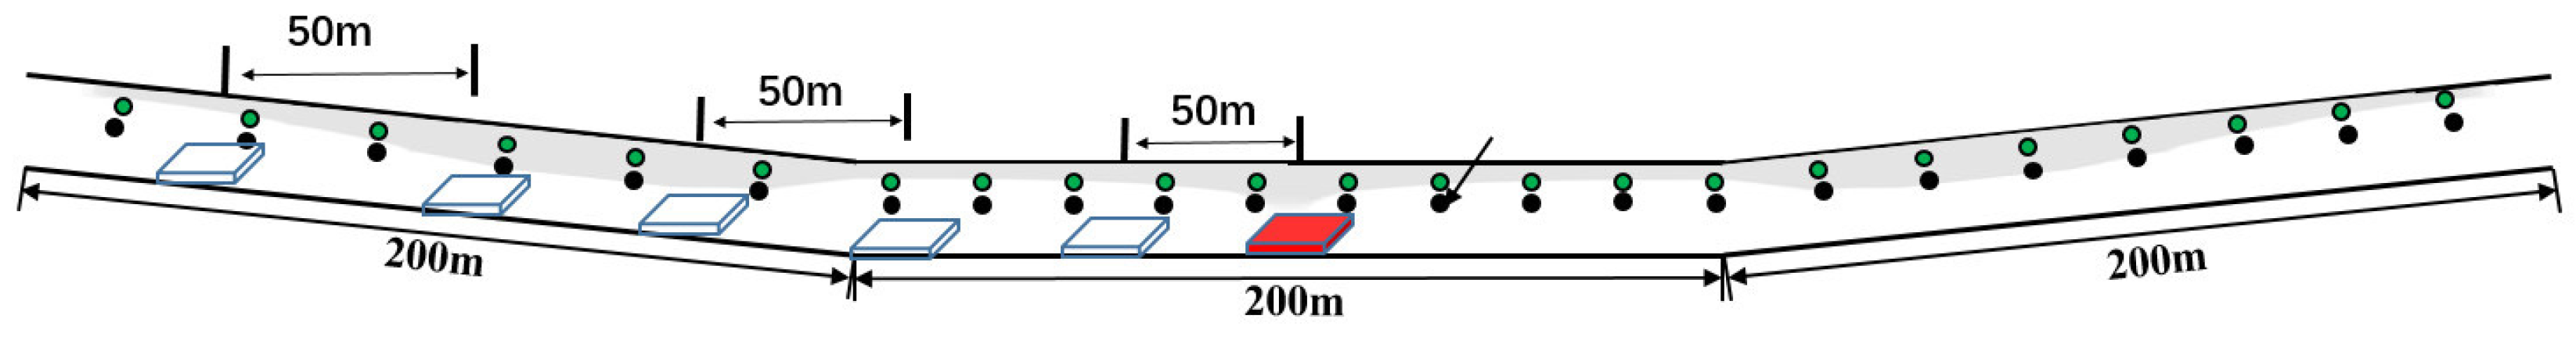
2.1. Model Design

FDS is used in the research of this issue for investigating the smoke transport characteristics of underwater tunnel fires, which is commonly used for the numerical simulation of fire dynamics [18]. The parameter settings of this tunnel model are mainly based on an underwater tunnel in China. As shown in the schematic below, a series of parameter settings were made for three different inclination tunnels, and the numerical simulation setup for the underwater tunnel is briefly depicted in the accompanying graphic (Figure 1). Under typical conditions, the upstream and downstream directions in a tunnel are defined based on the direction of traffic flow. In this study, the upstream and downstream are defined as the distances from the left and right tunnel openings to the fire source, respectively. The test condition was shown in Table 1. The HRR of the fire source was set at 2.5 MW, 5 MW, and 10 MW, respectively, because the maximum HRR for a single small car is 5 MW [19], and considering the possible scenario of multiple vehicles on fire at a fire scene, the maximum HRR is more than 10 MW [20]. In previous engineering cases, an angle of 5% has generally been considered the upper limit for the slope, as a steep incline can reduce transportation efficiency, so the inclination angle can be set to 3%, 4%, and 5%, respectively. The longitudinal position of the fire source was examined through five settings, commencing from the center of the tunnel, and changing the position of the fire source every 50 m along one side of the opening (Figure 2). In the simulation of the underwater tunnel with the same inclination and the same HRR from the fire, following previous research [12,21], the fire source was positioned at 50 m intervals along the tunnel’s longitudinal direction. Two groups of the fire source were set up in the horizontal tunnel (300 m and 250 m from the left opening of the tunnel, respectively), one group was positioned at the intersection of the inclined part and the horizontal part, and three groups were set up in an inclined tunnel on one side (50 m, 100 m, and 150 m from the tunnel’s left opening). Thermocouples and wind velocity measurements were arranged every 10 m. Mass flow rate detectors were set as negative and positive to monitor the real-time smoke and air volume, and the interval was also set at 10 m. “Concrete” was selected for the tunnel model’s sides and ceiling. And the openings of both sides were set as “open”. The time of this simulation was set to the 1800s, and according to the results, the smoke temperature achieved stability at approximately 600 s, so the average values after stabilization after 600 s were selected as the data for the study in this paper.

2.2. Mesh Size Setting

To accurately simulate smoke flow parameters, selecting the appropriate grid size is crucial. The FDS manual employs a dimensionless criterion to numerically assess the grid size’s adequacy and to establish standards for the characteristic diameter of the fire source [22]:
D * = Q ˙ ρ 0 C p T 0 g 1 2 2 5
In this expression, Q ˙ is the H R R of the fire, g is the acceleration of gravity ( m / s 2 ), which normally takes the value of 9.81, ρ 0 is the density of air at ambient temperature ( k g / m 3 ), C p is the constant-pressure specific heat capacity ( J / k g K ), T 0 is the ambient temperature (k), and δ x is the mesh size (m). The recommended values for the dimensionless expression in the FDS manual are 4–16. This suggests that the D * / δ x needs to be set from 0.0625 D * to 0.25 D * . When the grid size is set to 0.25, the values of 8.7, 4.35, and 5.73, respectively, generally meet the requirements. The temperature variation in the vertical direction was measured at 1 m intervals from the fire source (5 MW) and temperature data were collected. Temperature data were gathered and the vertical variation in temperature was monitored at 1 m intervals from the top of the fire source (5 MW), As shown in Figure 3, when the grid sizes are 0.25 m and 0.2 m, the temperature data are quite similar. For a grid size of 0.1 m, the data are slightly higher, while for a grid size of 0.3 m, there is a significant deviation in the temperature data. Considering that a finer grid would substantially increase the computation time, a grid size of 0.25 m was selected.

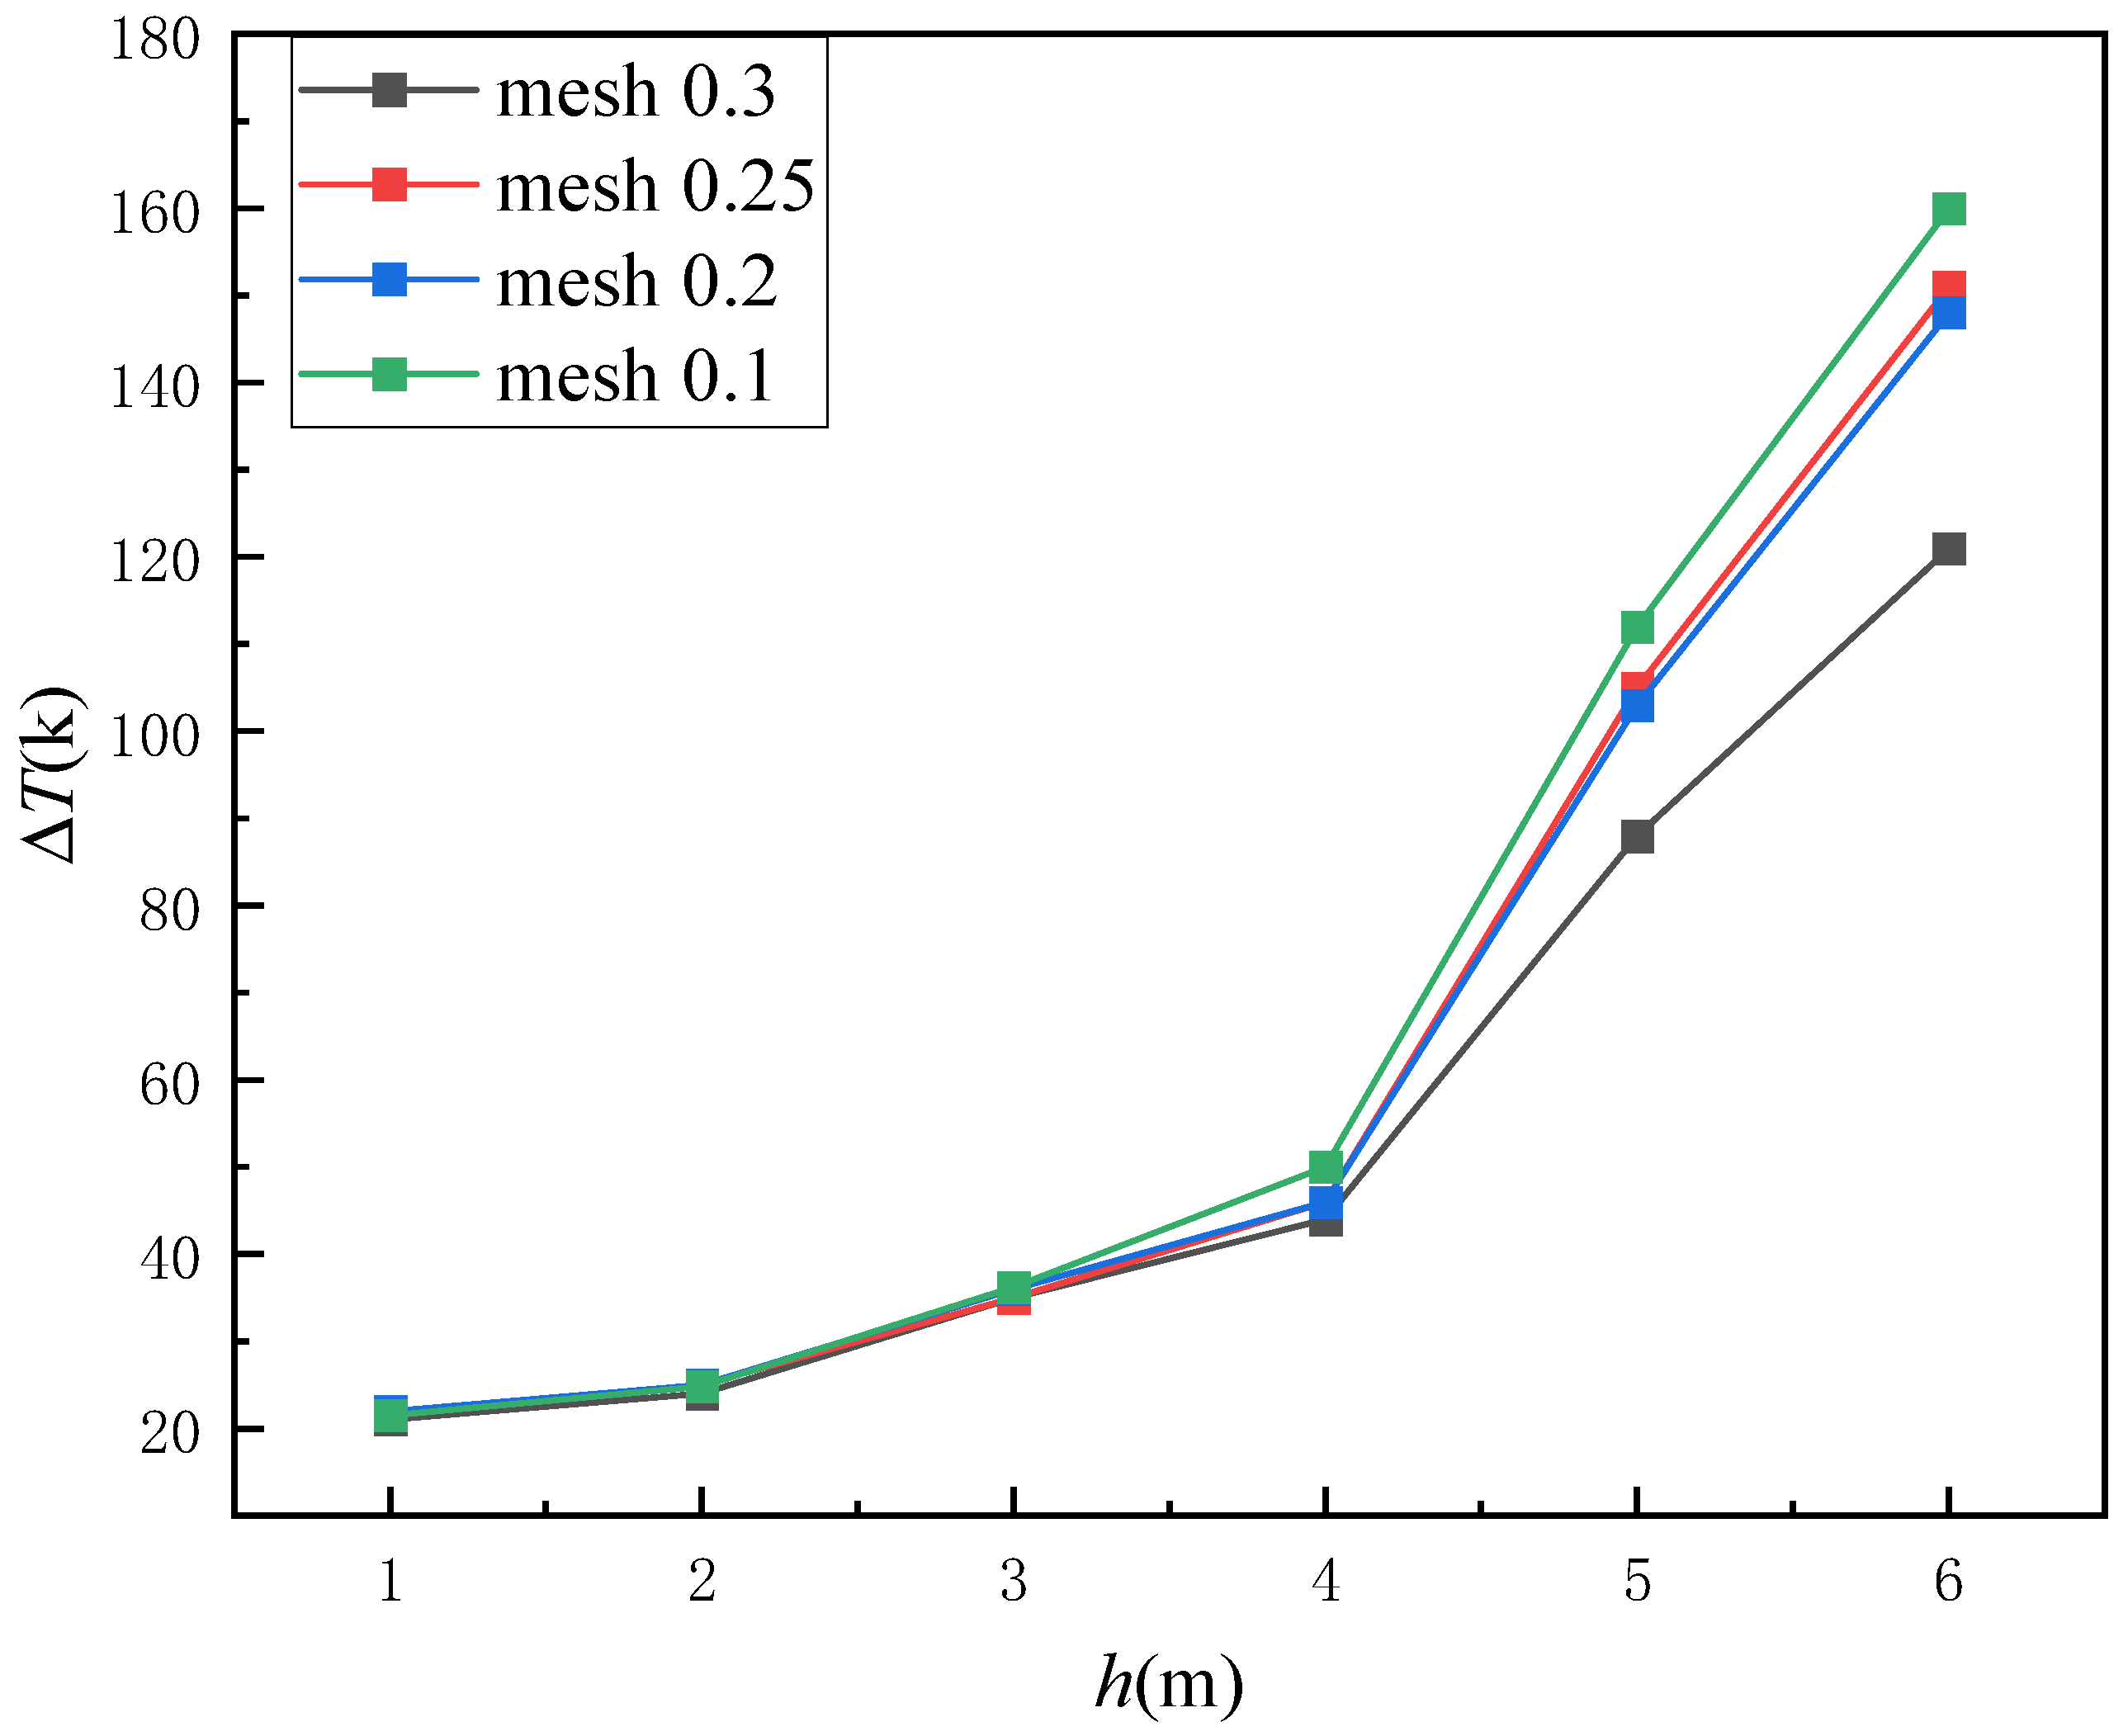
2.3. Mesh Accuracy Verification

In this article, the actual and computationally computed values of temperature attenuation downstream of the fire were contrasted (Figure 4) [23]. It was found that the simulation values were basically consistent with the experimental values, Therefore, FDS could accurately predict the smoke flow in the tunnel fire [18,24,25].

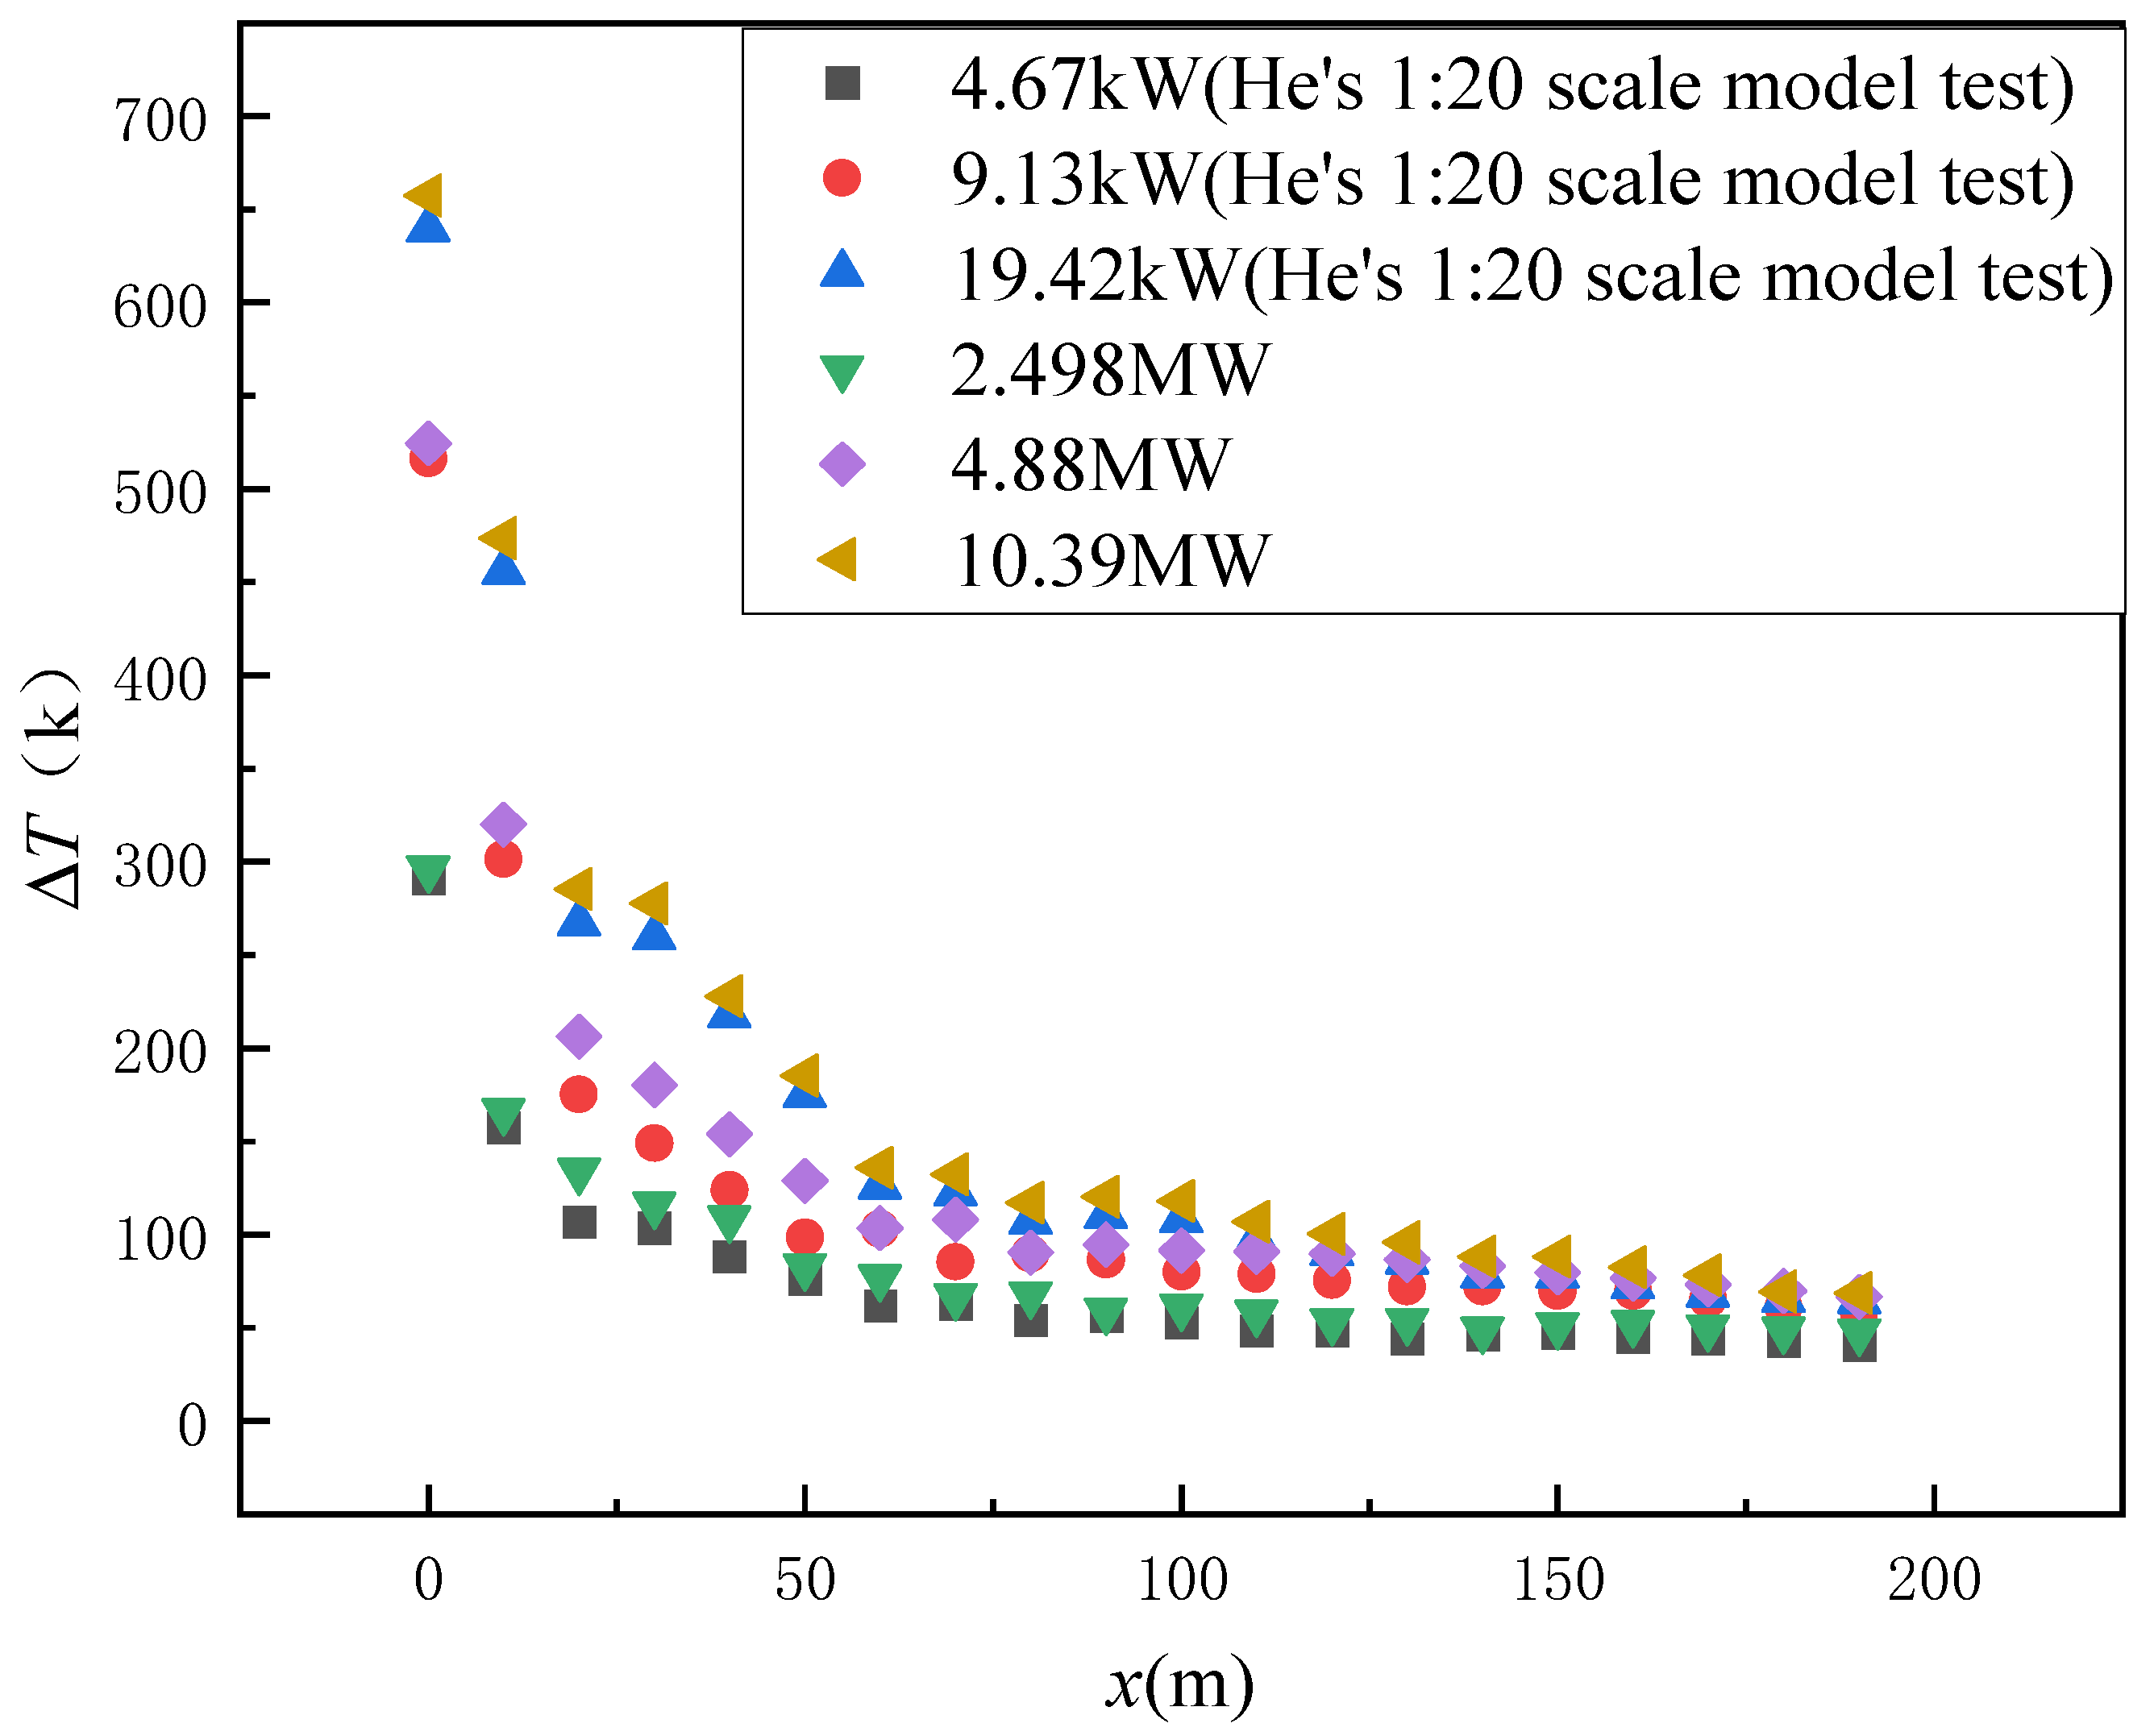
3. Result and Discussion

When fire sources with different heat release rates were located at various longitudinal positions in tunnels with different inclinations, the mass flow rate of the induced airflow varied, significantly affecting the internal heat transfer mechanisms. By comparing the changes in smoke spread patterns and temperature fields after altering the heat transfer mechanisms, we developed a temperature prediction model under varying strengths of induced airflow.

3.1. Changes in the Heat Transfer Proportion Under Induced Airflow

We compared the temperature variation in underwater tunnel fires in the three inclination cases and found that the basic trend of change was similar, but there were some differences in the specific value, so we focused on selecting the temperature variation under the working condition of 5 MW.
(1)
Temperature variation of 5 MW
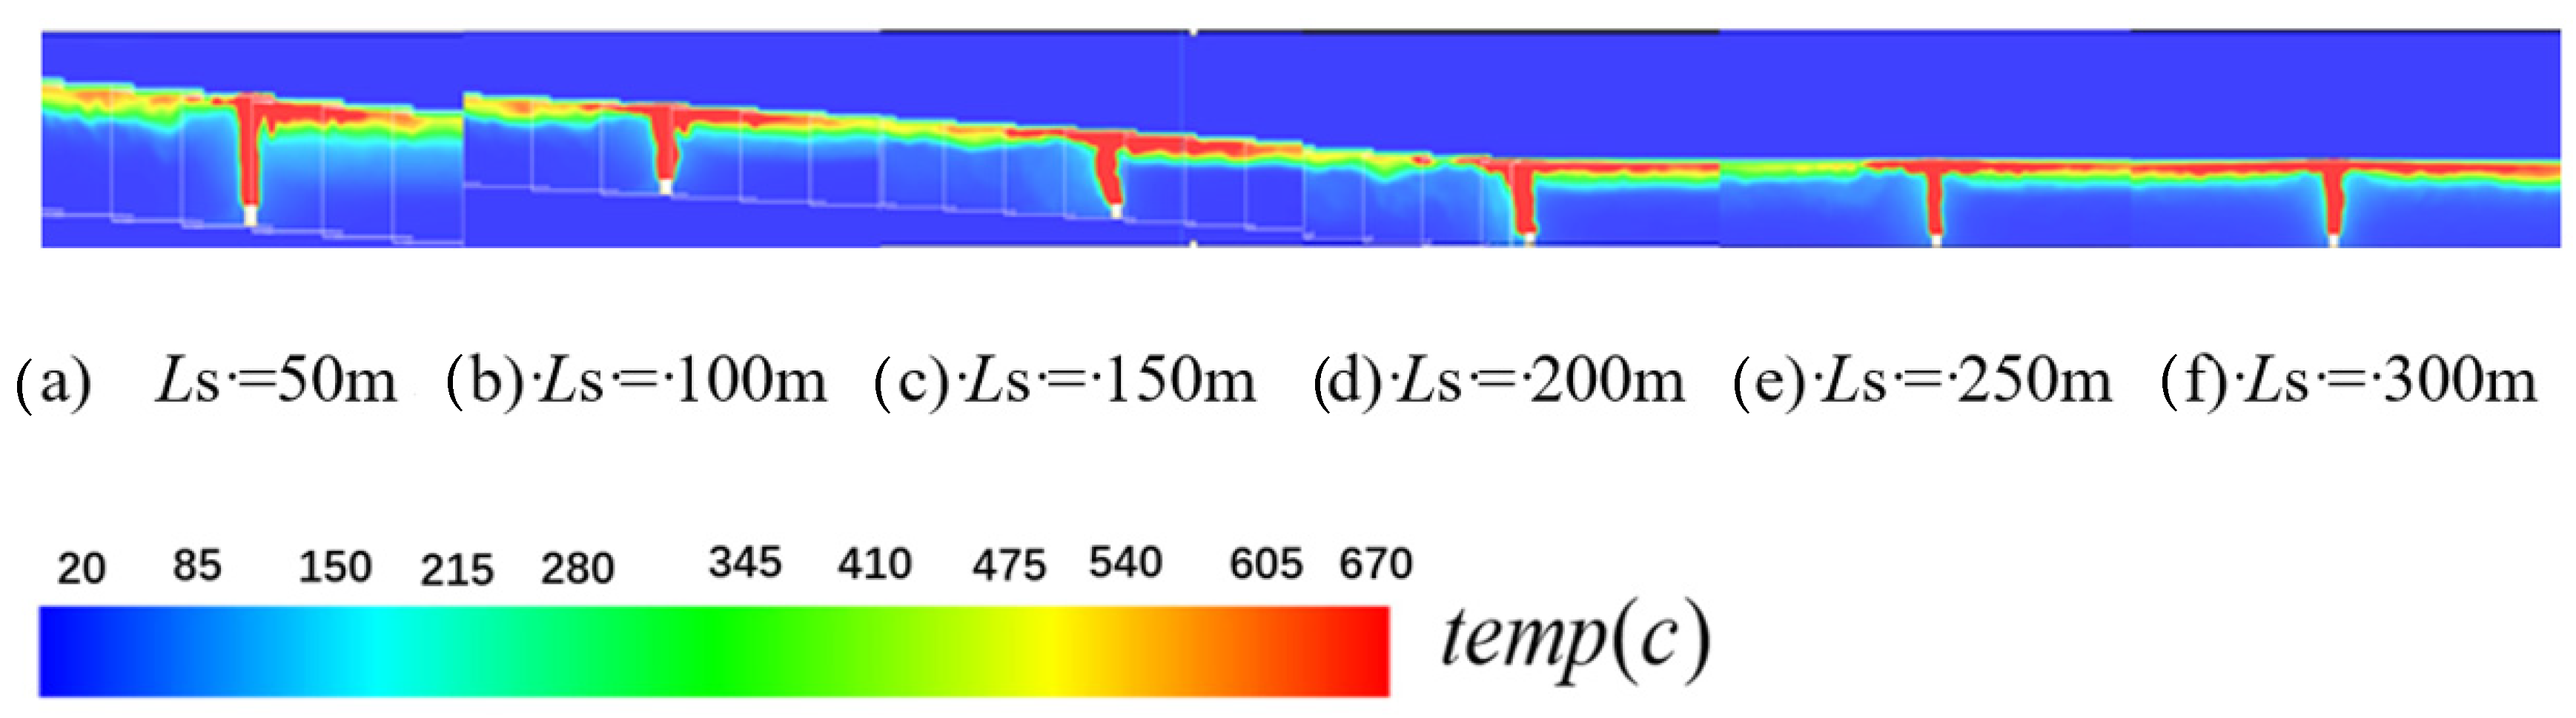
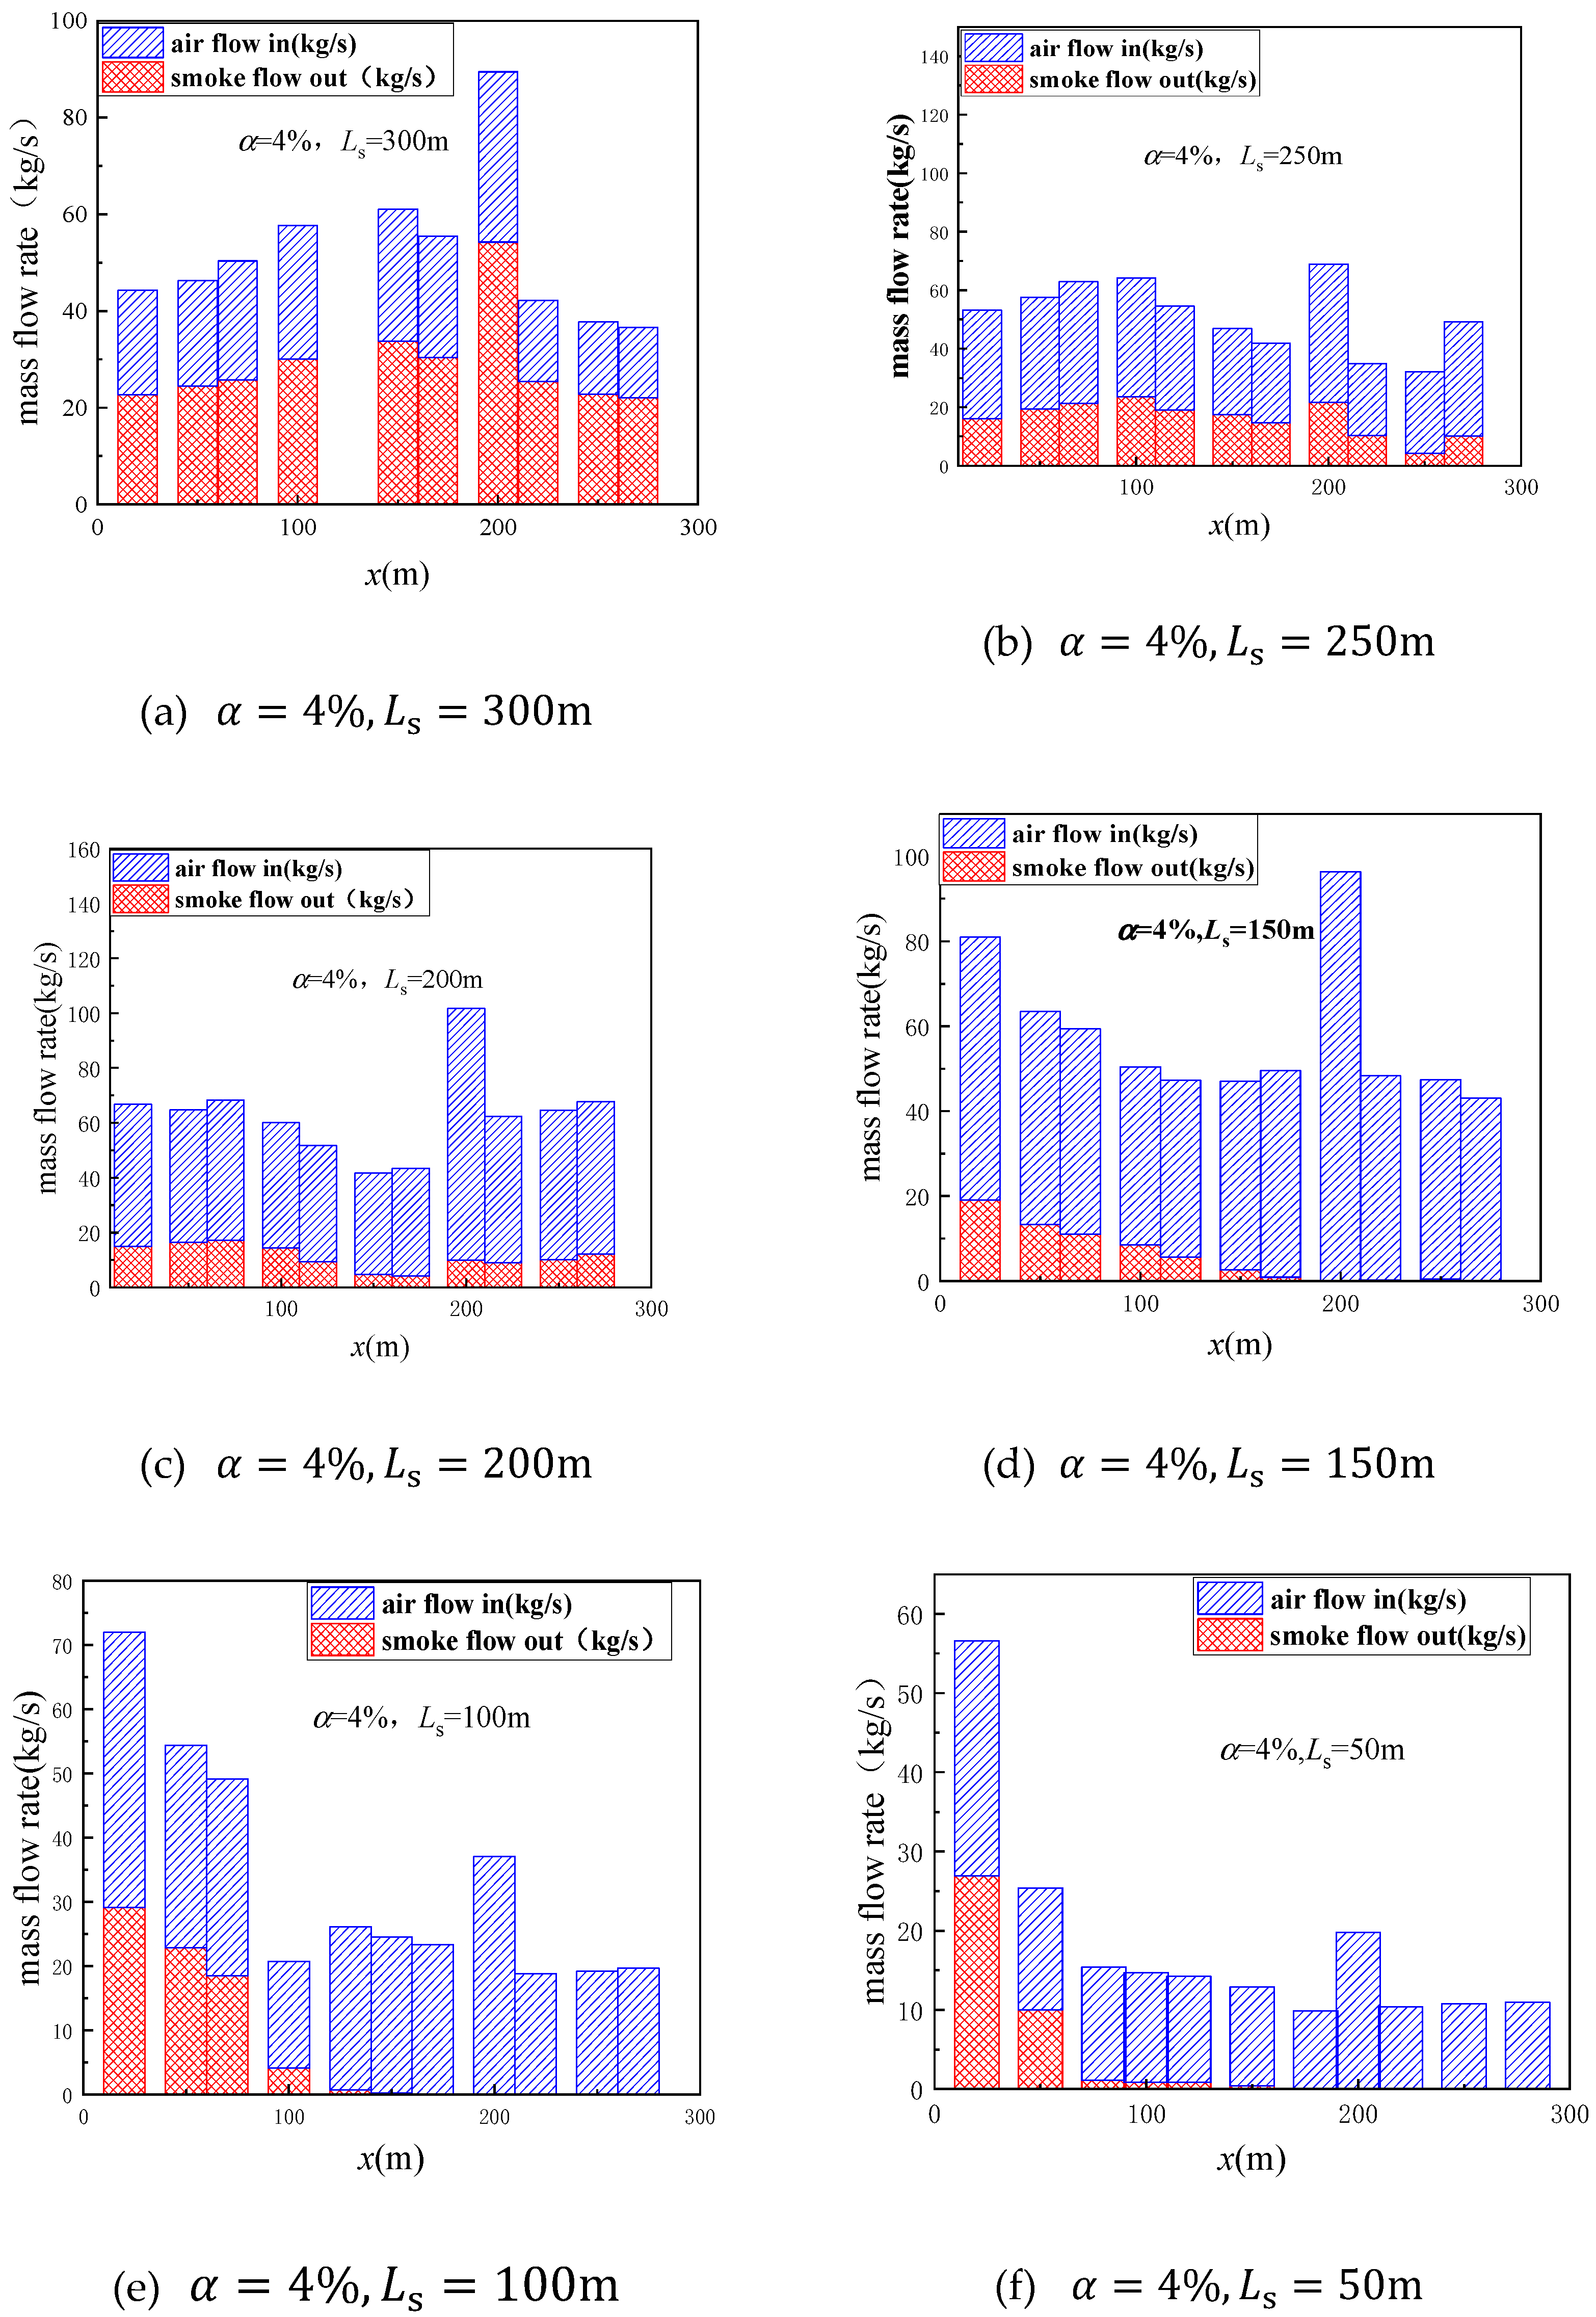
Figure 5 shows the distribution of temperatures surrounding the fire source at various positions of an underwater tunnel at the steady state, where the inclination angle of the 5 MW fire source was 4%. L s refers to the gap between the left opening and the fire, when the fire was positioned in the horizontal tunnel. There was a symmetrical distribution of temperatures on both sides. As the fire moved towards the side of the opening, the temperature variation on both sides of the source gradually became asymmetric, and the temperature attenuation of the upstream was accelerated. This was because the stack effect accelerates the outflow of fire smoke, and the mass flow rate of the induced airflow progressively increases over time., which made the ambient air and fire smoke fully exchange, and the air suction was further accelerated. On the other hand, with the reduction in frictional resistance and local resistance, the air inflow and smoke outflow were accelerated, and the rate of the entrained air increased, which further accelerated the temperature decay.
(2)
Mass flow distribution after longitudinal position change of 5 MW fires
As depicted in Figure 6, as the fire moved toward one of the tunnel openings (Figure 6a–d), the mass flow rate of the exhaust smoke gradually decreased. This was due to the ongoing influence of the stack effect upstream of the fire source, which accelerated the movement of smoke toward one opening. As the distance to the opening shortened, the stack effect became more pronounced, causing the mass flow rate of the exhaust smoke to continuously decrease. From the perspective of the mass flow rate of air, a local maximum consistently occurred at the corner between the 200 m horizontal tunnel section and the inclined tunnel section. This was due to the higher local resistance at the corner, which hindered the airflow and caused air to accumulate at this location.
(3)
Changes in heat transfer proportion under the influence of induced airflow
Ingason found that ventilation caused the heat transfer mechanism in tunnels to change, and the proportion of convective heat transfer would increase [2]; he assumed that 2/3 of the HRR in tunnels with low-speed ventilation effects came from convective heat transfer, and by using two different wood stacks as fuel to carry out experiments, he found that the dimensionless excess temperature (Equation (2)) was stable at 3.1–3.75, with only a few points lower than 3. He concluded that ventilation had a huge impact on the T m a x when HRR was relatively small or when the ventilation rate was too large, at that moment the dimensionless excess temperature would be below 3. The Δ T a v g , f was measured after the values at all measurement points stabilized. In this study, the values at the measurement points stabilized after 300 s, and data from 350 s to 450 s were selected for subsequent analysis.
Δ T a v g , f T a = 2 3 Q ˙ m a x m ˙ a c p T a
According to the model established by Ingason, the authors established the T m a x / T and Q * in both the horizontal tunnel section and inclined tunnel section (Figure 7). It could be observed that when the fire was located in the horizontal tunnel section, the Δ T a v g , f / T a consistently fell within the range of 3 to 4, with the inclination angle had little impact. However, when the fire was in the inclined tunnel section, most of the Δ T a v g , f / T a values were below 3, with a few approaching 3. In this case, the slope of the inclined tunnel section became the key influencing factor. As the slope of the incline increased, the induced airflow became stronger, and the Δ T a v g , f / T a approached 2.
This phenomenon occurred due to the simultaneous increase in inclination angle and the left side opening being closer to the fire. The exhaust velocity and incoming airflow velocity increased significantly, resulting in a stronger induced airflow, and the convective heat transfer ratio increased, which can notably affect the T m a x of the fire. Therefore, it may be deduced that airflow influenced the T m a x in inclined tunnels in underwater tunnels and ventilation had a negligible impact on the T m a x in horizontal tunnel sections.
Building upon the aforementioned research findings, the induced airflow could be classified into two categories, strong and weak, under varying conditions. Under strong induced airflow, the fresh air from the tunnel opening enhanced convective heat transfer and caused a certain inclination of the flame angle. Under weak induced airflow, heat accumulated inside the tunnel, and the proportion of radiative heat transfer increased. The heat transfer mechanisms differed significantly in both cases, requiring separate predictive models to analyze temperature field changes. Additionally, further analysis revealed that the critical transition point between strong and weak induced airflow was located near the angle. When the fire was in the inclined tunnel section with a small inclination angle or in the horizontal tunnel section, the critical transition point was above the angle. This also explained why some points were slightly above 3 under the 3% condition. However, as the inclination angle increased, the critical transition point gradually shifted closer to the fire-source side. Therefore, all points in the 4% and 5% inclined sections were below 3, indicating the influence of strong induced airflow.

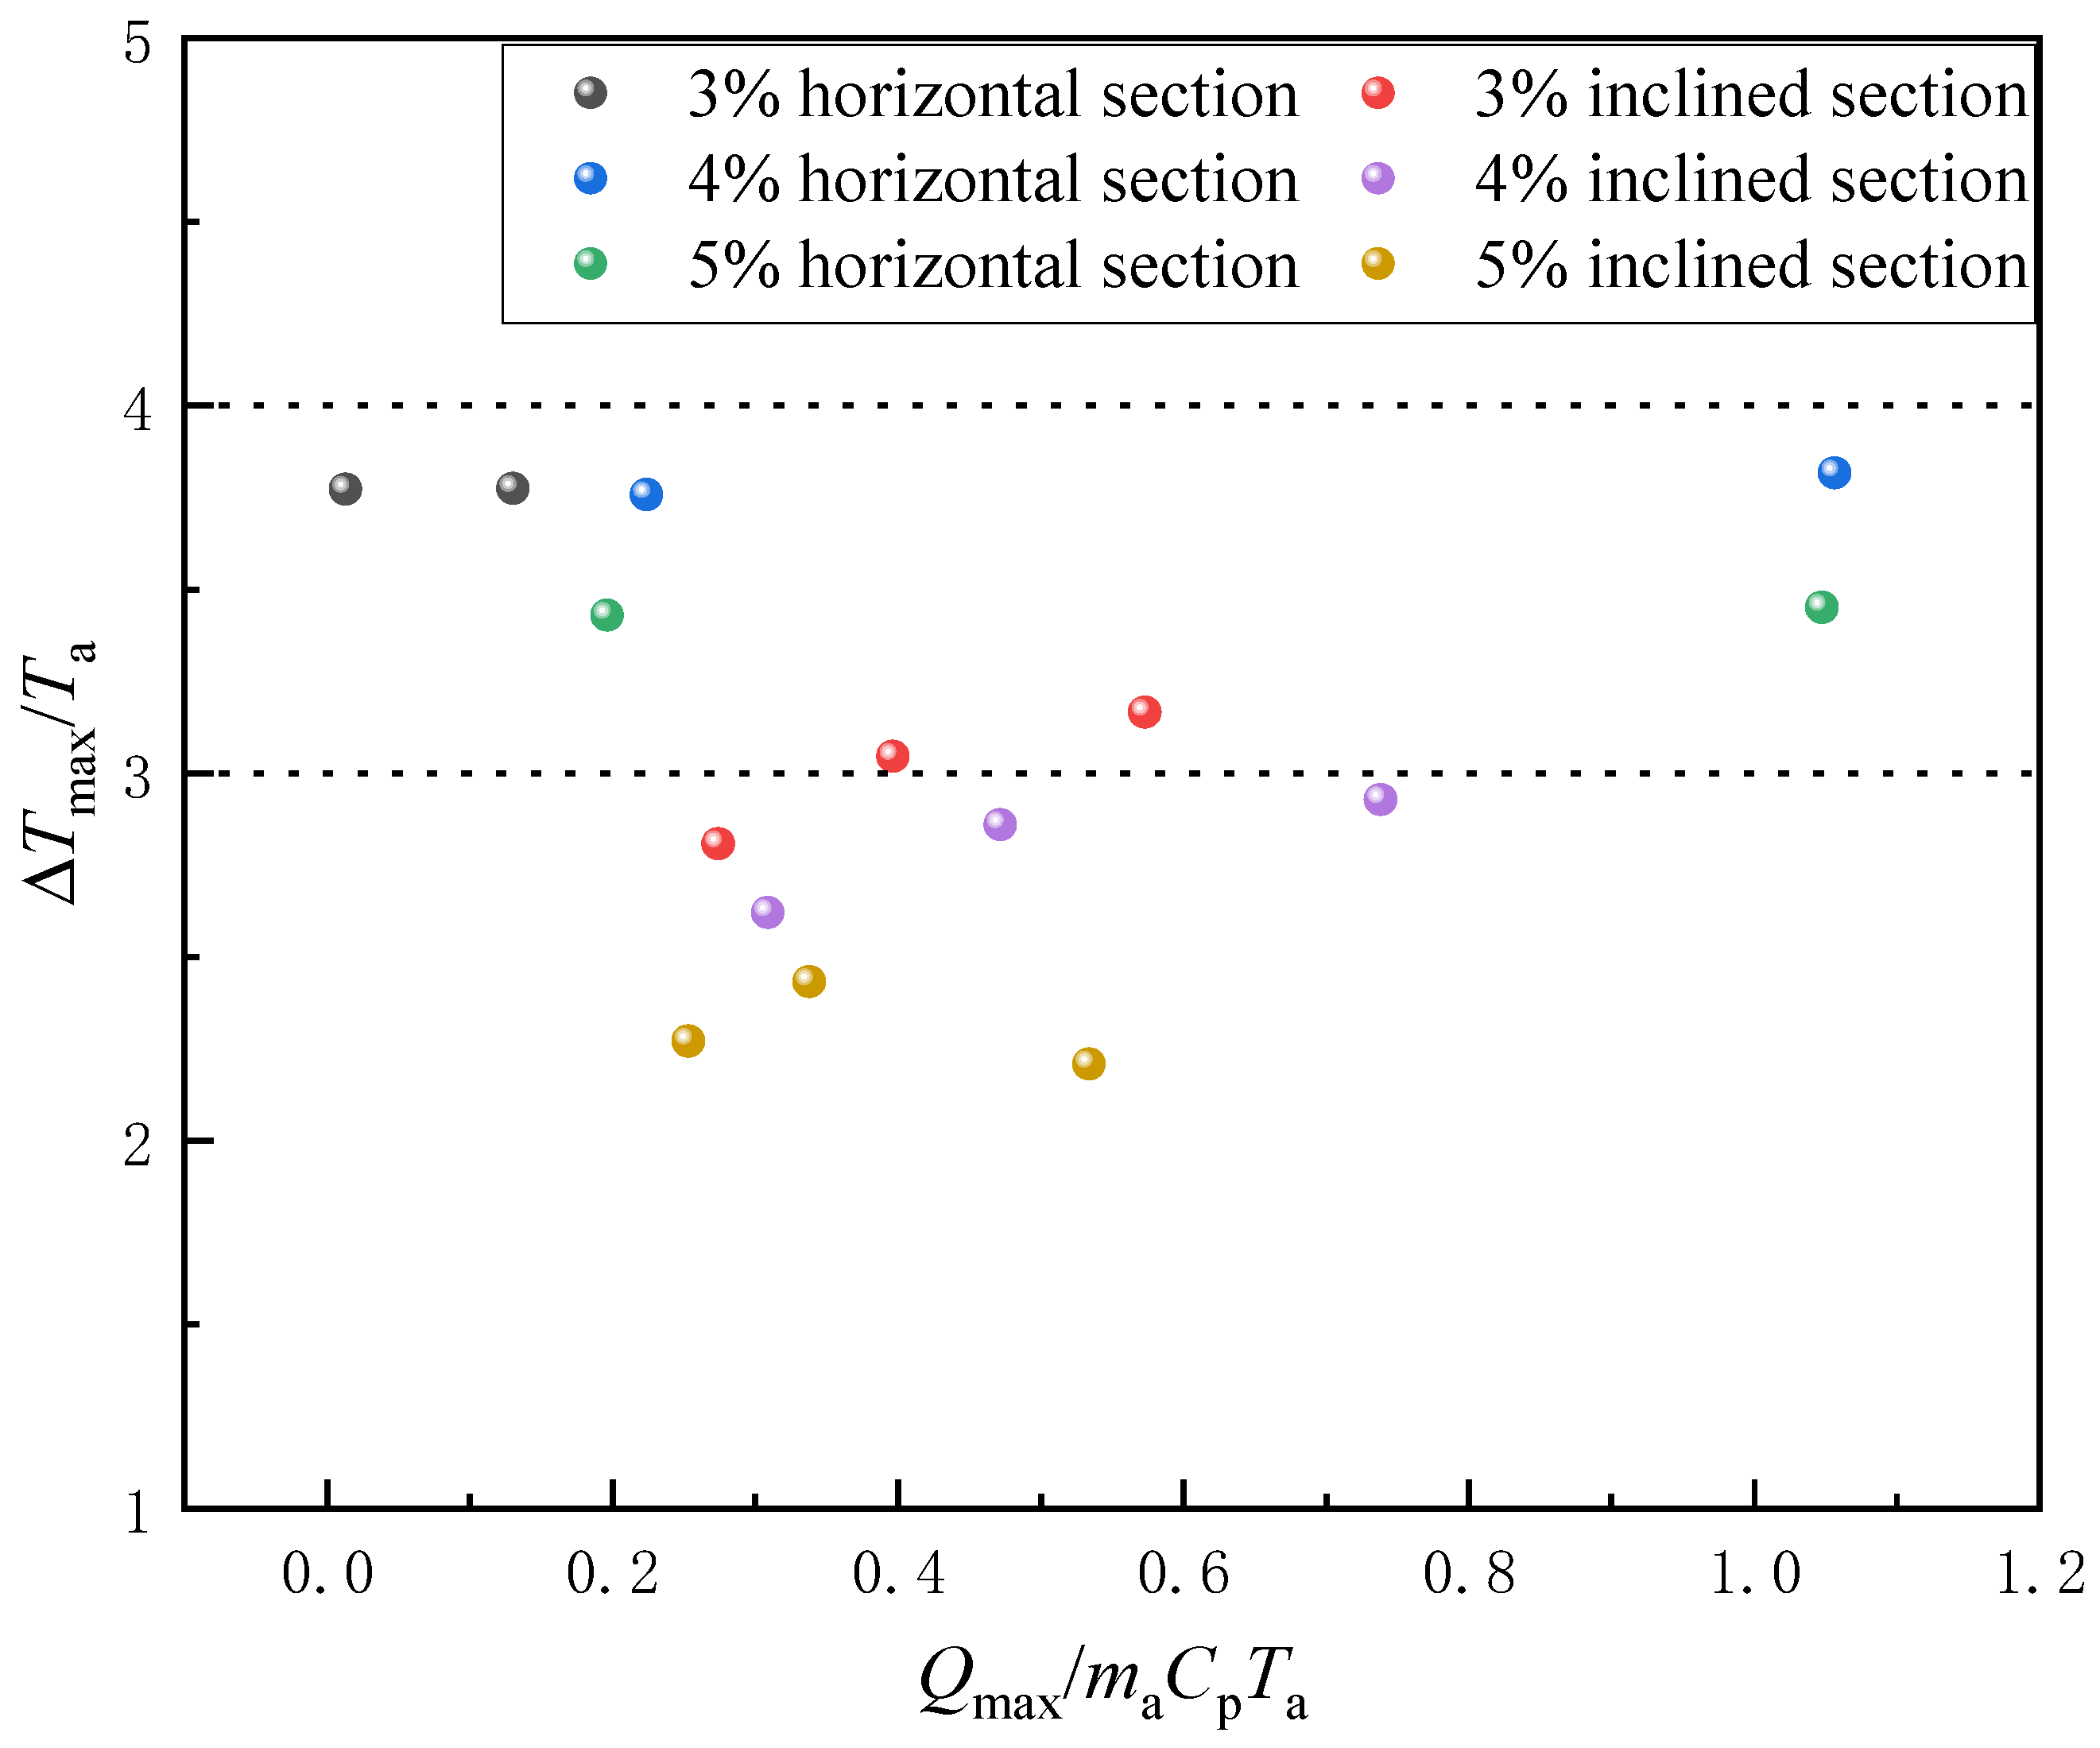
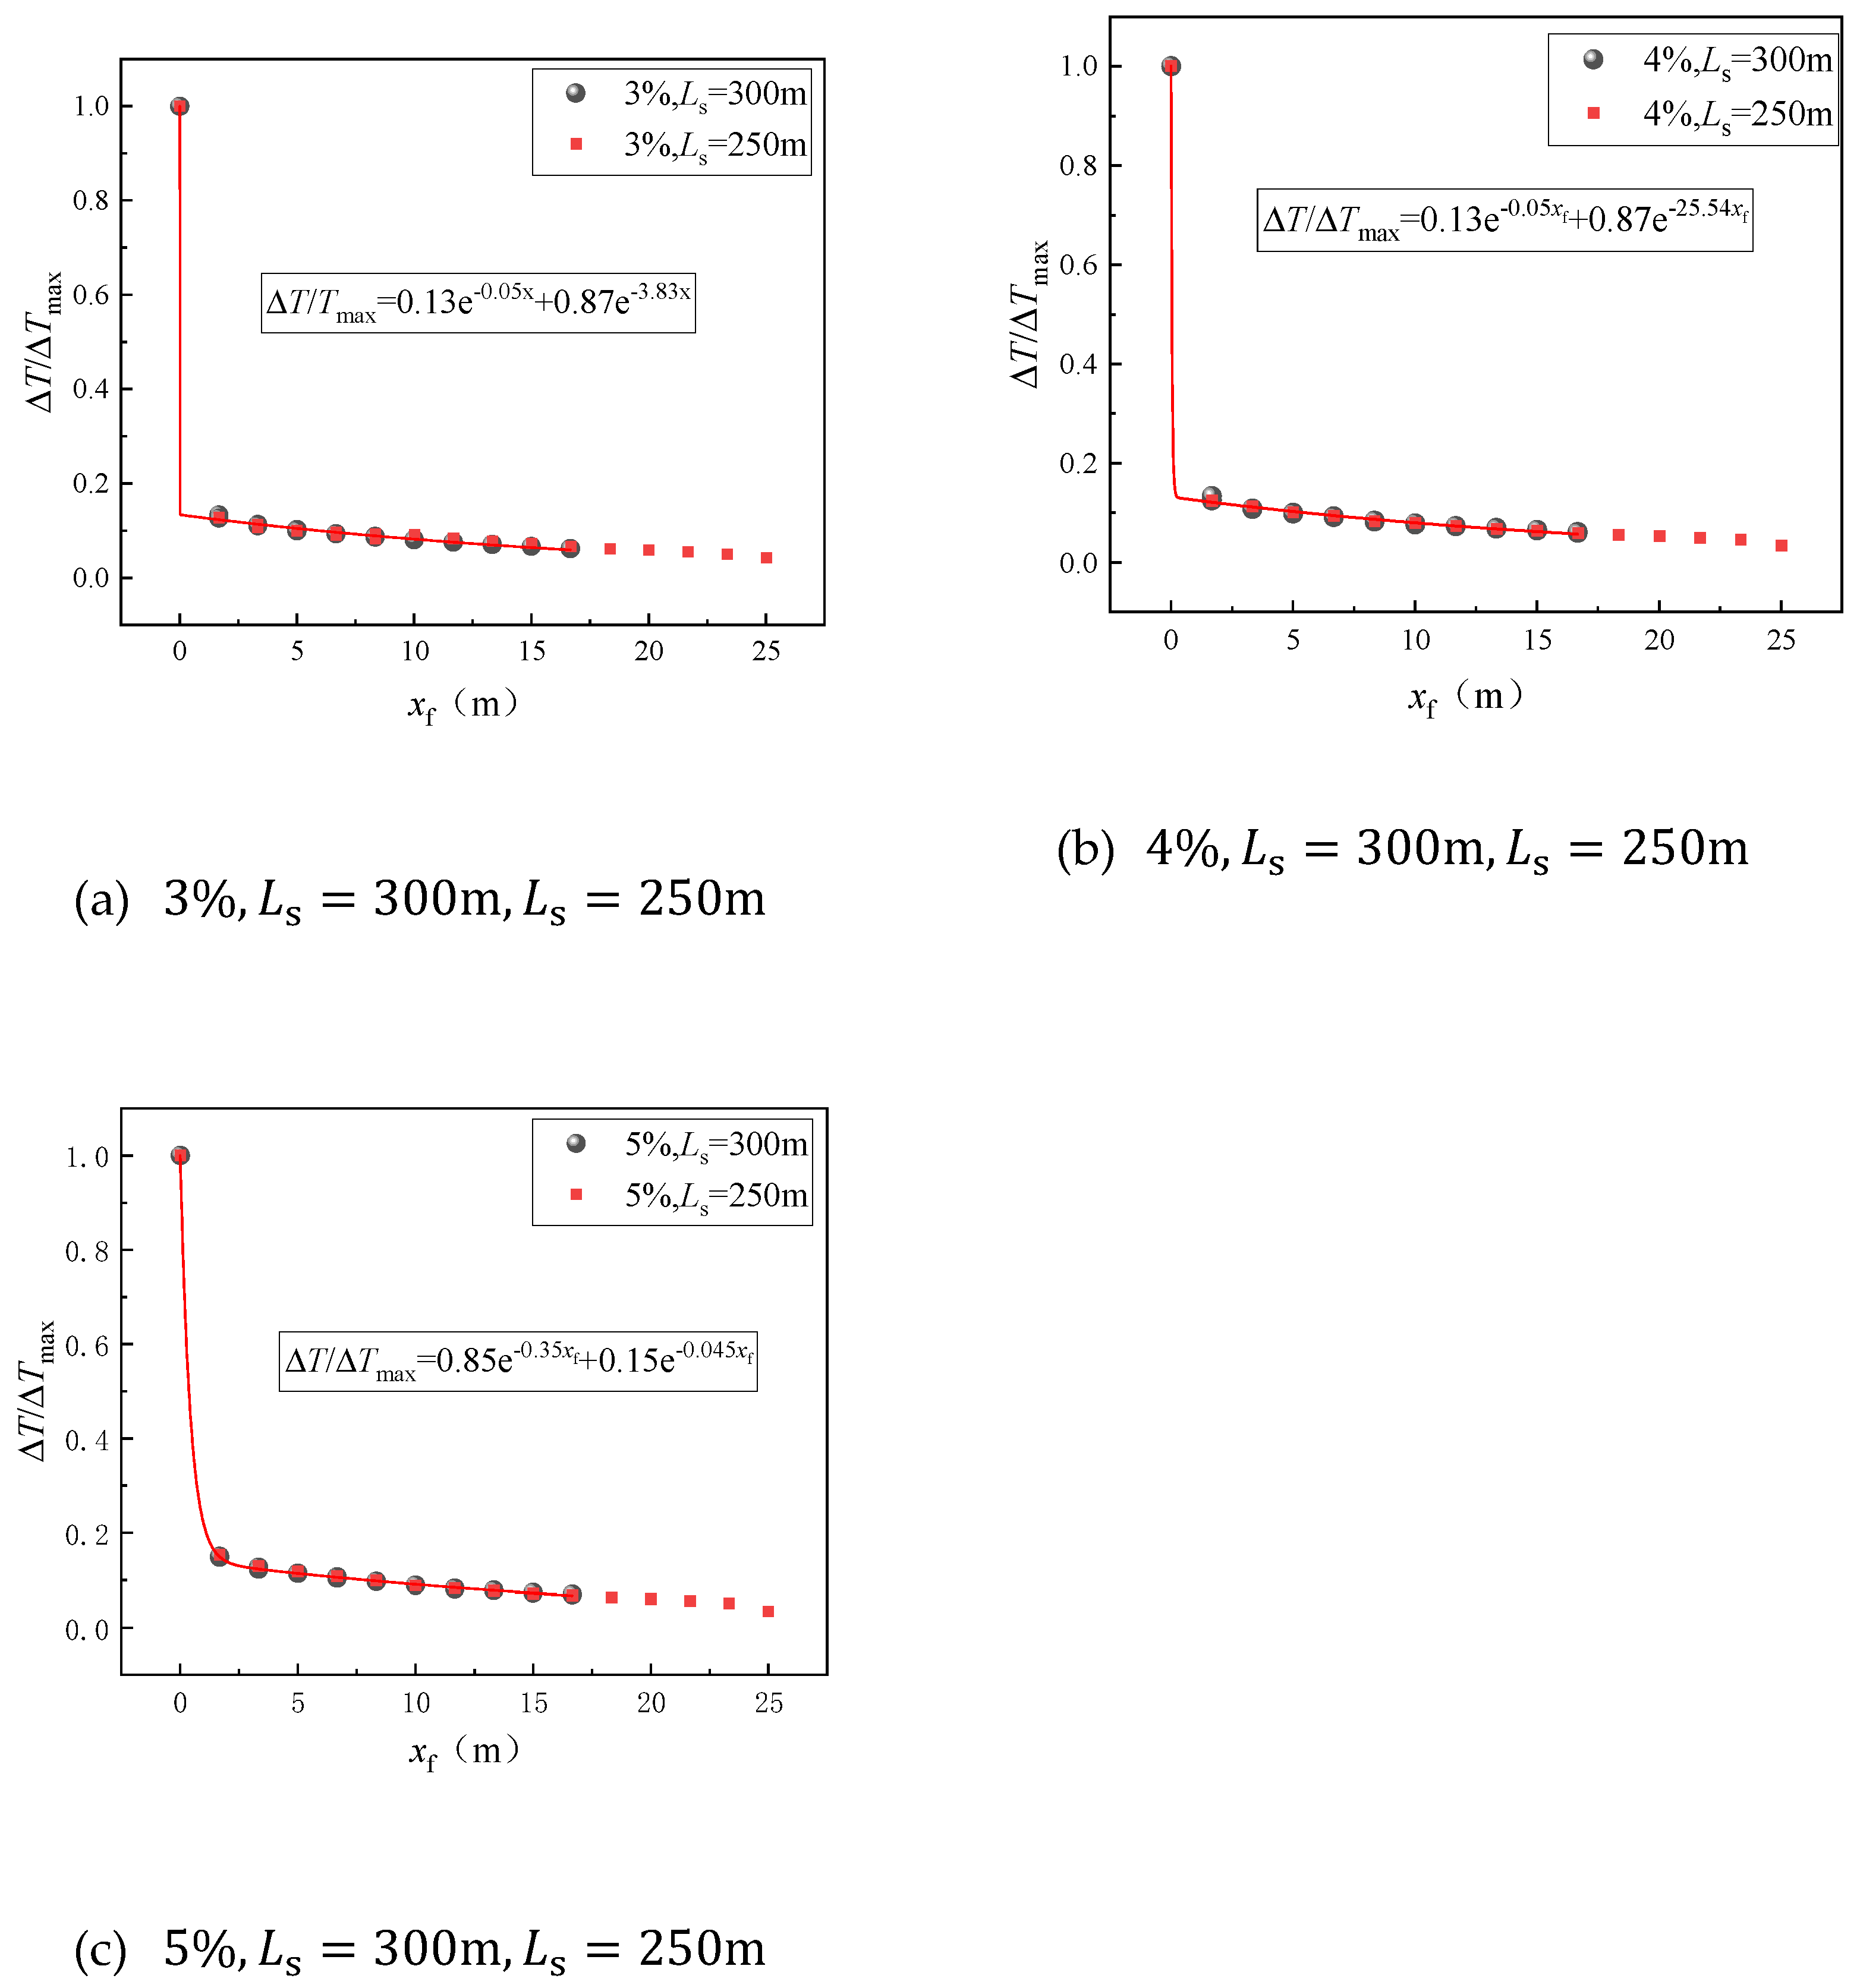
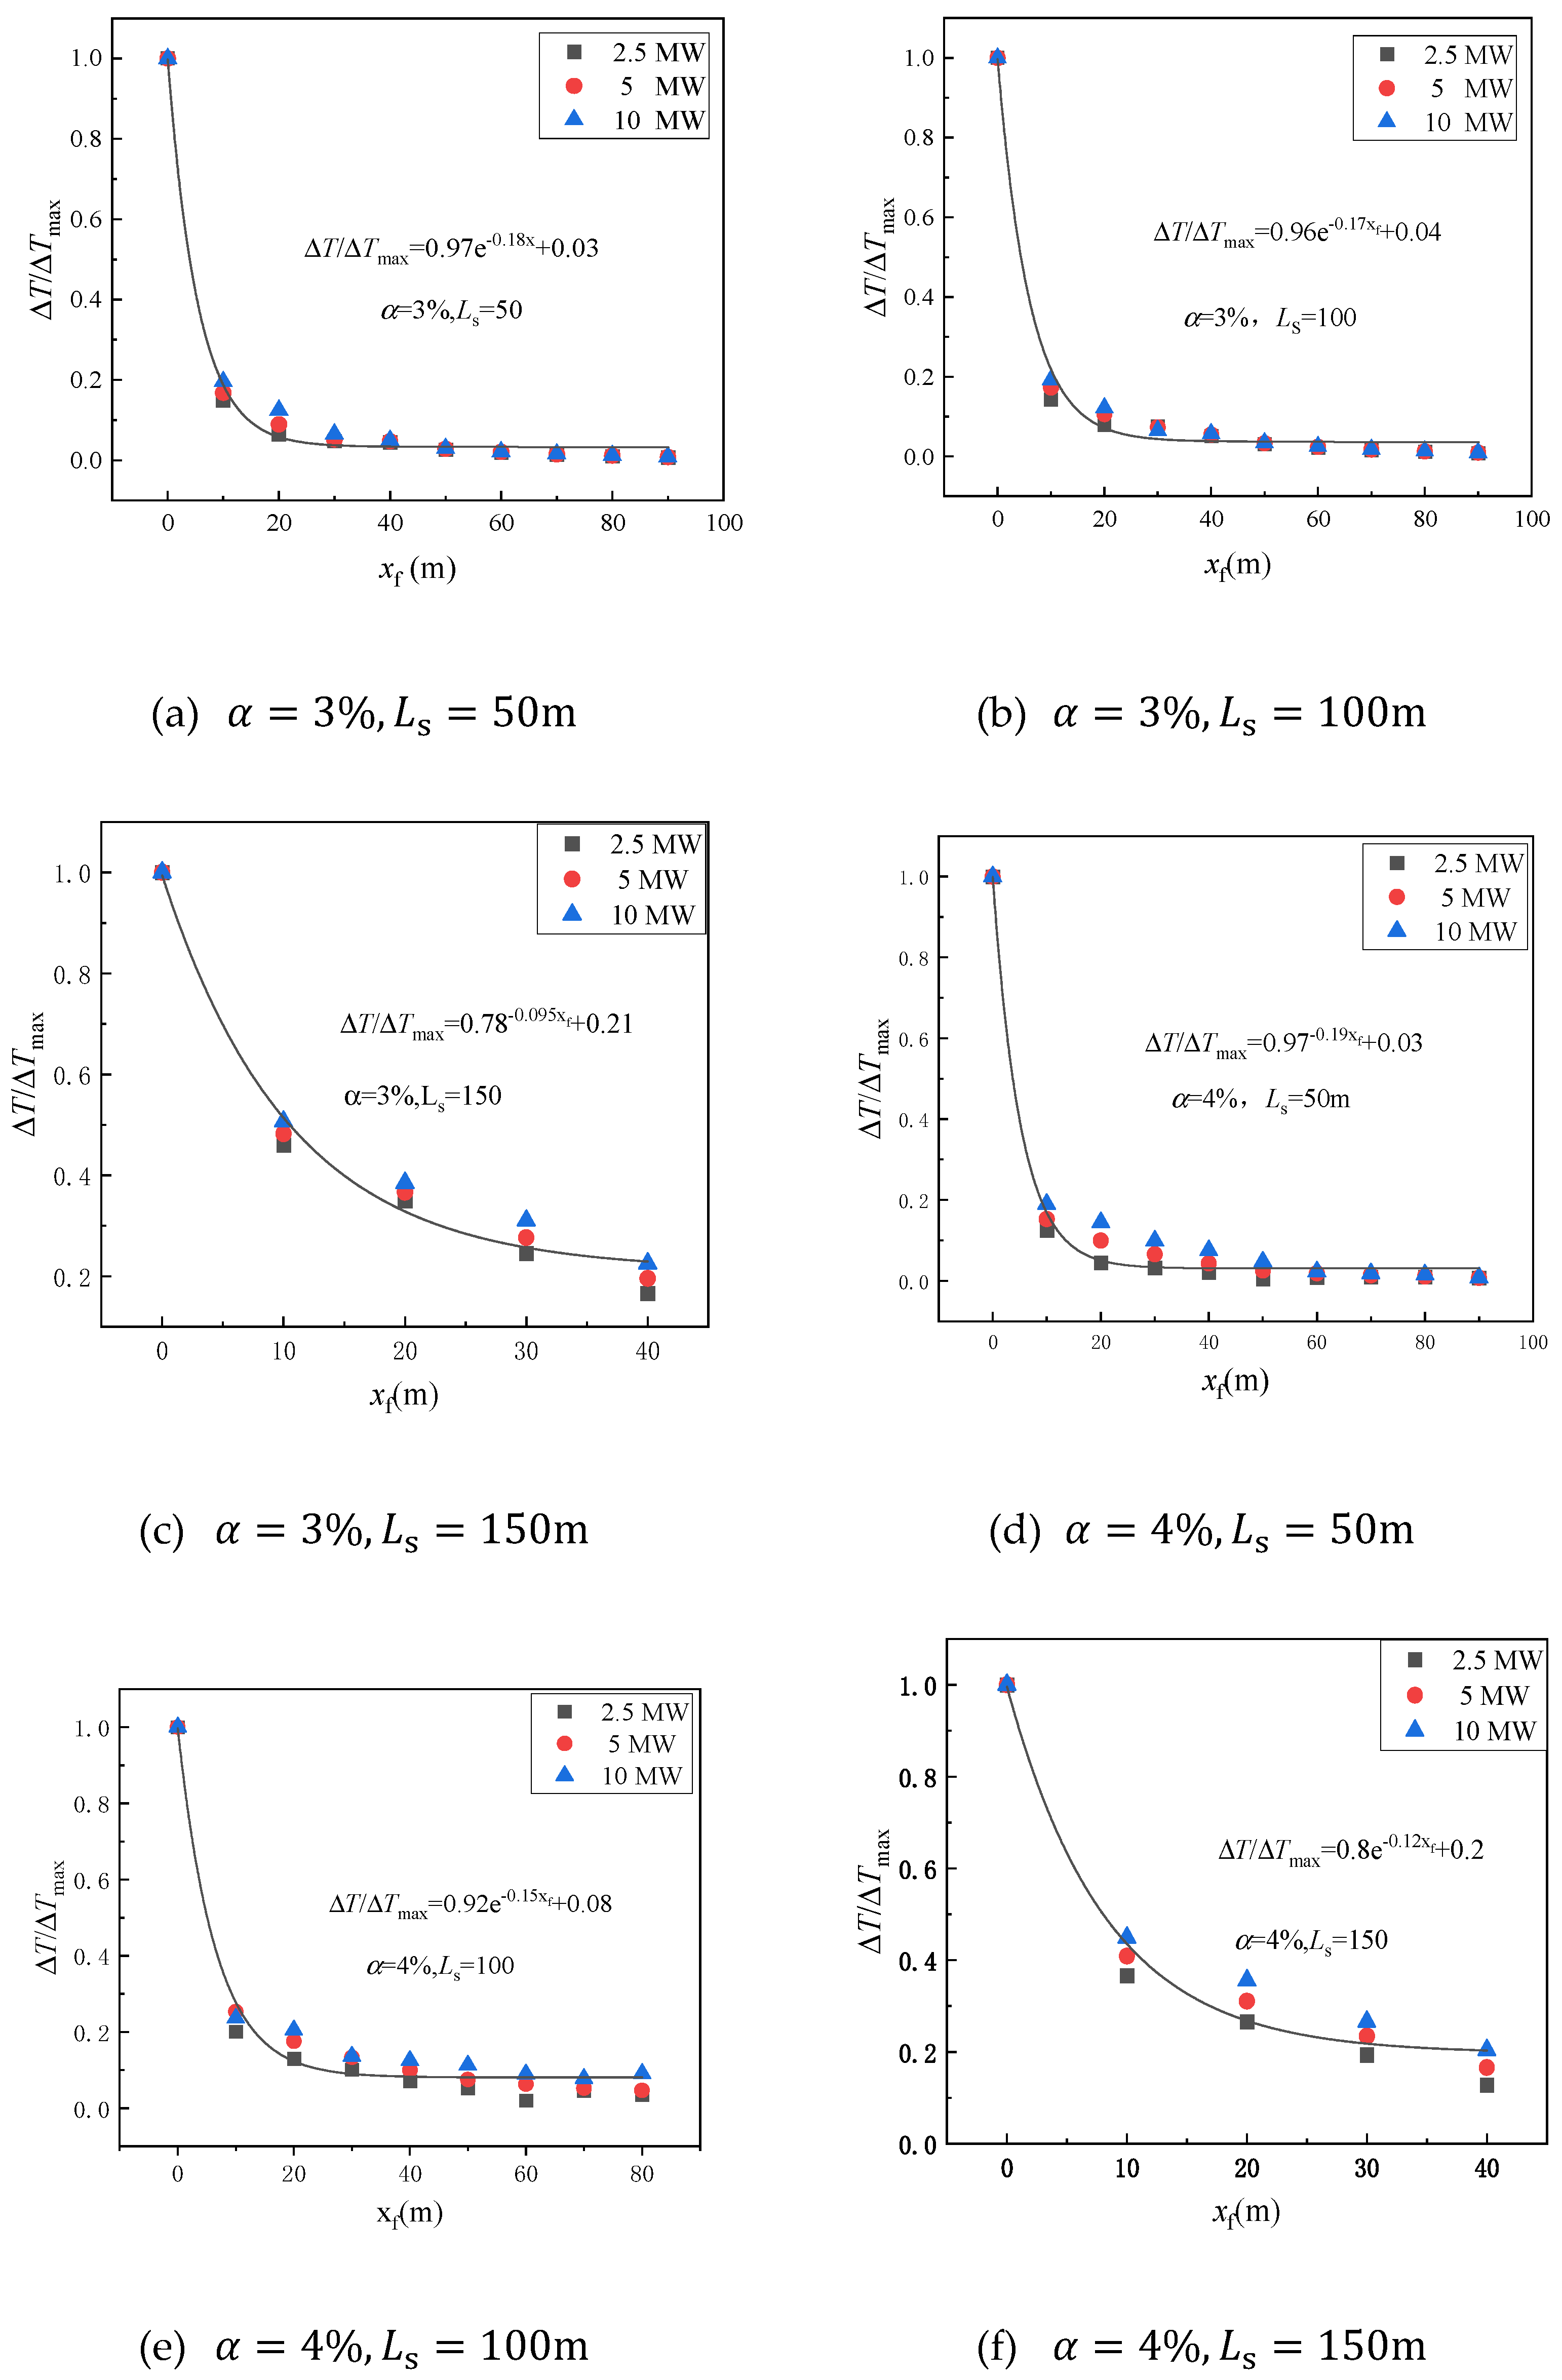
3.2. Temperature Field Under the Influence of Weak Induced Airflow

(1)
Maximum excess temperature under weak induced airflow
Zhu and Tang et al. examined the T m a x under the tunnel ceiling in relation to various vents and HRRs of the fire with lateral exhaust by conducting reduced-scale experiments and proposed a maximum excess temperature model [26]:
Δ T m a x = 15.2 Q ˙ 2 / 3 / H e f 5 / 3
Ming et al. analyzed the impact of various lateral smoke exhaust velocities on the temperature field of the tunnel ceiling during tunnel fires and put out a comparable theoretical framework [27]:
Δ T m a x ( v ) = 0.32 v * + 0.98 15.7 Q ˙ 2 / 3 H e f 5 / 3
It could be found from the previous research results that for the T m a x of the horizontal tunnel, although different working conditions presented different prediction models, the main part of the prediction model was still Q ˙ 2 / 3 / H e f 5 / 3 . Figure 8 displays the T m a x in the horizontal tunnel section at various longitudinal locations with varying HRRs, and the empirical relationship equation for the forecast of the maximum excess temperature was obtained through fitting as follows:
Δ T m a x = 28.4 Q ˙ 2 / 3 H e f 5 / 3 + 150.76
Under the influence of weak induced airflow, the primary factor affecting the maximum temperature rise was the HRR of the fire source. However, as the slope increased, the local resistance between the horizontal and inclined sections became larger, leading to a more pronounced accumulation of induced airflow, which affected the prediction of the maximum temperature rise.
(2)
Longitudinal temperature decay under weak induced airflow
To address the small impact of ventilation on temperature decay in horizontal tunnels, Ingason proposed that the tunnel’s longitudinal temperature decrease exhibits a double-exponential model [2]. Based on this research result, we proposed a model for T :
Δ T ( x ) Δ T m a x = a e b x f H + ( 1 a ) e c x f H
x f is the separation between the fire (m), H is the height of the tunnel, and there are three constant unknowns, a, b, and c. Through an examination of the horizontal tunnel section’s longitudinal temperature at various inclinations, an empirical model of T ( x ) / T m a x and the separation from the fire is established, and the key parameter was fitted (Figure 9). The average coefficients for each operating condition were obtained.
Δ T Δ T m a x = 0.3718 e 0.1497 x f + 0.6282 e 9.802 x f
To further validate the model’s reliability, the predictive model was compared with the reduced-scale experimental results by Ingason et al. and the full-scale experiments from the Runehamar Tunnel. In particular, Ingason et al. conducted experiments using a 1:23 scaled tunnel model, with wood cribs as the fuel source. They investigated the effects of longitudinal ventilation on key parameters such as the heat release rate (HRR) of the fire source, temperature distribution, flame height, and backlayering length [2]. Based on their findings, they proposed predictive models that have been extensively cited and validated by subsequent researchers. These two experimental results have been verified by numerous scholars and widely accepted. From Figure 10, it could be observed that both sets of data align well with the predictive model, with the error controlled within an acceptable range. Bringing in the previous maximum excess temperature model, the following is the empirical equation that may be used to forecast the temperature decrease in the horizontal tunnel section:
Δ T = 15.2 Q ˙ 2 / 3 H e f 5 / 3 0.3718 e 0.15 x f + 0.6282 e 9.8 x f
To make the obtained results more applicable, the variable x f in the model is replaced with the dimensionless form x f / H , where H is the tunnel height. As a result, Equation (8) can be rewritten as Equation (9):
Δ T = 15.2 Q ˙ 2 / 3 H e f 5 / 3 0.3718 e 0.9 x f / H + 0.6282 e 58.8 x f / H
It should be noted that in Figure 10, a comparative analysis between the experimental data from Ingason et al. [2]. and the model predictions reveals that the experimental values are generally slightly lower than the predicted curve. This discrepancy arises from differences in the tunnel conditions. Ingason et al. conducted experiments in a reduced-scale tunnel, where airflow entered from both sides upstream and downstream of the fire source through openings, resulting in mixing between the air and smoke and consequently lower temperature [2]. In contrast, the scenario represented in Figure 10 assumes the fire source is located in a horizontal section of the tunnel under the influence of weak induced airflow. In this setup, the airflow enters the tunnel through openings in the inclined sections and reaches the fire location with reduced momentum. As a result, radiative heat transfer dominates within the tunnel, leading to a model prediction that is slightly higher than the experimental data of previous studies [2].

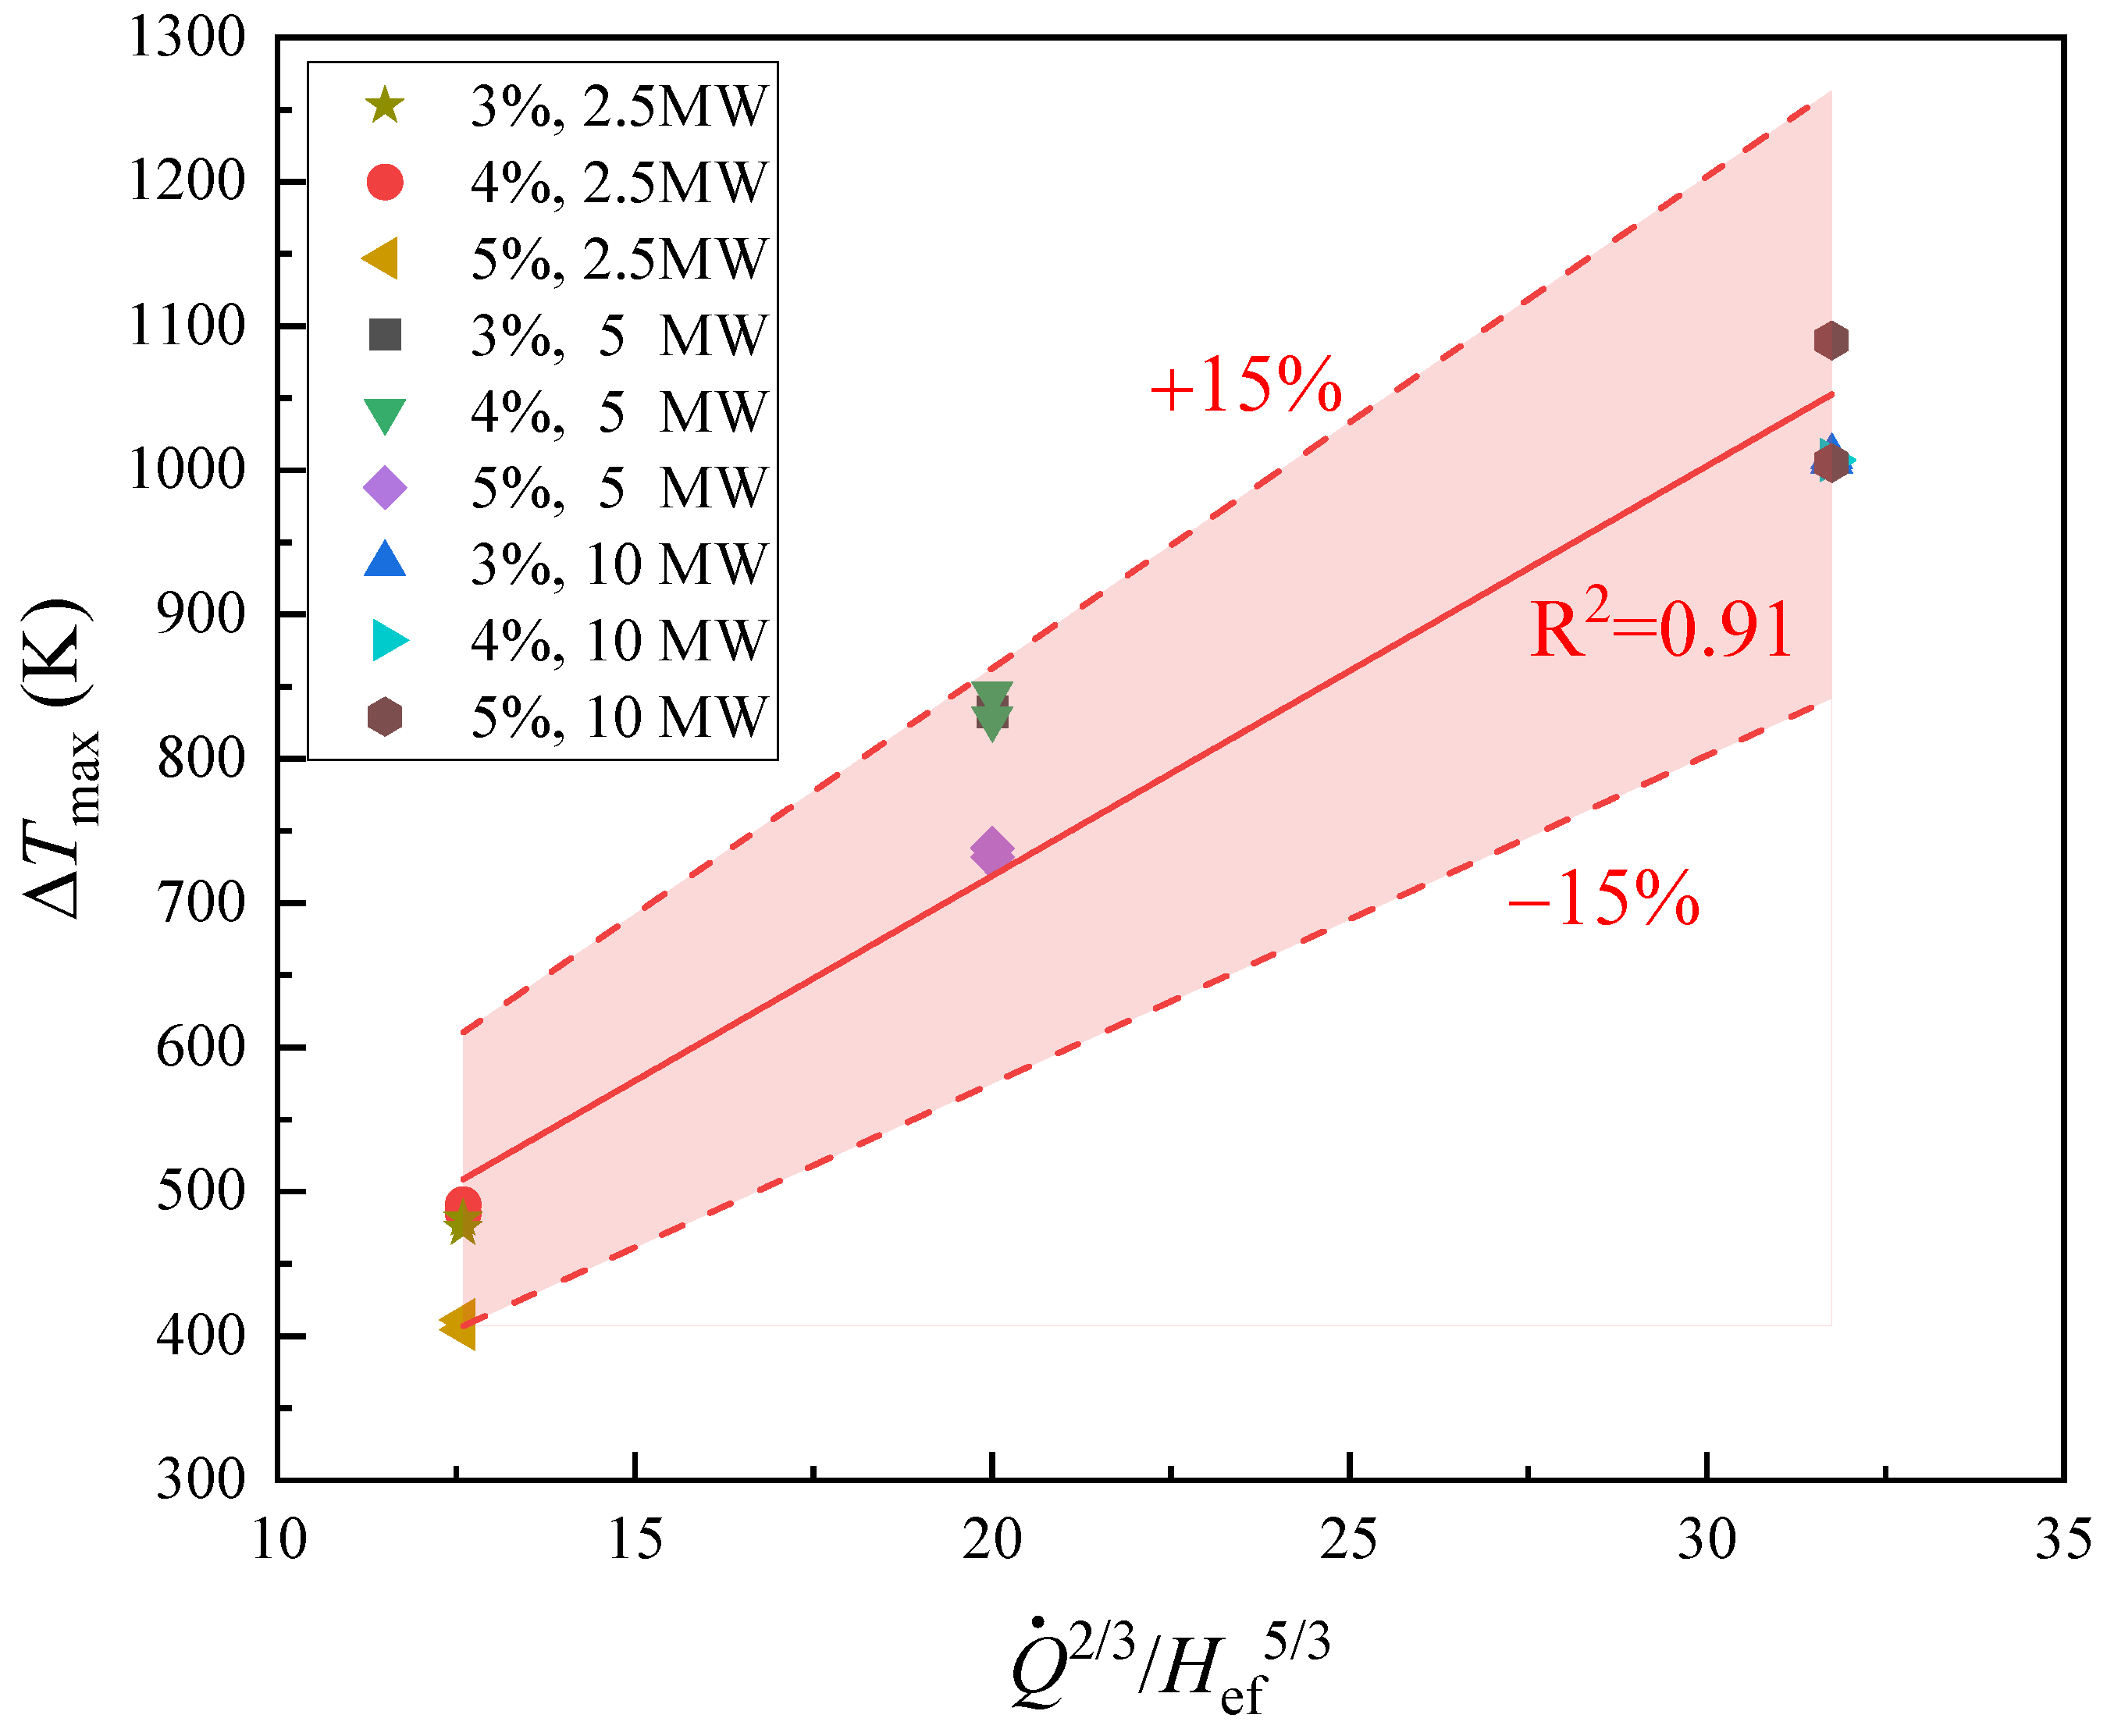
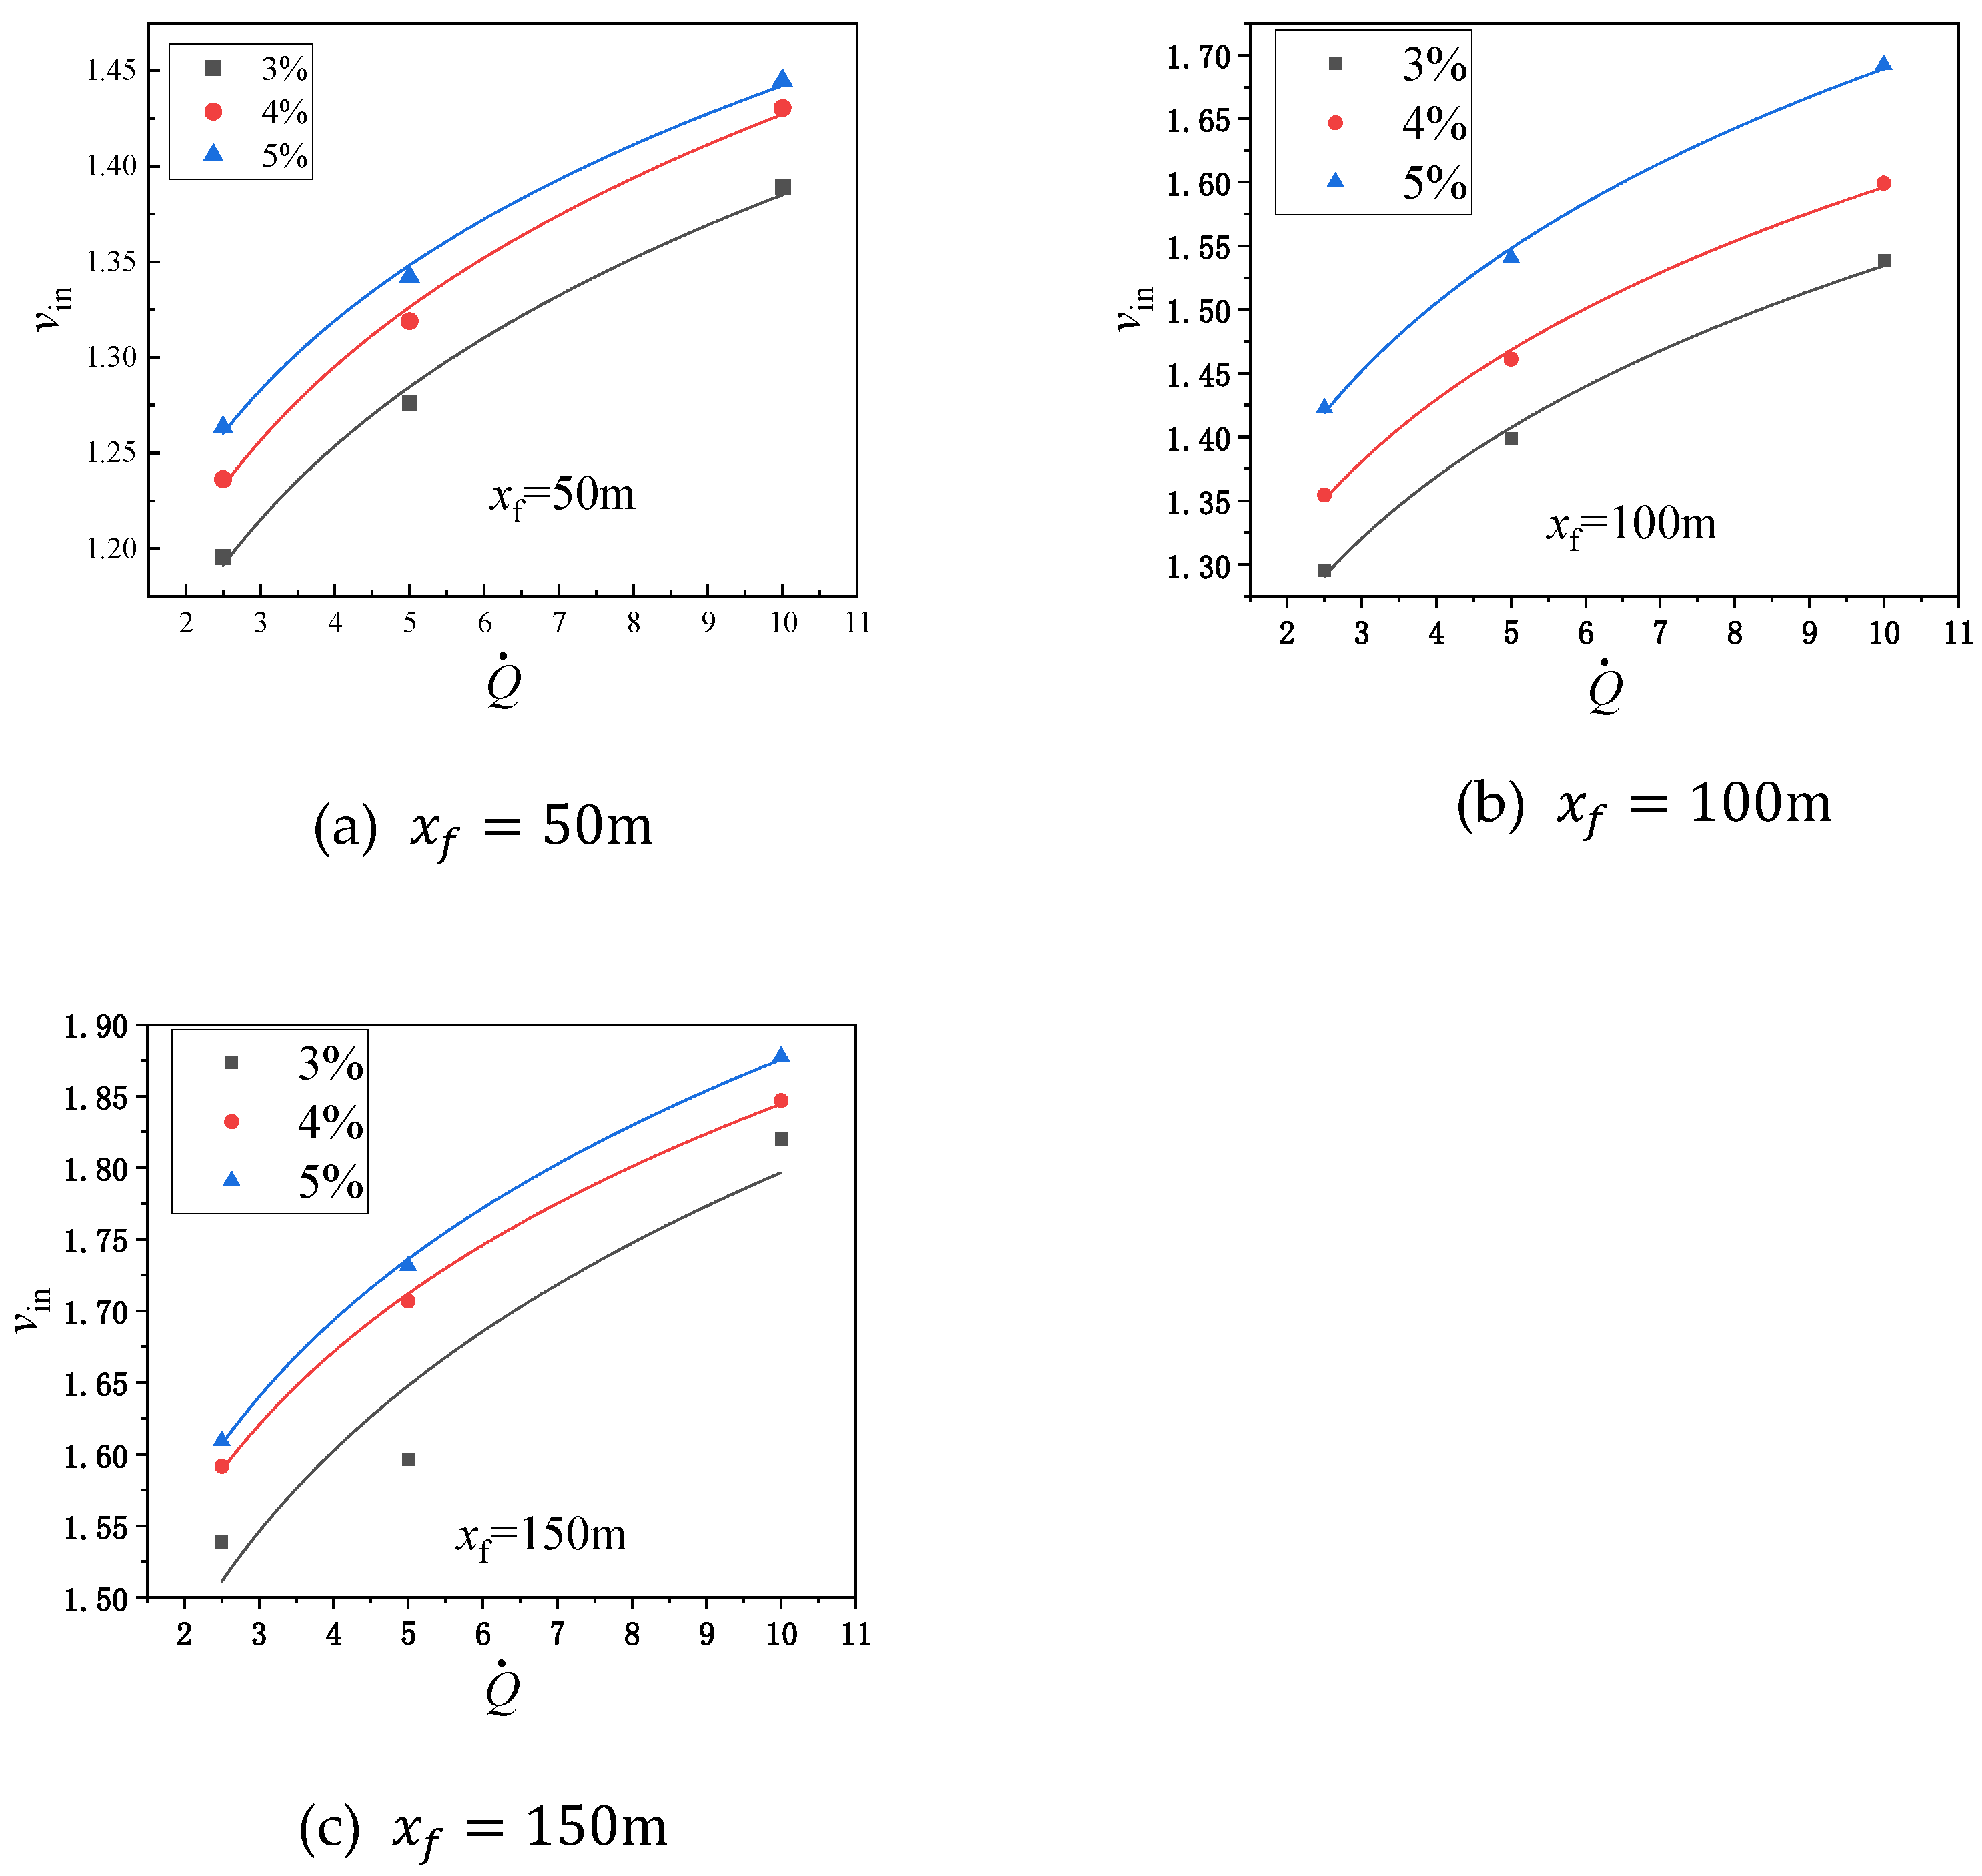
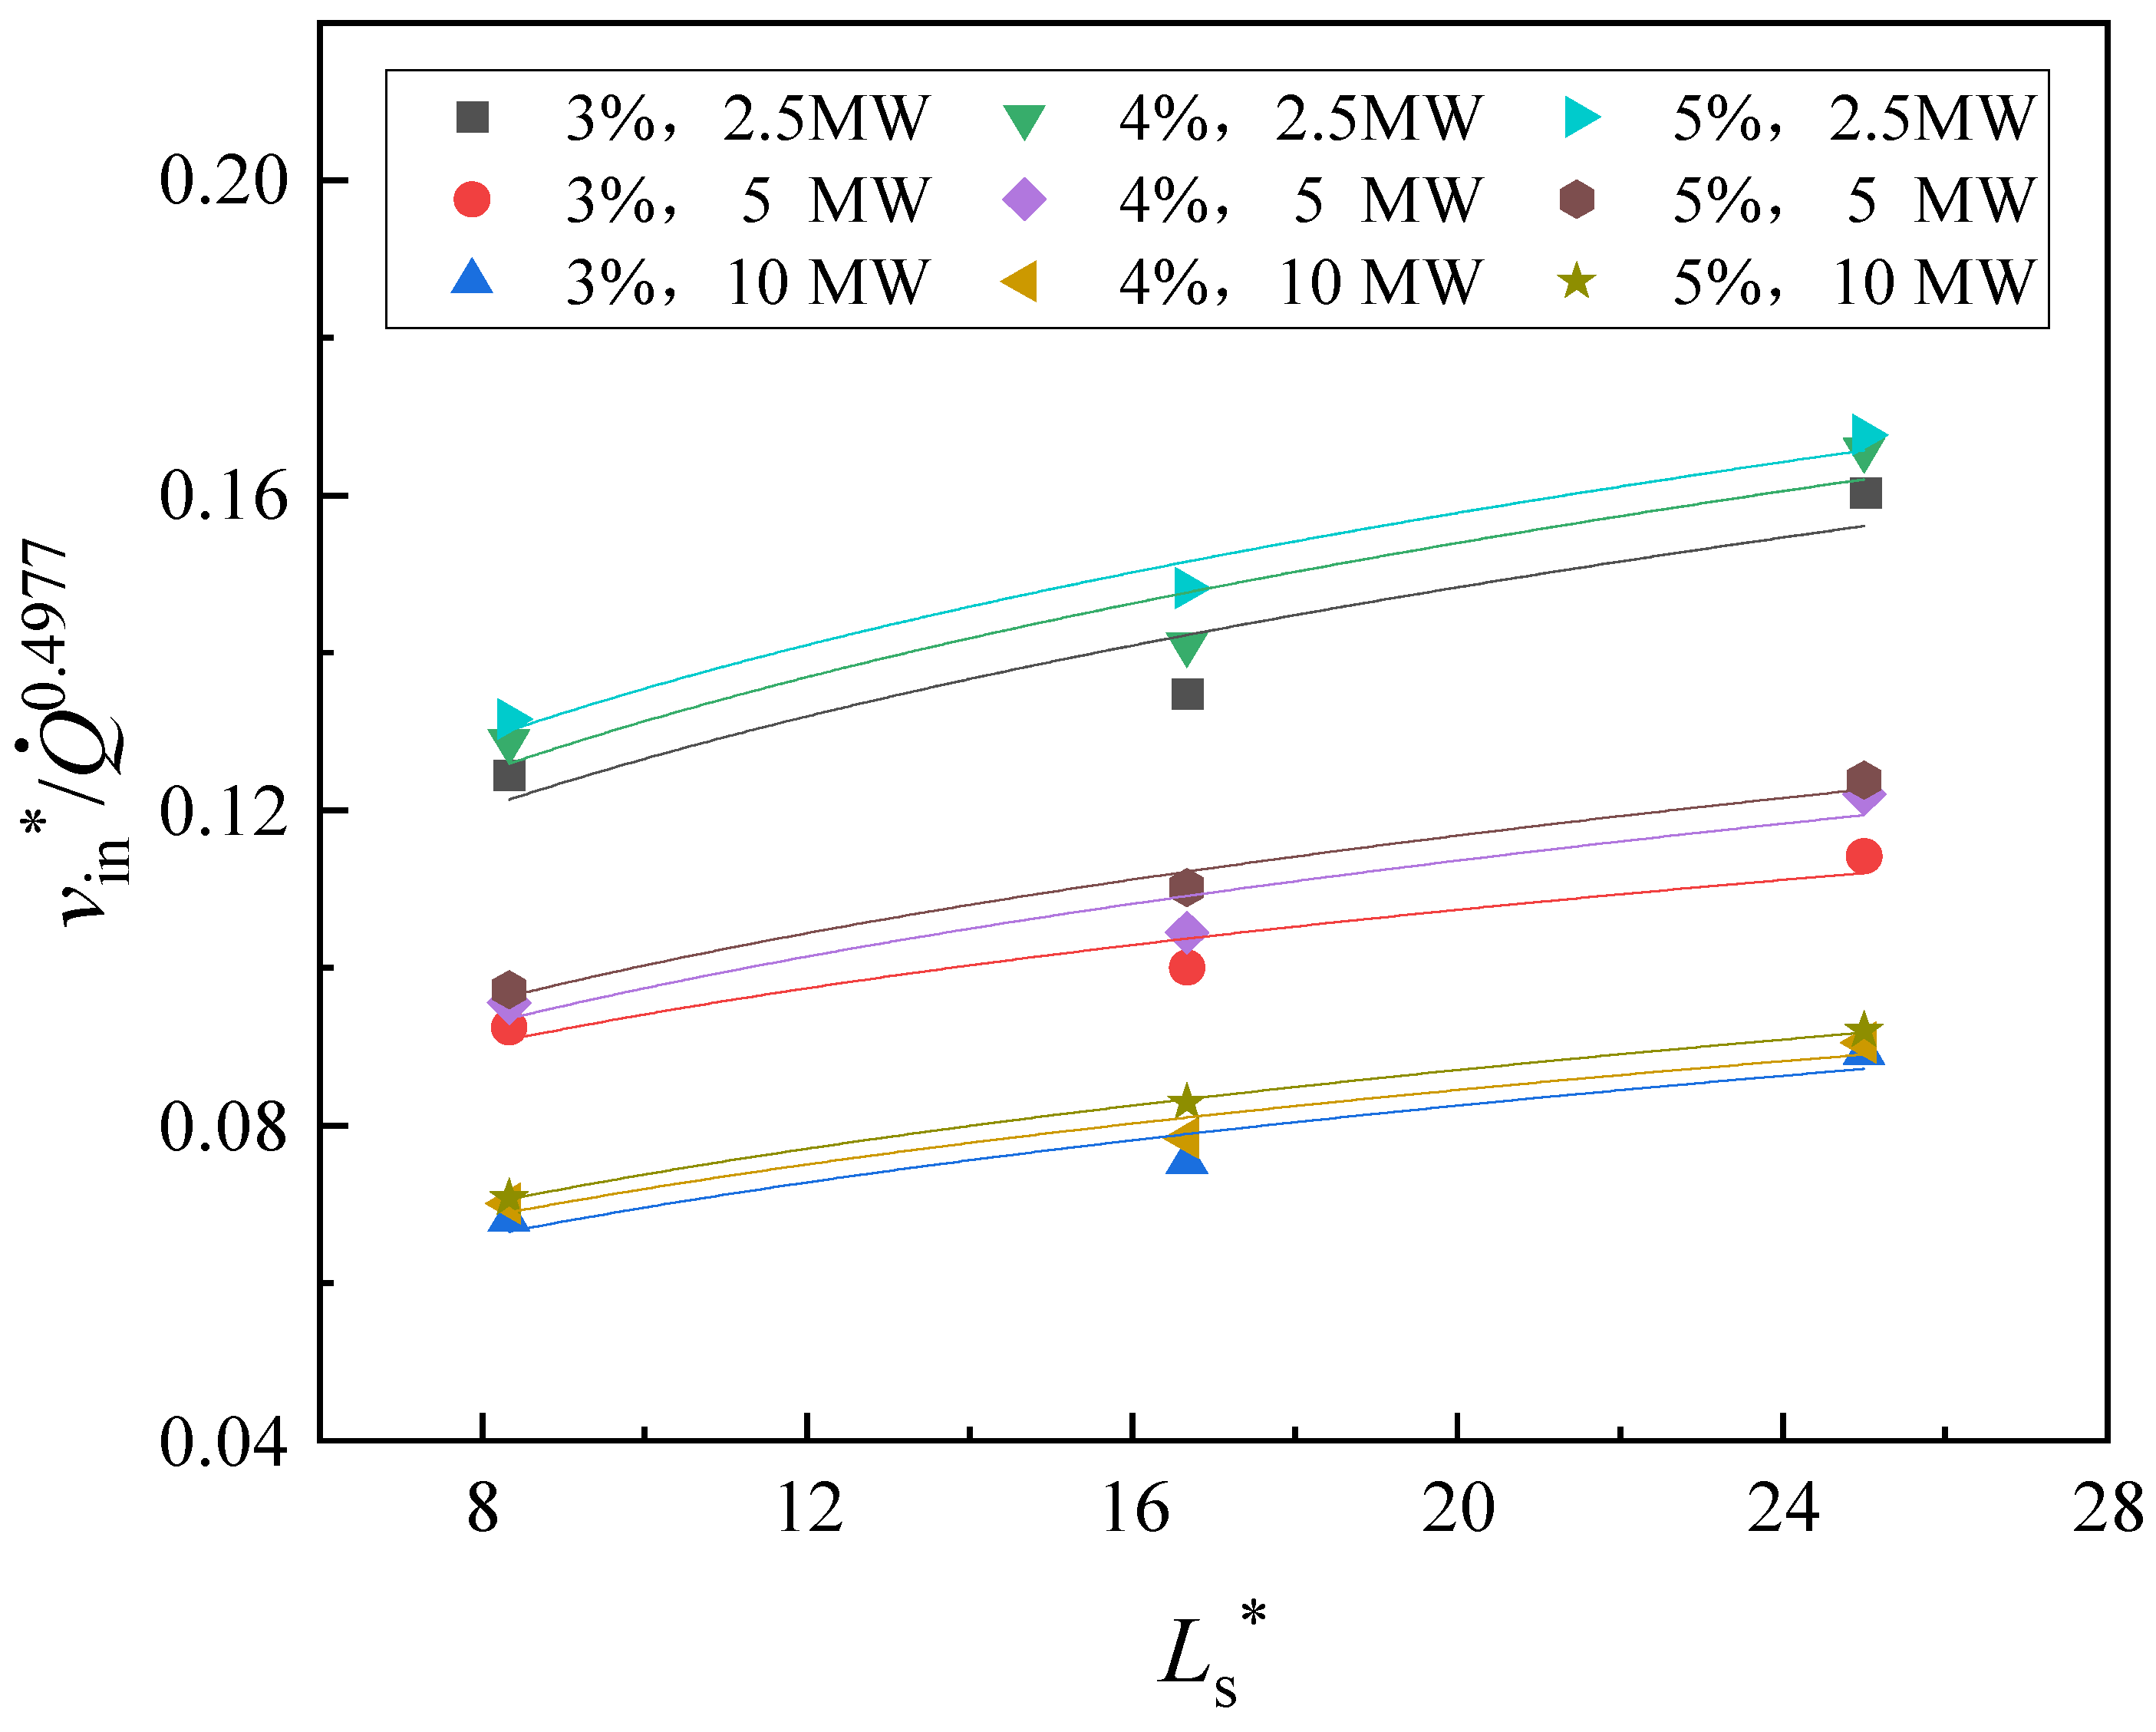
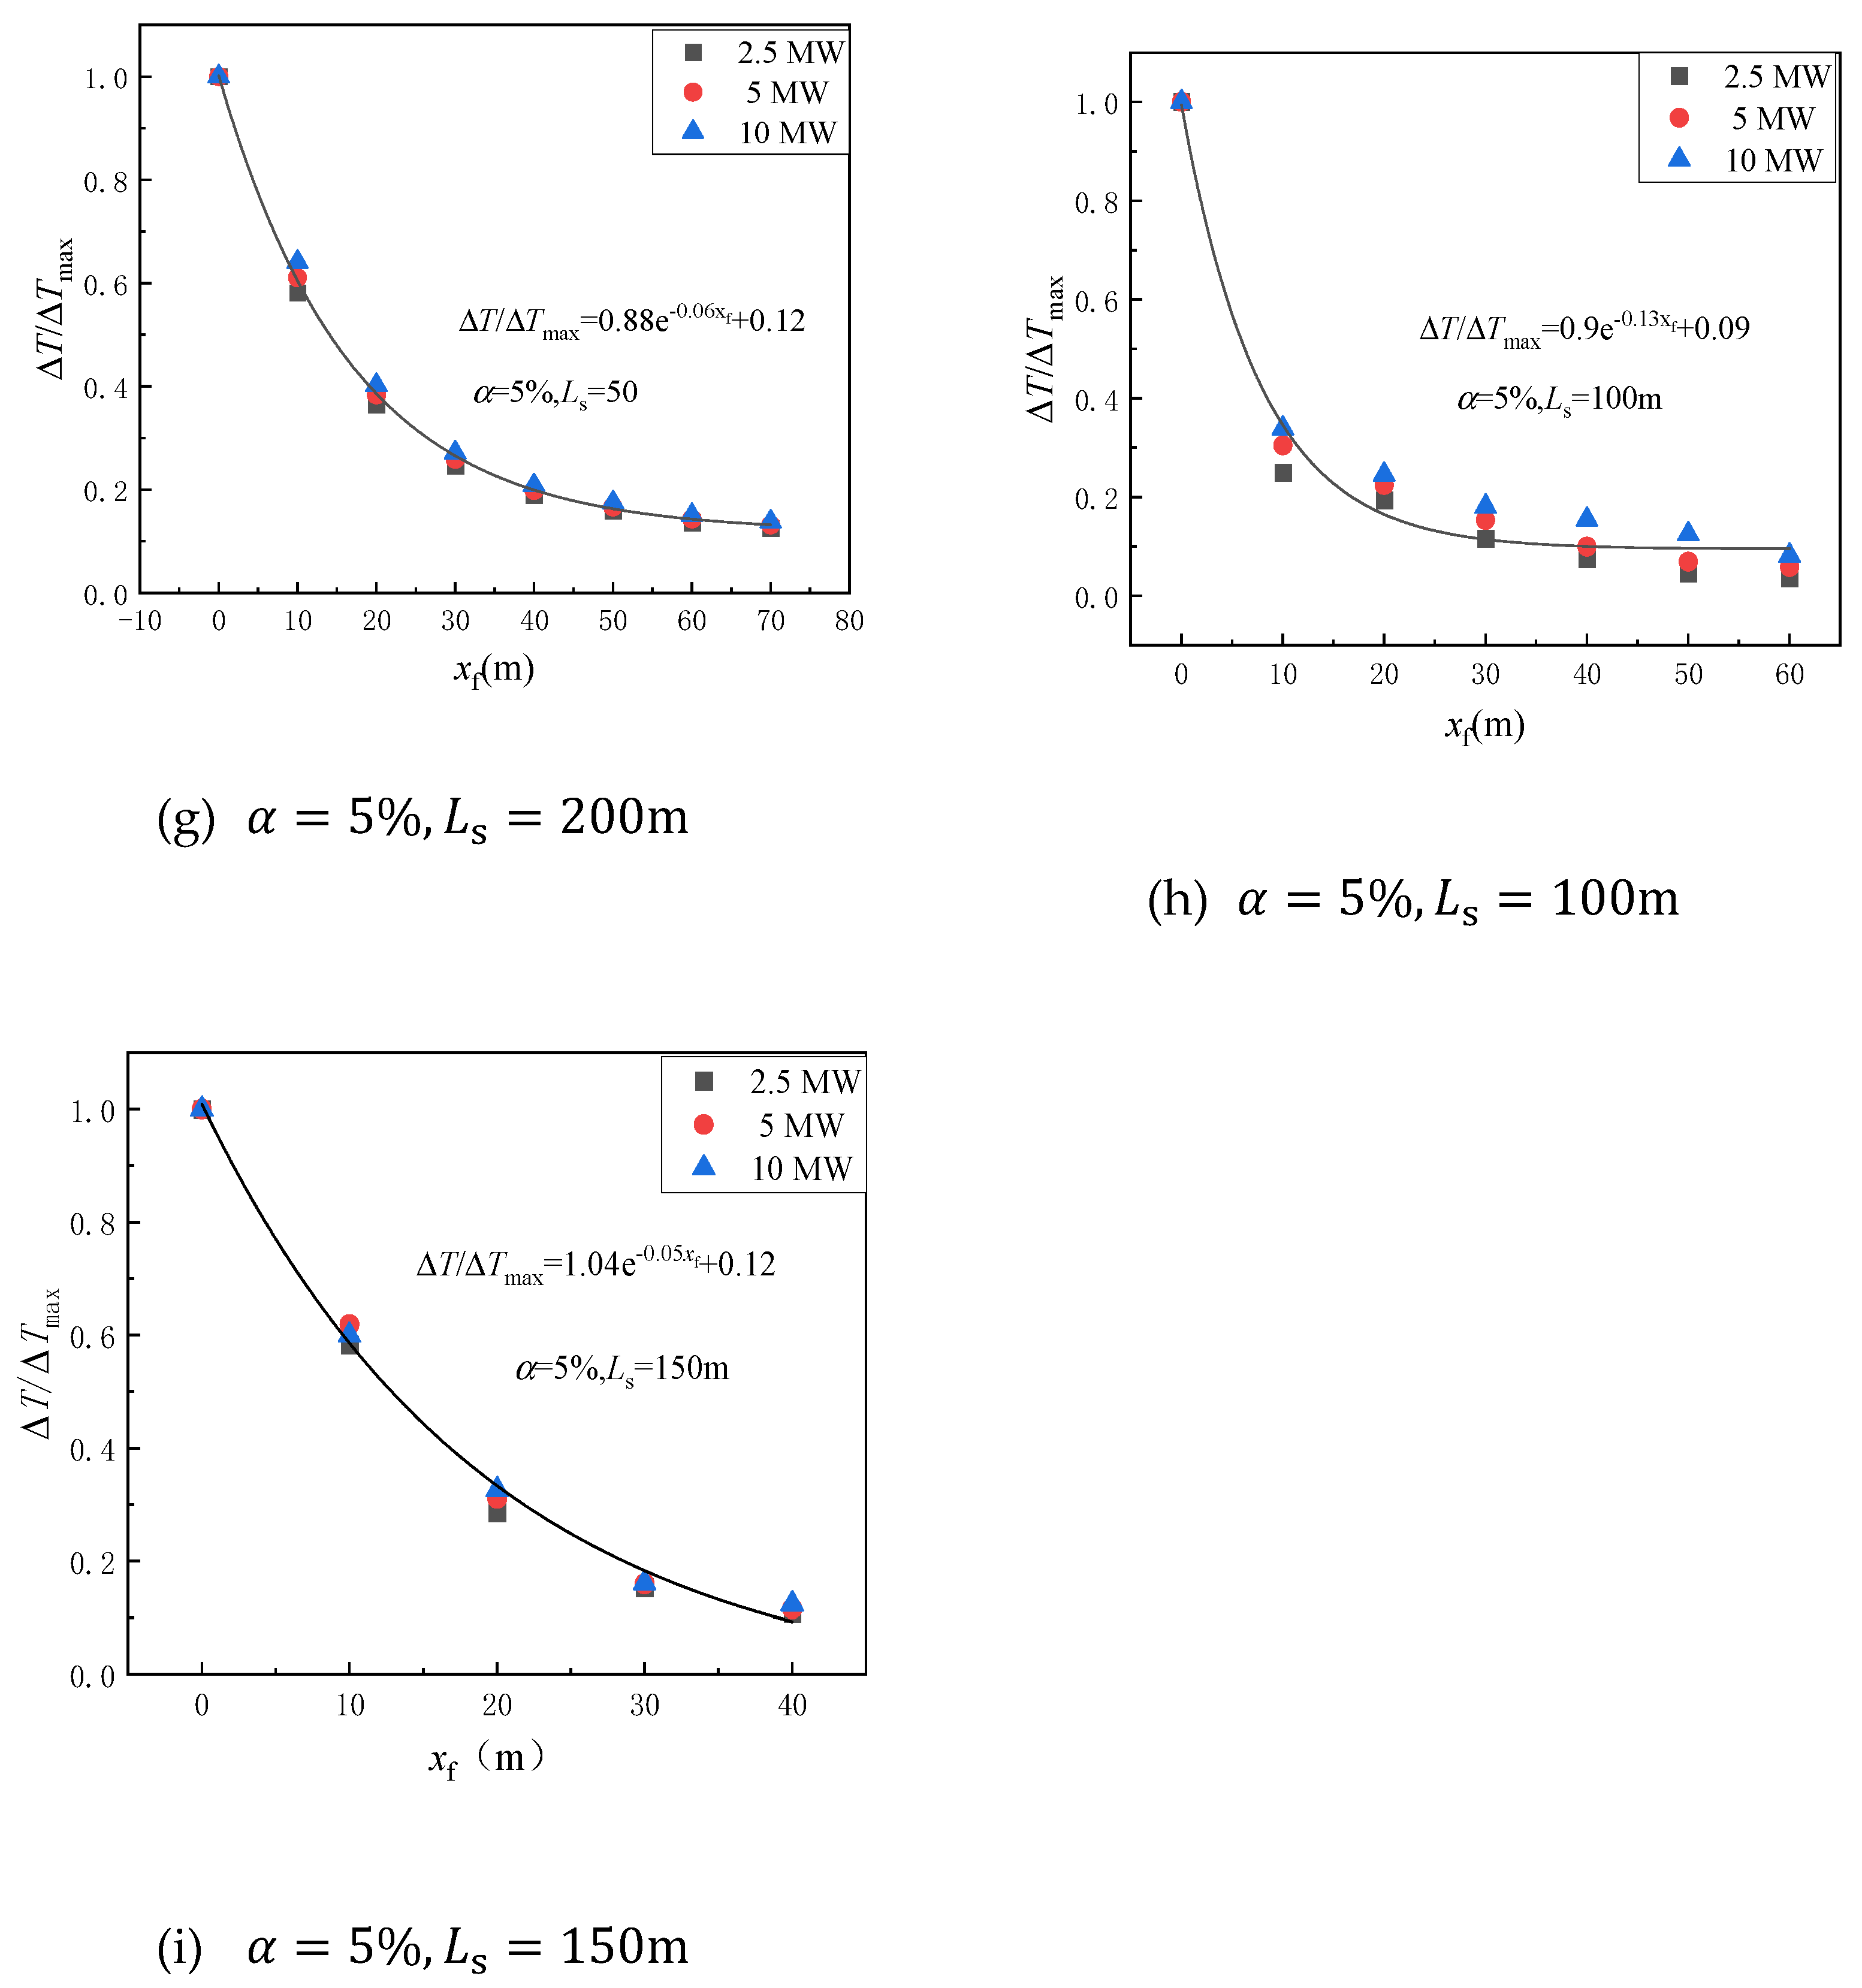
3.3. Temperature Field Under the Influence of Strong Induced Airflow

(1)
Maximum excess temperature under strong induced airflow
Previous researchers have conducted several studies on the T m a x in inclined tunnels [28,29]. Li et al. presented prediction model in the study of the T m a x of fire in inclined tunnels. He argued for the coefficient CT and that there is a connection between this value and the inclination angle, proposing an empirical expression for T m a x obtained based on the inclination angle fitting [3]:
v i n = 2.68 C T 1 χ r g 1 / 3 Q Δ T m a x ρ 0 c p T a 1 / 3 b f 0 1 / 3 H e f 5 / 3
Bart investigated the induced airflow generated by inclined tunnels using numerical simulations and developed an empirical prediction model for airflow velocity [30]. Wan et al. came to a similar conclusion [31]:
v in   = 22 L 0.25 ( t a n α ) 0.36 ε 0.11 Q ˙ c 0.33 1 e x p 0.5 D h
Therefore, the dimensionless induced airflow prediction model was calculated by the method of dimensionless analysis:
v in   = f Q , ρ 0 , c p , T 0 , g , H , α , L s
Ls was the length from the left opening of the tunnel; thus, we could obtain the following equation:
v i n g H = f Q ρ 0 C P T 0 g 1 / 2 H 5 / 2 , L s H , α
Further simplified,
v i n * = f Q * , L s * , α
According to the previous results, it was believed that the v i n * was exponentially related to other factors, so the model could be further rewritten as
v i n * = α Q * b L s * c α d
Figure 11 presents v in   at various distances from the tunnel opening on the left side. These cases were fitted, except for one group of 0.91. The rest were all at 0.97 and above, and the b-values obtained for the cases with different inclinations and different distances from the left side opening of the tunnel were collated by averaging the b-values to obtain an average value of 0.4977.
We continued to analyze the distance to the left opening of tunnel, for different distances of dimensionless values to the scatter plot of each measurement point, still using the method of dimensionless fitting, as shown in Figure 12, by taking an average of 0.438. Thus, it could be considered that
v in   * Q * 0.4977 L s * 0.438 α
Figure 13 shows a dimensionless prediction model of the induced airflow developed by fitting the dimensionless values at different inclinations, averaging the coefficient. Then, we obtained the following:
v i n * Q * 0.4977 L s * 0.438 = 1 + α 0.12
The dimensionless model was brought to Li’s model and the original dimension was added:
Δ T m a x = 2.68 C T 1 χ r g 1 / 3 Q ρ 0 c p T 0 1 / 3 1 + α 0.12 Q ρ 0 c p T 0 g 1 / 2 H 2 / 5 0.4977 L s 0.438 H 0.438 b f 0 1 / 3 H e f 5 / 3
As the model was too complex, combined with the actual parameters of the conditions, the formula could be further simplified:
Δ T m a x = 0.89 C T Q 0.5023 1 + α 0.12 L s 0.438
C T represents the ratio of the maximum temperature rise to the average temperature rise. Li proposed that this value should be determined by the actual conditions of the tunnel [32], a view that has been accepted by other researchers in subsequent studies. Therefore, the value obtained through fitting in this study was 23. Under conditions of strong induced airflow, the temperature field distribution within the tunnel is primarily influenced by multiple factors such as L s , Q ˙ , and α . In the development and analysis of the model, to reflect the coupled effects of multiple factors, the constants were determined by averaging results from multiple fitting iterations. This approach constitutes the primary source of error. Consequently, the final predictive model exhibits some deviation when compared with the simulation data. However, the discrepancy generally falls within a 15% error range, indicating that the resulting model is acceptable and can be applied to engineering scenarios with similar conditions.
(2)
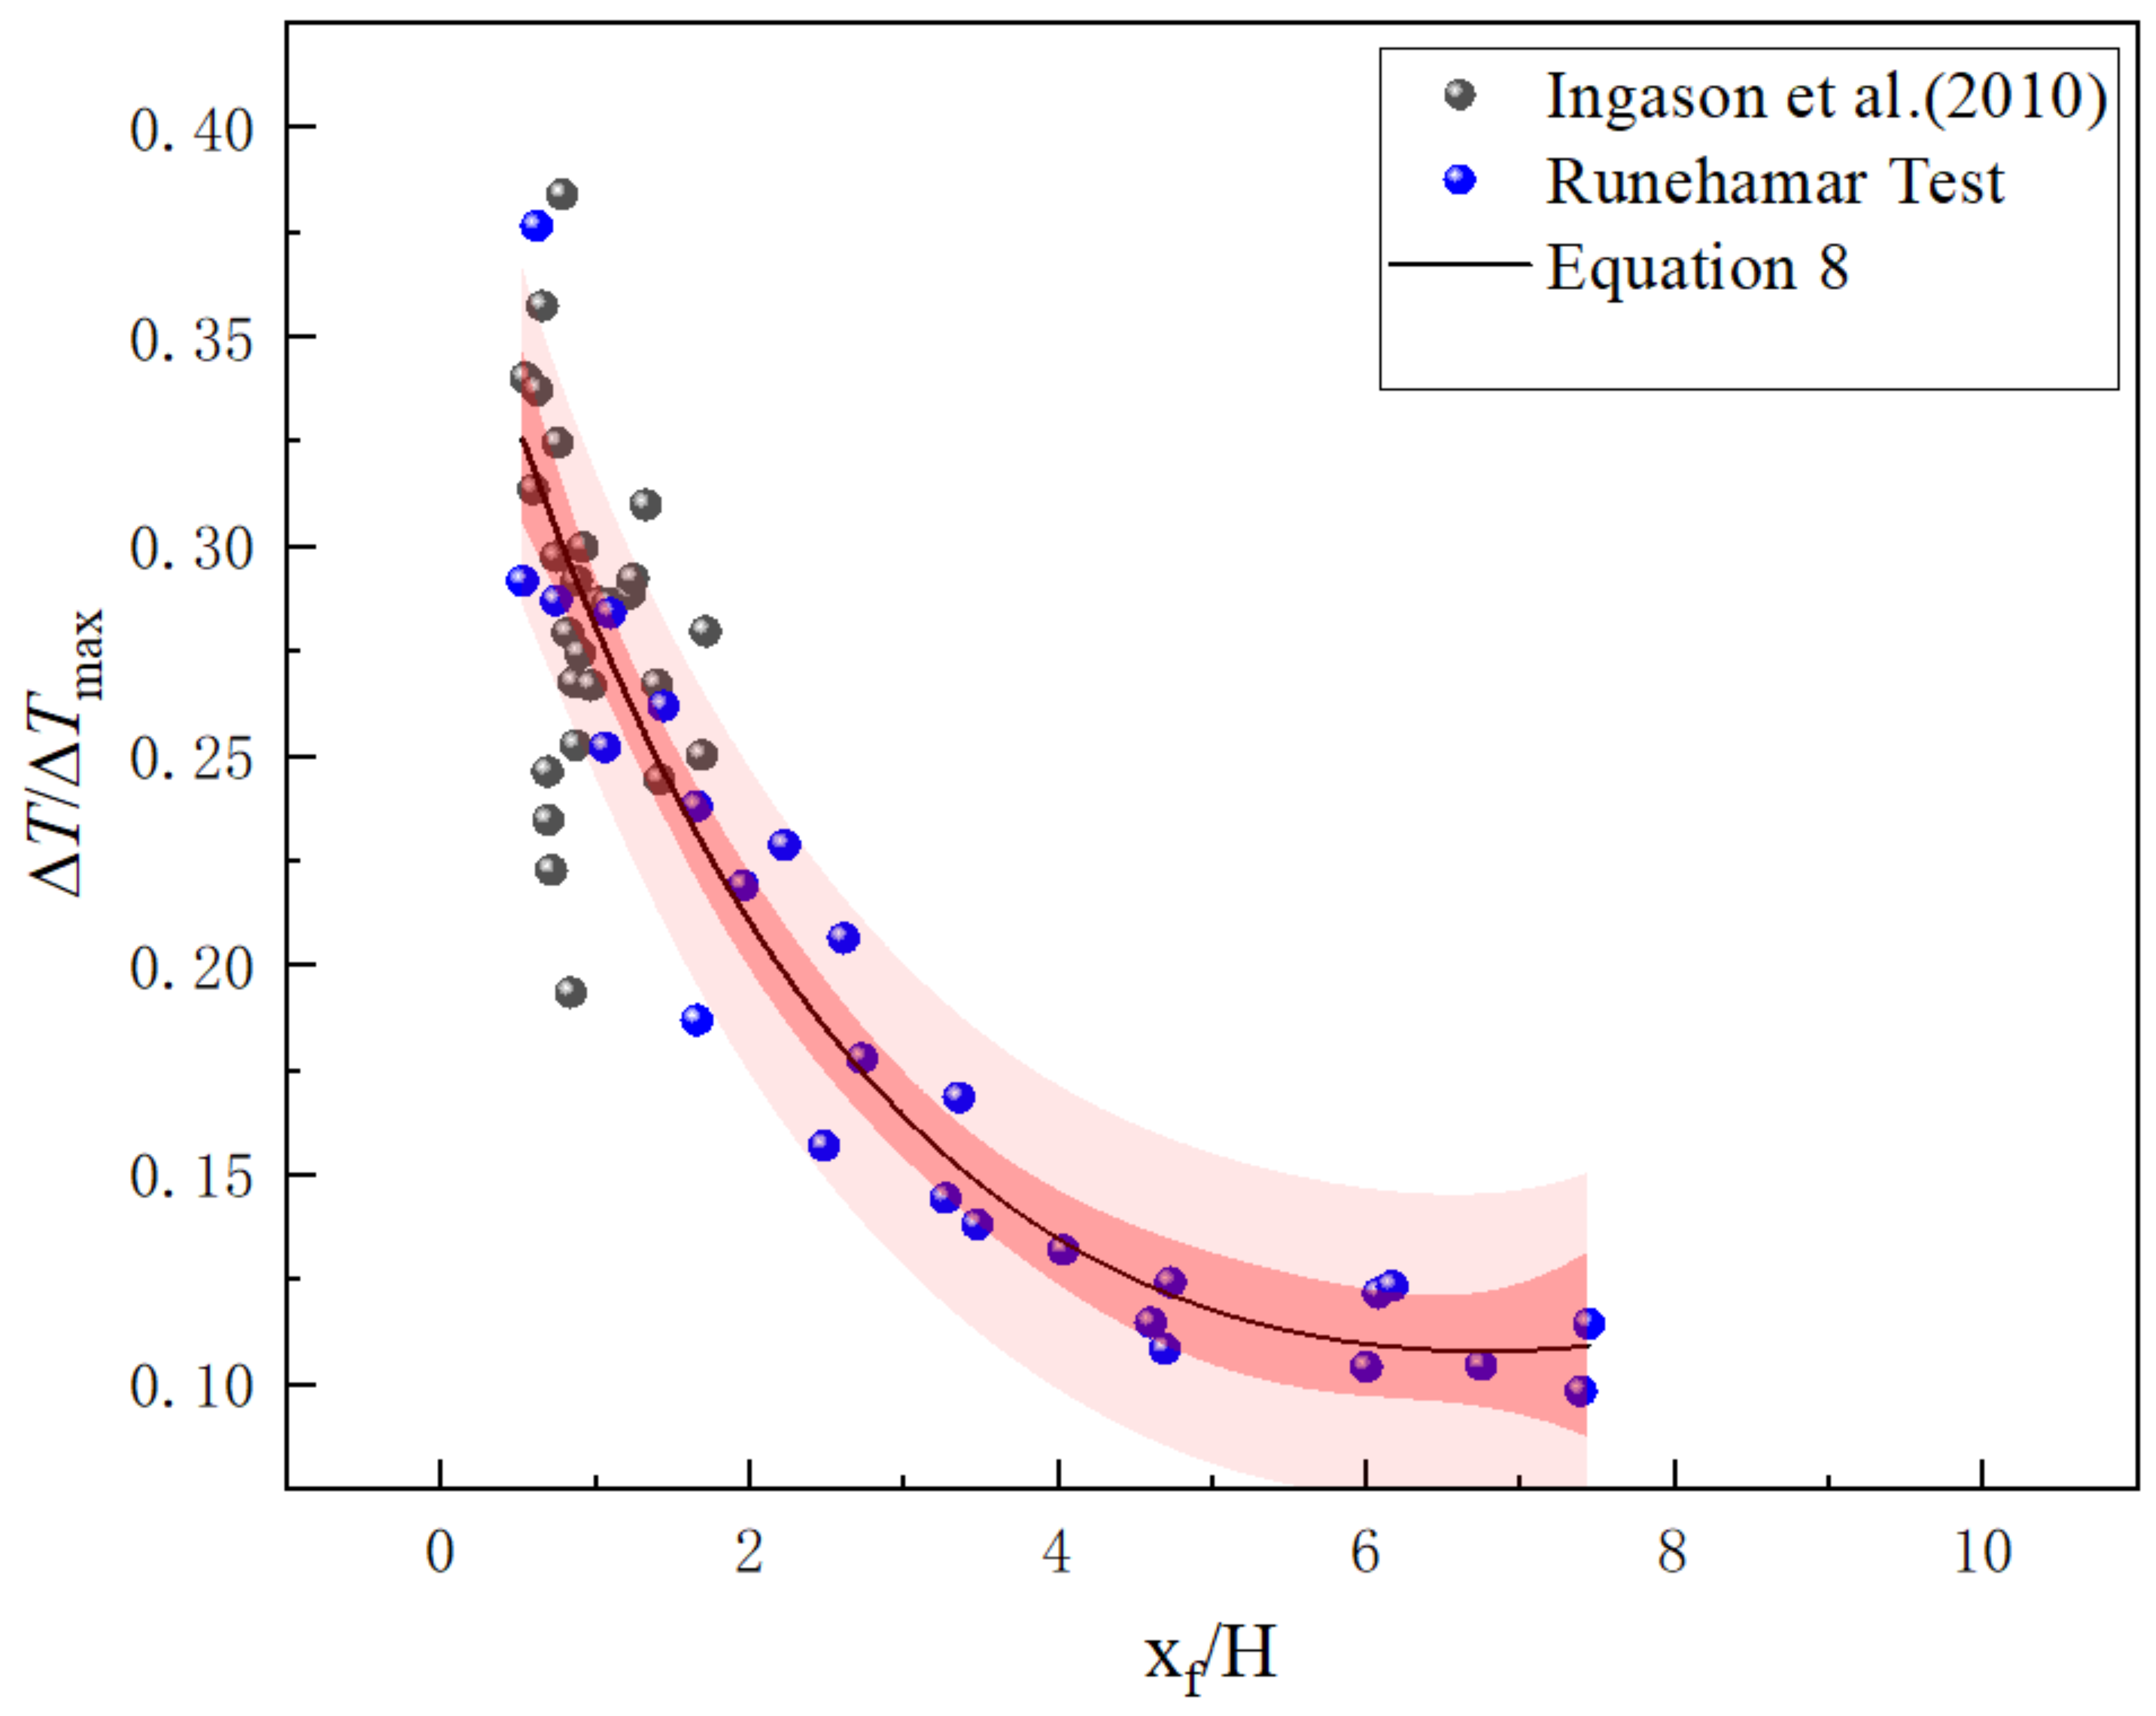
Longitudinal temperature decay under strong induced airflow
Previous studies have demonstrated that inclined tunnel sections are drastically affected by airflow, and based on this characteristic, there is a strong influence on horizontal tunnel fire modeling when ventilated [8,33]. Based on this characterization, horizontal tunnel fire model could be initially established [2]:
Δ T Δ T m a x e h c m a c p
In the equation, the total heat transfer coefficient ( k w / m 2 · k ) as 0.025, and c was the circumference of the tunnel. Ingason believed that the longitudinal temperature variation was related to m ˙ s , which is consistent with the authors’ previous results, so a modified model could be proposed:
Δ T Δ T m a x = d e e x f + f
Figure 14 shows the dimensionless temperature decay of the inclined tunnel section for different inclinations and different longitudinal positions of the fire, after fitting and averaging the value of the coefficients:
Δ T Δ T m a x = 1.2657 e 91.55 m ˙ a 0.257
In previous studies of maximum excess temperature in inclined tunnels, wind velocity for induced airflow has been obtained as
v in   = 1 + α 0.12 Q ρ 0 c p T 0 g 1 / 2 H 2 / 5 0.4977 L s H 0.438 g H
For v i n = m ˙ a ρ 0 W H , substituting Equation (23) into Equation (22), which can be given as
Δ T = 0.4 1.2657 e 0.98 1 v i n 0.257 C T Q 0.5023 1 + α 0.12 ( x f / H ) 0.438
Yin et al. employed a combination of reduced-scale experiments and numerical simulations to analyze the ventilation speed and critical wind speed of this type of tunnel [34]. They also determined the temperature field distribution for a 6% inclination angle. To further validate the accuracy of the model, a comparison was made between the predicted model, simulation data, and the measurements from Yin et al. [34]. Figure 15 compares the simulated ∆T values with the predicted ones, revealing good consistency between the data. Except for a few outliers, most deviations fell within a 15% error bar range, indicating that the model could accurately predict the temperature field variation under these conditions. Meanwhile, in the model validation shown in Figure 15, several data points corresponding to a 5% tunnel gradient lie close to the 15% error margin, with one point exceeding this range. At a 5% slope, the temperature exhibits more pronounced fluctuations due to the combined effect of a relatively steep gradient and a high heat release rate (HRR) of the fire source, which generates stronger induced airflow. This results in more significant longitudinal temperature decay, leading to deviations beyond the predictive range of the model. This trend is also evident in Figure 7, where sharp temperature decay is observed under certain 5% slope conditions.

4. Conclusions

This study examined the proportions of convective and radiative heat transfer, as well as the temperature distribution, under varying HRRs of the fire, inclinations, and longitudinal positions. The major conclusions applicable to these can be summarized as follows:
(1)
In the U-shaped tunnel, as the fire moves towards the left opening, the stack effect upstream of the fire source becomes more pronounced, and the temperature decays more rapidly. At the same time, there is a critical transition point for the change between strong and weak induced airflow near the corner. When the inclination angle is small, this position is located above the corner. As the inclination angle increases, the position gradually moves towards the fire-source side.
(2)
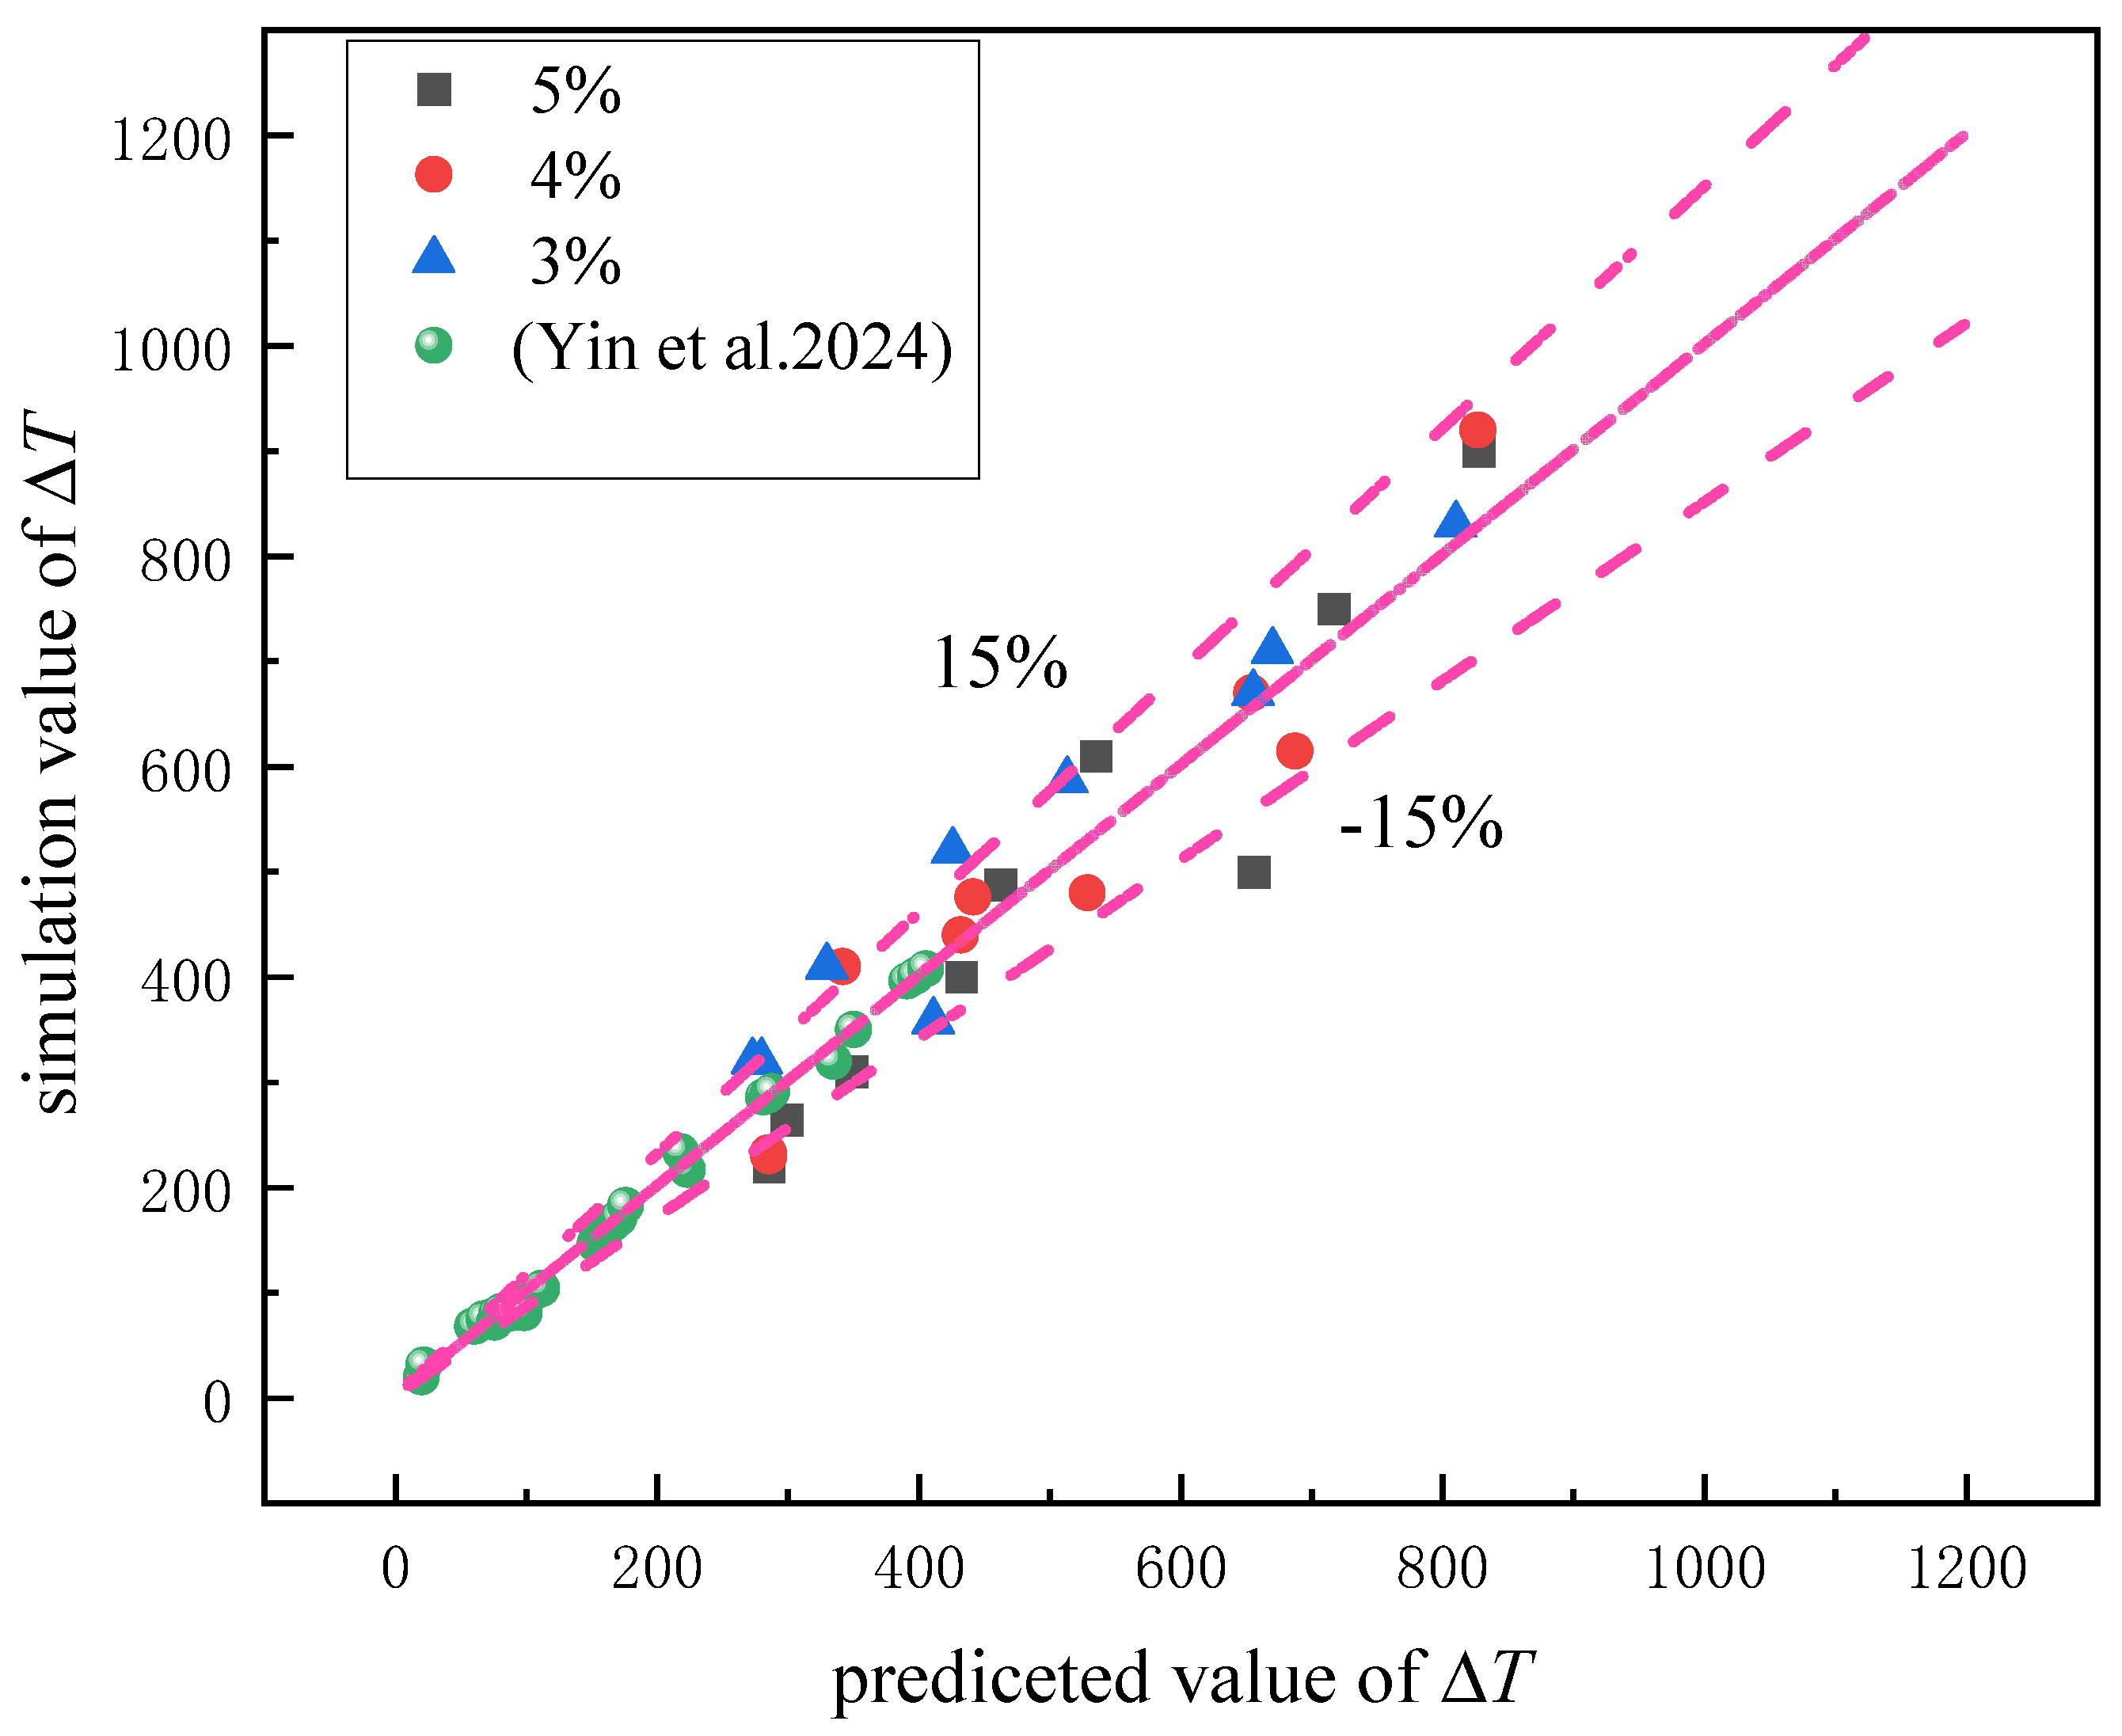
In the case where the fire-source location is in the horizontal section of the tunnel, heat transfer within the tunnel is primarily dominated by thermal radiation. In this scenario, weak induced airflow occurs, making ventilation challenging. A prediction model for the maximum excess temperature and longitudinal temperature decay is developed, considering the impact of varying HRRs of the fire, various inclination angles, and different longitudinal positions.
(3)
In the case where the fire-source location is in the inclined section of the tunnel, the heat transfer mechanism is dominated by convective heat transfer, indicating strong induced airflow. The mass flow rate of incoming air is used to predict temperature under the influence of two factors: distinct longitudinal locations of the fire source and varying inclination angles. Prediction models are proposed for longitudinal temperature decrease and maximum excess temperature, respectively.
It is significant to remember that the results reached in this work apply only to the specific context of this prediction model and are only applicable in situations where the distance of the inclined part of the tunnel is approximately 200–300 m. If this section is too long, excessive frictional resistance may hinder the smoke from flowing toward the tunnel opening. Meanwhile, the predictive model proposed in this paper is primarily designed for inclined tunnel sections with slopes ranging from 3% to 5%, which are commonly used in the design of underwater tunnel projects. For less common conditions where the slope exceeds 5%, the model may not be applicable, and the tunnel is assumed to be under natural ventilation conditions, without considering additional meteorological factors such as ambient wind. as the strong induced airflow effects could be more pronounced, and the flame deflection angle could be larger.

Author Contributions

Methodology, Y.Z.; Software, Y.Z.; Validation, Y.Z.; Formal analysis, Y.M.; Investigation, Y.Z.; Resources, G.Z. and L.W.; Writing – original draft, Y.Z.; Writing – review & editing, Y.M., X.W. and X.L.; Project administration, G.Z.; Funding acquisition, G.Z. All authors have read and agreed to the published version of the manuscript.

Funding

This research was funded by the National Project funding for Key R&D programs (Grant No. 2023YFC3009900).

Institutional Review Board Statement

Not applicable.

Informed Consent Statement

Not applicable.

Data Availability Statement

The raw data supporting the conclusions of this article will be made available by the authors on request.

Conflicts of Interest

The authors declare no conflict of interest.

Nomenclature

Q ˙ Heat release rate (kW)
Q ˙ m a x Maximum of heat release rate (kW)
Q ˙ c Convection of the HRR (kW)
Q * Dimensionless heat release rate
H Tunnel height (m)
H e f Effective height of tunnel (m)
W Tunnel width (m)
C Tunnel perimeter (m)
L s Distance from the fire source to the left opening (m)
x f , r Distance from fire source (m)
δ x Mesh size (m)
D * Dimensionless fire-source characteristic diameter
α Slope angle
P Ambient pressure (pa)
h Total heat transfer coefficient (kW/m2⋅k)
χrPercentage of radiation of heat transfer
T m a x Maximum excess temperature (K)
T Temperature difference between smoke and ambient air (K)
T a v g , f Average temperature difference between smoke and ambient air (K)
T a Temperature of ambient air (K)
ρ a Density of ambient air (kg/m3)
C p Specific heat capacity (J/kg·g)
v i n Induced airflow velocity (m/s)
v * Dimensionless induced airflow velocity
C T Coefficients related to the angle
g Gravitational acceleration (m/s2)
m ˙ a Mass flow rate of air (kg/s)
m ˙ s Mass flow rate of smoke (kg/s)

References

  1. Alpert, R.L. Calculation of response time of ceiling-mounted fire detectors. Fire Technol. 1972, 8, 181–195. [Google Scholar] [CrossRef]
  2. Ingason, H.; Li, Y.Z. Model scale tunnel fire tests with longitudinal ventilation. Fire Saf. J. 2010, 45, 371–384. [Google Scholar] [CrossRef]
  3. Li, Y.Z.; Lei, B.; Ingason, H. The maximum temperature of buoyancy-driven smoke flow beneath the ceiling in tunnel fires. Fire Saf. J. 2011, 46, 204–210. [Google Scholar] [CrossRef]
  4. Huo, Y.; Gao, Y.; Chow, W.K. A study on ceiling jet characteristics in an inclined tunnel. Tunn. Undergr. Sp. Tech. 2015, 50, 32–46. [Google Scholar] [CrossRef]
  5. Zhang, S.; Yang, H.; Yao, Y.; Zhu, K.; Zhou, Y.; Shi, L.; Cheng, X. Numerical Investigation of Back-Layering Length and Critical Velocity in Curved Subway Tunnels with Different Turning Radius. Fire Technol. 2017, 53, 1765–1793. [Google Scholar] [CrossRef]
  6. Chow, W.K.; Gao, Y.; Zou, J.F.; Liu, Q.K.; Chow, C.L.; Miao, L. Numerical Studies on Thermally-Induced Air Flow in Sloping Tunnels with Experimental Scale Modelling Justifications. Fire Technol. 2018, 54, 867–892. [Google Scholar] [CrossRef]
  7. Zhao, S.; Li, Y.Z.; Kumm, M.; Ingason, H.; Liu, F. Re-direction of smoke flow in inclined tunnel fires. Tunn. Undergr. Sp. Tech. 2019, 86, 113–127. [Google Scholar] [CrossRef]
  8. Zhang, J.; Zhou, X.; Xu, Q.; Yang, L. The inclination effect on CO generation and smoke movement in an inclined tunnel fire. Tunn. Undergr. Sp. Tech. 2012, 29, 78–84. [Google Scholar] [CrossRef]
  9. Ji, J.; Wan, H.; Li, K.; Han, J.; Sun, J. A numerical study on upstream maximum temperature in inclined urban road tunnel fires. Int. J. Heat. Mass. Tran. 2015, 88, 516–526. [Google Scholar] [CrossRef]
  10. Fan, C.G.; Li, X.Y.; Mu, Y.; Guo, F.Y.; Ji, J. Smoke movement characteristics under stack effect in a mine laneway fire. Appl. Therm. Eng. 2017, 110, 70–79. [Google Scholar] [CrossRef]
  11. He, L.; Liao, K.; Zhu, G. Study on the influence of the longitudinal position of fire source and tunnel width on the maximum ceiling gas temperature. Case Stud. Therm. Eng. 2023, 52, 103731. [Google Scholar] [CrossRef]
  12. Huang, P.; Ye, S.; Xie, J.; Chen, M.; Liu, C.; Yu, L. Study on the maximum and longitudinal distribution of ceiling gas temperature in a naturally ventilated tunnel: The effect of longitudinal fire location. Int. J. Therm. Sci. 2023, 185, 108037. [Google Scholar] [CrossRef]
  13. Chen, C.; Jiao, W.; Zhang, Y.; Shi, C.; Lei, P.; Fan, C. Experimental investigation on the influence of longitudinal fire location on critical velocity in a T-shaped tunnel fire. Tunn. Undergr. Sp. Tech. 2023, 134, 104983. [Google Scholar] [CrossRef]
  14. Li, X.; Zhu, G.; He, L. Study on the smoke mass flow in T-shaped tunnel fire. Case Stud. Therm. Eng. 2024, 61, 104848. [Google Scholar] [CrossRef]
  15. Qie, Y.; Li, J.; Li, Y.; Zhao, H.; Lin, X.; Li, D.; Hou, S.; Wang, Z. Experimental Study on the Impact of Smoke Exhaust Rate and Exhaust Vent Opening Mode on the Smoke Control Effect of the Point Smoke Exhaust System in an Asymmetric V-Shaped Tunnel. Fire 2025, 8, 162. [Google Scholar] [CrossRef]
  16. Wang, J.; Gao, D.; Kong, X.; Jiang, X.; Lu, K. Water spray effects on fire smoke temperature distribution beneath a symmetrical V-shaped tunnel ceiling. Case Stud. Therm. Eng. 2023, 51, 103568. [Google Scholar] [CrossRef]
  17. Liu, Y.; Chen, J.; Yang, D. Experimental study on the effects of exhaust vent layout on plug-holing for ceiling central smoke extraction in road tunnel fires. Tunn. Undergr. Sp. Tech. 2022, 126, 104550. [Google Scholar] [CrossRef]
  18. Hu, L.H.; Xu, Y.; Zhu, W.; Wu, L.; Tang, F.; Lu, K.H. Large eddy simulation of pollutant gas dispersion with buoyancy ejected from building into an urban street canyon. J. Hazard. Mater. 2011, 192, 940–948. [Google Scholar] [CrossRef]
  19. Ko, J.; Yoon, C.; Yoon, S.; Kim, J. Determination of the applicable exhaust airflow rate through a ventilation shaft in the case of road tunnel fires. Saf. Sci. 2010, 48, 722–728. [Google Scholar] [CrossRef]
  20. Kong, J.; Xu, Z.; You, W.; Wang, B.; Liang, Y.; Chen, T. Study of smoke back-layering length with different longitudinal fire locations in inclined tunnels under natural ventilation. Tunn. Undergr. Sp. Tech. 2021, 107, 103663. [Google Scholar] [CrossRef]
  21. Jiang, X.; Chen, X.; Xiao, N.; Liao, X.; Fan, C. Influence of the competitive effect of V-shaped slope tunnel on smoke characteristics. Tunn. Undergr. Sp. Tech. 2021, 118, 104193. [Google Scholar] [CrossRef]
  22. Tilley, N.; Rauwoens, P.; Merci, B. Verification of the accuracy of CFD simulations in small-scale tunnel and atrium fire configurations. Fire Saf. J. 2011, 46, 186–193. [Google Scholar] [CrossRef]
  23. He, L.; Liao, K.; Zhou, Y.; Tao, H.; Ming, Y.; Wang, X.; Zhang, H.; Zhu, G. Study on the influence of the longitudinal position of the fire source on the movement behavior of the asymmetric flow field. Therm. Sci. Eng. Prog. 2023, 39, 101753. [Google Scholar] [CrossRef]
  24. Hu, L.H.; Fong, N.K.; Yang, L.Z.; Chow, W.K.; Li, Y.Z.; Huo, R. Modeling fire-induced smoke spread and carbon monoxide transportation in a long channel: Fire Dynamics Simulator comparisons with measured data. J. Hazard. Mater. 2007, 140, 293–298. [Google Scholar] [CrossRef] [PubMed]
  25. Li, Y.Z.; Lei, B.; Ingason, H. Scale modeling and numerical simulation of smoke control for rescue stations in long railway tunnels. J. Fire Prot. Eng. 2012, 22, 101–131. [Google Scholar] [CrossRef]
  26. Zhu, Y.; Tang, F.; Chen, L.; Wang, Q.; Xu, X. Effect of lateral concentrated smoke extraction on the smoke back-layering length and critical velocity in a longitudinal ventilation tunnel. J. Wind. Eng. Ind. Aerod 2020, 207, 104403. [Google Scholar] [CrossRef]
  27. Ming, Y.; Zhu, G.; He, L.; Liu, X.; Zhou, Y.; Ding, J. Study on the maximum excess temperature and temperature distribution under the influence of lateral smoke exhaust in tunnel fires. Therm. Sci. Eng. Prog. 2023, 40, 101713. [Google Scholar] [CrossRef]
  28. Weng, M.; Lu, X.; Liu, F.; Du, C. Study on the critical velocity in a sloping tunnel fire under longitudinal ventilation. Appl. Therm. Eng. 2016, 94, 422–434. [Google Scholar] [CrossRef]
  29. Ji, J.; Guo, F.; Gao, Z.; Zhu, J. Effects of ambient pressure on transport characteristics of thermal-driven smoke flow in a tunnel. Int. J. Therm. Sci. 2018, 125, 210–217. [Google Scholar] [CrossRef]
  30. Merci, B. One-dimensional analysis of the global chimney effect in the case of fire in an inclined tunnel. Fire Saf. J. 2008, 43, 376–389. [Google Scholar] [CrossRef]
  31. Wan, H.; Gao, Z.; Han, J.; Ji, J.; Ye, M.; Zhang, Y. A numerical study on smoke back-layering length and inlet air velocity of fires in an inclined tunnel under natural ventilation with a vertical shaft. Int. J. Therm. Sci. 2019, 138, 293–303. [Google Scholar] [CrossRef]
  32. Li, Y.Z.; Lei, B.; Ingason, H. Study of critical velocity and backlayering length in longitudinally ventilated tunnel fires. Fire Saf. J. 2010, 45, 361–370. [Google Scholar] [CrossRef]
  33. Oka, Y.; Kakae, N.; Imazeki, O.; Inagaki, K. Temperature Property of Ceiling Jet in an Inclined Tunnel. Procedia Eng. 2013, 62, 234–241. [Google Scholar] [CrossRef]
  34. Yin, Y.; Xu, Z.; Lei, Z.; Xie, B.; Liu, Q. Study of air supplement velocity by thermal stack effect and critical velocity under longitudinal ventilation in the uniclinal V-shaped tunnel. Case Stud. Therm. Eng. 2024, 60, 104723. [Google Scholar] [CrossRef]
Figure 1. Schema of the underwater tunnel model.
Fire 08 00185 g001
Figure 2. Schema of the longitudinal position of fire sources.
Fire 08 00185 g002
Figure 3. Vertical temperature variations with different grid sizes.
Fire 08 00185 g003
Figure 4. Validation between the simulated and experimental values.
Fire 08 00185 g004
Figure 5. T in the tunnel between the simulated and experimental values.
Fire 08 00185 g005
Figure 6. Mass flow rate at different longitudinal positions of the fire.
Fire 08 00185 g006
Figure 7. Maximum excess temperature pattern for different tunnel sections.
Fire 08 00185 g007
Figure 8. Relationship between T m a x and Q ˙ 2 / 3 / H e f 5 / 3 .
Fire 08 00185 g008
Figure 9. Horizontal tunnel section temperature decay.
Fire 08 00185 g009
Figure 10. Prediction model validation comparison [2].
Fire 08 00185 g010
Figure 11. Induced airflow wind speed at different distances from the left opening.
Fire 08 00185 g011
Figure 12. Variation in dimensionless numbers at different vertical positions.
Fire 08 00185 g012
Figure 13. Variation pattern of dimensionless induced air velocity with slope.
Fire 08 00185 g013
Figure 14. Inclined tunnel section temperature decay.
Fire 08 00185 g014aFire 08 00185 g014b
Figure 15. Prediction model validation comparison [34].
Fire 08 00185 g015
Table 1. Test conditions.
No.Distance from the Left Opening (m)AngleHRR (MW)
1–1850, 100, 150, 200, 250, 3003%2.5, 5, 10
19–3650, 100, 150, 200, 250, 3004%2.5, 5, 10
37–5450, 100, 150, 200, 250, 3005%2.5, 5, 10
Disclaimer/Publisher’s Note: The statements, opinions and data contained in all publications are solely those of the individual author(s) and contributor(s) and not of MDPI and/or the editor(s). MDPI and/or the editor(s) disclaim responsibility for any injury to people or property resulting from any ideas, methods, instructions or products referred to in the content.

