Article

Forest Fires, Vulnerability, and Exposure: The Evaluation of What Was Salvaged in the 2023 Fire in Tenerife (Spain)

1
Disaster Risk Reduction and Resilient Cities Group, Department of Geography and History, University of La Laguna (ULL), 38200 San Cristóbal de La Laguna, Spain
2
Department of Geography and Planning, University of Montpellier Paul Valéry (UPVM), 34199 Montpellier, France
*
Author to whom correspondence should be addressed.
Fire 2025, 8(5), 186; https://doi.org/10.3390/fire8050186
Submission received: 17 March 2025 / Revised: 30 April 2025 / Accepted: 2 May 2025 / Published: 7 May 2025
(This article belongs to the Special Issue Building Fires, Evacuations and Rescue)

Abstract

Forest fires are one of the risks with the greatest socio-territorial impact in island areas with Mediterranean precipitation characteristics. Regions such as the Canary Islands, densely populated and where there is no clear differentiation between land uses, regularly suffer major forest fires that devastate a large part of their forest mass and endanger the lives and property of thousands of people. This paper characterizes the forest fire that occurred on the island of Tenerife during the month of August 2023—defined as the most severe in Spain during that year—from a double perspective: on the one hand, analysis of the exposure and vulnerability of the buildings located in the surroundings of the fire and, on the other hand, economic quantification of the assets salvaged thanks to the intervention of the means and resources deployed by the authorities. The conclusion is that the analyzed buildings exhibit moderate vulnerability and exposure, being high in aspects such as their poor accessibility, their proximity to forest areas and, specifically, to dangerous fuel models, as well as the slope of their surroundings and their proximity to ravines. In terms of the evaluation of what was salvaged, the losses avoided are estimated at EUR 187 million, which would have been added to the actual losses—EUR 164 million—especially thanks to the interventions carried out around the nearby buildings and agricultural areas.

1. Introduction

Forest fires are very frequent in many geographical areas of the planet, with particular impact in regions with Mediterranean features where, during the summer, the highest temperatures of the year coincide with a marked rainfall deficit. This is the case, for example, in a large part of the Iberian Peninsula, Greece, Southern France, or California [1,2].
A variety of scientific publications highlight how anthropogenic climate change is altering the distribution and main characteristics of these events. It is suggested that the altered climatic variables lead to fires with a greater destructive potential [3,4,5]. Thus, rising temperatures, changes in rainfall patterns, or the intensification of droughts in certain areas are the phenomena of particular interest in relation to forest fires. In turn, some studies mention the relentless increase in human exposure to these events as a consequence of the urbanization of spaces close to forest masses—or, directly, of the forested sectors themselves [6,7]. Similarly, it is worth mentioning the transformations that forest areas and their management have undergone in recent decades, including the progressive abandonment of traditional uses, ecosystemic changes associated with climate change, the replacement of some plant species by others, or the widespread anthropization of these areas, etc. [8,9].
These factors lead to the occurrence of fires of complex management that find the right breeding ground in these changes to reach large magnitudes and cause considerable damage to infrastructure, homes, and natural spaces, as well as to people—affecting their physical and mental health. These are the forest fires commonly known as sixth generation, which are extraordinarily violent, and whose energy release is powerful enough to create their own meteorological conditions that make control tasks difficult or, in some cases, impossible [10].
Based on these general premises, this paper presents the Canary Islands as the area of analysis (Figure 1). In this region, although forest fires are by no means a recent phenomenon [11], their intensity has increased in recent years. Despite the subtropical latitudes at which the archipelago is located and other geographical factors that individualize its situation, the Canary Islands can be considered a territory with eminently Mediterranean environmental characteristics [12]. In the summer season, rainfall is rather scarce or directly non-existent—with identifying areas with annual precipitation values below 100 mm [13]—and temperatures can be considered warm, with monthly averages above 20 °C throughout the year in wide areas.
However, as in the rest of these regions with Mediterranean features, most of the Large Forest Fires (LFFs), that is, >250 hectares, according to the most commonly used threshold in the Canary Islands, originate under an environment dominated by very dry and warm air masses which, in the islands, correspond to the advection of Saharan air. These conditions generate intense heat waves with thermal values that can exceed 35 °C or 40 °C, relative humidity levels below 20%, and, occasionally, winds with high gustiness [14]. Under these circumstances, fire development is favored, as it is possible to affirm that more than 90% of the area affected by fires occurs during very intense heat waves [15] and, likewise, that a similar percentage of the affected hectares burn during LFFs [16]. In addition, in the Canary archipelago, there is another relevant circumstance that significantly affects forest fires: the presence of a subsidence thermal inversion characteristic of this territory [17]. It usually separates a layer of humid surface air with moderate temperatures from an upper layer that is noticeably drier and warmer in the first few meters. When a Saharan advection occurs, the altitude of the thermal inversion drops considerably, causing most of the forest mass, which often benefits from the coolness under the inversion, to be exposed to a very hot and extremely dry environment.
Thus, for example, in the summer of 2007, three LFFs occurred simultaneously on the islands of Gran Canaria, Tenerife, and La Gomera, which together affected more than 30,000 ha [18]. Since 2000, there have been more than two thousand fire events in the region that have burned nearly 100,000 ha [19]. Note that the archipelago has about 135,000 ha of tree-covered forest [20], 18% of the total area of the islands, mostly composed of a xerophytic pine forest whose main species is Pinus canariensis, as well as the humid and dense laurel forest, found upwind of the trade winds—corresponding to the septentrional sectors of the most mountainous islands.
In recent years, LFFs have been occurring with greater intensity and affecting more populated areas. It is likely that there are at least two key factors to be considered in their evolution; the first is linked to climate change, which is already affecting this region of the planet and, according to Carrillo et al. [21], is bringing forward the period in which weather conditions are most favorable for the development of forest fires. Secondly, and probably with greater incidence, the change in land use that has been registered in the islands since the last third of the 20th century due to economic tertiarization [22], with the consequent abandonment of agriculture and forest harvesting activities, should be mentioned. It is difficult to precisely define where the urbanized area begins and where the forest ends; in any case, what can be appreciated with certain clarity is a wide transition sector between the urban centers, which tend to be located on the coasts and in the areas locally known as “medianías” (midlands), and the mountain sectors, mainly made up of two types of forest formations: the laurel forest and the Canary pine forest. The laurel forest is made up of a wide variety of plant species, including Laurus novocanariensis, Ilex canariensis, and Persea indica, which have high botanical value. They are located on the windward slopes of the trade winds of the islands of higher relief, between 600 and 1500 m.a.s.l. (meters above sea level), with conditions of constant humidity throughout the year [23]. Meanwhile, the Canary Islands pine forest, where the pyrophyte species Pinus canariensis stands out, thrives in drier conditions, between 1500 and 2000 m.a.s.l. (windward slopes) and 900 and 2200 m.a.s.l. (leeward slopes).
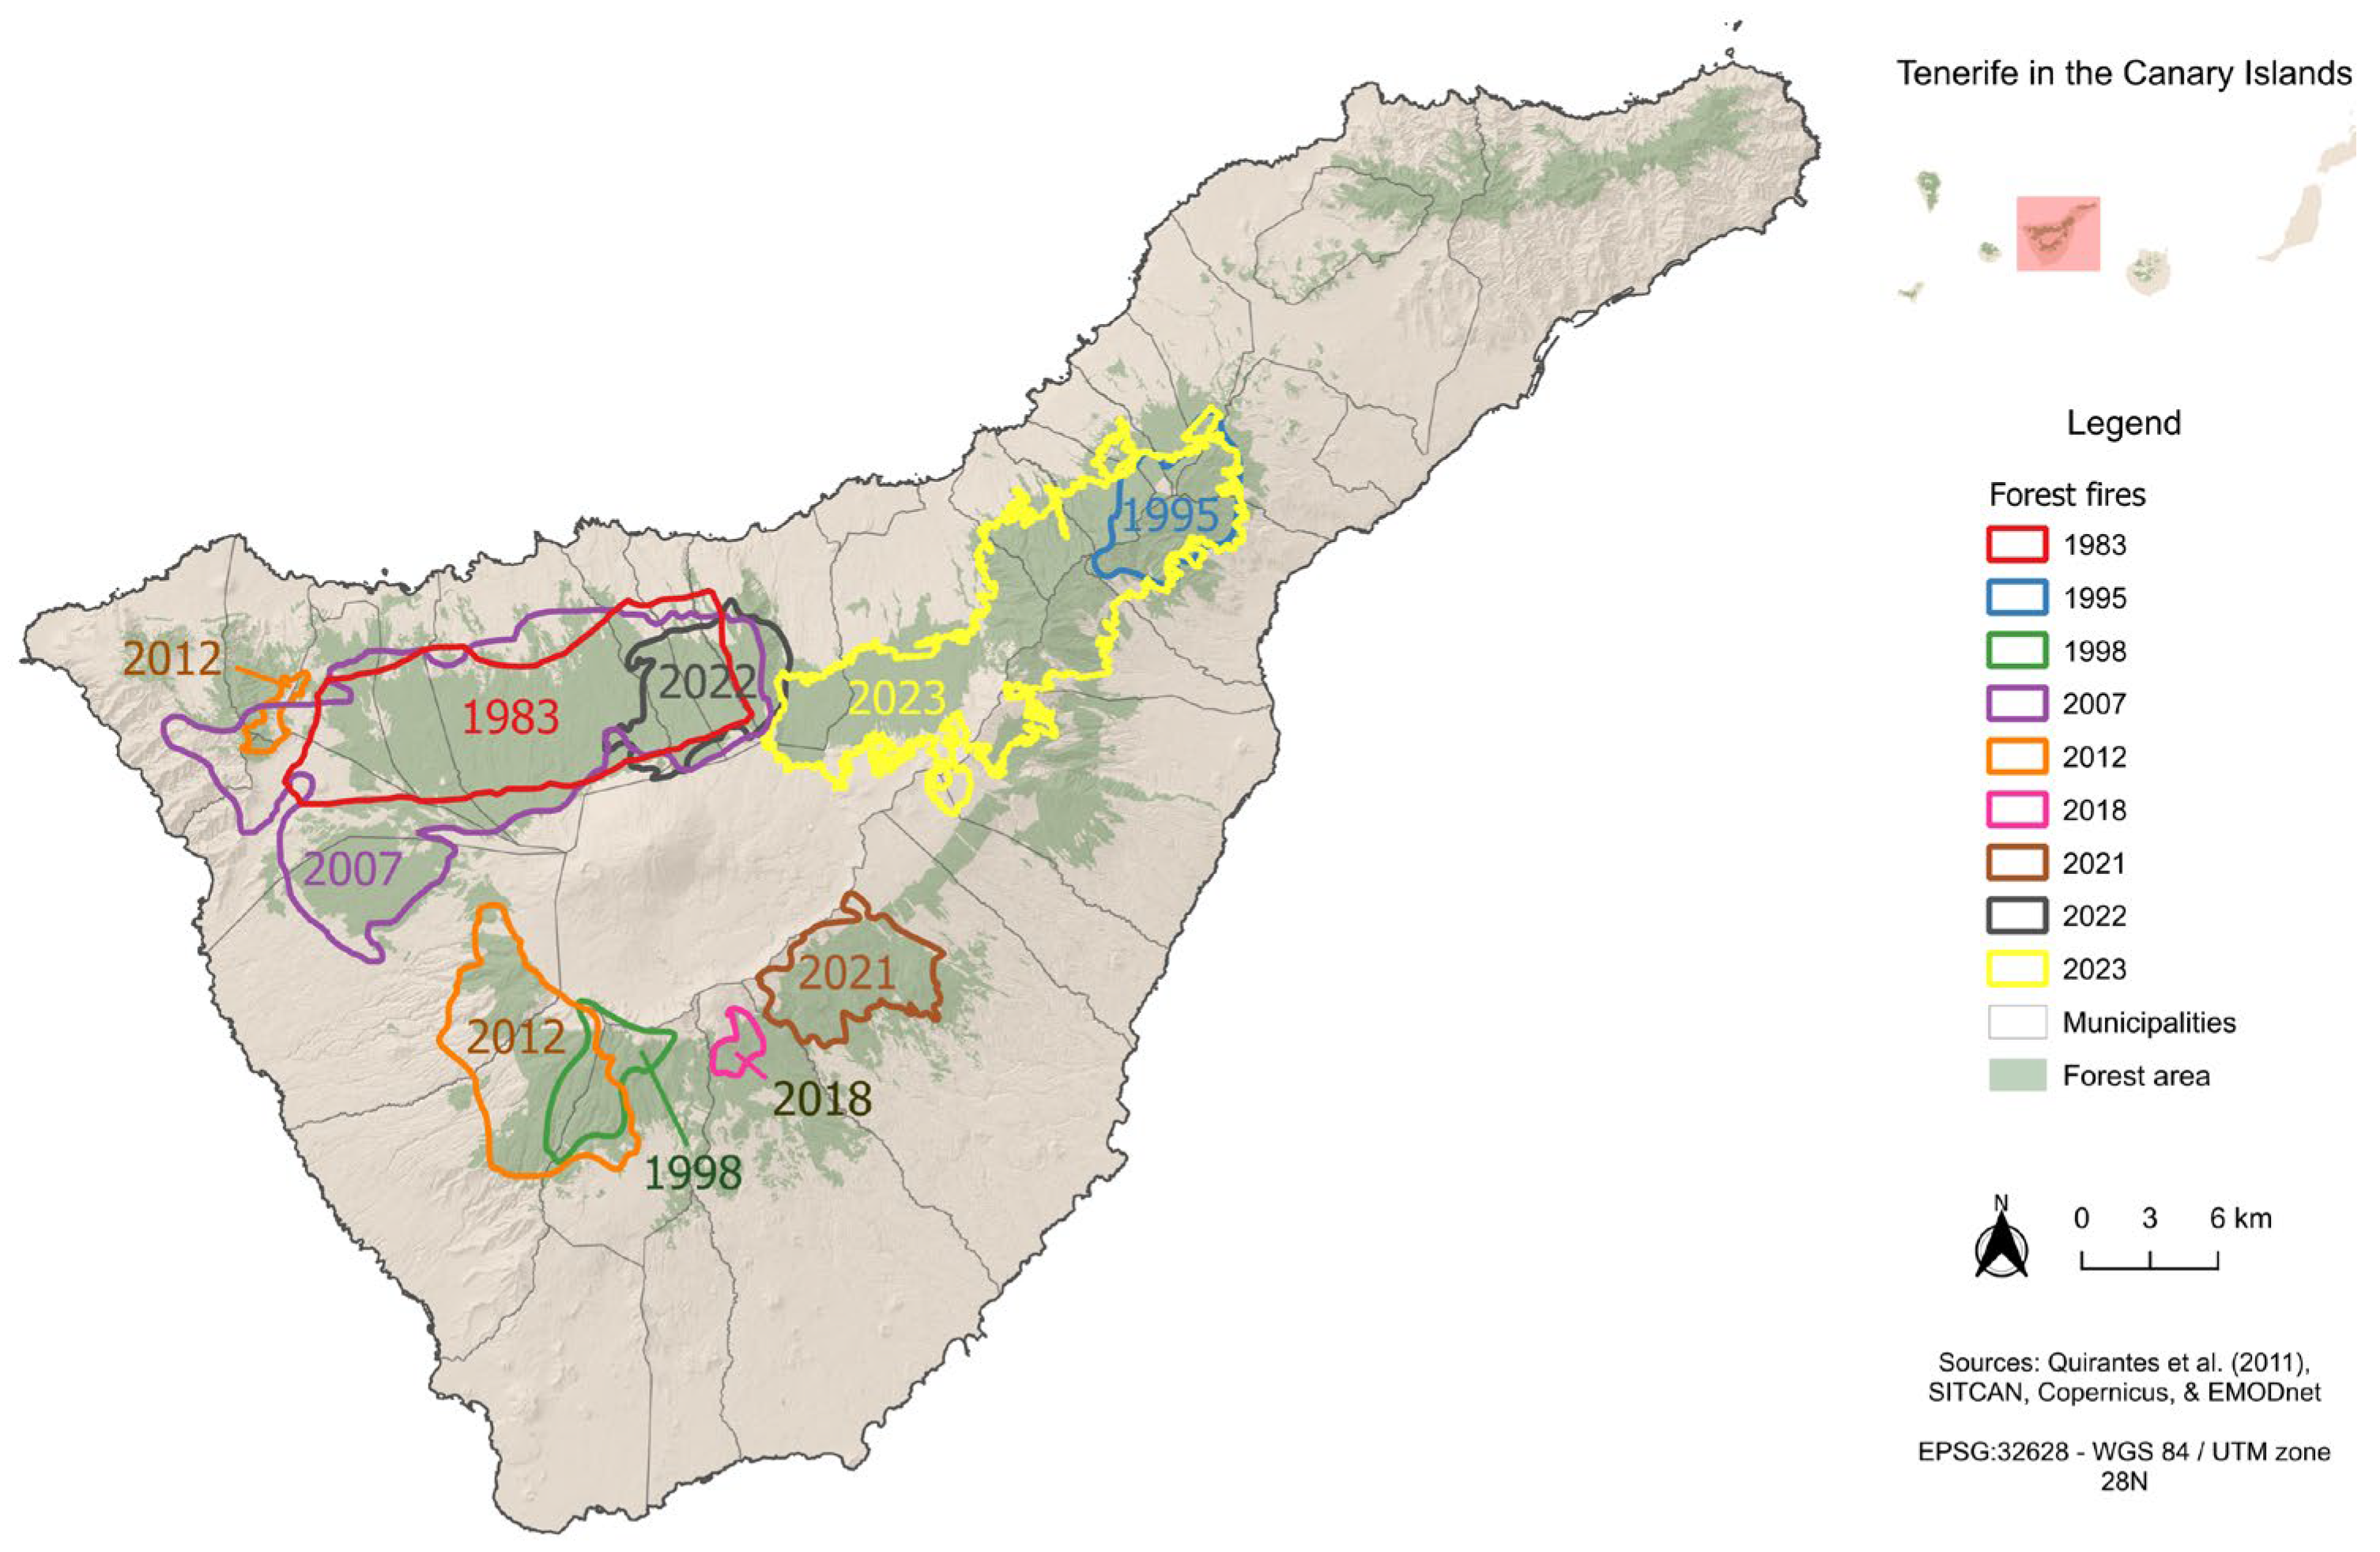
As a consequence of this increase in the risk of forest fires, in recent years, the administrations responsible for forest management have significantly reinforced the extinguishing means, providing them with greater human, material, and financial resources, so that the Canary Islands are among the Spanish autonomous communities with the highest public investment in emergence preparedness against forest fires [24]. However, despite this, fires not only continue to occur, but the most severe have been recorded very recently. The August 2023 fire incident in Tenerife was defined by experts as one of the first sixth generation fires in the island history [25] and as the most severe in Spain in 2023 [26]. Tenerife—2034 km2—is the most populated among the Canary Islands—ca. 1 million inhabitants—and has the largest forest mass. As shown in Figure 2, there have been other large wildfires—1983 and 2007—that affected considerable areas. Nevertheless, the 2023 fire presented particularly complex characteristics, as it impacted areas near highly populated regions and affected both the northern and southern slopes of the main ridge that geographically divides the island, which complicated its control and the distribution of resources on the ground.
In this context, it is necessary to investigate these events of immense magnitude. Despite their severity, few papers have dealt with the study of forest fires in the Canary Islands from a management point of view. In view of the above, this paper has four main objectives: (1) to characterize, from a geographical perspective, the forest fire that took place in August 2023 on the island of Tenerife; (2) to analyze the vulnerability and exposure of the buildings in the urban–forest area affected by the fire; (3) to estimate the value of the assets salvaged thanks to the response strategy designed; and (4) to propose a methodology for the analysis of vulnerability and exposure to forest fires applicable to other areas with Mediterranean environmental features.

2. Materials and Methods

2.1. Fire Characterization and Management

At around 11:00 p.m. on 15 August 2023, the forest fire analyzed in this paper broke out in the municipality of Arafo, on the island of Tenerife, in a sector of forest at about 1200 m.a.s.l. The event began after five days of maximum heat wave alert; from August 10 onwards, maximum temperatures close to 40 °C and relative humidity below 20% with wind gusts above 30 km/h were reached, as recorded at station C438N, located at 463 m a.s.l. in the neighboring municipality of Candelaria [27]. However, as shown in Figure 3, the fire started at a time when temperatures and humidity had returned to more usual values, meaning that the heat wave had ended a day earlier, on 14 August [28]. In any case, there is no doubt that the dryness of the forest environment during those weeks was a decisive factor in its development; in fact, the altitude of the base of the subsidence thermal inversion—which separates in the Canary Islands a layer of lower air, cool and humid, from a layer of upper air, warmer and drier—did not exceed 600 m.a.s.l. between 11 and 19 August.
In terms of the area affected, which amounted to about 14,878 hectares, or just over 7% of the total area of the island of Tenerife (2034 km2), this increased considerably between 18 and 21 August, when more than 11,000 hectares were burned as a result of the advance of the fire towards the northern slope of the island and towards the Teide National Park, whose surface area reached by the fire was finally around 1000 ha. Out of the island’s 31 municipalities, 11 were affected by the fire, whose final balance consists of nearly six-thousand damaged plots of land, eleven viewpoints, nine recreational areas, around 450 km of roads—287 of which are trails in the bush area—and nineteen livestock farms, among other consequences [29]. Approximately 80% of the affected areas corresponded to wooded forest; 52% of this area was covered by Canary pine forest (Pinus canariensis), 44% by fayal-brezal (Morella faya and Erica canariensis), fundamentally, and just over 3% by laurel forest (Laurus, Ocotea). In turn, the unfavorable air quality recorded in up to nineteen municipalities is significant [30], as well as problems in the water supply in the northern part of the island [31] and power outages in some localities [32].
More than 13,000 people were evacuated, most of them between 18 and 19 August because of the advance of the fire during those days in the northern zone. During the most intense days of the event, the number of resources deployed in the field was around 300 during the day and 350–380 at night. The intervention of approximately two hundred members of the Military Emergency Unit is also noteworthy [33]. Likewise, more than twenty aerial means—mostly helicopters— intervened to contribute to the stabilization of the fire, which officially happened on 24 August—it was not considered under control until 11 September [34]. At the beginning of October 2023, as a consequence of an intense heat wave, several reactivations occurred in the northern zone; the most important one took place in the municipality of Santa Úrsula, which resulted in the involvement of about thirty hectares of land and the evacuation of about three thousand people, causing a house to burn down [35]. The fire was declared officially extinguished on 10 November [36].
At the management level, both the PLATECA (Territorial Civil Protection Plan of the Autonomous Community of the Canary Islands) and the INFOCA (Canary Islands Civil Protection and Emergency Plan for Forest Fires) were activated during the fire. Thus, after the aforementioned situation of maximum alert for high temperatures declared by the regional government on 9 August, between the 16th and 27th, the emergency went to Level 2 of INFOCA, that is to say, under the direction of the Government of the Canary Islands. With the sole exception of 4, 5, and 6 October, due to the aforementioned reactivation, the emergency remained at Level 1 from 28 August onward, that is, was coordinated by the Tenerife Island authorities. In early September 2023, the Council of Ministers of the Government of Spain agreed to declare the area affected by the fire as a Severely Affected Area by a Civil Protection Emergency (ZAEPC, for its initials in Spanish), in order to facilitate access to public aid by affected citizens and institutions [37].

2.2. Diagnosis of Vulnerability and Exposure of Buildings Surrounding the Urban–Forest Interface

The analysis of the Tenerife fire of 2023 is based on a multidimensional method known as RETEX—Retour d’Expérience, in French—which combines the experience reported by the people involved in the event with the study of the vulnerabilities and exposure of the buildings in the urban–forest areas and also with a quantification of the value of the assets salvaged as a result of the action of the control and extinguishing teams. This methodology, rarely used in traditional forest fire risk analysis studies, contributes to a global understanding of the emergency by integrating the different factors involved in the phenomenon in question [38,39,40].
In this case, the qualitative data gathered during the fieldwork and interviews with the protagonists—responsible for the management of the emergency—were validated and crossed with quantitative records such as the number of people evacuated, the means deployed, the prevailing weather conditions during the days of the fire, among others. Both methods are complementary; the qualitative method helps to identify the key factors of the disaster, while the quantitative method enables the construction of specific indicators to map the risks—in this case, the event that occurred—and to support public decision making [39,41].
According to Lagadec and Langlois [40], it is a technique that seeks to search for all the factors that have intervened in the shaping of a complex event, dissecting the practices, interactions, and sequences that have shaped the crisis as a whole. Thus, RETEX presents three main analytical steps [42]: (1) collection of all the information necessary for an adequate characterization of the event; (2) analysis of the available data to determine the direct and underlying causes; and (3) extraction of lessons learned from the analysis to improve future decision making. In this sense, this approach shares certain similarities with the traditional case study methodology, although it adopts a more practice-oriented perspective, focused on deriving lessons from a real-life event that has already taken place.
The analysis of vulnerability and exposure of buildings is necessary to identify, evaluate, and spatialize risk, as well as to propose territorial adaptation strategies. As previously mentioned, the buildings under analysis are those located around the urban–forest interface, defined, in essence, as the area where forest space comes into contact with built-up areas [43]. In island territories of small size and high population density, such as the Canary Islands, it is not easy to accurately delimit this area, due to the high degree of urbanization present in them and the blurred boundary between spaces and land uses.
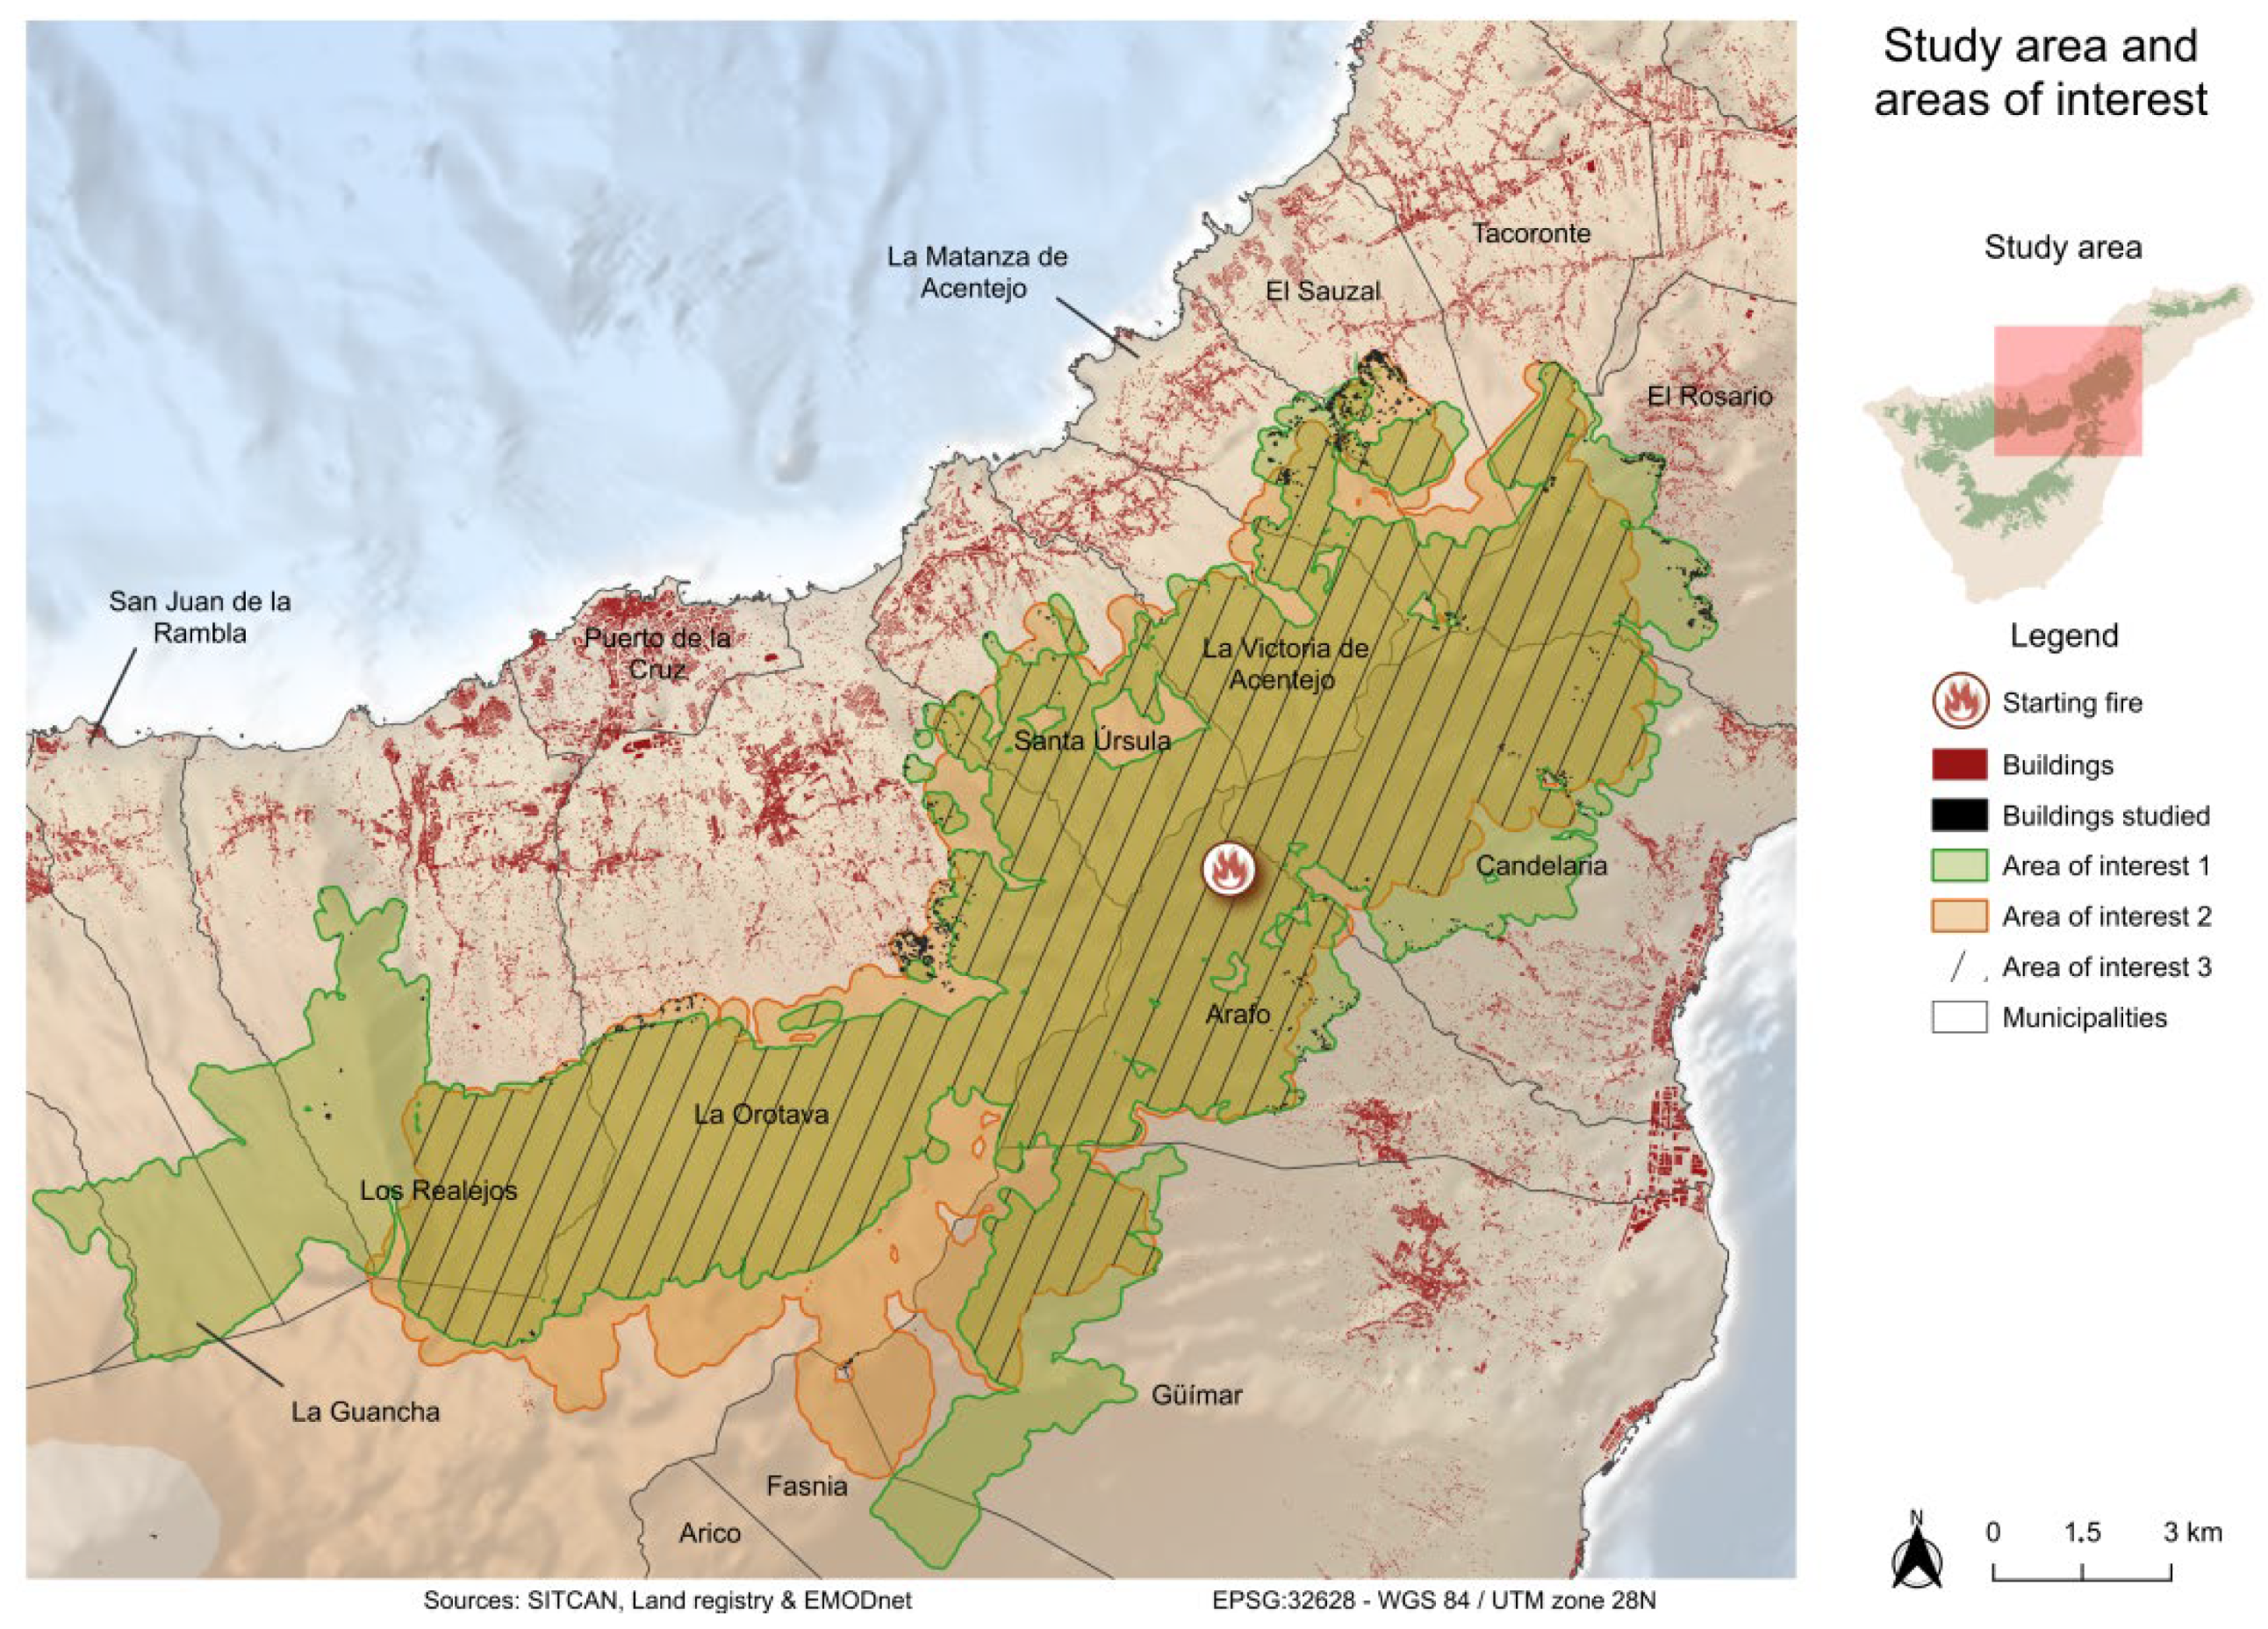
The area of interest for this study is defined as the intersection—overlapping surface—between the forested area [44], including the territory within 200 m thereof, and the area affected by the fire [45], including the 200 m buffer zone (shaded area in Figure 4). Within this defined area, a total of 967 buildings were present and included in the analysis. Of these, 723 buildings were situated within the 200 m wide zone surrounding both the forested and affected areas, while 244 buildings were located within the fire perimeter. However, only approximately 40 of these buildings were directly impacted by the flames, with only one severely damaged, during the reactivation of the fire that occurred in October.
Direct field inspection was complemented with photo interpretation of the buildings, given the difficulty of accessing some of them. It should be noted that, prior to conducting the field work, a sheet was prepared with the criteria considered for the analysis, which are grouped into five vulnerability and exposure indexes that summarize the data collected, as indicated below and subsequently shown in Table 1.

2.2.1. Structural Vulnerability Index (SVI)

This index is based on an assessment of the conditions that increase the vulnerability of buildings in relation to forest fires: construction materials, age of the building, and the presence of shutters or blinds.
Firstly, the study of building materials is essential since elements such as stone, concrete, or steel offer high fire resistance, while others, such as wood or plastic, are flammable and therefore tend to increase the vulnerability of the building. Likewise, the presence of shutters or some types of blinds limits the heating of glass and makes it difficult for flames to enter the interior of the building [46], considering that windows are the weakest points of dwellings in the face of fire. Finally, it is estimated that older buildings have a higher degree of vulnerability because, in general, they are built with less fire-resistant materials, tend to be more deteriorated, and are not adapted to current safety and risk prevention regulations. To evaluate the age of the buildings, the date recorded in the Spanish Land Registry [47] was consulted. In the case of buildings without information in this regard, this field was completed based on the observation made in situ and, in addition, based on the age of the nearest buildings, if any.

2.2.2. Accessibility Exposure Index (AEI)

This index, assessed in situ, refers to the analysis of the road network in the vicinity of the building, as well as the distance between the building and the extinguishing means. Therefore, it is related to the typology of the road network; bidirectional roads facilitate rapid interventions, while one-way or dead-end roads complicate access for intervention teams and evacuations [46]. In turn, unobstructed, wide, and paved roads favor greater agility in response. Finally, the shorter the distance between the buildings and the extinguishing means, the greater, a priori, the speed of response to the event.

2.2.3. Territorial Exposure Index (TEI)

This is a study of the territorial characteristics—slope, proximity to ravines, and type of settlement around the urban–forest interface—that increase the exposure of buildings to the risk of forest fires. Thus, steep slopes make fire response difficult, just as ravines facilitate the spread of fire due to the vegetation accumulated in them and their inaccessibility. In terms of settlement, within the area of contact between the forest mass and the built-up areas, dense housing developments generally present less risk than dispersed and isolated buildings, whose access is more complex for the means and whose proximities are usually colonized by more vegetation. The average slope in the vicinity of the building was calculated from the Digital Elevation Model with 5 m grid spacing offered by the National Center for Geographic Information (CNIG, for its initials in Spanish) [48]. The ravines considered were taken from the Tenerife island inventory of watercourses [49], while the assessment of the type of settlement was carried out in situ.

2.2.4. Vegetation Exposure Index (VEI)

In this case, the distance between buildings and forest areas, the proximity to trees, and the presence of particularly pyrophytic vegetation in their vicinity are considered. Thus, the smaller the distance of the buildings from the forest mass, the greater the exposure to fires [50], especially in cases where the surrounding vegetation burns easily or in buildings very close to the tree canopy. Regarding the sources consulted for the assessment of this index, the delimitation of the forest area comes from the Forestry Map of Spain [44]. For its part, the presence of pyrophytic vegetation is linked to forest fuel models in the Canary Islands [51]. In this case, the maximum exposure is assigned to buildings located near the fuel models 6, 7, 8, and 9 proposed by Rothermel [52]. These models include dense thickets with dry hardwood debris, thickets under 2 m in height, pine forests with flammable undergrowth, closed coniferous or hardwood forests with compact litter and minimal undergrowth, and forests with less compact litter, such as longleaf pine forests [53]. High exposure is associated with Rothermel’s models 4 and 5, which include low thickets that cover large areas and thickets about two meters tall, as well as densely regenerated or young repopulated areas. Moderate exposure is linked to models 2 and 3, which involve dry and/or dead fine herbaceous fuels, as well as model 11, which represents clear or heavily cleared forests. Finally, lower exposure is attributed to other fuel models that generally propagate more slowly and are less prevalent in the Canary Islands.

2.2.5. Fire-Affected Vegetation Index (FAVI)

Finally, an evaluation of the vegetation affected by the 2023 fire in the vicinity of the buildings was included as a control variable. This index, which, unlike the previous ones, is made up of a single criterion, is justified because the presence of charred vegetation in the vicinity of buildings represents a reliable indicator of their degree of vulnerability and exposure; i.e., it condenses all the aspects involved in the characteristics of buildings in relation to forest fire risk.
Table 1 summarizes the criteria used to evaluate the risk of buildings in forest fires. As can be seen, each of the thirteen criteria included is scored between 0.5 and 2, with 2 representing the maximum degree of exposure and/or vulnerability.
Each of the indexes SVI, AEI, TEI, and VEI is built up of 3 criteria, scored between 0.5 and 2. Thus, each index may obtain the values of 1.5 in the best case and 6 in the worst case. In the case of FAVI, since it consists of a single criterion, it fluctuates between 0.5 and 2. Finally, the following global index is obtained, called the Wildfire Risk Building Vulnerability and Exposure Index (WR-BVEI), with a maximum value of 26:
WR-BVEI = SVI + AEI + TEI + VEI + FAVI
As an example, a house with moderately flammable structural materials (1.5), no blinds or shutters (2), and built in 1960 (1.5) would score 5 on the SVI. In the AEI, however, its rating would be 2, as it has a bidirectional access road (0.5) in excellent condition (0.5) and is located 10 min away from firefighting resources (1). Once all the criteria and subindices were evaluated using the same logic, the results would be summed to obtain the WR-BVEI for the house in question.
The index results are grouped into the vulnerability and exposure categories shown in Table 2:
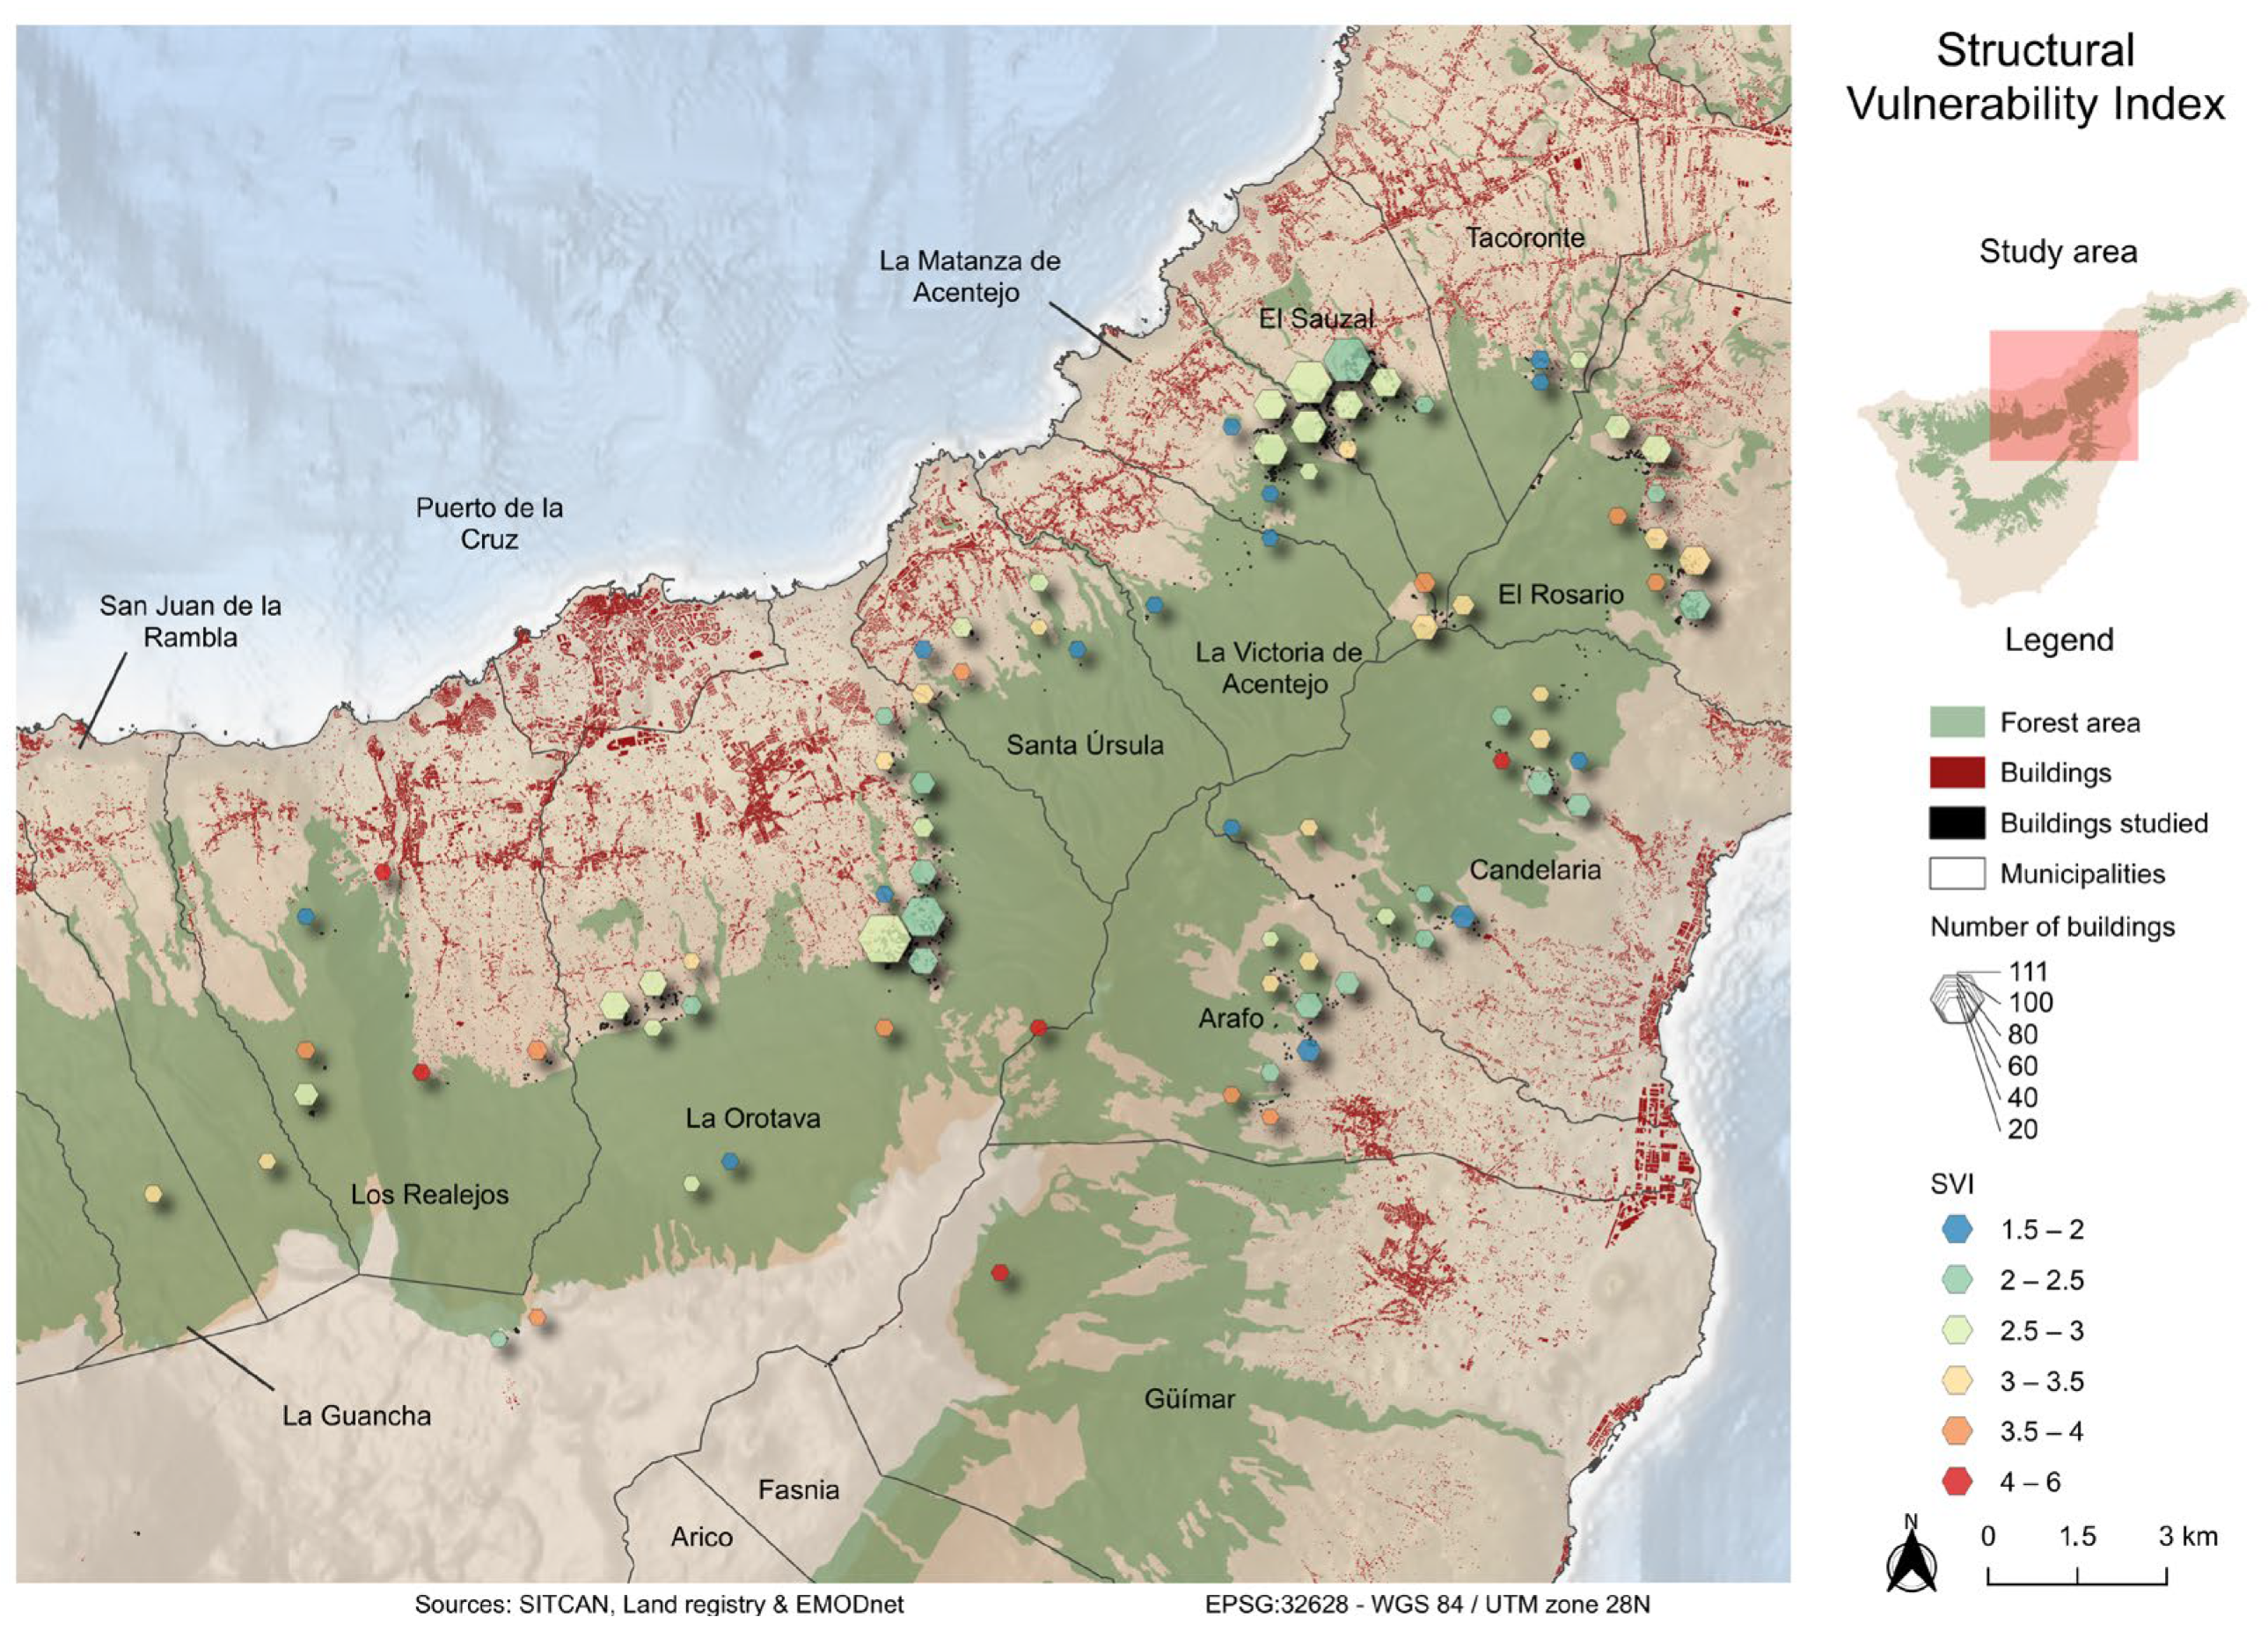
Note that the results of the different indexes are grouped into hexagonal grids originally of 750 m on each side where the values obtained in all the buildings in the area are averaged. In the maps included in the Results Section, the size of the hexagons is proportional to the number of buildings included in each of them.

2.3. Assessment of the Value of the Salvaged Assets

2.3.1. Delimitation of Fire Spreading Sectors

According to Moreira et al. [54], the effectiveness of forest fire management policies should not be evaluated according to the area burned but according to the socio-ecological damage avoided. Despite this, civil protection services, although considered essential, are often perceived as an expense rather than an investment [55]. Accordingly, the French École nationale supérieure des officiers de sapeurs-pompiers (ENSOSP) recommends a better evaluation of the value of the salvaged in order to adjust fire prevention and firefighting resources [56]. Therefore, the objective of this approach is to assess the financial and social benefits of firefighting services, proving their importance in civil protection and making it possible to communicate in a transparent manner the effectiveness of firefighting and control interventions to public authorities, the civilian population, and the sources of funding for emergency services [56].
Consequently, this approach raises the following question: What would have happened in the absence of the extinguishing services? The notion of the value of the salvaged is thus defined as “the difference between the hypothetical damage in the event of non-intervention by firefighting teams and the actual damage observed after the intervention” [56].
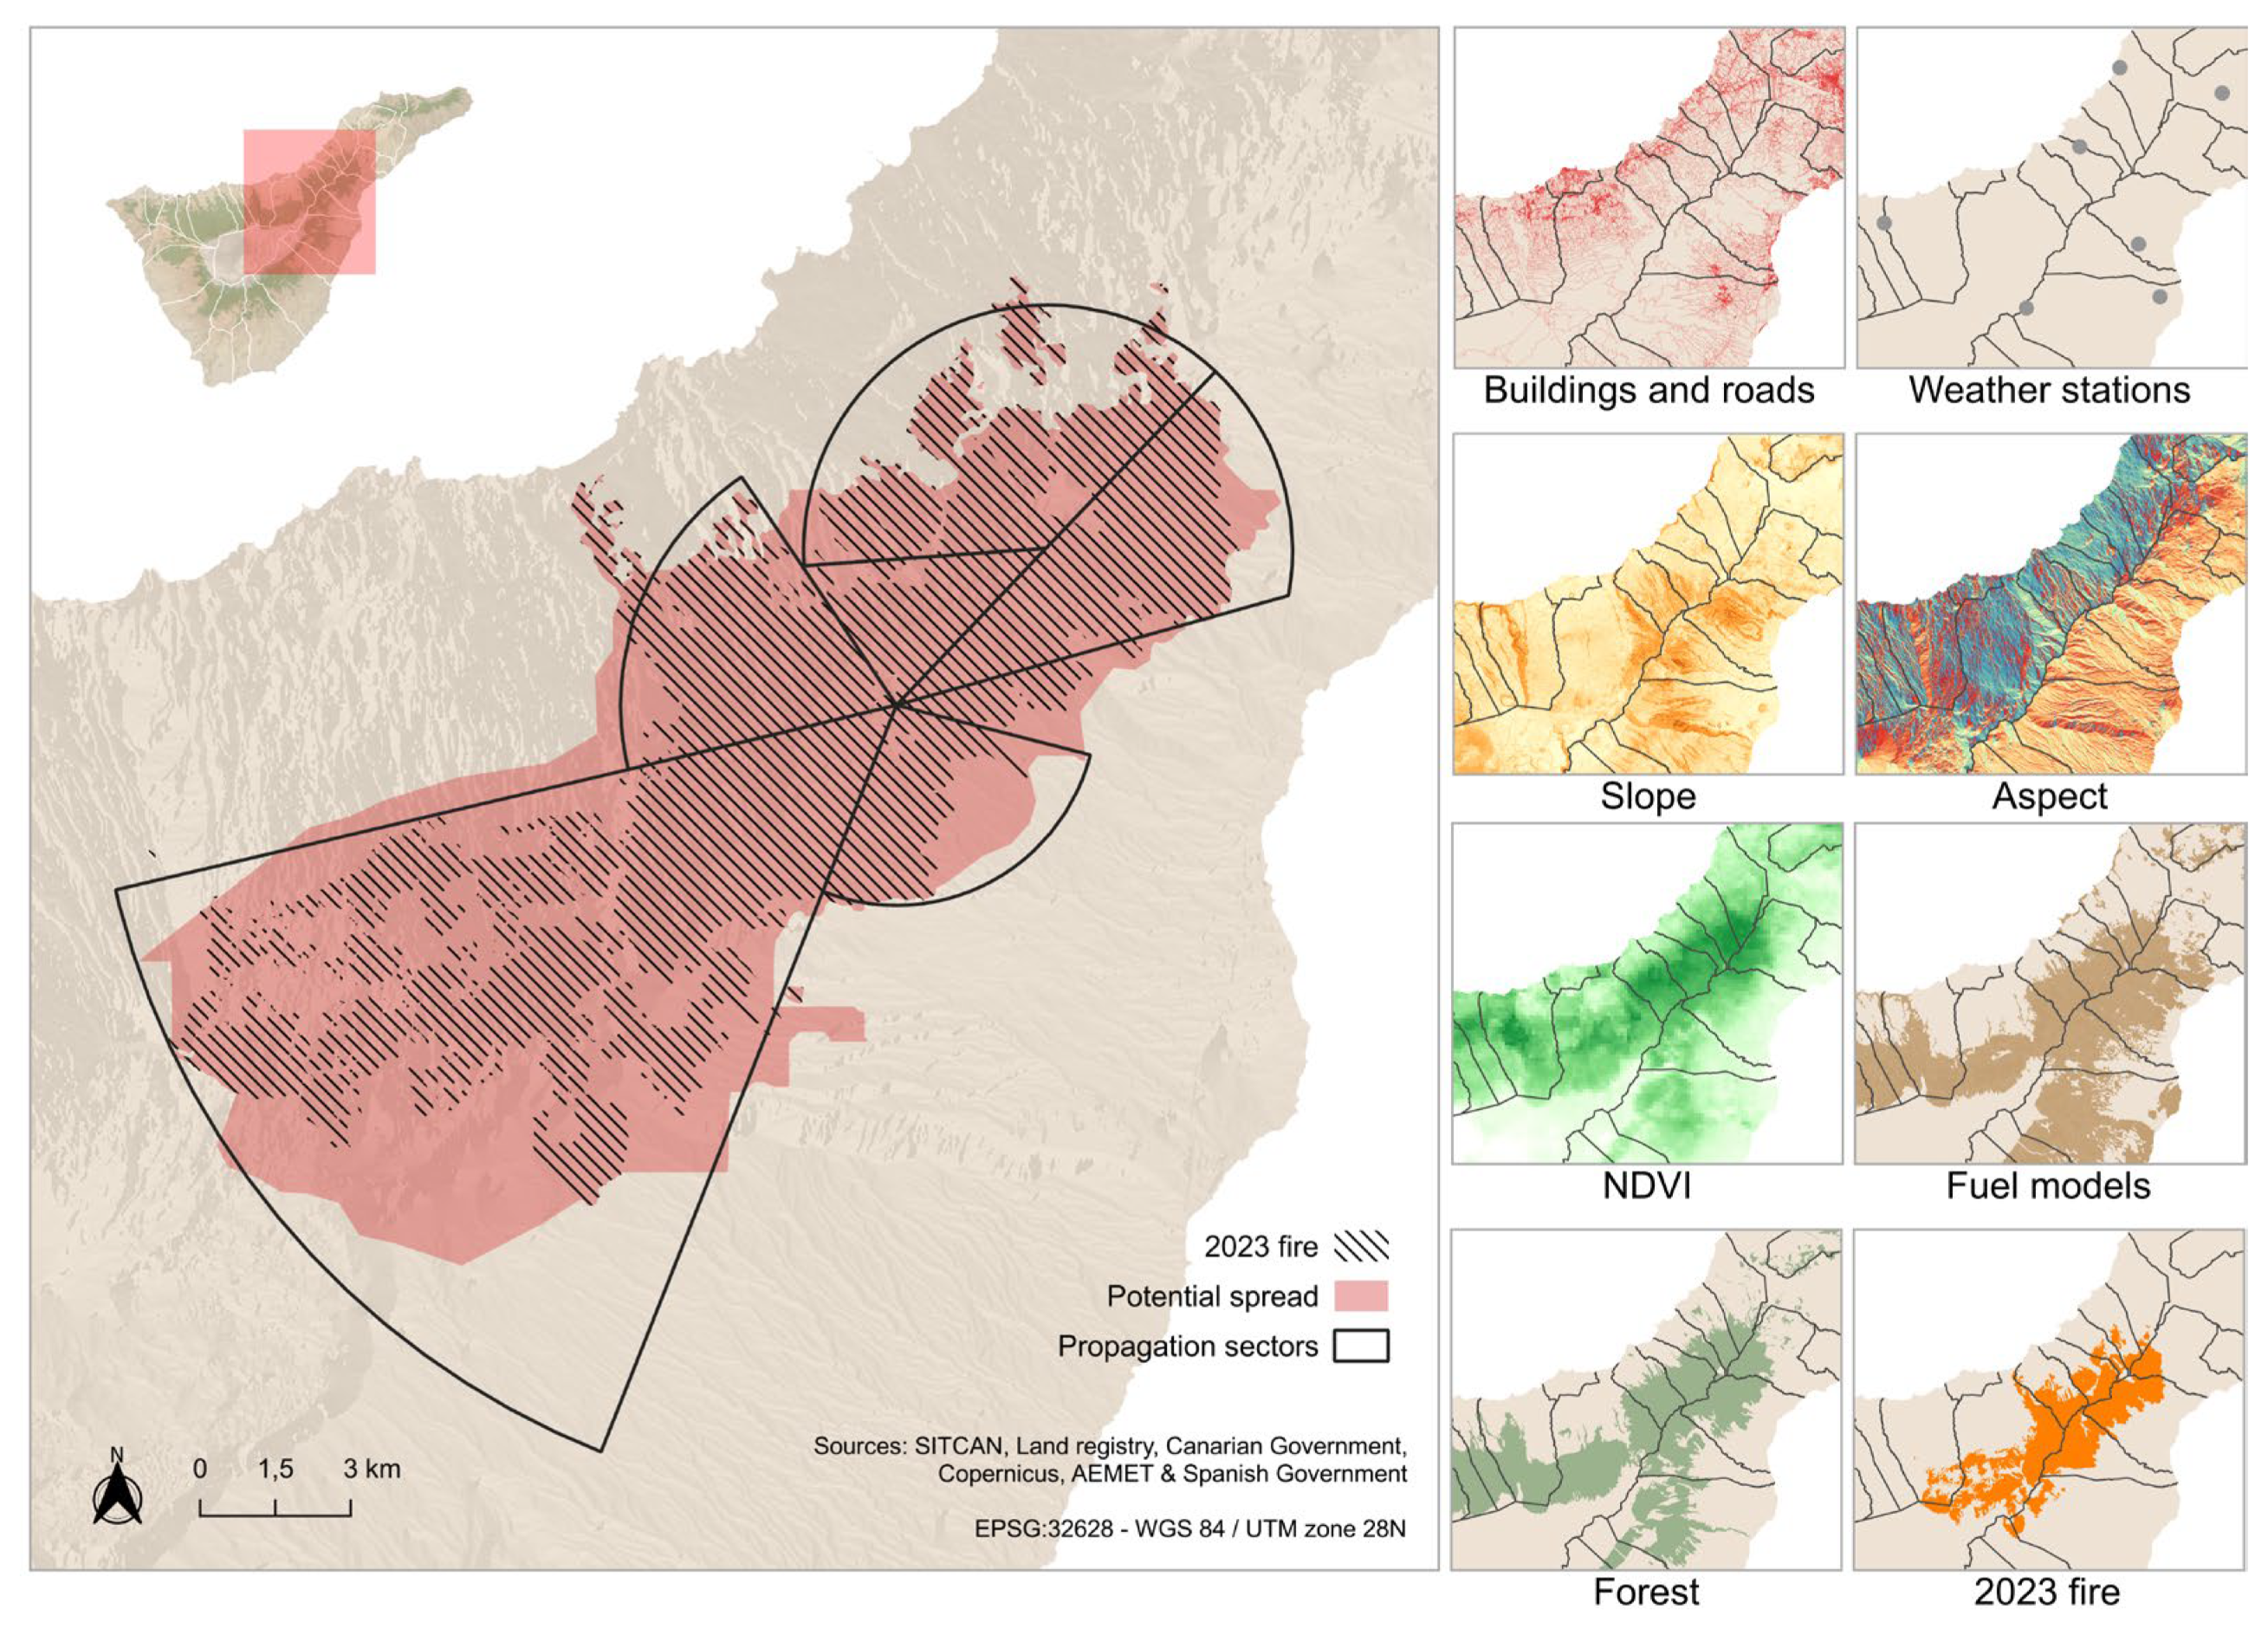
The method used to assess the amount of protected property is based on geographical and topographical assumptions to define different fire spread sectors and thus estimate a hypothetical extension beyond the actual final perimeter. Specifically, taking as a reference the different directions and speeds of fire advance, as well as the evolution of the wind—direction and intensity—, based on the analysis of the hot spots of the European Forest Fire Information System—EFFIS—, six spreading sectors were defined as areas potentially affected by the fire, if the intervention had been ineffective, as shown in the Results section.
As will be explained later, the delineation of the sectors was based on an empirical analysis of the fire behavior during the days that it remained active. In addition, several complementary criteria were considered, including the direction and speed of fire spread from its starting point in the municipality of Arafo, the island’s topography, and land use distribution, among others. The definition of the sectors was supported by the analysis of satellite imagery during different phases of the fire, historical wildfire maps since 1980, the identification of the most hazardous forest fuel models in the Canary Islands context, and interviews with emergency technicians and civil protection staff involved in managing the fire. It is important to note that the boundaries of these sectors were adjusted to include only forested and agricultural land, excluding urban areas, in order to represent regions with high potential exposure. This territorial segmentation allowed for the structuring of damage analysis and the subsequent validation of the predictive model.
Subsequently, to assess the extent to which the delineated sectors coincided with the potential fire spread digitally modeled, a spatial prediction model was developed using machine learning techniques, specifically the Random Forest algorithm. Random Forest has been widely used by various authors to model wildfires, and it is one of the most commonly employed algorithms today [57,58,59]. The study area was discretized into a regular grid of 100 m resolution cells and projected to the REGCAN95/UTM Zone 28N reference system EPSG:4083.
Each grid point was characterized by explanatory variables derived from raster and vector sources. The variables used included average temperature, average relative humidity, wind speed, and direction—averaged between 21 and 27 August, the last active week of the fire—terrain slope and aspect, NDVI vegetation index, distance to road networks and buildings, forested areas, and the presence of hazardous forest fuels (Figure 5). The target variable was defined as the presence or absence of fire impact, determined by the intersection of grid points with the official fire perimeter.
A random sample of 10,000 observations was selected to train a Random Forest model with 500 trees. Variable importance was examined, and the model was subsequently validated using a holdout test set (30% of the data) yielding accuracy and AUC values above 80%, thus confirming its strong predictive capability.
Once trained and validated, the model was applied to all grid points to estimate the probability of fire impact. Points with a predicted probability greater than 0.5 were classified as potentially affected. From this subset, a potential fire spread polygon was constructed using the concaveman algorithm, which generates a non-convex hull adapted to the spatial distribution of the predicted points.
This approach provided an objective method to compare the empirically delineated fire spread sectors with the model-based prediction. The observed spatial concordance between both outcomes reinforces the validity of the delineation criteria and illustrates the usefulness of integrating local territorial knowledge with machine learning techniques for wildfire risk analysis.

2.3.2. Estimation of the Economic Value of the Salvaged

Based on the above, the salvaged area is quantified by subtracting the area actually affected by the fire from the area of each sector. Economic quantification is based on TEV (Total Economic Value), based on three essential pillars: (1) use value—derived from the current use of a good or service; (2) non-use value—not associated with current or optional uses of a good or service; and (3) option value—linked to the value assigned by people to a good or service based on the possibility of using it at some point in time [60].
Table 3 shows the considered salvaged items—tangible and intangible—as well as the value assigned to each one.
Inevitably, the quantification carried out is based on average values and simplified assumptions, such as the normalization of housing prices. Similarly, some components of TEV were not included due to lack of reliable data, potentially underestimating the total value of preserved areas. In any case, both the layout of the spreading sectors and the value assigned to each element make up an indicative proposal that is useful for an approximate quantification of the real and avoided damage of the event. Although other formulas could have been devised, the estimate of losses made by the Government of the Canary Islands amounts to EUR 177 million [68], a figure similar to that obtained in this paper based on the aspects considered, 164 million plus another 10 million corresponding to the operation, which validates the proposed methodology.
In any case, considering the value per hectare—or per square meter in the case of buildings—of each of the elements presented, this value was multiplied by the actual area affected or preserved, resulting in a final figure presented in the Results Section. For example, as will be detailed later, the value of one hectare of crops is estimated at EUR 83,299/ha. Given that 511,934 ha were preserved, the total value of the preserved area amounts to EUR 7,238,662, while the actual loss corresponds to EUR 9,497,817, associated with 109,928 ha affected by the fire.

3. Results

3.1. Building Vulnerability and Exposure Analysis

Out of 967 buildings analyzed, about 13% are located in the altitudinal range 0–750 m.a.s.l., while 37% are located between 750 and 850 m, 13% between 850 and 950 m, 28% between 950 and 1050 m, and, finally, 9% above 1050 m.a.s.l. In order to facilitate the interpretation of the results, the buildings are grouped into these altitude ranges, differentiating between those located on the windward (north) and leeward (south) slopes of the island, which represent 78% and 22% of the total number of buildings, respectively. This disparity between the buildings studied by slope is explained by the greater effect of the fire on municipalities and population centers in the north of Tenerife.

3.1.1. Structural Vulnerability Index (SVI) Results

The buildings analyzed average a score of 2.7 out of 6 in the SVI, which points to a moderate structural vulnerability in relation to materials, age, and the presence of shutters or blinds in the buildings. This type of vulnerability is higher in buildings located above 1050 m.a.s.l. (slightly above 3), both in the north and in the south, while it tends to be lower in the lower areas of the south and in some midland sectors of the municipalities on the northern slope (Figure 6).
These modest index values are largely explained by the materials used in the buildings. Thus, around 99% of the constructions studied have non-flammable materials—cement, stone, brick, etc., while buildings with more flammable materials, such as wood or plastic, are in the minority. In turn, 60% of the buildings have blinds or shutters; there are proportionally more homes with shutters in the north (62%) than in the south (54%).
In terms of the age of the buildings, around 7% of the total (only 68) date back to 1950 or earlier, while 246 (25%) were built between 1951 and 1975, 425 (44%) between 1976 and 1999, and, finally, 228 (24%) after 1999. Therefore, almost 70% of the buildings analyzed were built after 1975, which shows the accelerated construction process in the area around the urban–forest interface. The oldest buildings tend to be located over 950 m.a.s.l. on the northern slope, remaining scarce in other altitudinal bands, especially in the south. On the contrary, the most recent constructions—since 1976—are located on the very edge of the forest mass, only a few hundred meters away from the forest and progressively entering into spaces formerly occupied by wooded or cultivated areas.

3.1.2. Accessibility Exposure Index (AEI) Results

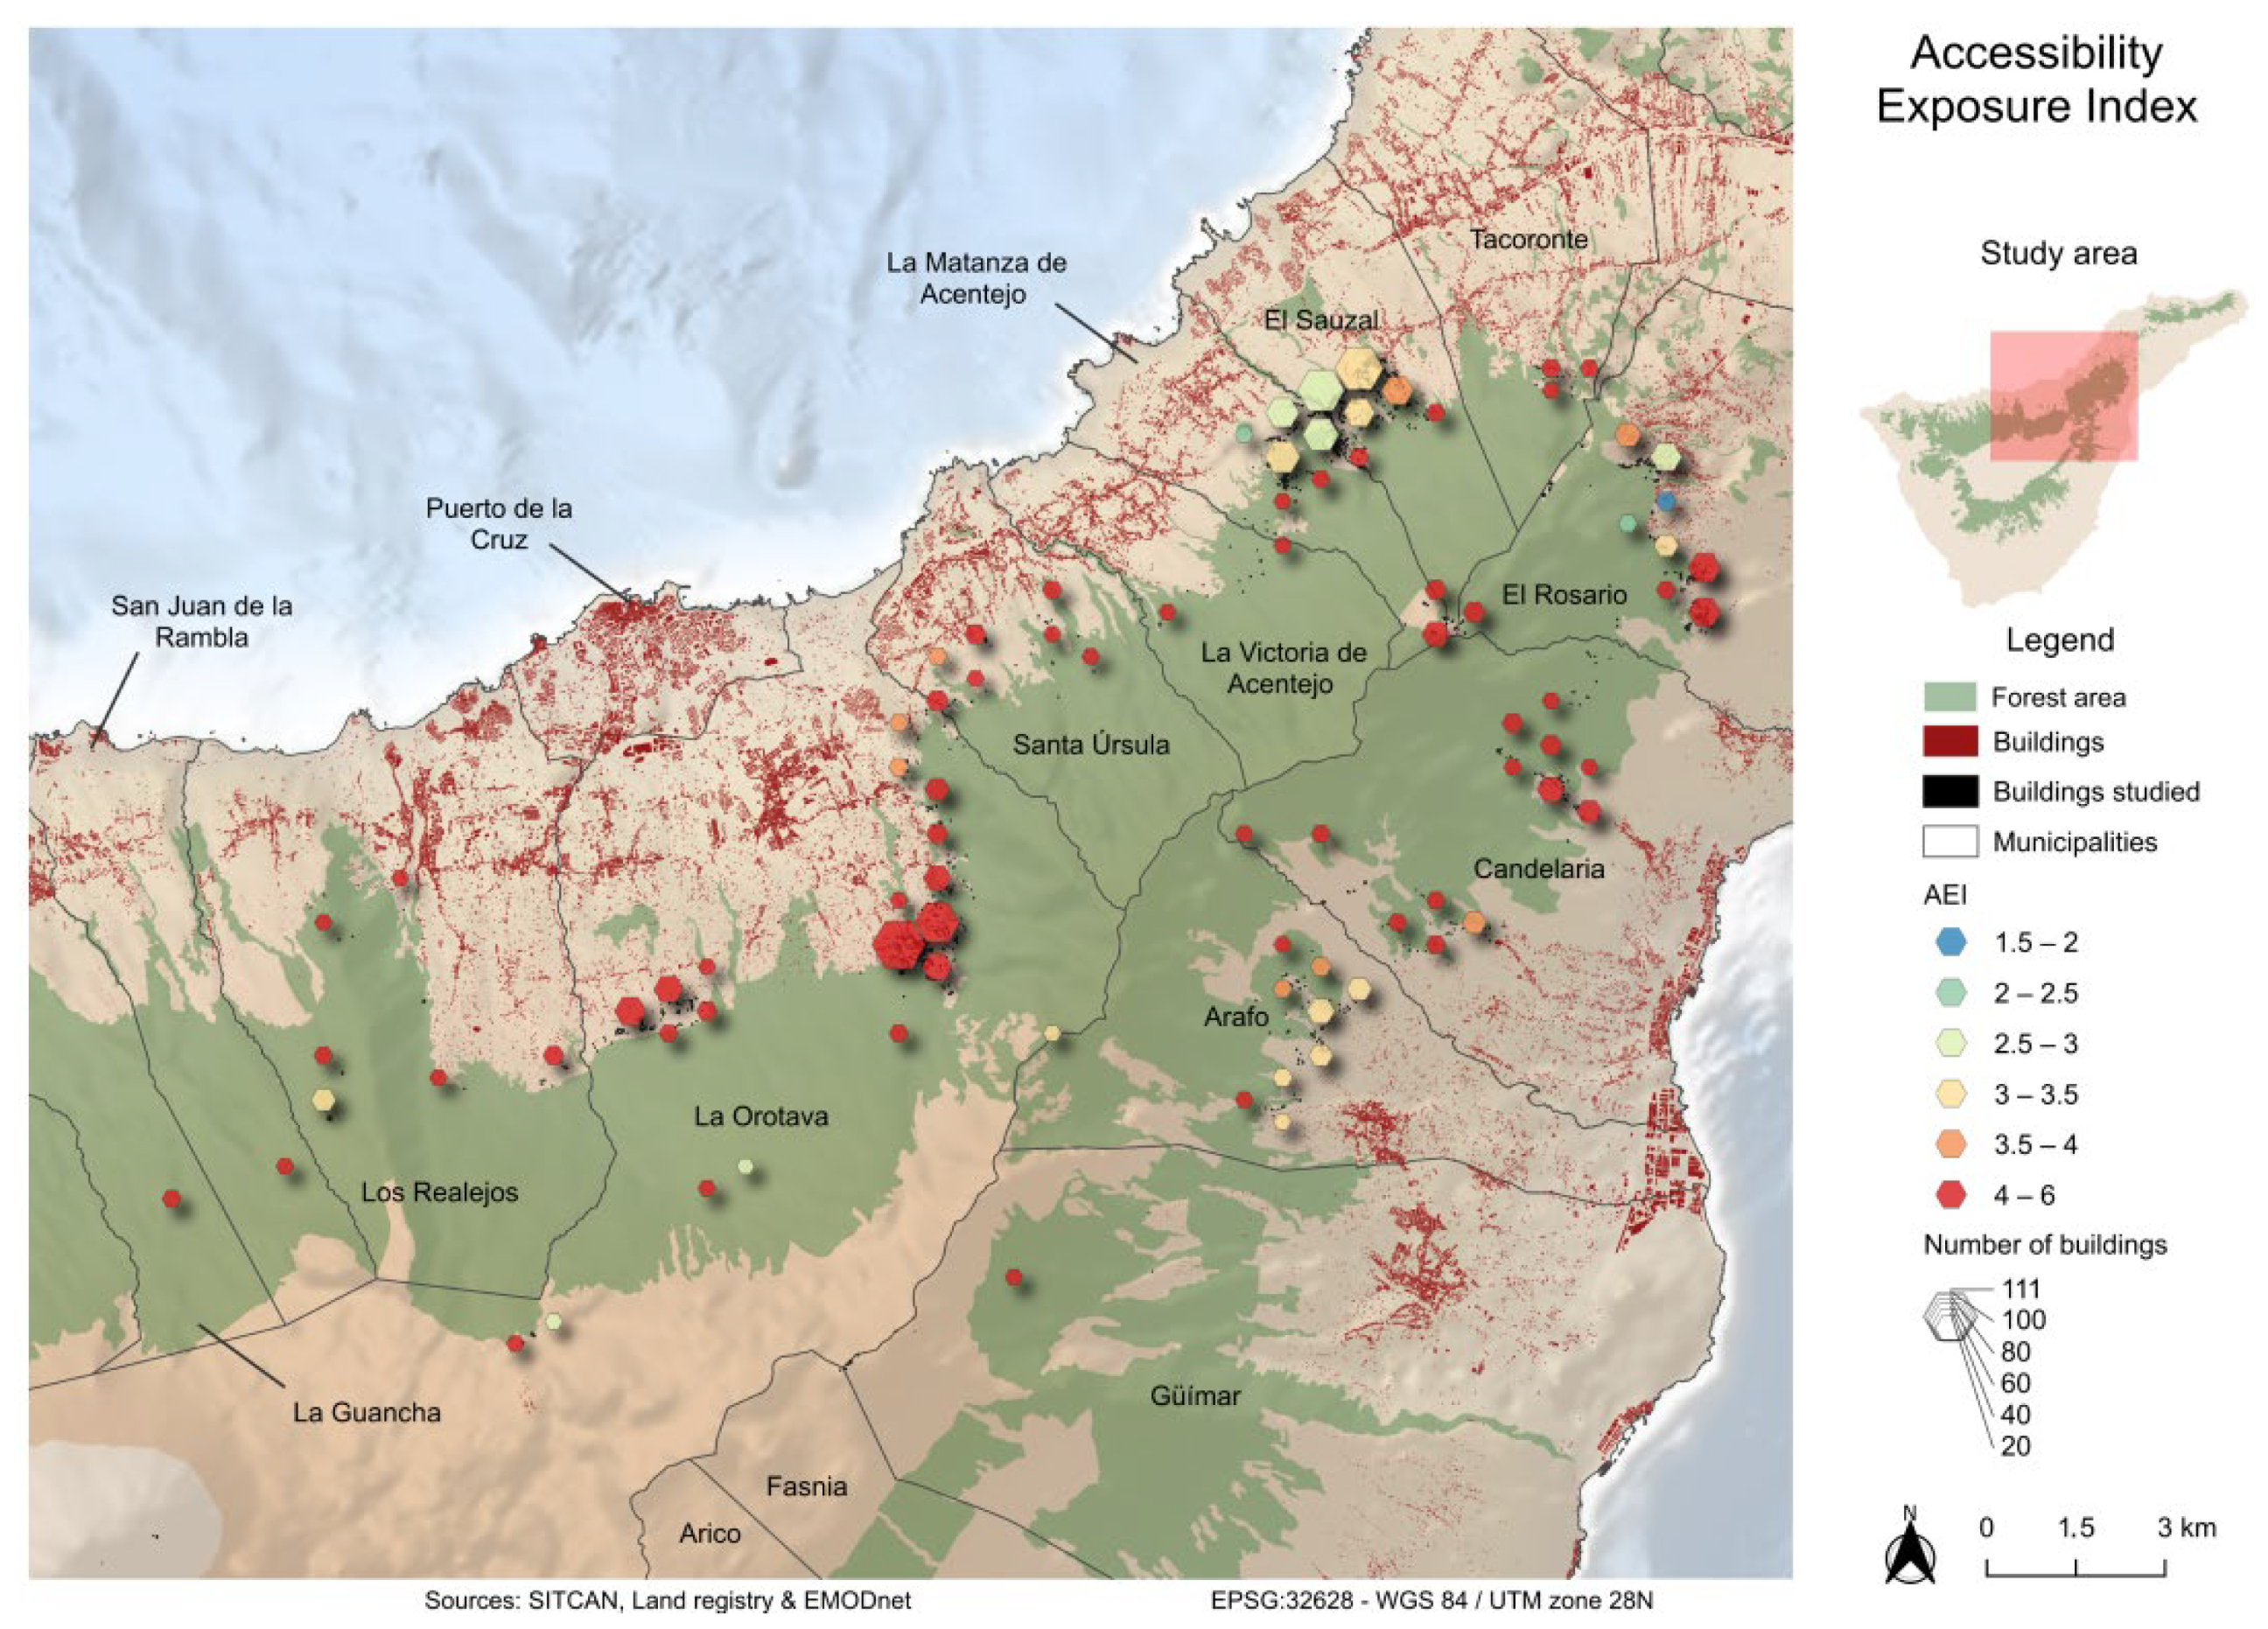
The buildings included in this study average 3.8 points out of a maximum of 6 in the AEI. A total of 37% of the buildings have an accessibility-related exposure equal to or higher than 4.5 points, while, in 9% of the buildings, this index registers 5.5 or 6, so that, as shown in Figure 7, the results are low in many areas.
The criterion relating to the condition of the access road network to buildings averages 1.3 out of 2, which indicates poor road maintenance in the vicinity of the buildings; in fact, 26% of the roads are considerably deteriorated. The access road network can only be considered “good” or “excellent” in the vicinity of 37% of the buildings studied. In 49% of the cases, the access road is bidirectional, with only 4% having no exit. Furthermore, 97% of these roads are in a poor state of conservation, which results in a high exposure of the houses located in their surroundings.
Regarding the distance between the buildings and the extinguishing means, 38% of the buildings are more than 30 min away from them, while only 10% are less than 15 min away. Thus, around 52% of the buildings considered are located at a temporary distance of between 15 and 30 min from an installation belonging to the extinguishing units.

3.1.3. Territorial Exposure Index (TEI) Results

The average score recorded for buildings in the TEI is 3.4 out of 6 (Figure 8), with proximity to ravines as the criterion that averages the highest score (1.2 out of 2). Thus, the proximity between the buildings and the ravines is remarkable; the average distance is 141 m, with 22% of the constructions less than 50 m from the ravines. In turn, only 9% of the buildings are separated from the ravines by more than 300 m.
As for the slope of the land within a radius of 100 m around the buildings, the average slope is 1.1, with an average of 14° within this radius. Twenty-two percent of the buildings are located in environments with very steep slopes(more than 25°), while 25% are located in areas with low slopes (less than 10°).
Finally, in terms of the type of settlement around the urban–forest interface in which the buildings are located, 33% of them are in areas of isolated or dispersed settlement, while 45% are found in densely populated areas, and the remaining 22% in very densely urbanized areas.

3.1.4. Vegetation Exposure Index (VEI) Results

The VEI averages 3.3 points, being ostensibly higher in those parts closest to the forest areas (Figure 9). Twenty-eight percent of the buildings are located less than 50 m from forest areas, and 49% of the total number of buildings have tree canopies less than ten meters away; in 80% of the cases, the canopies are located less than thirty meters away.
The analysis of the presence of potentially pyrophytic vegetation in the surroundings of the buildings also yields significant results. In total, 53% of the buildings have vegetation of these characteristics within 30 m, and only 26% do not have these fuel models within 100 m.

3.1.5. Fire-Affected Vegetation Index (FAVI) Results

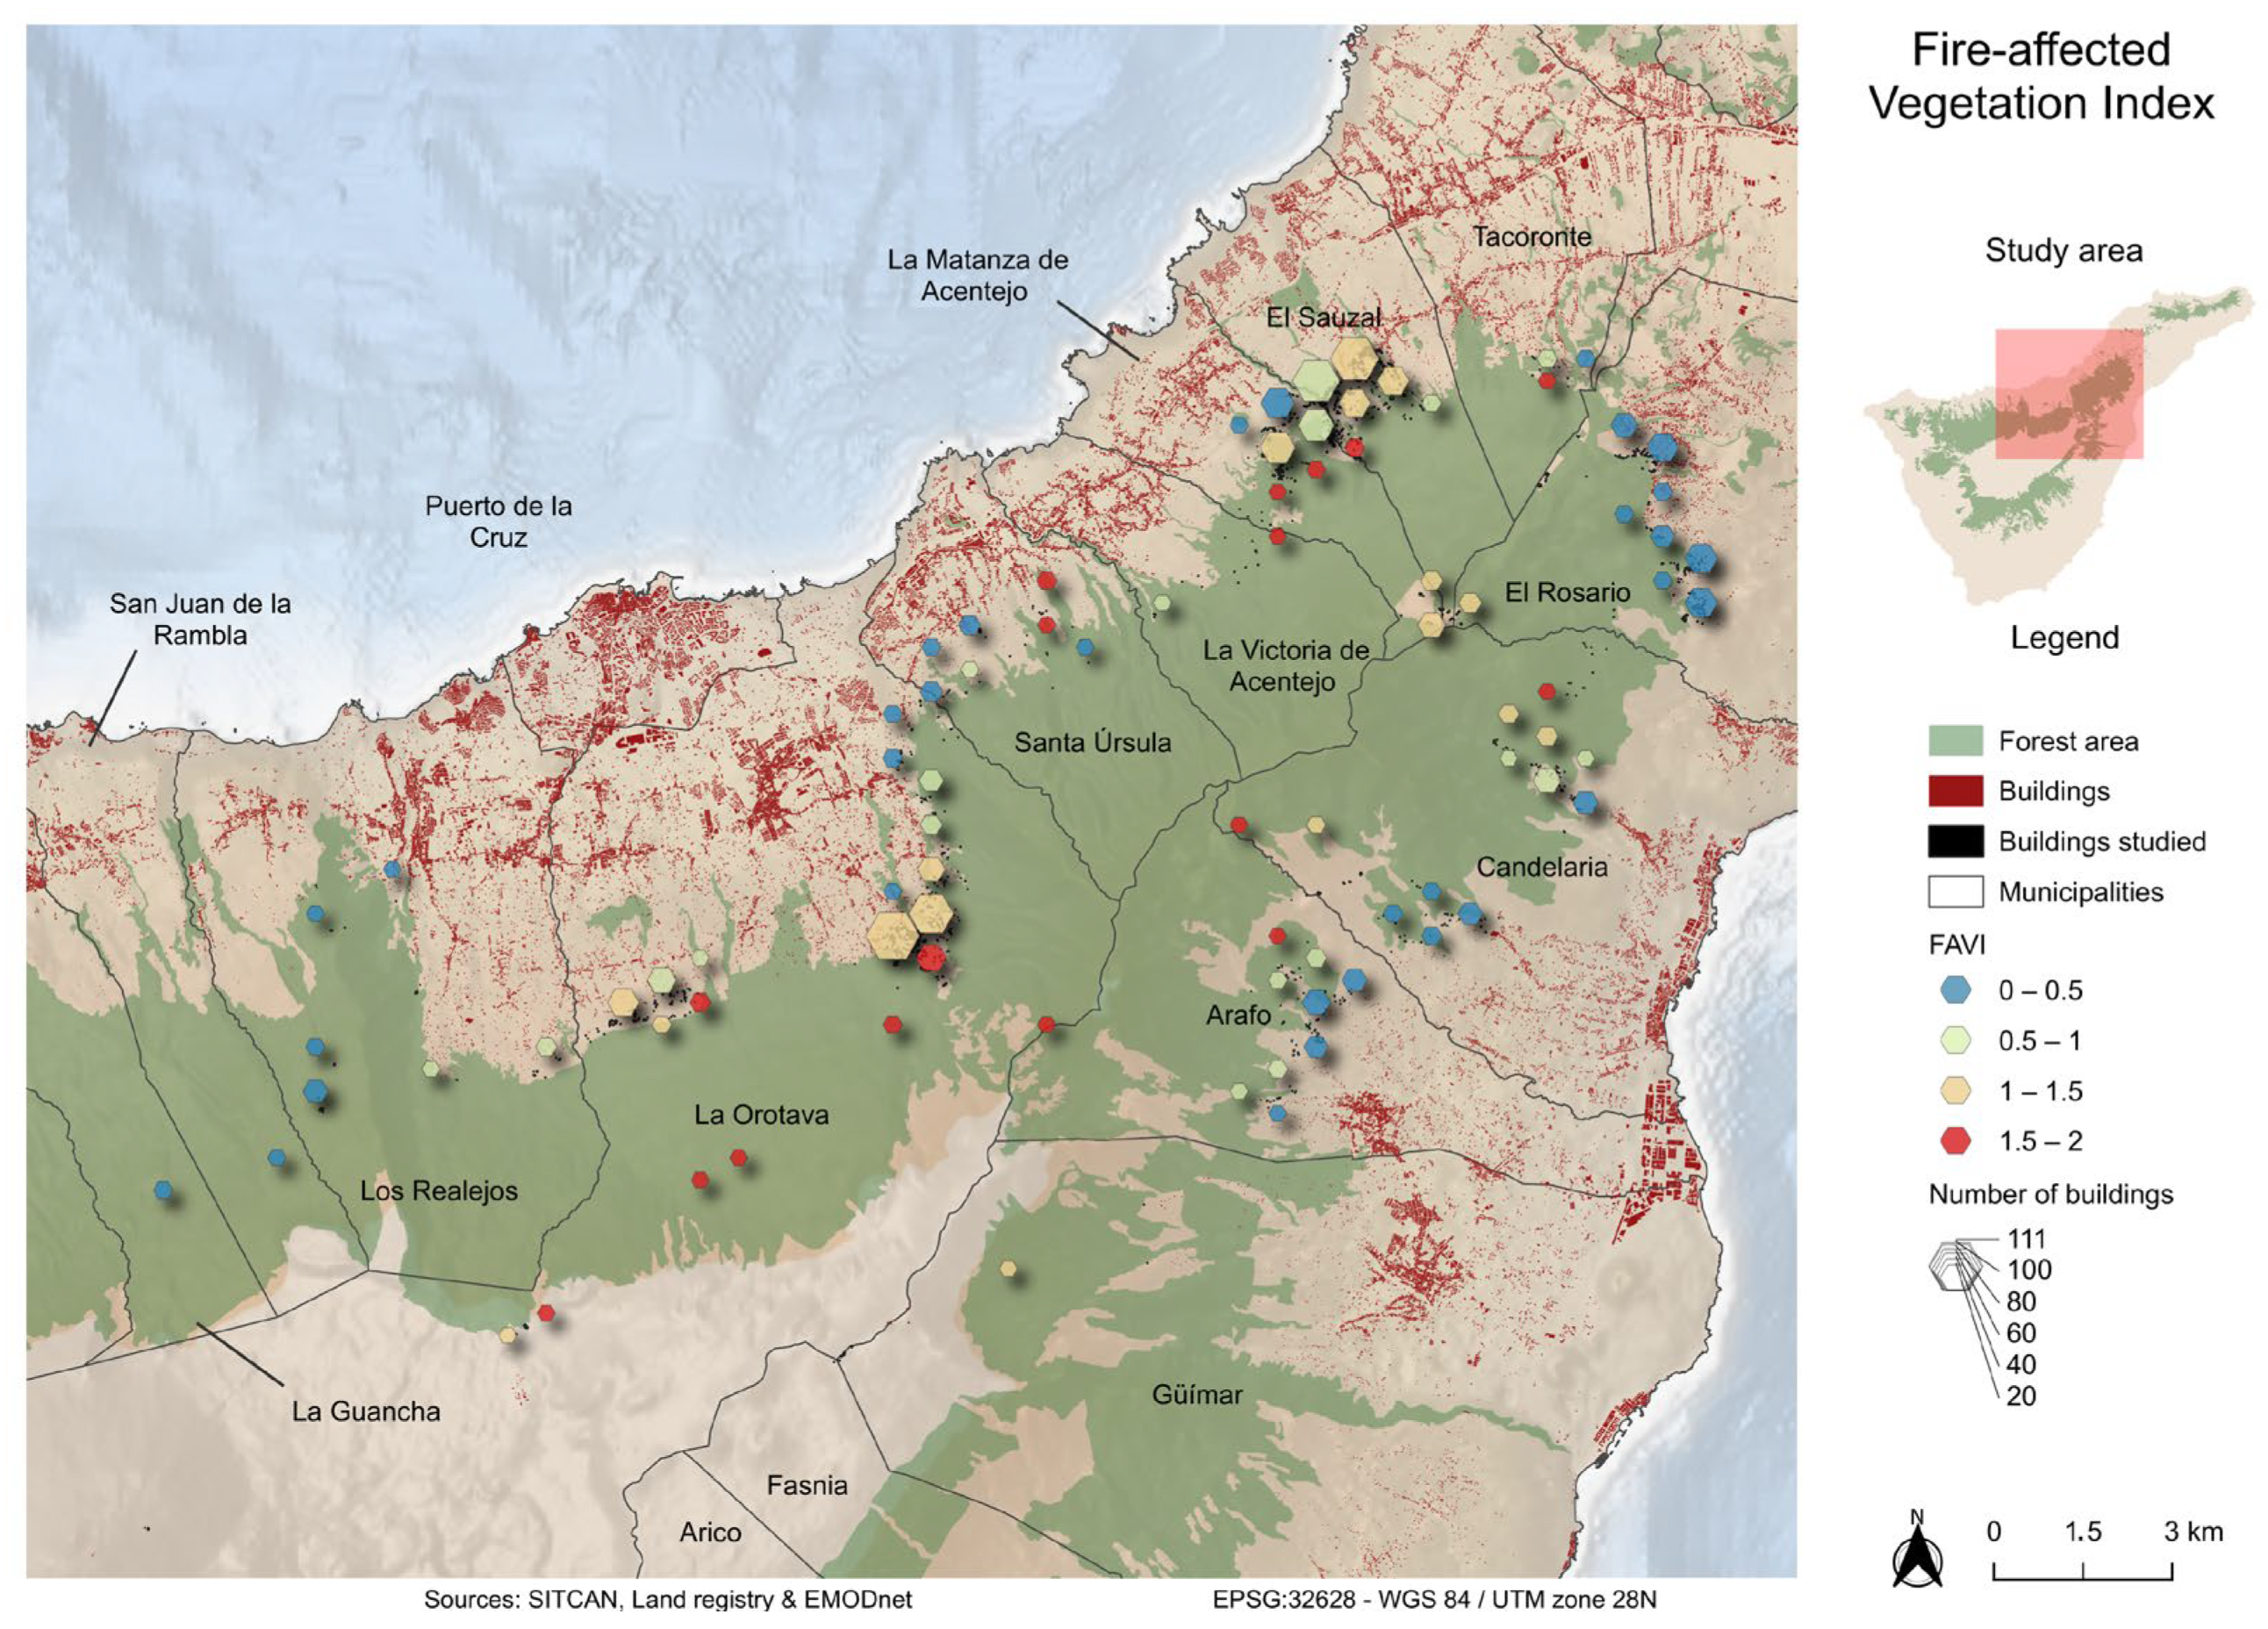
According to the analysis carried out, 41% of the buildings have no vegetation affected by the 2023 fire in their surroundings, while, in 31% of the cases, affected specimens are found within a radius of 200 m (Figure 10). In 22% of the buildings, vegetation was affected inside the property, while, in 6% of the buildings, it was affected in the immediate vicinity of the building, indicating the danger to which they were exposed during the event.

3.1.6. Wildfire Risk Building Vulnerability and Exposure Index (WR-BVEI)

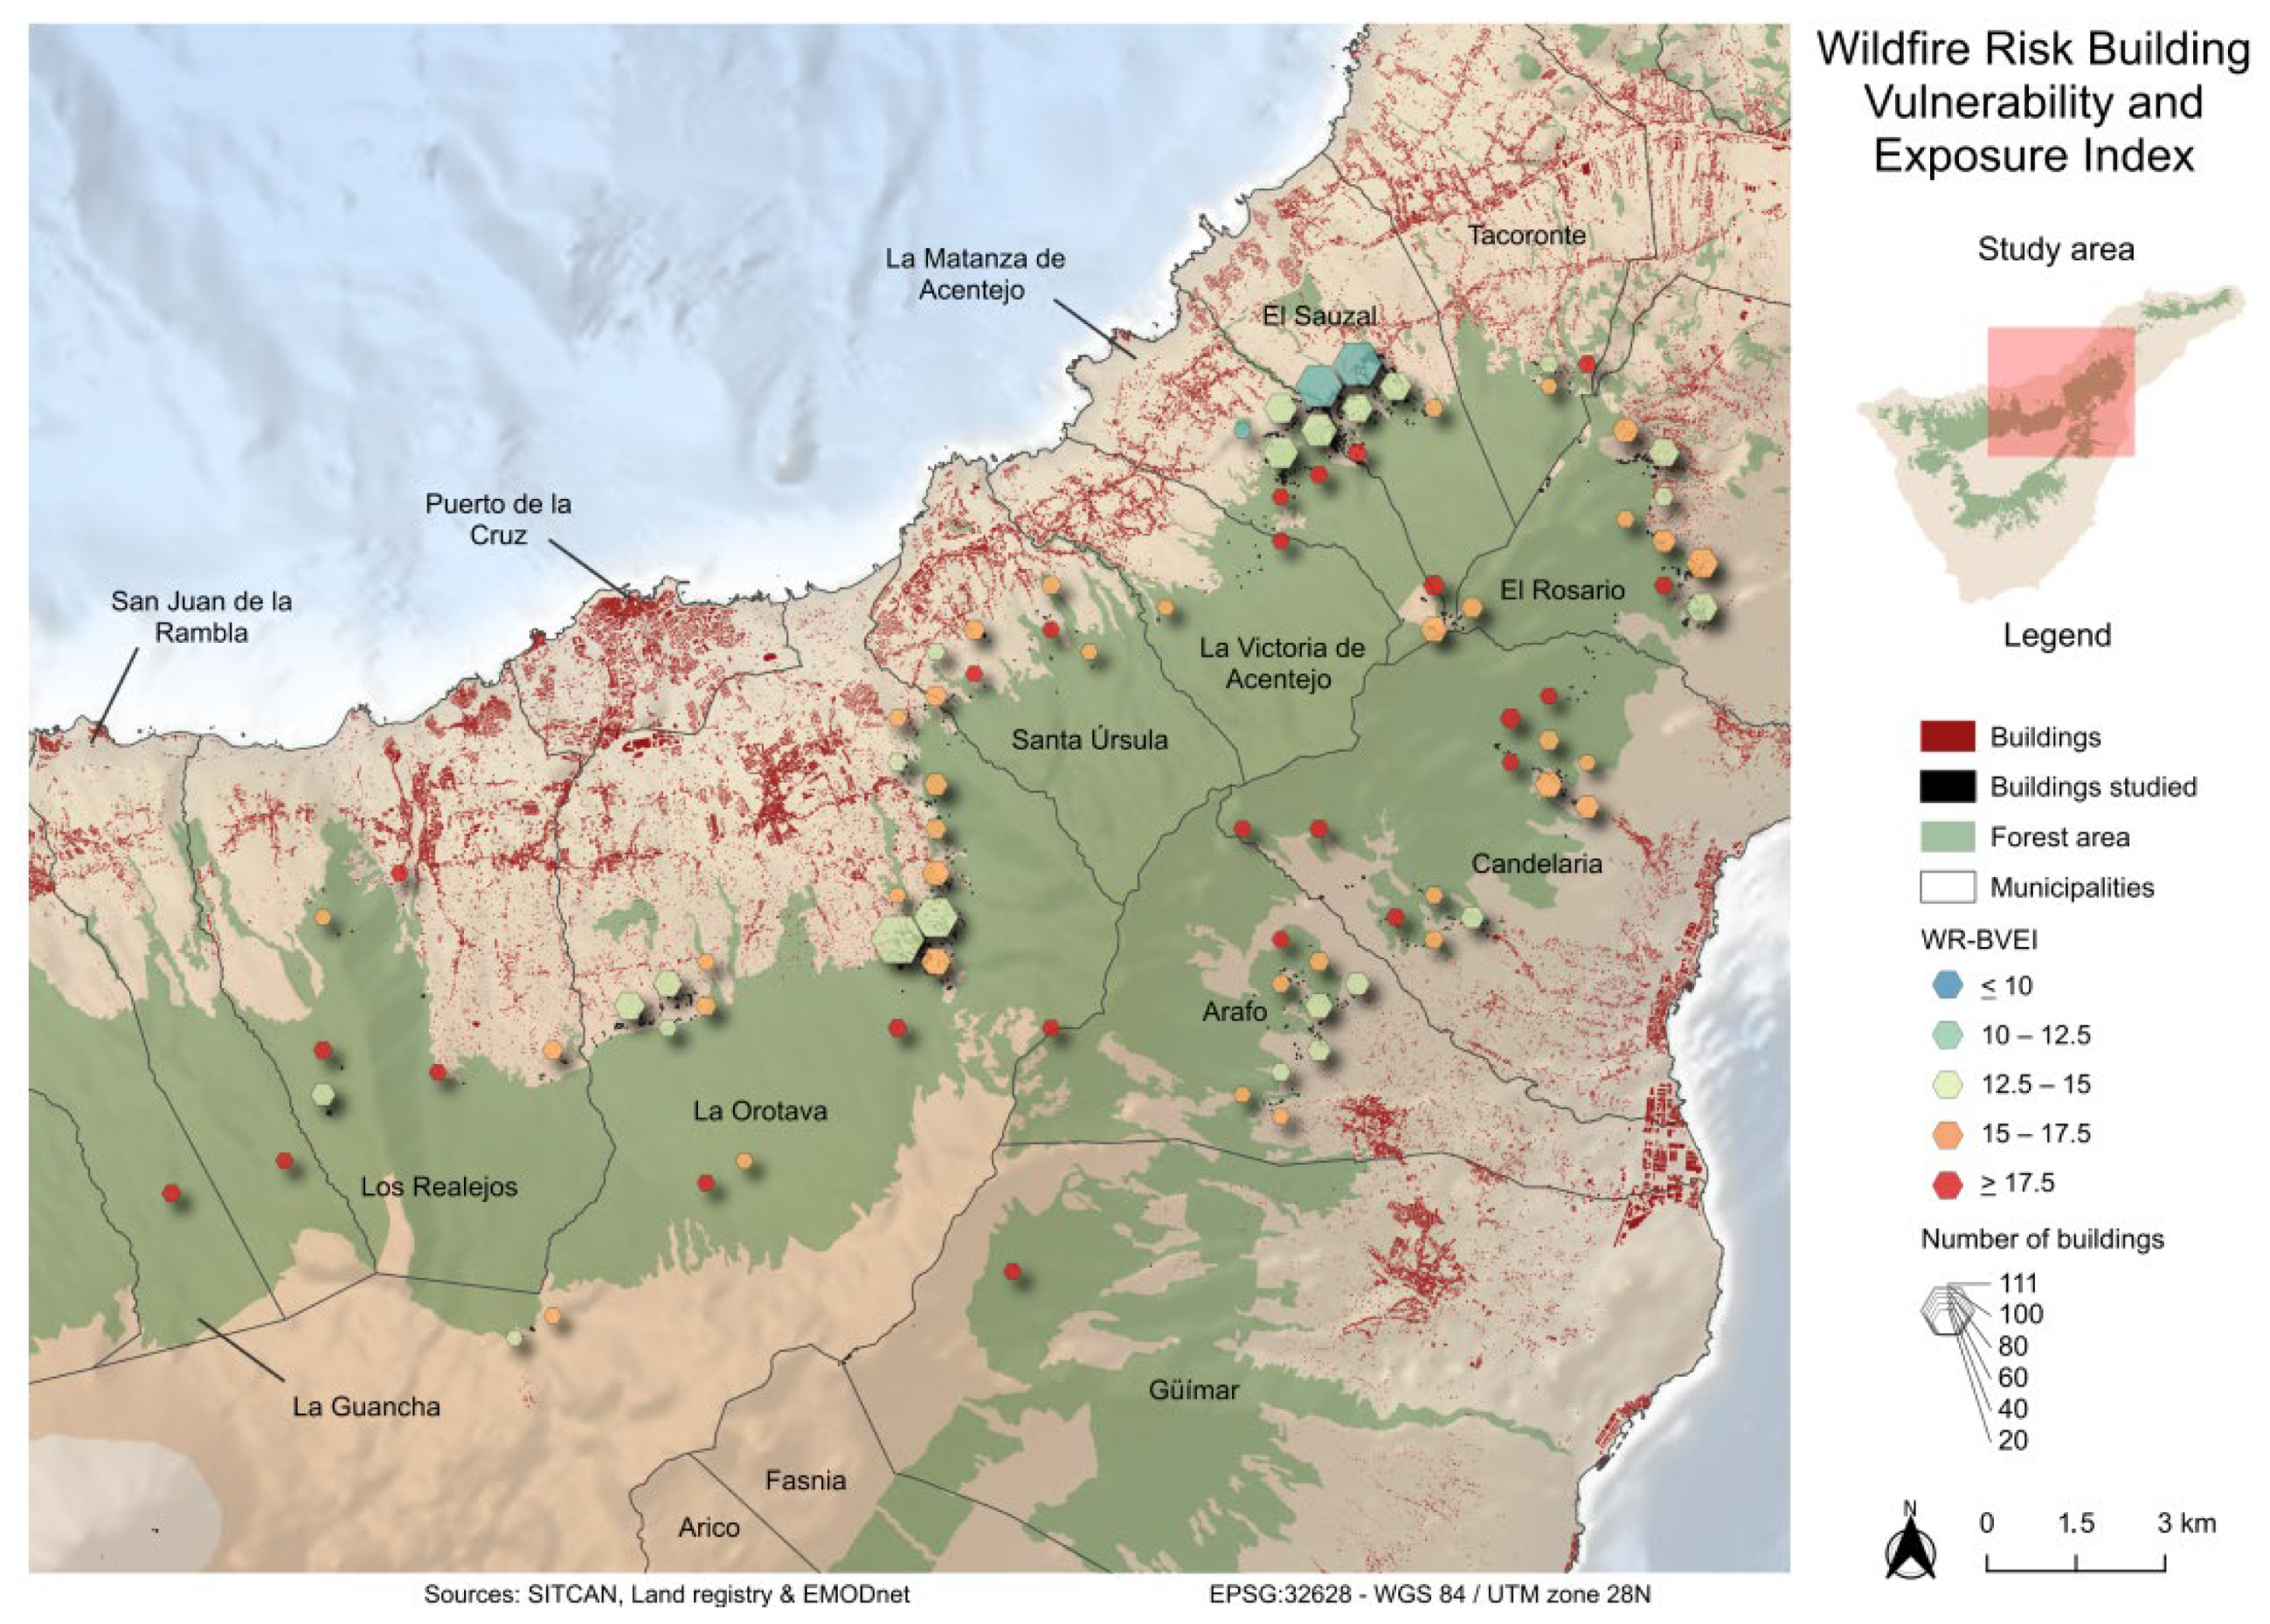
The sum of the intermediate indexes shown above gives an average vulnerability and exposure of buildings, expressed in the WR-BVEI, of 14.1 out of a maximum of 26. Within this general average, there are notable zonal contrasts; only 2.9% of the buildings analyzed have a very low vulnerability/exposure to forest fire risk (≤10). These are generally made of suitable materials, are of recent construction, have no flammable vegetation in their surroundings and are in accessible areas that do not contribute to the spread of fire. Both these constructions and those with a low vulnerability/exposure (10 to 12.5) tend to be located in population centers of a certain size, as is the case around the main roads of Ravelo or Aguamansa—in the municipalities of El Sauzal and La Orotava, respectively. In turn, 40.7% of the buildings exhibit a moderate final index from 12.5 to 15.5, while 22.3% present a high vulnerability/exposure (15 to 17.5), the latter and those with the highest scores (≥17.5) were located at a higher altitudinal elevation (Figure 11). This fact is explained by the greater proximity of the buildings to the forest mass and to more flammable forest fuel models, as well as by poorer accessibility.
A global analysis shows that, in 35.1% of the buildings studied, the intermediate index with the worst results is the Accessibility Exposure Index, which shows the type of access road, condition of the road network, and distance between buildings and extinguishing means. This is followed by the Vegetation Exposure Index (17.6%) and the Territorial Exposure Index (16.4%). Meanwhile, only 5.4% of the buildings show a higher vulnerability and structural exposure (SVI) than in the rest of the indexes. The remaining buildings have two or more indexes with the same score.

3.2. Estimated Value of the Salvaged

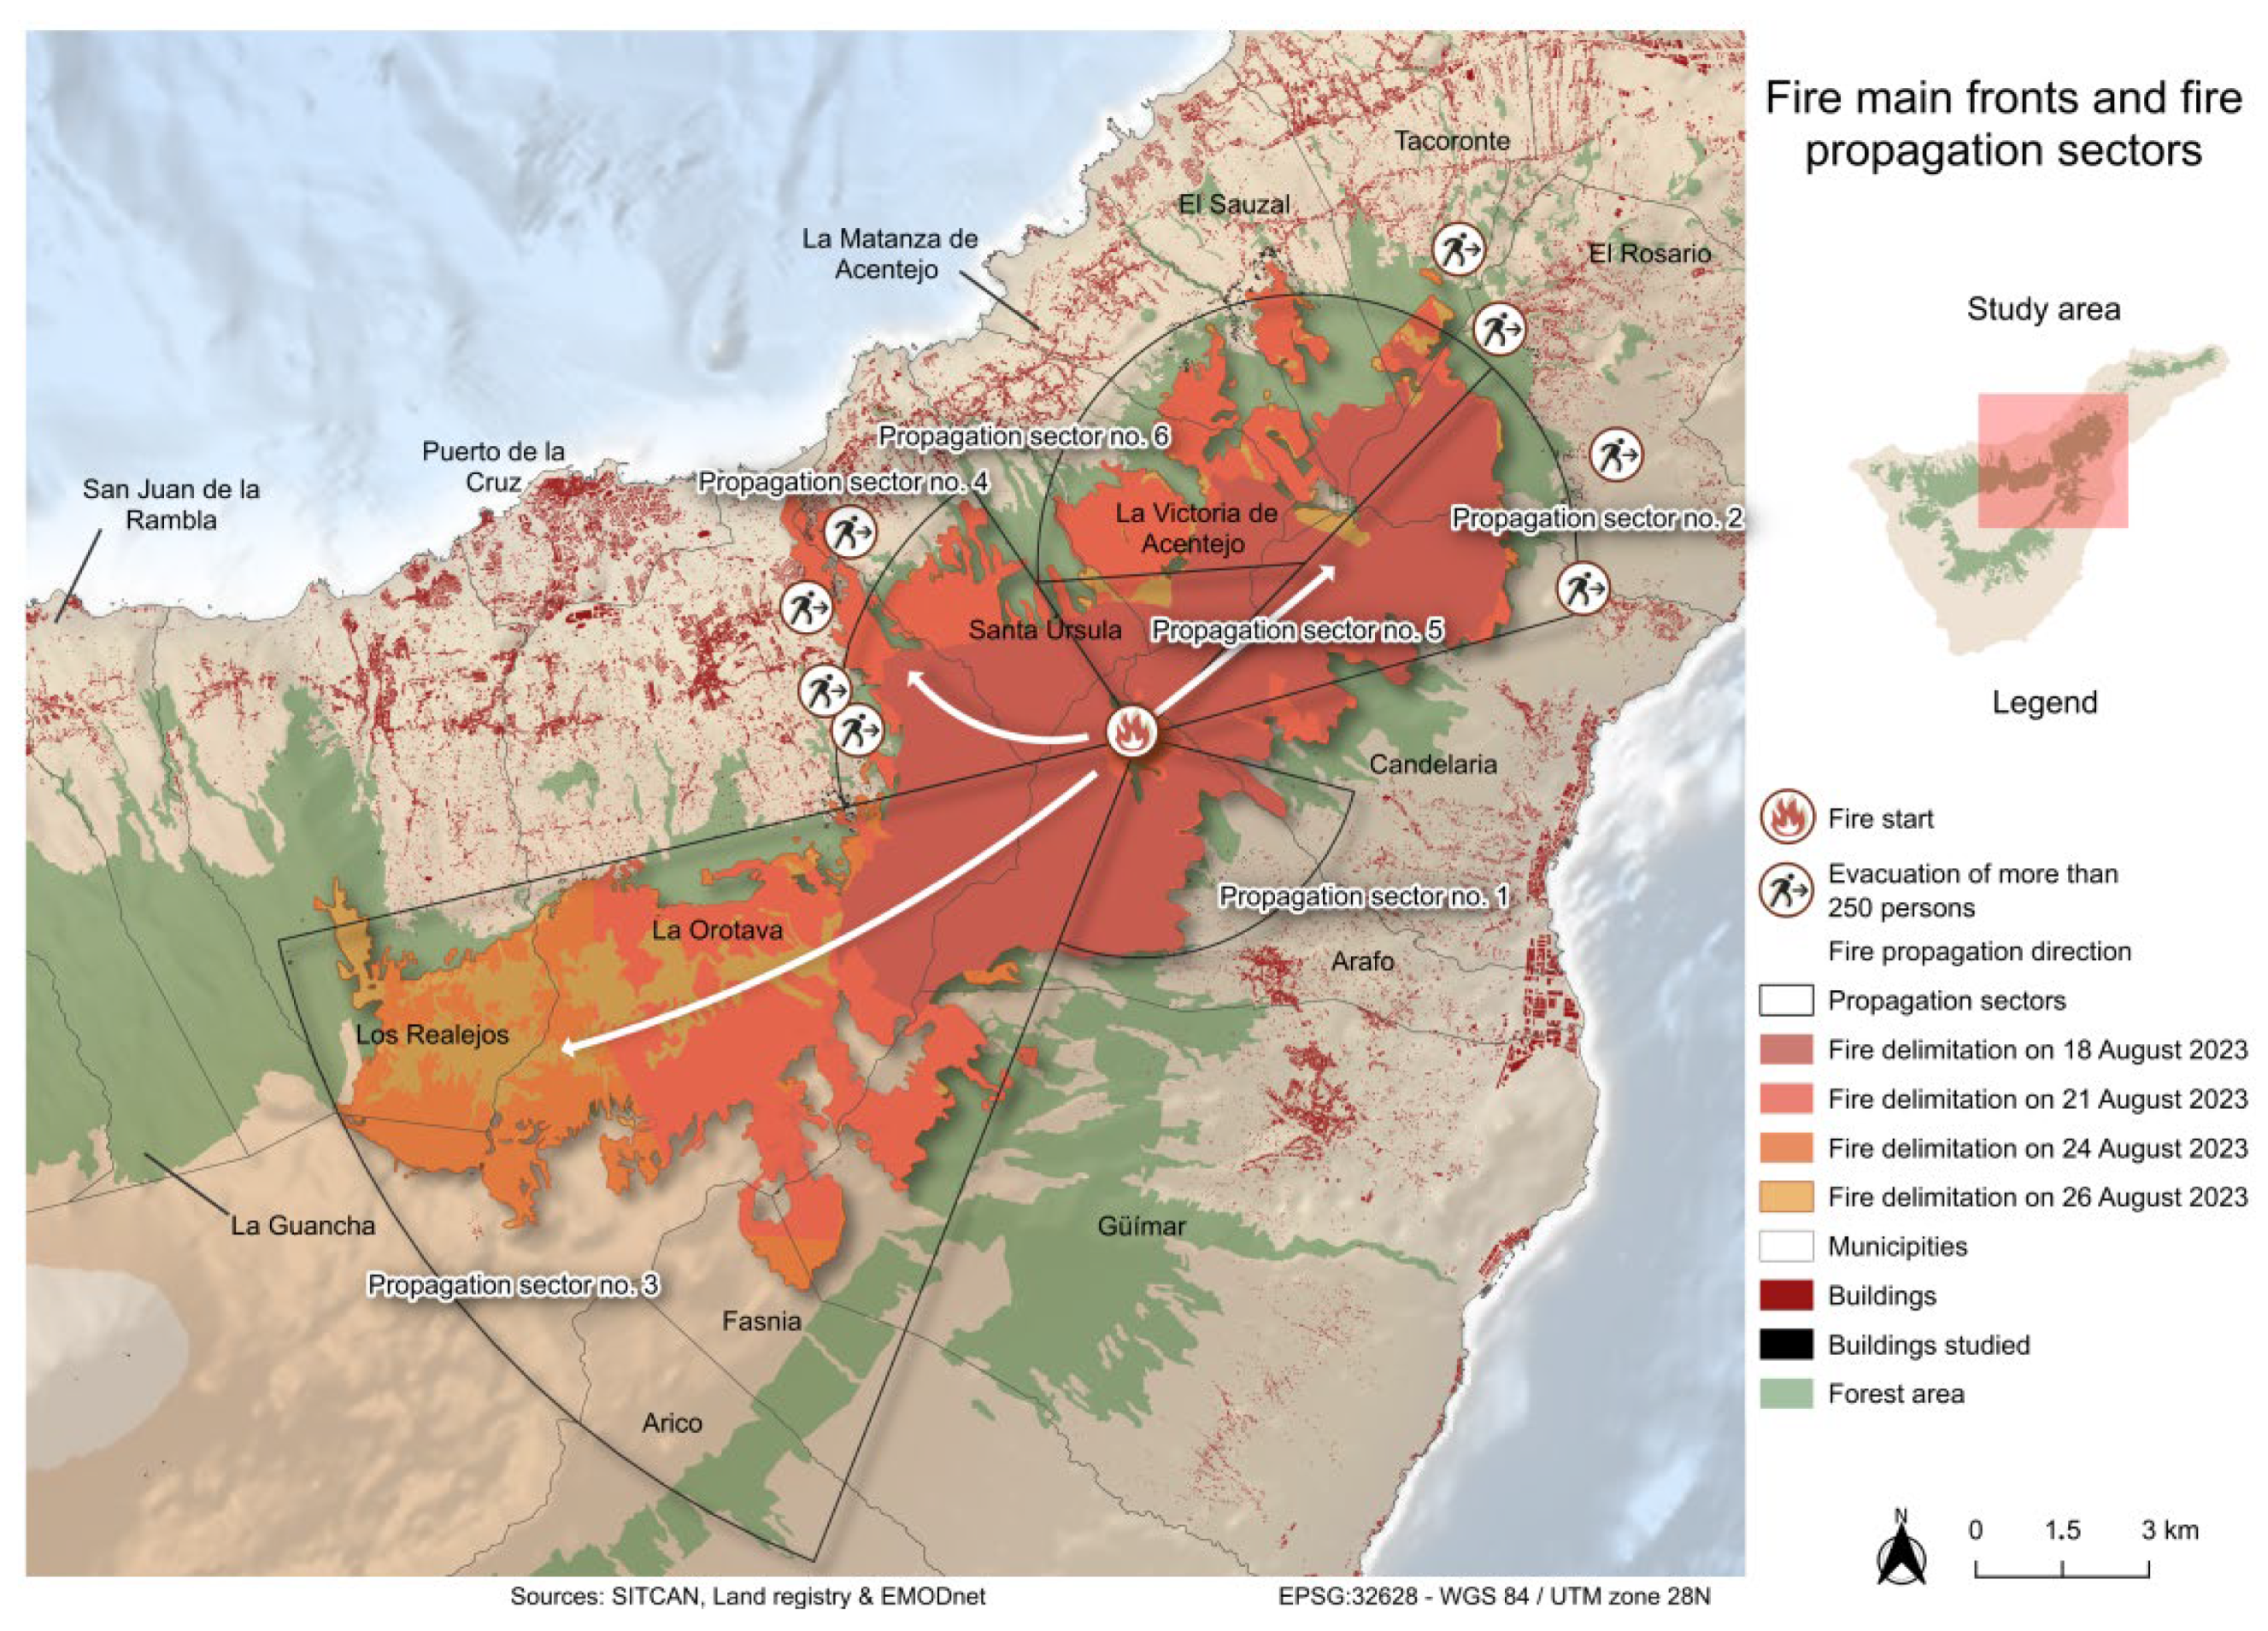
As previously explained, the estimation of the saved value is made based on the delineation of a series of potential fire propagation sectors. The first criterion used to define these sectors was the analysis of the fire’s directions and fronts. Thus, starting from the starting point of the fire, in the municipality of Arafo, the fire tends to spread in the following directions during the next few days: (1) it descends slightly in altitude on the same slope, that is, around Arafo and Candelaria (sector 1); (2) it moves towards the northeast, reaching the municipality of El Rosario one day later (sector 2); (3) it advances towards the inner part of the island, progressively entering the Valley of La Orotava and affecting a good part of highest altitude forest of Tenerife (sector 3); (4) it begins to descend the northern slope of the ridge, heading northwest (sector 4); and (5) it affects more municipalities, advancing in a northerly direction—sectors 5 and 6, the latter developing from the previous one and not from the starting point of the fire. Note that the number assigned to each sector does not correspond exactly with the chronological order in which the fire was affected, as shown in the legend of Figure 12.
Currently, numerous methodological approaches based on machine learning models and sophisticated physical simulations aim to predict the potential spread of a given wildfire. In this study, as previously mentioned, the delineation of the six propagation sectors was carried out by considering fire directions and speeds within a topographically complex, small, and rugged context, where such models are not always suitable. The scarcity of local training data, the unique characteristics of an insular environment, and the complexity of the propagation patterns observed in the analyzed fire are among the reasons that would justify a different study focused on comparing various models for estimating potential perimeter expansion.
Thus, based on extensive knowledge of the territory in question, the boundaries of the sectors are restricted to forested areas, taking into account wildfires recorded since 1980 (Figure 2), as well as the forest fuel models present on the island. This information was supplemented with data obtained through interviews with civil protection and emergency management officials, along with the island’s geographical characteristics. In this regard, sectors 1, 2, 4, 5, and 6 follow the boundaries between forested land and other cultivated or urban areas with low exposure, while sector 3 does not extend into the western part of the island, as the fire only reached these areas during its final phase with less aggressive behavior, as shown in Figure 11.
Therefore, the delineation of the sectors is based on multiple empirical sources and in-depth territorial knowledge, which we think constitutes an equally valid and useful approach for the objectives of this study.
Consideration should be given to the fact that some small areas affected by the forest fire exceed the limits of the potential spreading sectors. However, the expansion of the area of the sectors to cover the remaining sectors would have increased ostensibly—we believe not very precisely—the quantification of the avoided damage, as it would have gone into the urban areas of municipalities such as Candelaria or La Matanza de Acentejo.
As indicated in the Methods Section, the delineation of the different propagation sectors was validated using the results of the machine learning model developed (Figure 5). This confirms the consistency between the sectors used as a reference for calculating the salvaged areas and the scenario that, according to the model’s prediction, could have occurred. It is worth noting that the estimated potential extent of the fire, as predicted by the model, amounts to 17,727 ha—19% more than the officially recorded burned area of 14,878 ha.
Based on the above methodology for estimating the salvaged, the economic amount lost in the 11,965 hectares affected within the spreading sectors amounts to EUR 163,801,509. Note that the areas considered are those that, although within the perimeter of the fire, were subject to special protection by the extinguishing means, such as some farmhouses and specific properties, for example, in the area of Las Lagunetas, at the top of the ridge, which, in short, translates into a final assessed area of 10,342 ha (Table 4).
The largest economic preservation occurred in the third spread sector, which chronologically constituted the last phase of the fire, and, in which, in addition, the extinguishing teams were able to safeguard the highly populated nuclei existing in the Orotava Valley (Figure 12). The effectiveness of the intervention is also evident in the stoppage of the fire in the urban–forest interface in sectors 4, 5, and 6; an eventual advance of the fire towards the more populated zones in these areas would have considerably increased the economic losses associated with the disaster.
The estimate of losses is similar to that indicated by the Government of the Canary Islands [54], including EUR 1.8 million corresponding to damaged buildings. Considering the 425 existing buildings within the different spreading sectors that were not affected by the fire thanks to the intervention of the means deployed in the field, the damage avoided is estimated at EUR 28.2 million, of which 25.4 million would have been for homes and the rest for warehouses, sheds, camps, etc.
Environmentally, losses are estimated at EUR 36.7 million, while the estimate of what has been salvaged is around EUR 27.9 million. Most of this amount coincides with the intrinsic value of the forest area and its economic production—livestock, wood, beekeeping, etc., whose losses amounted to EUR 25.4 million, with a further EUR 19.4 million salvaged. Also noteworthy is the estimate of public investment in the prevention and extinction of forest fires—EUR 1.5 million in losses and EUR 1.1 million salvaged—and the economic evaluation of the provision of water—EUR 9.5 million in losses and EUR 7.2 million salvaged.
In terms of productive activities—essentially recreational uses and agricultural production, the value of what was salvaged was EUR 53.2 million, compared to EUR 22.9 million in actual losses. Significantly, without the intervention of the fire control teams, the cultivated area affected would have increased from about 100 hectares to 500 hectares, which would have raised the economic losses from EUR 9.2 to 42.6 million. Finally, the losses associated with the CO2 released into the atmosphere by the fire amount to EUR 102.5 million, to which a further EUR 78.1 million would have been added without the intervention of the means.
Ultimately, real losses associated with the disaster are estimated at around EUR 164 million, compared to 187 million saved, thanks to the work of the teams put in place by the authorities, whose total operating cost amounted to EUR 10.2 million [54].
By comparing the estimated losses with the avoided losses by category, it is demonstrated that the interventions were particularly effective in protecting productive assets—whose losses would have more than doubled and, above all, in buildings, which would have resulted in damages close to EUR 30 million, compared to the EUR 1.8 million actually affected. On the environmental and intangible level, the large area affected by the fire, which led to the destruction of much of the island’s forest cover, represented substantial losses—EUR 139.1 million in total, nearly 80% of the overall figure—to which an additional EUR 106 million would have been added. Consequently, it can be stated that the intervention of the control teams was beneficial in all areas, particularly in terms of protecting buildings and economic activities.

4. Discussion

This paper consists of two parts which, although closely related because they are linked to the forest fire that occurred on the island of Tenerife in 2023, can be dissociated at an analytical level: on the one hand, assessment of the vulnerability and exposure of the buildings located in the urban–forest interface environment and, on the other hand, economic estimation of the losses and, above all, of what was salvaged thanks to the intervention of the extinguishing means.
Regarding the study of vulnerability and exposure of buildings, based on the results obtained, the criteria considered are deemed adequate given that they encompass multiple aspects that influence the characteristics of buildings in relation to wildfires: territorial, structural, accessibility, vegetation, etc. As justified in the Methods Section, these are the most commonly analyzed parameters in studies of this nature, although the Territorial Exposure Index responds to the need to consider the particular characteristics of an island environment such as the one analyzed. Thus, given the highly rugged areas, it was essential to include a criterion related to the slope of the environment surrounding the buildings, which could also be used in areas with very complex relief. Additionally, considering the presence of numerous ravines cutting through the topography of Tenerife and their role as vectors for fire propagation, proximity to these ones constitutes another crucial factor to consider in these areas. Finally, given the minimal differentiation between land uses, it was essential to include a reference to the type of settlement in the urban–forest interface area.
On the other hand, one of the strengths of this study lies in the combination of quantitative techniques supported by the use of Geographic Information Systems—GIS—with others derived from field observation, such as the materials of the structures or the presence of blinds or shutters.
It has been shown that most of the buildings located in the area of analysis offer optimal structural conditions; in general, their materials are fireproof, they are in an acceptable state of conservation, and, in addition, they are not too old. The differences between houses are noticeable in terms of the existence of shutters or blinds, a fact that can cause unequal impacts of fire on similar buildings. In this regard, it is worth mentioning studies such as that of Do Nascimento-Vieira et al. [69], which show that, despite the adequacy of structural materials, aspects such as windows, doors, air extractors, or thermal insulation of buildings must be taken into account when assessing the vulnerability of buildings to fire.
Significantly, more than two-thirds of the buildings analyzed in the area surrounding the urban–forest interface of the island were built after 1975. It can thus be affirmed that the urbanization of areas close to the forest mass—or directly within it—is a relatively recent phenomenon, mostly limited to the last half century; only 7% of the buildings were built prior to 1950. Authors such as Galiana [70] have pointed out the progressive development of these transition zones as areas of high exposure to forest fires in Spain as a whole, although, in the Canary Islands, as Alonso-López [71] points out, this acquires unique characteristics as it is often carried out outside urban planning, adopting various forms of self-construction and spontaneous urbanization. In any case, only a third of these buildings are located in isolated or dispersed areas, which indicates the recent configuration and generalization of densely urbanized areas in very exposed sectors.
This ongoing encroachment into wooded areas explains, in part, the unfavorable results obtained, on average, by the buildings in relation to accessibility. In these areas, as has been demonstrated, the roads are often in a poor state of conservation and, in addition, only one out of ten buildings is less than fifteen minutes away from any fire extinguishing means. This is in addition to the proximity of the many ravines that run through the orography of the most mountainous islands and that act as real vectors for the flames due to the accumulation of vegetation—usually dry—in them, as well as in relation to their difficult access. Experts such as Santamarta and Guzmán [72] have repeatedly warned about this circumstance, proposing to adapt and modify the vegetation of ravines to prevent them from driving fires, creating wet barriers that hinder and prevent the advance of fire, especially the so-called chimney effect.
The progressive abandonment of traditional forest uses in the Canary Islands deserves special mention, as this has led to the expansion of the territory susceptible to forest fires. Authors such as Sabaté [73] highlight the undesired consequences of the agricultural regression of the midlands, the suburbanization of the countryside and the shift in the roles of the summit sectors, integrated into the contemporary tourist model. Furthermore, as Naranjo [74] points out, the Canary Islands are one of the three Spanish autonomous communities that still do not have their own forestry law that regulates the management of forest areas, slows down the accelerated process of agricultural abandonment in the surrounding areas, and promotes effective actions in terms of reforestation, fire prevention, biodiversity conservation, the recovery of traditional uses that favor ecological balance, etc.
The criteria included in this study, as well as the resulting index, could be used to assess the vulnerability and exposure of buildings in areas with a high incidence of wildfires in other geographic contexts. In this regard, although the present research analyzes an event that occurred on an island territory of relatively small size, the Canary Islands—and particularly those areas with Mediterranean rainfall regimes—face shared challenges that significantly exacerbate the threat of wildfires. Among these factors is global warming, which is expected to increase the frequency and intensity of fires in these areas prone to aridity [4]. Moreover, the previously mentioned process of urbanization and the abandonment of the countryside and agriculture experienced by the islands in recent decades is also occurring in other environmentally similar and densely populated regions. These areas, which are highly exposed to risks and often poorly planned, must simultaneously address multiple hazards—floods, droughts, wildfires, etc.—the management of which requires coherent and interconnected measures [75]. For these reasons, public policies related to the prevention and mitigation of wildfire risk must consider not only vulnerability and exposure—and the characteristics of the buildings—but also the hazard itself as the third component of overall risk, as well as the way in which factors such as climate change or human encroachment into vulnerable areas intensify its scope and impacts.
On another note, the estimation of the salvaged raised in this paper justifies the efficiency of public investment in forestry. Thus, the EUR ten million that amounted to the operation coordinated by the Government of the Canary Islands to control the 2023 fire in Tenerife prevented losses of EUR 187 million that would have been added to the EUR 164 million that the event actually cost. Investment should not only focus on the necessary commitment to strengthen extinguishing resources or direct intervention once an emergency has been declared but also on prevention—the recovery of degraded agricultural areas, silvicultural activities, reduction in flammable fuel, awareness campaigns, etc. Never before had so many resources been made available to control forest fires as today; in the fire analyzed, the authorities continually mentioned that an “unprecedented” system had been designed [76]. However, despite these efforts, LFFs continue to occur and still pose a threat to thousands of people and property around the world, which calls for the consideration of holistic strategies to minimize risk in a context of increasing exposure, as described in this research.
Experts such as Chudy et al. [77] or Lazaridou [78] point out the multiple benefits associated with a broad-based forestry investment—climate change mitigation and adaptation, biodiversity preservation, bioenergy, etc. Furthermore, these actions must be approached in a multisectoral manner, especially in island territories where there is an absolute overlap between socioeconomic areas. See, in this sense, the concern raised by the tourism reputational emergency; Tenerife receives more than six million tourists annually, and its economy depends, to a large extent, on this sector [79].
Given the recurrent nature of wildfires in the Canary Islands, the question arises: How can their occurrence be prevented or, at least, their impacts minimized in the future? Beyond the measures already considered, additional efforts should include improved land use and urban planning that prioritize fire-resilient infrastructure, enhanced firebreaks, and defensible spaces around buildings. Furthermore, early warning systems and risk mapping can facilitate a quicker response to potential outbreaks. It is essential to engage local communities through awareness campaigns, fire response training, and their active involvement in the design of emergency plans to ensure preparedness at the grassroots level. Public participation should also extend to maintaining homes in optimal conditions to minimize vulnerability to wildfires.
Ecological restoration and fuel management are critical and must also be prioritized to reduce highly flammable vegetation and cross-sector coordination, including cooperation with neighboring islands. Given the economic importance of tourism, the sector should also be involved in fire prevention strategies, including safety plans for tourist accommodations and public awareness efforts for visitors. A coordinated approach combining investment, community engagement, and regional cooperation is essential to reduce the risk of future wildfires and safeguard both the environment and the local economy.
In this context, initiatives such as the one presented in this study enhance societal preparedness for wildfire risk through the generation of knowledge [80,81,82,83]. Numerous studies focusing on other regions severely affected by fire have examined the relationship between wildfire impacts and the characteristics of exposed buildings, often in connection with recent events, such as the 2023 wildfire on Rhodes [84] and other events in Mediterranean areas. Such research is instrumental in forecasting the potential vulnerability of residential structures to wildfires and in informing the development of preventive strategies aimed at risk reduction. Nevertheless, according to Papathoma-Köhle et al. [83], the main shortcomings of this type of study are related to the limited potential for transferring methodologies and criteria to other regions, as well as, in some cases, the overly localized nature of the analyses. Other identified limitations include the narrow range of criteria considered and the lack of a comprehensive perspective linked to the vulnerability of buildings.
As previously discussed, this study adopts many of the traditional criteria for assessing vulnerability and exposure but complements them with additional factors specific to the particularities of the island environment. It also, in an innovative way, incorporates five sub-indices to capture the widest possible range of relevant characteristics. In comparative terms, the criteria used in this study—such as building materials, age, the condition and type of access roads, proximity to fire suppression means, slope, surrounding vegetation, and spatial configuration of the wildland–urban interface—are consistent with those employed in the recent literature [80,81,82,83,84]. However, while most previous works focus primarily on structural features and vegetation proximity (e.g., roofing, wall cladding, canopy cover, distance to fuels), few incorporate access road typologies or the condition of the firefighting infrastructure, which are particularly relevant in geographically fragmented and topographically complex regions such as the Canary Islands. Additionally, this study introduces factors such as the presence of pyrophytic vegetation affected by fire near buildings and the proximity to ravines, which have not been widely addressed in prior assessments but are critical to understanding fire behavior in insular terrains. Thus, while aligned with internationally recognized methodologies, our approach provides a more comprehensive and context-sensitive framework for wildfire risk evaluation.
To date, no scientific studies have been published that analyze the characteristics of buildings in relation to wildfire risk in the Canary Islands. In contrast, estimations of the economic losses associated with such events are regularly conducted. Nevertheless, this is the first time that a methodology aimed at estimating potential or avoided losses following a wildfire has been applied to the study area—and more broadly, within the national context of Spain. Consequently, although similar approaches have been adopted in other parts of the world, the scientific novelty of this article lies in the adaptation of vulnerability and building exposure assessments, as well as the estimation of what has been preserved, to a geographically insular and complex setting.
Furthermore, this study presents the first scientific characterization of one of the most severe wildfires that the region has experienced in its recent history. The event marked a turning point in the island’s forest management, culminating in a meeting held in July 2024, sponsored by local authorities, which brought together representatives from the political, legal, technical, and security sectors to discuss the development of effective strategies against the threat and to improve coordination of response efforts [85].
Finally, it is worth highlighting that the combination of quantitative techniques with detailed fieldwork constitutes a valuable analytical approach, further enriched by the insights provided by professionals responsible for managing the emergency.

5. Conclusions

This paper analyzes the last major fire in the Canary Islands in depth and presents an assessment of the degree of vulnerability and exposure of almost a thousand buildings in the area surrounding the forest fire that occurred on the island of Tenerife in August 2023, which affected 14,878 hectares and had a perimeter of approximately 90 km. Overall, the vulnerability and exposure of buildings, expressed in the Wildfire Risk Building Vulnerability and Exposure Index (WR-BVEI), is estimated to be moderate (14.1/26); only 2.9% of the buildings analyzed have a very low vulnerability/exposure, while one in four has high or very high values.
The highest levels of vulnerability and exposure of buildings to forest fires are generally associated with the poor accessibility of buildings, especially in relation to their distance from extinguishing means and the poor state of the road network. The results also reveal a high exposure associated with the territorial characteristics of the area in which the houses are located: high slope, closeness to ravines, proximity to densely vegetated forest areas, and the presence of easily flammable fuel models in the surrounding area. In almost six out of ten buildings, there is vegetation affected by the fire.
Meanwhile, this paper estimates the value of what was salvaged, i.e., the economic amount that was avoided as a result of the action taken by the means provided by the authorities. In this sense, the fire, defined by experts as the most complex of the last four decades in the Canary Islands, caused economic losses that, based on the estimation of this paper, are quantified at EUR 164 million. Had the fire been propagated through all the spreading sectors, additional losses of EUR 187 million are estimated, i.e., a total of EUR 351 million—about 1.5% of Tenerife’s GDP—mainly due to the exponential increase in the loss of houses and crops.

Author Contributions

Conceptualization, J.C., L.B., and P.D.; methodology, J.C. and L.B.; software, L.B., and J.C.; validation, P.D. and J.C.; formal analysis, L.B.; investigation, L.B. and J.C.; resources, P.D.; data curation, J.C.; writing—original draft preparation, L.B., writing—review and editing, J.C. and P.D.; supervision, P.D. All authors have read and agreed to the published version of the manuscript.

Funding

Cátedra Institucional de Medio Ambiente y Desarrollo Sostenible Cabildo de Tenerife-Universidad de La Laguna. Furthermore, the first author of this paper has received funding from the Ministry of Science, Innovation and Universities of the Government of Spain for University Teacher Training (FPU22/02606).

Data Availability Statement

The original contributions presented in this study are included in the article. Further inquiries can be directed to the corresponding author.

Acknowledgments

The authors wish to thank Freddy Vinet (Paul-Valéry Montpellier University), Montserrat Román Casamartina (Civil Protection and Emergency Response of the Government of the Canary Islands), and Florencio López Ruano (Consortium for Fire Prevention, Extinction, and Rescue of the Island of Tenerife) for their collaboration. Likewise, the work has been carried out within the framework of the PLANCLIMAC2 project (1/MAC/2/2.4/0006).

Conflicts of Interest

The authors declare no conflicts of interest.

References

  1. Chuvieco, E.; Martín, M.P.; Martínez, J.; Salas, F.J. Geografía e Incendios Forestales. Ser. Geográfica 1998, 7, 11–17. Available online: http://hdl.handle.net/10261/6427 (accessed on 5 March 2025).
  2. Moreno, J.M. (Ed.) Forest Fires Under Climate, Social and Economic Changes in Europe, the Mediterranean and Other Fire-Affected Areas of the World. FUME Project 2014. Available online: https://horizon.documentation.ird.fr/exl-doc/pleins_textes/divers15-08/010065139.pdf (accessed on 5 March 2025).
  3. Abatzoglou, J.; Williams, A.; Barbero, R. Global Emergence of Anthropogenic Climate Change in Fire Weather Indices. Geophys. Res. Lett. 2019, 46, 326–336. [Google Scholar] [CrossRef]
  4. Dupuy, J.; Fargeon, H.; Martin-StPaul, N.; Pimont, F.; Ruffault, J.; Guijarro, M.; Hernando, C.; Madrigal, J.; Fernandes, P. Climate change impact on future wildfire danger and activity in southern Europe: A review. Ann. For. Sci. 2019, 77, 35. [Google Scholar] [CrossRef]
  5. Jones, M.; Abatzoglou, J.; Veraverbeke, S.; Andela, N.; Lasslop, G.; Forkel, M.; Smith, A.; Burton, C.; Betts, R.; Werf, G.; et al. Global and Regional Trends and Drivers of Fire Under Climate Change. Rev. Geophys. 2022, 60, e2020RG000726. [Google Scholar] [CrossRef]
  6. Radeloff, V.; Helmers, D.; Kramer, H.; Mockrin, M.; Alexandre, P.; Bar-Massada, A.; Butsic, V.; Hawbaker, T.; Martinuzzi, S.; Syphard, A.; et al. Rapid growth of the US wildland-urban interface raises wildfire risk. Proc. Natl. Acad. Sci. USA 2018, 115, 3314–3319. [Google Scholar] [CrossRef]
  7. Bento-Gonçalves, A.; Vieira, A. Wildfires in the wildland-urban interface: Key concepts and evaluation methodologies. Sci. Total Environ. 2019, 707, 135592. [Google Scholar] [CrossRef]
  8. Ascoli, D.; Moris, J.; Marchetti, M.; Sallustio, L. Land use change towards forests and wooded land correlates with large and frequent wildfires in Italy. Ann. Silvic. Res. 2021, 46, 177–188. [Google Scholar] [CrossRef]
  9. Salis, M.; Giudice, L.; Jahdi, R.; Alcasena-Urdiroz, F.; Scarpa, C.; Pellizzaro, G.; Bacciu, V.; Schirru, M.; Ventura, A.; Casula, M.; et al. Spatial Patterns and Intensity of Land Abandonment Drive Wildfire Hazard and Likelihood in Mediterranean Agropastoral Areas. Land 2022, 11, 1942. [Google Scholar] [CrossRef]
  10. Moreno, J.M. La nueva gestión del incendio forestal ante el cambio climático. Ambienta 2021, 34–35. Available online: https://dialnet.unirioja.es/servlet/articulo?codigo=8213446 (accessed on 5 March 2025).
  11. Castilla-Beltrán, Á.; De Nascimento, L.; Fernández-Palacios, J.; Whittaker, R.J.; Willis, K.J.; Edwards, M.; Nogué, S. Anthropogenic transitions from forested to human-dominated landscapes in southern macaronesia. Proc. Natl. Acad. Sci. USA 2021, 118, e2022215118. [Google Scholar] [CrossRef]
  12. Santos-Guerra, A. Clima mediterráneo de Canarias y vegetación. Bull. Soc. Bot. Fr. Actual. Bot. 1984, 131, 121–128. [Google Scholar] [CrossRef]
  13. Sánchez-Benítez, A.; García-Herrera, R.; Vicente-Serrano, S.M. Revisiting precipitation variability, trends and drivers in the Canary Islands. Int. J. Climatol. 2017, 37, 3525–3752. [Google Scholar] [CrossRef]
  14. Dorta, P. Estado de la atmósfera en las olas de calor estivales en Canarias. Ería 1990, 205–212. Available online: https://reunido.uniovi.es/index.php/RCG/article/view/1062 (accessed on 5 March 2025).
  15. Dorta, P. Aproximación a la influencia de las advecciones de aire sahariano en la propagación de los incendios forestales en la provincia de Santa Cruz de Tenerife. In Actas del XVII Congreso de Geógrafos Españoles; Rodríguez-Gutiérrez, F., Menéndez Fernández, R., Montes Vigon, S., Poncelas Nietoz, M., Eds.; Universidad de Oviedo: Oviedo, Spain, 2001; pp. 158–162. Available online: https://dialnet.unirioja.es/servlet/articulo?codigo=7564844 (accessed on 5 March 2025).
  16. Quirantes, F.; Núñez-Pestano, J.R.; García-Mesa, D.A. Historia de los Montes de Tenerife; Servicio de Publicaciones de la Universidad de La Laguna: San Cristóbal de La Laguna, Spain, 2011. [Google Scholar]
  17. Dorta, P. Las inversiones térmicas en Canarias. Investig. Geogr. 1996, 109–124. Available online: https://www.redalyc.org/pdf/176/17654244007.pdf (accessed on 5 March 2025).
  18. Huesca-Martínez, M.; González-Alonso, F.; Cuevas, J.M.; Merino-de-Miguel, S. Estimación de la superficie quemada en los incendios forestales de Canarias en 2007 utilizando sinérgicamente imágenes MODIS y anomalías térmicas. Investig. Agrar. Sist. Recur. Forestales 2008, 17, 308–316. Available online: https://oa.upm.es/2263/ (accessed on 5 March 2025).
  19. ISTAC. Estadística de Incendios Forestales en Canarias/Series anuales o mensuales. Islas de Canarias. 1968–2022. 2025. Available online: https://www3.gobiernodecanarias.org/istac/statistical-visualizer/visualizer/data.html?resourceType=dataset&agencyId=ISTAC&resourceId=E04002B_000001&version=~latest#visualization/table (accessed on 5 March 2025).
  20. Tomé, J.L.; Fernández-Landa, A.; Ranz, P.P. Elaboración de cartografía forestal en canarias a partir de datos LIDAR. In Investigación, Gestión y Técnica Forestal en la Región de la Macaronesia; Santamarta, J.C., Ed.; Colegio de Ingenieros de Montes: Madrid, Spain, 2014; pp. 185–200. Available online: https://dialnet.unirioja.es/descarga/articulo/4996617.pdf (accessed on 5 March 2025).
  21. Carrillo, J.; Pérez, J.C.; Expósito, F.J.; Díaz, J.P.; González, A. Projections of wildfire weather danger in the Canary Islands. Nature 2022, 12, 8093. [Google Scholar] [CrossRef]
  22. González-Morales, A.; Ramón-Ojeda, A. Hacia una nueva propuesta de interpretación del paisaje agrario canario. Estud. Geogr. 2017, 78, 579–604. [Google Scholar] [CrossRef]
  23. Del Arco-Aguilar, M.J.; Rodríguez-Delgado, O. Vegetation of the Canary Islands. In Vegetation of the Canary Islands. Plant and Vegetation; Del Arco-Aguilar, M.J., Rodríguez-Delgado, O., Eds.; Springer: Cham, Switzerland, 2018; Volume 16, pp. 83–319. [Google Scholar] [CrossRef]
  24. Ministerio de Agricultura, Alimentación y Medio Ambiente. Criterios e Indicadores de Gestión Forestal Sostenible en los Bosques Españoles; Ministerio de Agricultura, Alimentación y Medioambiente: Madrid, Spain, 2012; Available online: https://www.miteco.gob.es/content/dam/miteco/es/biodiversidad/publicaciones/informe_castellano_criterios_indicarores_gestion_forestal_sostenible_bosques_2012_tcm30-101191.pdf (accessed on 5 March 2025).
  25. Diario de Avisos. ¿Qué Significa que el Incendio de Tenerife Sea de Sexta Generación? 20 August 2023. Available online: https://diariodeavisos.elespanol.com/2023/08/incendio-tenerife-sexta-generacion/ (accessed on 5 March 2025).
  26. Ministerio para la Transición Ecológica y el Reto Demográfico. Los Incendios Forestales en España. 1 Enero–31 de Diciembre 2023. Avance Informativo. 2024. Available online: https://www.miteco.gob.es/content/dam/miteco/es/biodiversidad/temas/incendios-forestales/Avance_1_enero_31_diciembre_2023.pdf (accessed on 5 March 2025).
  27. AEMET. Candelaria-Deposito Cuevecitas en Agosto de 2023. Observación Meteorológica Horaria. 2023. Available online: https://x-y.es/aemet/est-C438N-candelaria-deposito-cuevecitas?mes=2023-08 (accessed on 5 March 2025).
  28. AEMET. Olas de Calor en España Desde 1975. Área de Climatología y Aplicaciones Operativas. 2023. Available online: https://www.aemet.es/documentos/es/conocermas/recursos_en_linea/publicaciones_y_estudios/estudios/Olas_calor/olas_calor_actualizacionoct2023.pdf (accessed on 5 March 2025).
  29. Gobierno de Canarias. Incendio Tenerife Agosto 2023. 2023. Available online: https://experience.arcgis.com/experience/34a338f88db04ee6a090c29618e52801 (accessed on 5 March 2025).
  30. Diario de Avisos. La Calidad del Aire Empeora: Los 22 Municipios en los que es Muy Desfavorable. 2023. Available online: https://diariodeavisos.elespanol.com/2023/08/calidad-aire-incendio-tenerife/ (accessed on 5 March 2025).
  31. De Castro, V.; El Incendio Provoca Problemas en el Suministro del Agua en el Norte. El Día. 2023. Available online: https://www.eldia.es/sucesos/sucesos-en-canarias/2023/08/18/incendio-provoca-problemas-suministro-agua-91081958.html (accessed on 5 March 2025).
  32. EFE. La Orotava Recupera la Electricidad Tras el Corte Por el Incendio. Diario de Avisos. 2023. Available online: https://diariodeavisos.elespanol.com/2023/08/la-orotava-corte-luz/ (accessed on 5 March 2025).
  33. Gobierno de España. La Ministra de Defensa Pone en Valor el Trabajo en Equipo y de Coordinación de la UME en el Incendio de Tenerife. 2023. Available online: https://www.lamoncloa.gob.es/serviciosdeprensa/notasprensa/defensa/Paginas/2023/310823-roblesincendiotenerife.aspx (accessed on 5 March 2025).
  34. 112 Canarias. El Incendio Forestal de Tenerife se da por Estabilizado. Available online: https://www.112canarias.com/112/el-incendio-forestal-de-tenerife-se-da-por-estabilizado/ (accessed on 5 March 2025).
  35. Fumero, P. Los Desalojados de Santa Úrsula y La Orotava Seguirán Esta Noche Fuera de Sus Casas. El Día. 2023. Available online: https://www.eldia.es/sucesos/sucesos-en-canarias/2023/10/05/desalojados-santa-ursula-incendio-tenerife-92982437.html (accessed on 5 March 2025).
  36. Cabildo Insular de Tenerife. El Cabildo da Por Extinguido el Incendio Forestal, que Afectó a 12.000 Hectáreas. 2023. Available online: https://www.diariodetenerife.info/cabildo-extinguido-incendio-forestal-afecto-12-000-hectareas/ (accessed on 5 March 2025).
  37. Ministerio del Interior del Gobierno de España. El Gobierno Declara Zona Catastrófica y Aprueba Ayudas para los Afectados por el Incendio de Tenerife y Otros 36 Fuegos. 2023. Available online: https://www.interior.gob.es/opencms/eu/detalle/articulo/El-Gobierno-declara-Zona-Catastrofica-y-aprueba-ayudas-para-los-afectados-por-el-incendio-de-Tenerife-y-otros-36-fuegos/ (accessed on 5 March 2025).
  38. Ouided, H.; Tayab, L.M.; Lyes, M. Towards REX Method for Capitalizing the Knowledge of a Corporate Memory. In Intelligent Decision Technologies 2017; Czarnowski, I., Howlett, R., Jain, L., Eds.; Smart Innovation, Systems and Technologies; Springer: Cham, Switzerland, 2018; Volume 73, pp. 215–225. [Google Scholar] [CrossRef]
  39. Rey, T.; Defossez, S. Retours d’Expériences Post-Catastrophes Naturelles. Géorisques. 2019. Available online: https://hal.science/hal-03135646v1 (accessed on 5 March 2025).
  40. Lagadec, P.; Langlois, M. Ne pas rater le retour d’expérience. In Pandémie 2020—Ethique, Société, Politique; Hirsch, E., Ed.; Les Éditions du Cerf: Paris, France, 2021; pp. 798–805. Available online: https://www.patricklagadec.net/wp-content/uploads/2021/11/23-04-2020.pdf (accessed on 5 March 2025).
  41. Defossez, S.; Vinet, F.; Leone, F. Diagnostiquer la vulnérabilité face aux inondations: Progrès et limites. In Inondations 1. La Connaissance du Risque; Vinet, F., Ed.; ISTE: Paris, France; Elsevier: Paris, France, 2018; pp. 263–282. Available online: https://hal.science/hal-03171204v1 (accessed on 5 March 2025).
  42. Merian, Y. Apports et Difficultés du Retour D’expérience (RETEX/REX) pour la gestion de crise et la résilience. In Congrès Lambda Mu 23 «Innovations et Maîtrise des Risques Pour un Avenir Durable»—23e Congrès de Maîtrise des Risques et de Sûreté de Fonctionnement; Institut pour la Maîtrise des Risques: Paris, France, 2022; Available online: https://hal.science/hal-03966596 (accessed on 5 March 2025).
  43. Pérez-Soba, I.; Jiménez-Shaw, C. Interfaz urbano-forestal e incendios forestales: Regulación legal en España. Rev. Aragon. Adm. Pública 2019, 53, 158–219. [Google Scholar] [CrossRef]
  44. Ministerio para la Transición Ecológica y el Reto Demográfico. Mapa Forestal de España. Comunidad Autónoma de Canarias. 2023. Available online: https://www.miteco.gob.es/es/biodiversidad/servicios/banco-datos-naturaleza/informacion-disponible/mfe50_descargas_canarias.html (accessed on 5 March 2025).
  45. Copernicus. EMSN165: Post-Wildfire Damage Assessment in Tenerife, Spain. 2023. Available online: https://emergency.copernicus.eu/mapping/list-of-components/EMSN165 (accessed on 5 March 2025).
  46. Caballero, D.; Dalmau, F.; Grillo, F.; Quinto, F. Manual de Operaciones contra Incendios en la Interfaz Urbano Forestal; Escuela Nacional de Protección Civil: Madrid, España, 2023; Available online: https://es.scribd.com/document/636549059/Manual-Operaciones-Interfaz-Urbano-Forestal (accessed on 5 March 2025).
  47. Sede Electrónica del Catastro. Buscador de Inmuebles y Visor Cartográfico. Available online: https://www.sedecatastro.gob.es/ (accessed on 5 March 2025).
  48. Centro Nacional de Información Geográfica [CNIG]; Instituto Geográfico Nacional [IGN]. Modelo Digital del Terreno con Paso de Malla de 5 Metros (MDT05) de España. 2024. Available online: https://www.idee.es/csw-inspire-idee/srv/spa/catalog.search?#/metadata/spaignMDT05 (accessed on 5 March 2025).
  49. Cabildo Insular de Tenerife. Inventario Insular de Cauces de Tenerife. 2024. Available online: https://datos.tenerife.es/es/datos/tablero?resourceId=26ce489f-dc6d-430c-a79b-b4bd487b6c6e (accessed on 5 March 2025).
  50. Tecnoma. Guía Para la planificación preventiva contra incendios forestales en la interfaz urbano-forestal. In Estudio Básico para la Protección Contra Incendios forestales en la Interfaz Urbano-Forestal; Ministerio para la Transición Ecológica y el Reto Demográfico: Madrid, Spain, 2020; Available online: https://www.miteco.gob.es/content/dam/miteco/es/biodiversidad/temas/incendios-forestales/cap_7_guia_planificacion_preventiva_tcm30-278874.pdf (accessed on 5 March 2025).
  51. Consejería de Transición Ecológica y Energía del Gobierno de Canarias. Modelos de Combustible Forestales de Canarias. 2023. Available online: https://datos.canarias.es/catalogos/general/dataset/modelos-de-combustible-forestales-de-canarias (accessed on 5 March 2025).
  52. Rothermel, R.C. A Mathematical Model for Predicting Fire Spread in Wildland Fuels; Research & Development. Department of Agriculture, Intermountain Forest and Range Experiment Station: Ogden, UT, USA, 1972. Available online: https://research.fs.usda.gov/treesearch/32533 (accessed on 5 March 2025).
  53. Educación Forestal. Modelos de Combustible. Available online: https://edu.forestry.es/2016/09/modelos-de-combustible.html (accessed on 5 March 2025).
  54. Moreira, F.; Ascoli, D.; Safford, H.; Adams, M.A.; Moreno, J.M.; Pereira, J.M.C.; Catry, F.X.; Armesto, J.; Bond, W.; González, M.E.; et al. Wildfire management in Mediterranean-type regions: Paradigm change needed. Environ. Res. Lett. 2020, 15, 011001. [Google Scholar] [CrossRef]
  55. Pastor, V.; Chadli-Mauricio, H.; Amir, N.; Dumas, M.; Monet, J.-P. Approche d’une technique standardisée d’évaluation de la surface et des valeurs sauvées au cours de la lutte contre un feu de forêt. For. Méditerr. 2021, 42, 35–38. [Google Scholar]
  56. PNRS–ENSOSP. Note Sur la Reformulation du Terme «Coût du Sauvé» et son Emploi dans les Formations de l’École. Available online: https://pnrs.ensosp.fr/var/pnrs/storage/public-files/9d9002b528ee20d9f16f2063c330f641.pdf (accessed on 5 March 2025).
  57. Tan, Y.-C.; Duarte, L.; Teodoro, A.C. Comparative Study of Random Forest and Support Vector Machine for Land Cover Classification and Post-Wildfire Change Detection. Land 2024, 13, 1878. [Google Scholar] [CrossRef]
  58. Makowski, D. Simple random forest classification algorithms for predicting occurrences and sizes of wildfires. Extremes 2023, 26, 331–338. [Google Scholar] [CrossRef]
  59. Gao, C.; Lin, H.; Hu, H. Forest-Fire-Risk Prediction Based on Random Forest and Backpropagation Neural Network of Heihe Area in Heilongjiang Province, China. Forests 2023, 14, 170. [Google Scholar] [CrossRef]
  60. Ministerio de Ambiente de Colombia. Guía de Aplicación de la Valoración Económica Ambiental. 2022. Available online: https://www.andi.com.co/Uploads/Gu%C3%ADa%20de%20Aplicaci%C3%B3n%20de%20la%20Valoraci%C3%B3n%20Econ%C3%B3mica%20Ambiental%20(00000002).pdf (accessed on 5 March 2025).
  61. Ministerio para la Transición Ecológica y el Reto Demográfico. Cuarto Inventario Forestal Nacional. 2020. Available online: https://www.miteco.gob.es/es/biodiversidad/temas/inventarios-nacionales/inventario-forestal-nacional/cuarto_inventario.html (accessed on 5 March 2025).
  62. Monet, J.-P.; Chadli-Mauricio, H.; Amir, A.; Carlavan, A.; Giraud, C.; Alessandri, C.; Allione, G. Value for money, economic view on emergency services, how protection produces value. In Proceedings of the Citizens and Cities facing New Hazards and Threats, Virtual Conference, 30 November–4 December 2020; Available online: https://www.tiems.info/images/pdf/TIEMS_2020_ConferenceProgram2611-2_002.pdf (accessed on 5 March 2025).
  63. MTECT. Marchés du carbone—SEQE-UE. 2024. Available online: https://www.ecologie.gouv.fr/politiques-publiques/marches-du-carbone-seqe-ue (accessed on 5 March 2025).
  64. Instituto Canario de Estadística. Estadística de Valor Tasado de Vivienda/Series Trimestrales. España, Comunidades Autónomas y Provincias. 1995–2024, 2024. Available online: https://www3.gobiernodecanarias.org/istac/statistical-visualizer/visualizer/collection.html?resourceType=collection&agencyId=ISTAC&resourceId=E20007A_000001 (accessed on 5 March 2025).
  65. International Bank for Reconstruction and Development/The World Bank. Investment in Disaster Risk Management in Europe Makes Economic Sense; World Bank Group: Washington DC, USA, 2021; Available online: https://civil-protection-knowledge-network.europa.eu/system/files/2023-03/Investment%20in%20Disaster%20Risk%20Management%20-%20Background.pdf (accessed on 5 March 2025).
  66. Ministerio de Agricultura, Pesca y Alimentación del Gobierno de España. Encuesta de Precios de la Tierra (Base 2016); Centro de Publicaciones de la Administración General del Estado: Madrid, Spain, 2023; Available online: https://www.mapa.gob.es/es/estadistica/temas/estadisticas-agrarias/encuestadepreciosdelatierra2022v1_tcm30-662587.pdf (accessed on 5 March 2025).
  67. Ministerio para la Transición Ecológica y el Reto Demográfico. Cuarto Inventario Forestal Nacional. Descripción de los Códigos de la Base de Datos de Campo. 2020. Available online: https://www.miteco.gob.es/content/dam/miteco/es/biodiversidad/temas/inventarios-nacionales/ifn/ifn4/documentador_ifn4_campo_tcm30-536595.pdf (accessed on 5 March 2025).
  68. Gobierno de Canarias. Canarias Reclama al Estado que la Campaña Contra Incendios esté Activa Todo el año en el Archipiélago. 2024. Available online: https://www3.gobiernodecanarias.org/noticias/canarias-reclama-al-estado-que-la-campana-contra-incendios-este-activa-todo-el-ano-en-el-archipielago/ (accessed on 5 March 2025).
  69. Do Nascimento-Vieira, F.; Almeida, M.; Correia, J.P.; Lopez, R. Study of Building Vulnerabilities to Forest Fires in Portugal. IOP Conf. Ser. Earth Environ. Sci. 2022, 1101, 022022. [Google Scholar] [CrossRef]
  70. Galiana, L. Las interfaces urbano-forestales: Un nuevo territorio de riesgo en España. Bol. Asoc. Geógr. Españoles 2012, 58, 205–226. Available online: http://hdl.handle.net/10486/670088 (accessed on 5 March 2025).
  71. Alonso-López, J.M. Autoconstrucción y Urbanización Espontánea: La Urbanización del Espacio Rural al Margen del Planeamiento en Tenerife. Ph.D. Thesis, University of La Laguna, San Cristóbal de La Laguna, Tenerife, Spain, November 2016. Available online: http://riull.ull.es/xmlui/handle/915/25633 (accessed on 5 March 2025).
  72. Santamarta, J.C.; Guzmán, J. Hidrología forestal y conservación de suelos en medios insulares volcánicos. In Ingeniería Forestal y Ambiental en Medios Insulares; Técnicas y Experiencias en las Islas Canarias; Santamarta, J.C., Naranjo, J., Eds.; Colegio de Ingenieros de Montes: Madrid, Spain, 2013; pp. 283–312. Available online: https://dialnet.unirioja.es/servlet/articulo?codigo=9273742 (accessed on 5 March 2025).
  73. Sabaté, F. La humanización y la transformación histórica del territorio. In Una Visión Geográfica de Tenerife: Cuaderno de Campo; García-Rodríguez, J.L., Ed.; Asociación Española de Geografía: San Cristóbal de La Laguna, Spain, 2021; pp. 49–56. Available online: https://portalciencia.ull.es/documentos/620c9d41bd89a06a02bb4005 (accessed on 5 March 2025).
  74. Naranjo, J. La necesidad de una ley de montes para Canarias. Rev. Montes 2024, 39–40. Available online: https://www.revistamontes.net/Buscador.aspx?id=15510 (accessed on 5 March 2025).
  75. Moreno, M.; Bertolín, C.; Arlanzón, D.; Ortiz, P.; Ortiz, R. Climate change, large fires, and cultural landscapes in the mediterranean basin: An analysis in southern Spain. Heliyon 2023, 9, e16941. [Google Scholar] [CrossRef]
  76. Ministerio para la Transición Ecológica y el Reto Demográfico. MITECO Despliega un Gran Dispositivo de Refuerzo de Alta Capacidad en Apoyo al Gobierno de Canarias en la Extinción del Incendio de Arafo-Candelaria. 2023. Available online: https://www.miteco.gob.es/es/prensa/ultimas-noticias/2023/08/-miteco-despliega-un-gran-dispositivo-de-refuerzo-de-alta-capaci.html (accessed on 5 March 2025).
  77. Chudy, R.; Cubbage, F.; Mei, B.; Siry, J. The Journal of Forest Business Research to Support Sustainable Forest Investments for Economic, Social and Environmental Benefits. BioResources 2023, 18, 4373–4376. Available online: https://bioresources.cnr.ncsu.edu/wp-content/uploads/2023/05/BioRes_18_3_4373_Chudy_CMS_Editorial_J_Forest_Bus_Res_Sustain_Investm_Benefits-1.pdf (accessed on 5 March 2025). [CrossRef]
  78. Lazaridou, D.C.; Michailidis, A.; Trigkas, M. Exploring Environmental and Economic Costs and Benefits of a Forest-Based Circular Economy: A Literature Review. Forests 2021, 12, 436. [Google Scholar] [CrossRef]
  79. Turismo de Tenerife. Tenerife Recobra el Ritmo Tras el Incendio. 2023. Available online: https://www.webtenerife.com/elblog/2023/08/comunicado-incendio-forestal-tenerife/ (accessed on 5 March 2025).
  80. Dossi, S.; Messerschmidt, B.; Ribeiro, L.M.; Rein, G. Relationships between Building Features and Wildfire Damage in California, USA and Pedrógão Grande, Portugal. Int. J. Wildland Fire 2023, 32, 296–312. [Google Scholar] [CrossRef]
  81. Samora-Arvela, A.; Aranha, J.; Correia, F.; Pinto, D.M.; Magalhães, C.; Tedim, F. Understanding Building Resistance to Wildfires: A Multi-Factor Approach. Fire 2023, 6, 32. [Google Scholar] [CrossRef]
  82. Castillo-Soto, M.E.; Garay-Moena, R.; Vergara-Estrada, J. Exposición de infraestructuras frente a incendios forestales y aspectos técnicos para su protección. Estud. Caso Chile Central. Rev. Cuba. Cienc. For. 2021, 9, 264–284. Available online: https://cfores.upr.edu.cu/index.php/cfores/article/view/706 (accessed on 5 March 2025).
  83. Papathoma-Köhle, M.; Schlögl, M.; Garlichs, C.; Diakakis, M.; Mavroulis, S.; Fuchs, S. A wildfire vulnerability index for buildings. Sci. Rep. 2022, 12, 6378. [Google Scholar] [CrossRef] [PubMed]
  84. Menemenlis, D.; Palaiologou, P.; Kalabokidis, K. Wildfire-Residential Risk Analysis Using Building Characteristics and Simulations to Enhance Structural Fire Resistance in Greece. Fire 2023, 6, 403. [Google Scholar] [CrossRef]
  85. Europa Press. El Cabildo de Tenerife Celebra una Cumbre en Defensa de Los Montes y Contra Los Incendiarios. Europa Press. 2024. Available online: https://www.europapress.es/islas-canarias/noticia-cabildo-tenerife-celebra-cumbre-defensa-montes-contra-incendiarios-20240723162051.html (accessed on 5 March 2025).
Figure 1. Geographical context of the Canary Islands.
Fire 08 00186 g001
Figure 2. Major forest fires in Tenerife since 1980 [16].
Fire 08 00186 g002
Figure 3. Chronology of the emergency.
Fire 08 00186 g003
Figure 4. Areas of interest in which vulnerability and exposure of buildings have been analyzed.
Fire 08 00186 g004
Figure 5. Potential spread according to the model developed and propagation sectors.
Fire 08 00186 g005
Figure 6. Results of the SVI.
Fire 08 00186 g006
Figure 7. Results of the AEI.
Fire 08 00186 g007
Figure 8. Results of the TEI.
Fire 08 00186 g008
Figure 9. Results of the VEI.
Fire 08 00186 g009
Figure 10. Results of the FAVI.
Fire 08 00186 g010
Figure 11. Results of the WR-BVEI.
Fire 08 00186 g011
Figure 12. Main fire fronts and traced spreading sectors.
Fire 08 00186 g012
Table 1. Indexes and criteria considered for the evaluation of vulnerability and exposure of buildings to the risk of forest fires.
CRITERIAVULNERABILITY AND EXPOSURE EVALUATION
Low
(0.5)
Moderate
(1)
High
(1.5)
Very High
(2)
STRUCTURAL VULNERABILITY INDEX (SVI)
Structural materialNon-flammable (stone, brick, cement, etc.)Low flammability (e.g., fireproof woods)Moderately flammable (wood, rugs, etc.)Highly flammable (cardboard, plastics, etc.)
Blinds or shuttersPresence of blinds or shutters--Absence of blinds or shutters
Age of buildings2000 or later1976–19991951–19751950 or earlier
ACCESSIBILITY EXPOSURE INDEX (AEI)
Type of access road to the buildingsBidirectional-One-wayDead-end
Condition of the access road network to buildingsExcellent access road networkGood access road networkAcceptable access road networkDegraded access road network
Distance between buildings and extinguishing means<5 min<15 min<30 min>30 min
TERRITORIAL EXPOSURE INDEX (TEI)
Slope of the landBuildings located in areas (radius of 100 m) with a slope of 10° or lessBuildings located in areas (radius of 100 m) with a slope between 10° and 15°Buildings located in areas (radius of 100 m) with a slope between 15° and 25°.Buildings located in areas (radius of 100 m) with a slope of more than 25°
Proximity to ravinesBuildings located more than 200 m from a ravineBuildings located between 100 and 200 m from a ravineBuildings located between 50 and 100 m from a ravineBuildings located less than 50 m from a ravine
Type of settlement around the urban–forest interfaceVery dense populationDense populationDispersed populationIsolated population
VEGETATION EXPOSURE INDEX (VEI)
Distance between buildings and forested areas>50 m30–50 m10–30 m<10 m
Proximity between buildings and tree canopies >30 m10–30 m2–10 m<2 m
Presence of potentially pyrophytic vegetation (fuel models with fast and easy propagation).No pyrophytic vegetation within a radius of 100 m.No pyrophytic vegetation within a radius of 50–100 m.With pyrophytic vegetation in a radius of 30–50 m.With pyrophytic vegetation within 30 m of the building
FIRE-AFFECTED VEGETATION INDEX (FAVI)
Presence of vegetation affected by the fire in the vicinity of buildings.No surrounding vegetation affectedAffected vegetation within a radius of 200 mAffected vegetation within the propertyAffected vegetation in the immediate vicinity of the building
Table 2. Wildfire Risk Building Vulnerability and Exposure Index (WR-BVEI).
WR-BVEI ValueVulnerability and Exposure Categories
≤10Very low
10–12.5Low
12.5–15Moderate
15–17.5High
≥17.5Very high
Table 3. Considered elements for the estimation of the value of the salvaged.
ElementExplanationValue
Forest areaEconomic production of forests (wood, beekeeping, livestock, etc.), excluding recreational and environmental activities [61]EUR 2125/ha
Investment in forest fire emergency preparednessPublic investment for the prevention and extinction of forest fires, protection of wild flora and fauna, creation and maintenance of forest roads, forest research, etc. [24]EUR 123/ha
CO2 captureCost per CO2 captured. Only the value of live standing wood is included. It is calculated as follows:
1.18 tCO2/m3 × (ha of conifers salvaged × m3 of conifers per hectare) × market price [24,62,63]
EUR 8563/ha
BuildingsValue of the real estate market in the third quarter of 2023, divided by two for buildings smaller than 40 m2 or of a provisional nature and by four for sheds and warehouses [64]EUR 1679/m2
Land erosionAverage cost of land lost due to forest fire [65]EUR 5.82/ha
Agricultural productionAverage price of agricultural land in the Canary Islands [66]EUR 83,299/ha
Infrastructure and land for primary sector activitiesAverage price of artificial surfaces used for primary sector activities, such as agriculture, livestock, forestry, mining, or fish farming. Includes infrastructure and associated land but not agricultural or livestock plots directly [67]EUR 2.65/ha
RecreationalAverage cost of artificial surfaces destined to non-productive services, such as commerce, hotels, offices, and leisure, provided they are outside the urban fabric and are easily identifiable. Includes recreational parks, amusement parks, zoos, resorts, and campgrounds [67]EUR 1152.71/ha
Wood productionAverage cost of areas under logging and wood processing [67]EUR 1.37/ha
Conservation of biological diversityPublic investment per hectare for the protection and preservation of ecosystems and species [67]EUR 15.81/ha
Water supplyAverage cost of infrastructure dedicated to water treatment, purification, storage, and distribution [67]EUR 793.8/ha
Table 4. Evaluation of the salvaged.
TypeEstimated
Salvaged
Assets
ValueEstimated Damaged
Assets
Estimated Loss Value (EUR)Estimated
Salvaged Value (EUR)
Buildings
Housing407EUR 1679/m250,465 m21,062,74425,417,707
Housing <40 m2 or temporary268EUR 420/m210,665 m2411,8761,342,910
Other (camping, warehouses, etc.)257EUR 210/m222,475 m2334,5931,414,998
SubtotalEUR 1,809,213EUR 28,175,615
Environment
Environmental9119 haEUR 2125/ha11,965 ha25,425,62519,377,875
Land erosion9119 haEUR 6/ha11,965 ha69,63653,073
Investment in forest fire emergency preparedness9119 haEUR 123/ha11,965 ha1,471,6951,121,637
Conservation of biological diversity9119 haEUR 15.8/ha11,965 ha189,167144,171
Water supply9119 haEUR 793.8/ha11,965 ha9,497,8177,238,662
SubtotalEUR 36,653,940EUR 27,935,419
Productive
Wood production9119 haEUR 1.37/ha11,965 ha16,39212,493
Infrastructure and land for primary sector activities (without agricultural or livestock plots)9119 haEUR 6.65/ha11,965 ha31,70724,165
Crops511,934 haEUR 83,299/ha109,928 ha9,157,05942,640,758
Recreational9119 haEUR 1152.71/ha11,965 ha13,676,90410,511,562
SubtotalEUR 22,882,062EUR 53,188,978
Immaterial
CO29119 haEUR 8563/ha11,965 haEUR 102,456,295EUR 78,085,997
TOTALEUR 163,801,509EUR 187,386,008
Disclaimer/Publisher’s Note: The statements, opinions and data contained in all publications are solely those of the individual author(s) and contributor(s) and not of MDPI and/or the editor(s). MDPI and/or the editor(s) disclaim responsibility for any injury to people or property resulting from any ideas, methods, instructions or products referred to in the content.