Article

Spatial Agreement of Burned Area Products Derived from Very High to Coarse-Resolution Satellite Imagery in African Biomes

by
Daniela Stroppiana
1,*,
Matteo Sali
1,2,
Pietro Alessandro Brivio
1,
Giovanna Sona
3,
Magí Franquesa
4,
M. Lucrecia Pettinari
5 and
Emilio Chuvieco
5
1
Consiglio Nazionale delle Ricerche-Istituto per il Rilevamento Elettromagnetico dell’Ambiente (CNR-IREA), 20133 Milano, Italy
2
Dipartimento di Scienze dell’Ambiente e della Terra (DISAT), Università degli Studi di Milano-Bicocca, 20126 Milano, Italy
3
Dipartimento di Scienze Agrarie e Ambientali—Produzione, Territorio, Agroenergia, Università degli Studi di Milano, 20133 Milano, Italy
4
Instituto Pirenaico de Ecología, Consejo Superior de Investigaciones Científcas (IPE-CSIC), 50059 Zaragoza, Spain
5
Departamento de Geología, Geografía y Medio Ambiente, Universidad de Alcalá, 28801 Alcalá de Henares, Spain
*
Author to whom correspondence should be addressed.
Fire 2025, 8(4), 126; https://doi.org/10.3390/fire8040126
Submission received: 13 January 2025 / Revised: 21 March 2025 / Accepted: 22 March 2025 / Published: 26 March 2025

Abstract

Satellite data provide the spatial distributions of burned areas worldwide; assessing their accuracy and comparing burned area estimates from different products is relevant to gain insights into their reliability and sources of error. We compared BA maps derived from multispectral satellite data with different spatial resolutions, ranging from Planet (3 m) to Sentinel-2 (S2, 10–20 m), Sentinel-3 (S3, 300 m), and MODIS (250–500 m), over selected African sites for the year 2019. Planet and S2 images were processed to derive BA maps with a supervised Random Forest algorithm and used to assess the spatial agreement of the FireCCISFD20, FireCCI51, FireCCIS311, and MCD64A1 products by computing omission and commission errors, Dice Coefficient, and Relative bias. The products based on S2 images showed the greatest agreement with the very high-resolution Planet BA maps (overall Dice Coefficient was found to be greater than 80%). The coarse-resolution products showed a lower spatial agreement with reference perimeters. Among the coarse spatial resolution products, FireCCIS311 was found to outperform the others. The spatial resolution of satellite data was found to be influential on accuracy, with the omission error greater than the commission (RelB < 0) for coarser resolution BA products. The spatial patterns of burns and the vegetation type were found to be significant in the mapping accuracy, and BA detection in Sahelian savannas was found to be more accurate. This study provides insights into the variability of the spatial accuracy of different burned area products derived from very high- to coarse-resolution satellite imagery.

1. Introduction

Earth Observation data are a key resource for producing regional to global Burned Area (BA) products that depict the spatial and temporal distribution of wildfires [1]. Fires can have highly variable spatiotemporal patterns, and accurately representing their occurrence is essential for assessing their impact on ecosystems and society [2,3,4]. To this end, EO data provide objective and consistent coverage of the Earth’s surface, transcending natural and human boundaries [4,5,6], thus being suitable for generating fire datasets that support the study of fire regimes, drivers, impacts, and future trends [1,2,7,8]. Several algorithms have been proposed in the literature to map areas affected by fires across various spatial and temporal scales, utilizing a wide range of EO datasets [9,10,11,12,13,14,15]. However, no single algorithm has gained universal acceptance, and considerable effort is still needed to assess the accuracy of existing BA products.
Indeed, several factors hinder the automation of BA mapping and modeling, including fire regimes, climatic and environmental conditions, land cover, and the characteristics of satellite sensors, such as spatial resolution, spectral bands, and observation frequency [16,17]. Validation is the means of providing information on the accuracy of EO BA products and is essential for identifying the factors that could impact their spatial and temporal accuracy. Validation efforts have been conducted for burned area products derived from EO data at various scales, using different satellite sensors, and across all global regions [18,19,20,21,22]. A critical step in validation is the collection of reference datasets that are inherently more accurate than the products being validated. To this end, the use of EO data is widely accepted for capturing a diverse range of land cover and fire conditions worldwide and for designing sampling schemes to ensure robust estimation of accuracy metrics. However, several issues must be considered when building reference datasets from EO images, as extensively discussed in the literature [23]. For example, source EO data should have a higher spatial resolution, cover the same time span of the product being validated, include spectral bands suitable for discriminating burned areas, and, where possible, allow the use of image pairs and/or time series [19] to compare burned areas between dates [2]. Within this framework, the main objective of this work is to compare fire perimeters derived from multi-temporal datasets of Planet (3 m) and Sentinel-2 (S2, 10–20 m) data, obtained through the classification of image pairs using a Random Forest (RF) algorithm (PlanetRF and S2RF products). These datasets were developed for the validation of regional and global BA products, which were also analyzed in this study to assess burned area mapping performance for the FireCCISFD20 [12], FireCCI51 [11], FireCCIS311 [24], and Collection-6 MCD64A1 (hereafter referred to as MCD64) [10] products.
A pairwise comparison of the BA products was conducted at different scales, ranging from the area covered by Planet (referred to as “small-area”) to the region encompassing the S2 tile area (referred to as “tile-area”). The PlanetRF and S2RF products were used as reference perimeters for estimating the accuracy metrics of medium and coarser resolution products, as their fire perimeters were generated using a semi-automatic supervised RF algorithm followed by visual inspection by an expert interpreter to ensure the highest possible reliability. Although fire reference perimeters derived from S2 imagery might not satisfy the requirement of being generated from higher spatial resolution data, they can still be used for validating similar spatial-resolution BA products (e.g., FireCCISFD20) if they are inherently more accurate than the product under validation. Indeed, for large-area validation, S2 images represent the only freely available data that ensure systematic acquisitions [12].
We carried out a comparison of five sites located in typical biomes of Africa in the year 2019. Given the limited number of sites and the lack of randomness in their selection, the assessment does meet the requirements for statistical validation. Hence, it corresponds to validation stage 1 (validation is carried out on a small set of sites and time periods) according to the hierarchy established by the Committee on Earth Observation Satellite Land Product Validation (CEOS-LPV) subgroup (https://lpvs.gsfc.nasa.gov, accessed on 21 March 2025). This multi-scale comparison does not account for temporal reporting accuracy (the correct estimation of the time of burning) [25] and focuses solely on spatial agreement. Nevertheless, the results can provide valuable insights into the variability of accuracy metrics that might be obscured in global accuracy assessment and highlight issues to consider when using BA products at a local scale, which could influence accuracy estimates.

2. Study Sites

The comparison was carried out across five sites located in different African ecoregions: Sahelian savannas (Northern Africa), forest (central Africa), and denser savannas in southern Africa. These sites do not encompass all fire and vegetation conditions in Africa, but they broadly represent African vegetation across a latitudinal gradient. These sites were selected based on the availability of cloud-free S2 and Planet imageries covering a common time period, which are necessary for generating fire perimeters (Figure 1). For each site and pairwise comparison, the “small-area” refers to the region covered by Planet image mosaics, and the “tile-area” corresponds to the overlapping region covered by S2 tiles (~10,000 km2). Notice that site 2C encompasses two S2 tiles (33MXQ and 33MXR), both of which were used for the tile-area comparison. Table 1 summarizes the sites’ location and major land covers.

3. Materials

3.1. The PlanetRF Fire Perimeters

Planet Labs, Inc., based in San Francisco, CA, USA, currently operates approximately 130 small PlanetScope satellites (hereafter referred to as Planet) in sun-synchronous orbits, providing global coverage with equator crossing times between 9:30 and 11:30 a.m. local time. Since its first launch in 2014, the Planet mission has released three generations of miniature Triple-CubeSat satellites: Dove Classic (2014–2022), Dove-R (2019–2022), and SuperDoves (2020–present). The available Planet imagery (Image © 2019 Planet Labs PBC) was accessed via the Planet Explorer web tool (https://www.planet.com/explorer, accessed on 21 March 2025) by filtering for images with cloud cover below 15% and by visually inspecting each scene to discard those with radiometric disturbances. We selected Planet scenes with multispectral bands in the blue (455–515 nm), green (500–590 nm), red (590–670 nm), and Near InfraRed (NIR) (780–860 nm) wavelengths [26], and downloaded 3 m orthorectified and atmospherically-corrected products (Ortho Scene product, level 3B). The total number of Planet scenes (N scenes in Table 1) can be significantly large given the small area covered by each scene; moreover, the number of scenes covering each site can vary depending on the orbit; this also implies a greater effort for mosaicking scenes into single date images. These scenes were spatially mosaicked for each date and site (Table 1), and a supervised RF algorithm was applied to each pair of consecutive dates (pre-fire and post-fire images) to identify areas that burned between them with training data collected for burned and unburned surfaces for each pair of images. Change detection is widely recognized as the most reliable approach for minimizing spectral confusion caused by low albedo surfaces (e.g., shadows, water, and flooded areas) [27], and the use of bi-temporal image pairs is considered the best method for generating fire reference perimeters [28].
The input layers for the Planet RF classification algorithm applied to each pair of consecutive dates included the post-fire image bands as well as the difference between the pre- and post-fire green, red, and NIR reflectance and the Normalized Difference Vegetation Index (NDVI) [29]; the Planet blue band was excluded due to its susceptibility to atmospheric conditions, making it less reliable for burned area mapping [30,31]. The output of this semi-automatic RF classification was visually checked by comparison with RGB false-color composites (NIR, red, green) to ensure the highest accuracy [28,31]; if not satisfactory, burned polygons were manually refined and/or the RF algorithm was re-trained with new training areas. The final classifications from all image pairs were combined into a synthetic layer depicting all areas burned between the first and last Planet images for each site, resulting in the PlanetRF product. This product was delivered as Open Geospatial Consortium (OGC) Geopackage vector features, with the burned polygons labeled with the post-fire date of the corresponding image pair. The PlanetRF BA products for the five sites are shown in Supplementary Materials (Figure S1).

3.2. The Sentinel-2 Fire Perimeters

For each S2 tile covering the Planet small-area, we analyzed two BA products derived from S2 images: the S2RF, generated in this work, and the FireCCISFD20, delivered by the FireCCI project (https://climate.esa.int/en/projects/fire, accessed on 21 March 2025) [12]. Both products are based on S2 imagery. The S2RF fire perimeters were derived using a supervised RF algorithm applied to the multi-temporal dataset of MultiSpectral Instrument (MSI) A and B images and implemented in the Google Earth Engine (GEE) cloud-computing platform [32]. S2 consecutive images were selected by retaining images with cloud cover below 15% and a maximum time interval of 15 days (Table 1); these criteria were adopted from the protocol for validating the FireCCISFD20 BA product, as fully described in [33]. Similar to the Planet data processing, the RF algorithm was applied to each pair of consecutive pre-fire and post-fire S2 images, with training data collected by visual interpretation over unburned areas and areas burned between the two dates (new burns). The RF classification takes as input the post-fire NBR (Normalized Burn Ratio) [34], NBR2 (Normalized Burn Ratio 2) [35], and NDVI indices and their temporal differences. The RF outputs were visually checked by comparison with S2 RGB false-color composites (SWIR-S2 Band11, NIR-S2 Band8, Red-S2 Band 4) and combined into a synthetic layer to represent areas burned between the first and the last S2 image for each site. For the burned areas, the S2RF product records the date of detection as the Day Of the Year (DOY), corresponding to the post-fire image of the detection pair, and it includes a category for regions not observed due to cloud cover, as derived from the S2 Scene Classification Layer (SCL). Figure 2 shows the PlanetRF and S2RF BA products for site 1B in the Sahelian region of Africa. Figure 3 shows a zoomed view of Planet and S2 image sequences for the same site, with the fire perimeters (yellow polygons) overlaid to show the areas burned between each image pair.
The FireCCISFD20 burned area product [12] for the year 2019 over Sub-Saharan Africa was generated by processing MSI Level-2A images acquired by the Sentinel-2 A&B satellites. Multispectral information is combined with thermal anomalies from the Visible Infrared Imaging Radiometer Suite (VIIRS) sensor [36] onboard the Suomi-NPP and NOAA-20 satellites that provide medium spatial resolution active fires (375 m). The FireCCISFD20 BA product used in this work is delivered as full resolution (20 m) in 5-by-5-degree tiles in GeoTIFF format. Developed under the European Space Agency (ESA) Climate Change Initiative (CCI) Programme, the dataset is freely accessible through the CEDA repository (https://catalogue.ceda.ac.uk/uuid/01b00854797d44a59d57c8cce08821eb accessed on 21 March 2025).

3.3. Coarse Resolution BA Products

The high- and medium-resolution BA products were compared to currently available global BA products: FireCCI51 [11], FireCCIS311 [24], and MCD64A1 [11].
The MODIS Fire_cci version 5.1 product (FireCCI51) provides monthly global burned area maps for the period 2001–2020. BA data are derived using a hybrid algorithm that combines the highest resolution MODIS (250 m) red and near-infrared (NIR) bands with active fire data from thermal channels (collection 6 MODIS 1 km thermal anomalies) [16]. The FireCCI51 BA product used in this work is the full-resolution pixel product (250 m), which includes monthly BA estimates with daily records of DOY detection, uncertainty values, and burned land cover.
The Sentinel-3 S3 SYN (Synergy) Fire_cci version 1.1 product (FireCCIS311) comprises 300 m monthly global burned area maps covering the period 2019–2022. The product is derived from the Synergy dataset developed from the OLCI (Ocean and Land Colour Instrument) and SLSTR (Sea and Land Surface Temperature Radiometer) sensors onboard the Sentinel-3 satellites. Two main inputs are used by the algorithm: Level-2 Synergy surface reflectance (SY_2_SYN, bands SDR-S5N and SRD_S6N, corresponding to the short and long ShortWave InfrarRed (SWIR) bands) and VIIRS active fire data [36]. The characteristics and format of the delivered product are the same as in the case of FireCCI51.
NASA’s MODIS Collection-6.1 MCD64A1 Burned Area product provides 500 m monthly global burned area maps from November 2000 to the present. It is derived from MODIS Surface Reflectance data combined with 1 km MODIS thermal anomalies [16]. The dataset consists of monthly layers of the date of burn detection, uncertainty, and quality information for MODIS in 1200 km × 1200 km tiles.
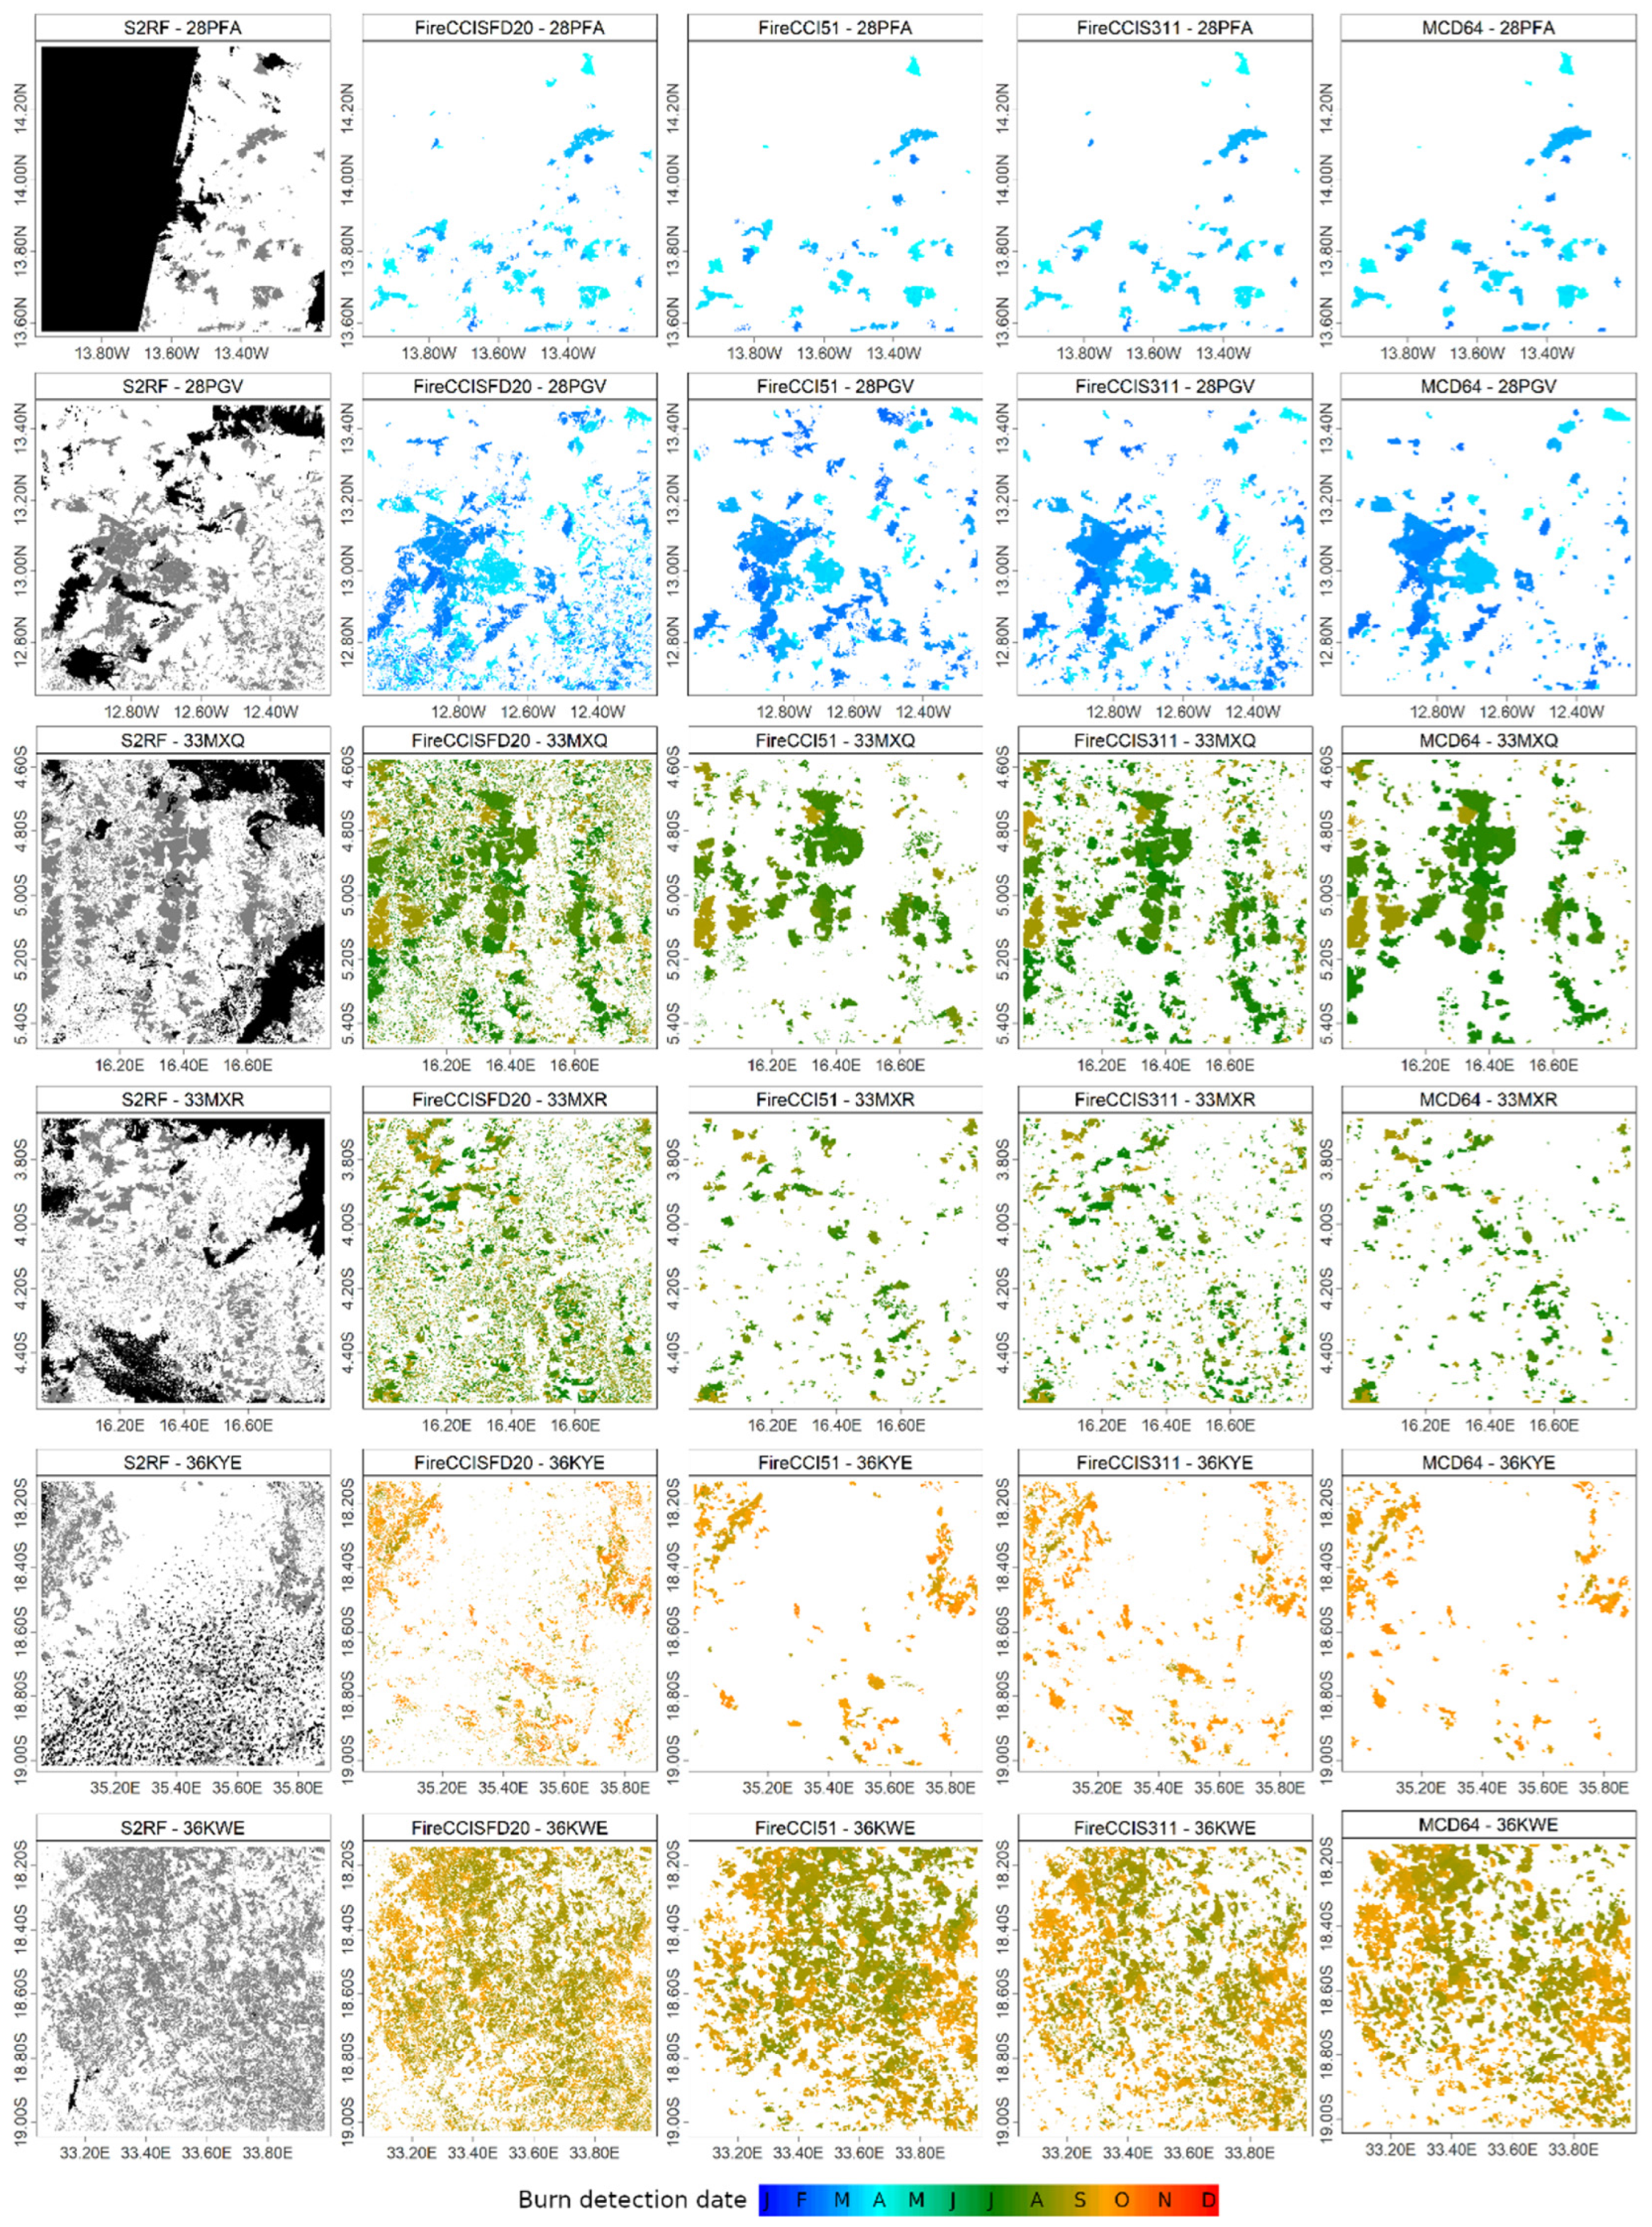
In Figure 4, tile-area BA products (coarse resolution and FireCCISFD20) for the five sites are compared, with colors representing the date of detection as DOY, which varies across sites according to the fire season. The panels highlight the larger burned area detected by the FireCCISFD20, attributed to its higher spatial resolution and the ability to detect small burns.

4. Methods

We assessed the spatial agreement between the BA products over the region covered by the Planet mosaics (small-area) and the S2 tiles (tile-area). Before comparison, all BA products were spatially and temporally sampled to the common area and dates and projected to the site-specific UTM coordinate reference system. For the PlanetRF vs. S2RF comparison, the S2RF cloud masks were applied to PlanetRF classifications to have the common observed area. For the other products, cloud cover information is only available at a monthly time step; therefore, it could not be directly applied to match the time period covered by the PlanetRF and S2RF products. From the pairwise comparison, we derived confusion matrices and accuracy metrics for the burned area class: omission error (OE) and commission error (CE), Dice Coefficient (DC), and Relative bias (RelB) [21,37,38]. The confusion matrix, commission, and omission error metrics are widely used to summarize the proportions of agreement and disagreement between the burned and unburned classes with respect to reference data [28]. DC is a similarity index that combines CE and OE into a single metric that varies in the range [0, 1], with values closer to 1 (or 100% if expressed as a percentage) indicating better accuracy. The RelB metric quantifies the percent difference between OE and CE, where negative values (OE > CE) indicate underestimation and positive values (OE < CE) indicate overestimation of the area burned. Tables S1 and S2 provide formulas for the confusion matrix and accuracy metrics, respectively. Spatial agreement between BA products was also visualized using pixel-by-pixel difference images, which highlight areas of agreement and disagreement in burned area classifications [38].
Since the confusion matrix provides a measure of the overall spatial agreement and may hide compensation effects, all BA products were further assessed using grid layers to compare the proportion of area burned within grid cells [14,18]. For the small-area comparison, the grid cell dimension was set to 1 km × 1 km, while, for the tile-area comparison, the grid cell dimension varied from 1 km to 6 km. The results were displayed as scatterplots, and agreement was quantified using regression analysis, including metrics such as slope, coefficient of determination (R2), and Root Mean Squared Error (RMSE). Regression metrics are also a way to mitigate the impact of co-registration errors and mixed pixels when comparing products with different spatial resolutions.

5. Results

5.1. Small-Area Comparison

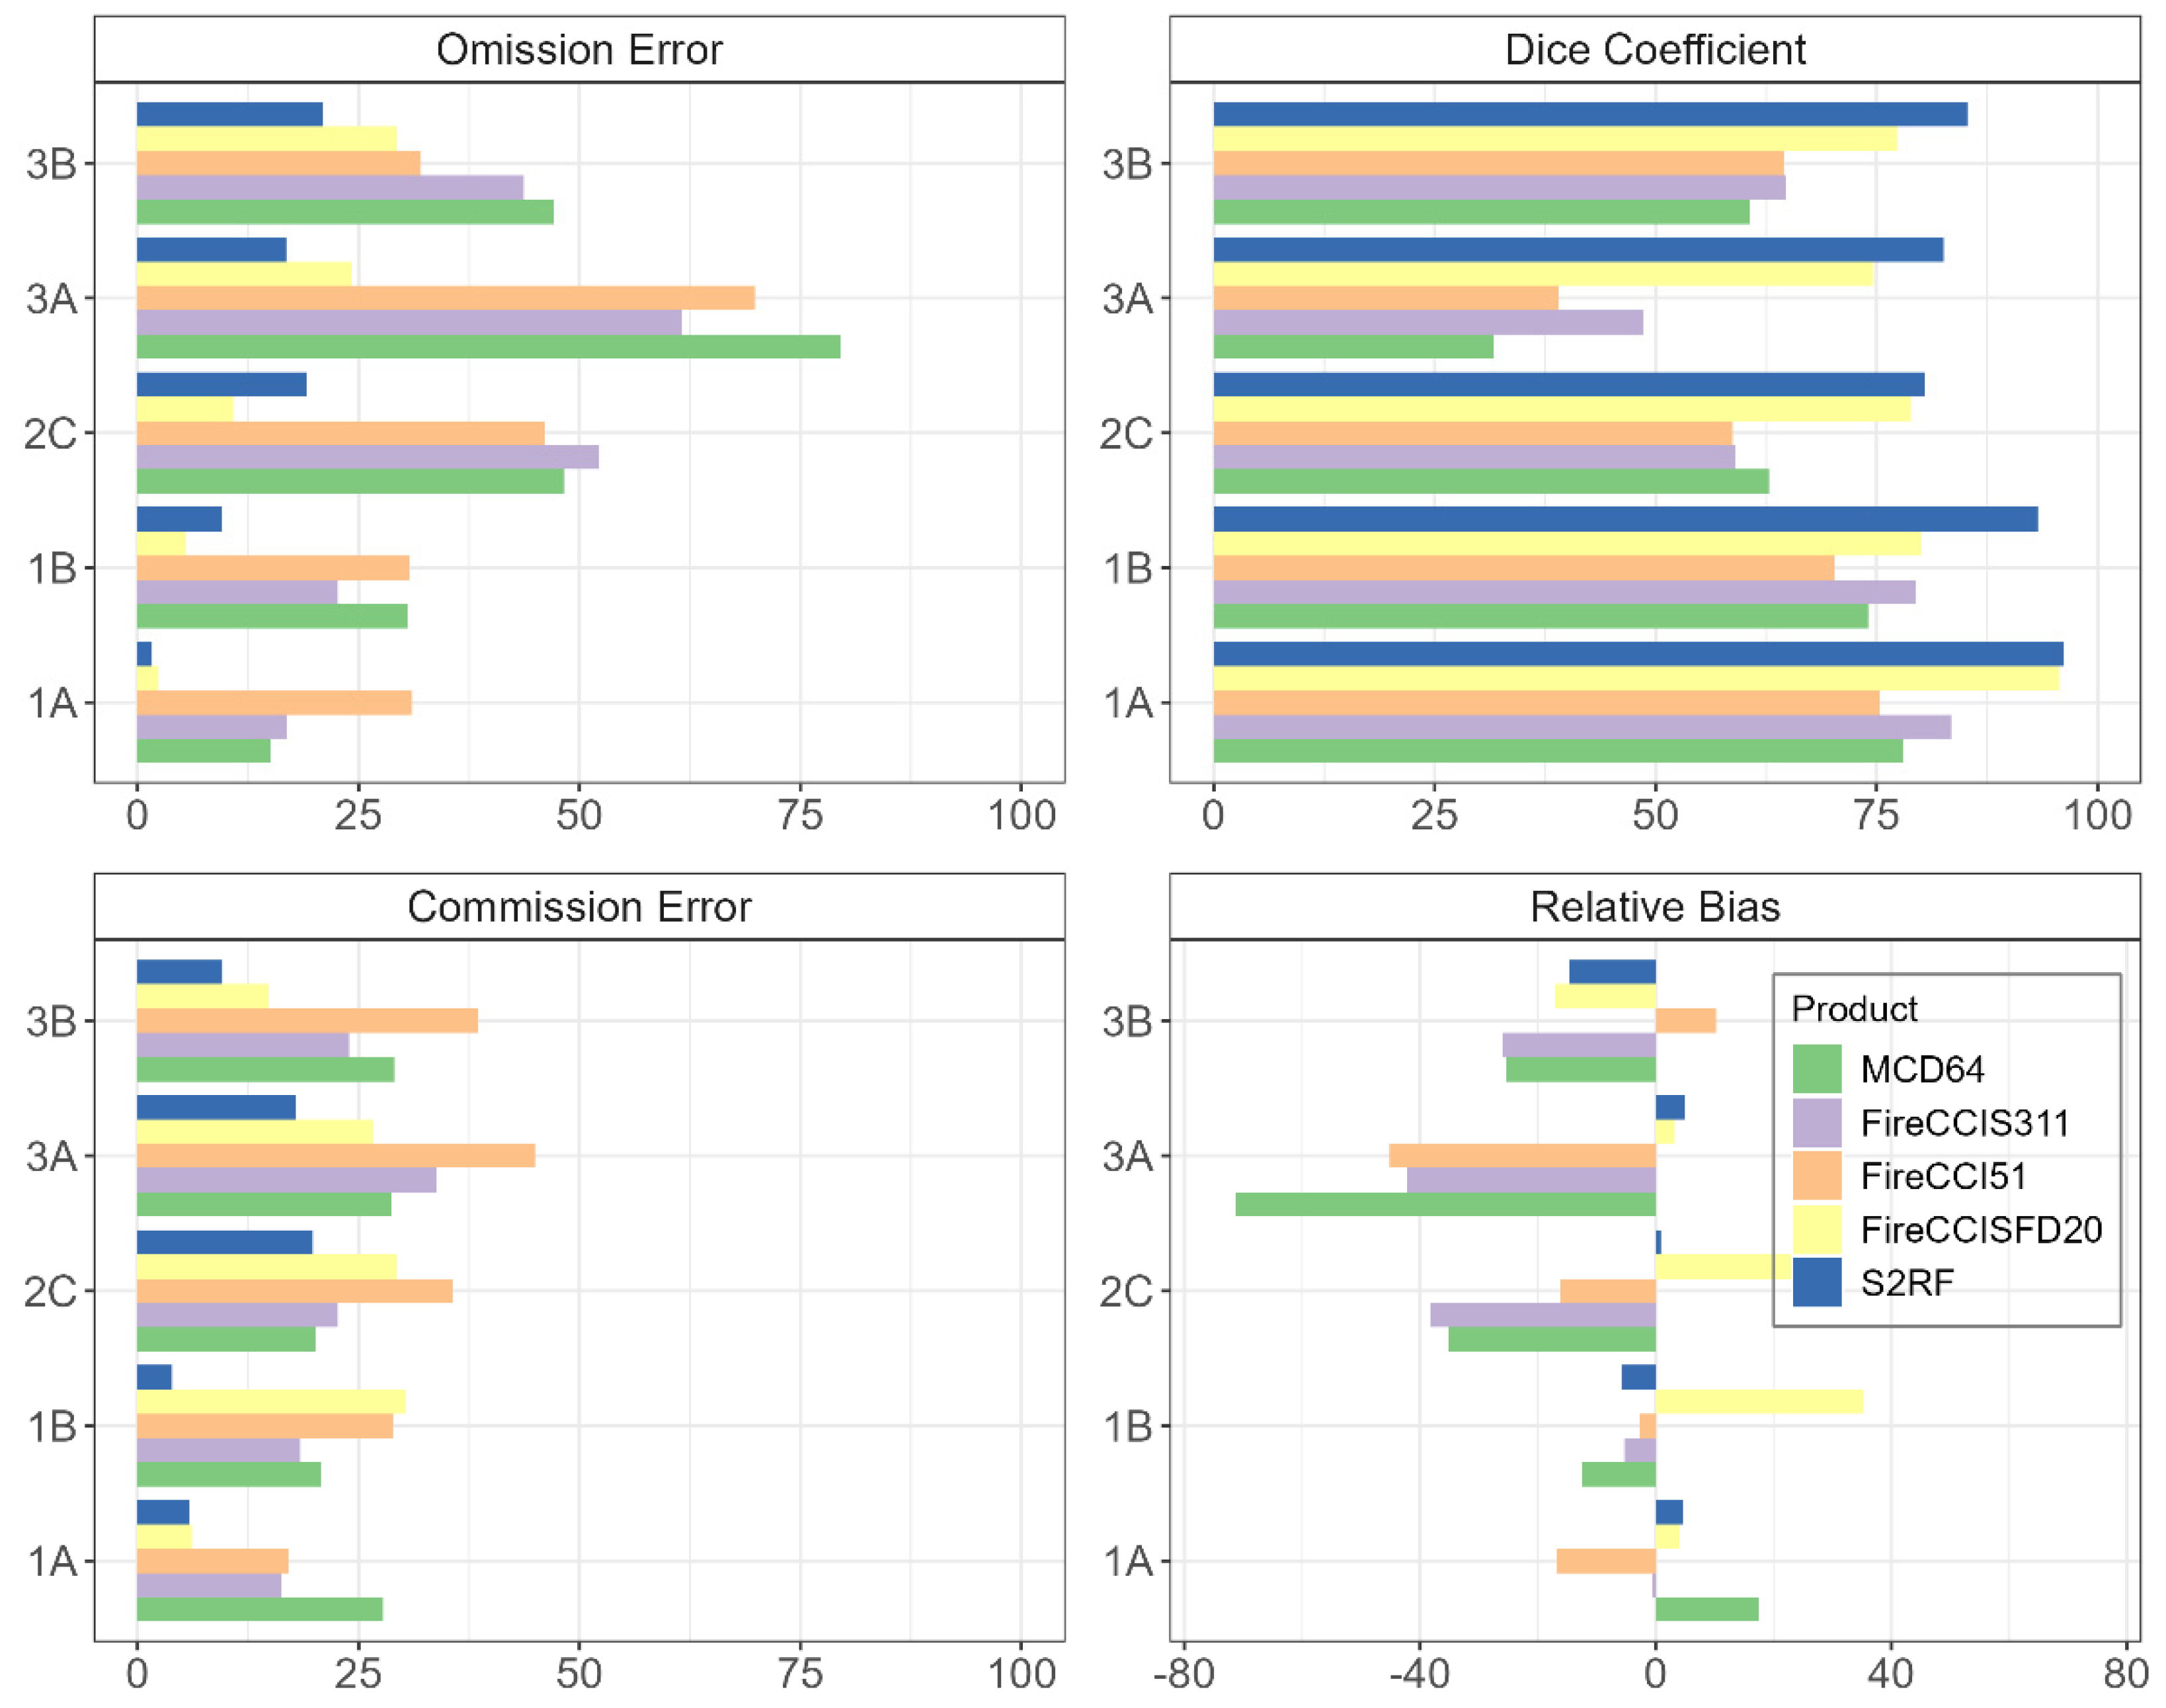
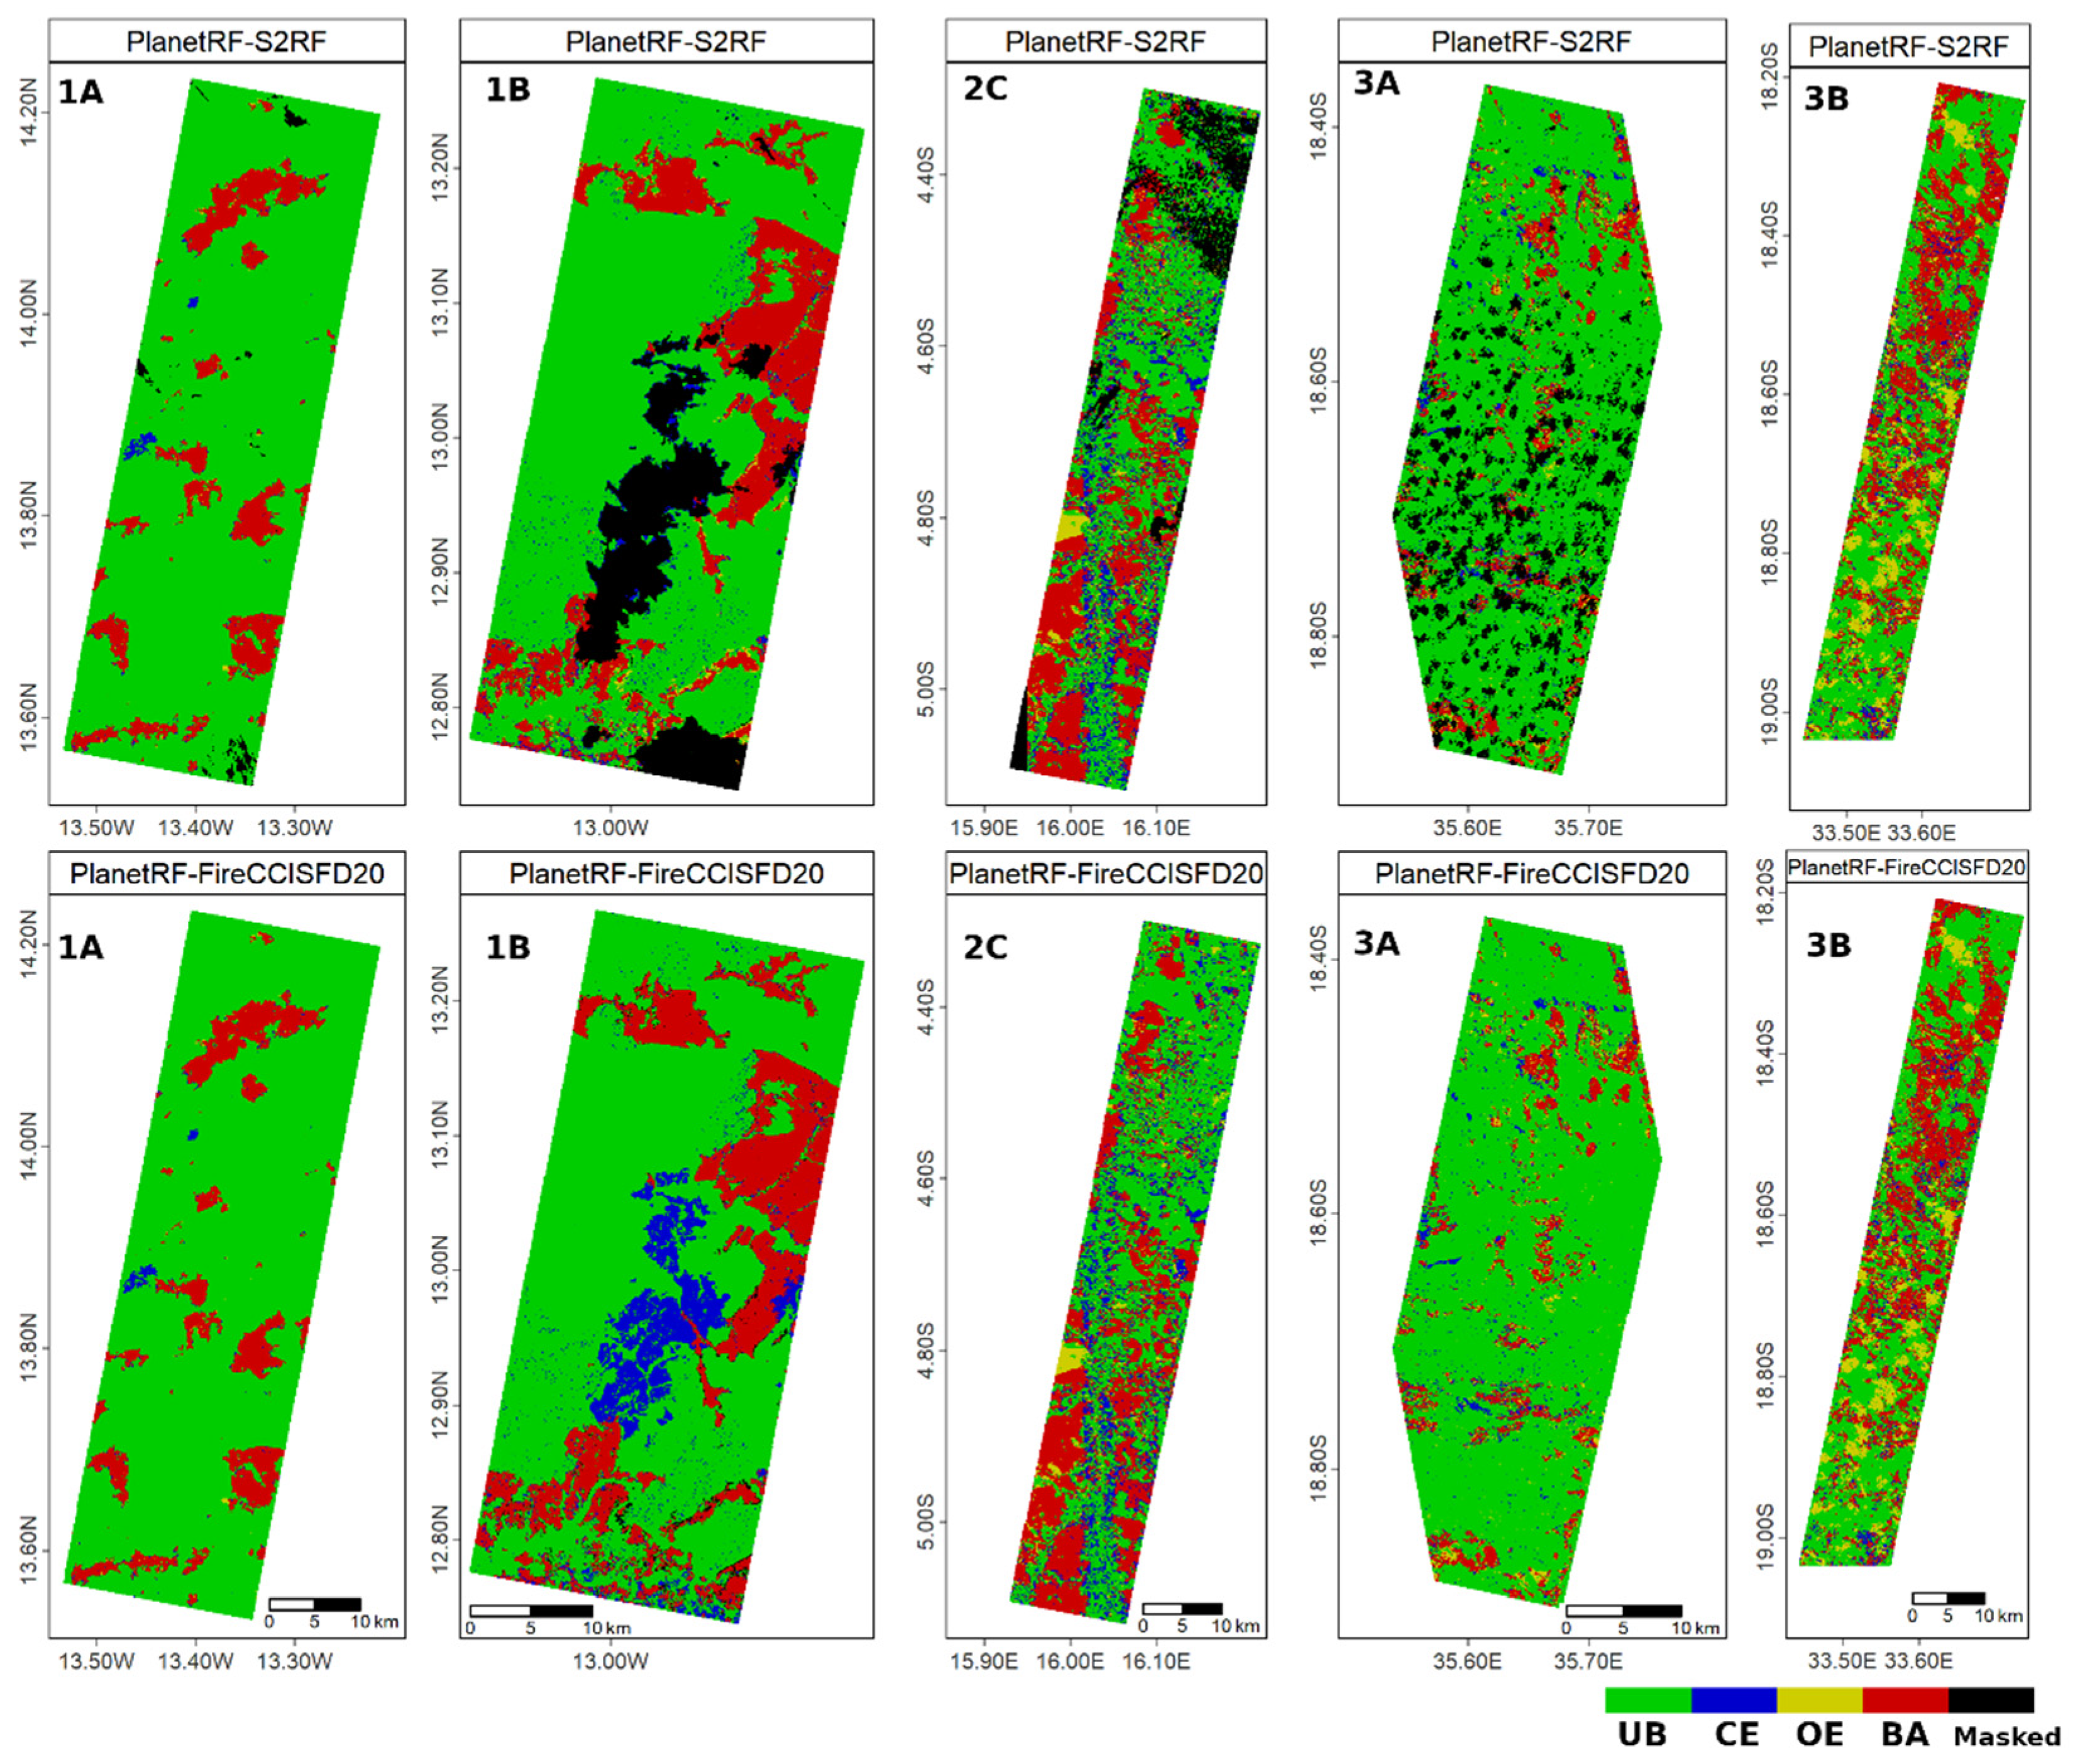
Figure 5 plots the small-area accuracy metrics (for each site and all sites together) for all products, using high-resolution PlanetRF perimeters as the reference. Detailed values are provided in Supplementary Materials (Tables S3 and S4). Figure 6 shows the agreement maps comparing PlanetRF with S2RF and FireCCISFD20.
The overall Dice Coefficient (DC) ranges from 63.7% to 86.2%, with the highest values (>80%) achieved by the S2-based BA products. For the S2RF product, sites 1B and 3B have OE >> CE, leading to a negative RelB. The opposite pattern (CE > OE) is observed at sites 1A and 3A, leading to a positive RelB. Overall, the RelB is negative for S2RF (−4.8%) and positive for FireCCISFD20 (+8.6%). Additionally, the overall commission error of the FireCCISFD20 product is twofold that of the S2RF product (22.9% vs. 11.6%), while the omission errors between the two products are nearly identical. The site-by-site metrics confirm this general trend for FireCCISFD20, except at site 3B (RelB = −17.1%), where the two S2-based products show more similar RelB values.
The coarser resolution products, as expected, have the lowest accuracy, with omission errors, in most of the cases, greater than commission errors, a negative RelB, and DC < 70%. The FireCCI51 BA product is the one with the smallest difference between commission and omission errors (RelB = −6.6%). The relative bias metric provides insight into whether a product tends to overestimate or underestimate (balanced omission and commission errors) and does not represent a complete picture of the product’s performance; indeed, the FireCCI51 BA product has the greatest values for the commission errors at all sites, except site 1A. In contrast, both FireCCIS311 and MCD64 have omission errors that are significantly larger than their commission errors, confirming the underestimation of the area burned when compared to the PlanetRF perimeters. These results are confirmed locally with negative RelB values for all sites and products except for two cases: site 3B (PlanetRF vs. FireCCI51) and site 1A (PlanetRF vs. MCD64).
When analyzing individual sites, the highest accuracy was obtained for all products at site 1A in the Sahelian savanna region: DC > 75% for the coarser resolution products and DC > 95% for the S2-based products. Both S2RF and FireCCISFD20 have omission and commission errors lower than 10%. For the coarser resolution products, these errors are higher, but the FireCCIS311 demonstrates relatively good performance (OE / CE ~16% and DC > 80%). Notably, MCD64 is the only product at this site with CE > OE and RelB > 0, due to the overestimation of burned areas associated with the coarser resolution data; the 500m spatial resolution reduces the accuracy of burned edge detection due to the presence of mixed pixels (i.e., partially burned pixels) and limits the detection of small unburned islands within fire patches, as depicted in Figure 4 (top row for site 1A) [39,40]. Figure 6 confirms the similar spatial distribution of agreement and disagreement areas between the two S2-based BA products when compared to PlanetRF and highlights how burned areas in this site are clustered in a few large patches, making detection with lower resolution S2 data less prone to errors.
The second most accurate site for S2RF is site 1B (DC = 93.2%), while the FireCCISFD20 accuracy is significantly lower (DC = 80.0%) due to a large commission error (CE = 30.4%) over a cloudy portion of the small-area highlighted by the yellow rectangle in Figure 6. This area was already burned in the first Planet image (17 January 2019), as confirmed by the dates of the MODIS active fires (Figure S2, Supplementary Materials); hence, it was assigned to the unburned category by the PlanetRF change detection algorithm, which detects only new burns. The area was covered by clouds in the first S2 image, acquired on the same date as Planet; hence, it was masked in the S2RF, as indicated by the SCL layer (black area); masked pixels are not included in the confusion matrix and in the computation of the accuracy metrics. Instead, in the FireCCISFD20 BA product, cloudy regions are probably replaced with antecedent observations by temporal compositing [12,13], thus dating the pre-fire image earlier in the season when the area had not burned yet, leading the FireCCISFD20 change detection algorithm to classify it as new burn. This region contributed as much as 89% to the high commission error (CE~30%) and accounted for a 12% difference in the Dice Coefficient. Excluding this region from the comparison of PlanetRF and FireCCISFD20 reduced CE to 12.79% and increased DC to 90.70%, aligning it more closely with site 1A accuracy. Site 1B also ranks as the second most accurate for coarser resolution products.
The accuracy of the S2RF product is lowest at site 2C, with balanced omission and commission errors (~19%). The spatial distribution of errors appears similar in the S2RF and FireCCISFD20 agreement maps, although, in the latter, the commission error is almost 10% larger and is concentrated along the humid regions of the Kwango River Valley. For the coarser resolution products and the three southern sites (i.e., 2C, 3A, and 3B), site 2C generally shows accuracy metrics with intermediate values between those observed at sites 3A and 3B for FireCCI51 and FireCCIS311 products. Site 3A shows the largest omission errors, with a significant underestimation for MCD64 (OE = 79.6%). At this site, all products show their lowest accuracy, except for S2RF, whose lowest accuracy is at site 2C. The FireCCISFD20 product gives lower accuracy (DC = 74.6%) compared to S2RF, although, in both products, omission and commission errors are well balanced, leading to small RelB values. Some of the input S2 images used in the S2RF products were affected by spotty cloud cover, increasing the likelihood of errors due to poor atmospheric conditions and the presence of clouds and cloud shadows.
Site 3B shows omission errors higher than commission errors for both S2RF and FireCCISFD20 products, resulting in negative RelB values of −14.75% and −17.05%, respectively. At this site, the last S2 image is three days earlier than the last Planet image (14 September 2019 and 11 September 2019, respectively), likely contributing to omission errors (yellow regions in Figure 6), especially since fire occurrence is biased towards the end of the time period. Regarding coarse resolution products at site 3B, both FireCCIS311 and MCD64 agree with OE > CE and RelB < 0 and show very similar values for all metrics; the opposite is found for FireCCI51, for which CE > OE, DC is similar to the other two products, but RelB is positive and lower.
The scatterplots in Figure 7 show the spatial agreement between BA products for 1 km × 1 km cells, comparing the S2RF and FireCCISFD20 products to PlanetRF. Parameters of the linear regression models (grey line) are also reported. The scatterplots show the cell-by-cell deviation from the perfect agreement (1:1 line), where full commission and omission cells are located along the y-axis and x-axis, respectively. Notice that, to reduce bias due to the presence of cloud cover, scatterplots were derived by masking out regions that were not observed based on the S2RF cloud mask. The results confirm the high degree of agreement for the Sahelian sites (R2 > 0.95, Slope ~1, RMSE < 0.06) and the greater dispersion of the points for sites 2C and 3B (R2 < 0.8). For site 3B, points below the 1:1 line confirm the larger omission error for both S2RF and FireCCISFD20 products when compared to PlanetRF, while points along the x-axis represent burned polygons that were not detected by the S2-based products. Indeed, over this site, omission error is the highest (20.9% and 29.3% for the S2RF and FireCCISFD20 products, respectively), largely due to the date mismatch and earlier S2 acquisition dates compared to Planet.

5.2. Tile-Area Comparison

In this comparison, we assumed S2RF as the reference burned area product, as it was derived using image-to-image training of a supervised algorithm (unlike the automatic algorithms used by the other products) and was the product that showed the highest accuracy in the small-area. The area analyzed in this comparison corresponds to the full S2 tile for each site.
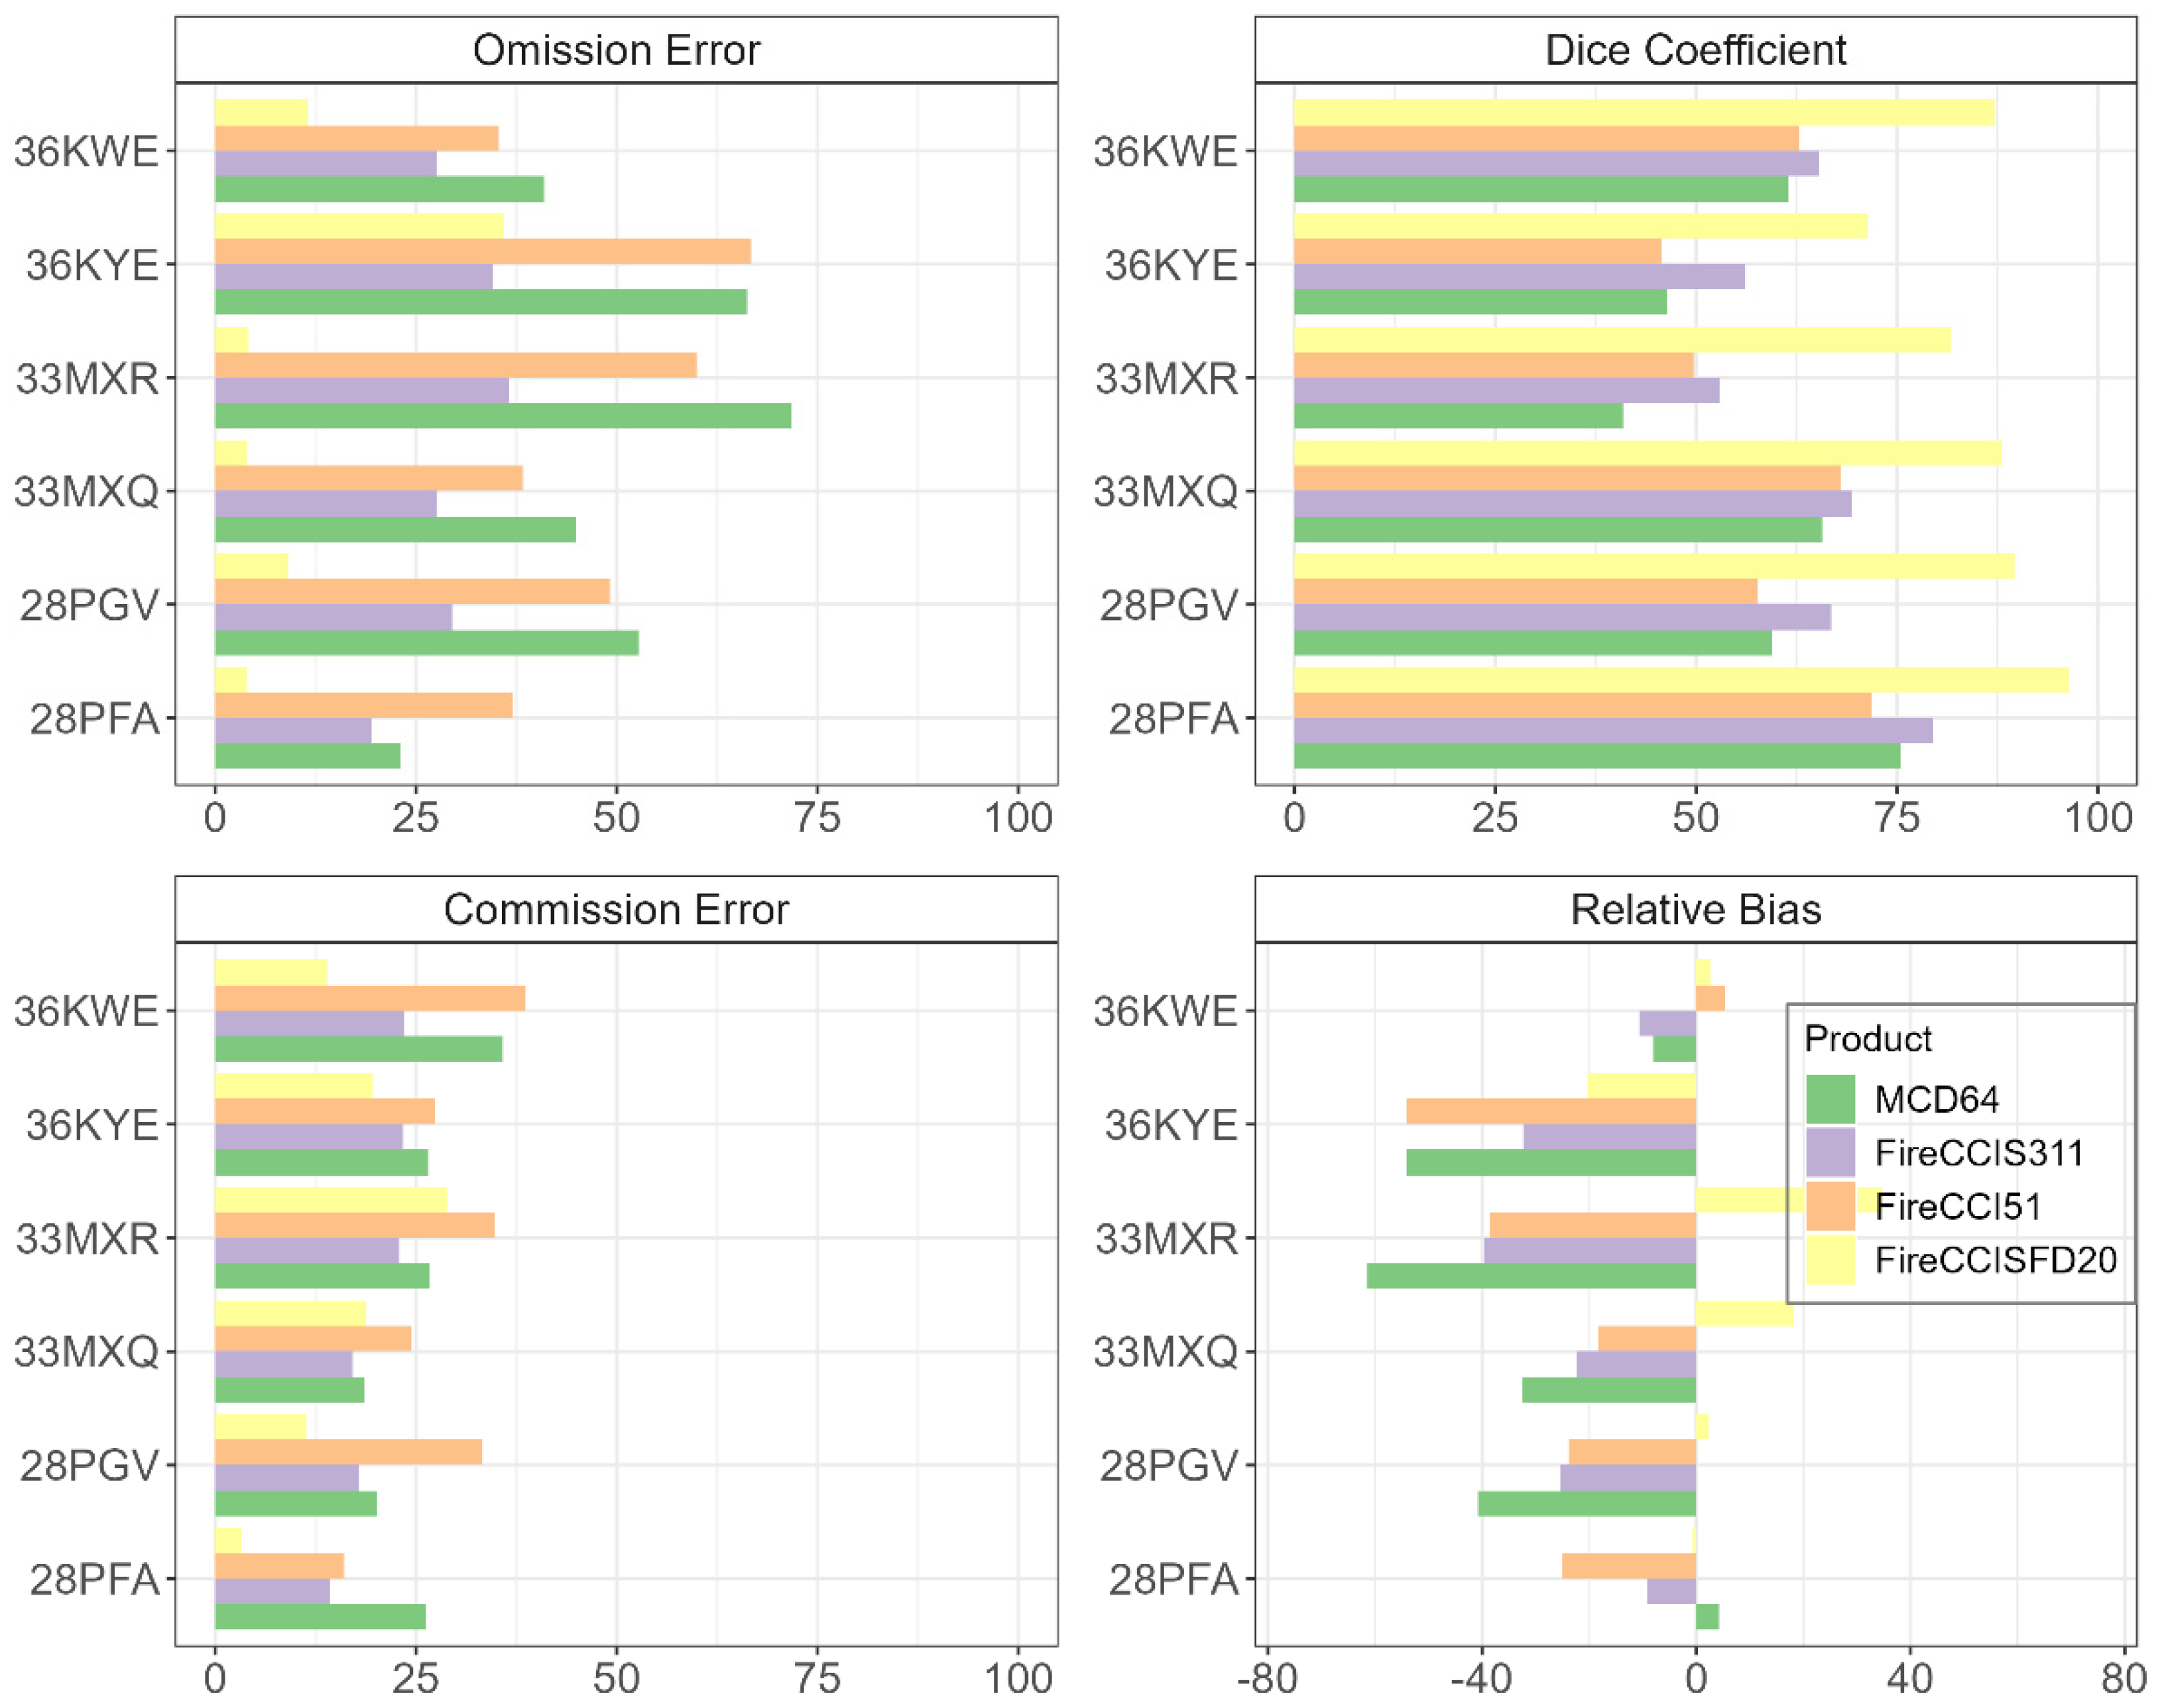
As in the small-area comparison, agreement maps show spatial agreement (burned and unburned areas), omission errors (i.e., areas detected only by S2RF), and commission errors (i.e., areas detected only by FireCCISFD20, FireCCI51, FireCCIS311, and MCD64) (Figure 8). These maps provide a comprehensive view of spatial agreement and disagreement within the tile area, which can vary substantially from tile to tile, depending on factors such as spatial resolution, acquisition dates, fire characteristics, and land cover. Accuracy metrics for tile-area comparison are shown in Figure 9, and values are provided in the Supplementary Materials (Tables S5 and S6).
The FireCCISFD20 product provides the best agreement, with the highest DC values across all tiles (71.3–96.4%), similar to the values obtained in the small-area analysis when compared to PlanetRF (74.6–95.7%). However, FireCCISFD20 shows greater overall agreement with S2RF (DC = 85.6%) than with PlanetRF (DC = 80.2%). When considering the low-resolution products, overall DC ranges from 58.80% (MCD64) to 64.4% (FireCCIS311), and the omission errors are consistently larger than commission errors for all coarse-resolution products (RelB < 0), whereas FireCCISFD20 shows the opposite trend (RelB > 0).
These trends are confirmed by the tile-specific accuracy metrics: omission error is consistently greater than commission error in the FireCCIS311, FireCCI51, and MCD64 products (except for tile 36KWE in FireCCI51 and tile 28PFA in MCD64), similar to the results found for the small-area comparison. The opposite occurs for the FireCCISFD20 product (CE > OE), except for tile 28PFA (RelB = −0.8%), although the difference between omission and commission errors is negligible, and tile 36KYE (RelB = −20.3%), where the omission error (35.9%) is significantly greater than commission (19.6%). Tiles 36KYE and 33MXR have the lowest accuracy across most products, with the highest omission errors for the FireCCI51 and MCD64 products (OE > 60%, yellow regions in Figure 8). As observed in the small-area comparison, tile 28PFA (corresponding to site 1A) has the most accurate results, with significantly greater accuracy for FireCCISFD20 (OE = 4.0% and CE = 3.2%).
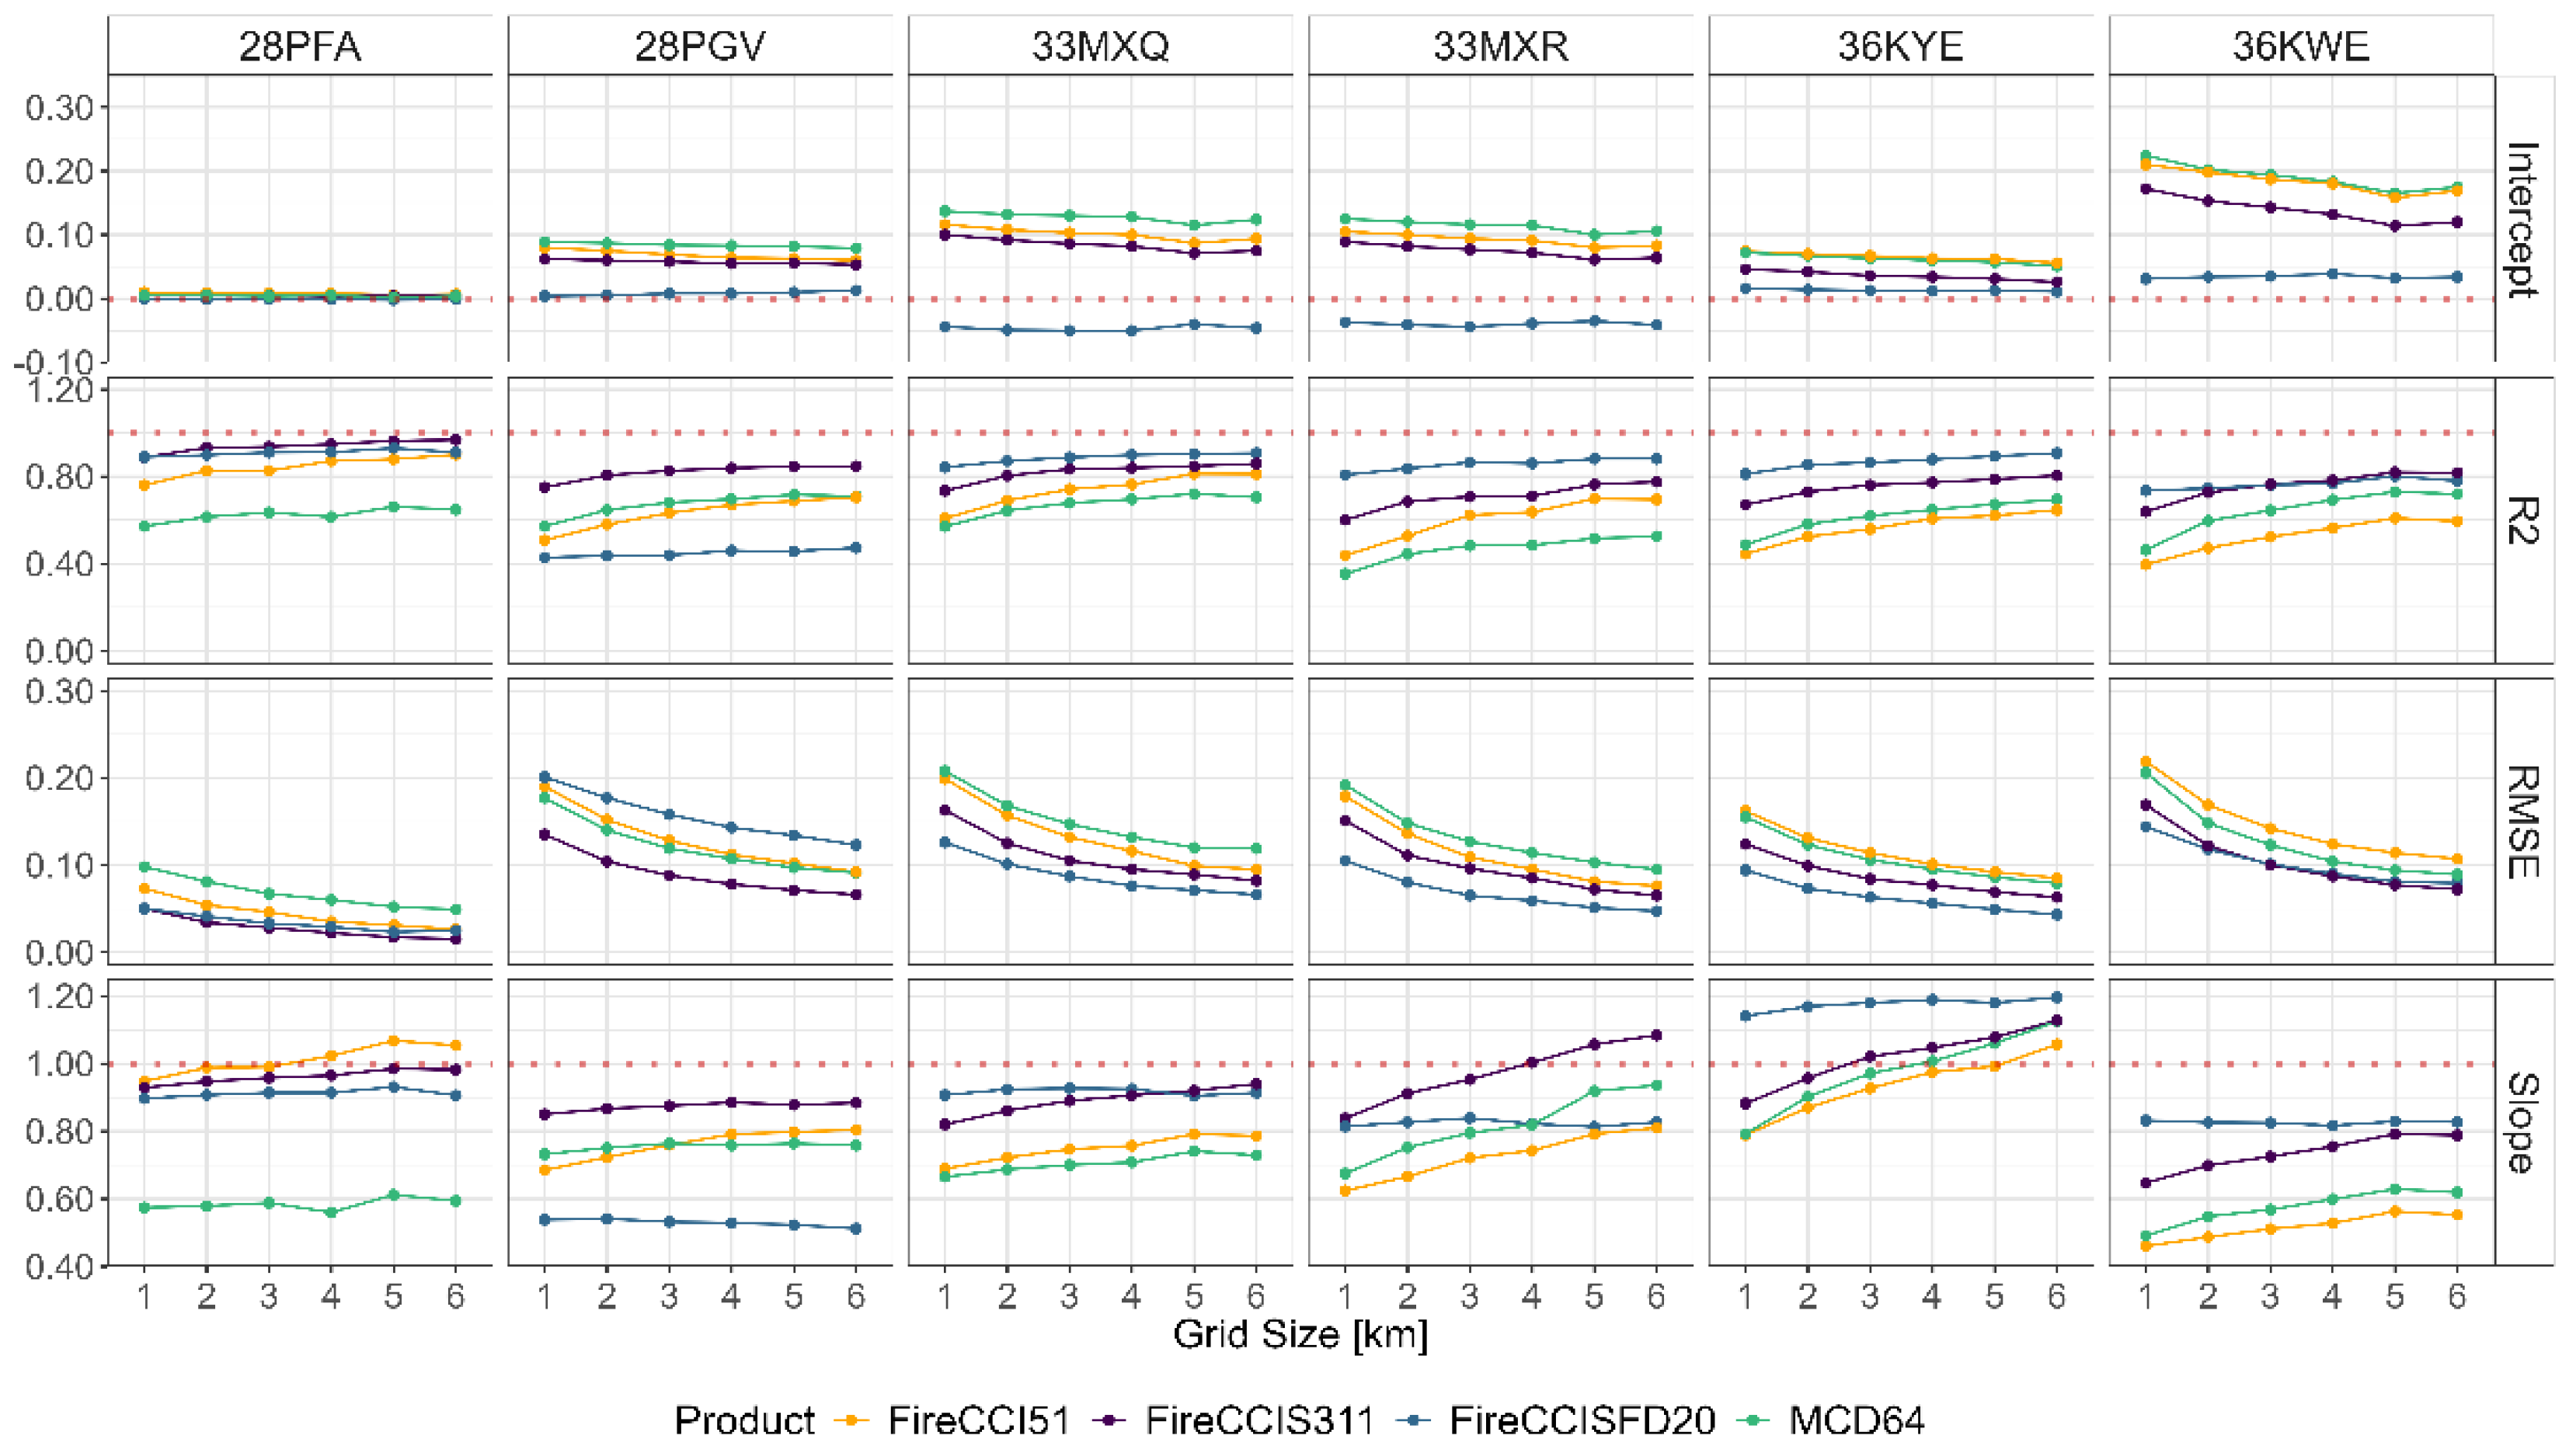
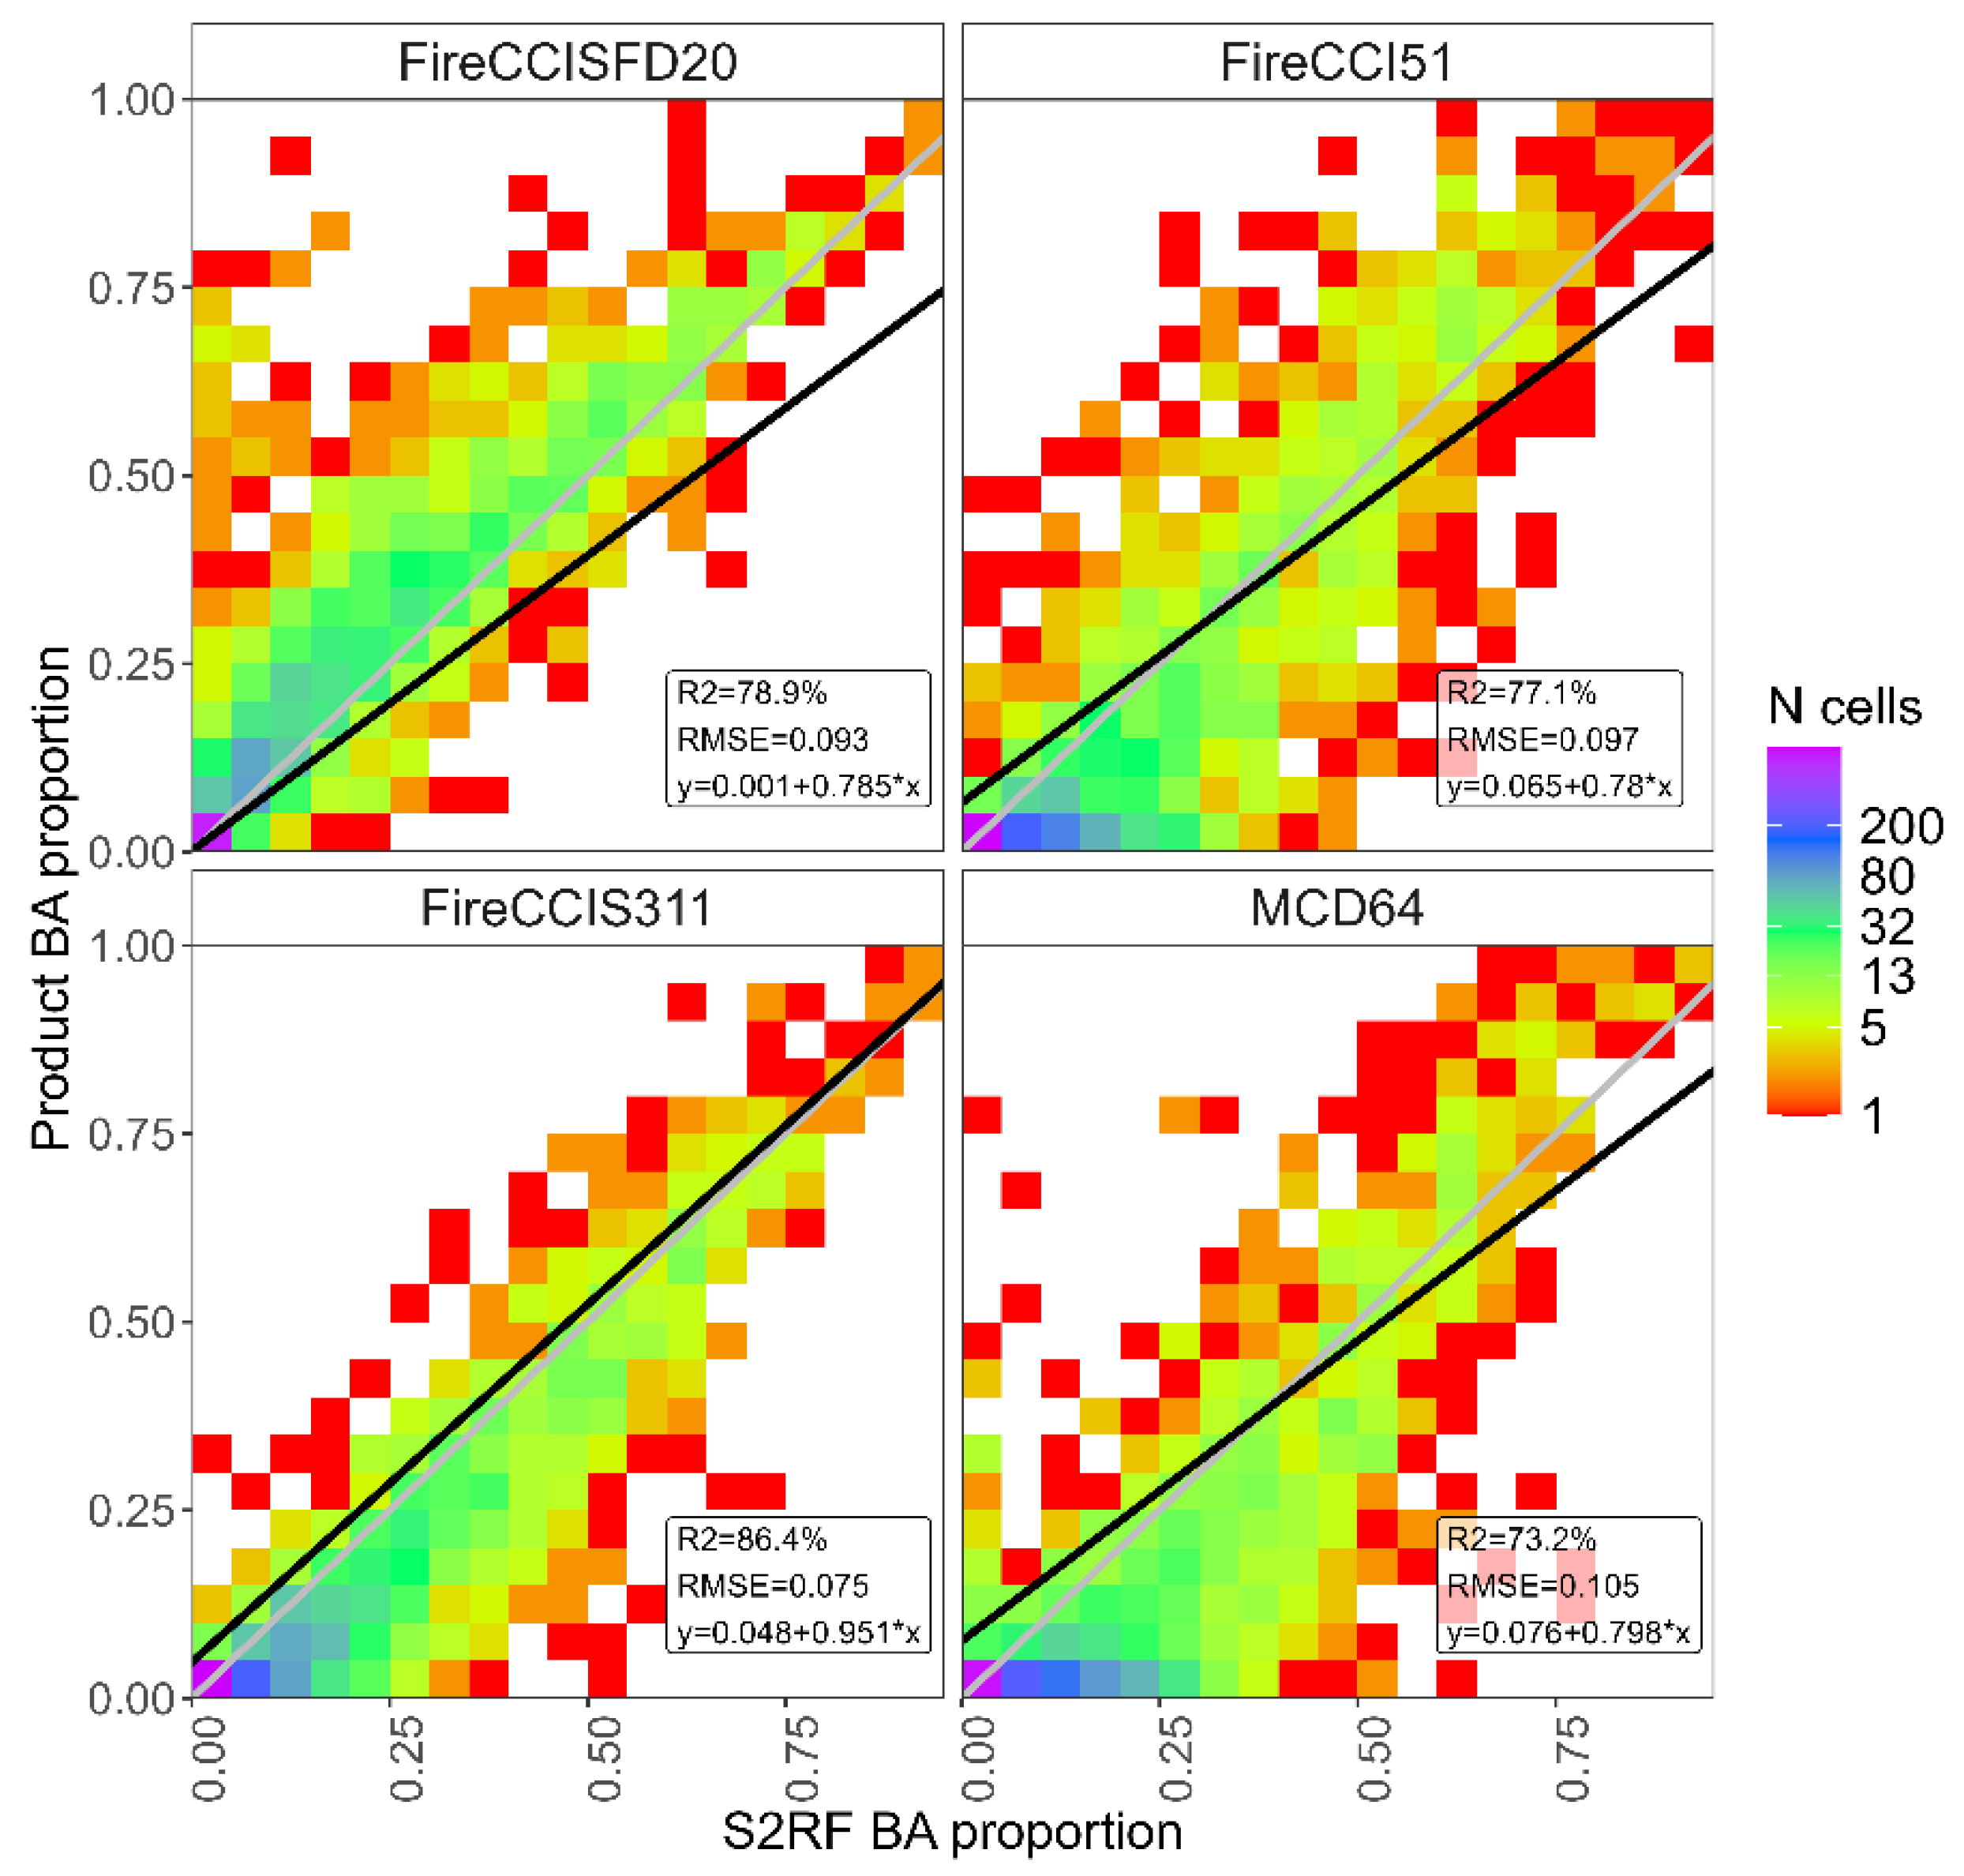
Figure 10 shows the results of the regression analysis carried out for variable sizes of the grid cells (1 km to 6 km, shown on the x-axis) for each S2 tile and for all tiles combined (last column); all regression models were found statistically significant with p < 0.001 (***). Regression parameters show increasing agreement for larger cell sizes, especially for the coarser resolution products, due to spatial compensation effects. The S2RF vs. FireCCISFD20 regression parameters show the least variability with cell size, as both products are derived from S2 imagery. The scatterplots for all tiles at a 5 km grid size (Figure 11) confirm that FireCCIS311 provides the best agreement, with the highest R² and the lowest RMSE. FireCCISFD20 follows, showing slightly better agreement than FireCCI51 and MCD64.
The regression line (black line) highlights the greater amount of area mapped as burned in the FireCCISFD20 compared to the other products, which tend to underestimate burned areas due to larger omission errors.

6. Discussion

We compared BA products derived from multispectral satellite data at different spatial resolutions: 3 m Planet (PlanetRF), 10–20 m Sentinel-2 (S2RF and FireCCISFD20), 300 m Sentinel-3 (FireCCIS311), and 250–500 m MODIS (FireCCI51 and MCD64, respectively). The comparison focused on assessing spatial agreement across five sites in different biomes of Africa for the year 2019, over the areas covered by Planet image mosaics (small-area) and S2 tiles (tile-area ~ 10,000 km2), using the highest spatial resolution PlanetRF and S2RF BA products as reference, respectively. Given the limited number of sites, this assessment represents a Stage 1 validation, meaning it does not quantify the overall accuracy of the BA products under investigation, which is fully reported in other publications [12,18,24,41]. Instead, it provides insights into the variability of the spatial agreement of the BA products at regional and local scales. To ensure the highest accuracy, PlanetRF and S2RF reference fire perimeters were generated using a supervised Random Forest algorithm, with image pair training and visual checks and refinements. Since no suitable source imagery is available, we could not further assess the accuracy of the PlanetRF perimeters. However, the very high spatial resolution, which enhances the detection of small fires, combined with supervised semi-automatic classification, ensures the highest possible accuracy [28]. The lack of bands in the Shortwave Infrared wavelengths could be a limitation for burned area mapping from Planet data. Nevertheless, several studies have achieved more than satisfactory accuracy and successfully used Planet imagery for generating reference datasets [8,30,31,39,42,43].
Besides intrinsic factors, such as fire patch size and shape, spatial and temporal resolution, burn severity, and burn signal persistence [39], which can be sources of disagreement between BA products, we must consider that the time span and spatial unit used for reference vs. product comparisons can greatly influence and, in some cases, bias, accuracy metrics. The characterization of BA mapping accuracy as a function of these factors is a widely addressed research topic in the literature, encompassing all ecosystems globally [39,44].
In this work, spatial agreement was analyzed by extracting all products over the same time period covered by Planet data. However, the lack of Planet images and cloud coverage introduced date differences that could bias commission and omission errors. This effect was particularly evident in the small-area comparison of PlanetRF vs. S2RF and FireCCISFD20 (Table S3, site1B), where errors were influenced by the availability of cloud-free images used to generate the BA products. The major impact of cloud cover is recognized as a delay in fire detection, leading to larger omission errors. However, we also observed (e.g., site 1B, Sahelian savanna) that cloud presence in the pre-fire image inflated commission errors (FireCCISFD20 CE = 30.4% vs. S2RF CE = 5.5%) due to the temporal compositing implemented in the FireCCISFD20 algorithm. Although temporal compositing techniques are used to reconstruct cloud-free images and to reduce the impact of missing data by selecting the “best” available observations over a given period, they can introduce a large uncertainty in fire dating [45]. Preserving information on the pixel acquisition date within composited images could support a more temporally rigorous comparison of reference and product BA maps.
In the small-area comparisons, S2RF and FireCCISFD20 showed the highest accuracy among all products with overall DC > 80% and omission and commission errors generally below 20% (Tables S3 and S4 and Figure 5). Across the analyzed sites, S2RF was demonstrated to be more accurate than FireCCISFD20 (DC = 86.2%), primarily due to the semi-automatic algorithm, which involved training and classification for each image pair. This result confirms that supervised algorithms and image-by-image training can achieve greater accuracy but at the expense of a significantly greater effort for collecting training data and manually refining burned perimeters. For this reason, such algorithms are not feasible for generating operational, multiannual, and large-scale BA products. These findings also support the use of EO data with similar or identical spatial resolution as the BA products being validated as a source for generating reference perimeters, but only if the classification algorithm produces outputs with greater accuracy than the products under validation [46]. Indeed, imagery with higher spatial resolution and consistent acquisitions is not always available or is not economically affordable for building reference datasets.
The two S2-based products have the opposite overall commission to omission error ratios: FireCCISFD20 overestimates the area burned (OE < 16.3%, CE = 22.9%, RelB = 8.58%) in contrast to S2RF (OE = 15.9%, CE = 11.7%, RelB = −4.84%). As discussed above, the compositing technique applied in the FireCCISFD20 algorithm might inflate commission errors due to the selection of pre-fire dates earlier than the first S2 image used for generating the S2RF BA product. The authors of [19] proposed the use of long reference temporal units (longer time periods for comparison) to improve the assessment of spatial accuracy; we, indeed, propose here the same approach by using multi-temporal datasets of Planet and S2 images to derive reference fire perimeters for the small-area and tile-area analyses. However, the less systematic acquisition of Planet images limited the possibility of extending the length of the reference dataset, leaving error metrics potentially affected by date mismatches. For example, the low availability of Planet images at sites 2C and 3B made it particularly challenging to generate cloud-free mosaics for more than three consecutive dates over the same region. Temporal reporting accuracy, therefore, plays a significant role in influencing accuracy metrics, as coarse-resolution BA products—typically based on input data with better temporal resolution compared to high-resolution sensors—are often more accurate in detecting fire dates [13]. At sites 2C and 3B, we observed, in fact, the worst regression parameters (Figure 7), with the greatest dispersion around the 1:1 line. Notice that our analysis pertains to the year 2019; since then, Planet revisiting frequency has significantly increased, overcoming some of the above-discussed issues and offering unprecedented temporal and spatial resolution [47].
By looking at the small-area accuracy metrics by site, we observed that, in most of the cases, S2RF and FireCCISFD20 exhibited commission errors greater than omission (RelB > 0); however, the S2RF overall relative bias was negative due to the weight of sites 1B (RelB = −5.7%) and 3B (RelB = −14.7%).
The coarser resolution products (FireCCI51, FireCCIS311, and MCD64) generally showed lower accuracy at both the small-area and tile-area scales, with the overall omission errors greater than the commission (Figure 9). Spatial resolution has been identified as a key source of error, contributing to commission errors from partially burned pixels and omission errors from undetected small burns [13,45,48]. Among the coarser resolution products, the best overall results were achieved by FireCCIS311, with the Dice Coefficient equal to 67.3% and 64.4% for the small- and tile-area, respectively, outperforming FireCCI51 and MCD64, which showed significantly higher omission errors. Although the direct comparison with other validation studies (e.g., [18,19]) is beyond the scope of this work due to the limited number of sites analyzed, the results are close to those of [19], who reported a DC = 67% for FireCCI51 and DC = 62% for MCD64, suggesting the relevant influence of the use of ‘long units’ (extended time periods) for comparison rather than ‘short units’ (image pairs) in order to compensate for date mismatches between the reference and the BA product.
The results from the regression analysis further support this discussion by comparing BA proportions over grid cells, providing a spatial distribution of the errors. Moreover, in the tile-area analysis, we used grid size variables from 1 km to 6 km, which highlighted the compensation effects in regression parameters, showing better agreement with increasing cell size, except for FireCCISFD20 (Figure 10). Despite variability across sites, FireCCISFD20 and FireCCIS311 showed the best regression metrics (R2 and RMSE).
When comparing BA products, it is essential to consider all factors that may explain the observed disagreements, although quantitatively assessing the impact of each factor on global errors remains challenging. For example, the FireCCISFD20 and FireCCIS311 rely on higher resolution active fire points (NASA VIIRS 375 m) compared to the coarser resolution 1 km MODIS thermal anomalies used in the FireCCI51 and MCD64 BA products. The greater number of active fires can significantly reduce the omission rate for burned areas [39]; in fact, we found FireCCI51 and MCD64 accuracy to be generally lower at both the small-area (DC = 63.7% and DC = 64.7%, respectively) and tile-area (DC = 60.5% and DC = 58.8%, respectively), although with some local exceptions.
The large local variability of accuracy metrics can also depend on the spatial patterns of burned areas and land cover [48]. BA classification in the Sahelian savanna was found to be more accurate for both small- and tile-area comparisons. The best accuracy metrics were observed at site 1A and tile 28PFA (OE and CE < 10% for the high-resolution products), confirming that BA detection in savannas provides the highest accuracy compared to other vegetation types. These findings are further supported by regression parameters (R2 > 95%, Slope ~1, RMSE < 0.1). Similarly, [44] reported the highest accuracy for tropical grasslands and savannas in the Brazilian Cerrado, although direct comparisons are complicated by differences in how savanna land cover is defined across ecosystems. Burned area detection in forested regions is generally more prone to omission errors, as seen in tile 36KYE, where the dominant land cover is classified as ‘Trees’ (OE > 30%), and even high-resolution BA products performed poorly. Detection becomes increasingly challenging when burned areas are small and/or have complex shapes, particularly for lower-resolution images, as in tile 36KWE. This tile is characterized by CE > OE for the higher resolution BA products (FireCCISFD20 and FireCCI51), while the omission error prevails in FireCCIS311 and MCD64, likely due to the inability to detect small burns.
All the factors discussed above (i.e., pre-processing techniques, BA detection algorithm, source image characteristics, validation protocol, reference datasets, site characteristics and conditions, fire patch size, and distribution) collectively influence the estimated accuracy metrics; while isolating the impact of each factor is challenging, these discussions provide valuable insights into their relative contributions.

7. Conclusions

In the comparison of BA products obtained from multi-spectral imagery with varying spatial resolution (3 m Planet, 10–20 m Sentinel-2, 300 m Sentinel-3, and 250–500 m MODIS) across different biomes in Africa, we found that spatial resolution is crucial for improving the detection of small burns but is not necessarily the only factor determining the accuracy of BA products. The use of a supervised semi-automatic algorithm, as in the S2RF product, provides the highest accuracy when compared to fire perimeters derived from very high-resolution Planet data (PlanetRF). Among the products derived with automated algorithms, FireCCISFD20 demonstrated the best performance, followed by FireCCIS311. For the coarser resolution products (FireCCIS311, FireCCI51, and MCD64), we confirmed that omission errors were greater than commission errors and negative RelB with increasing errors over larger areas. In this work, we highlighted how, besides actual errors in the BA products, metric values can also be influenced by the procedures used to compare over space and time and how fire dating can be crucial in the comparison. In this respect, BA products derived from coarse-resolution data with high observation frequency (quasi-daily) can certainly reduce bias due to temporal reporting accuracy. This study introduces Planet imagery (3 m resolution) as a high-resolution reference dataset for a detailed assessment of BA products, including those products generated from Sentinel-2 data; the results show that the accuracy metrics obtained using Sentinel-2 data are very close to those obtained using very high-resolution Planet imagery, supporting the use of Sentinel-2 as a reliable and cost-effective tool for validating both coarse- and medium-resolution BA products at from regional to global scales.

Supplementary Materials

The following supporting information can be downloaded at: https://www.mdpi.com/article/10.3390/fire8040126/s1. Figure S1: ‘Fire perimeters from Planet images for the five sites; colors represent the date of the post-fire image’, Figure S2: ‘The region identified as commission error (a) for site 1B and the Planet (b) and Sentinel-2 (c) images acquired on 17 January 2019; MODIS active fires clearly show that this area was burned in the days preceding 17 January 2019 thus not being detected by the change detection algorithm applied to Planet multi-temporal dataset’. Table S1: ‘The confusion matrix: nij expresses the number of pixels of agreements (diagonal cells) or disagreements (off diagonal cells) between the BA product and the reference (PlanetRF and S2RF for the small-area and tile-area respectively)’. Table S2: ‘Accuracy metrics computed from the error/confusion matrix and range of variability’. Table S3: ‘Accuracy metrics estimated for the five sites by comparing PlanetRF with S2RF and FireCCISFD20 burned area products over the small-area region’. Table S4: ‘Accuracy metrics estimated for the five sites by comparing PlanetRF with FireCCI51, FireCCIS310 and MCD64 burned area products over the small-area region’ Table S5: ‘Accuracy metrics for the S2 tiles covering the five sites estimated by comparing S2RF (reference) with FireCCISFD20 and FireCCI51 burned area products’. Table S6: ‘Accuracy metrics for the S2 tiles covering the five sites estimated by comparing S2RF (reference) with FireCCIS311 and MCD64 burned area products’.

Author Contributions

Conceptualization, D.S., M.S. and P.A.B.; methodology, D.S., P.A.B. and G.S.; validation, D.S., M.S. and M.F.; formal analysis, D.S., M.S. and M.F.; resources, E.C.; data curation, M.S.; writing—original draft preparation, D.S., M.F. and P.A.B.; supervision, M.L.P.; project administration, M.L.P.; funding acquisition, E.C. All authors have read and agreed to the published version of the manuscript.

Funding

This study has been funded by the Fire_cci project (contract no 4000126706/19/I-NB), which is part of the European Space Agency’s Climate Change Initiative (CCI). M.F. been supported by the Grant JDC2022-048710-I funded by MCIN/AEI/ 10.13039/501100011033 and by the European Union NextGenerationEU/PRTR.

Data Availability Statement

The data that support the findings of this study are available from the corresponding author, [D.S.], upon reasonable request.

Acknowledgments

The authors would like to thank Martina Pasturensi, who contributed to the analysis of Planet data during her thesis work carried out at the Politecnico of Milan, Italy. We thank the Planet Team for the provision of the images through the Education and Research Program (Image © 2019 Planet Labs PBC). We finally acknowledge the fundamental revision work performed by all reviewers who significantly contributed to improving our manuscript.

Conflicts of Interest

The authors declare no conflicts of interest.

References

  1. Chuvieco, E.; Mouillot, F.; van der Werf, G.R.; San Miguel, J.; Tanase, M.; Koutsias, N.; García, M.; Yebra, M.; Padilla, M.; Gitas, I.; et al. Historical Background and Current Developments for Mapping Burned Area from Satellite Earth Observation. Remote Sens. Environ. 2019, 225, 45–64. [Google Scholar] [CrossRef]
  2. Hawbaker, T.J.; Vanderhoof, M.K.; Schmidt, G.L.; Beal, Y.-J.; Picotte, J.J.; Takacs, J.D.; Falgout, J.T.; Dwyer, J.L. The Landsat Burned Area algorithm and products for the conterminous United States. Remote Sens. Environ. 2020, 244, 111801. [Google Scholar] [CrossRef]
  3. Aguilera, R.; Corringham, T.; Gershunov, A.; Benmarhnia, T. Wildfire smoke impacts respiratory health more than fine particles from other sources: Observational evidence from Southern California. Nat. Commun. 2021, 12, 1493. [Google Scholar] [CrossRef]
  4. Fernández-García, V.; Marcos, E.; Huerta, S.; Calvo, L. Soil-vegetation relationships in Mediterranean forests after fire. For. Ecosyst. 2021, 8, 18. [Google Scholar] [CrossRef]
  5. Hislop, S.; Haywood, A.; Jones, S.; Soto-Berelov, M.; Skidmore, A.; Nguyen, T.H. A satellite data driven approach to monitoring and reporting fire disturbance and recovery across boreal and temperate forests. Int. J. Appl. Earth Obs. Geoinf. 2020, 87, 102034. [Google Scholar] [CrossRef]
  6. Kennedy, R.E.; Andréfouët, S.; Cohen, W.; Gómez, C.; Griffiths, P.; Hais, M.; Healey, S.P.; Helmer, E.H.; Hostert, P.; Lyons, M.B.; et al. Bringing an ecological view of change to Landsat-based remote sensing. Front. Ecol. Environ. 2014, 12, 339–346. [Google Scholar] [CrossRef]
  7. Hollmann, R.; Merchant, C.; Saunders, R.; Downy, C.; Buchwitz, M.; Cazenave, A.; Chuvieco, E.; Defourny, P.; de Leeuw, G.; Forsberg, R.; et al. The ESA climate change initiative: Satellite data records for essential climate variables. Bull. Am. Meteorol. Soc. 2013, 94, 1541–1552. [Google Scholar] [CrossRef]
  8. Cho, A.Y.; Si-eun, P.; Duk-jin, K.; Junwoo, K.; Chenglei, L.; Juyoung, S. Burned Area Mapping Using Unitemporal PlanetScope Imagery with a Deep Learning Based Approach. IEEE J. Sel. Top. Appl. Earth Obs. Remote Sens. 2022, 16, 242–253. [Google Scholar] [CrossRef]
  9. Giglio, L.; Schroeder, W.; Justice, C.O. The collection 6 MODIS active fire detection algorithm and fire products. Remote Sens. Environ. 2016, 178, 31–41. [Google Scholar] [CrossRef]
  10. Giglio, L.; Boschetti, L.; Roy, D.; Humber, M.; Justice, C.O. The Collection 6 MODIS burned area mapping algorithm and product. Remote Sens. Environ. 2018, 217, 72–85. [Google Scholar] [CrossRef]
  11. Lizundia-Loiola, J.; Otón, G.; Ramo, R.; Chuvieco, E. A spatio-temporal active-fire clustering approach for global burned area mapping at 250 m from MODIS data. Remote Sens. Environ. 2020, 236, 111493. [Google Scholar] [CrossRef]
  12. Chuvieco, E.; Roteta, E.; Sali, M.; Stroppiana, D.; Boettcher, M.; Kirches, G.; Storm, T.; Khairoun, A.; Pettinari, M.L.; Franquesa, M.; et al. Building a small fire database for Sub-Saharan Africa from Sentinel-2 high-resolution images. Sci. Total Environ. 2022, 845, 157139. [Google Scholar] [CrossRef] [PubMed]
  13. Roteta, E.; Bastarrika, A.-; Padilla, M.; Storm, T.; Chuvieco, E. Development of a Sentinel-2 burned area algorithm: Generation of a small fire database for sub-Saharan Africa. Remote Sens. Environ. 2019, 222, 1–17. [Google Scholar] [CrossRef]
  14. Sali, M.; Piaser, E.; Boschetti, M.; Brivio, P.A.; Sona, G.; Bordogna, G.; Stroppiana, D. A Burned Area Mapping Algorithm for Sentinel-2 Data Based on Approximate Reasoning and Region Growing. Remote Sens. 2021, 13, 2214. [Google Scholar] [CrossRef]
  15. Tanase, M.A.; Belenguer-Plomer, M.A.; Roteta, E.; Bastarrika, A.; Wheeler, J.; Fernández-Carrillo, Á.; Tansey, K.; Wiedemann, W.; Navratil, P.; Lohberger, S. Burned Area Detection and Mapping: Intercomparison of Sentinel-1 and Sentinel-2 Based Algorithms over Tropical Africa. Remote Sens. 2020, 12, 334. [Google Scholar] [CrossRef]
  16. Chu, T.; Guo, X. Remote Sensing Techniques in Monitoring Post-Fire Effects and Patterns of Forest Recovery in Boreal Forest Regions: A Review. Remote Sens. 2013, 6, 470–520. [Google Scholar] [CrossRef]
  17. Valencia, G.M.; Anaya, J.A.; Velásquez, É.A.; Ramo, R.; Caro-Lopera, F.J. About Validation-Comparison of Burned Area Products. Remote Sens. 2020, 12, 3972. [Google Scholar] [CrossRef]
  18. Boschetti, L.; Roy, D.P.; Giglio, L.; Huang, H.; Zubkova, M.; Humber, M.L. Global validation of the collection 6 MODIS burned area product. Remote Sens. Environ. 2019, 235, 111490. [Google Scholar] [CrossRef]
  19. Franquesa, M.; Lizundia-Loiola, J.; Stehman, S.V.; Chuvieco, E. Using long temporal reference units to assess the spatial accuracy of global satellite-derived burned area products. Remote Sens. Environ. 2022, 269, 112823. [Google Scholar] [CrossRef]
  20. Hall, J.V.; Argueta, F.; Giglio, L. Validation of MCD64A1 and FireCCI51 cropland burned area mapping in Ukraine. Int. J. Appl. Earth Obs. Geoinf. 2021, 102, 102443. [Google Scholar] [CrossRef]
  21. Padilla, M.; Stehman, S.V.; Ramo, R.; Corti, D.; Hantson, S.; Oliva, P.; Alonso-Canas, I.; Bradley, A.V.; Tansey, K.; Mota, B.; et al. Comparing the accuracies of remote sensing global burned area products using stratified random sampling and estimation. Remote Sens. Environ. 2015, 160, 114–121. [Google Scholar] [CrossRef]
  22. Palomino, S.; Anaya, J.A. Evaluation of the Causes of Error in the Mcd45 Burned-Area Product for the Savannas of Northern South America. Dyna Colomb. 2012, 79, 35–44. [Google Scholar]
  23. Boschetti, L.; Roy, D.P.; Justice, C.O. CEOS International Global Burned Area Satellite Product Validation Protocol, Part I—Production and Standardization of Validation Reference Data. 2010. Available online: https://lpvs.gsfc.nasa.gov/PDF/BurnedAreaValidationProtocol.pdf (accessed on 21 March 2025).
  24. Lizundia-Loiola, J.; Franquesa, M.; Khairoun, A.; Chuvieco, E. Global burned area mapping from Sentinel-3 Synergy and VIIRS active fires. Remote Sens. Environ. 2022, 282, 113298. [Google Scholar] [CrossRef]
  25. Boschetti, L.; Roy, D.P.; Justice, C.O.; Giglio, L. Global assessment of the temporal reporting accuracy and precision of the MODIS burned area product. Int. J. Wildland Fire 2010, 19, 705–709. [Google Scholar] [CrossRef]
  26. Frazier, A.E.; Hemingway, B.L. A Technical Review of Planet Smallsat Data: Practical Considerations for Processing and Using PlanetScope Imagery. Remote Sens. 2021, 13, 3930. [Google Scholar] [CrossRef]
  27. Roy, D.P.; Frost, P.G.H.; Justice, C.O.; Landmann, T.; Le Roux, J.L.; Gumbo, K.; Makungwa, S.; Dunham, K.; Du Toit, R.; Mhwandagara, K.; et al. The Southern Africa Fire Network (SAFNet) regional burned-area product-validation protocol. Int. J. Remote Sens. 2005, 26, 4265–4292. [Google Scholar] [CrossRef]
  28. Boschetti, L.; Stehman, S.V.; Roy, D.P. A Stratified Random Sampling Design in Space and Time for Regional to Global Scale Burned Area Product Validation. Remote Sens Environ. 2016, 186, 465–478. [Google Scholar] [CrossRef]
  29. Rouse, J.W.; Haas, R.H.; Schell, J.A.; Deering, D.W. Monitoring vegetation systems in the Great Plains with ERTS. In Third Earth Resources Technology Satellite—1 Symposium; Freden, S.C., Mercanti, E.P., Becker, M., Eds.; Volume I: Technical Presentations, NASA SP-351; NASA: Washington, DC, USA, 1974; pp. 309–317. [Google Scholar]
  30. Roy, D.P.; Huang, H.; Boschetti, L.; Giglio, L.; Yan, L.; Zhang, H.H.; Li, Z. Landsat-8 and Sentinel-2 burned area mapping—A combined sensor multi-temporal change detection approach. Remote Sens. Environ. 2019, 231, 111254. [Google Scholar] [CrossRef]
  31. Martins, V.S.; Roy, D.P.; Huang, H.; Boschetti, L.; Zhang, H.K.; Yan, L. Deep learning high resolution burned area mapping by transfer learning from Landsat-8 to PlanetScope. Remote Sens Environ. 2022, 280, 113203. [Google Scholar] [CrossRef]
  32. Roteta, E.; Bastarrika, A.; Franquesa, M.; Chuvieco, E. Landsat and Sentinel-2 Based Burned Area Mapping Tools in Google Earth Engine. Remote Sens. 2021, 13, 816. [Google Scholar] [CrossRef]
  33. Stroppiana, D.; Sali, M.; Busetto, L.; Boschetti, M.; Ranghetti, L.; Franquesa, M.; Pettinari, M.L.; Chuvieco, E. Sentinel-2 sampling design and reference fire perimeters to assess accuracy of Burned Area products over Sub-Saharan Africa for the year 2019, ISPRS J. Photogramm. Remote Sens. 2022, 191, 223–234. [Google Scholar] [CrossRef]
  34. Key, C.H.; Benson, N.C. Measuring and remote sensing of burn severity: The CBI and NBR. In Proceedings of the Joint Fire Science Conference and Workshop, Volume II, Boise, ID, USA, 15–17 June 1999; Neuenschwander, L.F., Ryan, K.C., Eds.; University of Idaho and International Association of Wildland Fire: Boise, ID, USA, 1999; p. 284. [Google Scholar]
  35. Key, C.H.; Benson, N.C. Landscape Assessment (LA) Sampling and Analysis Methods; General Technical Report RMRS-GTR-164-CD; USDA Forest Service Rocky Mountain Research Station: Ogden, UT, USA, 2006.
  36. Schroeder, W.; Oliva, P.; Giglio, L.; Csiszar, I.A. The new VIIRS 375 m active fire detection data product: Algorithm description and initial assessment. Remote Sens. Environ. 2014, 143, 85–96. [Google Scholar] [CrossRef]
  37. Dice, L.R. Measures of the amount of ecologic association between species. Ecology 1945, 26, 297–302. [Google Scholar] [CrossRef]
  38. Congalton, R.G. Accuracy assessment and validation of remotely sensed and other spatial information. Int. J. Wildland Fire 2001, 10, 321–328. [Google Scholar] [CrossRef]
  39. Franquesa, M.; Stehman, S.V.; Chuvieco, E. Assessment and characterization of sources of error impacting the accuracy of global burned area products. Remote Sens. Environ. 2022, 280, 113214. [Google Scholar] [CrossRef]
  40. Humber, M.; Boschetti, L.; Giglio, L. Assessing the Shape Accuracy of Coarse Resolution Burned Area Identifications. IEEE Trans. Geosci. Remote 2020, 58, 1516–1526. [Google Scholar] [CrossRef]
  41. Stehman, S.V. Statistical rigor and practical utility in thematic map accuracy assessment. Photogramm. Eng. Remote Sens. 2001, 67, 727–734. [Google Scholar]
  42. Roy, D.P.; De Lemos, H.; Huang, H.; Giglio, L.; Houborg, R.; Miura, T. Multi-resolution monitoring of the 2023 Maui wildfires, implications and needs for satellite-based wildfire disaster monitoring. Sci. Remote Sens. 2024, 10, 100142. [Google Scholar] [CrossRef]
  43. Sismanis, M.; Chadoulis, R.-T.; Manakos, I.; Drosou, A. An Unsupervised Burned Area Mapping Approach Using Sentinel-2 Images. Land 2023, 12, 379. [Google Scholar] [CrossRef]
  44. Campagnolo, M.L.; Libonati, R.; Rodrigues, J.A.; Pereira, J.M.C. A comprehensive characterization of MODIS daily burned area mapping accuracy across fire sizes in tropical savannas. Remote Sens. Environ. 2021, 252, 112115. [Google Scholar] [CrossRef]
  45. Qiu, S.; Zhu, Z.; Olofsson, P.; Woodcock, C.E.; Jin, S. Evaluation of Landsat image compositing algorithms. Remote Sens. Environ. 2023, 285, 113375. [Google Scholar] [CrossRef]
  46. Olofsson, P.; Foody, G.M.; Herold, M.; Stehman, S.V.; Woodcock, C.E.; Wulder, M.A. Good practices for estimating area and assessing accuracy of land change. Remote Sens. Environ. 2014, 148, 42–57. [Google Scholar] [CrossRef]
  47. Roy, D.P.; Huang, H.; Houborg, R.; Martins, V.S. A global analysis of the temporal availability of PlanetScope high spatial resolution multi-spectral imagery. Remote Sens. Environ. 2021, 264, 112586. [Google Scholar] [CrossRef]
  48. Silva, J.M.N.; Sá, A.C.L.; Pereira, J.M.C. Comparison of burned area estimates derived from SPOT-Vegetation and Landsat ETM+ data in Africa: Influence of spatial pattern and vegetation type. Remote Sens. Environ. 2005, 96, 188–201. [Google Scholar] [CrossRef]
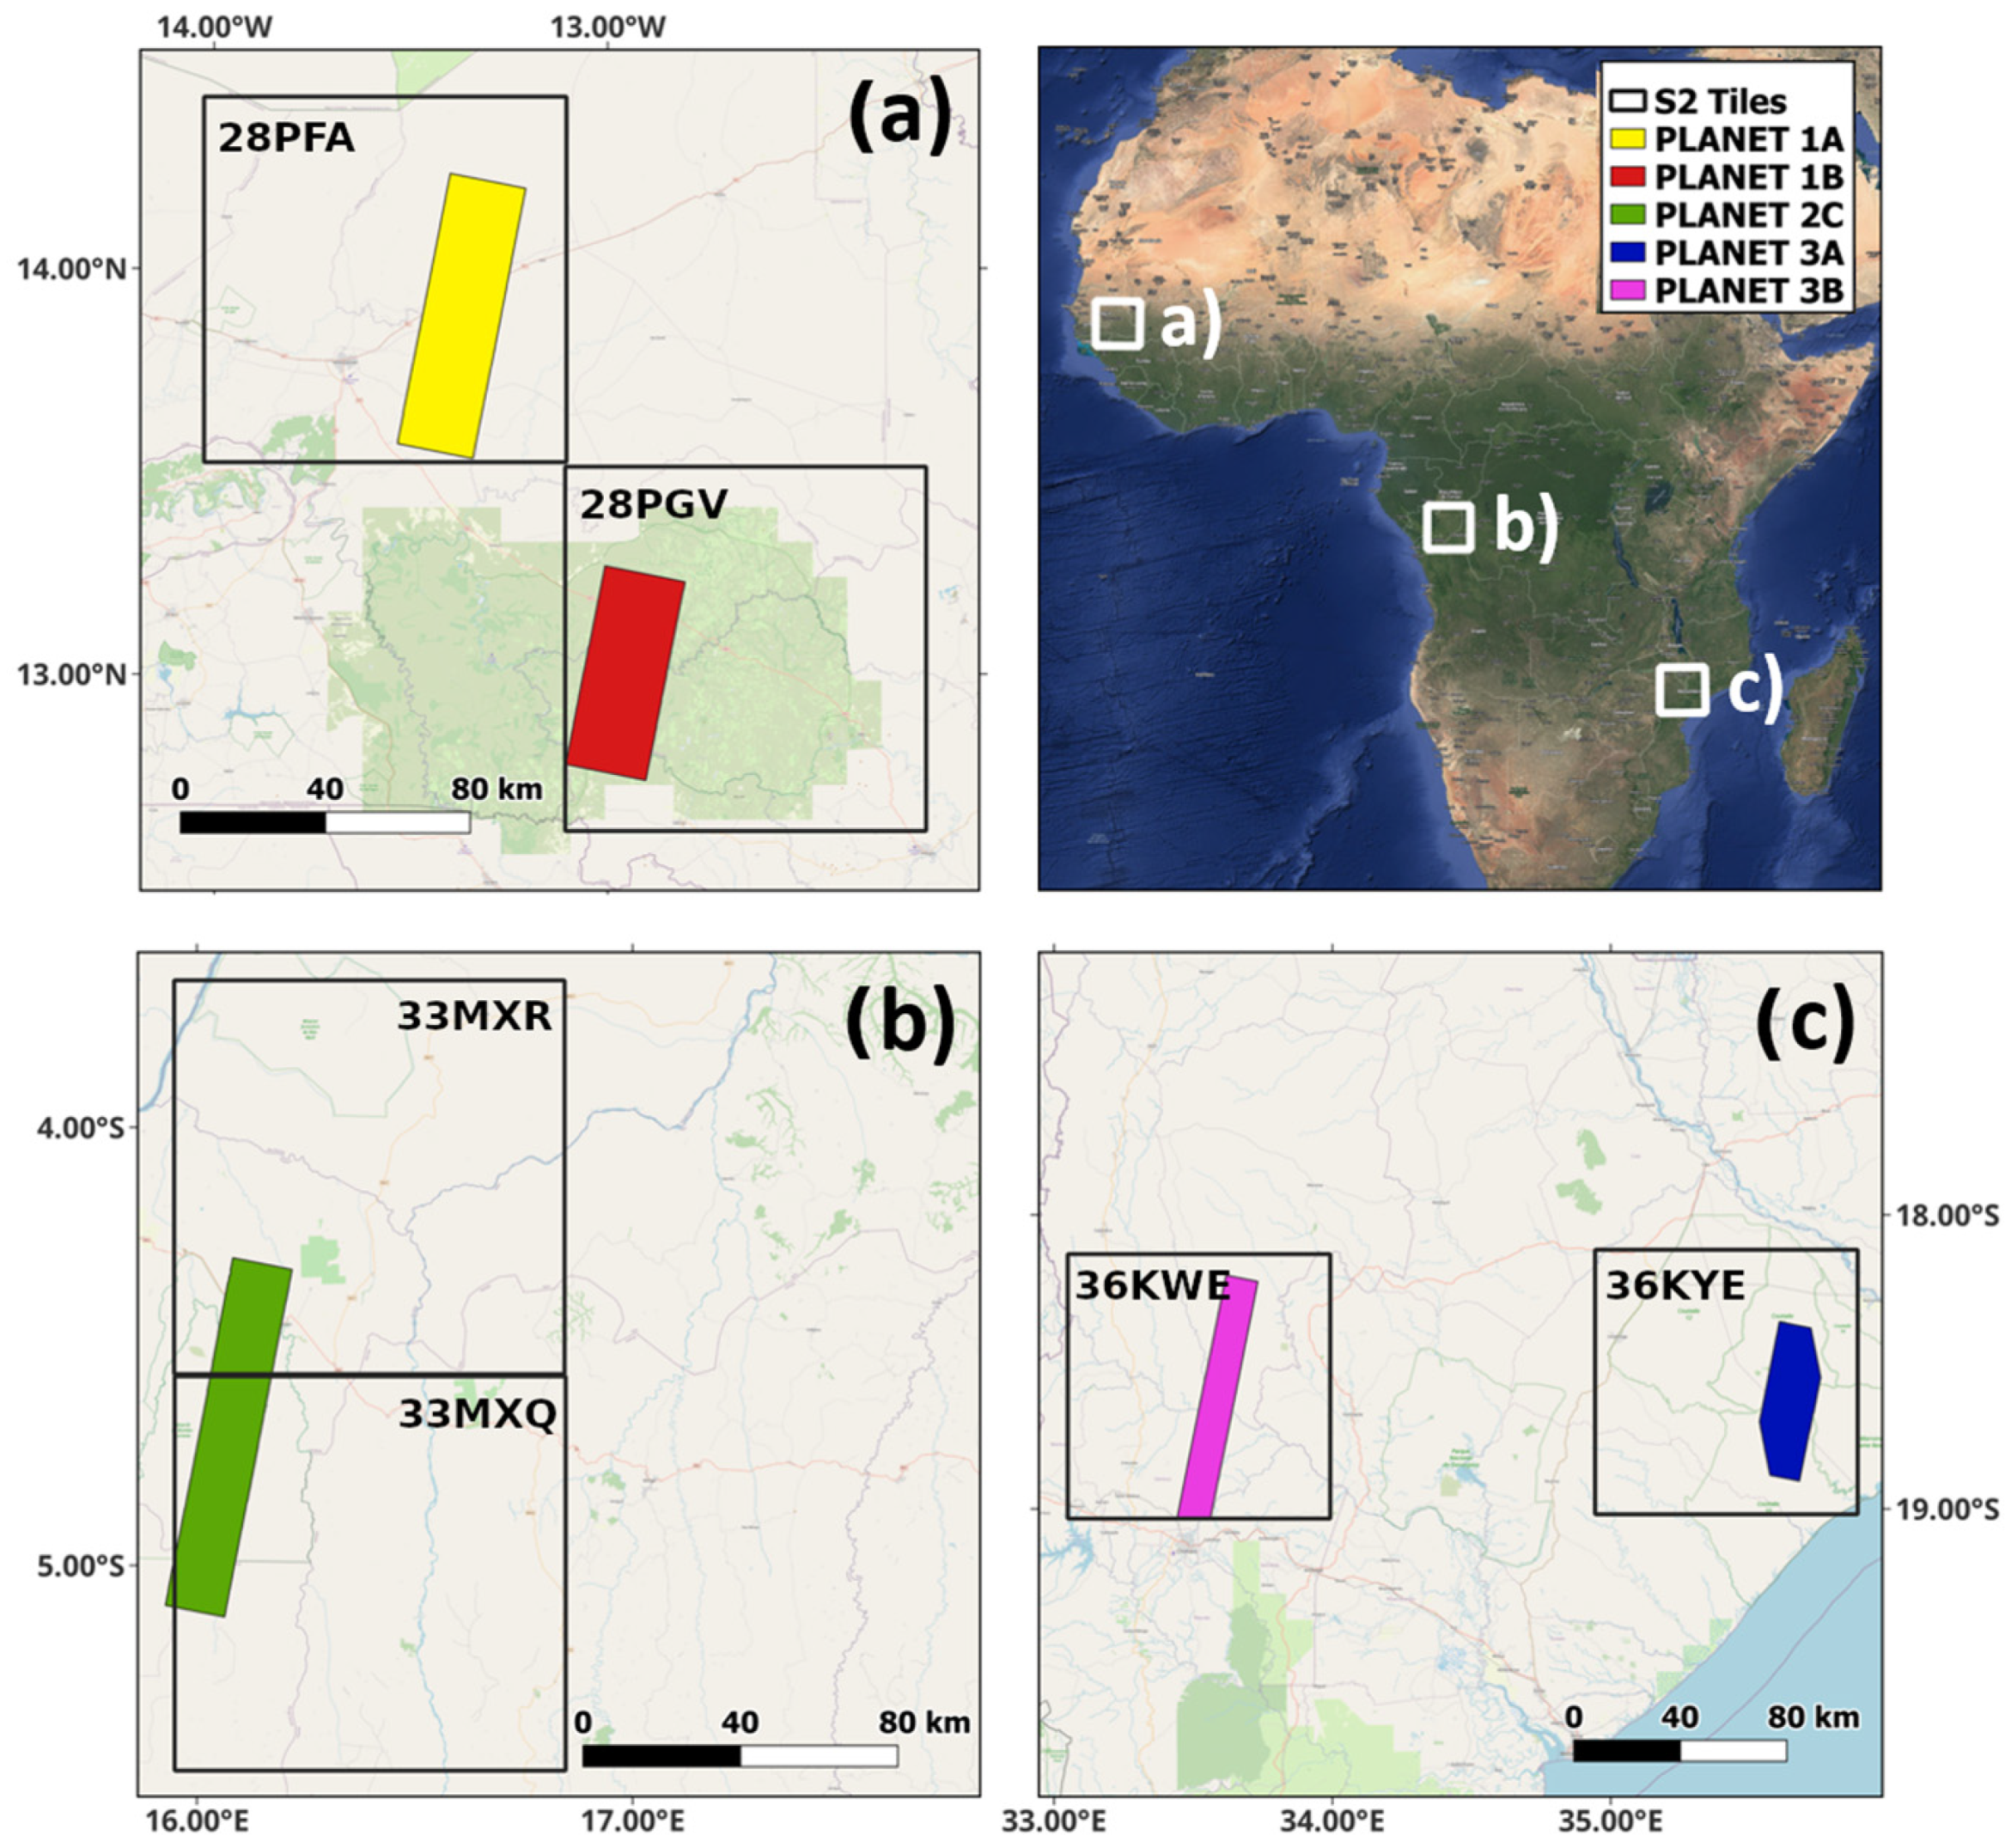
Figure 1. The location of the sites selected for the small-area (filled colored rectangle) and tile-area (black outline squares with S2 tiles names) comparison of BA products in northern Africa (a), central Africa (b), and southern Africa (c).
Fire 08 00126 g001
Figure 2. Example PlanetRF (a) and S2RF (b) burned area products for site 1B; filling colors show the detection date as outlined in the legend. The red rectangle highlights the zoom area shown in Figure 3.
Fire 08 00126 g002
Figure 3. Zoom over Planet (top) and S2 (bottom) multi-temporal acquisitions for the area A highlighted in Figure 2.
Fire 08 00126 g003
Figure 4. The Day Of the Year detection (DOY) value for the FireCCISFD20, FireCCI51, FireCCIS311, and MCD64 BA products over the S2 tiles compared to S2RF in the first column (white = unburned, grey = burned, black = masked). Each S2 tile covers an area of ~10,000 km2 and the location of the S2 tiles is shown in Figure 1.
Fire 08 00126 g004
Figure 5. Accuracy metrics for the five sites (and all together) as estimated by comparing PlanetRF (reference) with S2RF, FireCCISFD20, FireCCI51, FireCCIS311, and MCD64 burned area products.
Fire 08 00126 g005
Figure 6. Spatial agreement between PlanetRF and S2RF (top) and PlanetRF and FireCCISFD20 (bottom) for the five small-area sites: agreement on unburned area (UB, green) and burned area (BA, red); omission errors (OE, yellow) and commission errors (CE, blue). The black regions are cloud-masked areas from the S2RF product (Masked). The orange rectangle area in site 1B highlights details discussed in the text. A description of the small-area sites is given in Table 1.
Fire 08 00126 g006
Figure 7. Scatterplots of the proportion of area burned in PlanetRF (x-axis) vs. S2RF (first column) and FireCCISFD20 (second column) (y-axis) for all sites within the 1 km × 1 km grid cells. The black dotted lines are the 1:1 line (full agreement), while the grey lines are the linear regression models; all regression models are statistically significant with p < 0.001.
Fire 08 00126 g007
Figure 8. Spatial agreement between S2RF and FireCCISFD20, FireCCI51, FireCCIS311, and MCD64 BA products for the S2 tiles covering the five sites: agreement unburned area (UB, green) and burned area (BA, red), omission errors (OE, yellow) and commission errors (CE, blue). Black regions are cloud-masked areas from the S2RF product.
Fire 08 00126 g008
Figure 9. Accuracy metrics for the S2 tiles covering the five sites as estimated by comparing S2RF (reference) with FireCCISFD20, FireCCI51, FireCCIS311, and MCD64 burned area products.
Fire 08 00126 g009
Figure 10. Regression parameters for the grid analysis with variable cell size in the range 1–6 km (x-axis) for each tile-area (~10,000 km2).
Fire 08 00126 g010
Figure 11. Scatterplots for all tiles of the proportion of area burned in grid cells of 5 km × 5 km for the S2RF (x-axis) and the other products (names at the top of each panel). The grey line is the 1:1 perfect agreement and the black line is the linear regression model (equation for each product given in the bottom right box).
Fire 08 00126 g011
Table 1. Study site characteristics, Planet and S2 imageries, including the number of acquisition dates (n) and the number of scenes for Planet before spatial mosaicking (N); in the case of S2, the number of dates is coincident with the number of image tiles; for both imageries, the number of image pairs used for the classification is n − 1. The major land cover classes are extracted from the 2015 European Space Agency (ESA) Climate Change Initiative (CCI) Land Cover product (https://climate.esa.int/en/projects/land-cover/about, accessed on 21 March 2025). The percentages in brackets indicate the proportion of the major land cover types within the small-area (Planet) and tile-area (S2).
Site/TileLocation
(Country)
Land Cover
(Planet %, S2 Tile %)
Planet
Mosaic Area [km2]
(N Scenes)
Planet
Start, End
(n Dates)
S2
Start, End
(n Dates)
1A/28PFATambacounda
(Senegal)
Shrubs (47%, 46%)
Trees (24%, 20%)
1588.2 (72)14 January 2019
12 March 2019 (6)
17 January 2019
18 March 2019 (6)
1B/28PGVNiokolo-Koba (Senegal)Grass (56%, 38%)
Trees (32%, 51%)
1245.5 (33)17 January 2019
20 March 2019 (4)
17 January 2019
18 March 2019 (5)
2C/33MXQ&
33MXR
Kinshasa
(DRC)
Grass (52%, 55%)
Shrubs (36%, 16%)
Trees (7%, 27%)
1367.3 (33)13 June 2019
27 August 2019 (3)
12 June 2019
21 August 2019 (8)
3A/36KYECapenga (Mozambique)Trees (51%, 60%)
Grass (43%, 25%)
974.7 (38)30 July 2019
29 September 2019 (4)
4 August 2019
28 September 2019 (4)
3B/36KWEChimoio (Mozambique)Grass (44%, 32%)
Trees (32%, 45%)
1229.5 (43)23 July 2019
14 September 2019 (3)
23 July 2019
11 September 2019 (5)
Disclaimer/Publisher’s Note: The statements, opinions and data contained in all publications are solely those of the individual author(s) and contributor(s) and not of MDPI and/or the editor(s). MDPI and/or the editor(s) disclaim responsibility for any injury to people or property resulting from any ideas, methods, instructions or products referred to in the content.