Abstract
To investigate the propagation of explosion shock waves within a ship’s engine room, a two-story engine room of a cargo ship was selected as the research object. The BlastFOAM solver in OpenFOAM-9 software was utilized to conduct numerical simulations of the explosion dynamics in the engine room. The results demonstrate that the explosion impact force escalates with the quantity of explosives. Following a liquefied natural gas (LNG) explosion, the shock waves exerted on the ventilation duct and control room are significantly stronger in terms of maximum pressure and intensity compared with those generated by a naphtha explosion. Comprehensive analyses of shock wave pressure distribution, structural damage, and energy absorption reveal that the centralized control room sustains the most severe damage from shock waves, while the ventilation ducts are also significantly impacted. The mechanical equipment absorbs the majority of the shock wave impact while reflecting a minor portion, leading to the intersection of direct and reflected waves. This study provides valuable insights for enhancing the explosion resistance of ship engine rooms, optimizing equipment layout within cabins, and improving the structural resilience of cabin designs.
1. Introduction
With the expansion of global trade, the increase in the size of ships and the advancement of technology, the design and construction of engine rooms of large ships face increasingly complex challenges, among which safety is the primary concern [1]. According to the International Maritime Organization (2019), between 2000 and 2017, 270 out of 1400 reported maritime incidents were attributed to fires and explosions, representing 19.2% of the total incidents [2]. Explosions in ship engine rooms are particularly catastrophic, posing serious risks to crew safety, causing severe environmental pollution, and resulting in substantial economic losses. Most explosions within ships occur in cargo holds and engine rooms. In cargo holds, explosions are frequently caused by the transportation of flammable materials, explosives, improper handling by personnel, and the aging of hull structures [3]. In engine rooms, factors such as naphtha leaks, heat source ignition, and engine malfunctions can lead to explosions [4].
With the advancement of numerical simulation technology and increased computing power, numerical simulations of ship engine room explosions have become a critical tool for investigating the causes of such accidents. These simulations contribute to optimizing the internal design of engine rooms and enhancing the safety of ship personnel. The application of numerical simulation to engine room explosion scenarios enables a deeper understanding of the impact of explosions on the structural systems of ships [5]. Early investigations predominantly simplified structures subjected to explosion loading into basic configurations, such as beams and plates, to analyze their nonlinear large deformation behavior [6]. Weibull’s research demonstrated that the quasi-static pressure peak has negligible influence on the pressure relief zone but is primarily a function of the charge-to-container volume ratio [7]. Liu et al. developed a weighted essentially non-oscillatory (WENO) scheme [8]. Later, Shu et al. developed the WENO format and expanded its application [9,10]. To reduce the amount of explosives required, Stewart designed a conical shock tube to simulate large-scale free-field explosions [11]. Liu et al. employed a nonlinear coupled numerical simulation approach to develop a fluid–structure interaction model capable of simulating the interaction between fluids and solids, enabling research on the dynamic response of ship structures to explosions [12]. Shin utilized a finite element-based ship–fluid coupling model to conduct ship explosion impact analysis [13]. To mitigate the occurrence of fire and explosion incidents, tankers transporting hazardous materials should implement enhanced precautionary and preventive measures during loading operations, maintenance, and routine activities [14]. Furthermore, the role of numerical simulation in the analysis and prevention of accidents is indispensable. Through numerical simulations of engine room explosions, various explosion scenarios can be replicated, the impact of explosions on ship structures can be analyzed, safety risks can be predicted, and relevant preventive measures can be implemented [15]. Chen employed the finite volume method, based on the Navier–Stokes equations for explosive detonation and the k-omega SST turbulence model, to analyze the flow field characteristics of a detonation simulator using three approaches: detonation-driven, compression-driven, and combined driving methods [16]. The results demonstrated that the proposed numerical approach aligns with experimental findings and accurately simulates the flow field characteristics of the explosion simulator under both detonation-driven and compression-driven schemes. In a related study, Kong investigated the impact of water mist on explosion load reduction and structural dynamic response through experimental research [17].
Research on the potential risks associated with liquefied natural gas (LNG) transportation and storage necessitates extensive numerical simulations and experimental investigations [18]. Nubli constructed an LNG fuel ship model, simulated a vapor cloud explosion overpressure test, and determined the design accidental load resulting from vapor cloud explosions [19]. Li analyzed the fire and explosion risks of LNG ships from different perspectives, providing a theoretical basis and practical significance for subsequent simulations [20]. Nubli discussed and highlighted the application of CFD in LNG release cases by analyzing actual fire and explosion cases [21]. Zheng validated a 3D CFD model with chemical reactions and simulated possible gas diffusion and explosion in a ventilated cabin. The results showed that when a given minor leak occurred in the fuel pipe, the methane accumulated in the cabin would not exceed 1 kg [22]. Nubli used ExSim CFD to simulate gas explosions and performed grid convergence and software validation. Finally, the overpressure and gas explosion frequency in the scenario were used to determine the over frequency map. It is used to predict gas explosions on LNG fuel ships [23]. Sun used CFD methods to quantitatively and qualitatively study the deflagration characteristics of premixed LNG vapor–air mixtures with different mixing ratios. The results showed that the one with a volume fraction of 10.4% and near the stoichiometric mixing ratio had the highest flame propagation speed and explosion risk [24].
In summary, numerical simulations of engine room explosions play a critical role in advancing ship engineering research [25,26,27,28,29,30]. Domestic and international scholars have conducted extensive research on ship engine room explosions; however, certain aspects remain to be further improved. The innovations and objectives of this study are highlighted in the following points: First, a high-precision numerical model for simulating explosion shock wave propagation was established using the BlastFOAM solver and actual ship engine room parameters, offering a novel approach for complex explosion dynamics analysis under real working conditions. Second, the specific energy per unit mass of trinitrotoluene (TNT) and the TNT equivalent method were employed to standardize the energy of different explosives, enabling a comprehensive analysis of the effects of explosion scale and material properties on shock wave propagation and structural stress distribution. This led to the development of a clear quantitative evaluation framework. Third, the absorption and reflection of shock waves by mechanical equipment during explosions were examined, identifying the vulnerability of key areas such as centralized control rooms and ventilation ducts. This analysis provides a theoretical foundation for optimizing equipment layout and explosion-proof design. Finally, the study quantified the superposition effect of shock waves under the coupling of multiple mechanical structures and the significant changes in temperature, velocity, and pressure caused by the interaction between explosion waves and reflected waves. This clarified the formation mechanism of secondary damage and offered insights for mitigating structural damage.
This study aims to conduct a numerical investigation of explosions in a ship’s engine room using the BlastFOAM solver within the OpenFOAM-9 software. The structure of this paper is organized as follows: Section 1 presents a literature review, summarizing previous studies on numerical simulations of ship engine rooms and emphasizing the key contributions of this research. Section 2 describes the theoretical framework and the complete process of multi-material explosion simulations, and the applicability of BlastFOAM for simulating engine room-scale explosions is validated through the explosion data were compared with those of the experimental data by reproducing the explosion experiment in a confined space. Section 3 analyzes the propagation characteristics of blast waves, temperature distribution, pressure shock response, and their influencing factors in cabin explosions. Section 4 and Section 5 present the discussion and conclusions of this study and outline future research directions and shortcomings.
2. Materials and Methods
2.1. Theory
BlastFOAM is an open-source and explicit solver developed for simulating explosions within the OpenFOAM framework. It incorporates a simplified combustion model to replicate the detonation of high-energy materials and supports multi-point and multi-material explosion simulations. Furthermore, BlastFOAM includes an enhanced implementation of the JWL equation of state, which is suitable for force modeling [31].
2.1.1. Governing Equations
By utilizing limited explosive materials and well-defined parameters, we employed a five-equation model to simulate the behavior of highly compressible materials, each governed by a distinct equation of state that represents the vector of conserved variables, volume fraction, mass, momentum, and energy; is the flux associated with the respective conserved variable, and denotes the source term vector [32].
where represents the mixture density, denotes the mixture velocity vector, is the total pressure, and and signify the density and volume fraction of each phase. In the case of using only two phases, we define:
The five-equation model is capable of tracking phase masses and volume fractions, but it assumes a mixture-averaged velocity, energy, and pressure, thereby reducing the number of evolution equations that need to be solved. The pressure is defined using a specified equation of state (EOS), where the internal energy, density, and volume fraction of the mixture are utilized to calculate the total pressure (see Equation (5)) [33]. The Mie–Gruneisen type equations of state (EOSs) are expressed as follows:
Equation (5) describes how the pressure of the material in the element is determined by combining the heat contribution and the cold pressure correction term for a given density . The density unit is kg/m3, the speed of sound and velocity mentioned are in m/s, and the internal energy and are in J/kg, which means the energy per unit mass.
2.1.2. Equation of States
A small quantity of TNT is selected as the explosive material to control the explosion range and detonation point, thereby enhancing the accuracy of simulating real-world scenarios. The mixture pressure in Mie–Gruneisen type EOS is defined as follows:
Equations (6) and (7) provide a means to calculate the pressure of a system based on several key parameters and variables. Here, denotes the density of the system, represents its internal energy, signifies the proportion or concentration of the i-th component, indicates the volume fraction of the i-th component, and stands for the pressure exerted by the i-th component. is the model coefficient, which refers to the Grüneisen parameter of the material under the reference state. Equation (7) uses this parameter to characterize the thermodynamic response of matter. This equation shows how the total pressure of the system can be determined by considering its internal energy and the pressure contribution of each component, weighted by their respective ratios and volume fractions.
The speed of sound within a given phase is given by:
where is a correction term associated with the equation of state, and the names of the phases correspond to the required initial fields. If only two phases are specified, the relationship is used and only one volume fraction is passed; if multiple phases are specified, all volume fractions must be passed. The volume fraction is a dimensionless quantity, which indicates the proportion of each phase in the total. The weight factor is dimensionless, which is used to reflect the contribution of each component to the properties of the mixture. Because is a dimensionless parameter, is also dimensionless.
In the simulation, the maximum value of the internal energy is constrained to be less than 0, and its initial value is determined by the selected equation of state, initial pressure, and density. Because the boundary conditions require the storage of internal energy, the “e” field is initialized to zero in order to initialize the internal energy field of the equation of state. Explosives use the Jones–Wilkins–Lee (JWL) equation of state, which is often used to define energetic materials, and its pressure expression is:
where ,
For Equation (15), the exponential factors and given describe the attenuation of the correction term with density change, where , , , are all material characteristic parameters with no parameter units; is determined according to the after-burn model. The exploding air is treated as an ideal gas, given by the ideal gas formula. For an ideal gas, the pressure is defined as:
The functions needed for Equation (16) are
In this study, all combustion gases are modeled as ideal gases.
2.2. Model Validation
In order to evaluate the applicability of the BlastFOAM solver in closed-space explosion experiments and the equivalence of the explosion effects, this section reproduces the experiments previously conducted by Edri [34] through numerical simulations using the BlastFOAM solver and compares the explosion effects with the explosion data.
In the experimental configuration of the reference [34], the explosion is located at the bottom center of the geometric space, 1.2 m from the edge. The explosive material is TNT with a mass of 4 kg. The basic configuration of this numerical simulation is exactly the same as that of the experiment in the reference [34], whose geometry and measurement point locations are shown in Figure 1a. Using the room geometry data, the OpenFOAM mesh is generated, as shown in Figure 1b. In order to minimize the influence of uncontrollable variables such as model material, the model size, explosion location, and type and quantity of explosives are precisely matched to the conditions of the previous experiment.
Figure 1.
The geometry and the mesh of the validation: (a) the geometry, (b) the mesh.
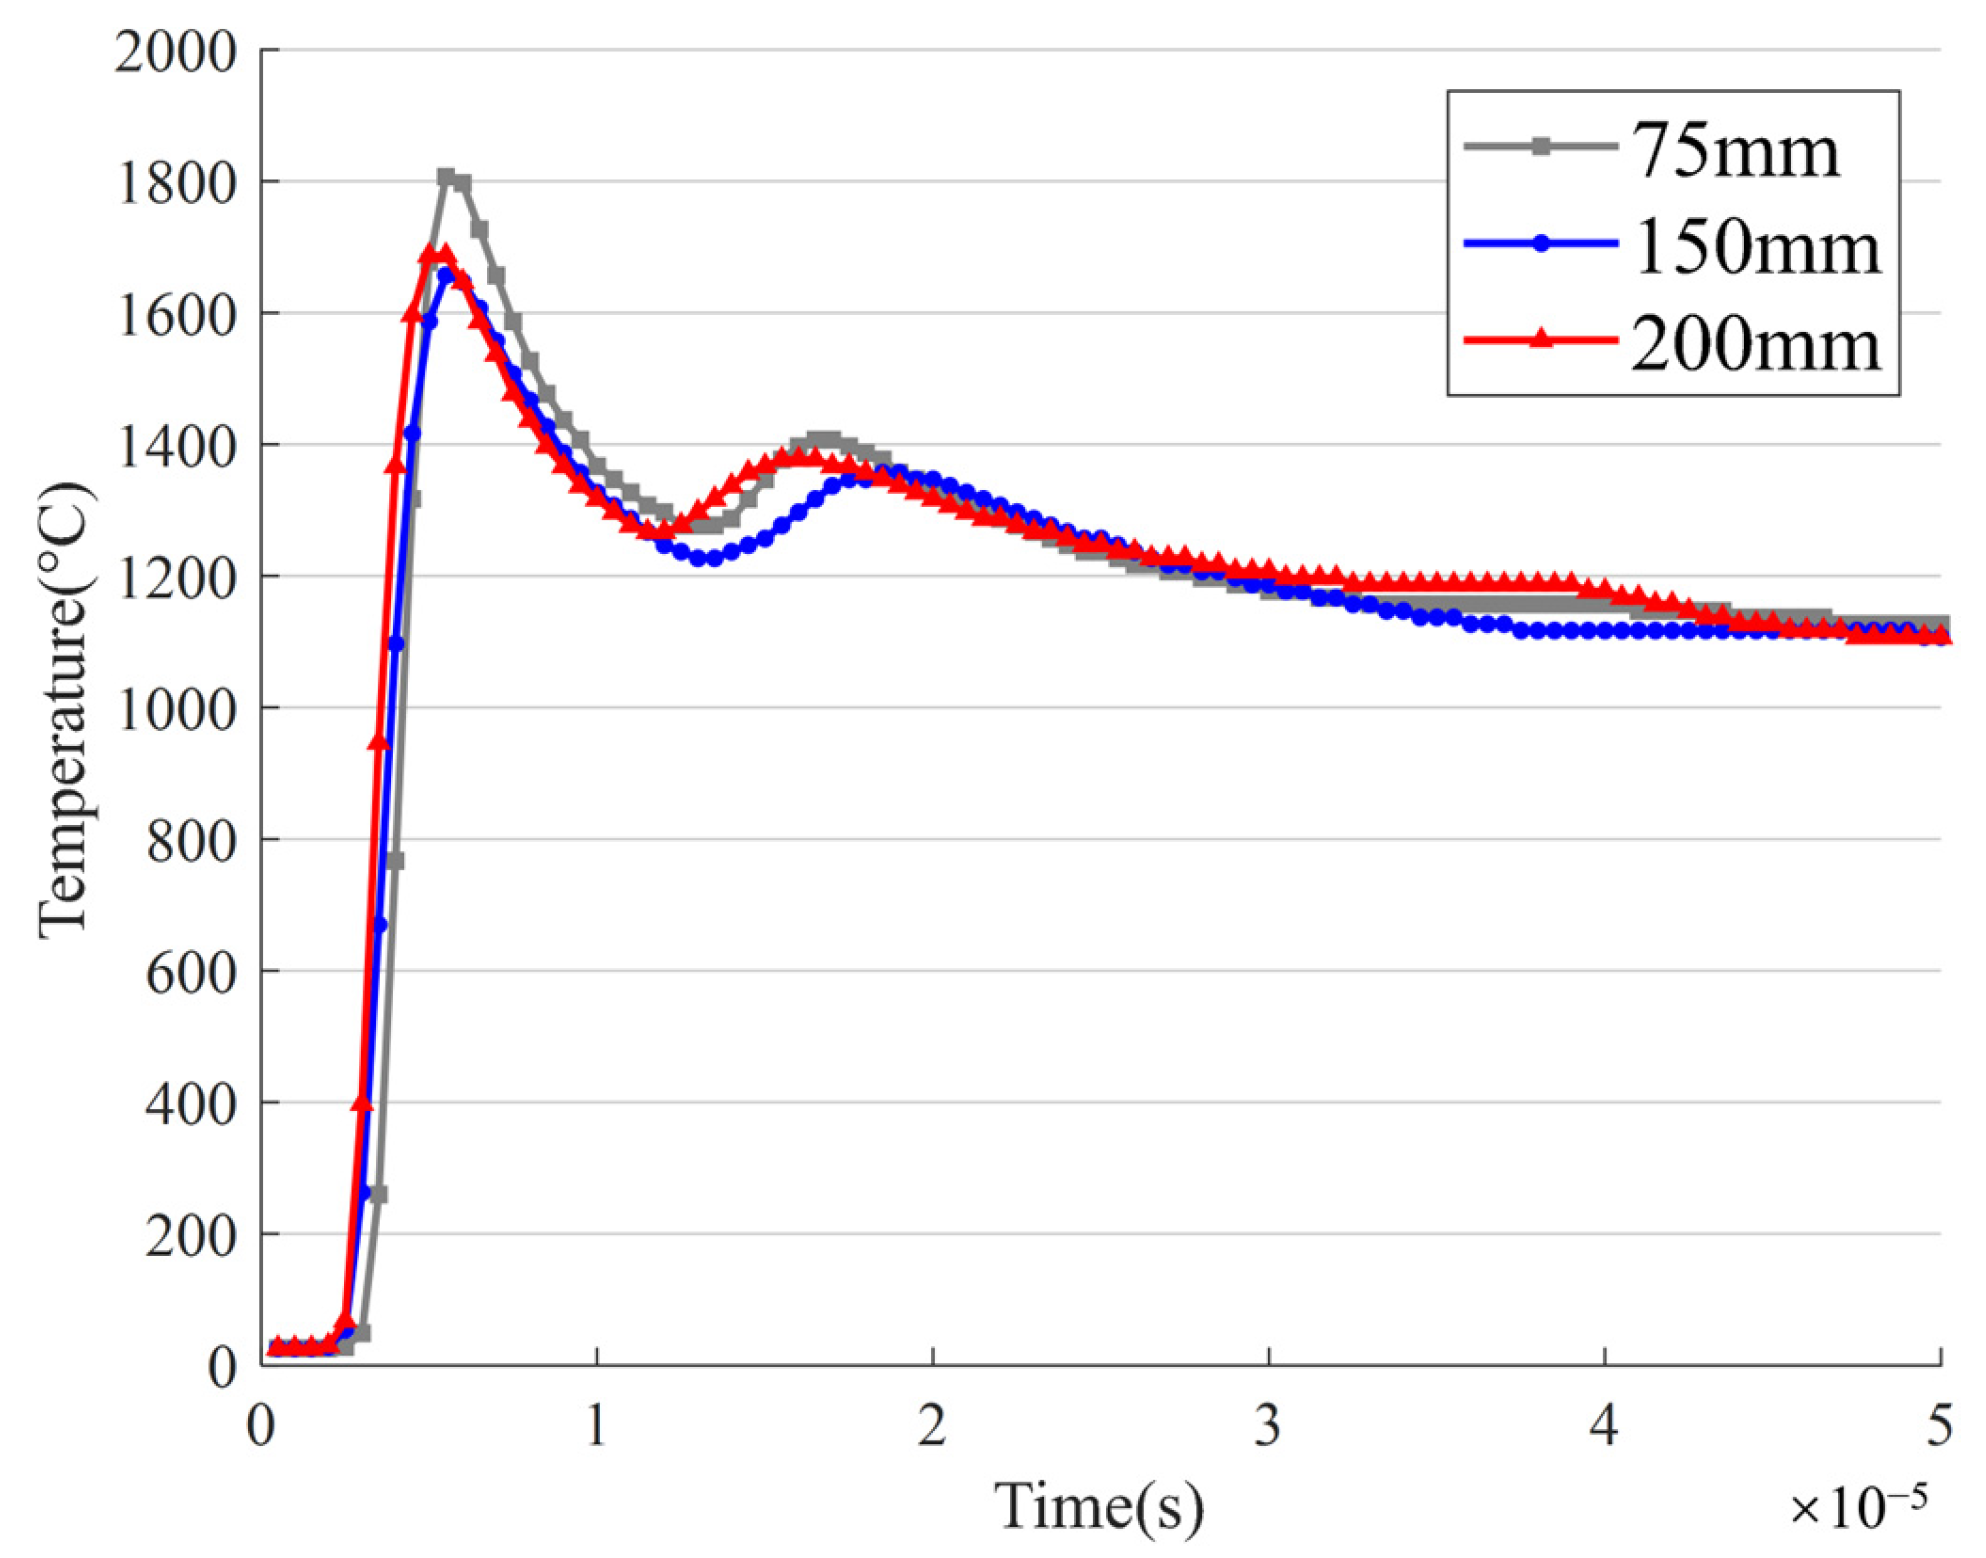
In order to eliminate the errors caused by the grid resolution, simulations were conducted using three mesh sizes: 75 mm, 150 mm, and 200 mm. Figure 2 presents the temperature profiles at measurement points for each resolution. The results indicate that the 75 mm and 150 mm grids produce comparable temperature curves, whereas the 200 mm grid yields more divergent outcomes. Balancing computational efficiency with accuracy, a 150 mm grid resolution was selected for subsequent simulations.
Figure 2.
Mesh sensitivity analysis.
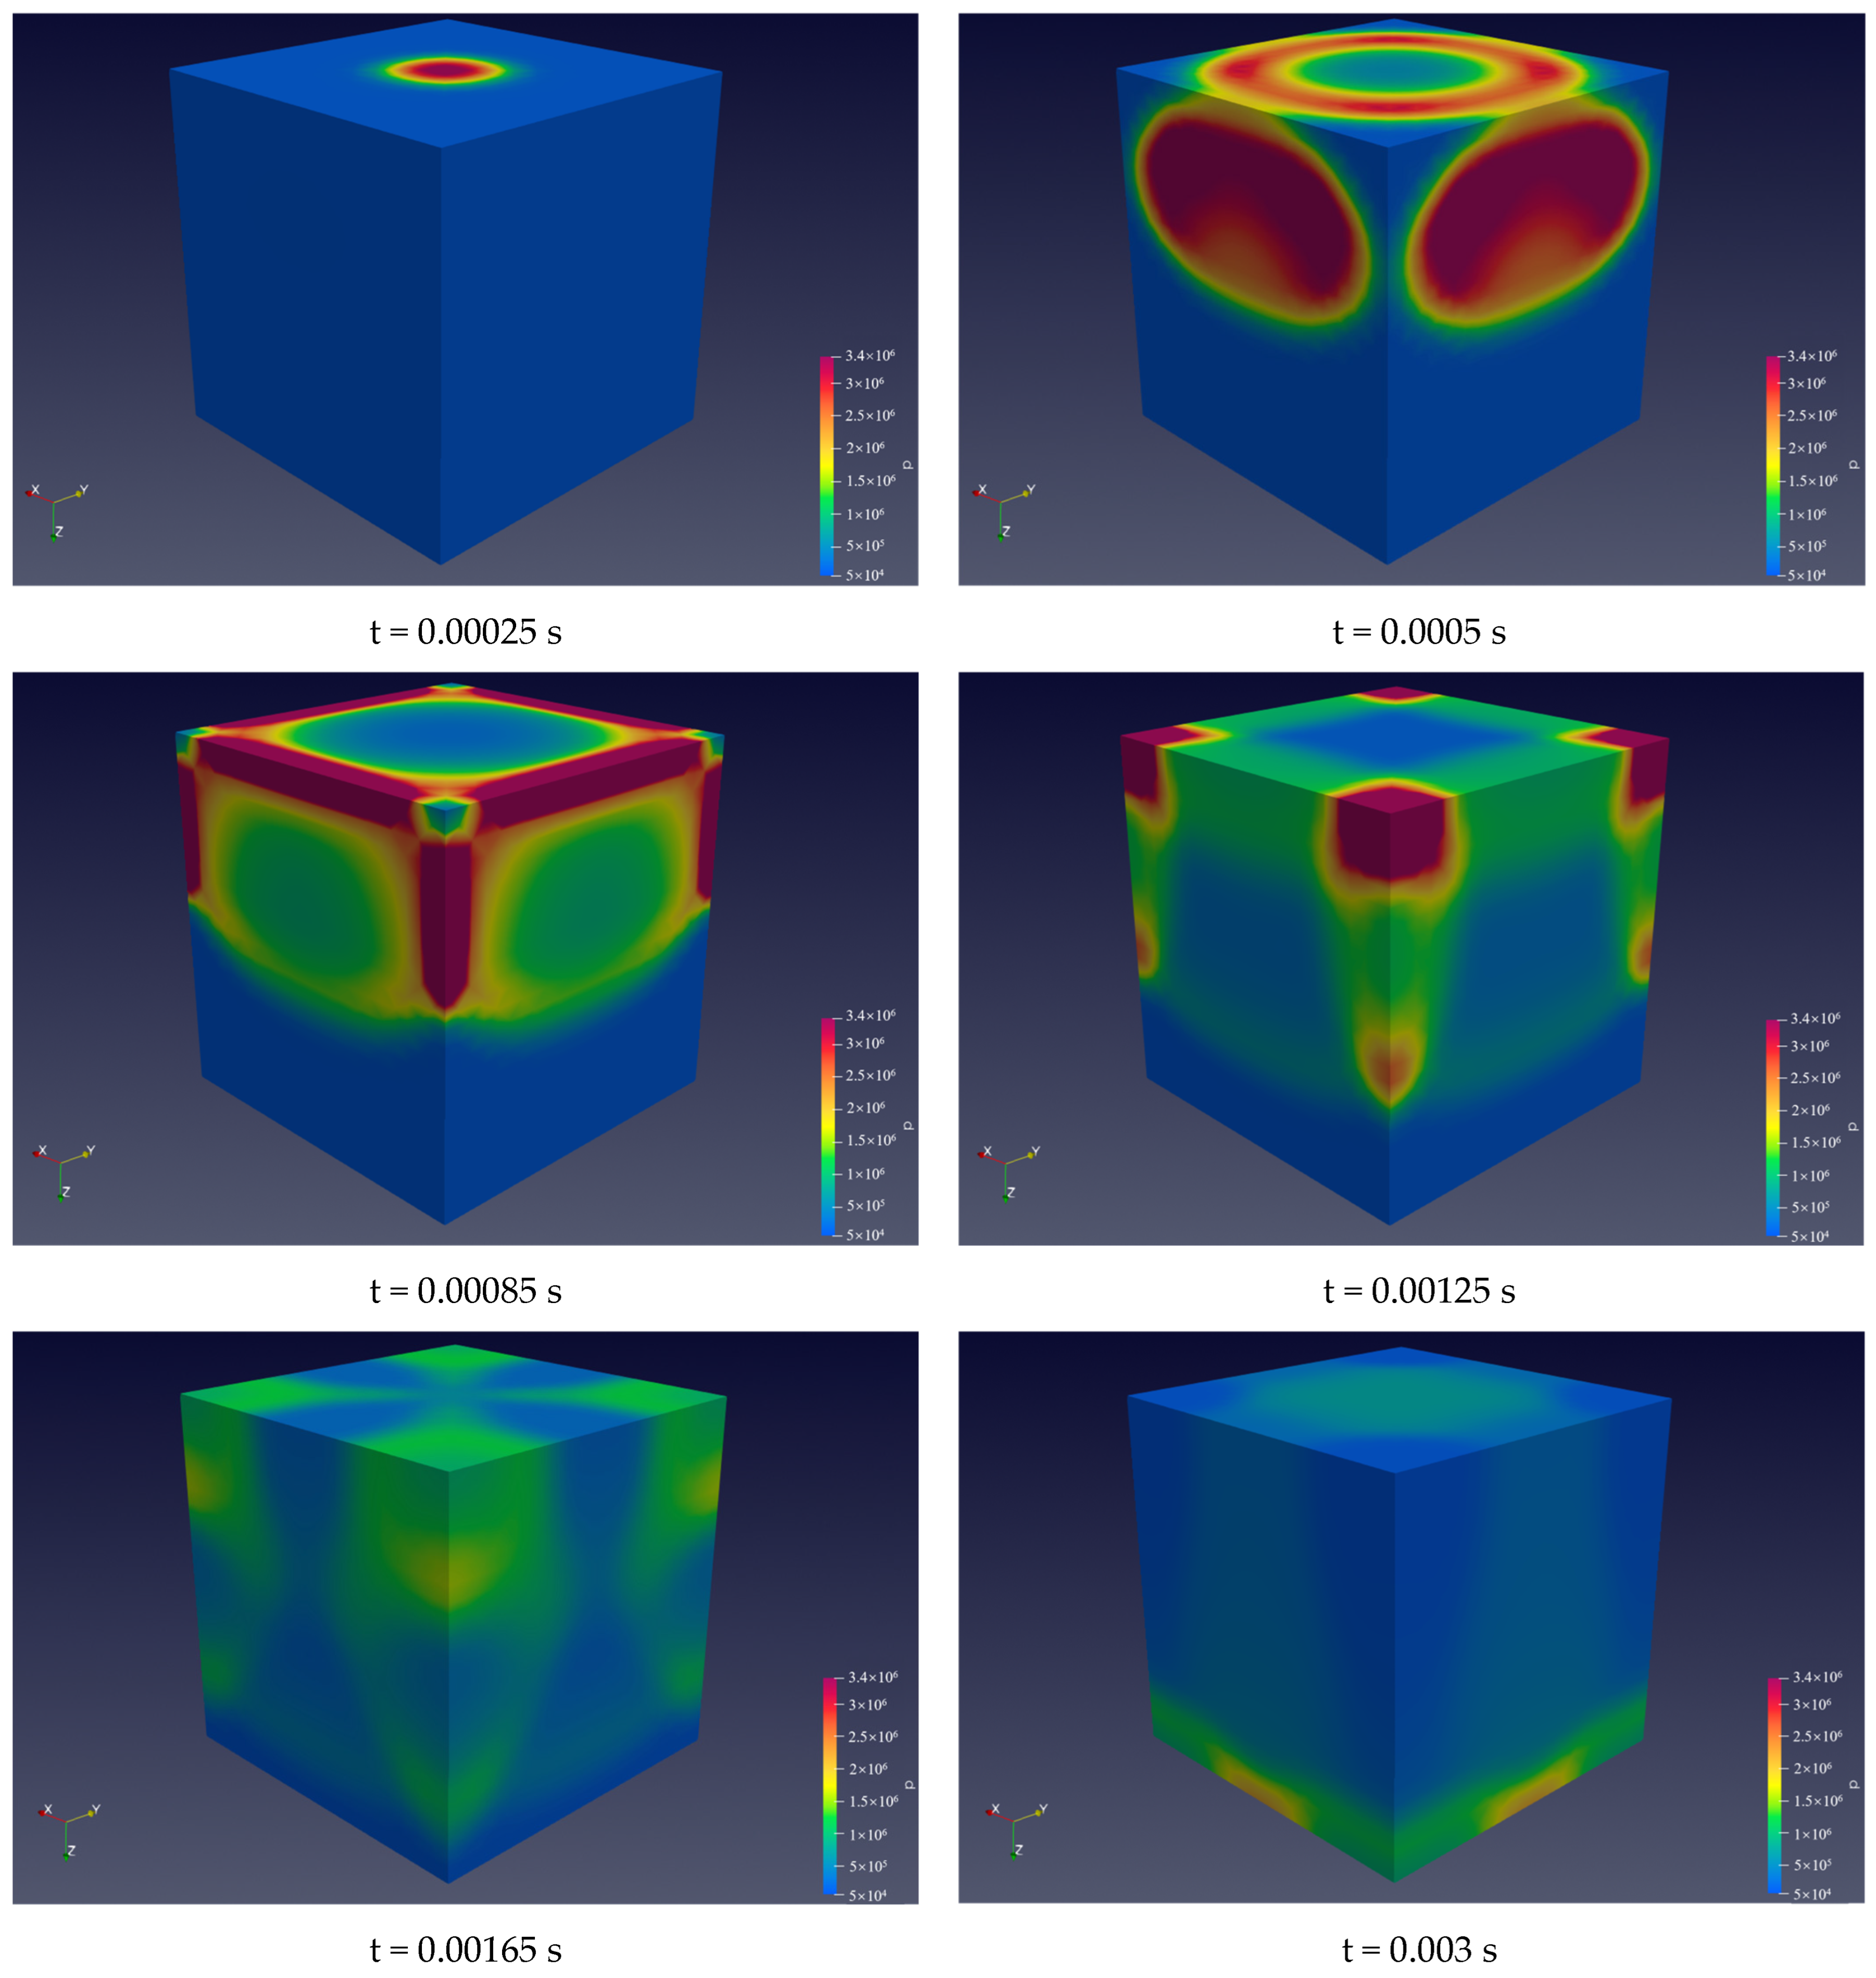
The following presents the simulation results based on the above parameters to compare with the experimental results of reference [34], including temperature and pressure. The simulated pressure distribution in the room domain at various times has been presented in Figure 3. The plotted results reveal that the local pressure value quickly rises after the explosion and the high-pressure area propagates and expands from the bottom to the top of the space as time goes by. The high-pressure wave travels through the wall in a fan shape, which also causes the explosion core region to prevent high-pressure expansion over time. Figure 4 shows the temperature generated by the explosion. It can be seen that when the explosion reaches 0.0005 s, the local temperature rises to 3700 °C. As the explosion progresses, the temperature gradually diffuses to various positions along the wall and produces a certain transfer law.

Figure 3.
Pressure distribution at various time points during the simulation.
Figure 4.
Temperature distribution at various time points during the simulation.
From Figure 5, it can be observed that the numerical simulation results closely align with the experimental explosion data obtained from the measurement points. The minimal discrepancies between the datasets demonstrate the solver’s capability to accurately simulate explosions within confined spaces. This agreement highlights the reliability of the numerical model in capturing the key physical phenomena observed in the experiments, thereby validating its use for further analysis of explosion dynamics in similar scenarios.
Figure 5.
Comparison between experimental and simulated datasets.
The observed discrepancy is primarily due to the response time of the temperature sensor, which introduces a delay in the measured data under high pressure rise rates, unlike the instantaneous response in simulations. Additionally, differences in the shape of the real and simulated explosives result in non-uniform detonation waveforms, leading to variations in arrival times at probe points.
2.3. Geometric Model
The research object of this paper is a 3100-container ship [35]. The three-dimensional structure of the engine room was designed, retaining the two-layer configuration. Irrelevant components were simplified, and the structural layout is illustrated in Figure 6. The engine room is divided into two levels, with overall dimensions of 32.5 m in length, 21 m in width, and 5.3 m in height. Each level has a height of 2.6 m, separated by a 0.1 m connecting layer. The control room, measuring 9 m in length and 4 m in width, includes two doors, each 1 m wide and 1.8 m high, which remain open during the simulation. The oil tank is located on the right side of the lower level, with dimensions of 21 m in length and 4 m in width. The main engine occupies the central area of the engine room, measuring 9 m in length, 6 m in width, and 3 m in height. The auxiliary engines are positioned in front of the main engine, adjacent to the bulkhead, with dimensions of 4 m in length, 5 m in width, and 1.5 m in height, and are situated 2 m away from the main engine. The structure between the upper and lower levels is hollow, featuring a 6 m wide circular passage in the upper engine room. Additionally, four ventilation windows were installed to simulate air circulation within the compartment. Each window measures 1 m by 1 m and is positioned at the four corners of the ceiling in the upper-level room. The device names represented by all the digital symbols appearing in Figure 6 have been mapped in Table 1.
Figure 6.
The layout and structural configuration of the ship’s engine room.

Table 1.
The correlation of numerical values with respective placements.
2.4. Boundary Conditions
Due to the rapid nature of the explosion, the experiment was configured with a stop time of 0.005 s, a time step of 1 × 10⁻⁷ s, and data points saved every 5 × 10⁻⁵ s. These meshes are entirely structural, with the explosives modeled using dynamic structural meshes, allowing the size and quantity of meshes to adapt as the explosion progresses as shown in Figure 7. The boundary conditions for regions No. 7 and No. 8 in Figure 7 are set to “slip”, while the remaining regions have “zeroGradient” boundary conditions. The boundary type for region No. 4 is “open”, and the others are designated as “wall”.
Figure 7.
Simulation mesh of explosion location.
In this study, two detection points are established, as illustrated in Figure 8. The first probe is positioned in the central control room, oriented perpendicular to the long edge of the engine. This setup simulates the impact of an explosion on personnel and equipment within the centralized control room. The second detection point is located at the ventilation system. Damage to the vents would compromise the air circulation system of the entire cabin, leading to inadequate heat dissipation and oxygen supply. In this model, each small segment of the wall is treated as a uniformly distributed force. These pressures result in a uniform stress distribution within the model, allowing the surface pressure to serve as an approximate representation of the overall force acting on the structure [36].
Figure 8.
Frame line drawing and detection point location.
To ascertain the energy release from the explosion, a reference explosive, TNT, serves as the standard, known as the explosion standard. By multiplying the conversion factor derived from the specific energy of the explosive by the specific energy of TNT, the energy output of the considered explosive is determined. Table 2 provides the known parameters for these explosives commonly encountered on ships [37,38,39]. In the scenario of an unconstrained explosion, the calculated explosive load corresponds to the weight of the TNT explosive and is represented by Equation (20).
where denotes the effective charge weight in terms of TNT, represents the weight of the explosive, and signifies the mass-specific energy of the explosive; stands for the mass-specific energy of TNT, and the ratio / signifies the TNT equivalent based on detonation heat [40]. Using the change in explosive substances as an experimental variable, it is divided into LNG, as well as naphtha and TNT. These are two common flammable and explosive substances on ships and in control experiments. They exist in the ship’s engine room in liquid and solid states, respectively. The flow of liquids is not considered in this study. TNT is used to represent explosions resulting from mechanical failure. This research disregards the chemical reactions and morphology of explosive materials, focusing solely on the explosion dynamics and energy release.
Table 2.
Types of explosive items on ships and their TNT equivalent [37,38,39].
The focus of this study is to analyze the explosion characteristics and energy release patterns of typical flammable and explosive materials in ship engine rooms through numerical simulations rather than investigate the detailed chemical reaction mechanisms or the complexities of the combustion process.
3. Results
3.1. Pressure Propagation Rules
Initially, the shock wave generated at the explosion point propagates to the detection point, where it reflects and forms a small peak-like waveform as Figure 9a,b, a phenomenon commonly referred to as a reflected wave. Positioned centrally among the engine, control room, and generator, the explosion point generates the most complex and irregular waveforms due to interactions with waves from three directions and reflections from the cabin walls. In a homogeneous, isotropic medium, the pressure from the explosion propagates outward uniformly in all directions as concentric spheres.


Figure 9.
Schematic illustration of blast wave reflection and Mach reflection: (a) Explosion location indication; (b) initial ground contact of the blast wave; (c) ground propagation culminating in Mach reflection.
Reflection amplifies blast pressure intensity and occurs as regular or Mach reflection, determined by the incidence angle. In Mach reflection, identified by Ernst Mach and analytically confirmed by von Neumann (1941), a shock wave reflects off the ground (Figure 9b), forming a secondary wave that merges with the incident wave to create a high-overpressure Mach stem [41,42]. The junction of these waves, the triple point, traces a path shown in Figure 9c, illustrating both reflection types [43].
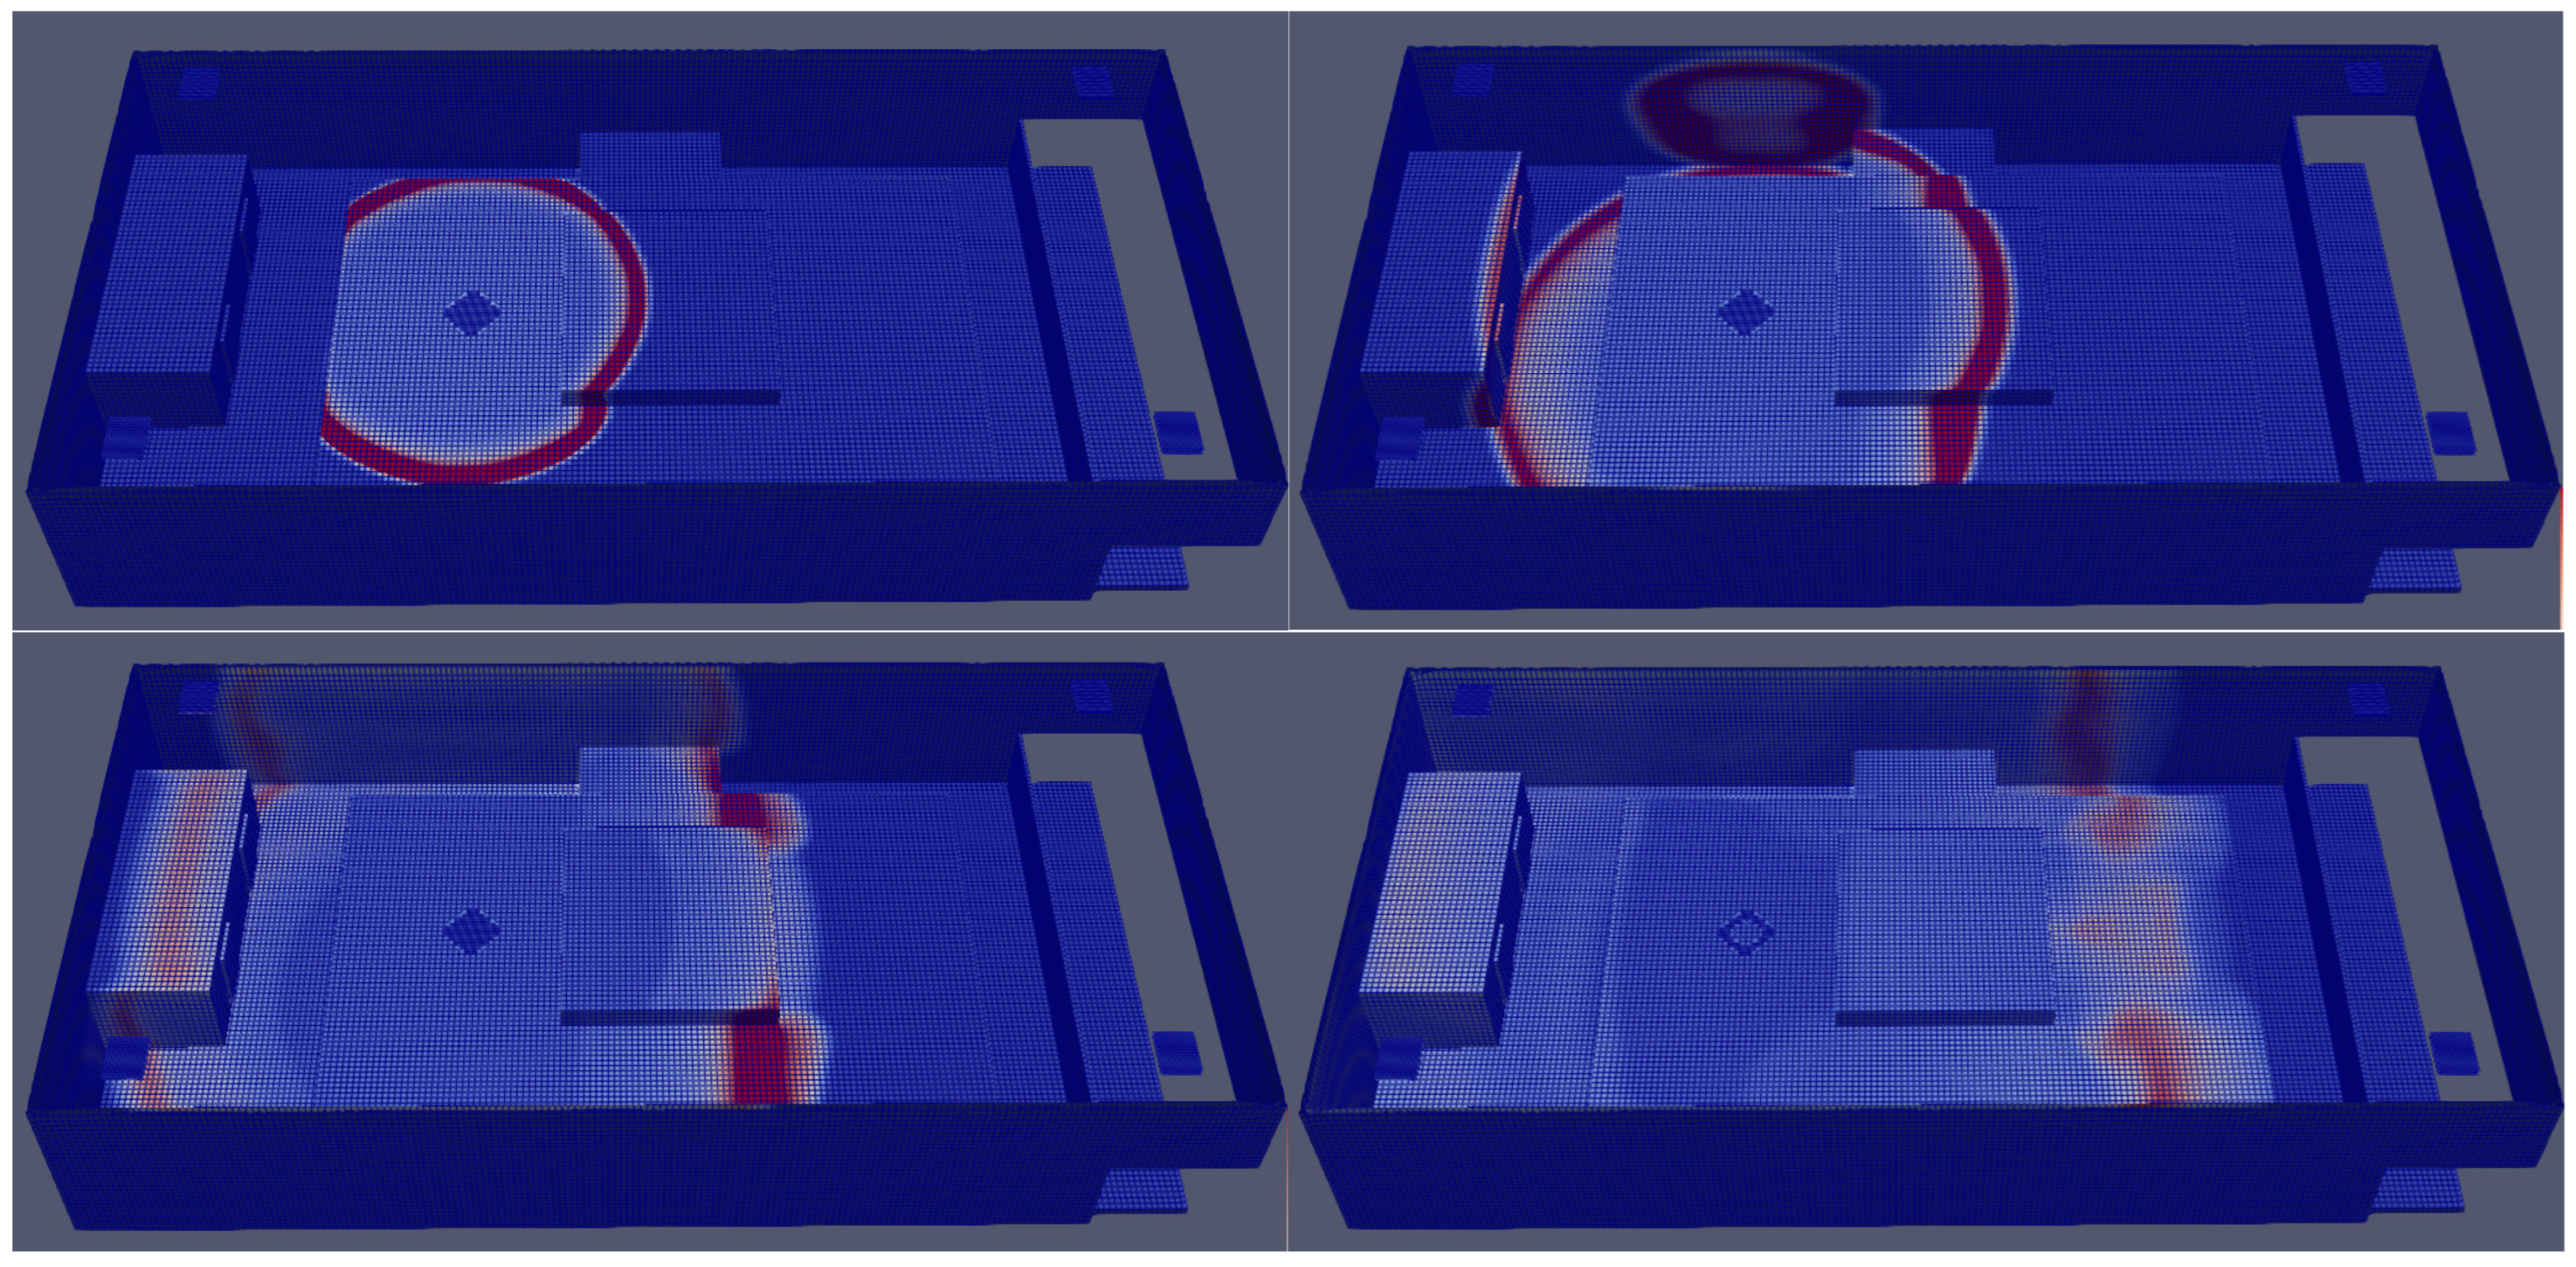
When an incident shock wave strikes an object, reflections are typically detectable. Based on this principle, the shock wave is captured by a pressure detector. Rarefaction and diffraction were not considered in this study. Figure 10 below presents the results of the test explosion simulation. It can be observed that as the explosion progresses, the shock wave exhibits a circular diffusion pattern, propagating outward from the center. Upon encountering a wall or fixed mechanical structure, reflection occurs, and multiple waves converge at specific points, generating new emission waves.
Figure 10.
Blast wave propagation and reflection in simulation.
3.2. Temperature Distribution Rules
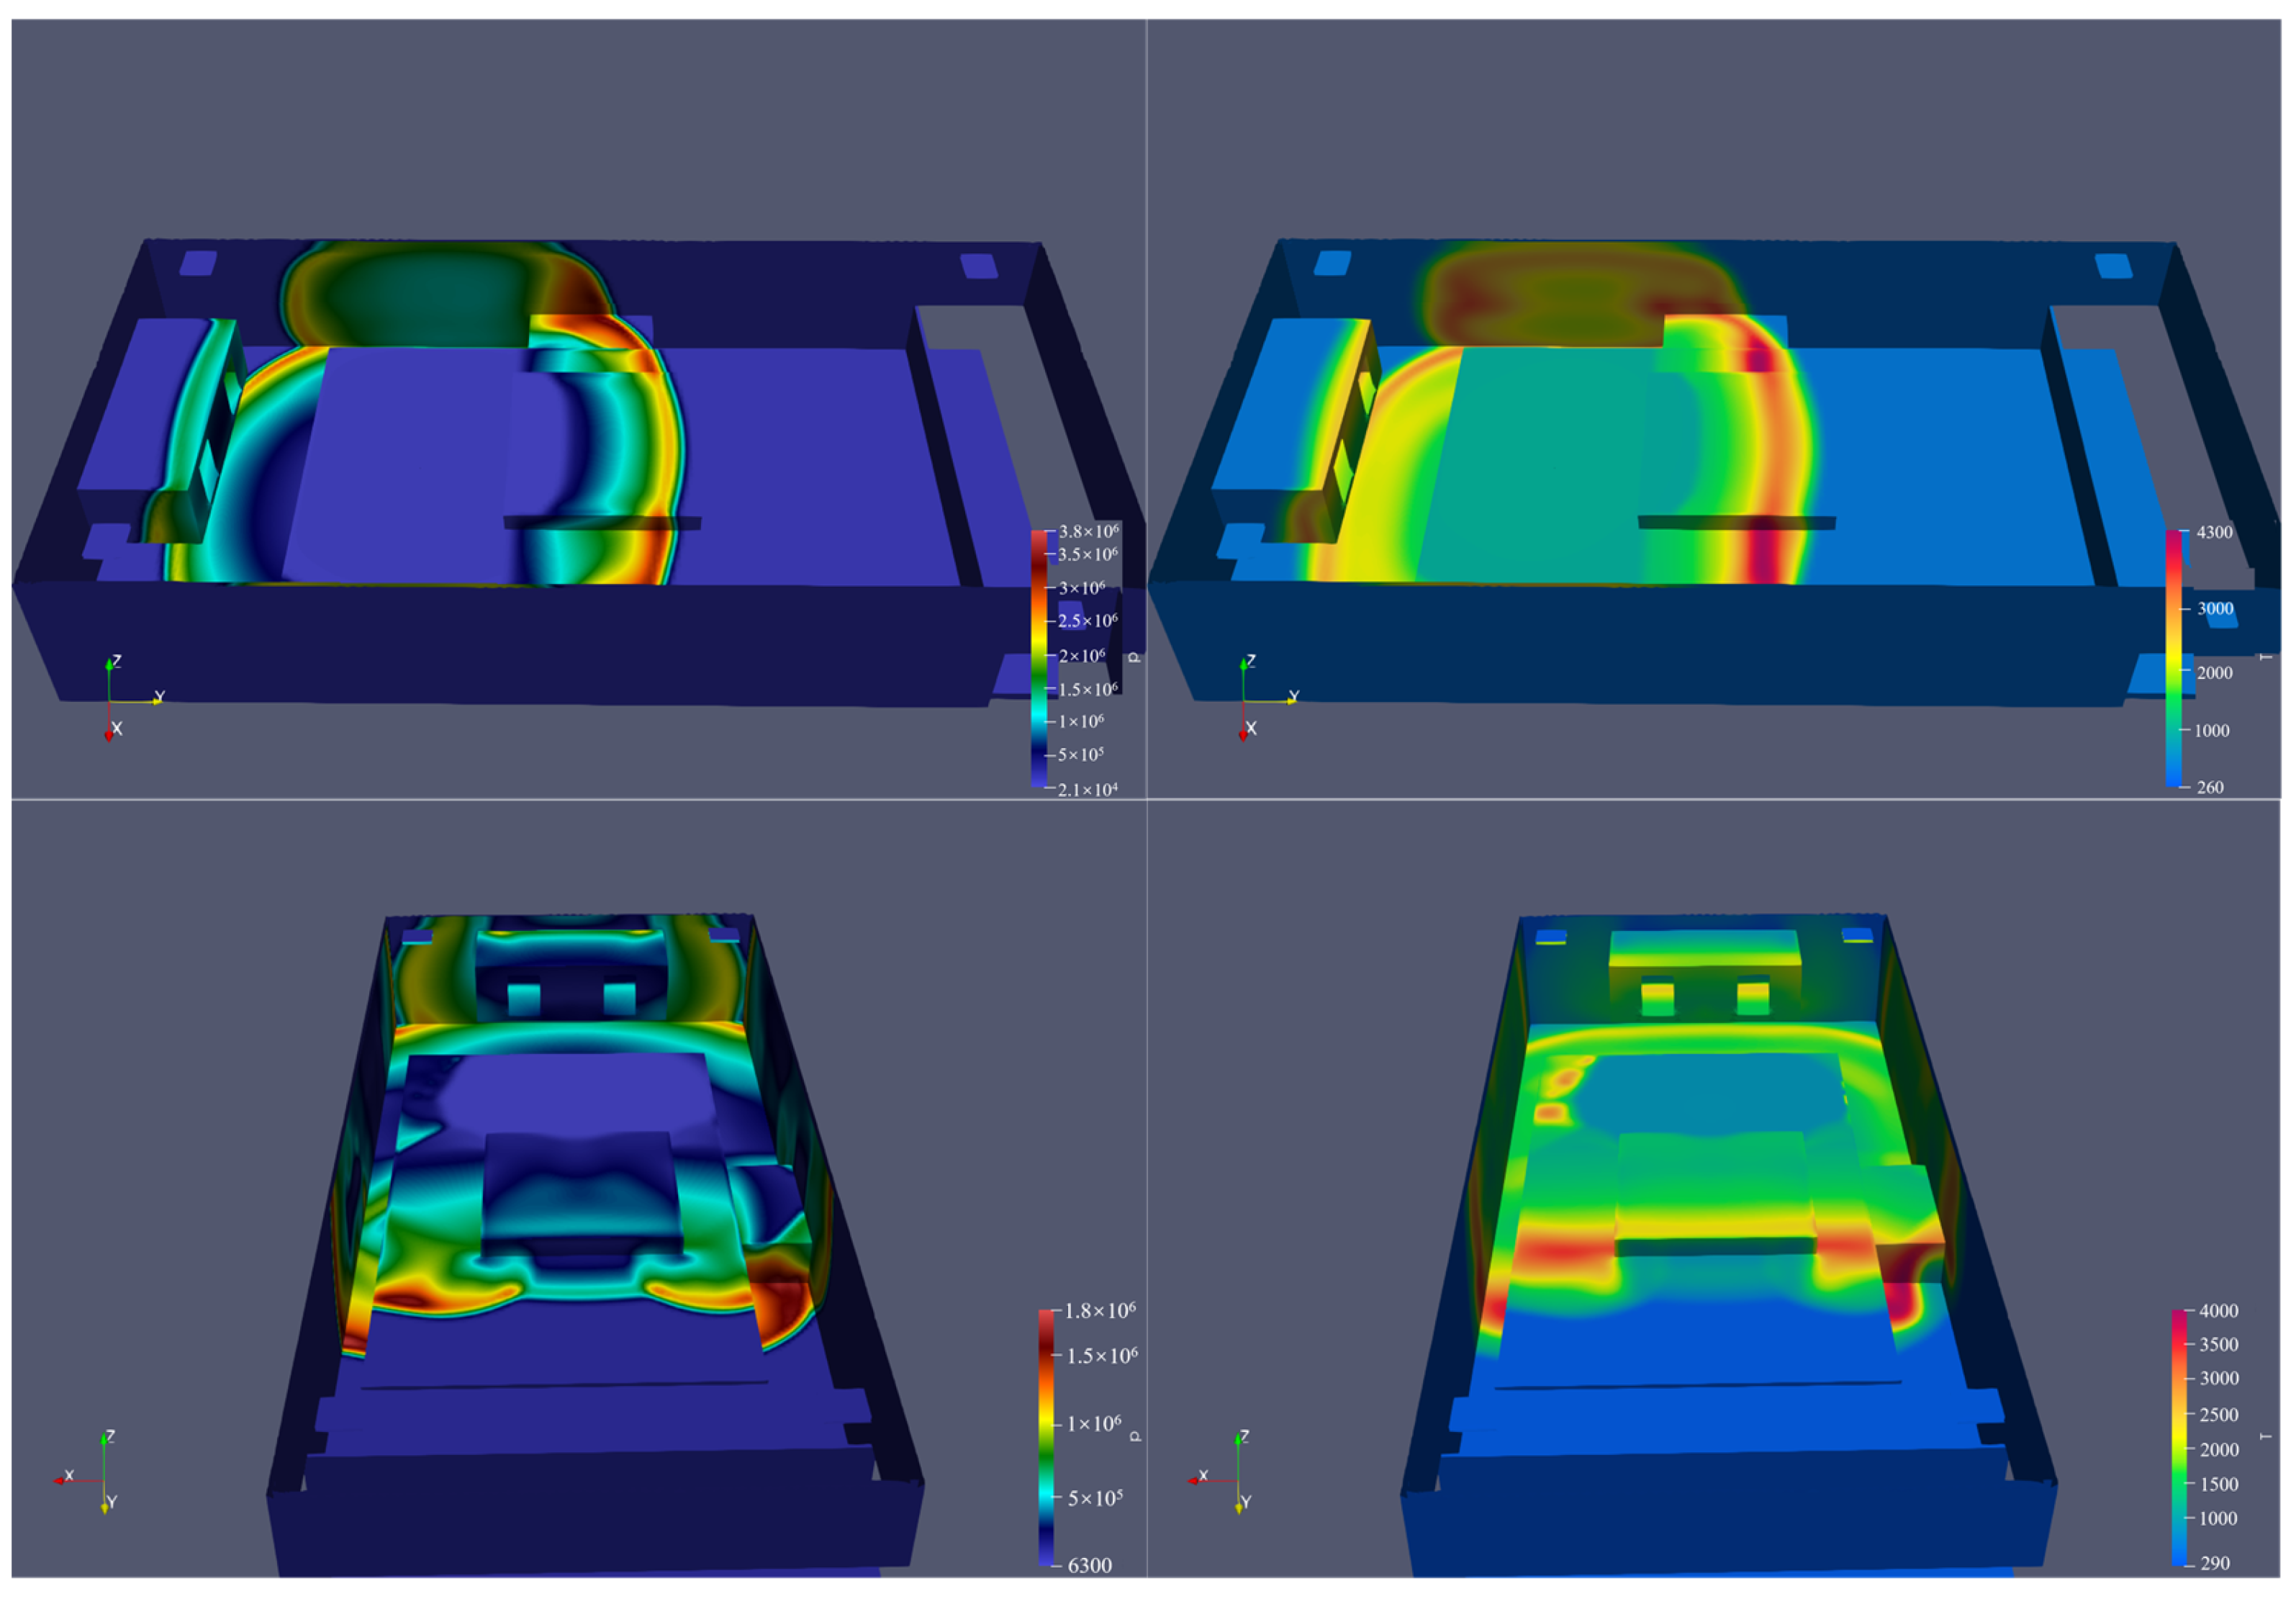
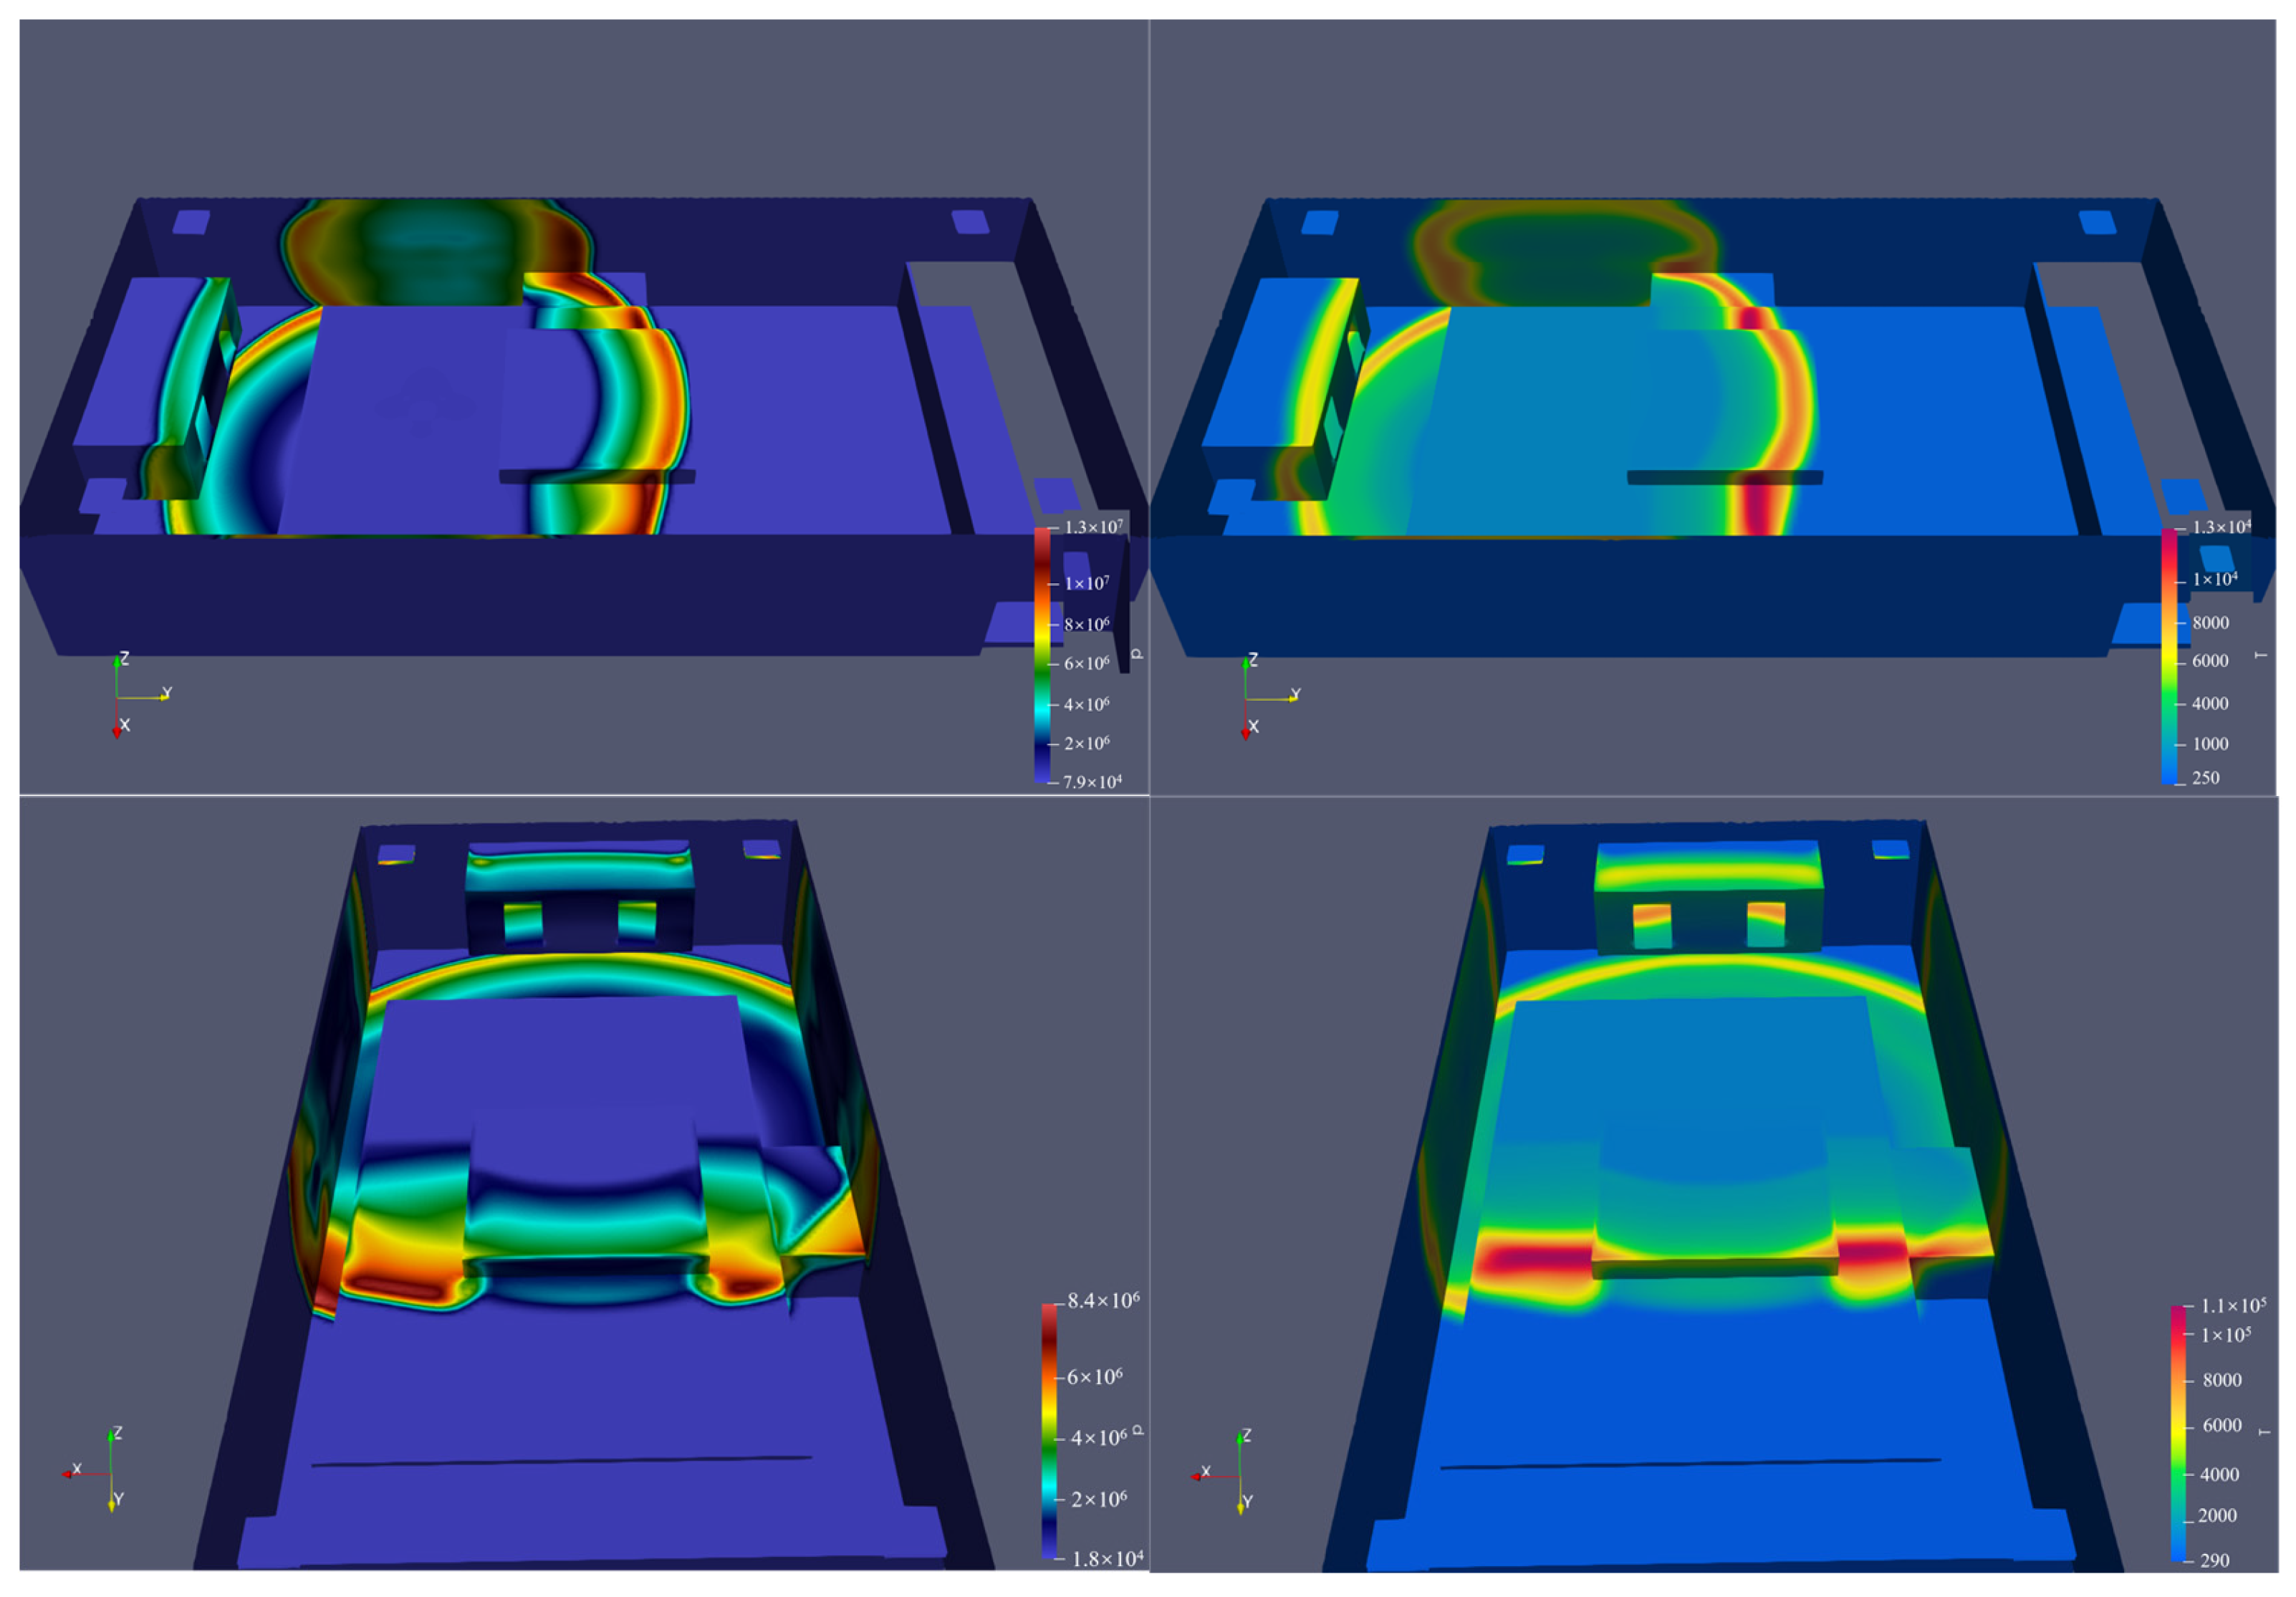
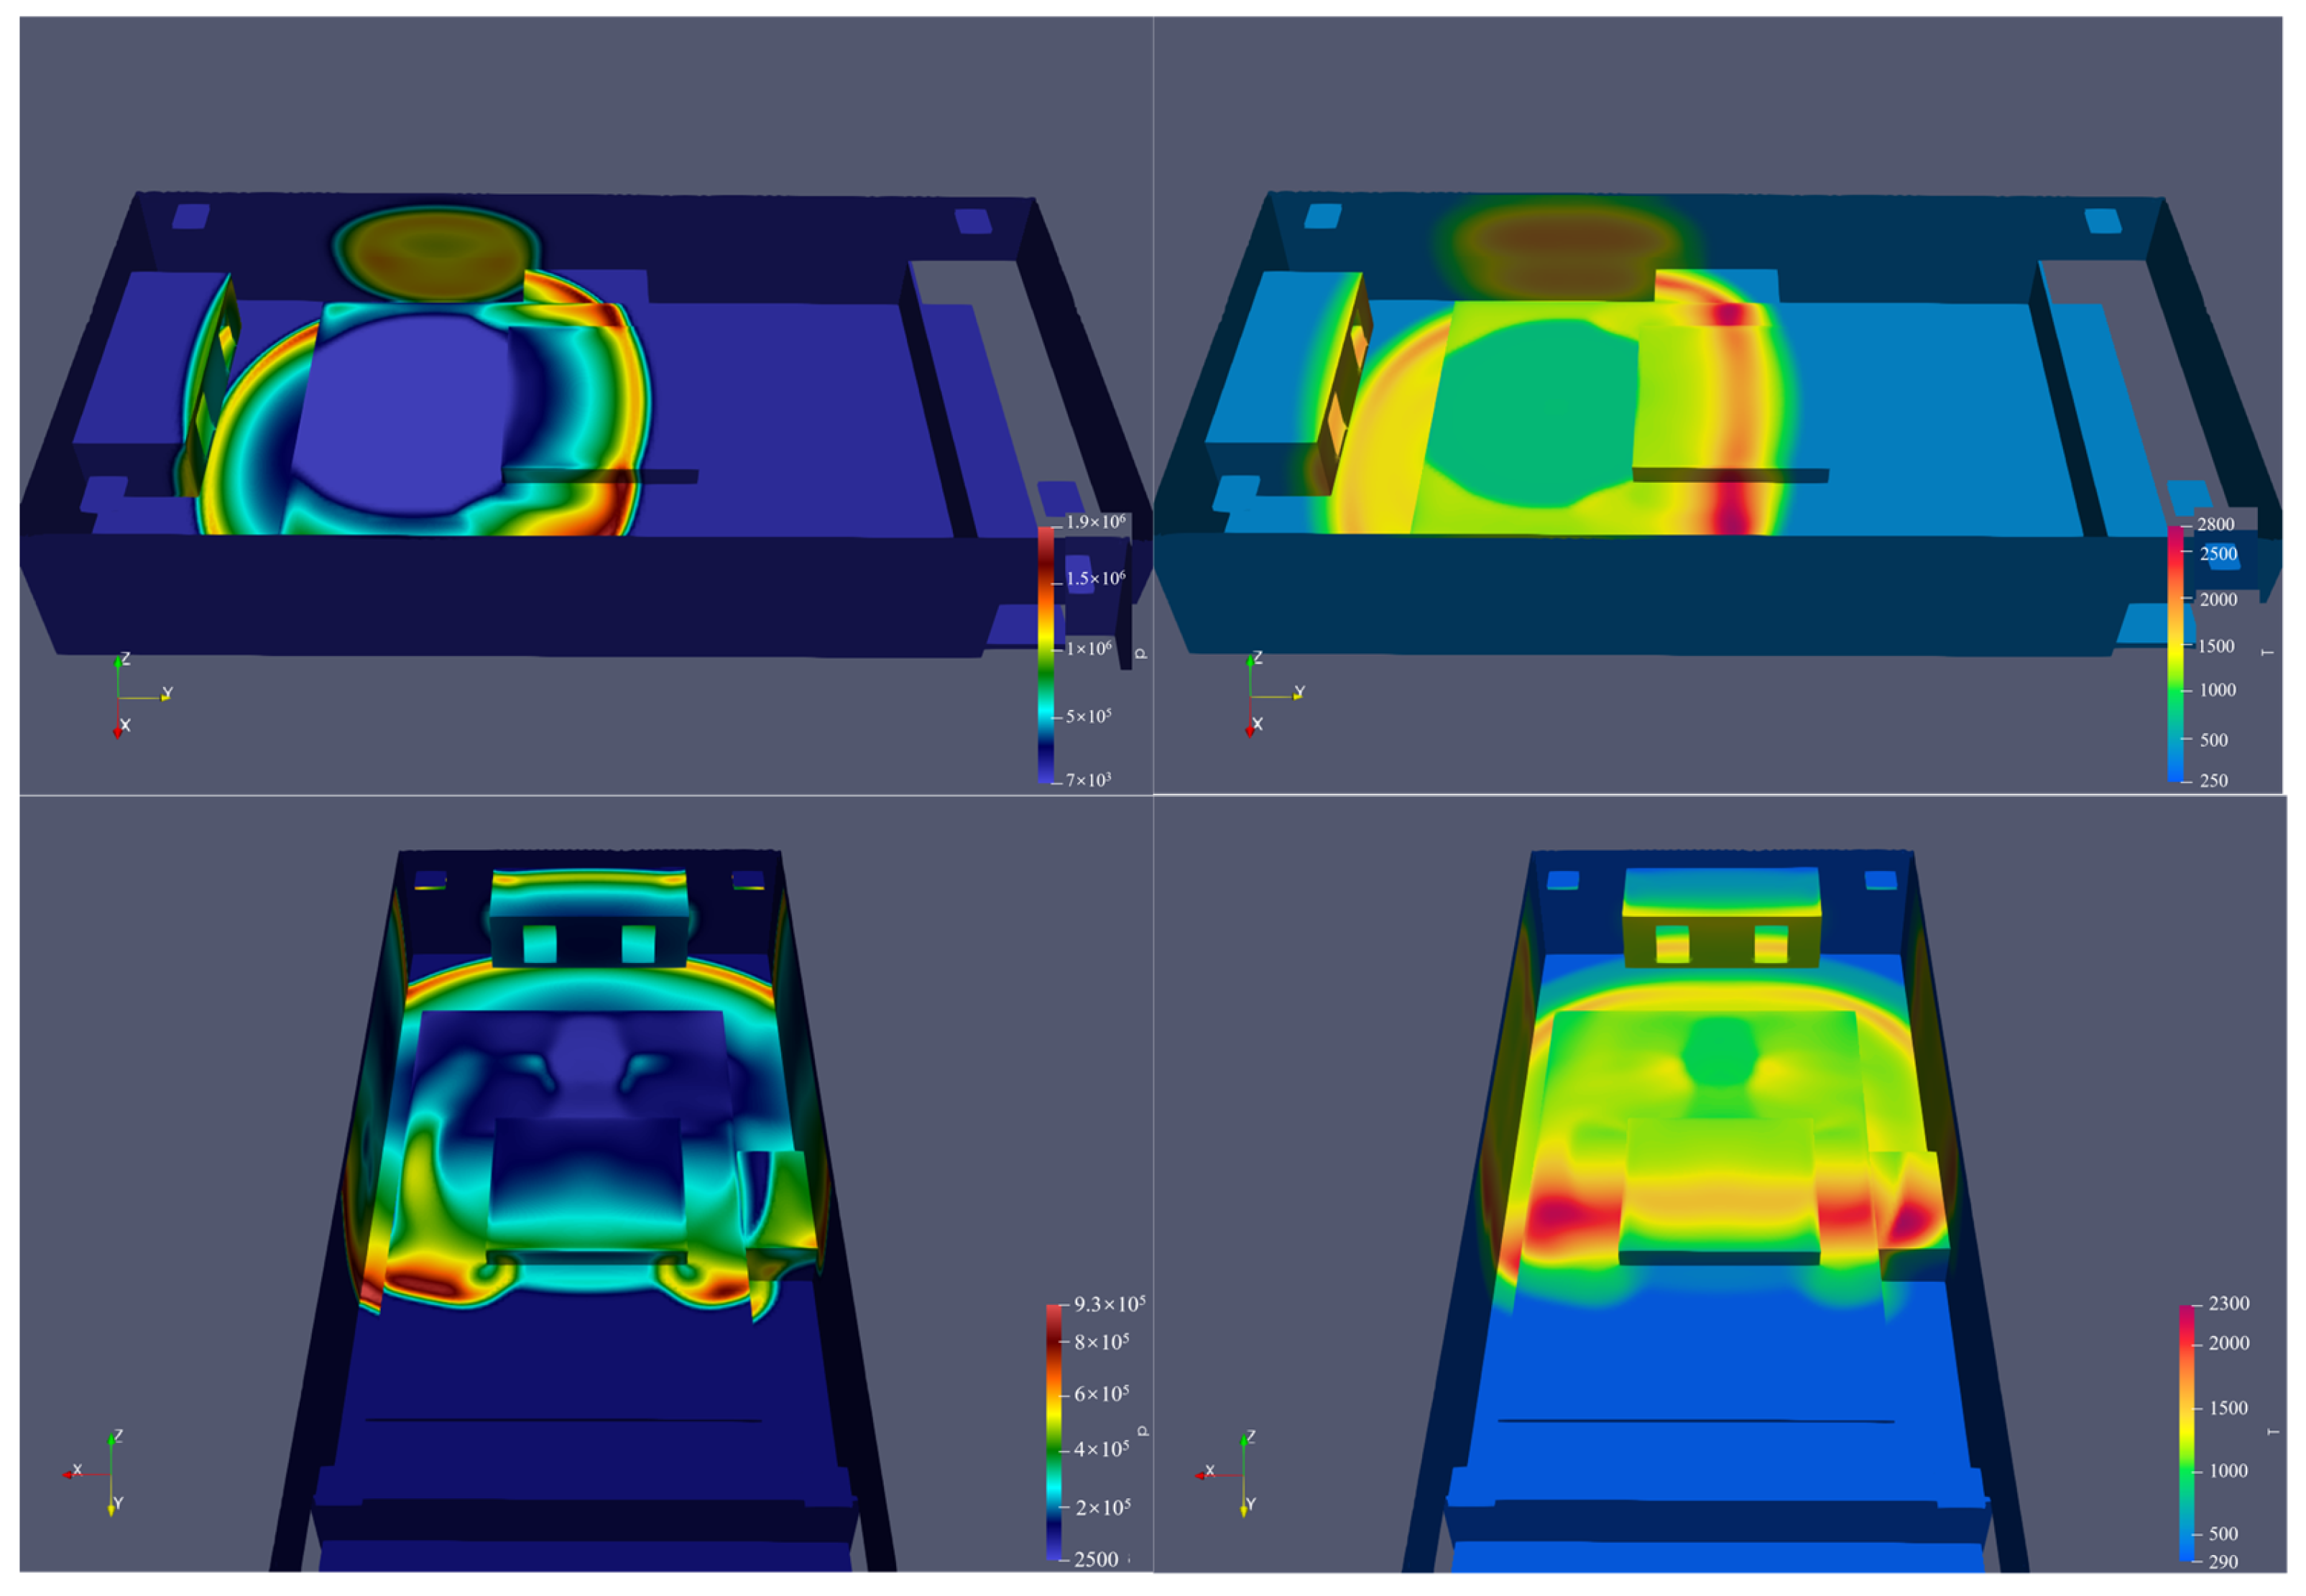
The temperature distribution during the explosion process exhibits diverse characteristics, heavily influenced by factors such as the materials involved, energy magnitude, and environmental conditions. Typically, in proximity to the explosion’s epicenter, temperatures surge dramatically, potentially reaching thousands of degrees Celsius or beyond. This surge is attributed to the immense energy release, which rapidly elevates surrounding materials to extreme temperatures. However, with increasing distance from the source, temperatures diminish swiftly as energy dissipates in space. The surrounding environment significantly impacts temperature distribution; within enclosed spaces such as cabins, convection, heat absorption, or reflection from nearby objects can alter temperature dynamics. Moreover, gases or flames resulting from the explosion reaction also influence temperature distribution, thereby affecting the surrounding environment. Consequently, the temperature distribution pattern in explosions is inherently complex, necessitating consideration of multiple factors for a comprehensive understanding of its characteristics [44,45]. The simulation results in Figure 11 below show the temperature distribution at different times after the explosion as the explosion wave and reflected wave propagate. The wave is accompanied by high temperature.
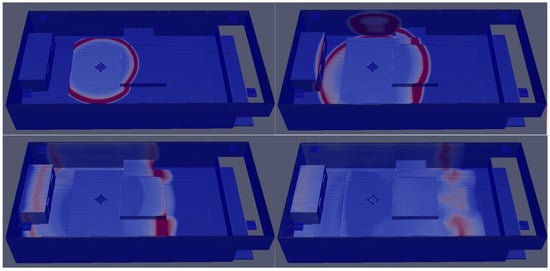
Figure 11.
Temperature distribution in simulation.
3.3. Effect of Explosion Substances
The purpose of explosion analysis in confined spaces is to assess the pressures exerted on the surfaces of the interior space and to analyze the response of boundary structural elements to predict their response and assess the resulting damage. Therefore, a confined explosion will cause more damage than a similar external open-air explosion [34].
Figure 12, Figure 13 and Figure 14 shows the temperature and pressure changes over time near the centralized control room after the explosion of different fuels (naphtha, LNG, and TNT) in a cabin explosion numerical simulation experiment. Changes: From the overall trend, the peak explosion temperature of LNG is the highest, reaching about 6500 °C. After the explosion, the temperature drops rapidly, shows obvious attenuated oscillation, and finally stabilizes. The temperature peak of naphtha is about 4000 °C, and the temperature rises rapidly. After the peak temperature, the temperature decreases relatively slowly, also shows a certain attenuated oscillation, and finally stabilizes. The temperature peak of TNT is about 2000 °C, which is the lowest among the three fuels.

Figure 12.
Temperature and pressure for the naphtha explosion simulation.
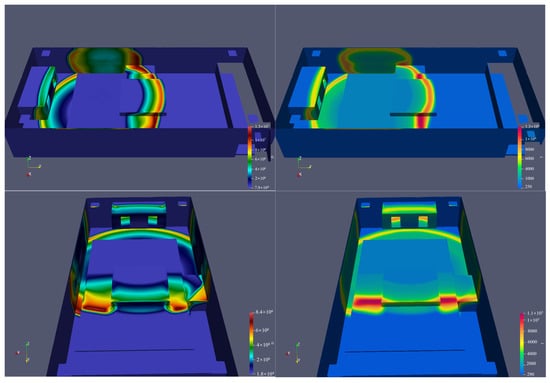
Figure 13.
Temperature and pressure for the LNG explosion simulation.
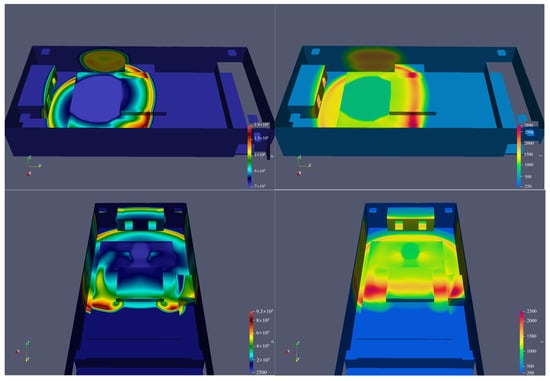
Figure 14.
Temperature and pressure for the TNT explosion simulation.
Figure 15b shows the change in pressure over time near the centralized control room after the explosion. From the overall trend, the peak explosion pressure of LNG is the highest, reaching about 1.65 × 10⁶ Pa. After the explosion, the pressure drops rapidly, shows obvious attenuated oscillation, and finally stabilizes. The peak pressure of naphtha is about 4 × 10⁶ Pa, and it rises quickly. After the peak, the pressure drops slowly, showing a certain attenuated oscillation, and eventually stabilizes. The pressure peak of TNT is about 1.5 × 10⁶ Pa, which is the lowest among the three fuels. And the pressure rises at a moderate speed, drops quickly after the peak, has small fluctuations, and tends to be stable.
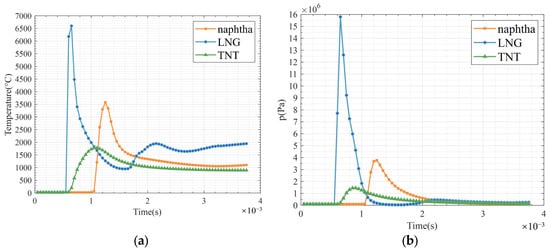
Figure 15.
Temperature and pressure curves recorded in the centralized control room: (a) temperature profile of different substances; (b) pressure profile of different substances.
Figure 16a illustrates the temporal variations in temperature and pressure near the vent following the explosion of different materials—naphtha, LNG, and TNT—in a simulated engine room explosion. LNG exhibits the highest peaks, reaching a temperature of approximately 5500 °C and pressure of 5.8 × 10⁶ Pa, followed by a rapid drop and attenuated oscillations before stabilization. Naphtha reaches peaks of around 1600 °C and 1.5 × 10⁶ Pa, with a faster rise and slower decline, also exhibiting oscillations before stabilizing. TNT shows the lowest peaks, at roughly 500 °C and 7 × 10⁵ Pa.

Figure 16.
Temperature and pressure curves recorded at the vents: (a) temperature profiles of different substances; (b) pressure profiles of different substances.
From a safety perspective, LNG and naphtha explosions present the most significant threat to vents, requiring advanced protective measures such as high-temperature and impact-resistant materials, as well as thermal insulation. Although TNT explosions produce lower temperature and pressure levels, adequate protection remains essential.
During the initial explosion phase (0–0.0015 s), LNG rapidly reaches peak temperature and pressure, experiences a sharp decay between 0.0015 s and 0.0017 s, and stabilizes after 0.0025 s. These findings underscore the necessity of prioritizing protection strategies based on fuel type. LNG represents the highest risk due to its elevated and fluctuating temperature and pressure, followed by naphtha. TNT, despite its lower intensity and minimal fluctuations, still demands attention due to its potential for significant damage.
The simulation reveals significant differences in the explosion effects of LNG, naphtha, and TNT between the centralized control room and vents. LNG shows the highest energy release, with temperature peaks of 6500 °C in the control room and 5500 °C at the vent, and pressure peaks of 1.65 × 10⁶ Pa and 5.8 × 10⁶ Pa, respectively, indicating more violent energy release in open areas. naphtha and TNT have lower peaks, with temperatures of 4000 °C and 1600 °C (naphtha) and 2000 °C and 500 °C (TNT), and pressures of 4 × 10⁶ Pa and 1.5 × 10⁶ Pa (naphtha) and 1.5 × 10⁶ Pa and 7 × 10⁵ Pa (TNT), showing stronger effects in enclosed spaces. These findings underscore the need for tailored safety designs, focusing on LNG protection at vents and both LNG and naphtha in the control room.
The numerical simulation results reveal that the temperature of LNG rises rapidly during the initial stage of an explosion, indicating a high energy release, while naphtha and TNT exhibit slower but significant temperature increases. At the peak stage, the extreme temperature of LNG can melt or decompose surrounding materials, leading to severe structural damage. Naphtha also demonstrates considerable destructive effects, whereas TNT, despite its lower peak temperature, still exerts a notable environmental impact. During the decay and stabilization stage, LNG displays a rapid temperature decline accompanied by significant oscillations, suggesting a complex heat transfer process. Naphtha exhibits a slower decay with mild fluctuations, reflecting a more stable heat release, while TNT shows the fastest decline and minimal oscillation, indicating a simpler heat release mechanism.
3.4. Impact of Explosion Size
In general, the measurement points at the location of the control room show that the maximum pressure at the beginning of the explosion increases sharply with the increase in explosive content and then rapidly reduces.
The explosion waves exhibit distinct behaviors influenced by location and explosive mass. Pressure–Time graphs reveal that pressure peaks increase significantly with explosive mass. As shown in Figure 17, during the initial phase (0–0.0012 s), the environment remains stable, but pressure rises rapidly afterward, with larger masses reaching peaks faster. The explosion peaked at 0.0022 s with a pressure of about 6 × 10⁶ Pa for a 10 kg explosion, while the 50 kg explosion peaked at 0.0017 s with a pressure of 1.5 × 10⁷ Pa. Then, there was a short period of negative pressure. This is because after the explosion, the shock wave expands outward, the internal gas density decreases, and the surrounding air flows back to replenish this low-pressure area. When the surrounding air return speed is insufficient or turbulent interference occurs, the local pressure is temporarily lower than atmospheric pressure, as shown in Figure 17 and Figure 18. Then, the figure shows that the negative pressure returns to above standard atmospheric pressure after being maintained for a short period of time. This indicates that the negative pressure area only exists temporarily and will eventually be backfilled and balanced by the ambient gas. At the same time, because the cabin used in the simulation is in a semi-enclosed space, the formation of negative pressure will be aggravated to a certain extent.
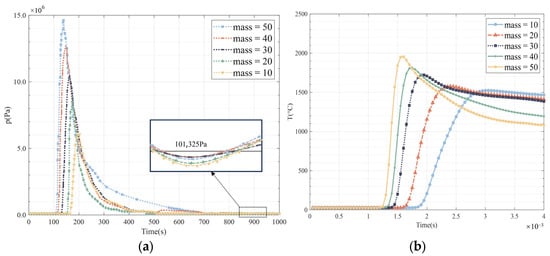
Figure 17.
Temperature and pressure curves recorded in the centralized control room: (a) pressure profiles of different mass; (b) temperature profiles of different mass.
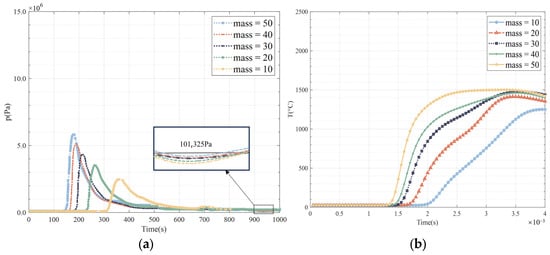
Figure 18.
Temperature and pressure curves recorded at the vents: (a) pressure profiles of different masses; (b) temperature profiles of different masses.
After peaking, pressure decreases sharply, stabilizing after approximately 0.0035 s, with varying baseline pressures for different masses. Similarly, temperature–time graphs show a sharp rise during explosions. Before detonation, the temperature remains around 300 °C. Peak temperatures increase with mass, reaching about 1500 °C for 10 kg and 2000 °C for 50 kg. Declines are initially steep but stabilize over time, with final temperatures varying—about 1450 °C for 10 kg and 1100 °C for 50 kg.
The analysis of the pressure and temperature versus time graphs in Figure 18 reveals the significant influence of explosive mass on the blast effects. In the initial phase (0 to ~0.0012 s), pressure remains stable across all mass groups, indicating a stable pre-explosion environment. As the mass increases, both the pressure peak and the time to peak decrease, with a 10 kg explosion reaching a peak pressure of approximately 2.6 × 10⁶ Pa at 0.0022 s and a 50 kg explosion peaking at 5.8 × 10⁶ Pa at 0.0017 s. After the peak, pressure rapidly declines and stabilizes after 0.0035 s, with larger masses showing slightly higher residual pressures. Similarly, temperature remains stable at 25 °C before the explosion, rising rapidly upon detonation. Larger masses reach peak temperatures more quickly, with 10 kg and 50 kg explosions peaking at approximately 1300 °C and 1500 °C, respectively. The temperature decline post-peak is steep at first but stabilizes, with the final temperatures stabilizing at 1250 °C for 10 kg and 1450 °C for 50 kg. These findings underscore the mass-dependent nature of both pressure and temperature behaviors, with larger explosions producing higher peaks and more significant residual effects. These data are crucial for guiding structural reinforcement and safety measures to mitigate explosion impacts in confined spaces. Additionally, the explosion characteristics for 20 kg and 30 kg masses resemble those of the 10 kg explosion, while 40 kg and 50 kg explosions exhibit similar trends, especially after reaching peak values.
4. Discussion
The selection of the BlastFOAM solver for this study was driven by its specialized capabilities in simulating explosive loads, particularly for scenarios involving energy equivalents such as TNT. Unlike ReactFOAM and XiFOAM, which are designed for detailed combustion and chemical reaction modeling, BlastFOAM allows for the direct input of explosive equivalents, enabling efficient calculations of shock wave propagation, energy release, and pressure field distribution without the computational overhead of complex chemical kinetics. This approach is particularly advantageous for large-scale simulations, such as those involving ship engine rooms, where computational efficiency is critical. By focusing on the energy release and propagation characteristics of explosive loads, BlastFOAM aligns with the study’s objectives while avoiding unnecessary complexity, making it an optimal choice for this research.
The analysis yielded three key findings. First, the standardization of explosive energy using TNT mass-specific energy and the TNT equivalent ratio provided a consistent framework for comparing the energy of different explosives. This approach simplified the analysis by focusing on explosion energy release while ignoring complexities such as liquid flow, ensuring comparability across explosive materials. Second, the study revealed that explosive dynamics in mechanical systems are highly sensitive to structural interactions. The pressure at the detection point initially exhibits a rapid surge due to enhanced cabin energy absorption, subsequently undergoes phase-shifted attenuation triggered by structural coupling effects, followed by a gradual decline with minor fluctuations. Ultimately, wave propagation characteristics induce transient negative pressure before the system progressively stabilizes to equilibrium. The superposition of shock wave interactions was identified as a primary cause of secondary damage, emphasizing the need for detailed modeling of structural responses. Third, the propagation of shock waves was found to be significantly influenced by the geometry and material properties of the environment. The pressure increases and the lagged pressure loads in areas like ventilation ducts underscored the complex nature of shock wave behavior in confined spaces, providing critical insights for optimizing structural designs to mitigate damage.
Despite these insights, this study has limitations. The exclusion of combustion processes, liquid fuel flows, and multi-physics coupling in intricate geometries restricts the model’s ability to fully capture real-world explosion dynamics. Factors such as the effects of pressure on detonation and scenarios involving fuel explosions remain unexplored, presenting opportunities for future research. Integrating combustion models and investigating liquid fuel flow could provide a more comprehensive understanding of explosion behavior, particularly for fuels like LNG and naphtha. Additionally, exploring multi-physics coupling and structural responses under combined thermal and mechanical loads could further refine the accuracy of explosion dynamics predictions. These advancements would not only address the current limitations but also contribute to the development of more robust safety measures for industrial and maritime applications, ultimately enhancing the resilience of ship structures and equipment layouts.
5. Conclusions
This study employs the BlastFOAM solver in OpenFOAM to conduct full-scale numerical simulations of a ship’s engine room. By utilizing the TNT mass ratio as a reference to standardize explosion energy, combined with the TNT equivalent ratio, the energy release patterns of LNG and naphtha explosives in the ship’s engine room are determined. Notably, the maximum pressure in the control room varies with different materials, with LNG exhibiting the highest explosion risk due to its strongest pressure impact. The unique structure of the ventilation duct results in significant pressure loads that lag behind damage observed in other areas. Enhanced energy absorption in the confined space causes the pressure at detection points to initially peak and then fluctuate downward, underscoring the importance of considering secondary damage from shock wave interactions and mechanical stress concentrations. Additionally, the propagation and reflection of shock waves under different fuel explosions significantly alter internal conditions. The temperature distribution analysis reveals varying temperature increases in the control room and ventilation duct with different explosive materials. The presence of ventilation structures, such as ducts, leads to gradual temperature accumulation on walls, causing sudden pressure changes and potential structural deformation. Subsequent work will focus on exploring the effects of chemical reactions on explosion outcomes. Overall, this study provides valuable insights into explosion dynamics and offers practical guidance for enhancing industrial and ship fire and explosion safety, optimizing cabin equipment layout, and improving the impact resistance of cabin structures.
Author Contributions
Conceptualization, Y.Z. and Z.M.; methodology, Z.M.; software, Z.M.; validation, Y.Z., Z.M. and D.A.; formal analysis, Z.M.; investigation, Q.W.; resources, Y.Z.; data curation, Z.M.; writing—original draft preparation, Z.M.; writing—review and editing, Z.M.; visualization, Z.M.; supervision, Y.Z. and Y.L.; project administration, Y.Z.; funding acquisition, Y.G. All authors have read and agreed to the published version of the manuscript.
Funding
This research received no external funding.
Institutional Review Board Statement
Not applicable.
Informed Consent Statement
Not applicable.
Data Availability Statement
Data are provided in this article.
Conflicts of Interest
The authors declare no conflicts of interest.
References
- Talley, W.K. The Safety of Ferries: An Accident Injury Perspective. Marit. Policy Manag. 2002, 29, 331–338. [Google Scholar] [CrossRef]
- Xu, S.; Hu, H. Development of a Maritime Safety Management Database Using Relational Database Approach. Int. J. Shipp. Transp. Logist. 2019, 11, 334–353. [Google Scholar] [CrossRef]
- Wang, L.; Yang, Z. Bayesian Network Modelling and Analysis of Accident Severity in Waterborne Transportation: A Case Study in China. Reliab. Eng. Syst. Saf. 2018, 180, 277–289. [Google Scholar] [CrossRef]
- Chen, J.; Zhang, W.; Li, S.; Zhang, F.; Zhu, Y.; Huang, X. Identifying Critical Factors of Oil Spill in the Tanker Shipping Industry Worldwide. J. Clean. Prod. 2018, 180, 1–10. [Google Scholar] [CrossRef]
- Ming, F.R.; Zhang, A.M.; Xue, Y.Z.; Wang, S.P. Damage Characteristics of Ship Structures Subjected to Shockwaves of Underwater Contact Explosions. Ocean Eng. 2016, 117, 359–382. [Google Scholar] [CrossRef]
- Nurick, G.N.; Martin, J.B. Deformation of Thin Plates Subjected to Impulsive Loading—A Review: Part I: Theoretical Considerations. Int. J. Impact Eng. 1989, 8, 159–170. [Google Scholar] [CrossRef]
- Weibull, H.R.W. Pressures Recorded in Partially Closed Chambers at Explosion of Tnt Charges. Ann. N. Y. Acad. Sci. 1968, 152, 357–361. [Google Scholar] [CrossRef]
- Liu, X.-D.; Osher, S.; Chan, T. Weighted Essentially Non-Oscillatory Schemes. J. Comput. Phys. 1994, 115, 200–212. [Google Scholar] [CrossRef]
- Jiang, G.-S.; Shu, C.-W. Efficient Implementation of Weighted ENO Schemes. J. Comput. Phys. 1996, 126, 202–228. [Google Scholar] [CrossRef]
- Shi, J.; Zhang, Y.-T.; Shu, C.-W. Resolution of High Order WENO Schemes for Complicated Flow Structures. J. Comput. Phys. 2003, 186, 690–696. [Google Scholar] [CrossRef]
- Stewart, J.B. Approximating a Free-Field Blast Environment in the Test Section of an Explosively Driven Conical Shock Tube. Shock Waves 2019, 29, 355–360. [Google Scholar] [CrossRef]
- Liu, Y.L.; Zhang, A.M.; Tian, Z.L.; Wang, S.P. Numerical Investigation on Global Responses of Surface Ship Subjected to Underwater Explosion in Waves. Ocean Eng. 2018, 161, 277–290. [Google Scholar] [CrossRef]
- Shin, Y.S. Ship Shock Modeling and Simulation for Far-Field Underwater Explosion. Comput. Struct. 2004, 82, 2211–2219. [Google Scholar] [CrossRef]
- Kar, A.R.; Dutta, B.B. Risk Analysis Techniques for Improving Fire Safety Onboard Ships. In Proceedings of the ASME 2011 30th International Conference on Ocean, Offshore and Arctic Engineering, Rotterdam, The Netherlands, 19–24 June 2011; American Society of Mechanical Engineers Digital Collection; ASME: New York, NY, USA, 2011; pp. 1–6. [Google Scholar]
- Lutfi Tunçel, A.; Bal Beşikçi, E.; Akyuz, E.; Arslan, O. Safety Analysis of Fire and Explosion (F&E) Accidents Risk in Bulk Carrier Ships under Fuzzy Fault Tree Approach. Saf. Sci. 2023, 158, 105972. [Google Scholar] [CrossRef]
- Chen, Z.; Ren, H.; Ning, H.; Zhou, S.; Long, Z.; Huang, K. Analysis of Flow Field in a Blast Simulator Combined-Driven by Explosive Charge and Compressed Gas. Front. Earth Sci. 2023, 10, 1094415. [Google Scholar] [CrossRef]
- Kong, X.; Zhou, H.; Zheng, C.; Liu, H.; Wu, W.; Guan, Z.; Dear, J.P. An Experimental Study on the Mitigation Effects of Fine Water Mist on Confined-Blast Loading and Dynamic Response of Steel Plates. Int. J. Impact Eng. 2019, 134, 103370. [Google Scholar] [CrossRef]
- Luketa-Hanlin, A. A Review of Large-Scale LNG Spills: Experiments and Modeling. J. Hazard. Mater. 2006, 132, 119–140. [Google Scholar] [CrossRef]
- Nubli, H.; Sohn, J.M. Procedure for Determining Design Accidental Loads in Liquified-Natural-Gas-Fuelled Ships under Explosion Using a Computational-Fluid-Dynamics-Based Simulation Approach. Ships Offshore Struct. 2022, 17, 2254–2271. [Google Scholar] [CrossRef]
- Li, J.; Huang, Z. Fire and Explosion Risk Analysis and Evaluation for LNG Ships. Procedia Eng. 2012, 45, 70–76. [Google Scholar] [CrossRef]
- Nubli, H.; Fajri, A.; Prabowo, A.R.; Sohn, J.M. CFD Implementation to Mitigate the LNG Leakage Consequences: A Review of Explosion Accident Calculation on LNG-Fueled Ships. Procedia Struct. Integrity. 2022, 41, 343–350. [Google Scholar] [CrossRef]
- Zheng, Q.G.; Wu, W.Q.; Song, M. Study of Gas Fuel Leakage and Explosion in the Engine Room of a Small Lng-Fueled Ship. Int. J. Marit. Eng. 2019, 161, 1096. [Google Scholar] [CrossRef]
- Nubli, H.; Sohn, J.M. CFD Gas Explosion Simulation on LNG-Fueled Ship. In Proceedings of the OMAE2021, Virtual Events, 21–30 June 2021; Volume 2: Structures, Safety, and Reliability. [Google Scholar]
- Sun, B.; Guo, K.; Pareek, V.K. Dynamic Simulation on Deflagration of LNG Spill. J. Combust. 2019, 2019, 7439589. [Google Scholar] [CrossRef]
- Gao, Y.; Yang, B.; Zhu, H.; Peng, G.; Zhang, Z.; Pan, G. Numerical Simulation of Flow Induced Vibration of Two Rigidly Connected Cylinders in Different Arrangements. Ships Offshore Struct. 2022, 17, 1142–1158. [Google Scholar] [CrossRef]
- Li, G.; Shi, D.; Wang, L.; Zhao, K.; Helal, W.M.K. Numerical Study on Structural Damage Characteristics under Long Pulse Width of Underwater Nuclear Explosions. Ships Offshore Struct. 2023, 18, 1746–1754. [Google Scholar] [CrossRef]
- Liu, K.; Lu, Y.; Wang, Z.; Wang, G. An Experimental, Numerical and Analytical Study on Deformation Mechanisms of Web Girders in a Collision or Grounding Incident. Ships Offshore Struct. 2019, 14, 839–852. [Google Scholar] [CrossRef]
- Zhang, S.; Guo, X.; Gan, X.; Gong, C.; Yang, W.; Li, C. Numerical study of detonation shock with partitioned fluid-structure interaction simulations. Acta Aerodyn. Sin. 2022, 40, 163–172. [Google Scholar] [CrossRef]
- Shehu, E.; Lomazzi, L.; Giglio, M.; Manes, A. Computational Modeling of Confined Blast Waves with Focus on Interaction with Structures. IOP Conf. Ser. Mater. Sci. Eng. 2023, 1275, 012028. [Google Scholar] [CrossRef]
- Wu, J.; Sun, Z.; Jiang, Y.; Zhang, G.; Sun, T. Experimental and Numerical Study of Slamming Problem for a Trimaran Hull. Ships Offshore Struct. 2021, 16, 46–53. [Google Scholar] [CrossRef]
- Heylmun, J.; Vonk, P.; Brewer, T. Blastfoam Theory and User Guide; Synthetik Applied Technologies: Austin, TX, USA, 2019. [Google Scholar]
- Zheng, H.; Shu, C.; Chew, Y.-T. An Object-Oriented and Quadrilateral-Mesh Based Solution Adaptive Algorithm for Compressible Multi-Fluid Flows. J. Comput. Phys. 2008, 227, 6895–6921. [Google Scholar] [CrossRef]
- Zheng, H.W.; Shu, C.; Chew, Y.T.; Qin, N. A Solution Adaptive Simulation of Compressible Multi-Fluid Flows with General Equation of State. Int. J. Numer. Methods Fluids 2011, 67, 616–637. [Google Scholar] [CrossRef]
- Edri, I.; Savir, Z.; Feldgun, V.R.; Karinski, Y.S.; Yankelevsky, D.Z. On Blast Pressure Analysis Due to a Partially Confined Explosion: I. Experimental Studies. Int. J. Prot. Struct. 2011, 2, 1–20. [Google Scholar] [CrossRef]
- Yang, B.; Wang, D. Dynamic Ultimate Hull Girder Strength Analysis on a Container Ship under Impact Bending Moments. Int. J. Offshore Polar Eng. 2018, 28, 105–111. [Google Scholar] [CrossRef]
- Liu, H.-H.; Rutqvist, J.; Berryman, J.G. On the Relationship between Stress and Elastic Strain for Porous and Fractured Rock. Int. J. Rock Mech. Min. Sci. 2009, 46, 289–296. [Google Scholar] [CrossRef]
- Jeremić, R.; Bajić, Z. An Approach to Determining the TNT Equivalent of High Explosives. Sci. Tech. Rev. 2006, 56, 58–62. [Google Scholar]
- Shakor, Z.M.; AbdulRazak, A.A.; Sukkar, K.A. A Detailed Reaction Kinetic Model of Heavy Naphtha Reforming. Arab J. Sci. Eng. 2020, 45, 7361–7370. [Google Scholar] [CrossRef]
- Salakhi, M.; Eghtesad, A.; Afshin, H. Heat and Mass Transfer Analysis and Optimization of Freeze Desalination Utilizing Cold Energy of LNG Leaving a Power Generation Cycle. Desalination 2022, 527, 115595. [Google Scholar] [CrossRef]
- Acosta Patrick, F. Overview of UFC 3-340-02 Structures to Resist the Effects of Accidental Explosions. In Proceedings of the Structures Congress 2011, Las Vegas, NV, USA, 14–16 April 2011; Structural Engineering Institute of ASCE: Reston, VA, USA, 2012; pp. 1454–1469, ISBN 978-0-7844-1171-1. [Google Scholar]
- Karzova, M.M.; Khokhlova, V.A.; Salze, E.; Ollivier, S.; Blanc-Benon, P. Mach Stem Formation in Reflection and Focusing of Weak Shock Acoustic Pulses. J. Acoust. Soc. Am. 2015, 137, EL436–EL442. [Google Scholar] [CrossRef]
- Rigby, S.E.; Fay, S.D.; Tyas, A.; Warren, J.A.; Clarke, S.D. Angle of Incidence Effects on Far-Field Positive and Negative Phase Blast Parameters. Int. J. Prot. Struct. 2015, 6, 23–42. [Google Scholar] [CrossRef]
- Matsagar, V.; Goel, M.D. Blast Resistant Design of Structures. Pract. Period. Struct. Des. Constr. 2014, 19, 04014007. [Google Scholar] [CrossRef]
- Lee Perry, W.; Clements, B.; Ma, X.; Mang, J.T. Relating Microstructure, Temperature, and Chemistry to Explosive Ignition and Shock Sensitivity. Combust. Flame 2018, 190, 171–176. [Google Scholar] [CrossRef]
- Luo, Z.; Li, R.; Wang, T.; Cheng, F.; Liu, Y.; Yu, Z.; Fan, S.; Zhu, X. Explosion Pressure and Flame Characteristics of CO/CH4/Air Mixtures at Elevated Initial Temperatures. Fuel 2020, 268, 117377. [Google Scholar] [CrossRef]

Disclaimer/Publisher’s Note: The statements, opinions and data contained in all publications are solely those of the individual author(s) and contributor(s) and not of MDPI and/or the editor(s). MDPI and/or the editor(s) disclaim responsibility for any injury to people or property resulting from any ideas, methods, instructions or products referred to in the content. |
© 2025 by the authors. Licensee MDPI, Basel, Switzerland. This article is an open access article distributed under the terms and conditions of the Creative Commons Attribution (CC BY) license (https://creativecommons.org/licenses/by/4.0/).