
Research on Sequential Decision-Making of Major Accidents with Incomplete Information

Abstract
1. Introduction
2. Evidence Set Construction of Major Accidents
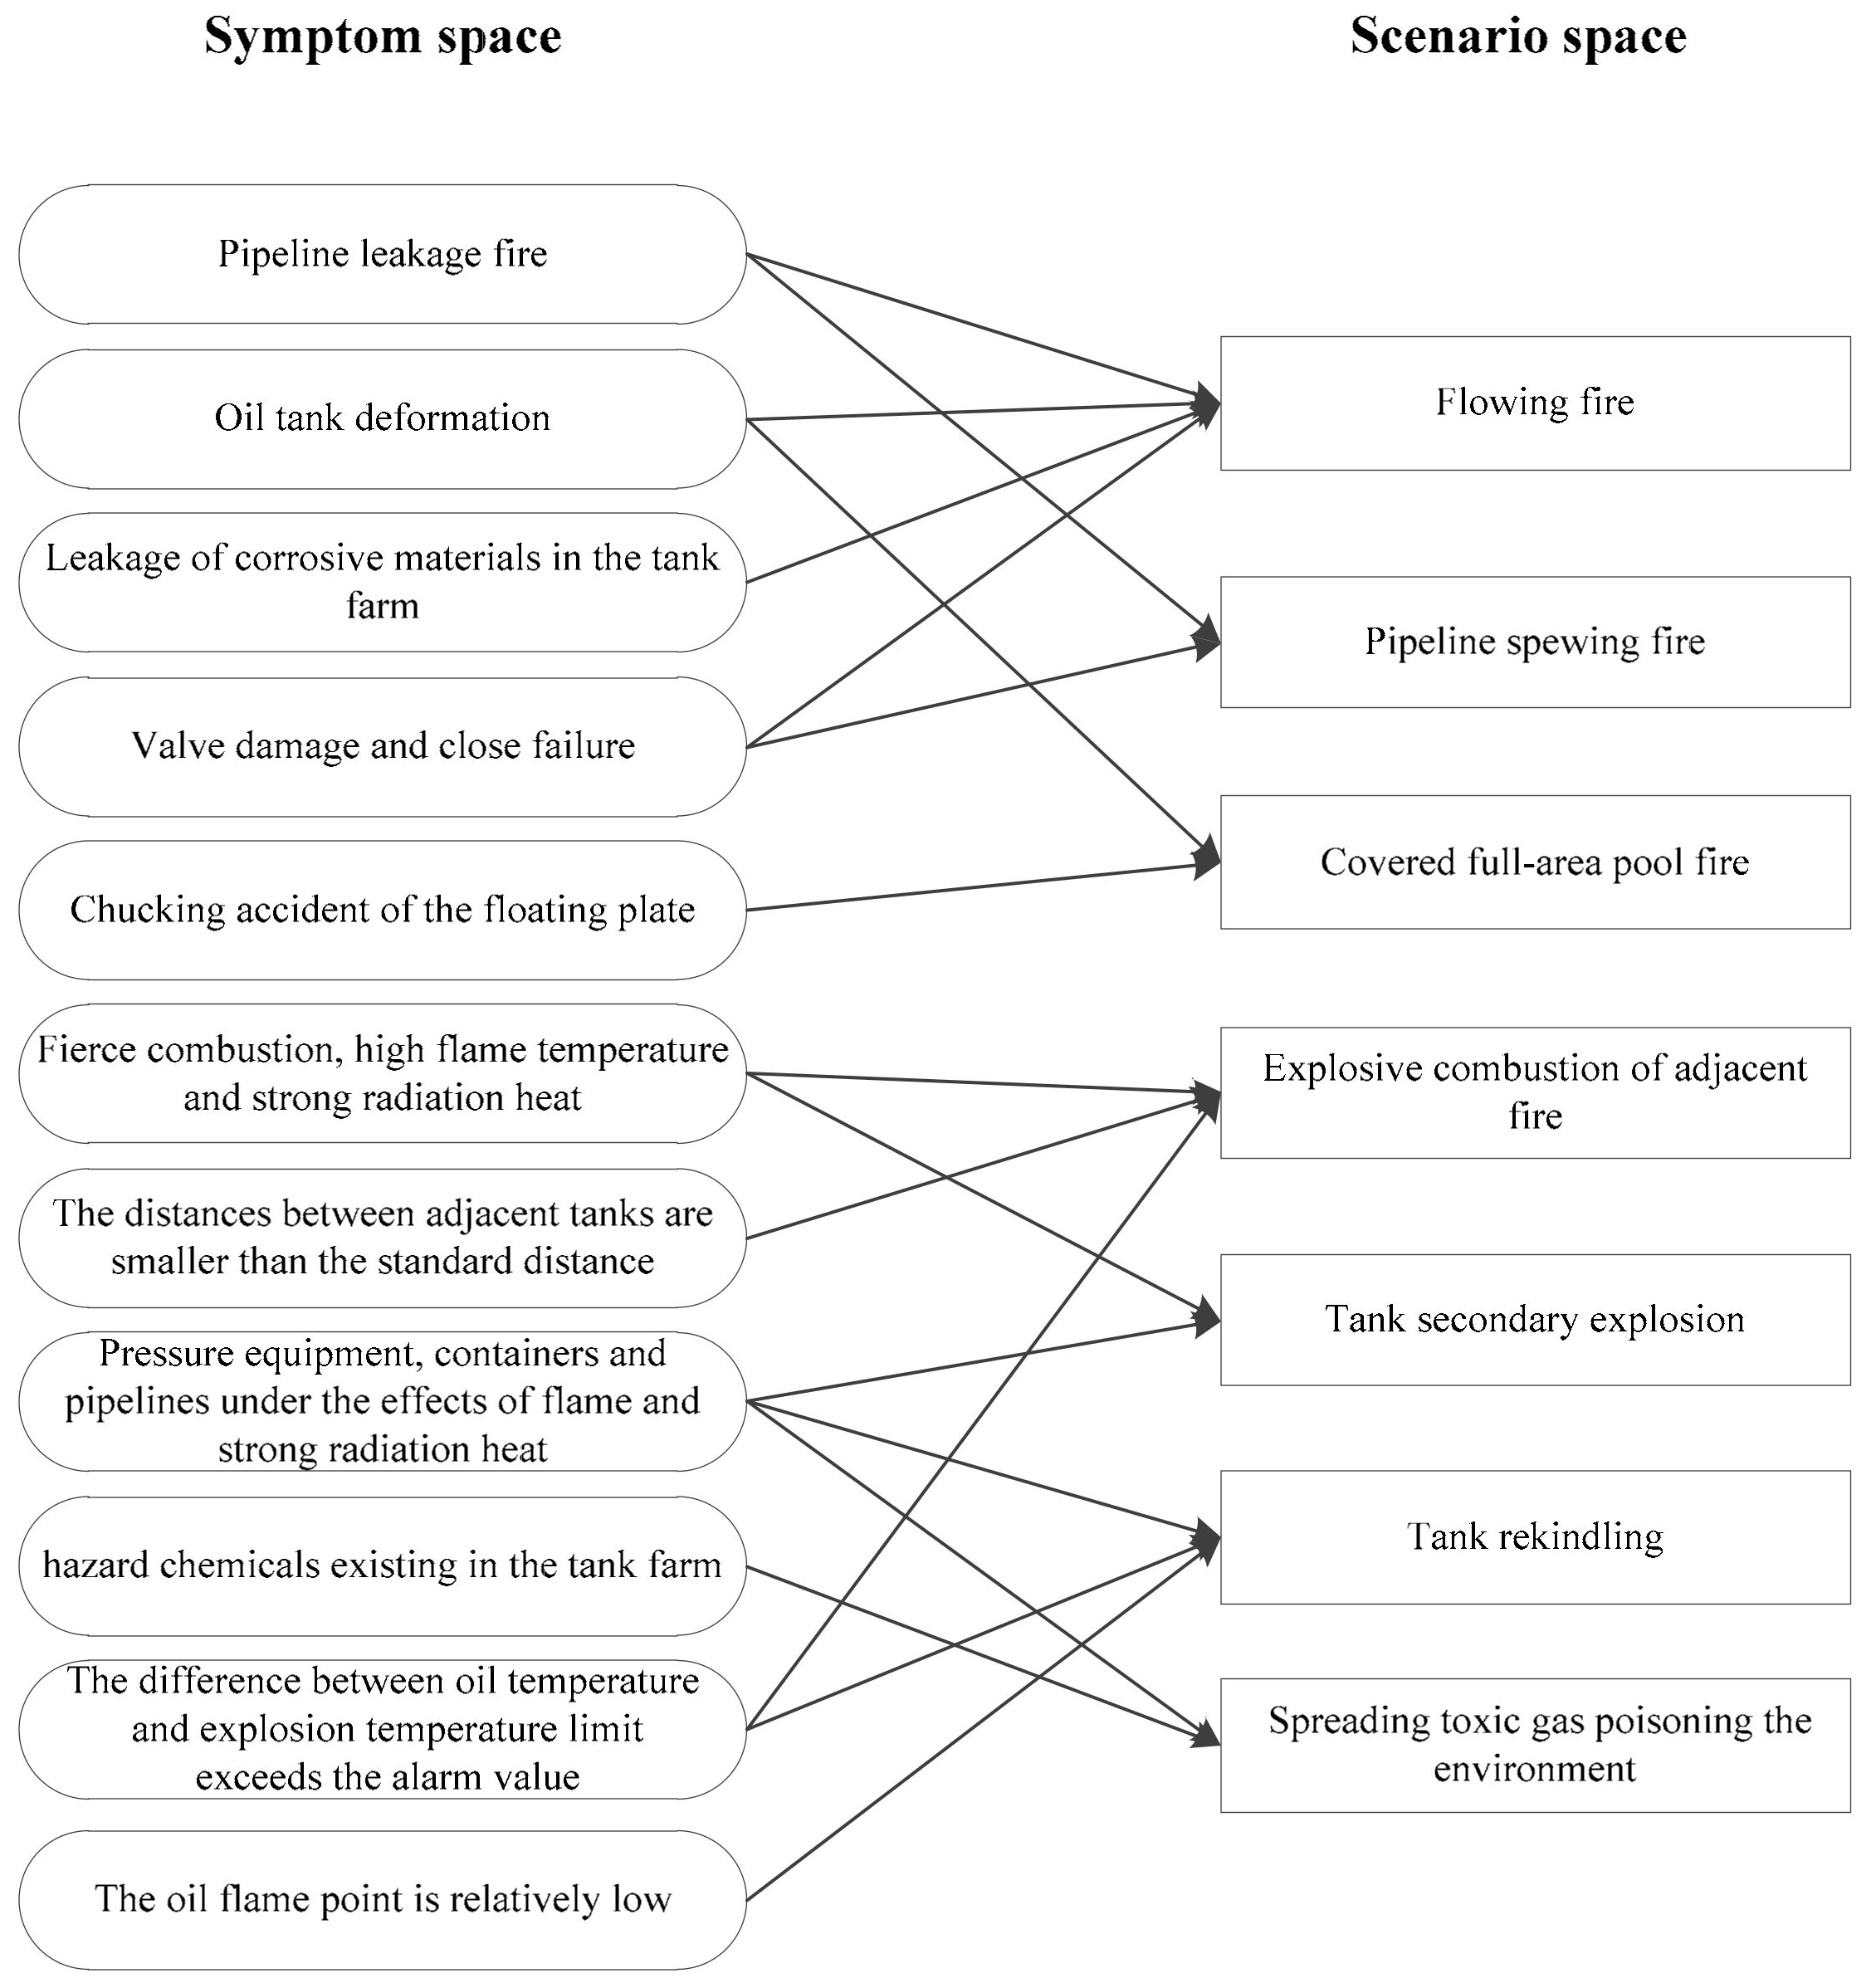
2.1. Definition of Key Accident Scenarios and Symptoms
2.2. Construction Methods of Major Accident Evidence Sets
2.3. Construction of Accident Scenario Evidence Sets—Taking an Oil Tank Fire as an Example
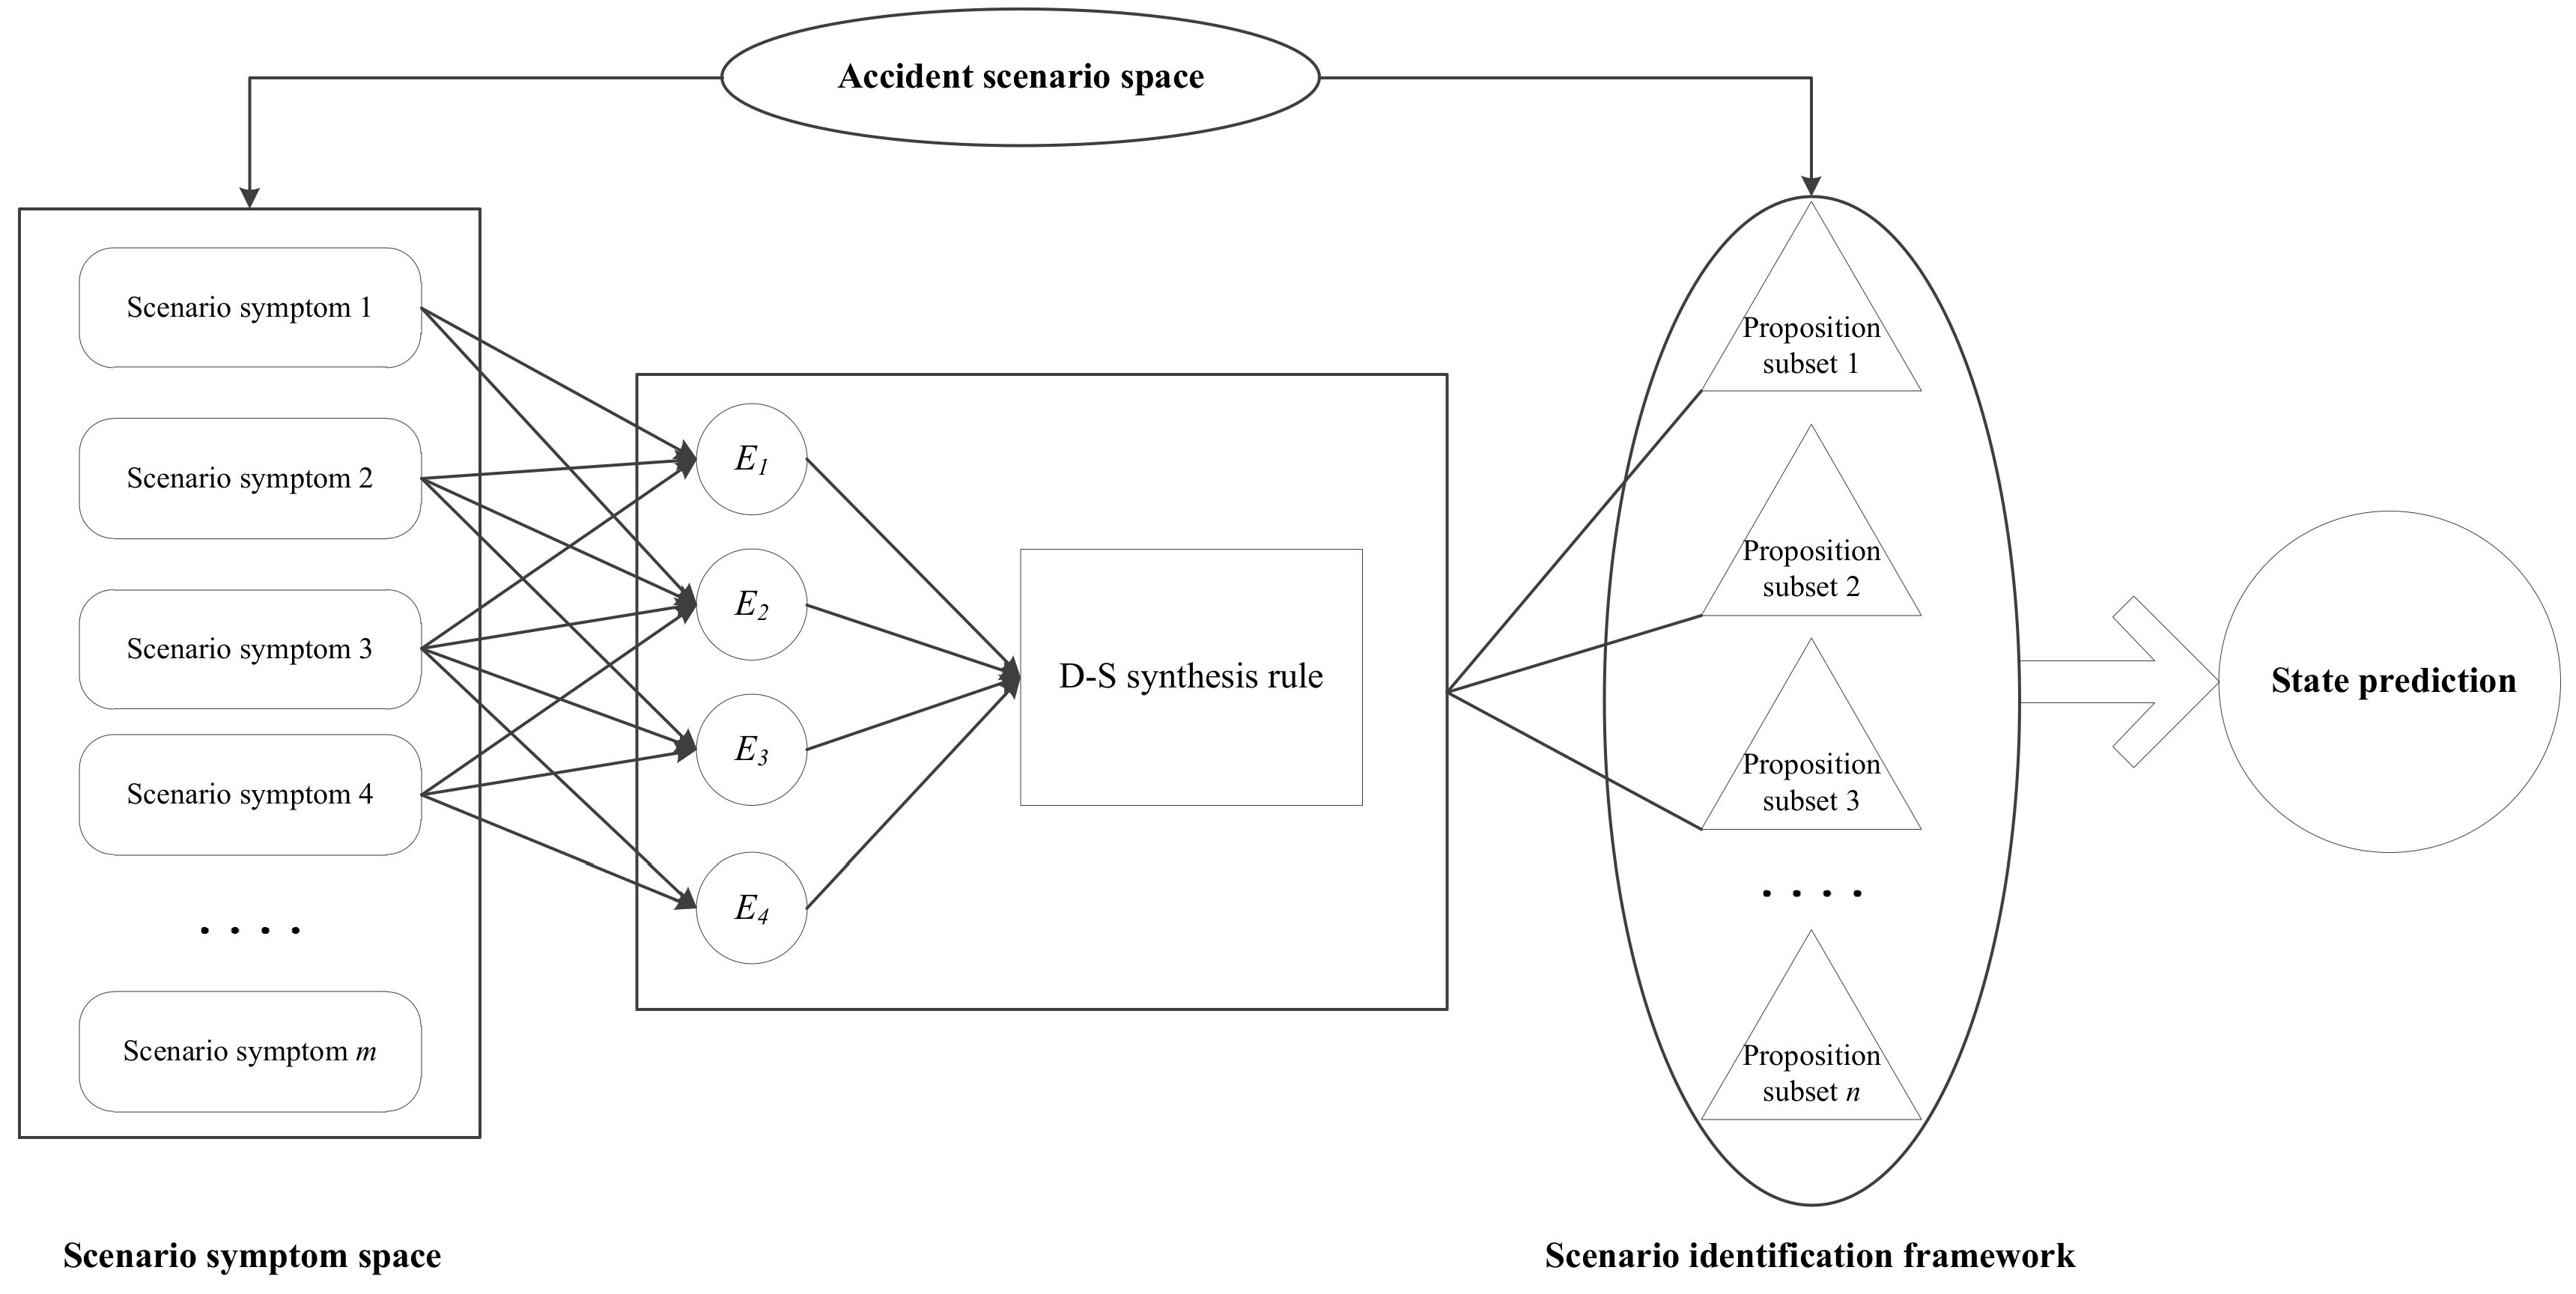
3. Situation Predictions of Major Accidents
3.1. D-S Evidence Theory
3.2. Situation Prediction Method Based on D-S Evidence Theory
4. Sequential Decision-Making in Major Accidents
4.1. Sequential Decision-Making
4.2. Generation Method of Sequential Decision-Making Schemes
5. Methods of On-Site Emergency Decision-Making in Major Accidents
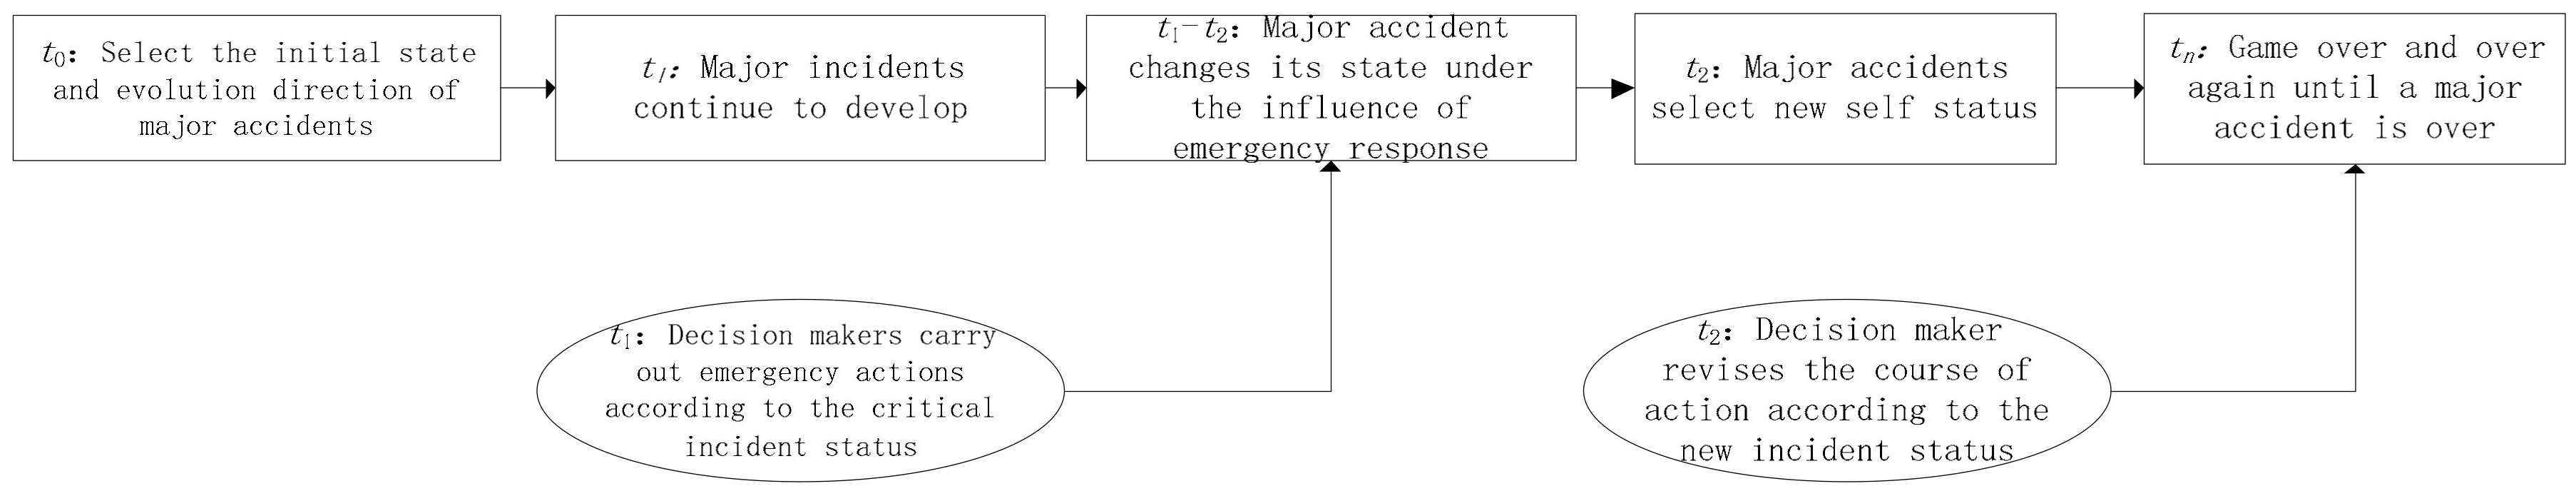
5.1. Analysis of On-Site Game Processes of Major Accidents
5.2. Emergency Decision-Making Processes of Major Accidents
- (1)
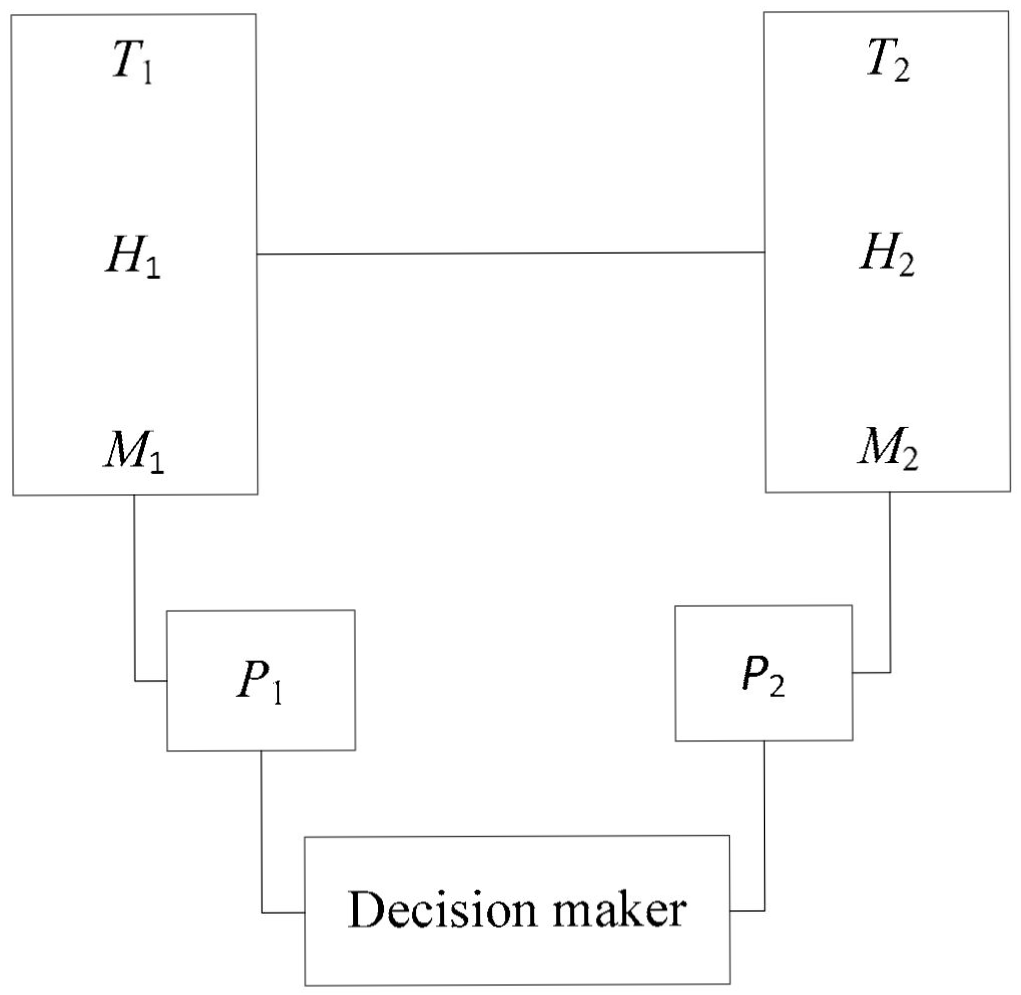
- At the initial moment, the decision-maker is informed of the occurrence of a major accident, and at this very moment, the decision-maker needs to make a judgment with almost no information. Additionally, the decision-maker needs to extract useful information from a brief description of the accident state, compare historical cases, assume the on-site accident situation, and formulate a solution scheme. Assume that there occurs a chemical accident. Firstly, according to the accident evolution situation, it is assumed that the state of the accident scene could be one of four states, namely T1, T2, T3, and T4, which are briefly described as follows:
- T1:
- A major danger is about to happen on the scene,
- T2:
- Temporarily, there is no major danger risk at the scene of the accident,
- T3:
- The accident state tends to stabilize,
- T4:
- The accident gradually vanishes.
- P1:
- Continuously observe the state of the disaster and prevent casualties.
- P2:
- Take all necessary measures to control the accident in a stable state.
- P3:
- Launch an all-out attack to make the accident gradually vanish.
- P4:
- Go to the accident site to deal with the accident.
- (2)
- With data obtained from the accident database or historical cases, a profit and loss matrix and an accident loss probability distribution table should be created. Assume that the cost of information collection at each stage is one unit (Ck = 1, k = 1, 2, …, N), and the sample spaces represent the degrees of losses caused by accident, namely, I1 (particularly serious), I2 (serious), I3 (relatively serious), and I4 (general serious). Based on the field situation, the accident states and the benefits and losses caused by the corresponding solution schemes are listed in Table 3.
- (3)
- A first round of decision-making is initiated, and decision-making losses of those four schemes of P1, P2, P3, and P4 corresponding to four accident states of T1, T2, T3, and T4 are calculated, respectively. By comparing these decision-making losses with calculated results of decision-making loss functions, the decision-maker needs to decide when and which solution scheme should be adopted and simultaneously start the first-round information collection. During the information collection process, with sufficient key accident scenarios and accident scenario symptoms obtained, the decision-maker needs to judge the current accident state and use the situation prediction model based on the D-S evidence theory to predict the next-stage accident state. Based on the situation prediction results, the decision-maker should calculate the anticipated decision loss at the next stage and compare the calculated result of the decision loss function at the current stage with the calculated result of the anticipated decision loss function to make the emergency decision for the current stage.
- (4)
- Step (3) should be repeated until the accident completely vanishes.
- (5)
- Application example: The emergency decision-making of key accident scenarios of the “P.X. project explosion accident in Zhangzhou, China, on 6 April” was taken as an example.
- Scheme P1: = 0 × 0.25 + 150 × 0.25 + 200 × 0.25 + 250 × 0.25 = 150
- Scheme P2: = 162
- Scheme P3: = 212.5
- Scheme P4: = 300
- Scheme P1: = 148.65
- Scheme P2: = 165.9
- Scheme P3: = 215.4
- Scheme P4: = 298.9
- Additionally, = = 148.65.
6. Conclusions
Author Contributions
Funding
Institutional Review Board Statement
Informed Consent Statement
Data Availability Statement
Acknowledgments
Conflicts of Interest
References
- Fan, W.C. Advisement and suggestions to scientific problems of emergency management for public incidents. Bull. Natl. Nat. Sci. Found. China 2007, 2, 71–76. [Google Scholar]
- Liu, X.Q. Research on Assistant Decision-Making Method for Railway Emergency Management. Ph.D. Thesis, China Academy of Railway Sciences, Beijing, China, 2017. [Google Scholar]
- Liu, X.H.; Shen, H.Z. Fuzzy multi-attribute decision making of internet public opinion emergencies based on degree of synergetic. Shanghai Manag. Sci. 2021, 6, 103–109. [Google Scholar]
- Li, B.D.; Lv, J.; Li, J. An Emergency Response Decision-Making Method for Emergency Events Based on Prospect Theory and Probabilistic Linguistic Terms. J. Syst. Manag. 2023, 6, 1164–1175. [Google Scholar]
- Xu, X.H.; Liu SL Chen, X.H. Dynamic Adjustment Method of Emergency Decision Scheme for Major Incidents Based on Big Data Analysis of Public Preference. Oper. Res. Manag. Sci. 2020, 7, 41–51. [Google Scholar]
- Wu, H. Research on Group Decision with Expert Preference for Earthquake Emergency Rescue Based on D-S Evidence Theory; Wuhan University of Technology: Wuhan, China, 2021. [Google Scholar]
- Ding, J.Y.; Wang, Z.F.; Guo, G.X. Emergency Decision Making for Urban Heavy Rainfall Flooding Based on Bayesian and Dynamic Game Analysis. Stat. Decis. 2012, 23, 26–29. [Google Scholar]
- Xu, X.H.; Wang, L.L.; Chen, X.H.; Liu, B. Large group emergency decision-making method with linguistic risk appetites based on criteria mining. Knowl.-Based Syst. 2019, 182, 104849. [Google Scholar] [CrossRef]
- Xu, X.H.; Zhang, Q.H.; Chen, X.H. Consensus-based non-cooperative behaviors management in large-group emergency decision-making considering experts’ trust relations and preference risks. Knowl.-Based Syst. 2020, 190, 105–108. [Google Scholar] [CrossRef]
- Song, Y. Research on the Emergency Decision-Making of Disasters in Smart City Based on Dynamic Game Theory. Ph.D. Thesis, Tianjin University, Tianjin, China, 2017. [Google Scholar]
- Wang, D.; Wan, K.; Ma, W. Emergency decision-making model of environmental emergencies based on case-based reasoning method. J. Environ. Manag. 2020, 262, 110382. [Google Scholar] [CrossRef] [PubMed]
- Li, Q.; Liu, W.; Guan, M.Z.; Du, Y.; Sun, H. Modeling and analysis of emergency decision making based on logical probability game. Comput. Sci. 2022, 4, 294–301. [Google Scholar]
- Liu, Y. Study on the Off-Site Emergency Decision-Making of Nuclear Accident in Nuclear Power Plant Based on Dynamic Game Theory. Master’s Thesis, University of South China, Hengyang, China, 2020. [Google Scholar]
- Ishola, F.; Oladokun, V.; Petinrin, O.; Olatunji, O.; Akinlabi, S. A Mathematical Model and Application for Fire Risk Management in Commercial Complexes in South Africa. Results Eng. 2020, 7, 100145. [Google Scholar] [CrossRef]
- Sarkheil, H. Risk and Incident Analysis on Key Safety Performance Indicators and Anomalies Feedback in South Pars Gas Complex. Results Eng. 2021, 9, 100210. [Google Scholar] [CrossRef]
- Meng, Y.W.; Zhang, X.Y.; Qing, G.Y.; Wang, Y.H.; Luo, J.Q. Analysis of Influencing Factors of Expressway Accident Consequences based on binomial Logistic regression analysis model. J. Wuhan Univ. Technol. (Transp. Sci. Eng.) 2022, 1, 12–16. [Google Scholar]
- Li, Y.; Wang, Y.J.; Yang, Z.N. Fire risk assessment of public buildings based on D-S evidence theory. J. North China Univ. Sci. Technol. 2022, 1, 124–128. [Google Scholar]
- Chen, X.; Wang, Y.; Wu, L.Y.; Yan, G.Y.; Zhu, W. Emergency decision model with multiple stages, multipleobjectives, and multidivisional cooperation. Syst. Eng.-Theory Pract. 2010, 11, 1977–1985. [Google Scholar]
- Zhang, Q.; Huang, Z.; Wang, G. A novel sequential three-way decision model with autonomous error correction. Knowl.-Based Syst. 2021, 212, 106526–106534. [Google Scholar] [CrossRef]
- Zhang, Q.; Pang, G.; Wang, G. A novel sequential three-way decisions model based on penalty function. Knowl.-Based Syst. 2019, 192, 105350–105357. [Google Scholar] [CrossRef]
- Zhang, Y.; Guo, H.M.; Zhao, Z.; Chen, W.F.; Shen, Y. Phased Dynamic Decision-making Method for Earthquake Emergency Based on Sequential Game and Bayesian Theory. Earthq. Res. China 2022, 2, 260–269. [Google Scholar]
- Xia, Y. Research on Emergency Decision-Making for Unconventional Disasters and Accidents Based on Scenario-Response. Ph.D. Thesis, Beijing Institute of Technology, Beijing, China, 2015. [Google Scholar]
- Kulba, V.; Bakhtadze, N.; Zaikin, O.; Shelkov, A.; Chernov, I. Scenario analysis of management processes in the prevention and the elimination of consequences of man-made disasters. Procedia Comput. Sci. 2017, 112, 2066–2075. [Google Scholar] [CrossRef]
- Li, S.M.; Chen, S.; Liu, Y. A Method of Emergent Event Evolution Reasoning Based on Ontology Cluster and Bayesian Network. IEEE Access 2019, 7, 15230–15238. [Google Scholar] [CrossRef]


| Symptom Space | B | S.E. | Wals | df | Sig | Exp (B) | EXP (B) 95% C.I. | |
|---|---|---|---|---|---|---|---|---|
| Lower Limit | Upper Limit | |||||||
| Pipeline leakage fire | 0.917 | 22,670.964 | 0 | 1 | 0.290 | 2.358 | 0 | |
| Oil tank deformation | 1.414 | 0.826 | 2.928 | 1 | 0.087 | 4.114 | 0.814 | 20.783 |
| Leakage of corrosive materials in the tank farm | 1.088 | 0.915 | 1.413 | 1 | 0.034 | 2.967 | 0.494 | 17.829 |
| Valve damage and close failure | 0.006 | 0.911 | 0 | 1 | 0.045 | 1.006 | 0.169 | 5.999 |
| Constant | 19.157 | 22,670.964 | 0 | 1 | 0.999 | 208,919,956.9 | ||
| Accident Scenario Space | Scenario Symptom Space | Sig Value | Exp (B) Value | Basic Probability |
|---|---|---|---|---|
| Flowing fire (S1) | Pipeline leakage fire | 0.29 | 2.358 | 0.702 |
| Oil tank deformation | 0.087 | 4.114 | 0.815 | |
| Leakage of corrosive materials in the tank farm | 0.034 | 2.967 | 0.748 | |
| Valve damage and close failure | 0.045 | 1.006 | 0.501 | |
| Pipeline spewing fire (S2) | Pipeline leakage fire | 0.047 | 1.875 | 0.652 |
| Valve damage and close failure | 0.054 | 2.385 | 0.705 | |
| Hidden dead corner fire (S3) | Oil tank deformation | 0.025 | 8.222 | 0.892 |
| Chucking accident of the floating plate | 0.033 | 4.760 | 0.826 | |
| Explosive combustion of adjacent tank (S4) | Fierce combustion, high flame temperature, and strong radiant heat | 0.407 | 2.131 | 0.681 |
| Difference between oil temperature and explosion temperature limit exceeds the alarm value | 0.069 | 6.292 | 0.863 | |
| Distances between adjacent tanks are smaller than the standard distance | 0.079 | 3.171 | 0.760 | |
| Tank secondary explosion (S5) | Fierce combustion, high flame temperature, and strong radiant heat | 0.041 | 3.867 | 0.795 |
| Pressure equipment under the effects of flame and strong radiation heat | 0.046 | 2.529 | 0.717 | |
| Not favorable wind direction for the on-site firefighting and rescue activity | 0.026 | 4.909 | 0.831 | |
| Tank rekindling (S6) | Difference between oil temperature and explosion temperature limit exceeds the alarm value | 0.195 | 3.415 | 0.773 |
| The oil flame point is relatively low | 0.039 | 1.529 | 0.605 | |
| Not favorable wind direction for the on-site firefighting and rescue activity | 0.042 | 1.199 | 0.528 | |
| Spreading toxic gas, poisoning the environment (S7) | Hazardous chemicals existing in the tank farm | 0.055 | 2.830 | 0.739 |
| Not favorable wind direction for the on-site firefighting and rescue activity | 0.058 | 3.427 | 0.774 |
| Accident State | |||||||||
|---|---|---|---|---|---|---|---|---|---|
| T1 | T2 | T3 | T4 | ||||||
| Benefit | Loss | Benefit | Loss | Benefit | Loss | Benefit | Loss | ||
| Solution scheme | P1 | 100 | 0 | −50 | 150 | −100 | 200 | −150 | 250 |
| P2 | −200 | 300 | 100 | 0 | −50 | 150 | −100 | 200 | |
| P3 | −300 | 400 | −200 | 300 | 100 | 0 | −50 | 150 | |
| P4 | −400 | 500 | −300 | 400 | −200 | 300 | 100 | 0 | |
| T1 | T2 | T3 | T4 | |
|---|---|---|---|---|
| I1 | 0.6 | 0.2 | 0.15 | 0.05 |
| I2 | 0.2 | 0.6 | 0.2 | 0.15 |
| I3 | 0.15 | 0.2 | 0.6 | 0.2 |
| I4 | 0.05 | 0.15 | 0.2 | 0.6 |
| Time | Key Accident Scenario Symptoms |
|---|---|
| 19:03, 6 April | The adsorption and separation device of aromatic hydrocarbon exploded, and the No. 607, No. 608, and No. 610 tanks cracked and burned fiercely, with a high flame temperature and strong radiation heat. The explosive combustion led to the leakage fires of some pipelines. |
| 23:40, 6 April | A fire broke out in the main power station of the coal-fired power generation facility in the south of the factory. |
| 02:50, 7 April | The rubber sealing ring on top of the No. 102 external floating roof tank caught fire. |
| 09:50, 7 April | The fire of the No. 607 tank was extinguished, and at about 10:25, the fire of the No. 608 tank was put out. |
| 11:30, 7 April | The No. 608 oil tank was rekindled. |
| 17:05, 7 April | The open flame of the No. 610 burning tank was completely extinguished. By 19:00, the wall temperatures of the No. 607, No. 608, and No. 610 tanks were 21 °C, 24 °C, and 24 °C, respectively. The top temperature of the No. 610 tank was 60 °C, and the temperature of each tank dropped rapidly. |
| 19:40, 7 April | The oil surface of the No. 610 tank was rekindled. |
| Key Accident Symptom | Key Accident Scenario | Probability Distribution Function | Calculated Probability |
|---|---|---|---|
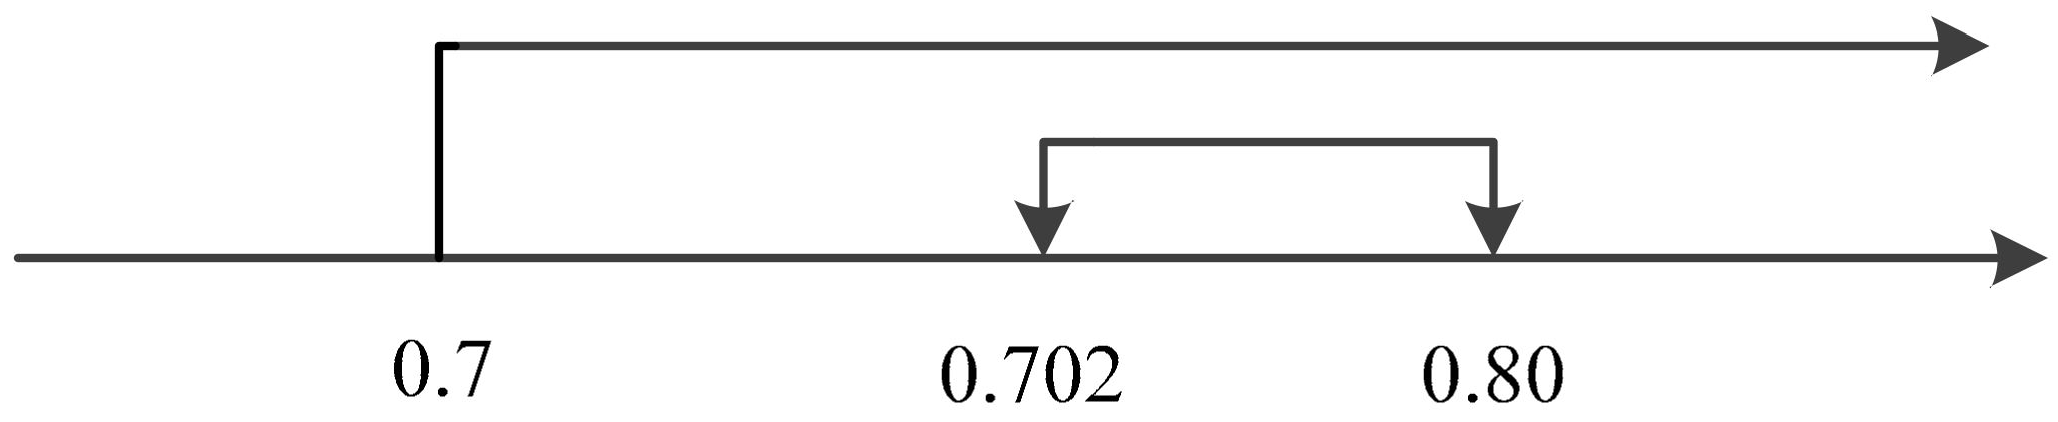
| Pipeline leakage fire | Flowing fire, S1 | (0.702, 0.80) | (0.1) |
| Pipeline spewing fire, S2 | (0.652, 0.90) | (0.19, 0.81) | |
| Fierce combustion, high flame temperature, and strong radiation heat | Explosive combustion of adjacent tank, S4 | (0.1362, 0.980) | (0.67, 0.33) |
| Tank secondary explosion, S5 | (0.0795, 0.980) | (0.1) |
| Key Accident Symptom | Key Accident Scenario | Probability Distribution Function | Threshold Analysis Result |
|---|---|---|---|
| Not favorable wind direction for the on-site firefighting and rescue activity | Tank secondary explosion, S5 | (0.415, 0.682) | (1.0) |
| Tank rekindling, S6 | (0.626, 0.95) | (0.23, 0.77) | |
| The oil flame point is relatively low | Spreading toxic gas, poisoning the environment, S7 | (0.619, 0.728) | (0.47, 0.53) |
Disclaimer/Publisher’s Note: The statements, opinions and data contained in all publications are solely those of the individual author(s) and contributor(s) and not of MDPI and/or the editor(s). MDPI and/or the editor(s) disclaim responsibility for any injury to people or property resulting from any ideas, methods, instructions or products referred to in the content. |
© 2024 by the authors. Licensee MDPI, Basel, Switzerland. This article is an open access article distributed under the terms and conditions of the Creative Commons Attribution (CC BY) license (https://creativecommons.org/licenses/by/4.0/).
Share and Cite
Xia, D.; Chen, C.; Zheng, C.; Xin, J.; Zhu, Y. Research on Sequential Decision-Making of Major Accidents with Incomplete Information. Fire 2024, 7, 49. https://doi.org/10.3390/fire7020049
Xia D, Chen C, Zheng C, Xin J, Zhu Y. Research on Sequential Decision-Making of Major Accidents with Incomplete Information. Fire. 2024; 7(2):49. https://doi.org/10.3390/fire7020049
Chicago/Turabian StyleXia, Dengyou, Changlin Chen, Ce Zheng, Jing Xin, and Yi Zhu. 2024. "Research on Sequential Decision-Making of Major Accidents with Incomplete Information" Fire 7, no. 2: 49. https://doi.org/10.3390/fire7020049
APA StyleXia, D., Chen, C., Zheng, C., Xin, J., & Zhu, Y. (2024). Research on Sequential Decision-Making of Major Accidents with Incomplete Information. Fire, 7(2), 49. https://doi.org/10.3390/fire7020049