Article

Experimental Study on Temperature Distribution Characteristics Under Coordinated Ventilation in Underground Interconnected Tunnels

Institute of Disaster Prevention Science and Safety Technology, Central South University, Changsha 410075, China
*
Author to whom correspondence should be addressed.
Fire 2025, 8(3), 110; https://doi.org/10.3390/fire8030110
Submission received: 27 February 2025 / Revised: 10 March 2025 / Accepted: 10 March 2025 / Published: 13 March 2025
(This article belongs to the Special Issue Fire Detection and Public Safety, 2nd Edition)

Abstract

Underground interconnected tunnels typically have a large curvature and multiple branching structures, which pose a higher fire risk than traditional single-tube tunnels. In this paper, experiments were performed on a reduced-scale tunnel to study the characteristics of temperature distribution and smoke propagation under coordinated ventilation. A total of 318 experimental cases were conducted, systematically varying fire location, ventilation scheme, and fire power. The results show that an increased heat release rate (HRR) significantly elevates both the maximum temperature ( Δ T max ) and smoke spread range. The influence of ventilation on Δ T max and smoke spread varies depending on fire locations. When fire occurs at the intersection of two tunnel central axes, increasing the velocity in either the branch tunnel (v1) or main tunnel (v2) reduces Δ T max and smoke spread in tunnels. When fire occurs inside the branch tunnel, the main tunnel airflow obstructs downstream smoke movement, leading to a higher Δ T max and expanded smoke spread upstream of the branch tunnel. A prediction model for Δ T max under cooperative ventilation in underground interconnected tunnels was established, accounting for variations in fire position and the HRR. Meanwhile, the temperature distribution upstream of the branch tunnel was studied, revealing that the HRR has minimal impact on it. When fire occurs outside of the branch tunnel, v2 significantly affects temperature attenuation within the branch tunnel. When fire occurs at the branch tunnel entrance or inside, v2 has less effect. Combining the ventilation scheme and the HRR, dimensionless temperature decay models for different fire locations were proposed. These findings offer valuable insights for smoke control in underground interconnected tunnels.

1. Introduction

To meet the requirements of social development and urban construction, tunnel construction is evolving towards diversification, with underground interconnected tunnels becoming prominent. These tunnels are typically located in pivotal urban areas, alleviating traffic congestion and enhancing urban landscapes and environmental quality. Underground interconnected tunnels feature multiple branches and complex configurations of curvature radius and slopes [1], as illustrated in Figure 1. The presence of bifurcation structures leads to complex interaction mechanisms between fire smoke and tunnel ventilation system parameters. In the event of a fire, failure to promptly control and exhaust smoke in time may hinder external firefighting efforts and result in casualties [2,3]. Therefore, it is crucial to study the dispersion characteristics of fire smoke in such tunnels.
The temperature below the ceiling is a crucial parameter for describing the behavior of tunnel fires. It helps in assessing the damage to tunnel structures and electromechanical facilities. Therefore, smoke temperature has been extensively studied by scholars. Alpert [4] first developed a model for predicting the maximum temperature below ceilings during building fires. Subsequent research by various scholars [5,6,7] indicated that this model is also applicable in tunnel fires, as depicted in Equation (1). In natural ventilation conditions, coefficient α ranges from 16.9 to 17.9.
Δ T max = α Q ˙ 2 / 3 H e f 5 / 3
where the Δ T max is the maximum temperature rise below the ceiling, K; Q ˙ is the fire power, kW; H e f is the tunnel effective height, m; and α is the coefficient.
Kurioka et al. [8] developed an formula for predicting the Δ T max based on the Froude number obtained from model-scale experiments. Li et al. [7] discovered that Kurioka’s [8] model is primarily effective in scenarios with low wind speeds, failing to predict accurately under high wind speed scenarios. Drawing on the fire plume theory, they explored the influence of various ventilation speeds and introduced a refined model for predicting Δ T max , as shown in Equation (2).
Δ T max = 17.5 Q ˙ 2 / 3 H 5 / 3 , v * 0.19 Q ˙ v b 1 / 3 H 5 / 3 , v * > 0.19
v * = v / Q ˙ g b ρ 0 c p T 0 1 / 3
where H is the tunnel height, m; v is the longitudinal speed in the tunnel, m/s; v* is the dimensionless longitudinal speed; b is the radius of the fire source, m; g is the gravitational acceleration, m/s2; ρ 0 is the air density, kg/m3; c p is the specific heat capacity of air at constant pressure, kJ/(kg·K); and T0 is the ambient temperature, K.
Subsequent research has explored the effect of multiple parameters on the Δ T max , focusing on variables such as the lateral position of the fire source [5,9,10], tunnel gradient [11,12,13], and longitudinal ventilation [14,15,16]. Researchers have developed predictive models based on these findings.
Research on underground interconnected tunnels has been extensive. Liu et al. [17] took into account the gradients of the mainline and branch tunnels and developed a formula to calculate the Δ T max beneath the tunnel ceiling, as depicted in Equation (4).
Δ T max = 1.05 0.13 ω 17.9 Q ˙ 2 / 3 / H 5 / 3 , ξ < 0 e 0.19 ω 0.05 β e 0.32 ω 17.9 Q ˙ 2 / 3 / H 5 / 3 , ξ 0
where ω represents the gradient of the mainline tunnel after the bifurcation, and ξ represents the gradient of the branch tunnel.
Huang et al. [18] analyzed two ventilation scenarios in bifurcated tunnels: airflow management in the main tunnel before and after the branch. They derived an equation to predict the Δ T max , detailed in Equation (5).
Δ T max T 0 = 6.81 C T Q ˙ * 2 / 3 , v * 0.19 1.71 C T v * 5 / 6 Q ˙ * 2 / 3 , v * > 0.19
where the dimensionless HRR is written as:
Q ˙ * = Q ˙ T 0 c p ρ 0 g H e f 5
where the coefficient CT is obtained through experiments.
Lei et al. [19] preformed tests on the longitudinal temperature decay and the maximum temperature when the fire source was positioned at various longitudinal locations along the mainline of a bifurcated tunnel under natural ventilation conditions. Li et al. [20] investigated the effects of the fire source’s lateral position at the bifurcation on both the flame length and maximum temperature. Tao et al. [21] examined the deviation in maximum temperature and the spread of smoke toward the branch tunnel during coordinated ventilation in underground interconnected tunnels. Chen et al. [22,23] conducted experimental studies on fire and smoke characteristics in a bifurcated tunnel under different ventilation directions.
Delichatsios [24] was the first to propose a formula predicting the temperature decay between two beams in a building fire. Hu et al. [25] subsequently confirmed through theoretical derivation and full-scale experimental validation that the longitudinal temperature distribution in tunnel fire decays exponentially, akin to Delichatsios’s model, as shown in Equation (7).
Δ T x Δ T max = e k x x 0
where x0 is the reference point; x represents the distance from the reference point, m; Δ T x denotes the temperature rise away from reference point x m, K; and k is the decay coefficient.
Utilizing the single exponential decay model as a foundation, researchers have considered various factors such as longitudinal ventilation and centralized smoke extraction, proposing new temperature decay prediction models [5,26,27], as follows.
Δ T x Δ T max = A e k x x 0 / H + B
where A and B are empirical coefficients.
Furthermore, scholars such as Ingason and Li [28], Huang et al. [29], and Gong et al. [30] have demonstrated through various research methods—including full-scale experiments, scaled experiments, and theoretical derivations based on thermal balance equations—that temperature decay in tunnels can be described in a double-exponential form.
Δ T x Δ T max = C e k 1 x x 0 / H + D e k 2 x x 0 / H
where C and D are empirical coefficients, and k1 and k2 are decay coefficients.
In summary, the smoke temperature distribution in tunnels could be described using three types of exponential functions. The influence of factors like ventilation mode, tunnel gradient, and bifurcation structure manifests in the variations in the coefficients within these models.
Underground interconnected tunnels feature multiple branches and variable traffic flow, which necessitate coordinated ventilation across various segments to manage smoke effectively. Prior studies have predominantly concentrated on ventilation in single-tube tunnels, with scant attention paid to smoke spread characteristics under coordinated ventilation in interconnected systems. This study accounted for real fire scenarios by establishing four different fire source positions. The temperature distribution and smoke spread characteristics within the tunnel under cooperative ventilation are investigated. The variation patterns of smoke dispersion with ventilation at different fire locations is clarified. The findings provide valuable insights for smoke control in underground interconnected tunnels, guiding optimized ventilation design and emergency response strategies.

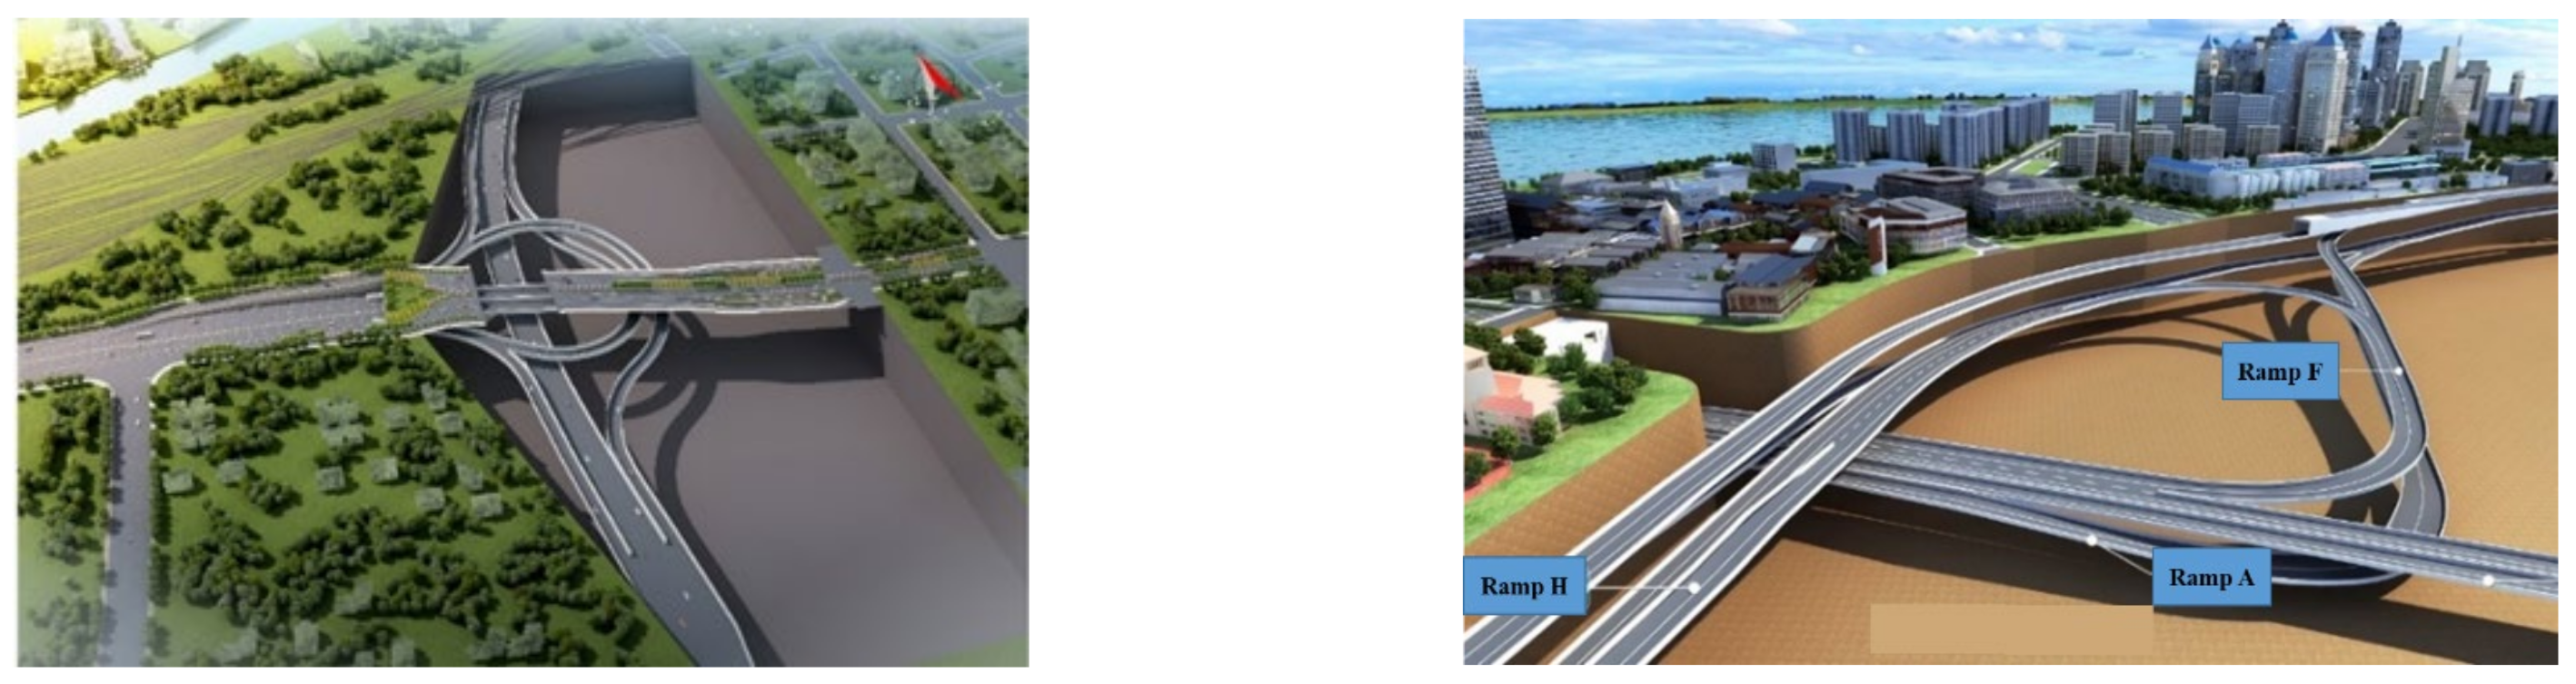
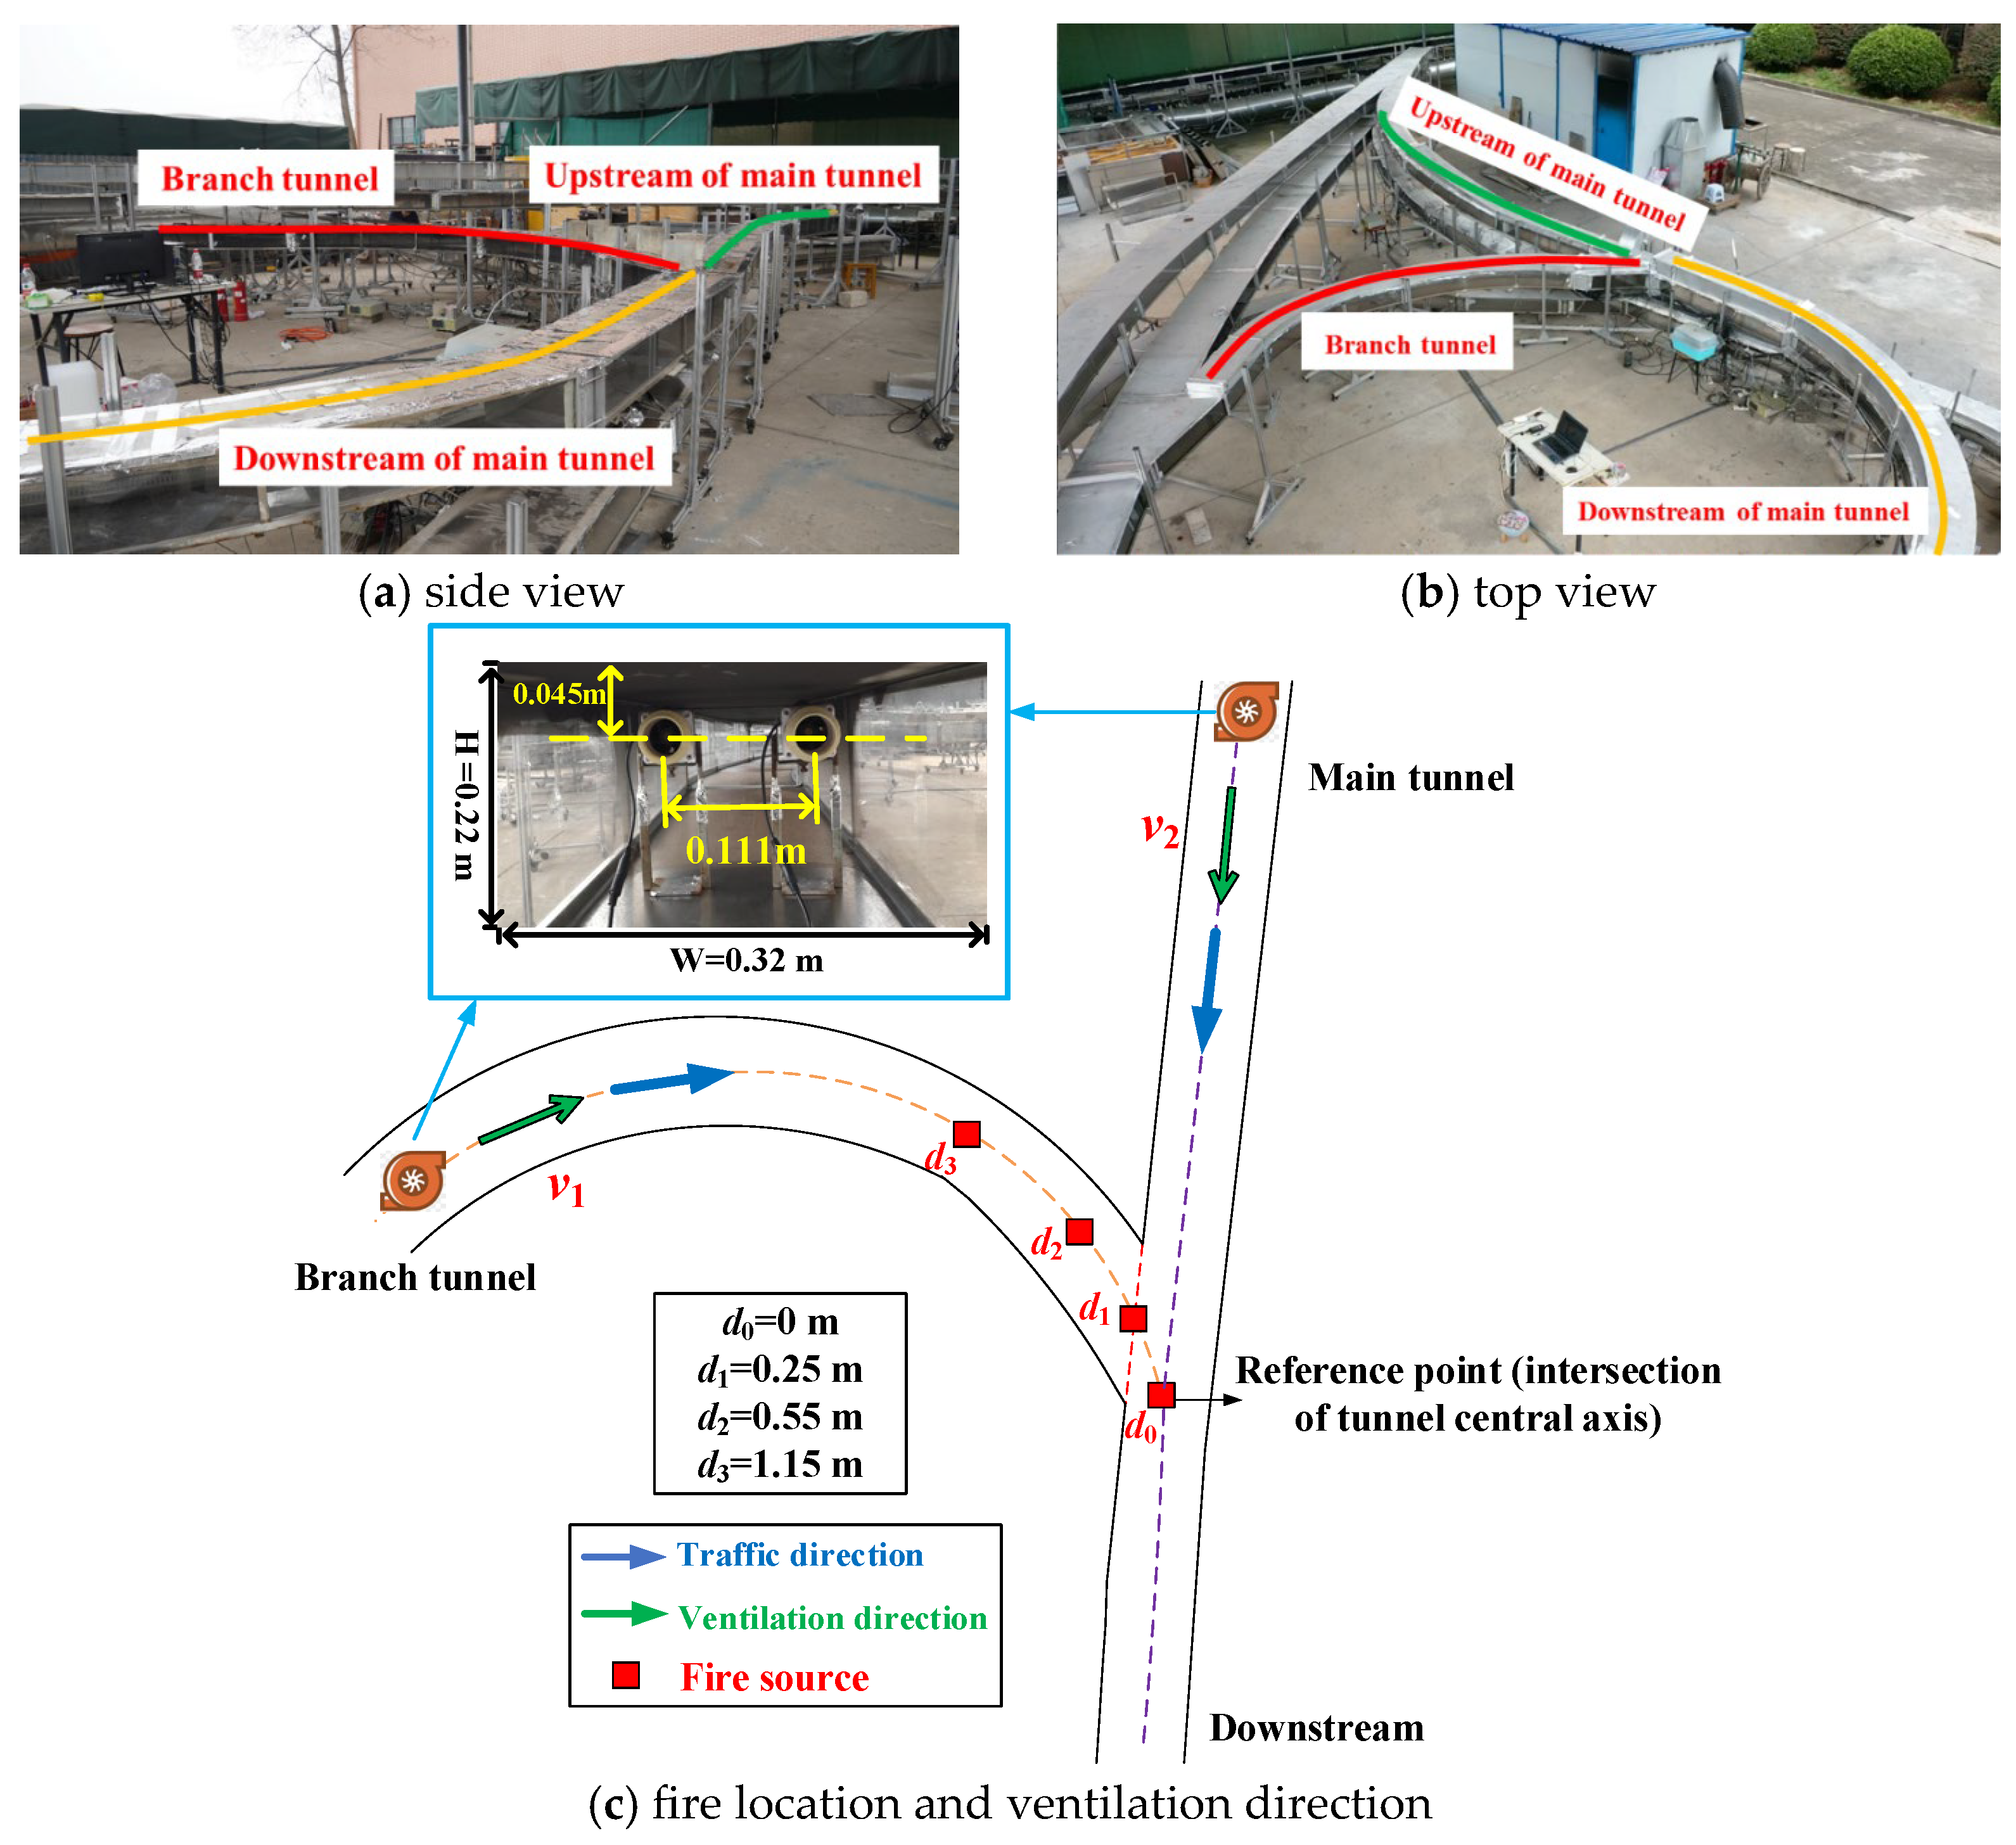
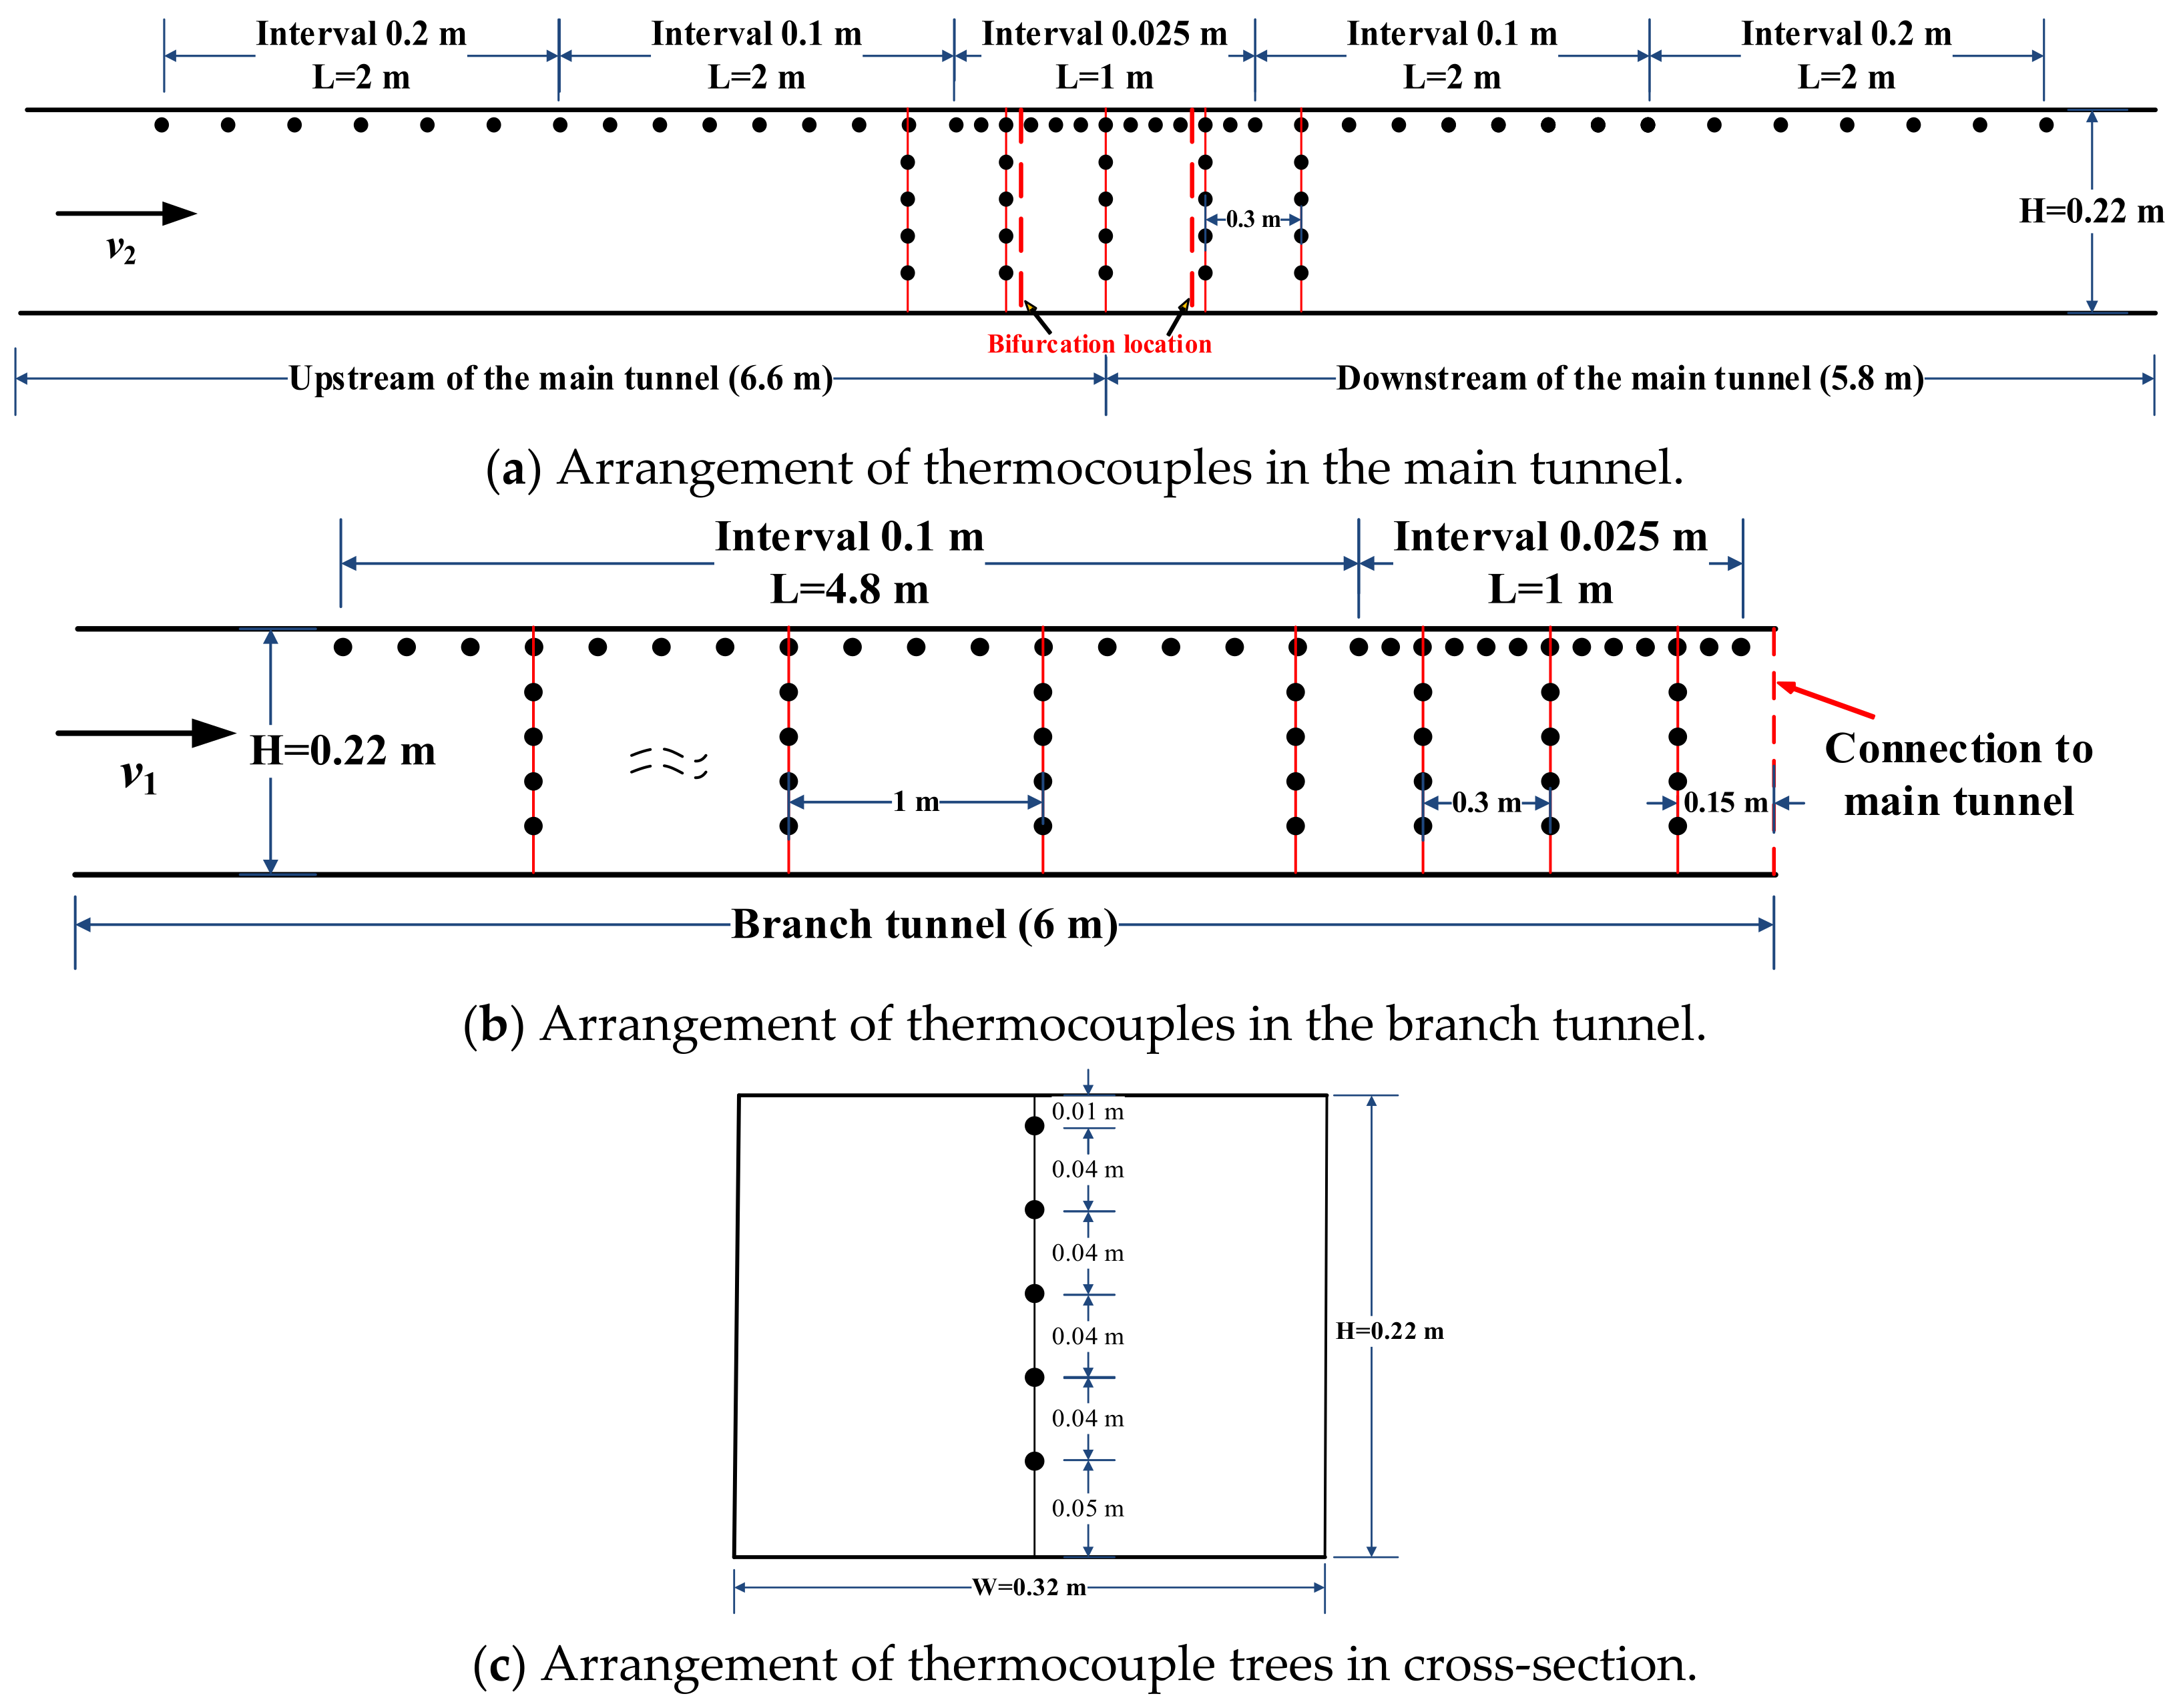
2. Experimental Setup

The experiments were conducted in a 1/30 underground interconnected tunnel, depicted in Figure 2. The tunnel’s cross-section measured 0.32 m wide by 0.22 m high, and the branch tunnel, 6 m in length, had a curvature radius of 2.6 m. The main tunnel featured an upstream section 6.6 m long and a downstream section 5.8 m long. The bifurcation angle of the model-scale tunnel was 45°. Construction materials included a 1.5 mm thick stainless steel floor, 6 mm fireproof glass sidewalls, and a 3 mm fireproof board roof.
A total of four different fire source positions were set up in the experiment, with the intersection of the central axes of the two tunnels labeled as d0, as illustrated in Figure 2c. Propane gas was used in the experiment. The dimensions of the gas burner outlet were 0.03 m by 0.03 m. HRRs were precisely regulated using a mass flowmeter, with six settings: 1.01, 2.03, 3.04, 4.06, 5.07, and 6.09 kW. Corresponding to full-scale conditions, this is in the range of 5~30 MW.
Figure 3 illustrates the arrangement of thermocouples in the tunnel. Positioned 0.01 m below the ceiling, the thermocouples were spaced longitudinally at intervals of 0.025 m near the fire source and at 0.1 m and 0.2 m further away. The measurement points on each thermocouple tree were set 0.04 m apart.
The experimental setup utilized model jet fans arranged at the entrance of the main and branch tunnel, as shown in Figure 2c. A DC power source was used to adjust the ventilation speed, aligning with our prior studies [31]. The longitudinal velocity was measured using Pitot tubes and a differential pressure transducer, which were placed at a distance of 3 m from the fan outlet. Four longitudinal ventilation speeds of 0.18 m/s, 0.37 m/s, 0.46 m/s, and 0.55 m/s were considered in the main tunnel. In the branch tunnel, velocities were set to range from 0 m/s to 0.64 m/s. In the full-scale tunnels, the range of ventilation air velocity was 1~3.5 m/s. We performed a total of 318 experimental groups, as detailed in Table 1.

3. Results

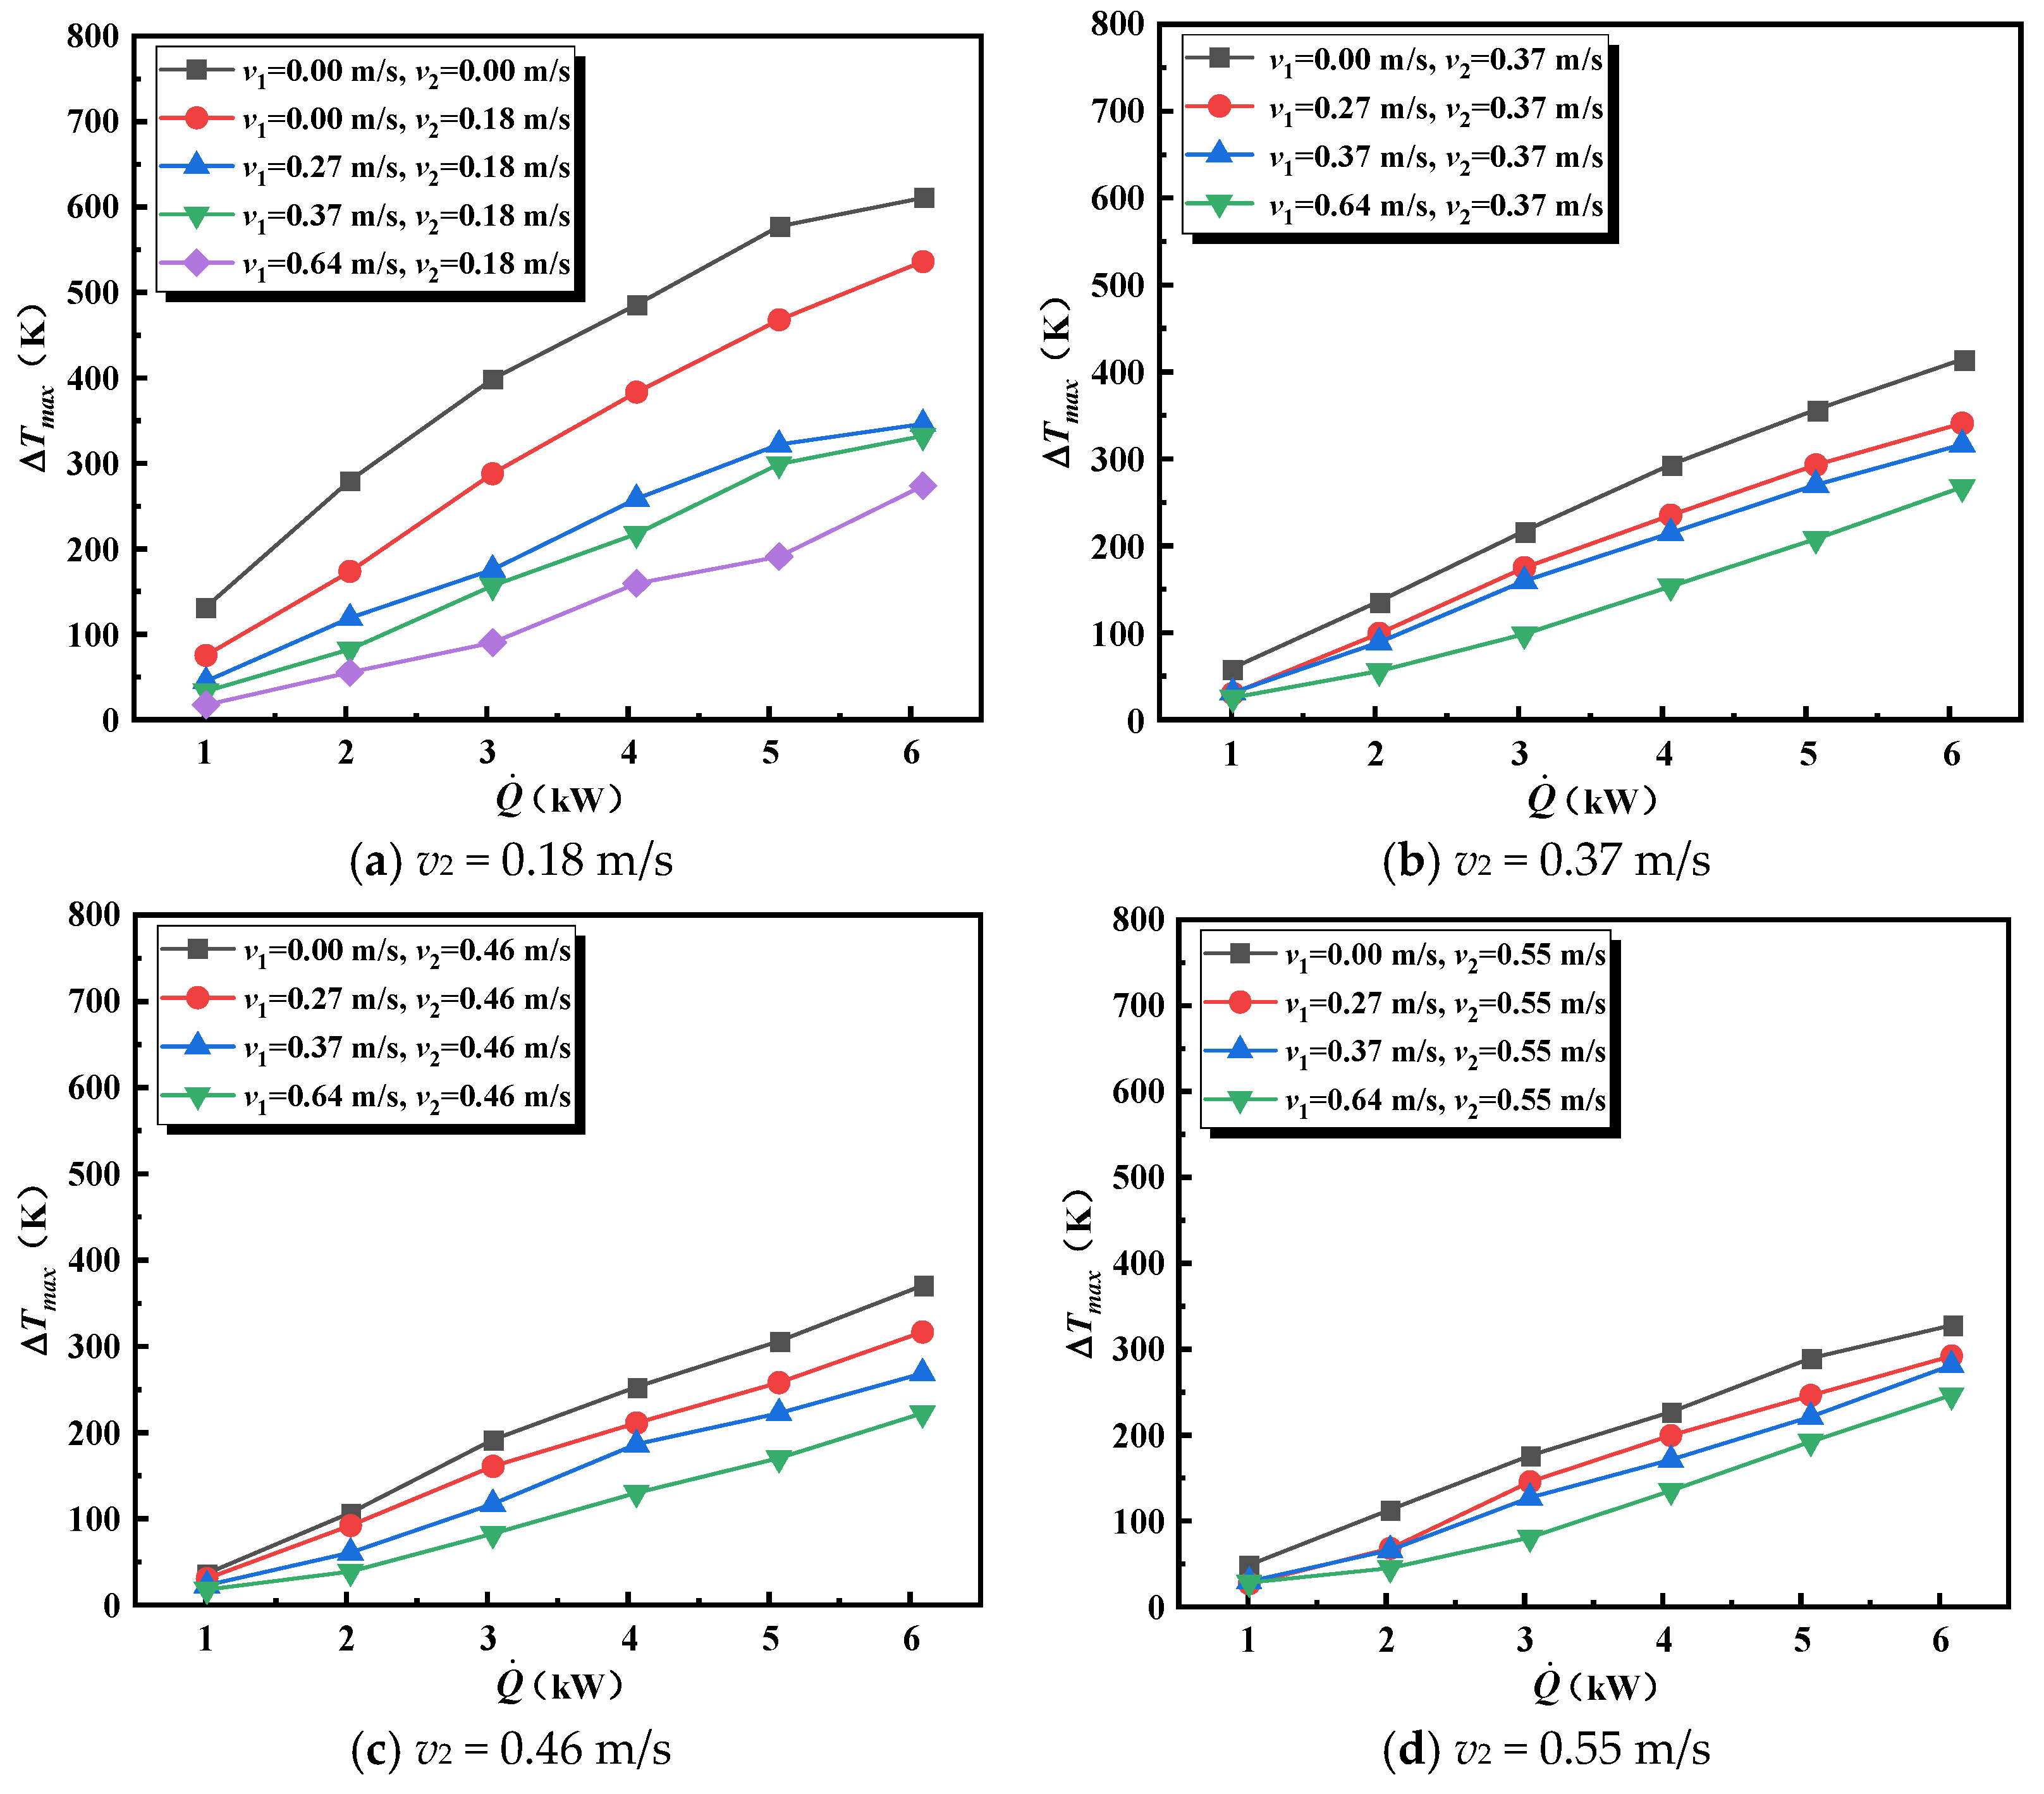
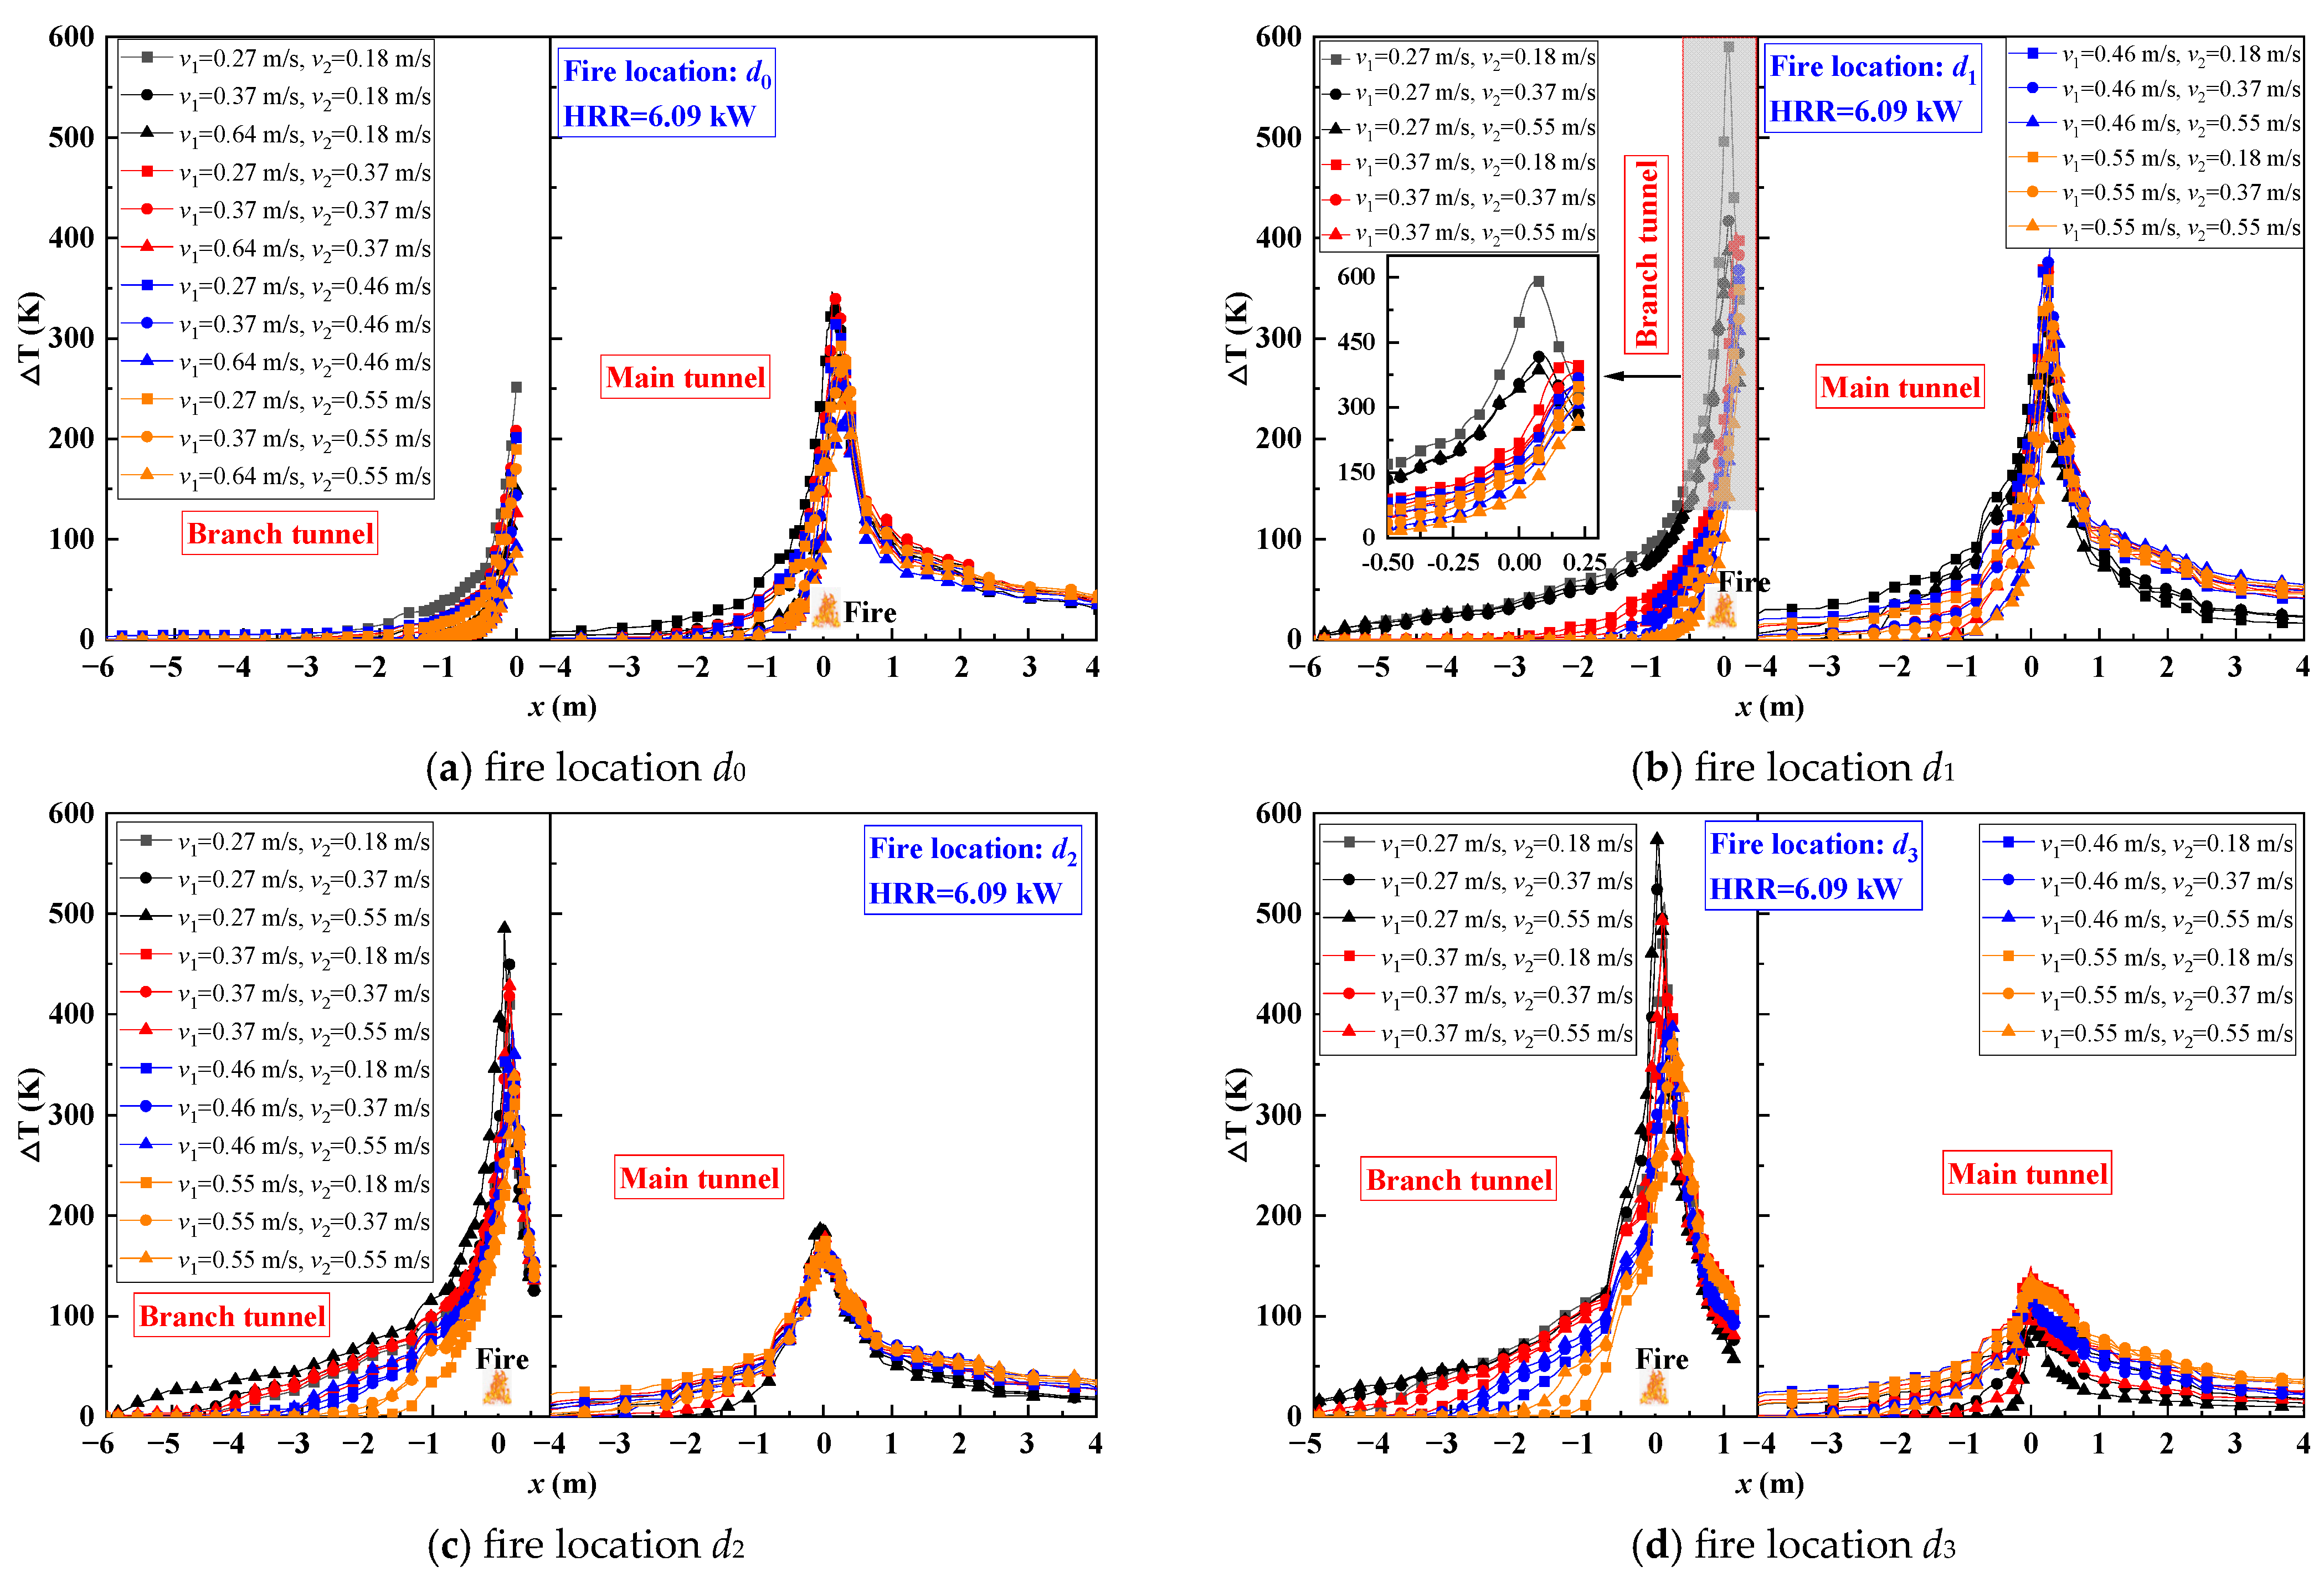
3.1. Analysis of Maximum Temperature Below the Ceiling at Different Fire Locations

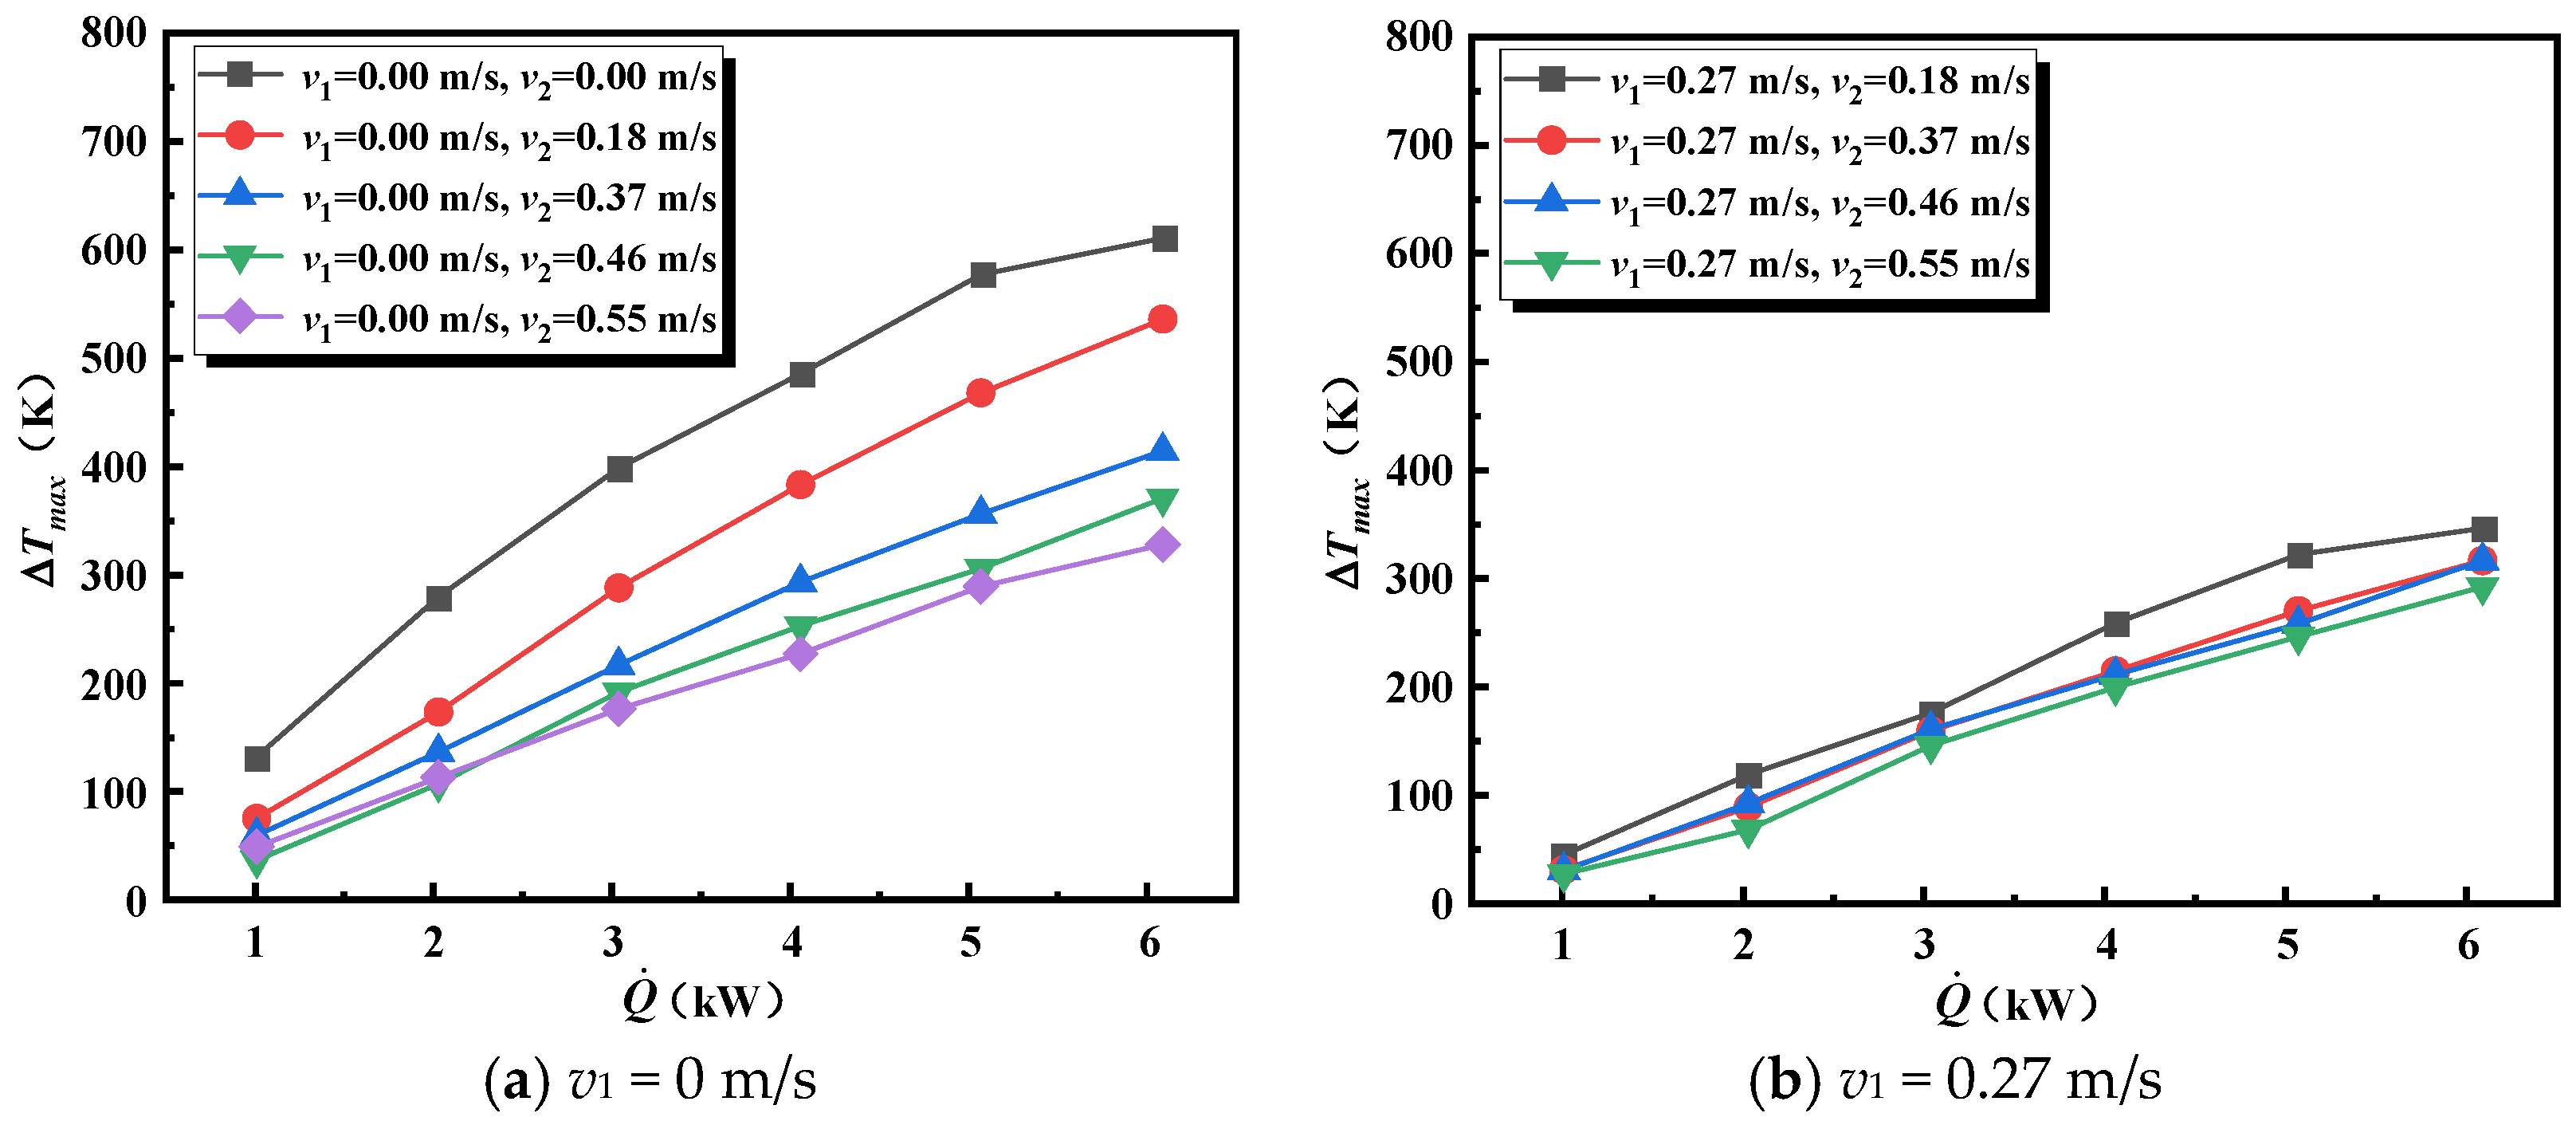
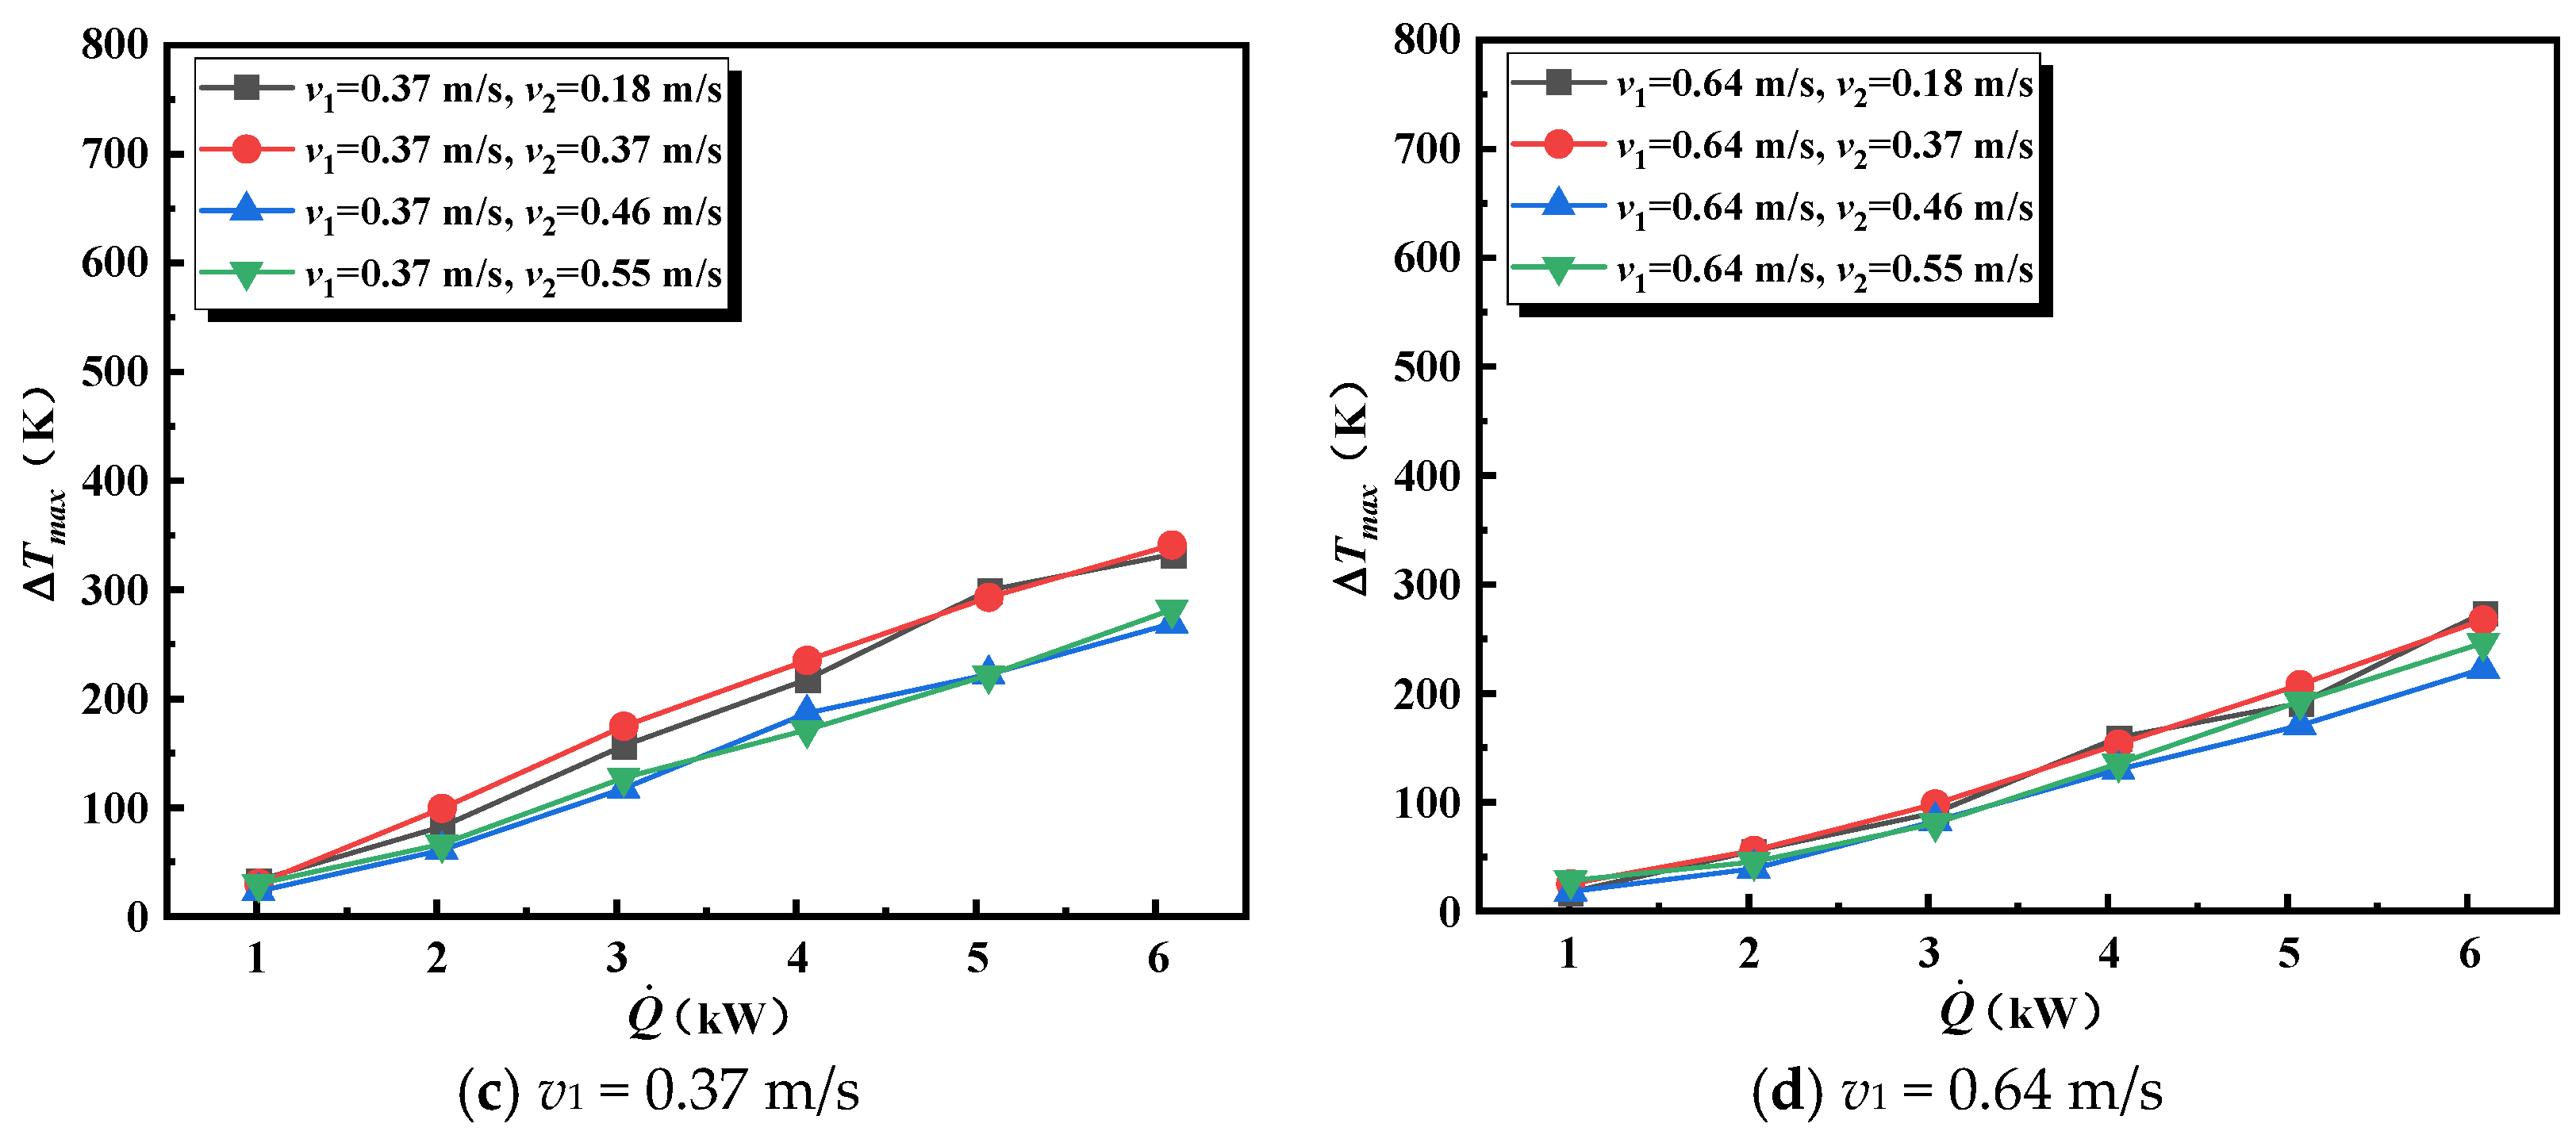
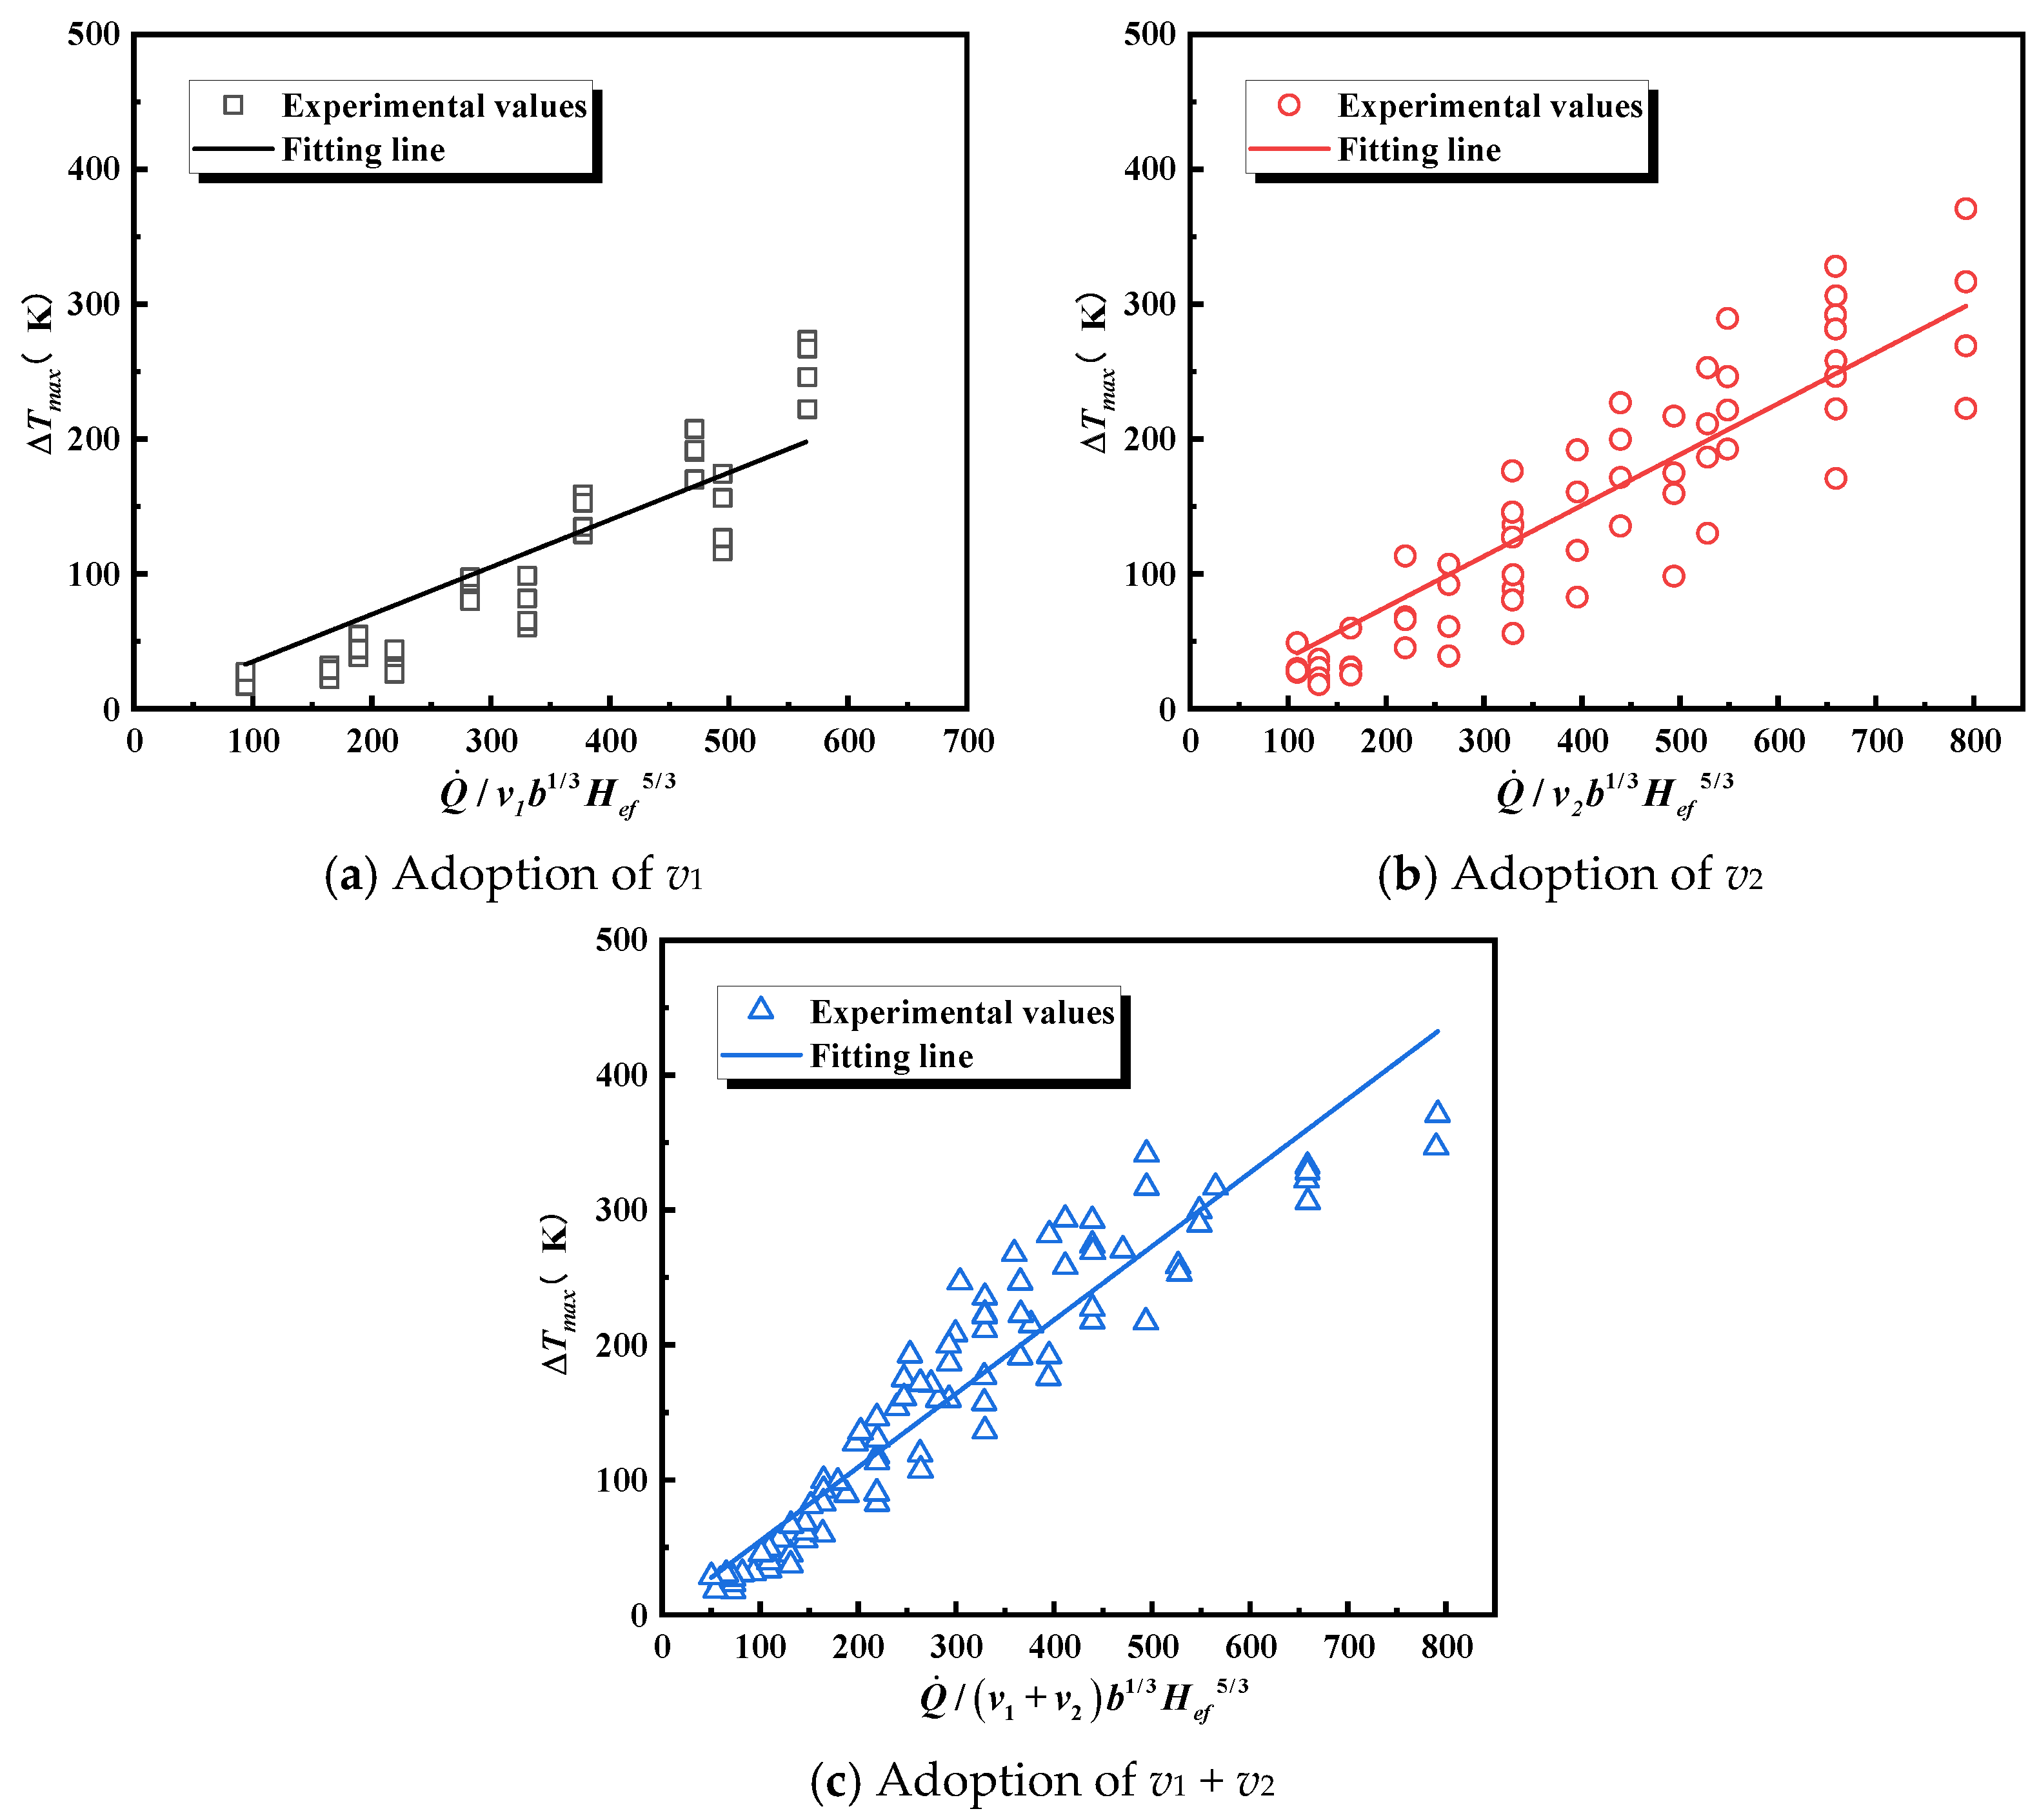
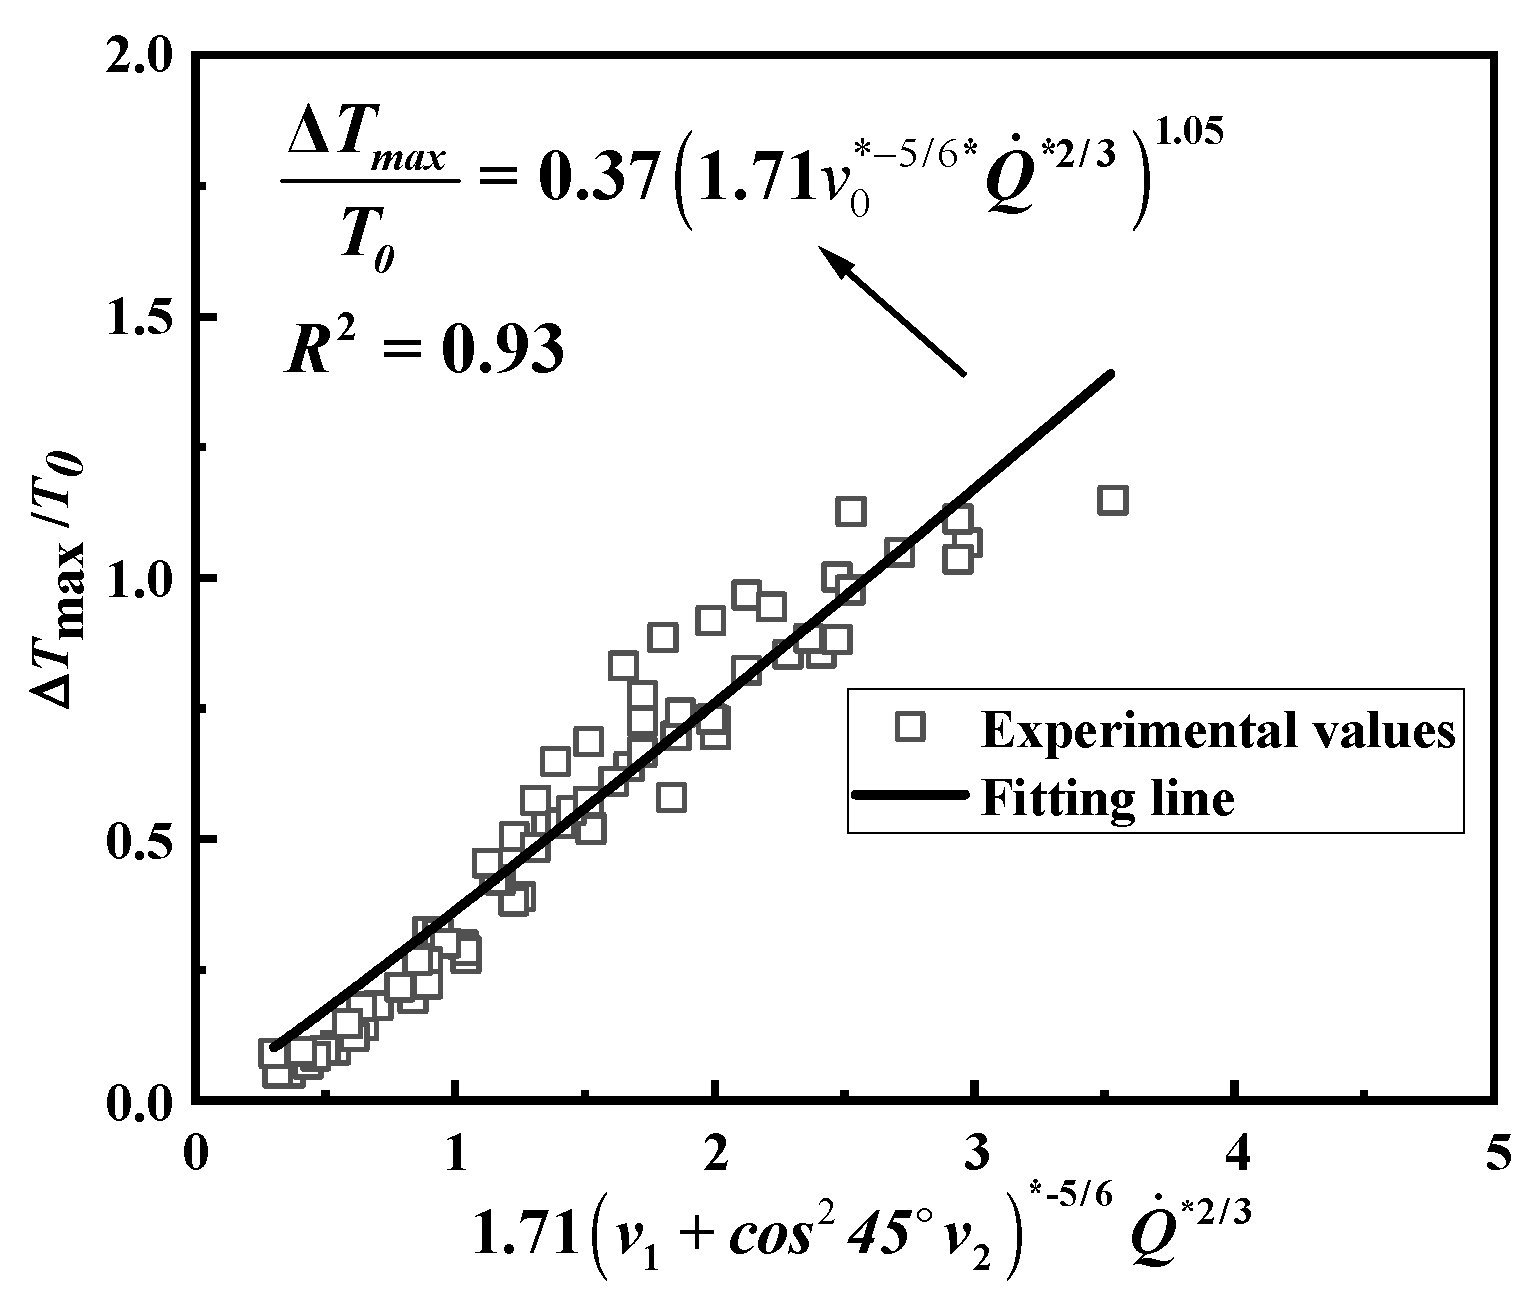
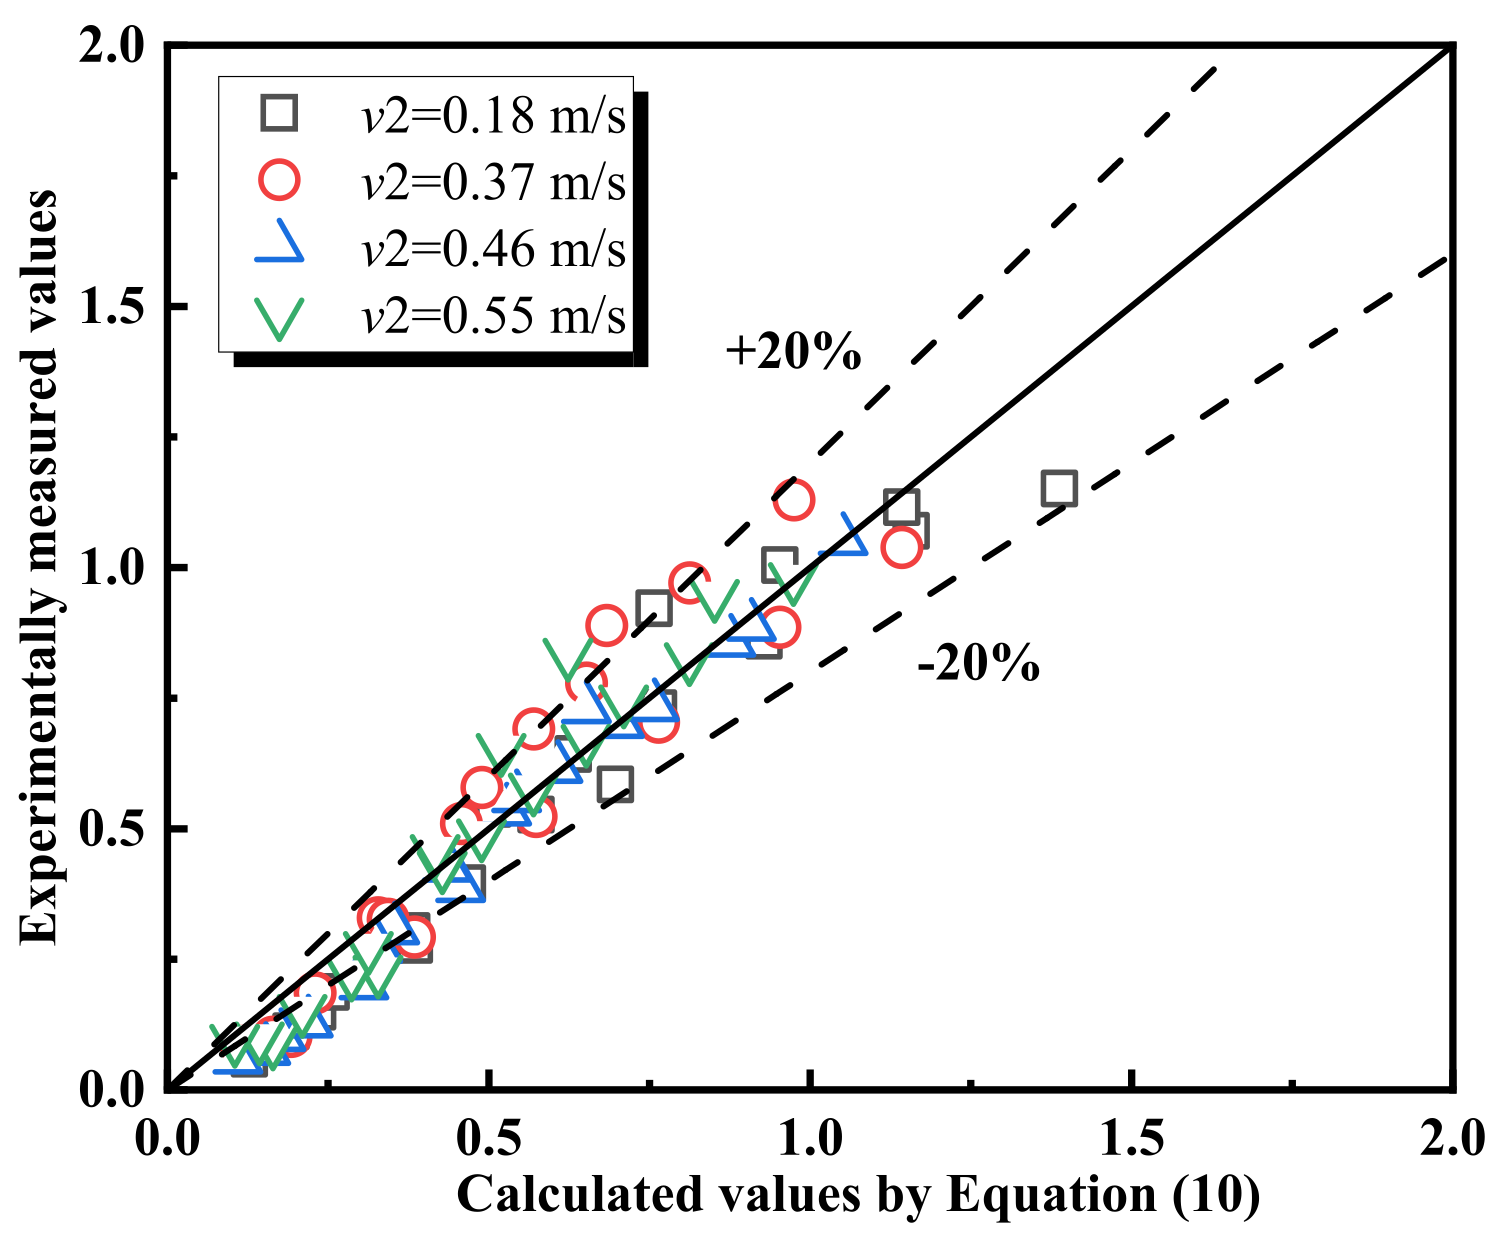
3.1.1. Maximum Temperature at Location d0

When the fire is positioned at the intersection of the mainline and branch tunnel axes, the longitudinal wind flow in both tunnels directly impacts the flame, which subsequently impacts the smoke temperature. Figure 4 illustrates the impact of the branch tunnel’s longitudinal velocity (v1) on the maximum temperature rise ( Δ T max ) when the main tunnel’s velocity (v2) is certain. Under natural ventilation conditions, the Δ T max escalates from 132 K to 610 K with increasing HRR. The Δ T max significantly decreases with longitudinal ventilation in the tunnel. According to Figure 4a–d, the Δ T max decreases with increasing longitudinal velocity in the branch tunnel, provided that v2 remains constant. Furthermore, the reduction in Δ T max diminishes as the main tunnel’s ventilation wind speed increases. For instance, at an HRR of 6.09 kW, the Δ T max decreases from 610 K to 274 K with increasing longitudinal velocity in the branch tunnel at v2 = 0.18 m/s, compared to a decrease from 328 K to 246 K at v2 = 0.55 m/s.
Figure 5 illustrates the impact of longitudinal velocity in the main tunnel on Δ T max . With the branch tunnel’s jet fan off (v1 = 0 m/s), increasing the main tunnel’s velocity effectively controls tunnel fire smoke, significantly reducing the maximum temperature rise. Furthermore, even when the branch tunnel’s velocity is fixed, increasing the main tunnel’s velocity continues to reduce the temperature rise, although the effect is less pronounced, as detailed in Figure 5b–d.
Li et al. [7] developed a classical model for predicting Δ T max in a single-tube tunnel, as shown in Equation (2). The model indicated that if the dimensionless longitudinal velocity does not exceed 0.19, the Δ T max depends solely on the HRR. However, when this velocity surpasses 0.19, the Δ T max is influenced by both the HRR and the longitudinal velocity.
Figure 6 compares the test data with the prediction model by Li et al. [7] for dimensionless velocities above 0.19. The data reveal that relying solely on the longitudinal velocities of either the branch or main tunnel does not accurately reflect the pattern of maximum temperature rise. The data points are notably scattered. Conversely, when the velocities of both the branch and main tunnels are combined (the sum of the ventilation velocity of the branch and the main tunnel is substituted into Equation (2)), the data points show better convergence. This finding aligns with observations from Figure 4 and Figure 5, indicating that joint ventilation from both tunnels significantly affects the Δ T max .
In studies on bifurcated tunnels, the maximum temperature rise prediction model proposed by Huang et al. [18] has been extensively utilized by researchers in this domain. The bifurcation angle between the main and branch tunnel in this study is 45°. Through the analysis of experimental data, we found that when fire source is located at d0, the influence of the main and branch tunnels’ velocity (v1, v2) on maximum temperature can be represented by v0, where v 0 = v 1 + cos 2 45 v 2 . Referring to the study by Huang et al., the experimental data were analyzed using the dimensionless velocity v 0 * . This section only considers the scenarios of cooperative ventilation, and the scenarios of single-tunnel ventilation is not discussed. In this case, v 0 * is greater than 0.19.
As shown in Figure 7, there is an exponential relationship between the dimensionless maximum temperature rise and the dimensionless expression. The fitting yields Equation (10), with a correlation coefficient of 0.93. From this, a new predictive model for Δ T max , considering cooperative ventilation in underground interconnected tunnels, is proposed in Equation (10). This model aligns closely with the experimental data, as evidenced by Figure 8.
Δ T max T 0 = 0.37 1.71 v 1 + cos 2 45 v 2 * 5 / 6 Q ˙ * 2 / 3 1.05 , v * > 0.19

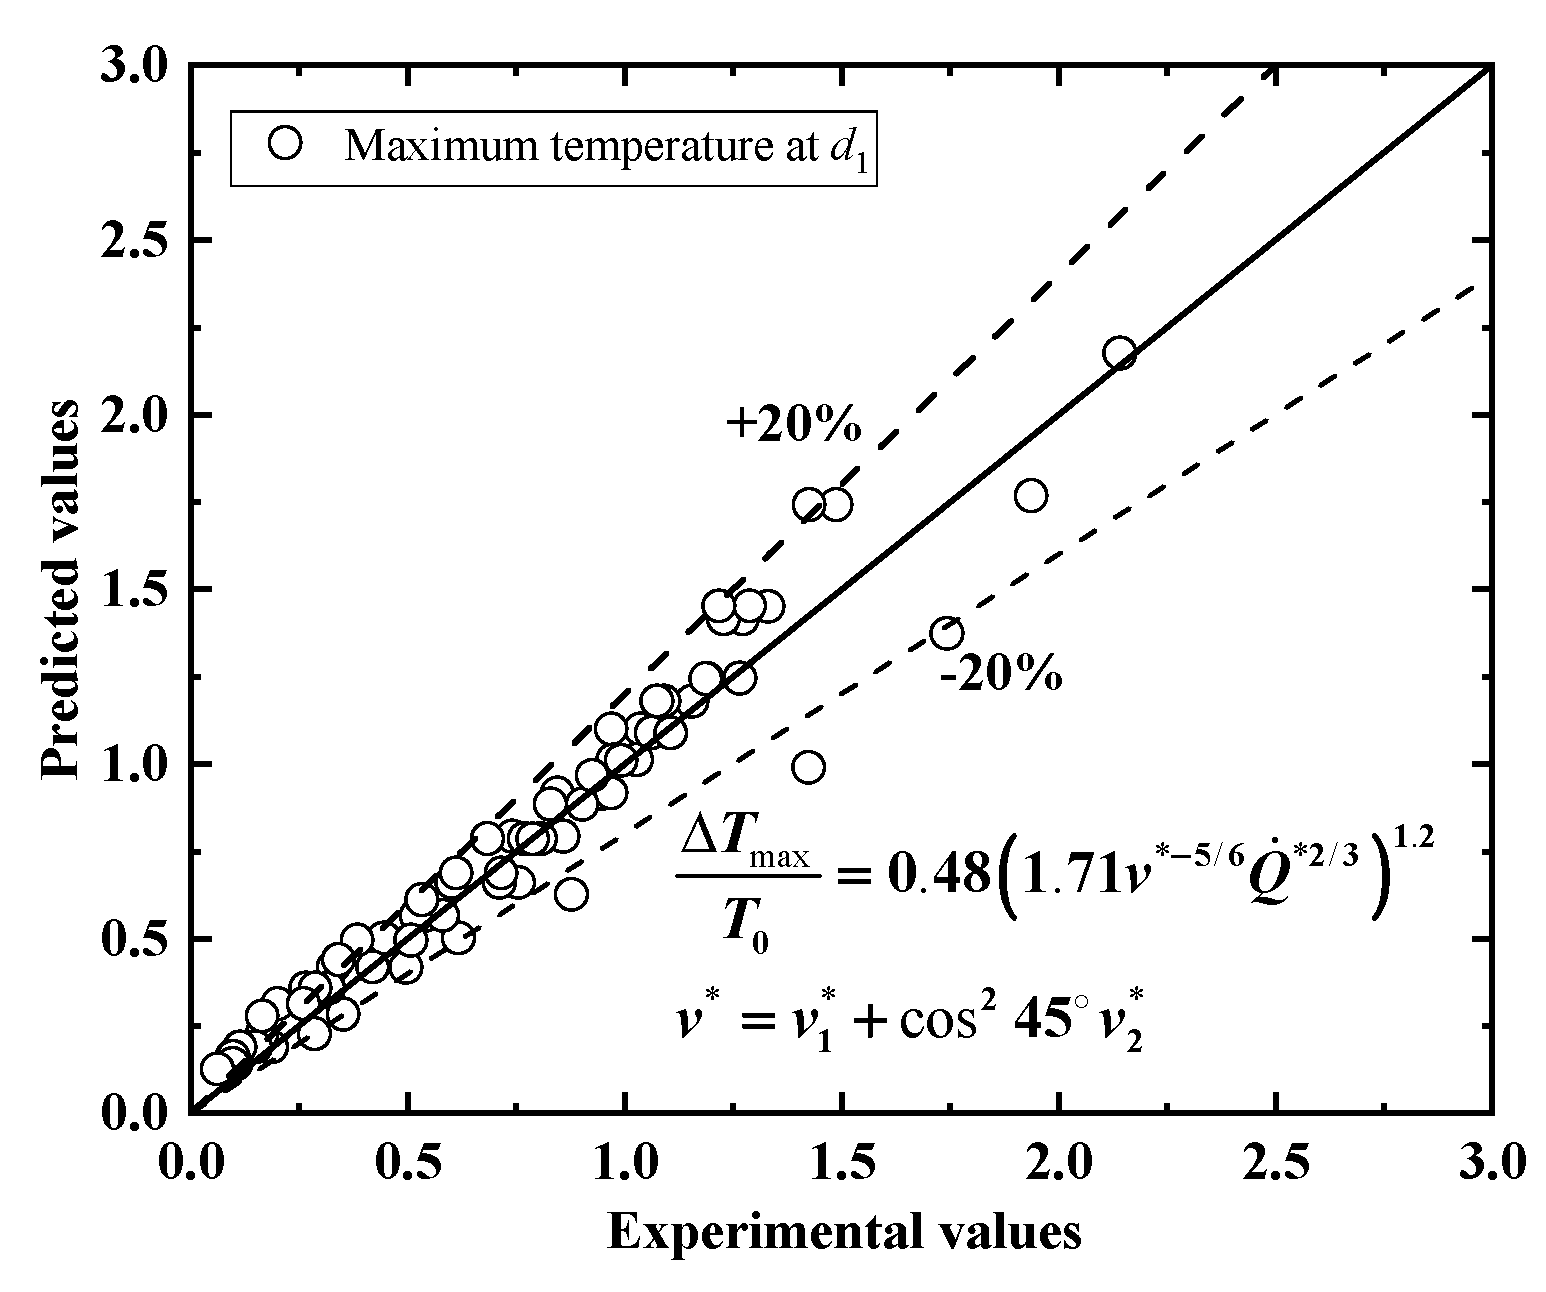
3.1.2. Maximum Temperature at Location d1

When the fire source is located at the cross-section between the branch tunnel and the main tunnel (d1), the effect of the longitudinal velocity of branch and main tunnels on the maximum temperature rise below the tunnel ceiling is shown in Figure 9. The increase in the ventilation velocity in the branch tunnel causes the maximum temperature rise to decrease gradually, as shown in Figure 9a. When v1 is constant, Δ T max becomes smaller as v2 increases. However, the difference between v2 = 0.18 m/s and v2 = 0.37 m/s is small, and there is no significant difference in the maximum temperature until v2 increases to 0.55 m/s, as shown in Figure 9b.
It is worth noting that when the ventilation wind speed is small (v1 = 0.27 m/s, v2 = 0.18 m/s), the longitudinal airflow provides more oxygen to the tunnel, resulting in a fuller combustion and higher temperature. The cooling effect of the longitudinal airflow is dominant in the other ventilation schemes, and thus the maximum temperature for this condition is significantly higher than the other ventilation schemes, as shown by the orange circle in Figure 9.
Through the analysis of experimental data at d1, it was found that the pattern follows the same trend as observed at the d0 position. The influence of ventilation in both tunnels on the maximum temperature rise can also be represented by v 0 = v 1 + cos 2 45 v 2 . The dimensionless characteristic velocity v 0 * is greater than 0.19 for the cooperative ventilation scenario at position d1. The two parameters in the maximum temperature rise prediction model are 0.48 and 1.2, as shown in Equation (11). Comparison with the experimental results reveals that the model predicts well, as demonstrated in Figure 10.
Δ T max T 0 = 0.48 1.71 v 1 + cos 2 45 v 2 * 5 / 6 Q ˙ * 2 / 3 1.2 , v * > 0.19

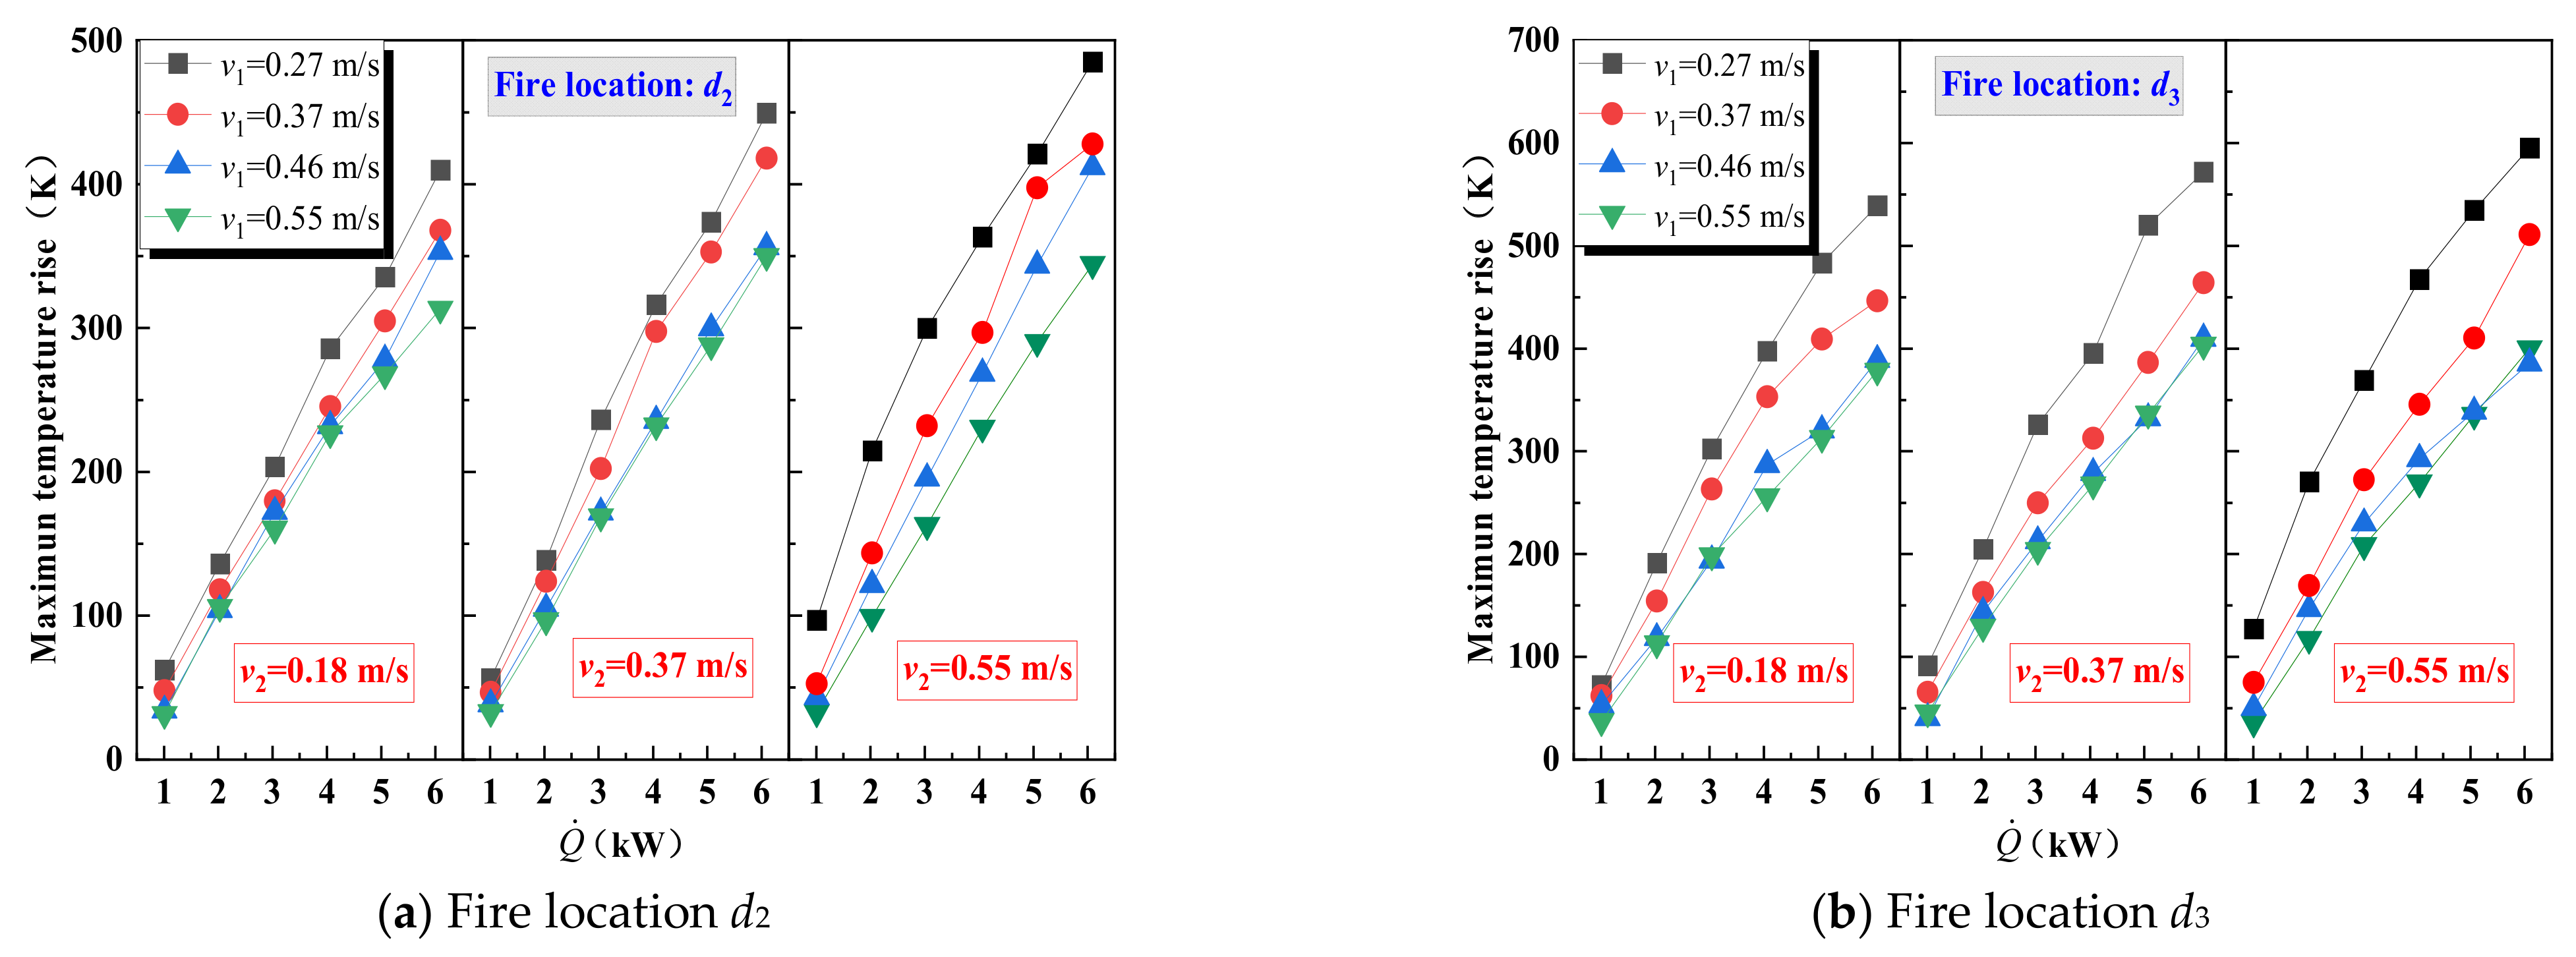
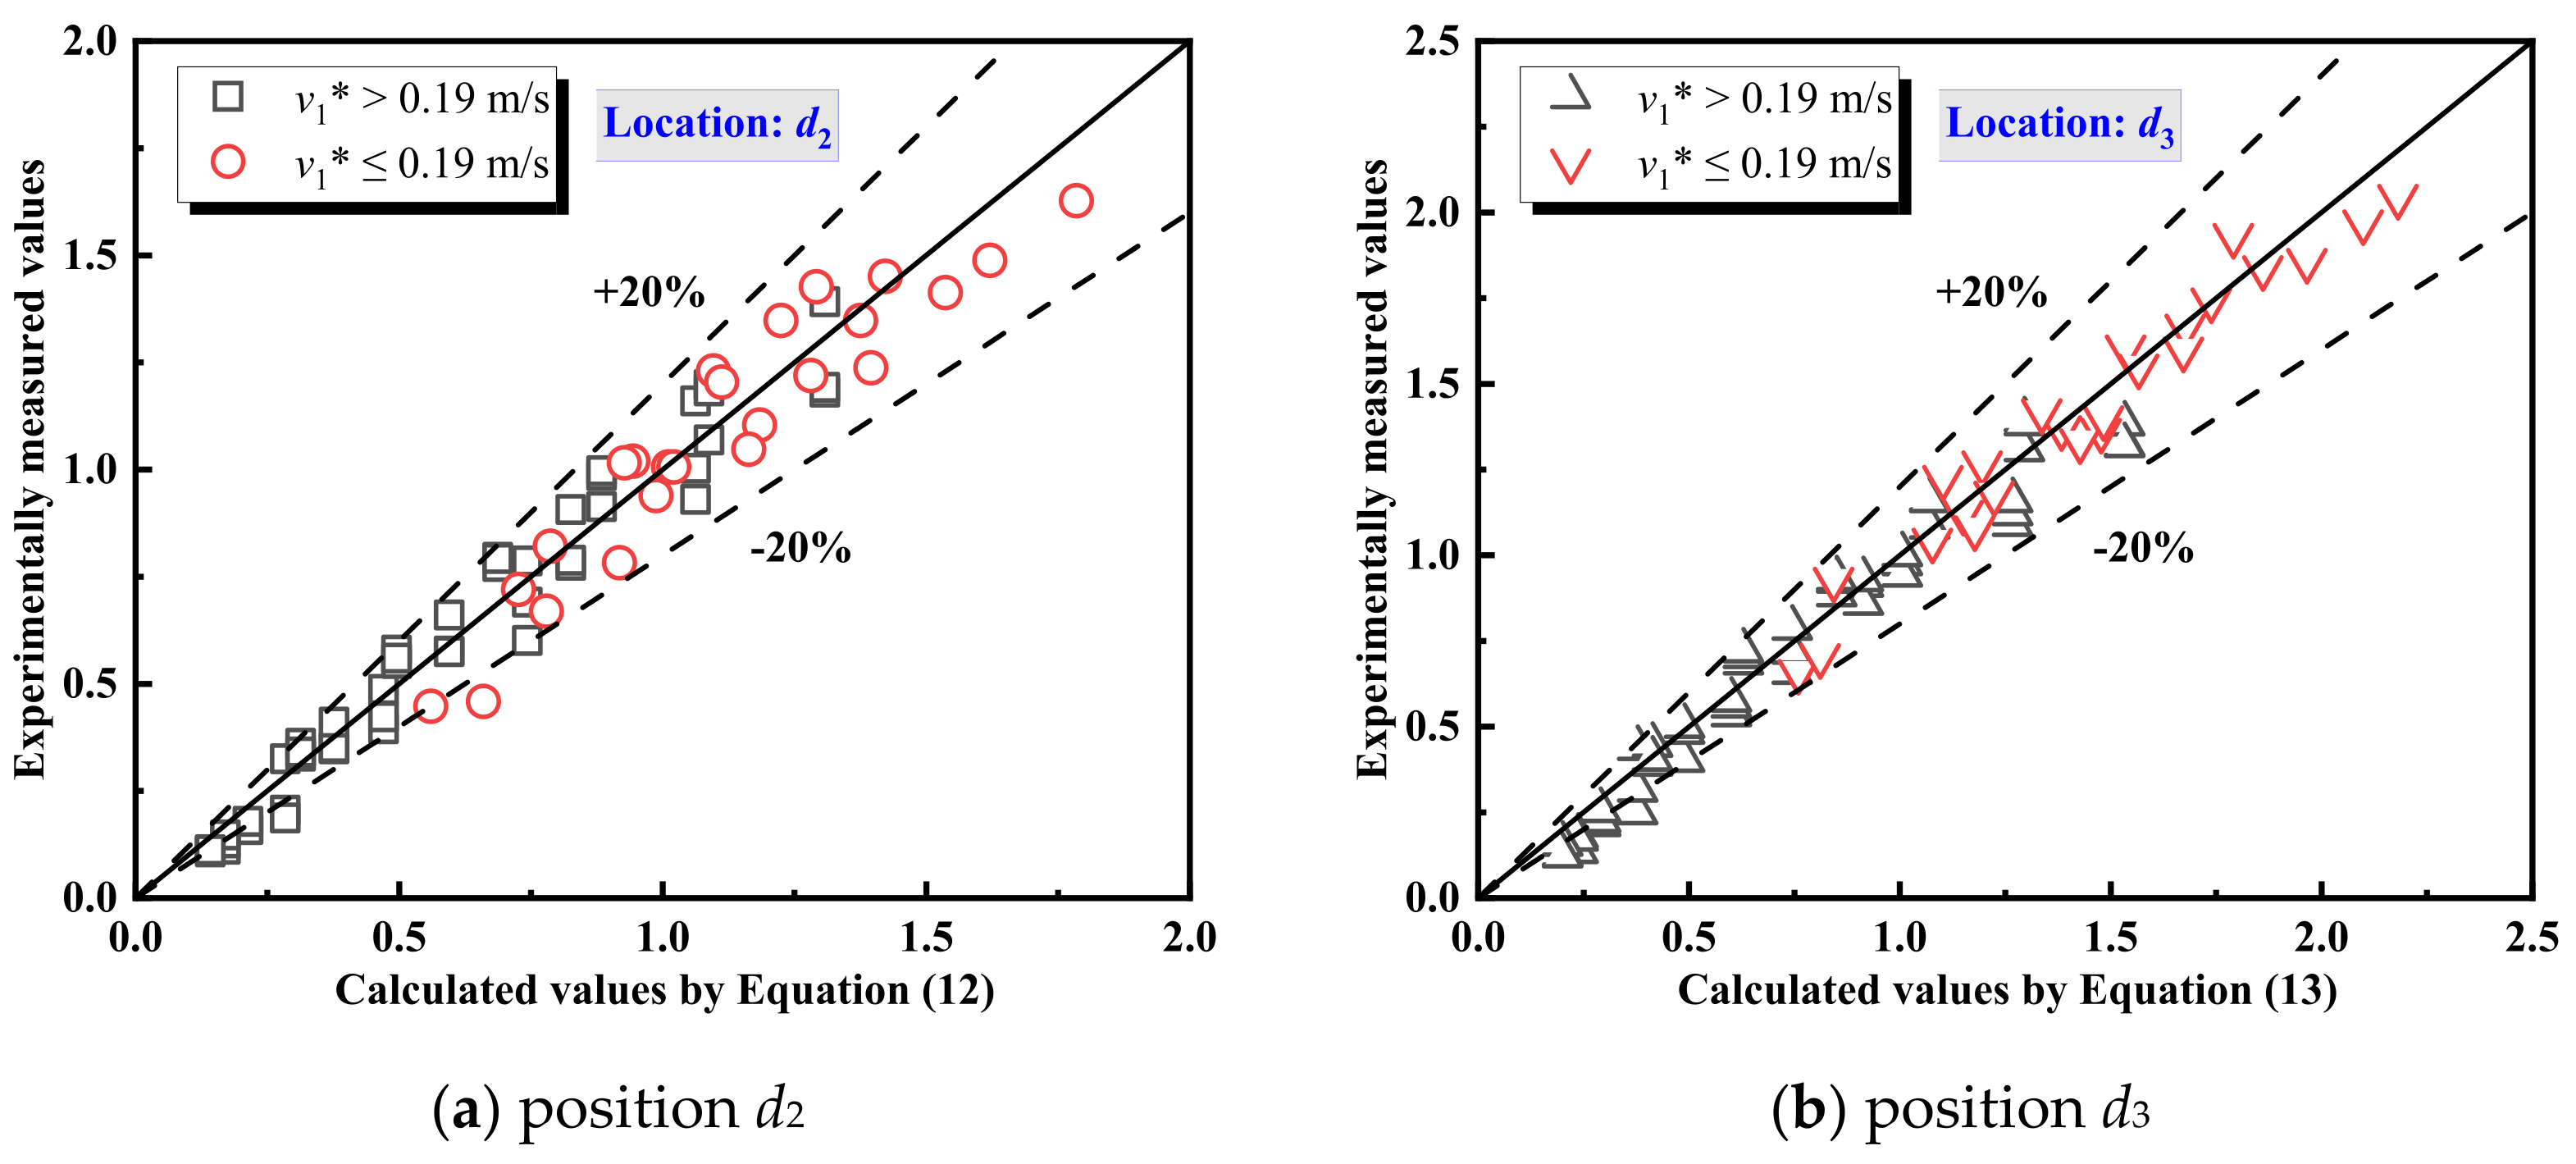
3.1.3. Maximum Temperature for Positions d2 and d3

When the fire source moves into the branch tunnel (located at positions d2 and d3), the relationship between the maximum temperature and longitudinal velocity is shown in Figure 11. The trends between longitudinal velocity and maximum temperature rise are the same at both positions. Increasing the branch tunnel velocity (v1) still reduces the maximum temperature, while the influence of the main tunnel velocity (v2) on the temperature changes. Before the fire enters the branch tunnel, increasing v2 lowers the maximum temperature rise. After the fire enters the branch tunnel, as v2 increases, Δ T max gradually rises. When v1 is low, v2 has a significant enhancing effect on the maximum temperature. In contrast, when v1 is high, v2 has minimal impact on the maximum temperature. This is because after the fire source moves into the branch tunnel, the airflow in the main tunnel partially impedes the downstream movement of smoke. A higher v2 strengthens this obstruction, leading to an increased accumulation of hot smoke within the branch tunnel and higher temperatures. However, when v1 is sufficiently large, the obstructing effect of the main tunnel airflow diminishes.
Therefore, based on the magnitude of v 1 * , we divided the maximum temperature rise data into two parts for discussion. When v 1 * > 0.19 , the influence of v2 can be neglected, and Δ T max is analyzed based on v 1 * alone. When v 1 * 0.19 , the influence of v2 becomes significant, and Δ T max is analyzed by incorporating v2.
When the dimensionless characteristic velocity exceeds 0.19, the form of the maximum temperature rise prediction model remains consistent with Equations (10) and (11), differing only in coefficients. The coefficients for the d2 position are 0.37 and 1.2, while those for the d3 position are 0.47 and 1.1. When the dimensionless characteristic velocity is less than 0.19, the main tunnel velocity v2 shows a positive correlation with Δ T max . Further analysis reveals that Δ T max v 2 1 / 4 at position d2, and it becomes Δ T max v 2 1 / 10 by fire position d3. The prediction models for maximum temperature when the fire source is located at d2 and d3 are given by Equation (12) and Equation (13), respectively, as evidenced in Figure 12.
Δ T max T 0 = 0.37 1.71 v 1 * 5 / 6 Q ˙ * 2 / 3 1.2 , v 1 * > 0.19 0.6 1.71 v 1 * 5 / 6 v 2 * 1 / 4 Q ˙ * 2 / 3 0.95 , v 1 * 0.19
Δ T max T 0 = 0.47 1.71 v 1 * 5 / 6 Q ˙ * 2 / 3 1.1 , v 1 * > 0.19 0.6 1.71 v 1 * 5 / 6 v 2 * 1 / 10 Q ˙ * 2 / 3 0.95 , v 1 * 0.19

3.2. Analysis of Longitudinal Temperature Distribution Upstream of the Branch Tunnel Under Cooperative Ventilation

Figure 13 depicts how the temperature distribution varies with the HRR in the main tunnel under natural ventilation. Smoke disperses symmetrically both upstream and downstream. Higher heat release rates result in higher temperatures and a wider smoke spread. For example, at 1.01 kW, smoke extends 2 m upstream and downstream, while at 6.09 kW, it reaches the tunnel’s port. Longitudinal ventilation modifies this pattern, inhibiting upstream smoke spread and disrupting the symmetry of temperature distribution.
Figure 14 illustrates the dimensionless longitudinal temperature distribution under both natural and cooperative ventilation (with v1 = v2 = 0.37 m/s as representative scenarios). The analysis reveals that variation in the HRR minimally affects the dimensionless longitudinal temperature distribution. Consequently, we selected experiments with an HRR of 6.09 kW for detailed analysis of this temperature distribution.
Given that the sum of coefficients C and D in Equation (9) equals 1, Equation (9) can be reformulated as follows:
Δ T x Δ T max = C e k 1 x x 0 / H + 1 C e k 2 x x 0 / H
Equation (14) was applied to analyze the longitudinal temperature distribution in the branch tunnel, with results for position d0 depicted in Figure 15. It was found that the coefficient C remains constant with varying longitudinal velocities in the branch tunnel, provided that the main tunnel’s velocity is fixed. However, as the main tunnel’s velocity increases, coefficient C decreases until it stabilizes at 0.46 m/s. Unlike coefficient C, coefficient k1 varies solely with v1, increasing as this velocity increases. The coefficient k2 remains almost constant in all ventilation conditions, so we take the average value of 0.9 of k2 for all conditions to be fitted, which reduces the number of unknown variables and facilitates the establishment of the final unified model. Table 2. summarizes the temperature decay coefficients for the branch tunnel across various test cases.
Utilizing the data from Table 2, expressions for the coefficients C, k1, and k2 could be derived as follows:
C = 0.75 v 2 + 0.42 k 1 = 2.5 v 1 0.37 k 2 = 0.9
where v 1 and v 2 are the dimensionless longitudinal velocities of the branch and main tunnel. This can be calculated by v = v / g H .
Figure 16 compares the experimental data and the predictive model for dimensionless temperature at position d0. The smoke temperature in the branch tunnel, as calculated by the developed model, closely aligns with the test observations.
When the fire source moves into the branch tunnel (positions d1~d3), the influence of cooperative ventilation on the longitudinal temperature distribution upstream of the branch tunnel is consistent, and the variation patterns of coefficients in the prediction model remain the same. Under a constant branch tunnel ventilation velocity, the effect of v2 on the temperature attenuation upstream of the branch tunnel is negligible. The coefficients C, k1, and k2 in the upstream temperature attenuation model depend solely on v1. The variation of these coefficients with v1 is summarized in Table 3.
From Table 3, it can be observed that coefficients C and k1 are directly proportional to the branch tunnel velocity v1. In contrast, the coefficient k2 remains nearly constant regardless of v1 and be treated as a fixed parameter. The coefficients of the longitudinal temperature attenuation model for each fire position are summarized in Equation (16).
d 1 : C = 2.46 v 1 0.23 k 1 = 2.64 v 1 0.45 k 2 = 0.9     d 2 : C = 1.73 v 1 + 0.04 k 1 = 0.95 v 1 0.1 k 2 = 1     d 3 : C = 2.62 v 1 0.12 k 1 = 1.3 v 1 0.16 k 2 = 1.1
A comparison between the temperature attenuation prediction model and experimental results is shown in Figure 17. The model can effectively predict the temperature variation trends upstream of the branch tunnel under cooperative ventilation, with errors between the model and experiments remaining within 25%.

3.3. Characteristics of Smoke Propagation in Tunnels

During a tunnel fire, smoke spreads longitudinally along the tunnel driven by thermal buoyancy. The extent of smoke spread is determined by the combined effects of thermal buoyancy and inertial force. When pressure equilibrium between these forces is achieved, the smoke ceases to propagate further. These forces depend on the heat release rate and longitudinal velocity. Therefore, in the event of a fire in an underground interconnected tunnel, the smoke spread in the main and branch tunnels is closely related to the HRR and ventilation strategy.
First, the influence of the HRR on smoke spread in tunnel fires is analyzed. Figure 18 illustrates the fire scenario at position d0 (the intersection of the central axes of two tunnels). Under longitudinal ventilation, smoke is exhausted downstream through the main tunnel, while a certain range of smoke persists upstream of the main tunnel and within the branch tunnel. From Figure 18, it can be observed that as the HRR increases, the thermal buoyancy of the smoke flow rises, leading to greater smoke spread distances. When the HRR increases from 1.01 kW to 6.09 kW, the smoke spread range expands from 0.3 m to 2.4 m in the branch tunnel, and from 0.45 m to 2.25 m in the main tunnel.
To better illustrate the influence of ventilation schemes on smoke propagation, we selected a heat release rate of 6.09 kW (equivalent to 30 MW in real-scale scenarios) for analysis. Figure 19 shows the smoke spread under cooperative ventilation when fires occur at different locations in the underground interconnected tunnel. The ventilation direction aligns with the increasing x-axis direction.
When fire is located at d0 (within the main tunnel), both the main and branch tunnel airflow directly act on the flame. Increasing longitudinal velocity in either tunnel effectively suppresses smoke movement upstream of the main or branch tunnel. Changes in ventilation schemes have minimal impact on the temperature distribution downstream of the fire source. Next is the spreading patterns when fire moves to the entrance of the branch tunnel. When v1 is fixed, variations in v2 have limited influence on smoke spread within the branch tunnel. When v2 remains constant, increasing v1 to 0.37 m/s or higher reduces its impact on smoke spread in the main tunnel. At v1 = 0.27 m/s, the flame tilt is slight, and the longitudinal temperature from the branch tunnel portal to the intersection of the central axes first increases and then decreases. When v1 ≥ 0.37 m/s, significant flame tilt occurs, and the temperature decreases gradually from the intersection to the branch tunnel portal. After the fire source enters the branch tunnel (positions d2 and d3), the main tunnel airflow obstructs downstream smoke movement. At fixed v1, a higher v2 strengthens obstruction, leading to broader smoke spread within the branch tunnel. Conversely, while v2 is unchanged, a higher v1 drives more smoke into the main tunnel through the bifurcation structure, expanding upstream smoke spread in the main tunnel. Notably, increasing airflow velocity in either tunnel reduces smoke spread range within the corresponding tunnel.
Through the aforementioned analysis, it can be observed that complex interaction mechanisms exist between ventilation parameters and smoke propagation patterns in interconnected tunnels. For fire incidents in such tunnel systems, detailed smoke control strategies should be developed by comprehensively considering the specific fire location and existing ventilation systems to ensure the life and safety of personnel within the tunnel.

4. Conclusions

This work conducted a number of tests in a model-scale underground interconnected tunnel to examine the temperature distribution and spreading characteristics of fires, considering the variations in fire locations, HRRs, and coordinated ventilation. The main findings are as follows.
(1)
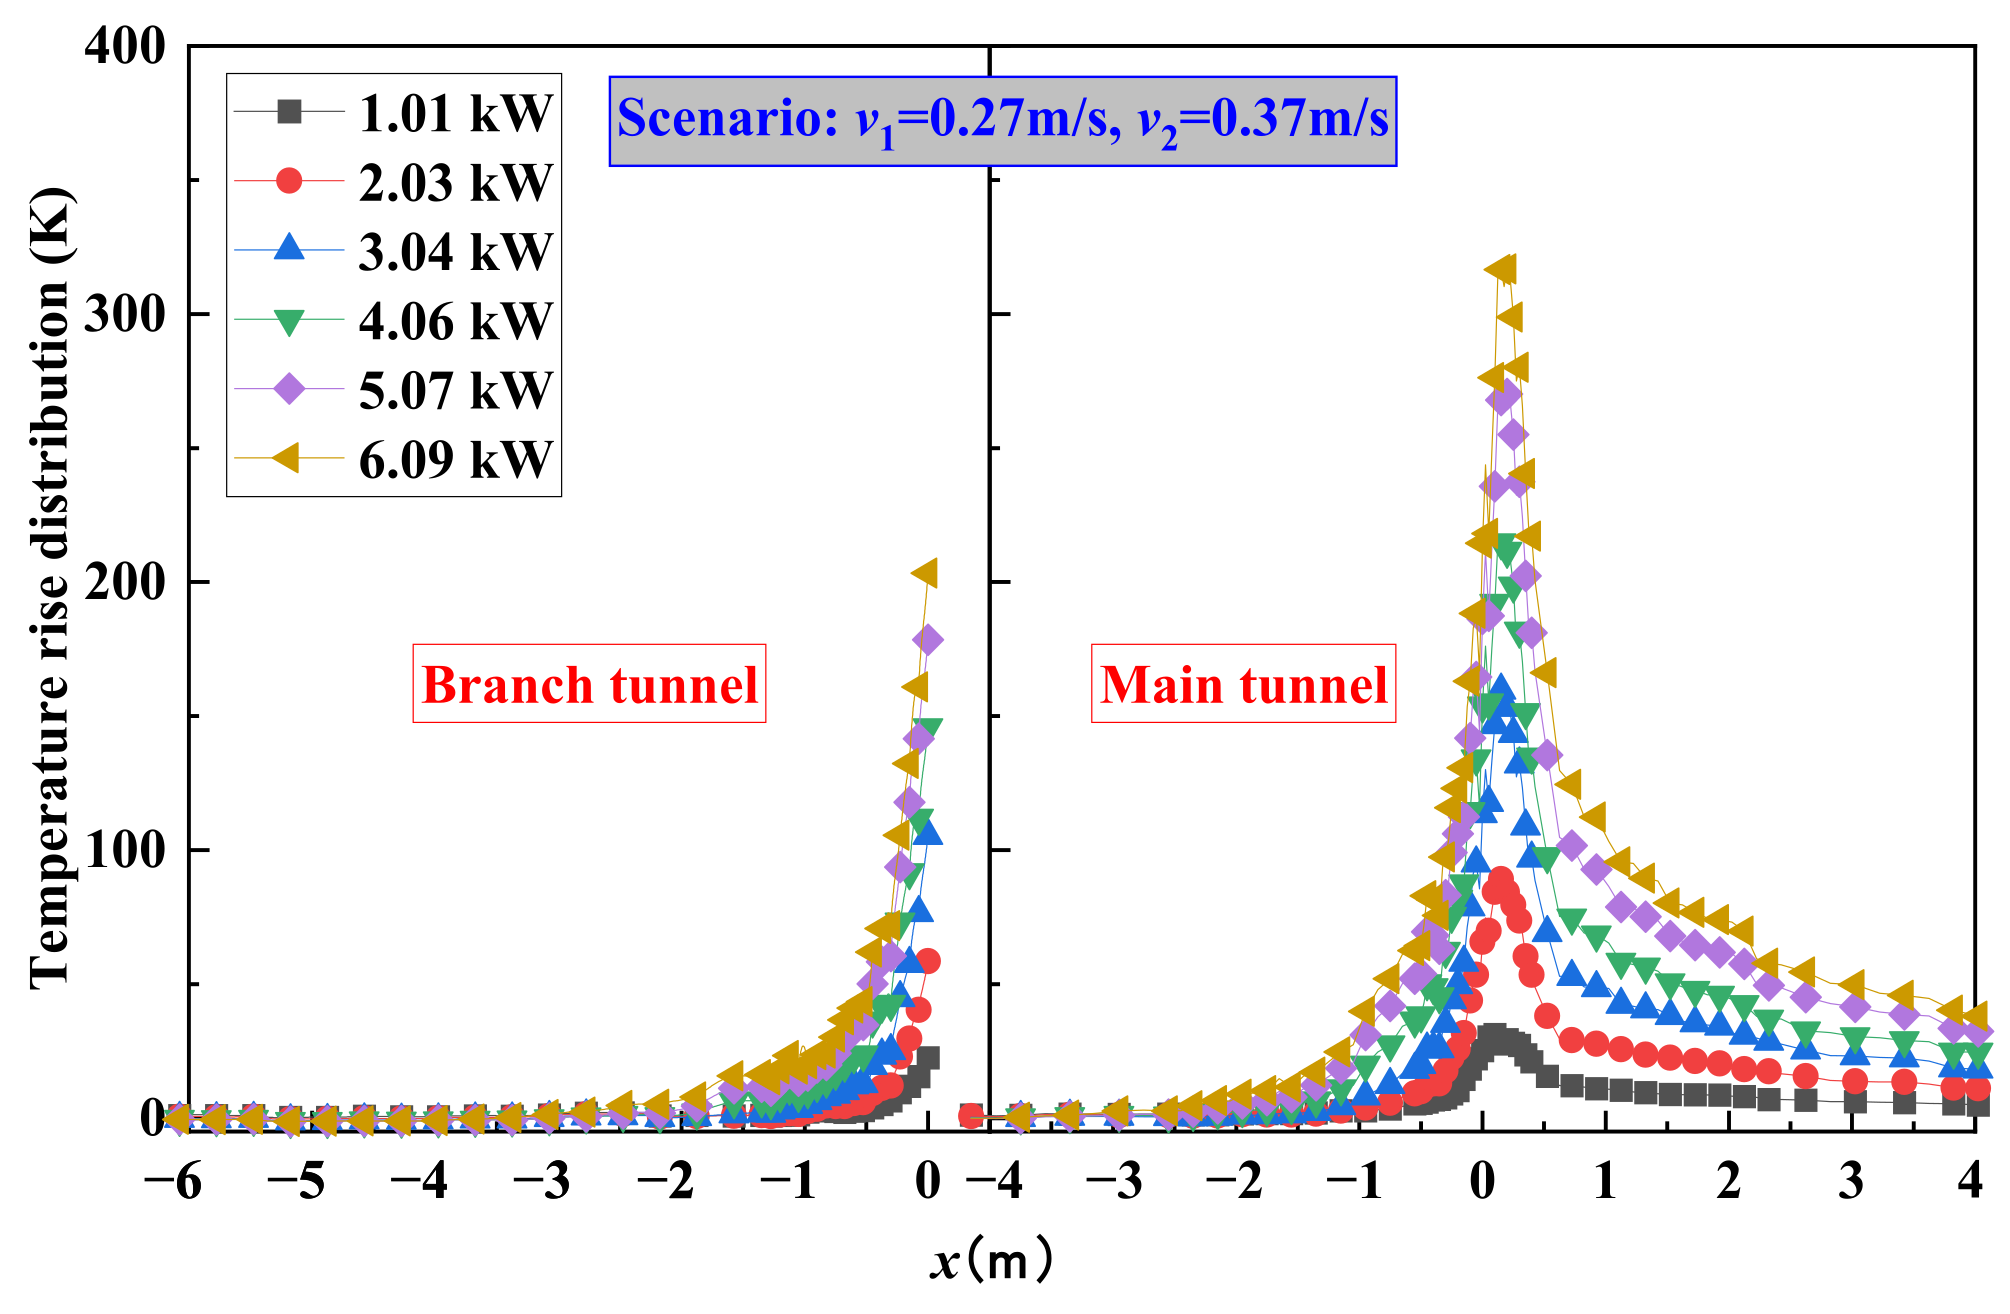
The maximum temperature rise is jointly determined by the HRR and cooperative ventilation. A higher HRR leads to a larger Δ T max . The influence of cooperative ventilation can be categorized based on the fire location. Before the fire enters the branch tunnel, ventilation in both the main and branch tunnels reduces Δ T max . After the fire moves into the branch tunnel, ventilation in the main tunnel transitions to increasing Δ T max . Considering variations in fire location, HRR, and cooperative ventilation, a prediction model for the maximum temperature in interconnected tunnels has been proposed.
(2)
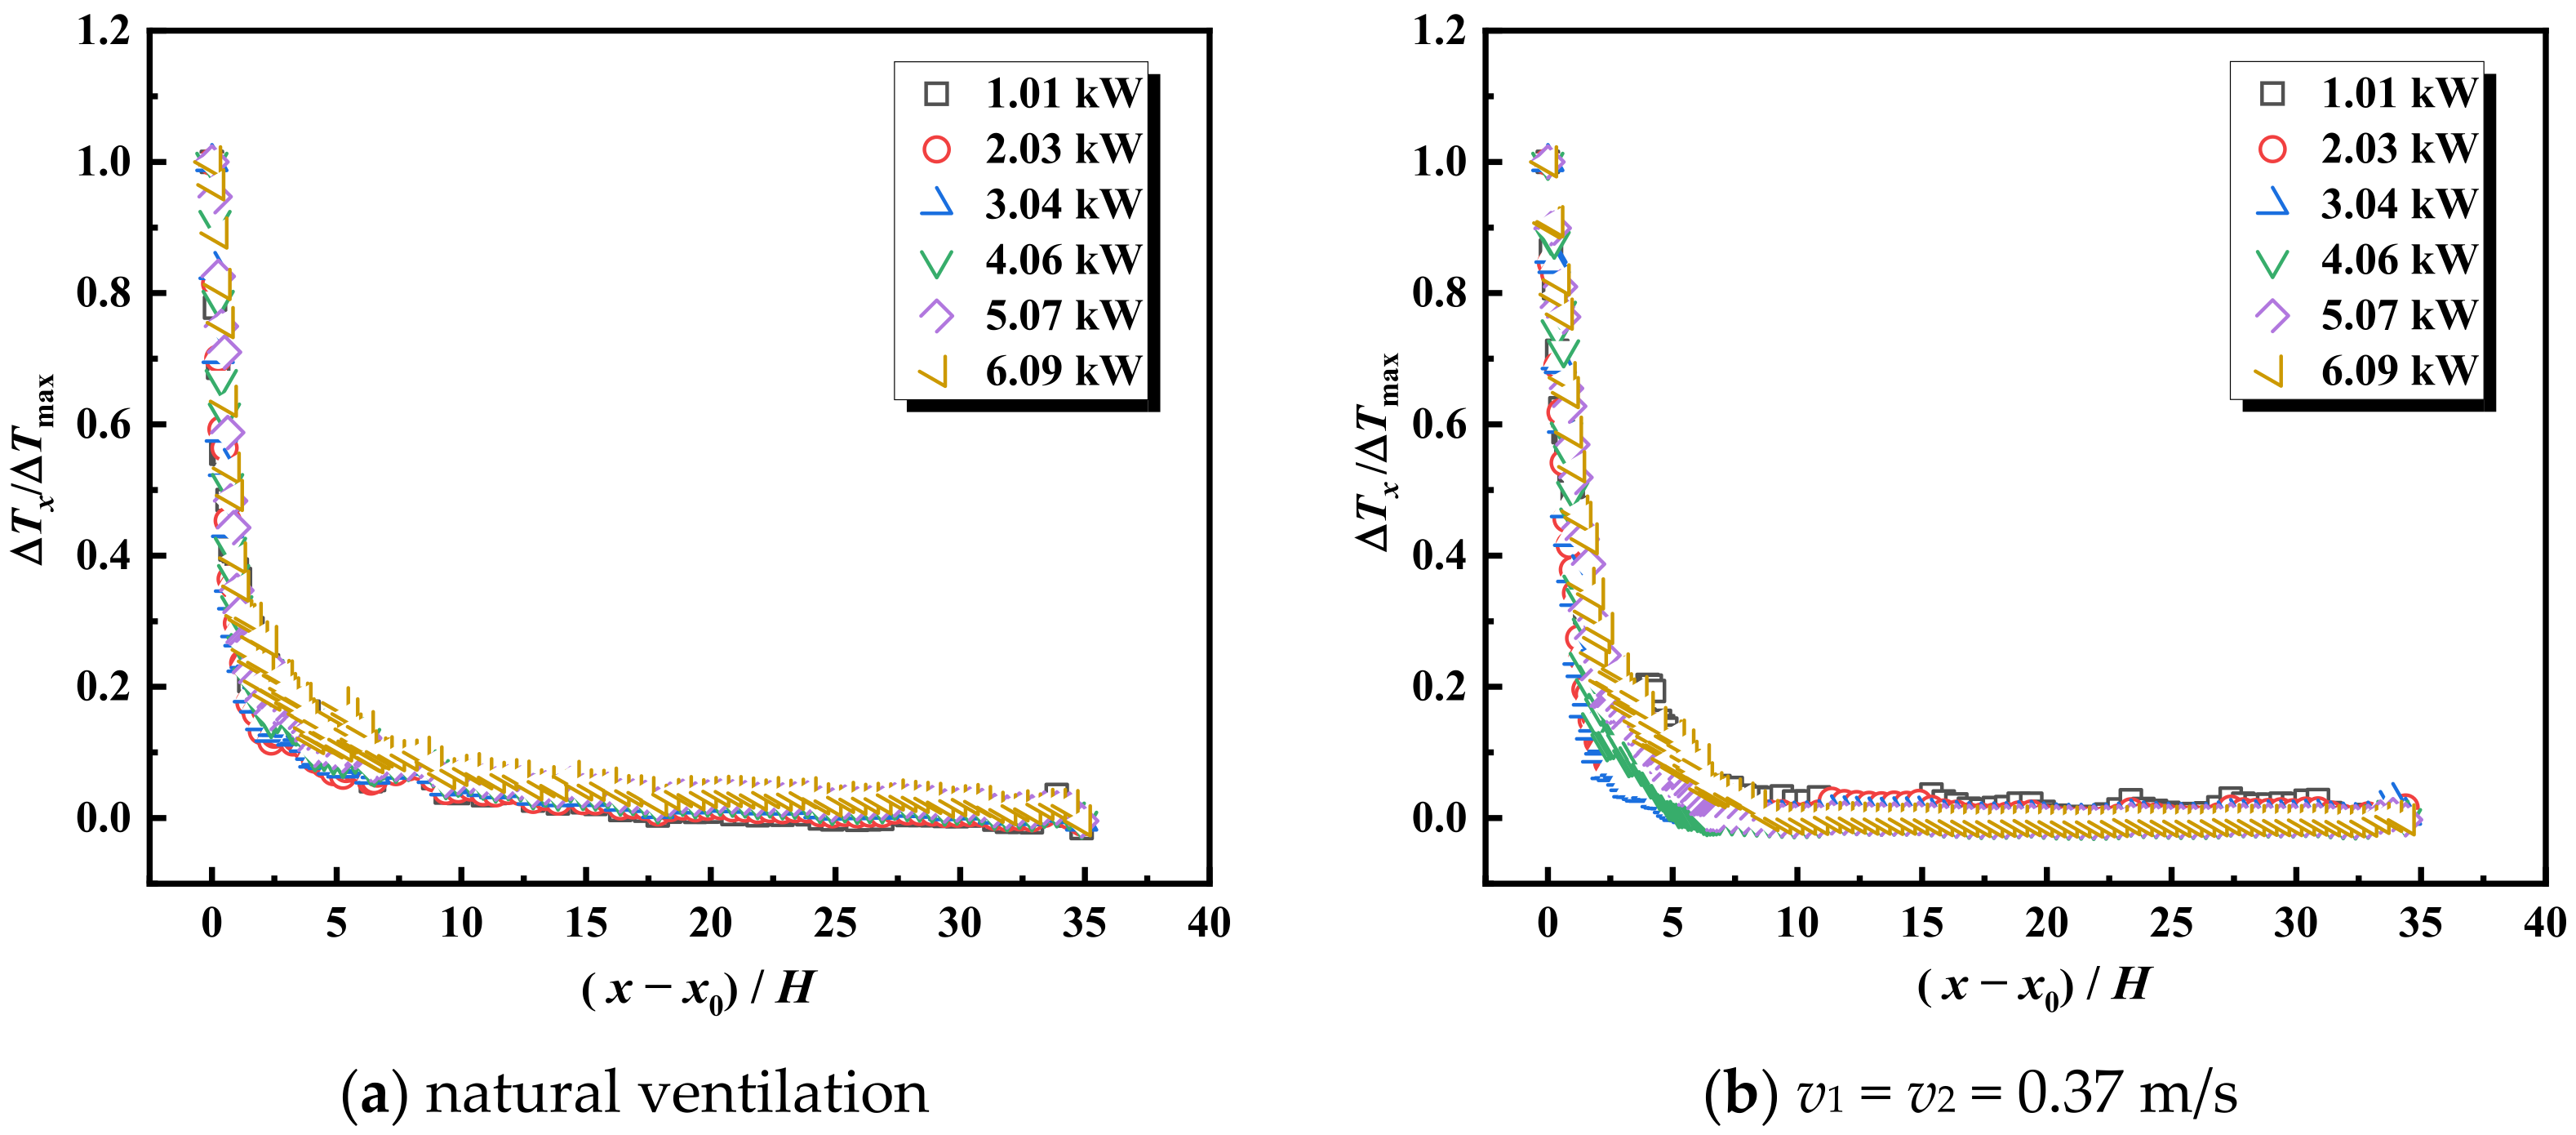
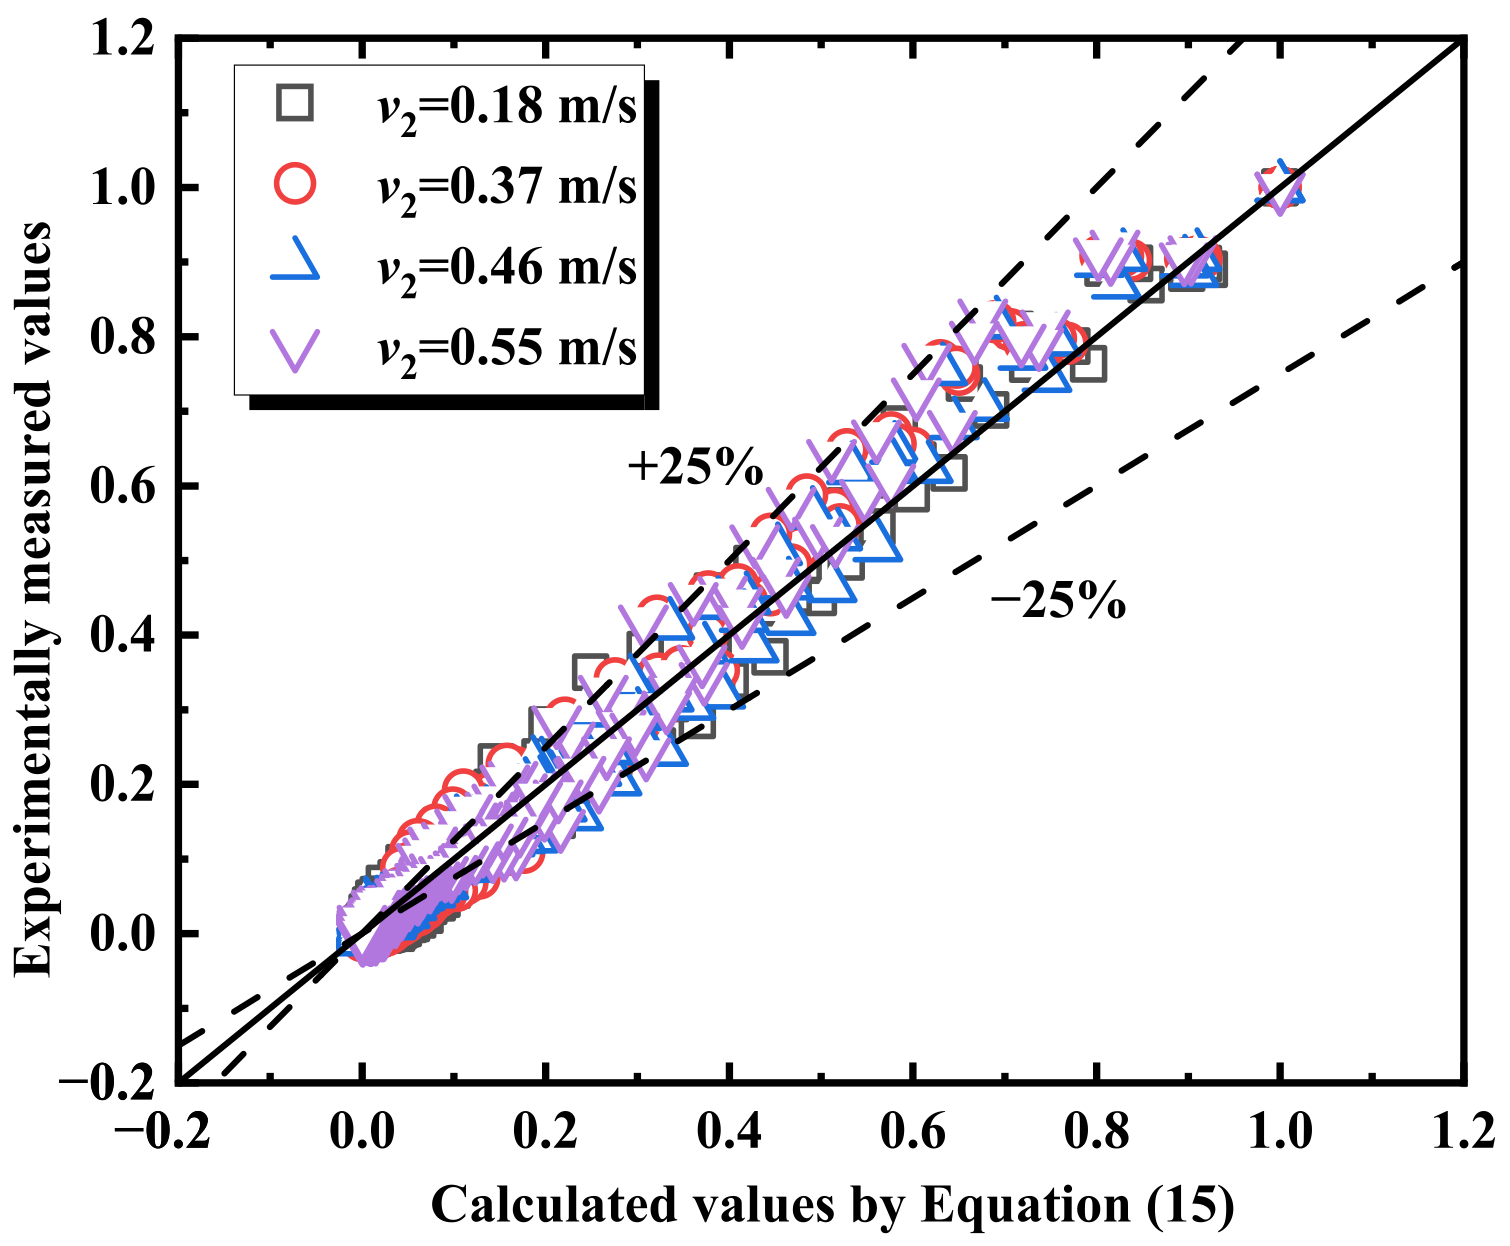
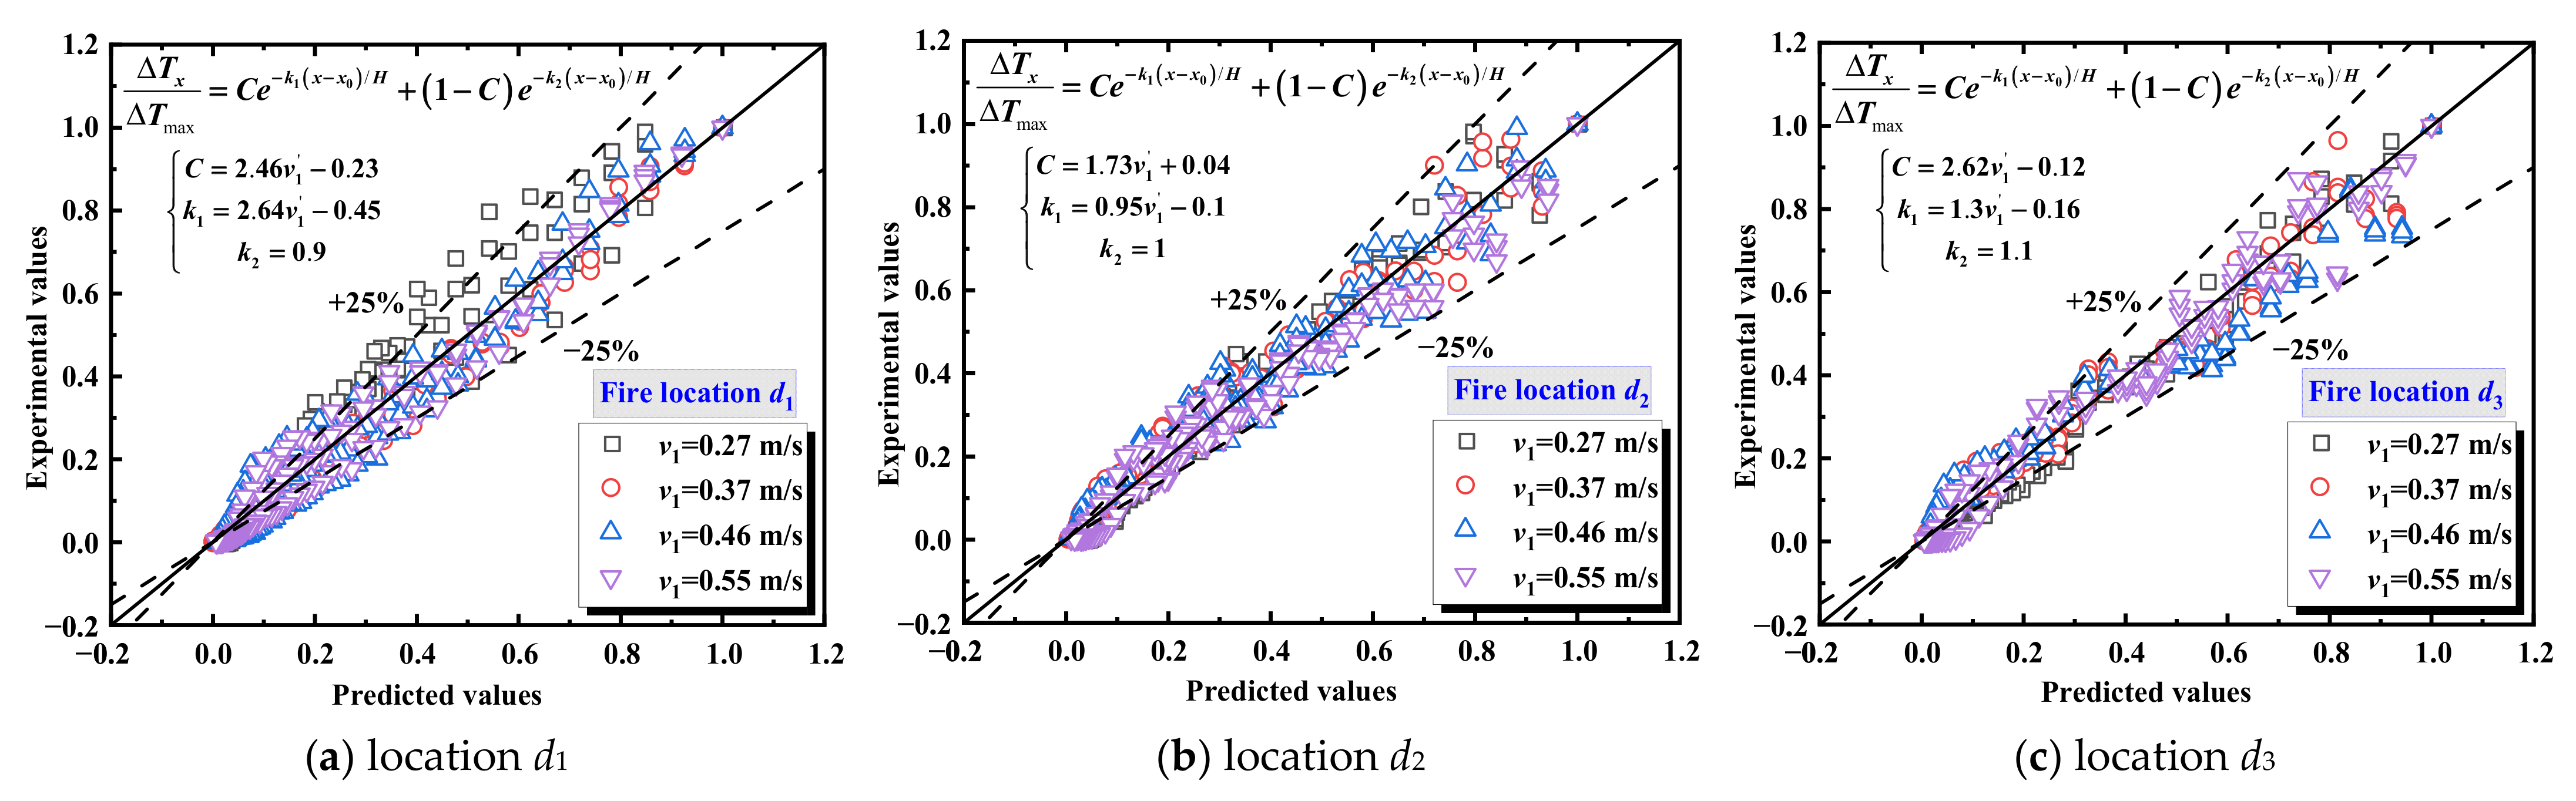
The dimensionless longitudinal temperature distribution is minimally affected by the HRR. When fire is at the intersection of the central axis (d0), the temperature decay upstream of the branch tunnel is closely related to v2. However, after the fire source moves to the entrance or inside the branch tunnel, the influence of the main tunnel’s airflow becomes minimal. Combining cooperative ventilation and the HRR, a predictive model for the temperature decay upstream of the branch tunnel under different fire locations in interconnected tunnel has been proposed.
(3)
A higher HRR enhances the thermal driving force of smoke, leading to a broader spread range. The spread of smoke within the tunnel is jointly affected by the fire location and cooperative ventilation. Before the fire enters the branch tunnel, ventilation in both the main and branch tunnels can effectively control smoke spread. The smoke spread range decreases with increasing velocity. After the fire moves into the branch tunnel, the impact of ventilation airflow transitions from suppressing smoke spread to increasing its diffusion range in the interconnected tunnel.
(4)
In underground interconnected tunnels, smoke movement characteristics are complex and variable. To better ensure personnel safety, smoke control strategies should be formulated based on the existing tunnel smoke extraction system (longitudinal smoke exhaust mode or centralized smoke exhaust mode) and actual fire scenarios (fire location).
In this paper, we primarily considered the variations in fire locations and ventilation schemes to investigate smoke spread patterns within a tunnel. The findings can provide a reference for smoke control in complex tunnel structures. However, the current research did not account for the effects of bifurcation angles and tunnel slopes, which warrant further investigation in the future.

Author Contributions

H.Y.: Conceptualization; Methodology; Writing—original draft. Data curation; Formal analysis; Investigation. Z.X.: Funding acquisition; Project administration; Supervision; Investigation. Z.Y.: Investigation. Y.Y.: Formal analysis. W.J.: Resources; Supervision; Writing—review & editing. All authors have read and agreed to the published version of the manuscript.

Funding

This research was funded by the National Natural Science Foundation of China (Grant No. 52176146).

Institutional Review Board Statement

Not applicable.

Informed Consent Statement

Not applicable.

Data Availability Statement

The data and other information can be obtained by contacting the e-mail address zhshxu@csu.edu.cn.

Conflicts of Interest

The authors declare no conflicts of interest.

References

  1. Tao, H.W.; Xu, Z.S.; Zhang, Y.C.; Zhang, X.C.; Fan, C.G. Application of the longitudinal ventilation system in the underground interconnected infrastructure: Assessment of flow distribution and confluence ratio. J. Wind Eng. Ind. Aerod. 2023, 239, 105466. [Google Scholar] [CrossRef]
  2. Babrauskas, V.; Gann, R.G.; Levin, B.C.; Paabo, M.; Yusa, S. A methodology for obtaining and using toxic potency data for fire hazard analysis. Fire Saf. J. 1998, 31, 345–358. [Google Scholar] [CrossRef]
  3. Hietainemi, J.; Kallonen, R.; Mikkola, E. Burning characteristics of selected substances: Production of heat, smoke and chemical species. Fire Mater. 1999, 23, 171–185. [Google Scholar] [CrossRef]
  4. Alpert, R.L. Calculation of response time of ceiling-mounted fire detectors. Fire Technol. 1972, 8, 181–195. [Google Scholar] [CrossRef]
  5. Ji, J.; Fan, C.G.; Zhong, W.; Shen, X.B.; Sun, J.H. Experimental investigation on influence of different transverse fire locations on maximum smoke temperature under the tunnel ceiling. Int. J. Heat Mass Tran. 2012, 55, 4817–4826. [Google Scholar] [CrossRef]
  6. Alpert, R.L. Turbulent ceiling-jet induced by large-scale fires. Combust. Sci. Technol. 1975, 11, 197–213. [Google Scholar] [CrossRef]
  7. Li, Y.Z.; Lei, B.; Ingason, H. The maximum temperature of buoyancy-driven smoke flow beneath the ceiling in tunnel fires. Fire Saf. J. 2011, 46, 204–210. [Google Scholar] [CrossRef]
  8. Kurioka, H.; Oka, Y.; Satoh, H.; Sugawa, O. Fire properties in near field of square fire source with longitudinal ventilation in tunnels. Fire Saf. J. 2003, 38, 319–340. [Google Scholar] [CrossRef]
  9. Gao, Z.H.; Ji, J.; Fan, C.G.; Sun, J.H.; Zhu, J.P. Influence of sidewall restriction on the maximum ceiling gas temperature of buoyancy-driven thermal flow. Energy Build. 2014, 84, 13–20. [Google Scholar] [CrossRef]
  10. Gao, Z.H.; Ji, J.; Fan, C.G.; Sun, J.H. Experimental analysis of the influence of accumulated upper hot layer on the maximum ceiling gas temperature by a modified virtual source origin concept. Int. J. Heat Mass Tran. 2015, 84, 262–270. [Google Scholar] [CrossRef]
  11. Hu, L.H.; Chen, L.F.; Wu, L.; Li, Y.F.; Zhang, J.Y.; Meng, N. An experimental investigation and correlation on buoyant gas temperature below ceiling in a slopping tunnel fire. Appl. Therm. Eng. 2013, 51, 246–254. [Google Scholar] [CrossRef]
  12. Ji, J.; Wan, H.X.; Li, K.Y.; Han, J.Y.; Sun, J.H. A numerical study on upstream maximum temperature in inclined urban road tunnel fires. Int. J. Heat Mass Tran. 2015, 88, 516–526. [Google Scholar] [CrossRef]
  13. Liu, F.; Yu, L.X.; Weng, M.C.; Lu, X.L. Study on longitudinal temperature distribution of fire-induced ceiling flow in tunnels with different sectional coefficients. Tunn. Undergr. Space Technol. 2016, 54, 49–60. [Google Scholar] [CrossRef]
  14. Li, Y.Z.; Ingason, H. The maximum ceiling gas temperature in a large tunnel fire. Fire Saf. J. 2012, 48, 38–48. [Google Scholar] [CrossRef]
  15. Li, Y.Z.; Ingason, H. Position of maximum ceiling temperature in a tunnel fire. Fire Technol. 2014, 50, 889–905. [Google Scholar] [CrossRef]
  16. Shi, C.L.; Li, J.; Xu, X. Full-scale tests on smoke temperature distribution in long-large subway tunnels with longitudinal mechanical ventilation. Tunn. Undergr. Space Technol. 2021, 109, 103784. [Google Scholar] [CrossRef]
  17. Liu, C.; Zhong, M.H.; Tian, X.L.; Zhang, P.H.; Xiao, Y.; Mei, Q. Experimental and numerical study on fire-induced smoke temperature in connected area of metro tunnel under natural ventilation. Int. J. Therm. Sci. 2019, 138, 84–97. [Google Scholar] [CrossRef]
  18. Huang, Y.B.; Li, Y.F.; Li, J.M.; Li, J.X.; Wu, K.; Zhu, K.; Li, H.H. Experimental investigation on maximum gas temperature beneath the ceiling in a branched tunnel fire. Int. J. Therm. Sci. 2019, 145, 105997. [Google Scholar] [CrossRef]
  19. Lei, P.; Chen, C.K.; Zhang, Y.L.; Xu, T.; Sun, H.K. Experimental study on temperature profile in a branched tunnel fire under natural ventilation considering different fire locations. Int. J. Therm. Sci. 2021, 159, 106631. [Google Scholar] [CrossRef]
  20. Li, Z.S.; Gao, Y.J.; Li, X.S.; Mao, P.F.; Zhang, Y.C.; Jin, K.Y.; Li, T.; Chen, L.F. Effects of transverse fire locations on flame length and temperature distribution in a bifurcated tunnel fire. Tunn. Undergr. Space Technol. 2021, 112, 103893. [Google Scholar] [CrossRef]
  21. Tao, H.W.; Xu, Z.S.; Zhang, Y.C.; Zhang, X.C.; Fan, C.G. An experimental study on the smoke spread in underground interconnected infrastructure with longitudinal ventilation. Tunn. Undergr. Space Technol. 2023, 142, 105381. [Google Scholar] [CrossRef]
  22. Chen, L.F.; Mao, P.F.; Zhang, Y.C.; Xing, S.S.; Li, T. Experimental study on smoke characteristics of bifurcated tunnel fire. Tunn. Undergr. Space Technol. 2020, 98, 103295. [Google Scholar] [CrossRef]
  23. Chen, L.F.; Zhou, S.X.; Lan, Y.J.; Liu, X.Y.; Yang, Y.P.; Li, X.S.; Yan, X.E.; Chen, H.F. Experimental study on fire characteristics of the bifurcated tunnel under multi-directional ventilation. Int. J. Therm. Sci. 2023, 185, 108072. [Google Scholar] [CrossRef]
  24. Delichatsios, M.A. The flow of fire gases under a beamed ceiling. Combust. Flame 1981, 43, 1–10. [Google Scholar] [CrossRef]
  25. Hu, L.H.; Huo, R.; Chow, W.K.; Wang, H.B.; Yang, R.X. Decay of buoyant smoke layer temperature along the longitudinal direction in tunnel fires. J. Appl. Fire Sci. 2005, 13, 53–57. [Google Scholar] [CrossRef]
  26. Tao, L.L.; Zeng, Y.H. Effect of single-side centralized exhaust on smoke control and temperature distribution in longitudinal ventilation tunnel fires. Tunn. Undergr. Space Technol. 2022, 119, 104241. [Google Scholar] [CrossRef]
  27. Tao, L.L.; Zeng, Y.H.; Li, J.; Yang, G.C.; Fang, Y.; Li, B.J. Study on the maximum temperature and temperature decay in single-side centralized smoke exhaust tunnel fires. Int. J. Therm. Sci. 2022, 172, 107277. [Google Scholar] [CrossRef]
  28. Ingason, H.; Li, Y.Z. Model scale tunnel fire tests with longitudinal ventilation. Fire Saf. J. 2010, 45, 371–384. [Google Scholar] [CrossRef]
  29. Huang, Y.B.; Li, Y.F.; Li, J.X.; Wu, K.; Li, H.H.; Zhu, K. Experimental study on the temperature longitudinal distribution induced by a branched tunnel fire. Int. J. Therm. Sci. 2021, 170, 107175. [Google Scholar] [CrossRef]
  30. Gong, L.A.; Jiang, L.; Li, S.Y.; Shen, N.; Zhang, Y.C.; Sun, J.H. Theoretical and experimental study on longitudinal smoke temperature distribution in tunnel fires. Int. J. Therm. Sci. 2016, 102, 319–328. [Google Scholar] [CrossRef]
  31. Ying, H.L.; Xu, Z.S.; Liu, Q.L.; Zhen, Y.X.; Tao, H.W.; Yu, Z.H.; Zhao, J.M. Experimental study on the impact of blockage ratio on smoke propagation in underground interconnected tunnel. Int. J. Therm. Sci. 2024, 203, 109150. [Google Scholar] [CrossRef]
Figure 1. Underground interconnected tunnel diagram.
Fire 08 00110 g001
Figure 2. The model-scale underground interconnected tunnel diagram.
Fire 08 00110 g002
Figure 3. Thermocouple distribution in the tunnel.
Fire 08 00110 g003
Figure 4. Influence of longitudinal velocity in the branch tunnel on Δ T max .
Fire 08 00110 g004
Figure 5. Influence of longitudinal velocity in the main tunnel on Δ T max .
Fire 08 00110 g005aFire 08 00110 g005b
Figure 6. Comparison with Li’s model ( v * > 0.19 ).
Fire 08 00110 g006
Figure 7. Relationship between Δ T max / T 0 and v0 under cooperative ventilation.
Fire 08 00110 g007
Figure 8. Comparison of predictive model with experimental data (d0).
Fire 08 00110 g008
Figure 9. Effect of longitudinal velocity on maximum temperature at position d1.
Fire 08 00110 g009
Figure 10. Comparison of predictive and experimental values at location d1.
Fire 08 00110 g010
Figure 11. Impact of longitudinal velocity on Δ T max for positions d2 and d3.
Fire 08 00110 g011
Figure 12. Comparison of predictive and experimental values at locations d2 and d3.
Fire 08 00110 g012
Figure 13. Longitudinal temperature distribution in main tunnel under natural ventilation.
Fire 08 00110 g013
Figure 14. Effect of HRR on dimensionless longitudinal temperature distribution.
Fire 08 00110 g014
Figure 15. Dimensionless temperature decay in the branch tunnel at d0.
Fire 08 00110 g015
Figure 16. Comparison between predicted dimensionless temperature and measured value in the branch tunnel at d0.
Fire 08 00110 g016
Figure 17. Comparison of predicted and experimental Δ T x / Δ T max upstream of the branch tunnel at locations d1~d3.
Fire 08 00110 g017
Figure 18. Smoke spread under different HRRs with the same ventilation scheme.
Fire 08 00110 g018
Figure 19. Smoke spread at different fire locations.
Fire 08 00110 g019
Table 1. Experimental scenarios.
TestsFire LocationHeat Release Rate Q ˙ (kW)Longitudinal Ventilation Velocity of the Branch Tunnel v1 (m/s)Longitudinal Ventilation Velocity of the Main Tunnel v2 (m/s)
Base01~06d0 (0 m)1.01,
2.03,
3.04,
4.06,
5.07,
6.09
00
A01~A96d0 (0 m)0, 0.27, 0.37, 0.640.18, 0.37, 0.46, 0.55
B01~B72d1 (0.25 m)0.27, 0.37, 0.46, 0.550.18, 0.37, 0.55
C01~C72d2 (0.55 m)0.27, 0.37, 0.46, 0.550.18, 0.37, 0.55
D01~D72d3 (1.15 m)0.27, 0.37, 0.46, 0.550.18, 0.37, 0.55
Table 2. Summary of coefficients in the branch tunnel at d0.
CaseCoefficient CCoefficient k1Coefficient k2
v2 = 0.18 m/s0.26v1 = 0 m/s, k1 = 0.06
v1 = 0.27 m/s, k1 = 0.16
v1 = 0.37 m/s, k1 = 0.26
v1 = 0.64 m/s, k1 = 0.81
0.9
v2 = 0.37 m/s0.24
v2 = 0.46 m/s0.14
v2 = 0.55 m/s0.15
Table 3. Statistics on upstream temperature attenuation coefficients for branch tunnel at locations d1~d3.
Fire LocationCaseCoefficient CCoefficient k1Coefficient k2
d1v1 = 0.27 m/s0.280.090.9
v1 = 0.37 m/s0.390.220.94
v1 = 0.46 m/s0.550.380.88
v1 = 0.55 m/s0.760.610.89
d2v1 = 0.27 m/s0.390.100.99
v1 = 0.37 m/s0.490.131.12
v1 = 0.46 m/s0.570.181.05
v1 = 0.55 m/s0.740.291.02
d3v1 = 0.27 m/s0.410.111.04
v1 = 0.37 m/s0.560.171.11
v1 = 0.46 m/s0.710.241.08
v1 = 0.55 m/s0.930.371.15
Disclaimer/Publisher’s Note: The statements, opinions and data contained in all publications are solely those of the individual author(s) and contributor(s) and not of MDPI and/or the editor(s). MDPI and/or the editor(s) disclaim responsibility for any injury to people or property resulting from any ideas, methods, instructions or products referred to in the content.

