Article

The Lookout Mountain Thinning and Fuels Reduction Study, Central Oregon: Tree Mortality 2–9 Years After Treatments

by
Christopher J. Fettig
1,*,
Jackson P. Audley
1,
Leif A. Mortenson
2,
Shakeeb M. Hamud
1 and
Robbie W. Flowers
3
1
U.S. Department of Agriculture, Forest Service, Pacific Southwest Research Station, 1323 Club Drive, Vallejo, CA 94592, USA
2
U.S. Department of Agriculture, Forest Service, Pacific Southwest Research Station, 2480 Carson Road, Placerville, CA 95667, USA
3
U.S. Department of Agriculture, Forest Service, Forest Health Protection, 63095 Deschutes Market Road, Bend, OR 97701, USA
*
Author to whom correspondence should be addressed.
Fire 2025, 8(3), 109; https://doi.org/10.3390/fire8030109
Submission received: 6 December 2024 / Revised: 5 February 2025 / Accepted: 10 March 2025 / Published: 13 March 2025

Abstract

:
Wildfire activity in the western U.S. has highlighted the importance of effective management to address this growing threat. The Lookout Mountain Thinning and Fuels Reduction Study (LMS) is an operational-scale, long-term study of the effects of forest restoration and fuel reduction treatments in ponderosa pine (Pinus ponderosa Dougl. ex Laws.) and mixed-conifer forests in central Oregon, U.S. The broad objectives of the LMS are to examine the effectiveness and longevity of treatments on wildfire risk and to assess the collateral effects. Treatments include four levels of overstory thinning followed by mastication of the understory vegetation and prescribed burning. Stands were thinned to residual densities of 50, 75, or 100% of the upper management zone (UMZ), which accounts for site differences as reflected by stand density relationships for specific plant communities. A fourth treatment combines the 75 UMZ with small gaps (~0.1 ha) to facilitate regeneration (75 UMZ + Gaps). A fifth treatment comprises an untreated control (UC). We examined the causes and levels of tree mortality that occurred 2–9 years after treatments. A total of 391,292 trees was inventoried, of which 2.3% (9084) died. Higher levels of tree mortality (all causes) occurred on the UC (7.1 ± 1.9%, mean ± SEM) than on the 50 UMZ (0.7 ± 0.1%). Mortality was attributed to several bark beetle species (Coleoptera: Curculionidae) (4002 trees), unknown factors (2682 trees), wind (1958 trees), suppression (327 trees), snow breakage (61 trees), prescribed fire (19 trees), western gall rust (15 trees), cankers (8 trees), mechanical damage (5 trees), dwarf mistletoe (4 trees), and woodborers (3 trees). Among bark beetles, tree mortality was attributed to western pine beetle (Dendroctonus brevicomis LeConte) (1631 trees), fir engraver (Scolytus ventralis LeConte) (1580 trees), mountain pine beetle (Dendroctonus ponderosae Hopkins) (526 trees), engraver beetles (Ips spp.) (169 trees), hemlock engraver (Scolytus tsugae (Swaine)) (77 trees), and Pityogenes spp. (19 trees). Higher levels of bark beetle-caused tree mortality occurred on the UC (2.9 ± 0.7%) than on the 50 UMZ (0.3 ± 0.1%) which, in general, was the relationship observed for individual bark beetle species. Higher levels of tree mortality were attributed to wind on the 100 UMZ (1.0 ± 0.2%) and UC (1.2 ± 1.5%) than on the 50 UMZ (0.2 ± 0.02%) and 75 UMZ (0.4 ± 0.1%). Higher levels of tree mortality were attributed to suppression on the UC (0.5 ± 0.3%) than on the 50 UMZ (0.003 ± 0.002%) and 75 UMZ + Gaps (0.0 ± 0.0%). Significant positive correlations were observed between measures of stand density and levels of tree mortality for most causal agents. Tree size (diameter at 1.37 m) frequently had a significant effect on tree mortality, but relationships varied by causal agent. The forest restoration and fuels reduction treatments implemented on the LMS increased resistance to multiple disturbances. The implications of these and other results to the management of fire-adapted forests are discussed.

1. Introduction

Many low to mid-elevation (e.g., <2500 m) forests in the Pacific Northwest, U.S., are fire-adapted [1]. Compared to their historic counterparts, contemporary forests have denser forest structures, more surface fuels, and increased fuel continuities. Changes in the composition of understory and overstory plants are also evident, with contemporary forests dominated by more shade-tolerant and fire-intolerant species (e.g., fir, Abies). Among other factors, wildfire suppression and the selective harvesting of large-diameter, fire-tolerant tree species, such as ponderosa pine (Pinus ponderosa Dougl. ex Laws.), contributed to these changes. Recent wildfires have increased public awareness of the prevalence and importance of fire-adapted forests and the urgent need to restore them [2,3]. In the Pacific Northwest, severe wildfires occur during warm, dry conditions [4], the frequency of which is projected to increase with warming and drought [4,5]. Increasing understanding of interactions among forest restoration and fuel reduction treatments and other stressors and disturbances is critical.
Thinning followed by prescribed burning is effective for reducing the incidence of crown fires in fire-adapted forests [6,7,8,9,10]. This is consistent with observations in the Pacific Northwest (e.g., [11]), and there is now widespread support for applying forest restoration and fuel reduction treatments in fire-adapted forests. For example, building on the National Cohesive Wildland Fire Management Strategy [12], the USDA Forest Service (USFS) developed and began implementing the Wildfire Crisis Strategy in 2022 [13]. Under this 10-year strategy, the USFS works with public and private partners to apply forest restoration and fuel reduction treatments using the best available science. The goal is to treat an additional 8 million ha of USFS lands and 12.1 million ha of other federal, state, tribal, and private lands in the U.S. [13].
Since 2000, billions of conifers across tens of millions of hectares have been killed by bark beetles (Coleoptera: Curculionidae) in western North America. Several recent outbreaks are among the largest in recorded history, which is attributed, in part, to the effects of warming and drought on bark beetles and their hosts [14]. As a result, numerous efforts have examined the effects of forest restoration and fuel reduction treatments on levels of tree mortality attributed to bark beetles (reviewed in [15]). While results vary, several trends have been observed. Following thinning, reductions in tree density (a) alter microclimates, affecting beetle fecundity and fitness as well as the phenology and voltinism of bark beetles and their predators, parasites, and competitors [16]; (b) reduce competition increasing the resistance of residual host trees to colonization by bark beetles [16]; (c) alter host availability; and (d) disrupt pheromone plumes used for recruiting conspecific bark beetles to a host tree [17]. Volatiles released by hosts during and after thinning and nonhosts also influence the behavior of bark beetles. For example, Fettig et al. [18] showed that chipping unmerchantable ponderosa pines and depositing the chips back into treated stands increased the risk of infestation by bark beetles. The effect was attributed to volatiles (terpenes) released from the chips which were attractive to some bark beetle species, especially in the presence of their aggregation pheromone [19]. Following prescribed fire, bark beetles often colonize and kill fire-injured trees that otherwise would have survived.
The objectives of our study were to determine the causes and levels of tree mortality that occurred 2–9 years after forest restoration and fuel reduction treatments were implemented on the LMS. These efforts expand on Fettig et al. [20] who described the causes and levels of tree mortality that occurred one year after treatments were implemented. Comparisons are made with [20] and other literature and discussed in the context of managing fire-adapted forests.

2. Materials and Methods

2.1. Study Site

The LMS is conducted on Pringle Falls Experimental Forest on the Deschutes National Forest, central Oregon, U.S. (43°42′ N, 121°37′ W). Stands of ponderosa pine predominate at lower elevations with mixtures of lodgepole pine (Pinus contorta Dougl.), grand fir (Abies grandis (Douglas ex D. Don) Lindley), white fir (Abies concolor (Gord. and Glend.) Hildebr.), sugar pine (Pinus lambertiana Dougl.), Douglas fir (Pseudotsuga menziesii (Mirb.) Franco), western white pine (Pinus monticola Dougl. ex D. Don), and mountain hemlock (Tsuga mertensiana (Bong.) Carr.) at higher elevations. Four blocks were created based on similarities among plant associations within blocks. Initially, five experimental units (ranging from ~24 to 155 ha) were established in each block, but was later adjusted following the detection of a pair of nesting northern spotted owls (Strix occidentalis caurina (Merriam)) [21]. The northern spotted owl, an old-growth, obligate species, is threatened in Oregon and was accounted for by establishing a no-treatment buffer around the nest site and reconfiguring some experimental unit boundaries. As a result, an experimental unit in block 1 (75 UMZ + Gaps, defined below) was removed. The untreated control units (UC, defined below) retained compositional and structural characteristics (e.g., less fire-adapted species, high surface and aerial fuel loads, and high tree densities) that are highly susceptible to catastrophic wildfire. Given this concern, the UC units were smaller in size than other treatment units. Detailed maps and imagery of the LMS are available in [21], and we encourage the reader to consult [21] for a comprehensive review of the LMS.

2.2. Treatments

The treatments included the following:
(1)
Fifty (50) UMZ (low density stand): Thinned from below to 50% of the upper management zone (UMZ) for the dominant plant association based on stand density index (SDI) values for ponderosa pine. Stand densities were reduced by removing trees from the subdominant crown classes to improve residual tree growth and tree vigor. Thinning was followed by masticating and prescribed burning;
(2)
Seventy-five (75) UMZ (medium density stand): Thinned from below to 75% of the UMZ followed by masticating and prescribed burning;
(3)
Seventy-five (75) UMZ + Gaps (medium density stand): Thinned from below to 75% of the UMZ followed by masticating and prescribed burning. Small gaps in the canopy (~0.1 ha) were created by augmenting the existing gaps or creating new gaps;
(4)
One hundred (100) UMZ (high density stand): Thinned from below to 100% of the UMZ followed by masticating and prescribed burning;
(5)
Untreated control (UC): No manipulation.
Thinning was conducted in 2011 (block 4), 2012 (block 2), and 2013 (blocks 1 and 3) (Table 1). Leave trees were marked based on their fire tolerance and historic tree species compositions. As a research study on an experimental forest, marking guides were not affected by the 53.3-cm dbh (diameter at 1.37 m in height) harvest limitations common to the region [22]. Lodgepole pine, grand fir, white fir, and small-diameter ponderosa pine were prioritized for harvesting [21]. Masticating occurred within one year of thinning and before prescribed burning (Table 1). Prescribed burning occurred in 2013 (block 4), 2014 (block 2), and 2015 (blocks 1 and 3) in spring (April–June) except for experimental unit 12 (Table 1).

2.3. Data Collection

Following [20], we conducted a 100% cruise (census) of each experimental unit in 2022 (block 4), 2023 (block 2), and 2024 (blocks 1 and 3) to locate trees ≥10.2 cm dbh that died since our first census (2014–2016, Table 1). Trees with fading crowns and snags that were not marked during the first census were tallied. The species, dbh, and causal agent were recorded. Despite the spatial scale of the LMS and the large amount of work involved, a census of tree mortality was conducted due to the contagious nature of some causal agents. For example, killing groups of trees is fundamental to the growth of bark beetle infestations and several species coordinate mass attacks through the use of aggregation pheromones, which results in clusters of tree mortality.
Samples of bark ~625 cm2 were removed from all dead trees with a hatchet at ~2 m in height on two (N and S) aspects to determine if bark beetle galleries were present. The shape of the galleries was used to identify the bark beetle species [23]. Bark removal also served as a means of marking trees that had been tallied. We attributed tree mortality to mountain pine beetle (Dendroctonus ponderosae Hopkins), western pine beetle (Dendroctonus brevicomis LeConte), and fir engraver (Scolytus ventralis LeConte) when evidence of colonization was found despite evidence of other bark beetle species in the same tree. On 48 occasions, we found evidence of mountain pine beetle and western pine beetle in the same tree. For analytical purposes, we attributed mortality to mountain pine beetle when trees were <31.8 cm dbh and to western pine beetle when trees were ≥31.8 cm dbh based on host preferences [23,24]. Mortality was attributed to engraver beetles (Ips spp.) if their galleries were present and evidence of colonization by mountain pine beetle and/or western pine beetle was absent. On occasion, other bark beetle species were found colonizing trees. In some cases, these were attributed as the causal agent. In other cases, they were ignored (e.g., red turpentine beetle, Dendroctonus valens LeConte, and Hylastes, Hylurgops, and Pseudohylesinus spp.). We acknowledge that the role of each bark beetle species in contributing to tree mortality is often unclear and that tree mortality is influenced by multiple factors (e.g., interactions between bark beetles and root diseases). However, we view our attributions as conservative as several bark beetle species initiate colonization in the mid- (e.g., mountain pine beetle and western pine beetle) and upper bole (e.g., Ips) [23] while our sampling was limited to ~2 m in height.
We attributed mortality to wind when there was evidence of windthrow or stem breakage indicative of wind and other causal agents were absent. Similarly, we attributed mortality to snow breakage when there was evidence of stem bending and other causal agents were absent. Suppression was assigned if little or no direct sunlight was received from above or on the sides of the crown and other causal agents were absent. Prescribed fire was assigned when the lower bole was charred on all sides see [20] and other causal agents were absent. Mechanical damage was assigned when a tree was damaged by logging equipment and other causal agents were absent. Mortality of trees for which no causal agents were identified was recorded as unknown.

2.4. Analyses

The proportions of trees killed were analyzed using generalized linear mixed-effects models with a beta-binomial distribution and a logit link to handle overdispersion and discrete tree counts with a binomial outcome [25,26]. Fit and model assumptions were assessed by visually inspecting scaled residual plots and by KS, dispersion, and outlier tests. Final model selections were informed by AIC values [27]. Treatment and dbh class (1 = 10.2–20.3, 2 = 20.4–30.5, 3 = 30.6–40.6, 4 = 40.7–50.8, and 5 = >50.8 cm) were fixed effects and block was a random effect. Interactions between treatments and dbh classes were considered. When applicable, the differences in mean proportions were analyzed using a post hoc, least square means test with the Tukey’s HSD correction. In one instance, the models failed to converge, and differences among treatments and dbh classes were identified via Kruskal–Wallis tests followed by pairwise Dunn’s tests with Bonferroni corrections. Relationships between trees/ha, basal area (m2/ha) and SDI, and levels of tree mortality were analyzed using Spearman’s Rank correlation tests. Proportions of trees killed by causal agents were compared between the first and second census via pairwise, two-sample tests for equality of proportions. Analyses were conducted using generalized linear mixed model TMB, DHARMa, emmeans, stats, and base packages with R Statistical Software (version 3.4.4) via RStudio (version 1.2.1335) [28].

3. Results and Discussion

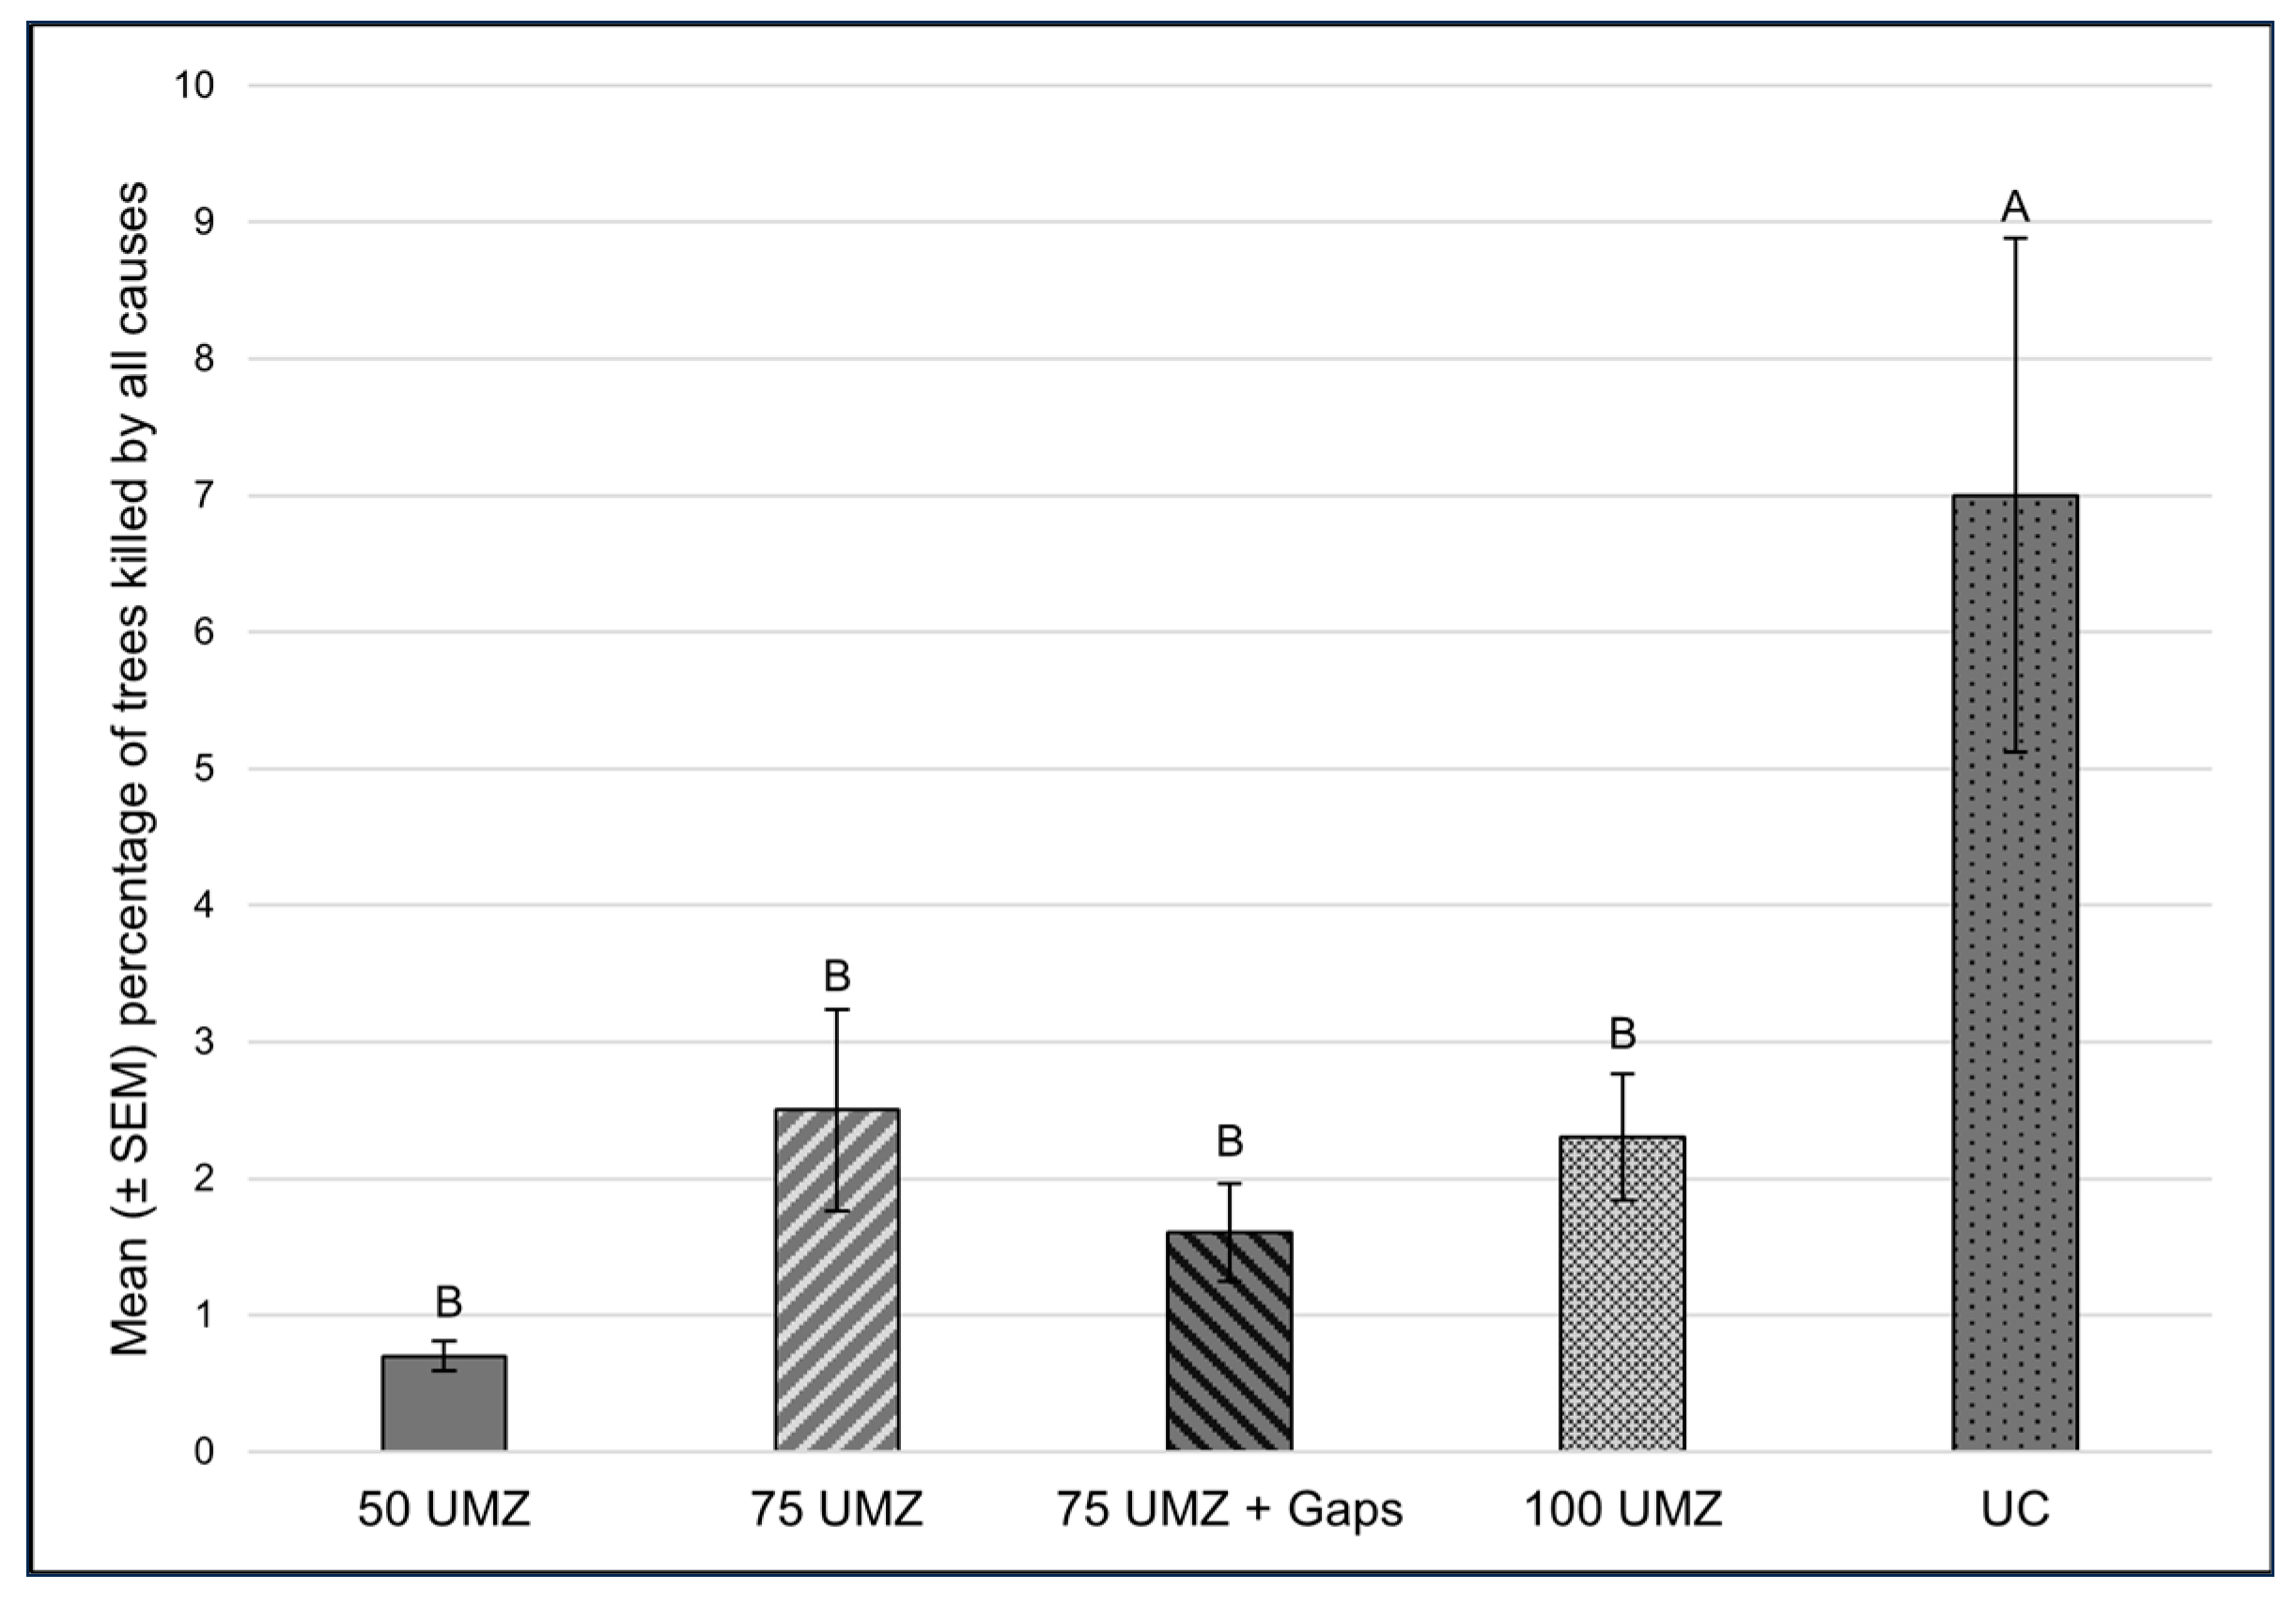
3.1. Tree Mortality Attributed to All Causes

A total of 391,292 trees were inventoried across all experimental units. Ponderosa pine (297,320), grand fir (53,139), lodgepole pine (35,386), and western white pine (3403) were most common. A total of 9084 trees (2.3%) died. Most of the tree mortality was attributed to bark beetles (44.1%), unknown factors (29.5%), and wind (21.6%) (Table 2).
Both treatment and dbh class were retained in the final model; however, only treatment had a significant effect (all causes; χ2 = 37.8, df = 4, p < 0.001). Higher levels of tree mortality occurred on the UC than on 50 UMZ, 75 UMZ, 75 UMZ + Gaps, and 100 UMZ (Z ratios −5.6 to −3.6, p ≤ 0.003 for all comparisons, Figure 1). No other significant differences were observed among treatments. The tree mortality was positively correlated with numbers of trees (rho = 0.64, p = 0.003), basal area (rho = 0.70, p = 0.001), and SDI (rho = 0.69, p = 0.001).
During our first census, the primary causal agents were prescribed fire (61.0%), bark beetles (35.9%), and unknown factors (3.1%) [20]. We attributed (1) a much higher percentage of tree mortality to unknown factors which is explained, in part, by (a) our census capturing tree mortality that occurred 2–9 years after treatments making identifications of causal agents more difficult (e.g., bark sloughing and bole decay inhibited signs and symptoms in some cases); and (b) several Armillaria root disease pockets were observed but our methods limited the attribution of Armillaria root disease as a causal agent (which requires sampling of basal sections and roots). As such, some trees killed by root disease(s) were likely recorded as unknown (e.g., on occasion Armillaria rhizomorphs were observed extending into our sampling windows (~2 m in height) on some grand firs); (2) a much higher percentage of tree mortality to wind, which was expected as thinning initially decreases windfirmness [29]; and (3) a much lower percentage of tree mortality to prescribed fire, which was expected as the effects of prescribed fire usually occur shortly after prescribed fire [15,30] (Table 3).
About 1.1% (4436) of trees died during our first census [20]. Higher levels of tree mortality occurred on the 100 UMZ than on the UC (only 48 of 4436 trees), and no other significant differences were observed among treatments [20]. Fettig et al. [20] suggested that tree mortality on the UC would increase over time, relative to the other treatments, due to higher levels of tree competition. Notably, their results primarily reflect the short-term influences of thinning and prescribed burning on tree susceptibility, and not changes in stand structure and composition on resistance to multiple stressors and disturbances [20], which take longer to manifest. Our results primarily capture the latter and confirm their ascertainment.

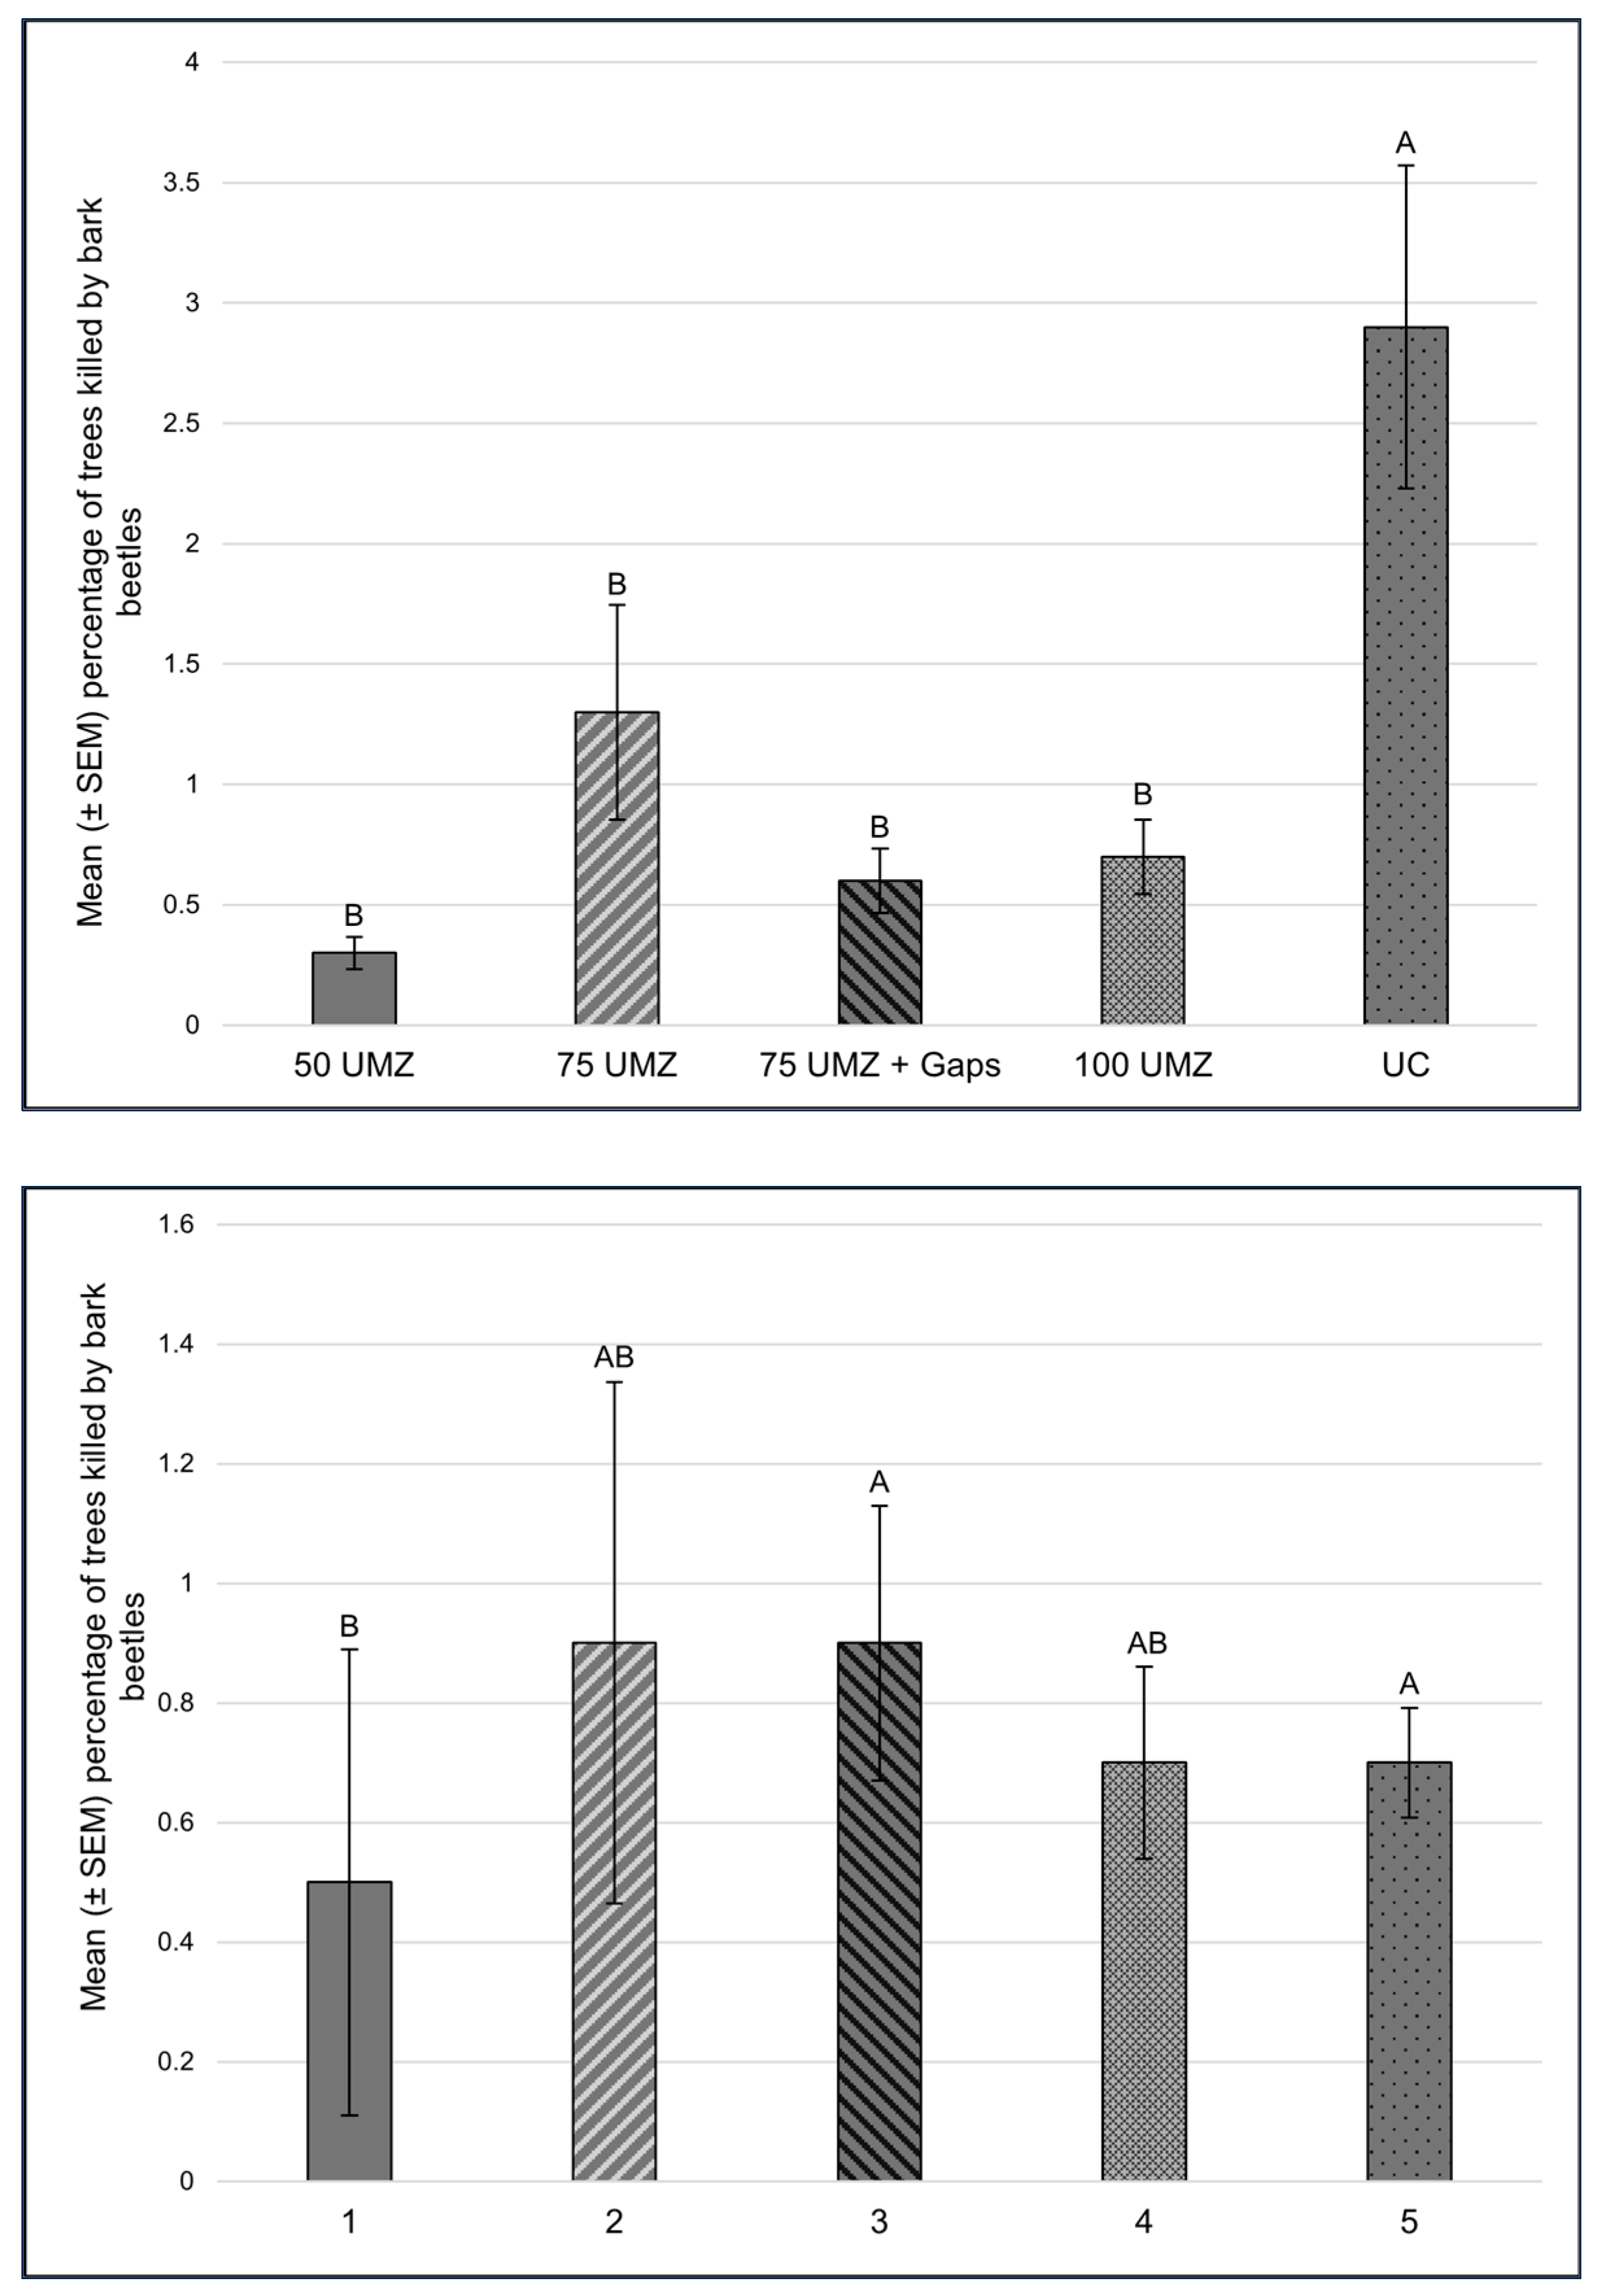
3.2. Tree Mortality Attributed to Bark Beetles

Bark beetles spend most of their lives feeding, reproducing, and overwintering beneath the bark of their host trees. Successful colonization requires overcoming formidable host defenses, which in the case of vigorous hosts requires an abundance of beetles (hundreds to tens of thousands) to mass attack the tree and overwhelm the tree’s defenses. When populations are low, bark beetles create small gaps in the forest canopy by killing individual trees or small groups of trees. When populations increase, outbreaks can occur resulting in large amounts of tree mortality across extensive areas.
Tree mortality was attributed to several bark beetle species (Table 2) with western pine beetle, fir engraver, mountain pine beetle, and pine engraver causing sufficient mortality (>125 trees) to warrant statistical analyses. We attributed mortality of 77 mountain hemlock trees to Scolytus tsugae (Swaine) (Table 2), the only bark beetle species not recorded in our first census [20]. Both treatment (χ2 = 32.2, df = 4, p < 0.001) and dbh class (χ2 = 14.0, df = 4, p = 0.007) had a significant effect on tree mortality attributed to bark beetles. Higher levels occurred on the UC than on 50 UMZ, 75 UMZ, 75 UMZ + Gaps, and 100 UMZ (Z ratios −5.3 to −2.9, p ≤ 0.035 all cases; Figure 2). No other significant differences were observed among treatments. Interestingly, during our first census, the lowest levels of tree mortality occurred on the UC [20]. Lower levels of tree mortality occurred in dbh class 1 compared to dbh class 3 (Z ratio = −3.4, p = 0.007) and dbh class 5 (Z ratio = −3.4, p = 0.007; Figure 2). During our first census, higher levels of tree mortality occurred in dbh class 3 than dbh class 1 [20]. Tree mortality was positively correlated with numbers of trees (rho = 0.74, p < 0.001), basal area (rho = 0.78, p < 0.001), and SDI (rho = 0.77, p < 0.001) (Table 3).
Levels of bark beetle-caused tree mortality were low during our first (0.4% of trees, 1592 trees, 1-year period) [20] and second census (1.0% of trees, 4002 trees, 8-year period). Fettig and McKelvey [31] reported that bark beetles killed 5.6% of trees over a 10-year period following thinning and prescribed burning at Blacks Mountain Experimental Forest in northeastern California (~350 km S of LMS). Mortality was concentrated on burned-split plots and in the two smallest-diameter classes (19–29.2 and 29.3–39.3 cm dbh). Fettig et al. [15] concluded that concerns of large increases in bark beetle-caused tree mortality following prescribed burns were unfounded in most studies, which agrees with our results. However, we caution that reports of large-diameter pines being killed by bark beetles following prescribed burns are not uncommon, an effect exacerbated by heavy accumulations of duff and litter at the base of large trees. Removing duff and litter away from trees prior to prescribed burns can reduce fire intensity and associated levels of tree mortality [32], but is rarely implemented in central Oregon (R.W.F., personal observation).

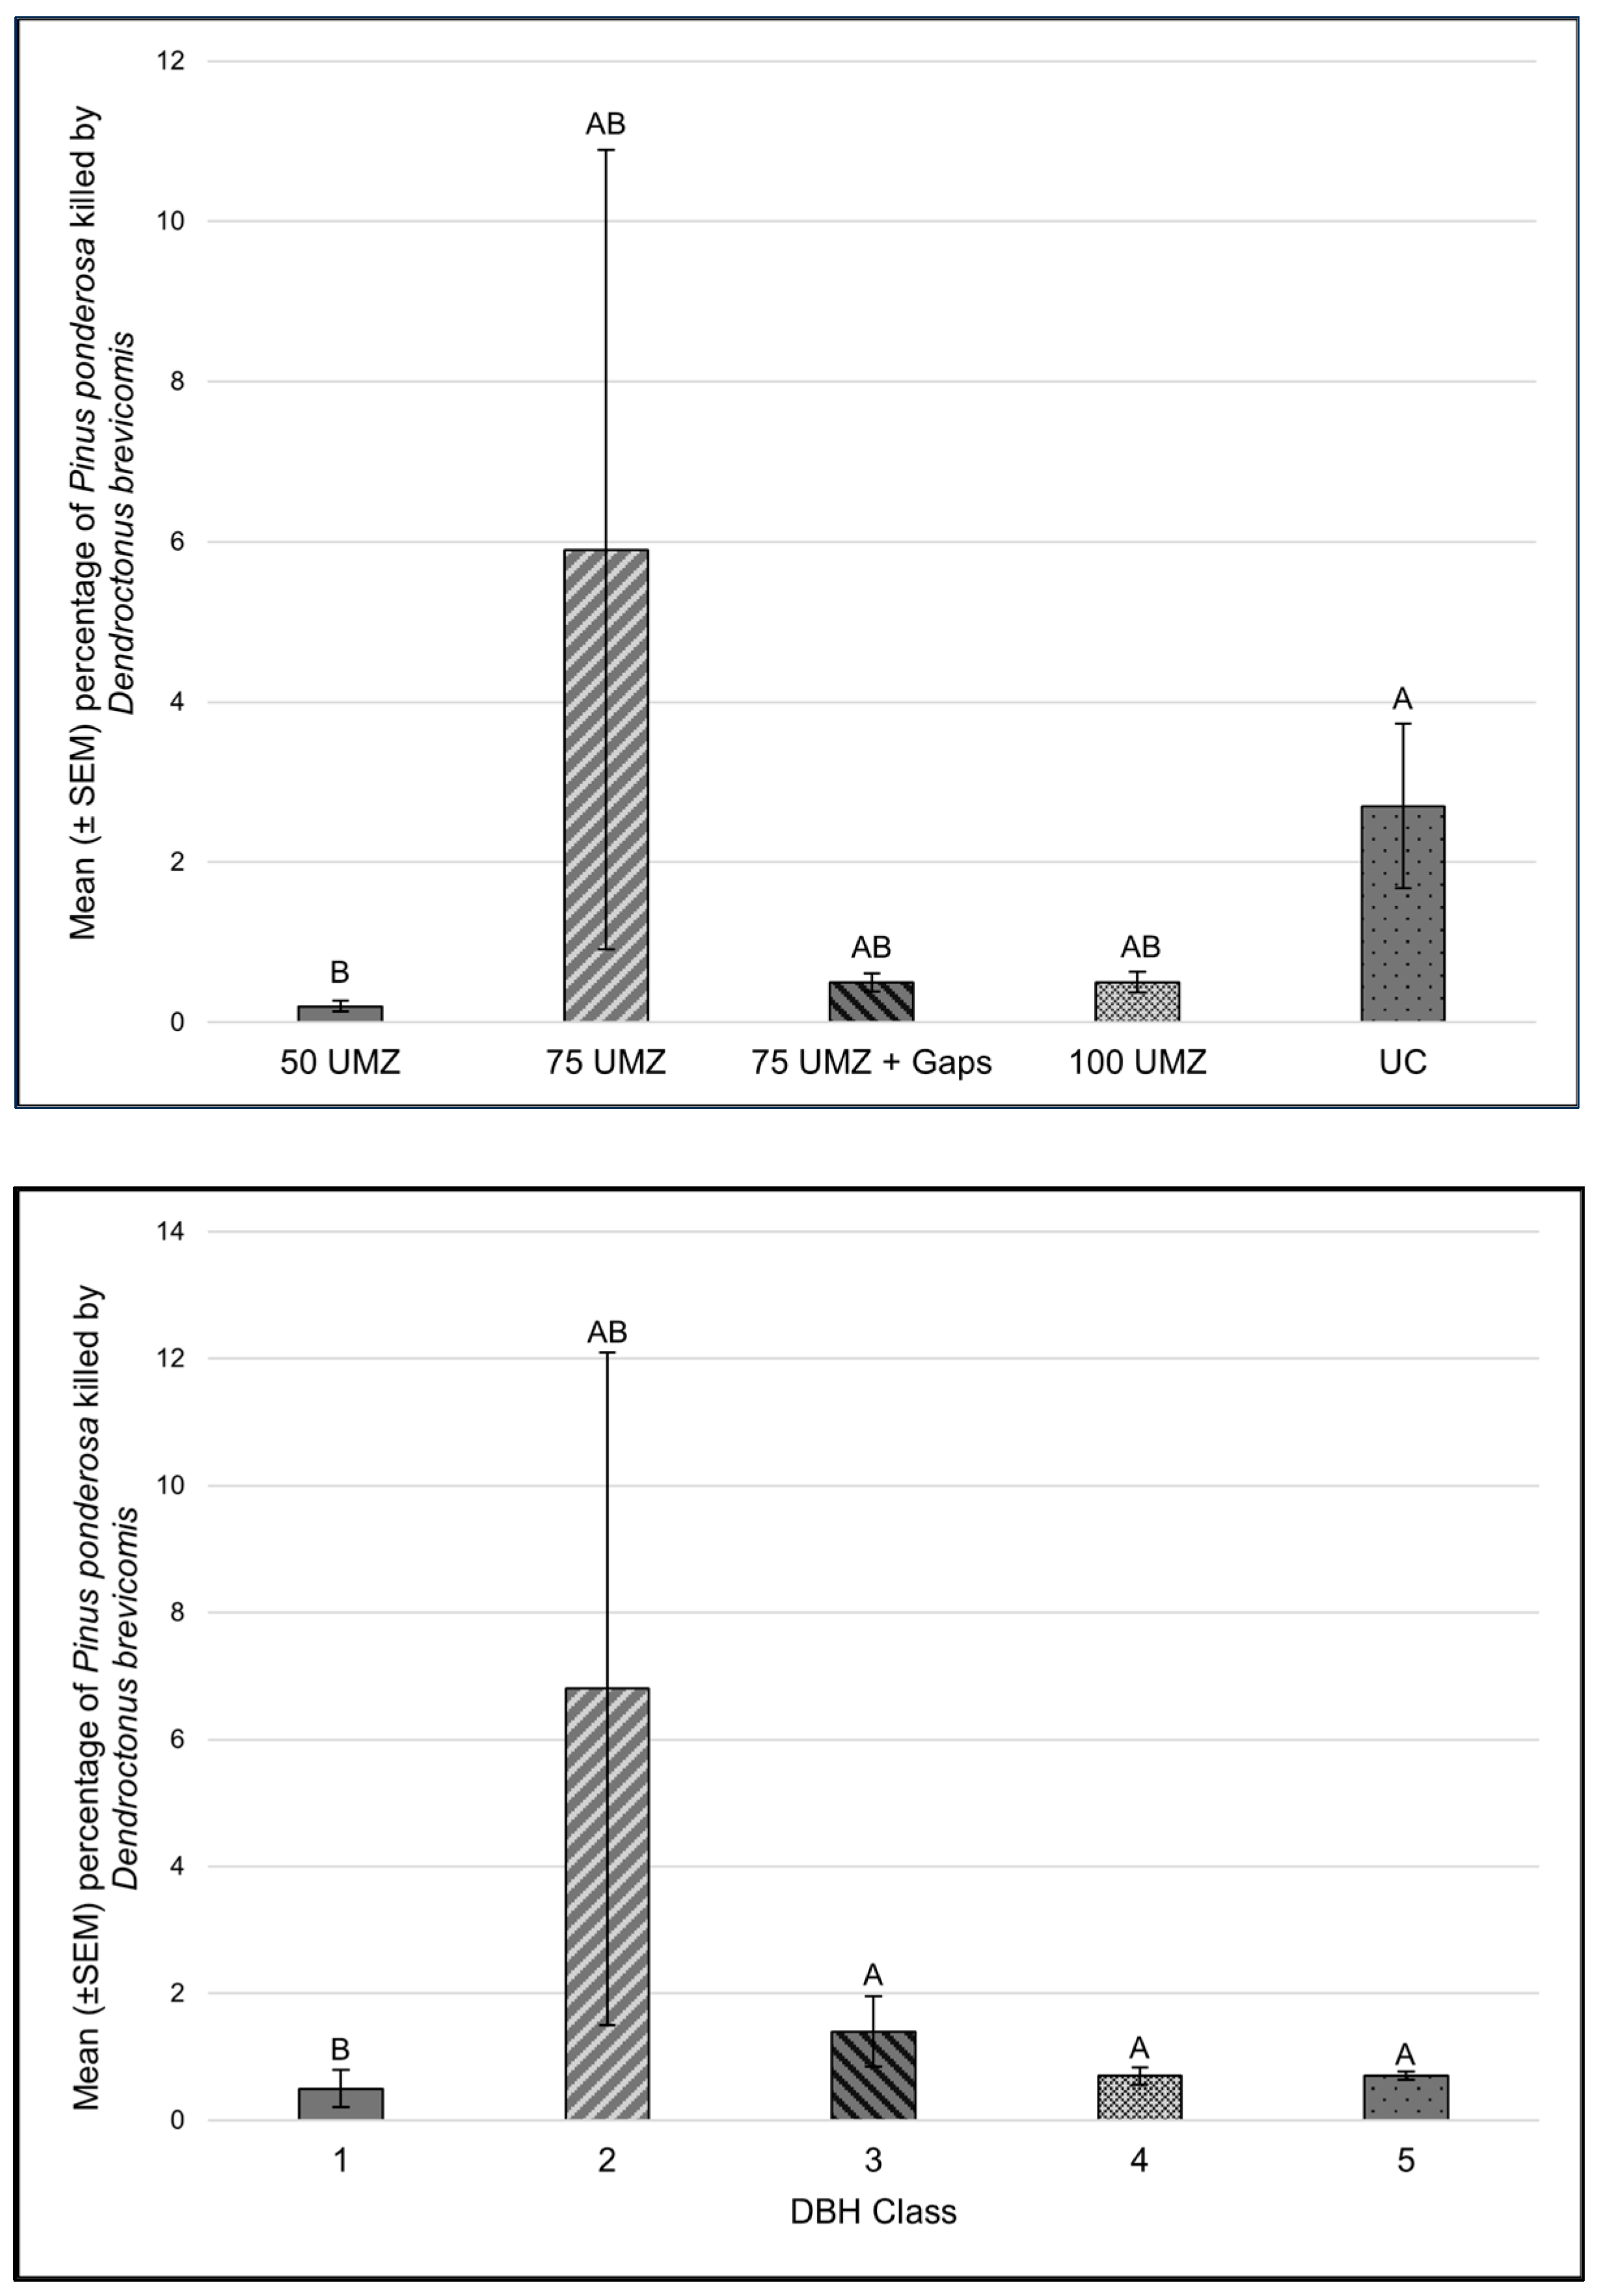
3.2.1. Western Pine Beetle
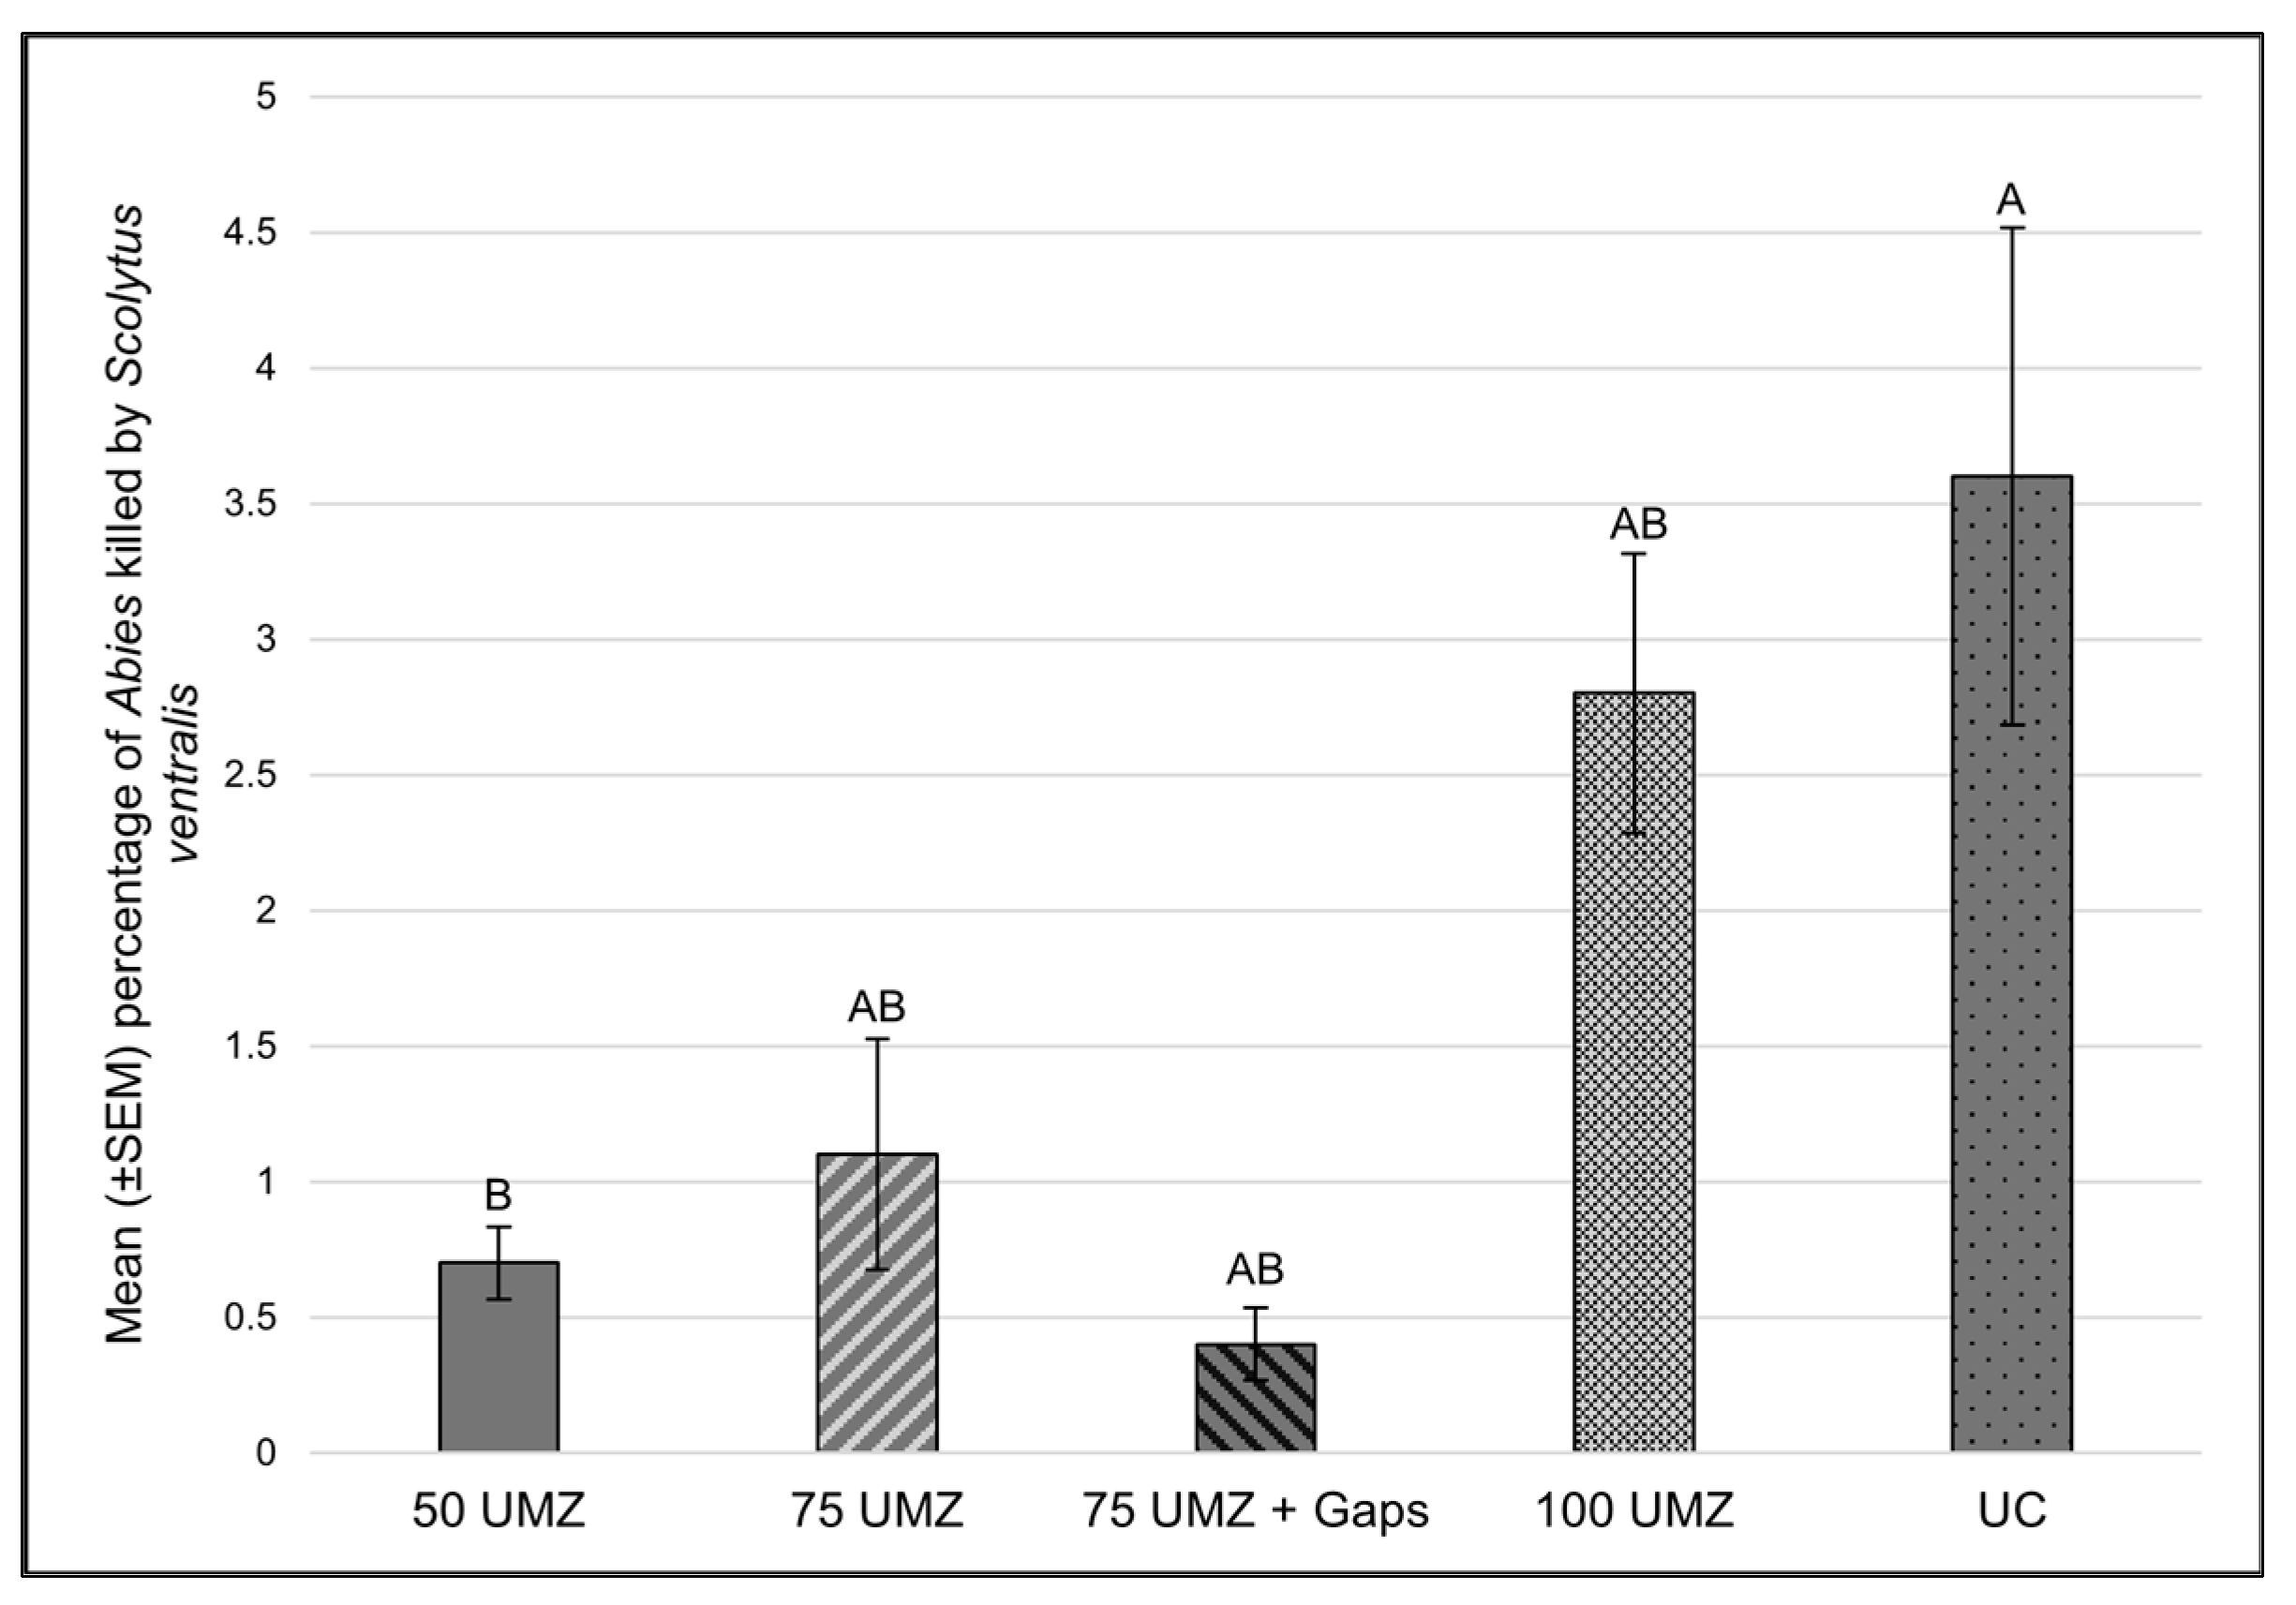
At the LMS and throughout much of its range, western pine beetle colonizes only ponderosa pine [21]. Western pine beetle completes 2–4 generations per year [23]. Among bark beetles, western pine beetles killed the most trees in our study (Table 2), which agrees with our first census [20]. Both treatment (χ2 = 20.5, df = 4, p < 0.001) and dbh class (χ2 = 17.4, df = 4, p = 0.001) had a significant effect on tree mortality attributed to western pine beetle. Higher levels occurred on the UC than on the 50 UMZ (Z ratio = −4.12, p < 0.001; Figure 3). No other significant differences were observed among treatments. The lowest levels of tree mortality occurred in dbh class 1 (Figure 3), which agrees with the species preference for colonizing larger trees [23] and results from our first census [20]. Mortality attributed to western pine beetle was positively correlated with numbers of trees (rho = 0.69, p = 0.001), basal area (rho = 0.69, p = 0.001), and SDI (rho = 0.68, p = 0.001) (Table 3).

3.2.2. Fir Engraver

Fir engraver colonizes several species of fir, including grand fir, white fir, and Shasta red fir (Abies magnifica var. shastensis) and has a univoltine lifecycle [23]. Infestations are often associated with trees stressed by drought, defoliation, root pathogens, and other factors [33]. Among bark beetles, fir engravers killed the second most trees (Table 2). Tree mortality attributed to fir engraver increased substantially (χ2 = 310.8, df = 1, p < 0.001) (Table 3), representing 17.4% of mortality tallied during our second census compared to only 6.6% during our first census [20]. This appears to be attributed, in part, to a large Armillaria root disease pocket on experimental unit 13 (UC) which likely predisposed the affected grand fir to colonization by fir engraver [34,35]. Additionally, this follows the trend of widespread fir mortality attributed to fir engraver across the western U.S. during this time period [36]. On nearby Cache Mountain (~64 km N of LMS), [37] reported that grand fir experienced severe mortality from Armillaria ostoyae (Romagn.) Herink and fir engraver during 1979–2002.
Treatment had a significant effect on tree mortality attributed to fir engraver (2 = 11.1, df = 4, p = 0.025). Higher levels occurred on the UC than on the 50 UMZ (Z ratio = −2.87, p = 0.034; Figure 4). No other significant differences were observed among treatments. During our first census, mortality ranged from 0.3 ± 0.2% on the UC to 2.3 ± 0.6% on the 100 UMZ, but statistical analyses were not performed [20] as too few trees were killed. No significant correlations were found between levels of tree mortality attributed to fir engraver and measures of stand density (p > 0.11, all cases). Fettig and McKelvey [31] reported that fir engraver killed 3.6% of trees over a 10-year period following thinning and prescribed burning at Blacks Mountain Experimental Forest.

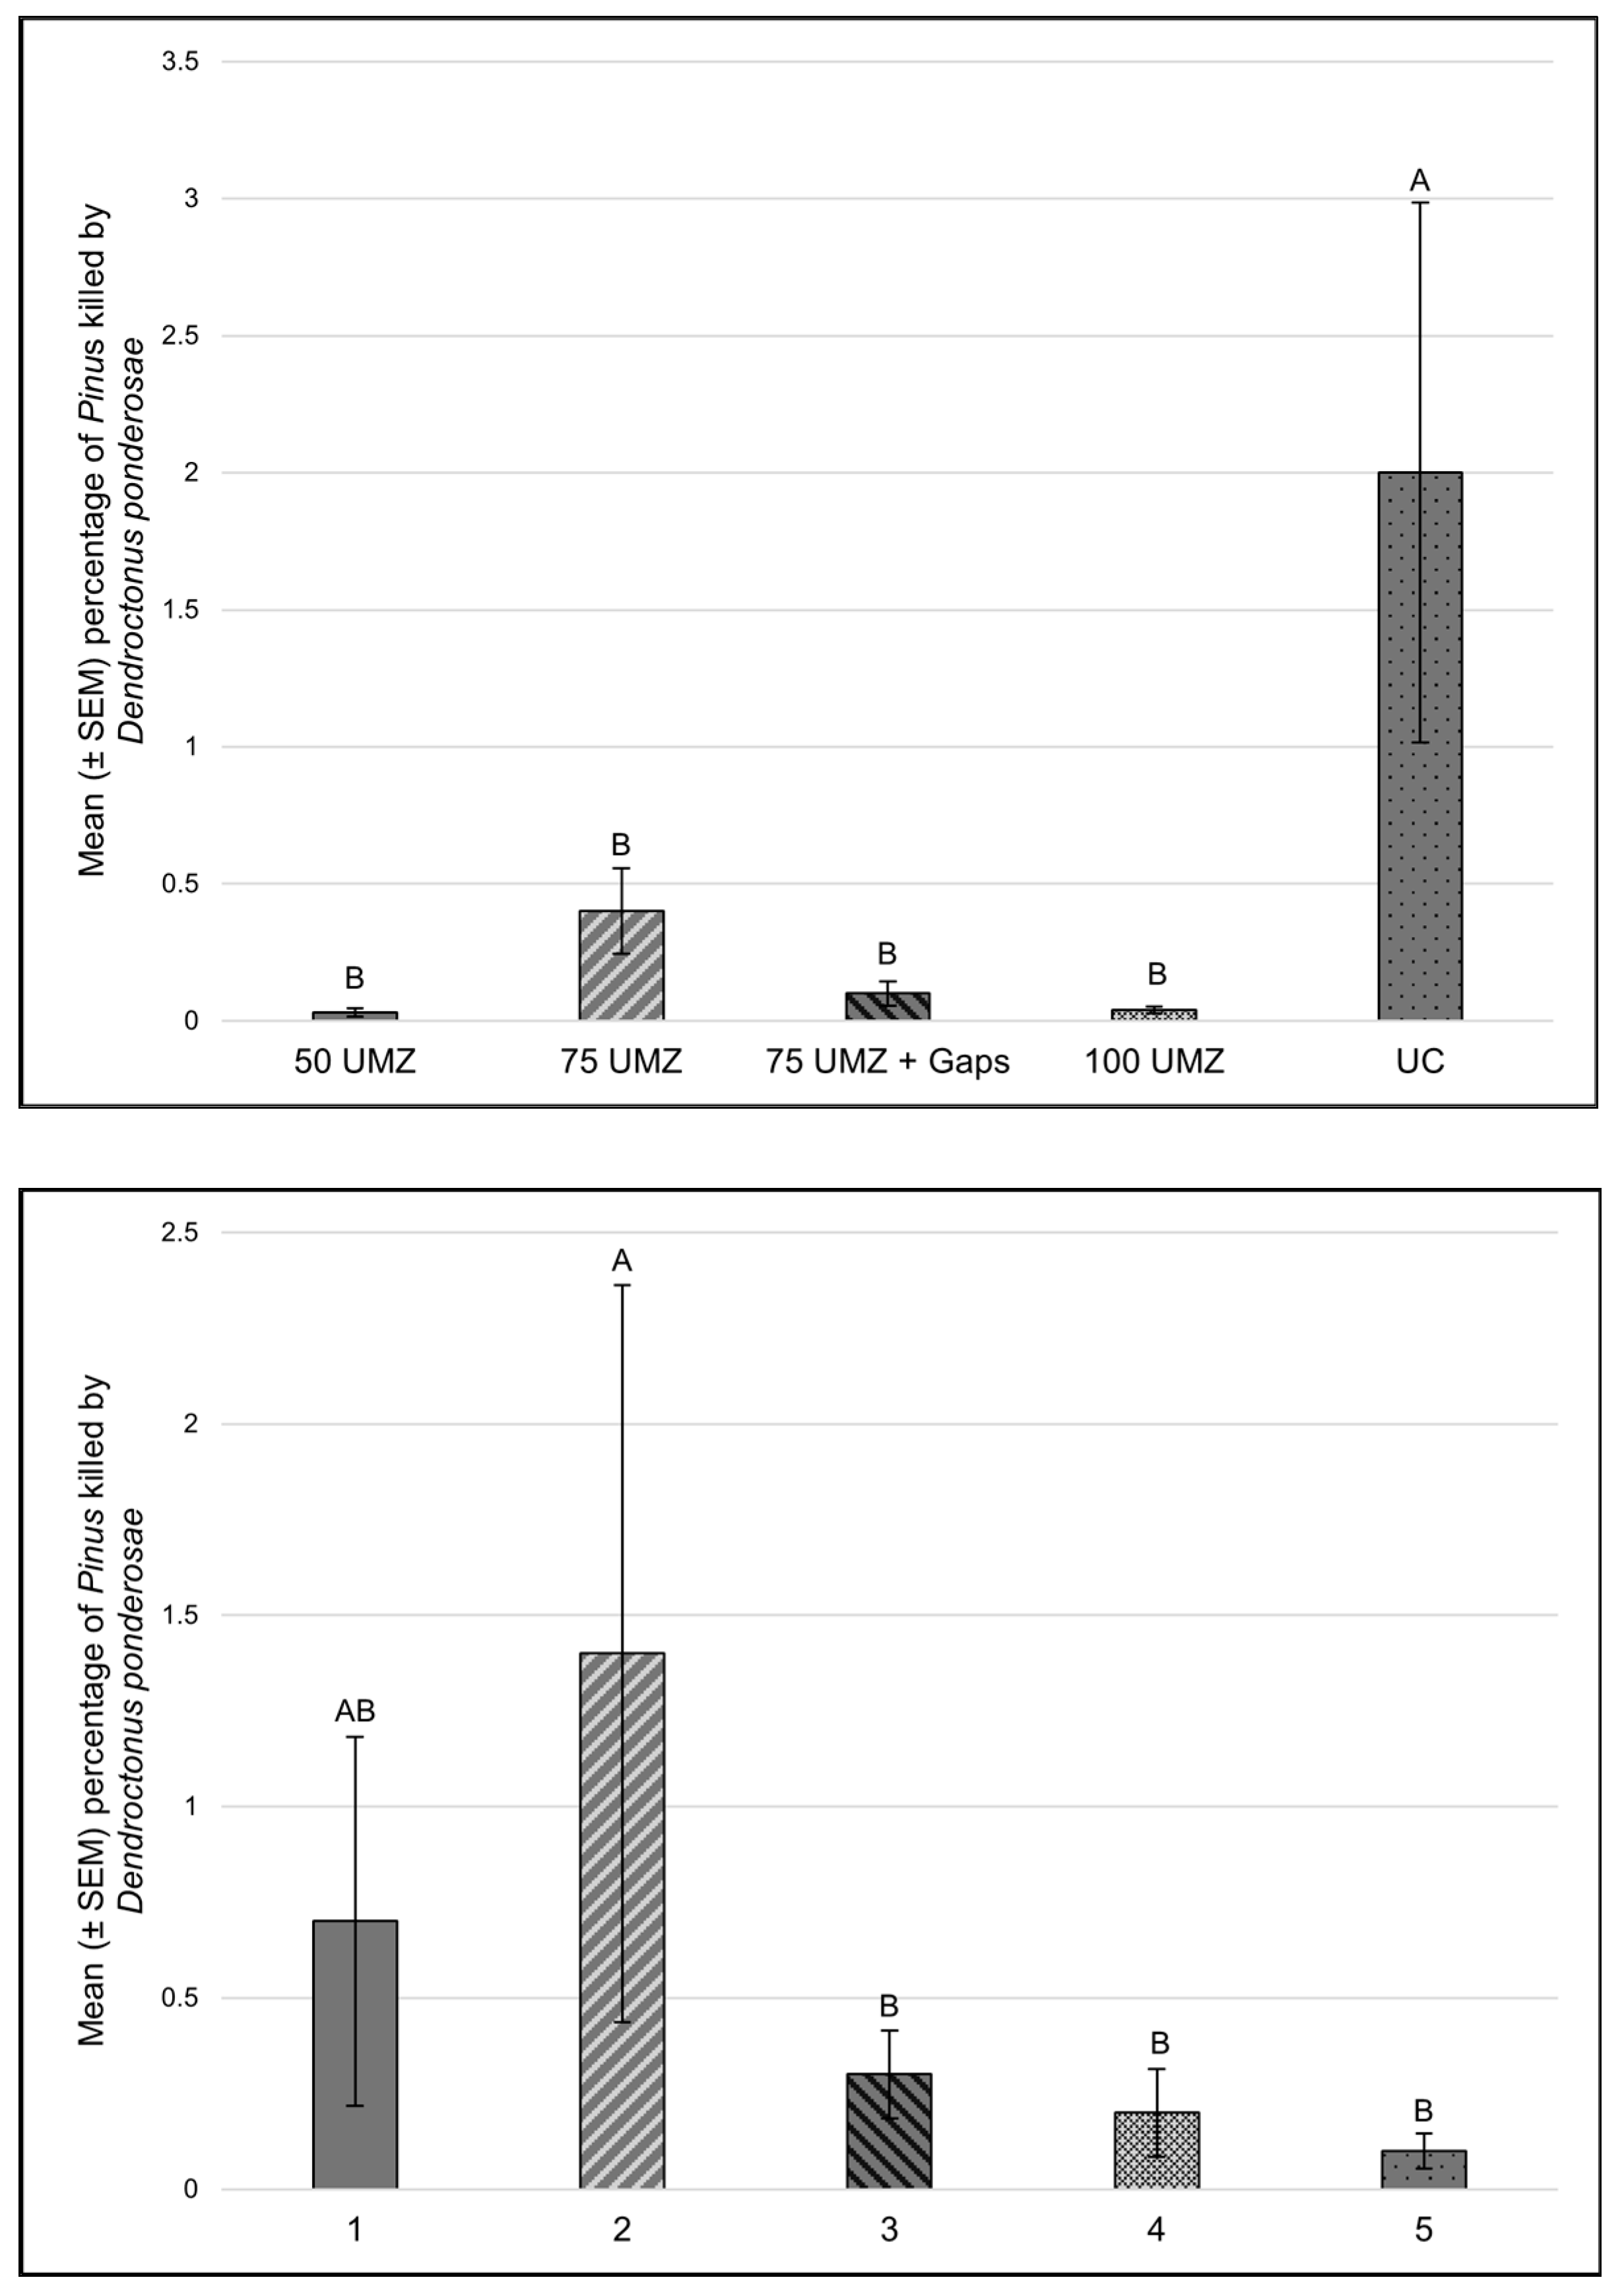
3.2.3. Mountain Pine Beetle

Mountain pine beetle colonizes at least 15 pine species native to North America, including ponderosa pine, lodgepole pine, sugar pine, and western white pine. The lifecycle is primarily univoltine, but a mixture of univoltine and semivoltine life cycles occurs [38]. Among bark beetles, mountain pine beetle killed the third most trees (Table 2). Tree mortality attributed to mountain pine beetle increased substantially (χ2 = 217.9, df = 1, p < 0.001) (Table 3), representing 6.6% of mortality tallied during our second census compared to only 0.5% during our first census [20]. Both treatment (2 = 37.1, df = 4, p < 0.001) and dbh class (2 = 318.2, df = 4, p = 0.001) had a significant effect on tree mortality attributed to mountain pine beetle. Higher levels occurred on the UC than on 50 UMZ, 75 UMZ, 75 UMZ + Gaps, and 100 UMZ (Z ratio = −5.2 to −3.2, p ≤ 0.012, all cases; Figure 5). Only 20 trees were killed by mountain pine beetle during our first census [20]. Higher levels of tree mortality occurred in dbh class 2 than dbh classes 3–5 (Z ratio = 3.3 to 3.9, p ≤ 0.001, all cases; Figure 5), which agrees with the species preference for colonizing mid-sized trees [23,24]. Tree mortality attributed to mountain pine beetle was positively correlated with numbers of trees (rho = 0.58, p = 0.009), basal area (rho = 0.63, p = 0.004) and SDI (rho = 0.61, p = 0.005) (Table 3).

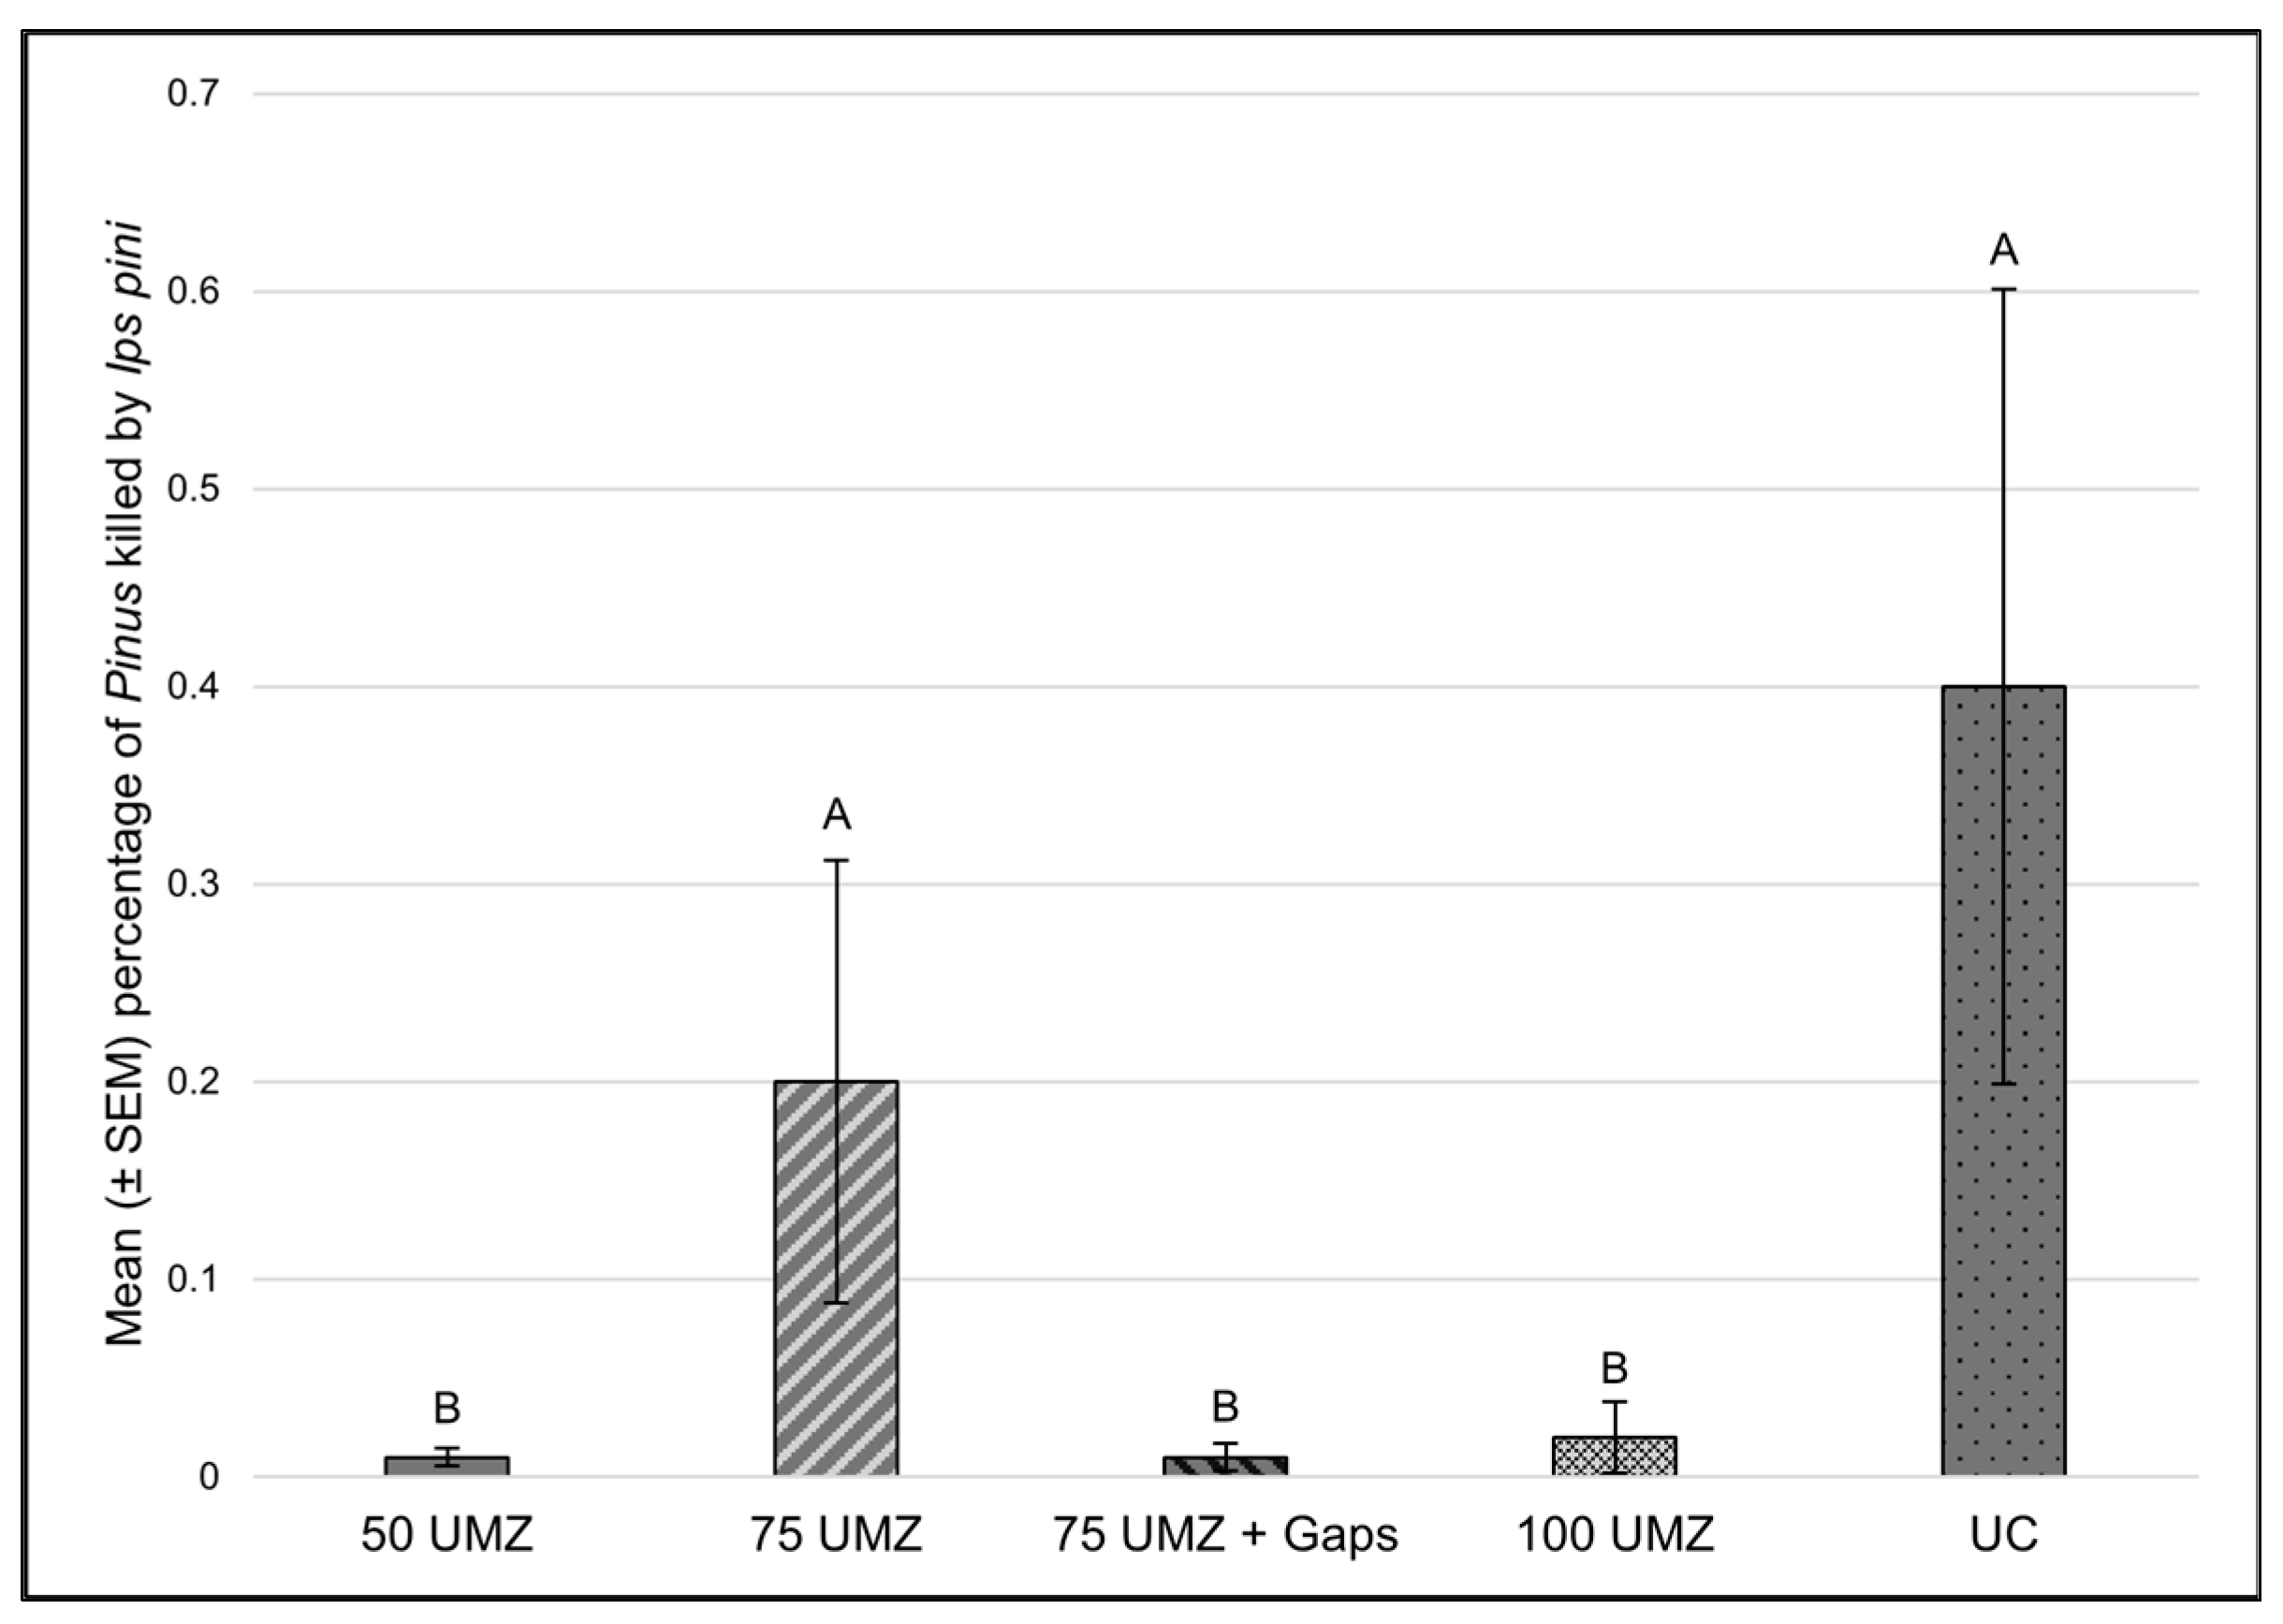
3.2.4. Pine Engraver

Pine engraver colonizes several species of pines and completes 1–2 generations per year [23]. Among bark beetles, pine engraver killed the fourth most trees (Table 2). Tree mortality attributed to pine engraver decreased substantially (χ2 = 395.1, df = 1, p < 0.001) (Table 3), representing 1.6% of mortality tallied during our second census compared to 8.7% during our first census [20]. This was expected given that pine engraver infestations are often short-lived and occur when host material (e.g., slash and/or weakened trees following drought) is plentiful. Both treatment (χ2 = 38.6, df = 4, p < 0.001) and tree size (χ2 = 16.9, df = 4, p < 0.001) had a significant effect on tree mortality attributed to pine engraver. Higher levels occurred on the UC and 75 UMZ than on 50 UMZ, 75 UMZ + Gaps, and 100 UMZ (Z ratio = −3.42 to −2.88, p ≤ 0.033 all cases; Figure 6). During our first census, lower tree mortality occurred on the UC than any other treatment and higher levels occurred on the 75 UMZ and 100 UMZ [20]. Lower levels of tree mortality occurred in dbh class 5 than dbh classes 1 and 2 (Z ratio = 2.88 and 3.51, p ≤ 0.032 respectively; Figure 6). During our first census, higher levels occurred in dbh classes 1 and 2 than dbh classes 4 and 5 [20]. No significant correlations were found between levels of tree mortality attributed to pine engraver and measures of stand density (p > 0.43, all cases) (Table 3).

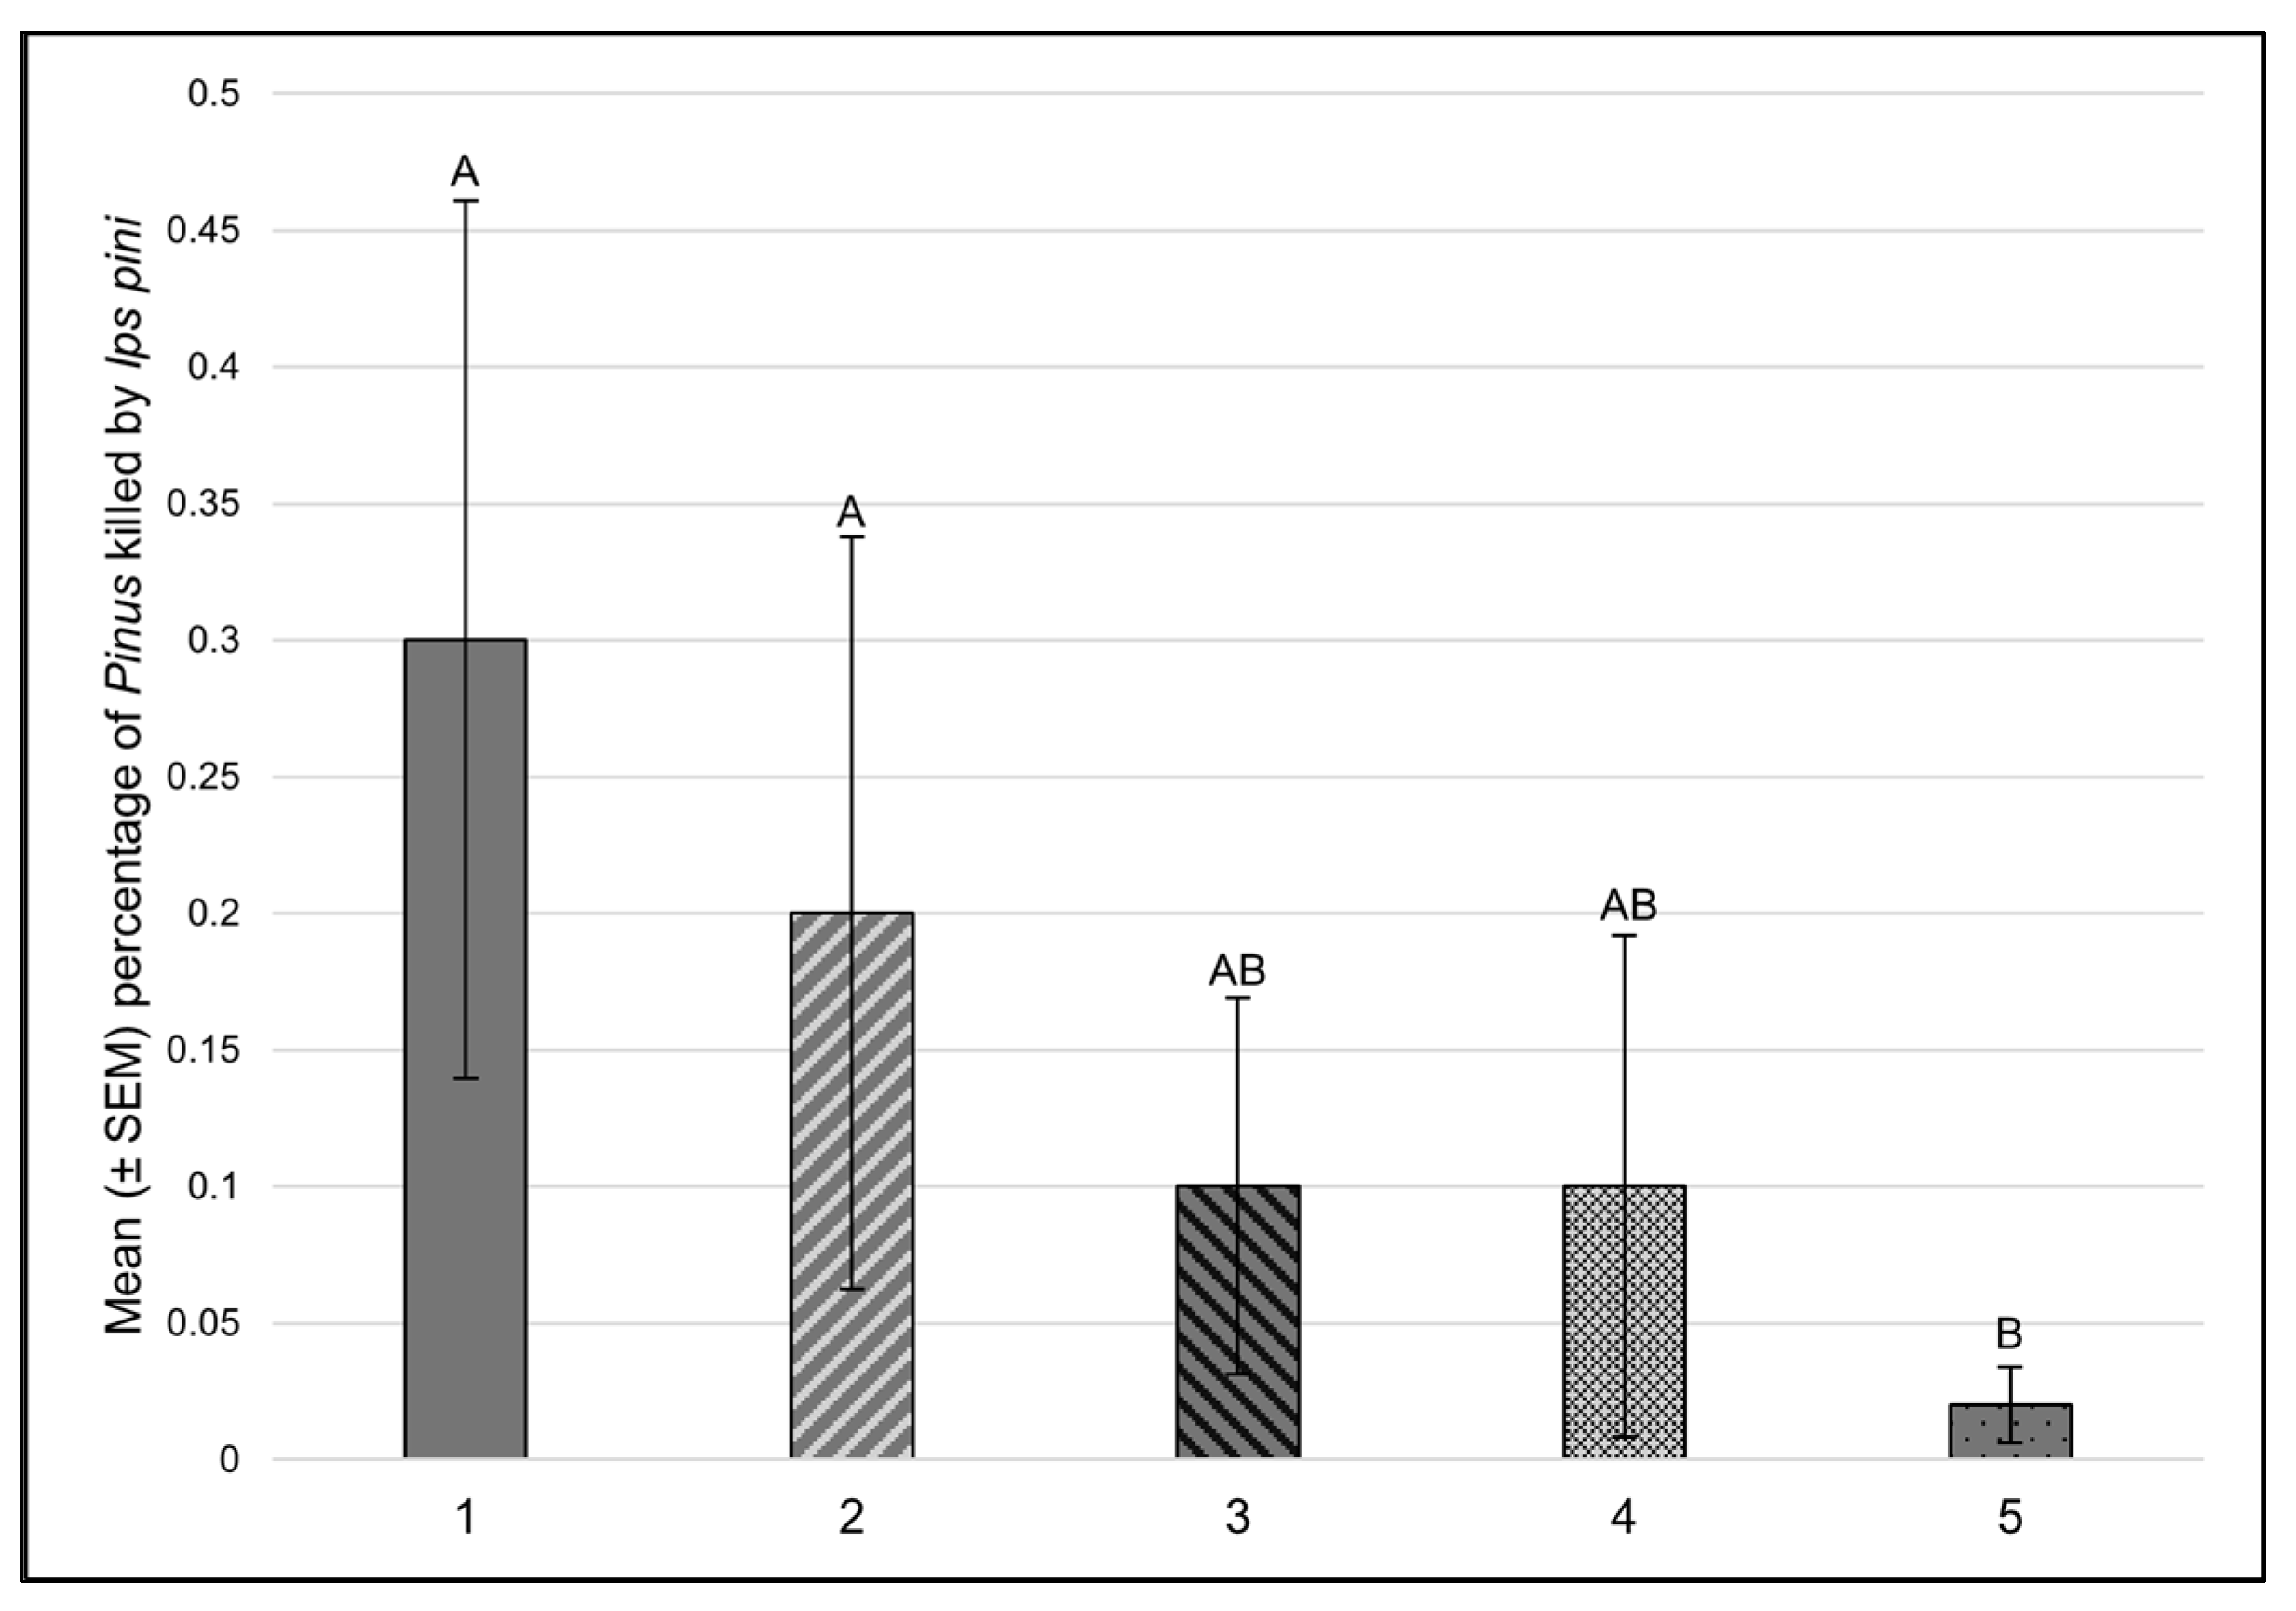
3.3. Tree Mortality Attributed to Wind

Wind killed the third most trees (Table 2). Tree mortality attributed to wind increased substantially (χ2 = 1113.5, df = 1, p < 0.001) (Table 3); representing 21.6% of mortality tallied during our second census compared to just 0.02% during our first census [20]. Treatment (2 = 43.98, df = 4, p < 0.001), dbh class (2 = 18.21, df = 4, p = 0.001), and their interaction (2 = 49.01, df = 16, p < 0.001) had a significant effect on levels of tree mortality attributed to wind. Higher levels occurred on the 100 UMZ and the UC than on the 50 UMZ and 75 UMZ (Z ratios = 3.16 to 4.02, p ≤ 0.0134 all cases; Figure 7). No other significant differences were observed among treatments. Higher levels of mortality occurred in dbh class 2 (Z ratio = 3.43, p = 0.005) and dbh class 3 (Z ratio = 2.73, p = 0.049) than dbh class 5 (Figure 7), indicating that the largest trees were more windfirm. Mortality attributed to wind was positively correlated with numbers of trees (rho = 0.56, p = 0.013), basal area (rho = 0.64, p = 0.003), and SDI (rho = 0.2, p = 0.005) (Table 3).
Following thinning, increases in wind velocities are common within thinned areas making newly exposed trees more vulnerable to windthrow and stem breakage [29]. Most studies on wind damage in the Pacific Northwest come from coastal forests and are of limited relevance to the LMS. However, Weidman [39] studied wind damage in ponderosa pine stands in eastern Oregon over several decades. Tree losses were highest in the most heavily thinned stands, with nearly two-thirds occurring the first 5–6 years following thinning. In our study, the increase in tree mortality attributed to wind on thinned experimental units is likely explained by the high levels of tree removals [21]. However, the high levels of mortality attributed to wind on the UC (Figure 7) are more difficult to explain, as is the positive relationship with measures of stand density (Table 3). As indicated earlier, the UC units are smaller in size than the other experimental units [21] and as such have more edge relative to their size. Wind velocities tend to be higher in and along forest edges, resulting in elevated rates of windthrow and stem breakage [40]. Root diseases could also be a factor affecting the windfirmness of trees on some experimental units (e.g., unit 13, UC).

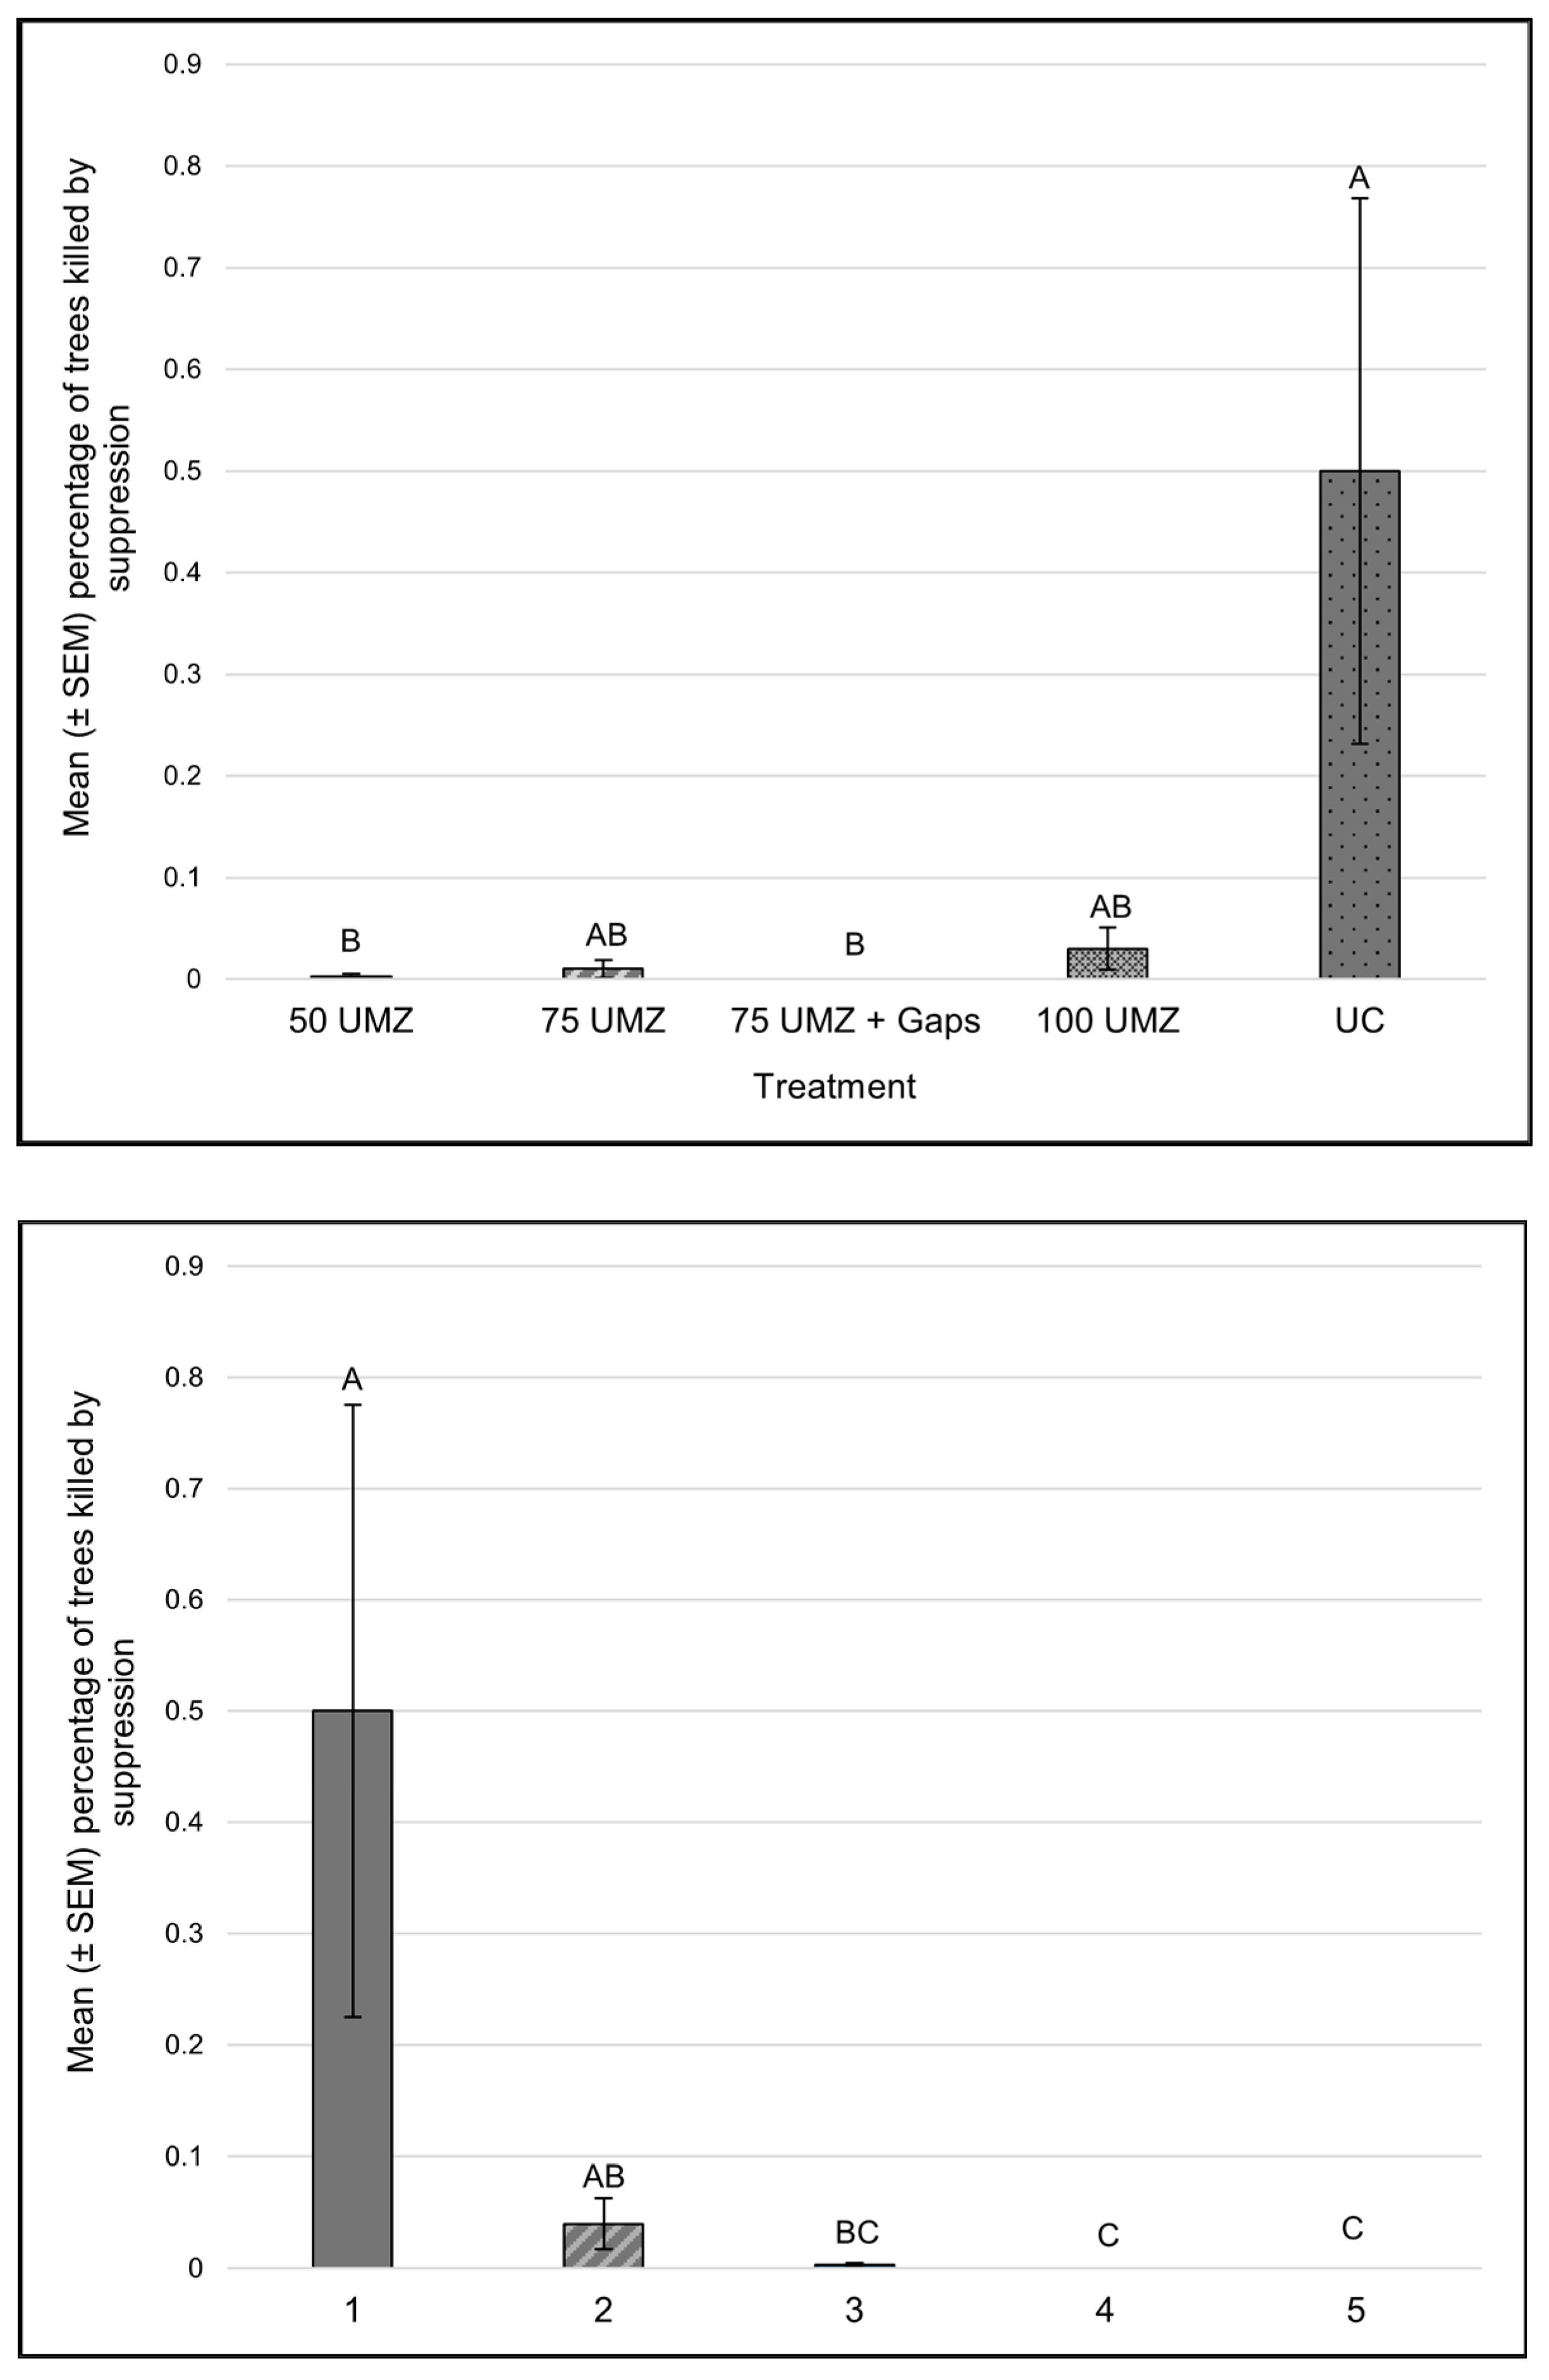
3.4. Tree Mortality Attributed to Suppression

Suppression killed the fourth most trees in our study (Table 2). All modeling attempts failed to converge, likely due to no tree mortality being attributed to suppression on the 75 UMZ. Kruskal–Wallis tests revealed differences among treatments (2 = 16.43, df = 4, p = 0.002) and dbh classes (2 = 26.16, df = 4, p < 0.001). Post hoc Dunn’s tests indicated that more trees were killed by suppression on the UC than on 50 UMZ (Z = −3.18, p = 0.015) and 75 UMZ + Gaps (Z = −3.6, p = 0.003; Figure 8). No mortality was attributed to suppression during our first census [20]. Higher levels of tree mortality occurred in dbh class 1 than dbh classes 3 (Z = 3.45, p = 0.006), 4 (Z = 3.84, p = 0.001), and 5 (Z = 3.84, p = 0.001; Figure 8). The tree mortality attributed to suppression was positively correlated with numbers of trees (rho = 0.71, p = 0.001), basal area (rho = 0.68, p = 0.001), and SDI (rho = 0.67, p = 0.002) (Table 3), collectively indicating that suppression was concentrated in small trees in areas of high tree density.

4. Conclusions

The LMS exists to increase our understanding of the effects of forest restoration and fuel reduction treatments on forests. Key foci include evaluating resistance to wildfire, insects, wind, and other stressors and disturbances [21]. Concerns of large increases in bark beetle-caused tree mortality following prescribed burns were unfounded. Notably, our first census [20] primarily reflects the short-term (1-year) effects of thinning and prescribed burning on tree susceptibility (e.g., of fire-injured trees to colonization by bark beetles). Our second census primarily reflects the influences of fuel reduction and forest restoration treatments on the forest environment (e.g., structure and composition, fuel loading, etc.) and subsequent effects on resistance to stressors and disturbances. Collectively, our results demonstrate that the LMS treatments increased resistance to multiple disturbances (Figure 1, Figure 2, Figure 3, Figure 4, Figure 5, Figure 6, Figure 7 and Figure 8, Table 3). This agrees with recent works by others, including [41] who reported that thinning and prescribed burning promoted resistance to multiple disturbances in mixed-conifer forests in the Sierra Nevada, CA, suggesting that our results are more broadly applicable to the ponderosa pine and mixed-conifer forests in the western U.S. However, further evaluations are necessary to better understand the long-term effects of forest restoration and fuel reduction treatments and to inform the adaptation of future management actions. For example, to address recent increases in surface and ladder (shrub) fuels on the LMS masticating is planned for 2026 followed by prescribed burning.

Author Contributions

Conceptualization, C.J.F.; methodology, C.J.F.; formal analysis, C.J.F., J.P.A., and S.M.H.; investigation, C.J.F., J.P.A., L.A.M., and R.W.F.; resources, C.J.F.; data curation, C.J.F., J.P.A., L.A.M., and S.M.H.; writing—original draft preparation, C.J.F. and J.P.A.; writing—review and editing, C.J.F., J.P.A., L.A.M., R.W.F., and S.M.H.; visualization, C.J.F. and J.P.A.; supervision, C.J.F.; project administration, C.J.F.; funding acquisition, C.J.F. All authors have read and agreed to the published version of the manuscript.

Funding

This research was supported by the USFS Pacific Northwest Research Station and Pacific Southwest Research Station, with funding from the Infrastructure Investment and Jobs Act (Project IIJA 20) for science to support the Wildfire Crisis Strategy.

Institutional Review Board Statement

Not applicable.

Data Availability Statement

The original contributions presented in the study are included in the article, further inquiries can be directed to the corresponding author.

Acknowledgments

We thank P. Anderson, D. Cluck, C. Homicz, M. Lagioia, A.S. Munson, B. Oblinger, L. Sherman, M. Siefker, M. Wahlberg, H. Zald, and four anonymous reviewers for their contributions to this work. The findings and conclusions in this publication are those of the author(s) and should not be construed to represent any official USDA or U.S. Government determination or policy. All authors have read and agreed to the published version of the manuscript.

Conflicts of Interest

The authors declare no conflicts of interest. The funders had no role in the design of the study; in the collection, analyses, or interpretation of data; in the writing of the manuscript; or in the decision to publish the results.

References

  1. Agee, J.K. Fire Ecology of Pacific Northwest Forests; Island Press: Washington, DC, USA, 1993; p. 505. [Google Scholar]
  2. Hagmann, R.K.; Hessburg, P.F.; Prichard, S.J.; Povak, N.A.; Brown, P.M.; Fulé, P.Z.; Keane, R.E.; Knapp, E.E.; Lydersen, J.M.; Metlen, K.L.; et al. Evidence for widespread changes in the structure, composition, and fire regimes of western North American forests. Ecol. Appl. 2021, 31, e02431. [Google Scholar] [CrossRef]
  3. Prichard, S.J.; Hessburg, P.F.; Hagmann, R.K.; Povak, N.A.; Dobrowski, S.Z.; Hurteau, M.D.; Kane, V.R.; Keane, R.E.; Kobziar, L.N.; Kolden, C.A.; et al. Adapting western North American forests to climate change and wildfires: 10 common questions. Ecol. Appl. 2021, 31, e02433. [Google Scholar] [CrossRef]
  4. Halofsky, J.E.; Peterson, D.L.; Harvey, B.J. Changing wildfire, changing forests: The effects of climate change on fire regimes and vegetation in the Pacific Northwest, USA. Fire Ecol. 2020, 16, 4. [Google Scholar] [CrossRef]
  5. Marvel, K.; Su, W.; Delgado, R.; Aarons, S.; Chatterjee, A.; Garcia, M.E.; Hausfather, Z.; Hayhoe, K.; Hence, D.A.; Jewett, E.B.; et al. Climate trends. In Fifth National Climate Assessment; Crimmins, A.R., Avery, C.W., Easterling, D.R., Kunkel, K.E., Stewart, B.C., Maycock, T.K., Eds.; U.S. Global Change Research Program: Washington, DC, USA, 2023; pp. 2-1–2-59. [Google Scholar]
  6. Ritchie, M.W.; Skinner, C.N.; Hamilton, T.A. Probability of tree survival after wildfire in an interior pine forest of northern California: Effects of thinning and prescribed fire. For. Ecol. Manag. 2007, 247, 200–208. [Google Scholar] [CrossRef]
  7. Stephens, S.L.; Moghaddas, J.J.; Edminster, C.; Fiedler, C.E.; Haase, S.; Harrington, M.; Keeley, J.E.; Knapp, E.E.; McIver, J.D.; Metlen, K.; et al. Fire treatment effects on vegetation structure, fuels, and potential fire severity in western U.S. forests. Ecol. Appl. 2009, 19, 305–320. [Google Scholar] [CrossRef]
  8. Kalies, E.L.; Yocom Kent, L.L. Are fuel treatments effective at achieving ecological and social objectives? A systematic review. For. Ecol. Manag. 2016, 375, 84–95. [Google Scholar] [CrossRef]
  9. Davis, K.T.; Peeler, J.; Fargione, J.; Haugo, R.D.; Metlen, K.L.; Robles, M.D.; Woolley, T. A meta-analysis of thinning, prescribed fire, and wildfire effects on subsequent wildfire severity in conifer dominated forests of the Western US. For. Ecol. Manag. 2024, 561, 121885. [Google Scholar] [CrossRef]
  10. McIver, J.; Stephens, S.; Agee, J.; Barbour, J.; Boerner, R.; Edminster, C.; Erickson, K.; Farris, K.; Fettig, C.; Fiedler, C.; et al. Ecological effects of alternative fuel reduction treatments: Highlights of the national Fire and Fire Surrogate study (FFS). Intl. J. Wild. Fire 2013, 22, 63–82. [Google Scholar] [CrossRef]
  11. Prichard, S.J.; Peterson, D.L.; Jacobson, K. Fuel treatments reduce severity of wildfire effects in dry mixed conifer forest, Washington, USA. Can. J. For. Res. 2010, 40, 1615–1626. [Google Scholar] [CrossRef]
  12. The National Strategy. Available online: https://www.forestsandrangelands.gov/documents/strategy/strategy/CSPhaseIIINationalStrategyApr2014.pdf (accessed on 22 October 2024).
  13. USDA Forest Service. Wildfire Crisis Strategy. Available online: https://www.fs.usda.gov/sites/default/files/fs_media/fs_document/Confronting-the-Wildfire-Crisis.pdf (accessed on 22 October 2024).
  14. Bentz, B.J.; Régnière, J.; Fettig, C.J.; Hansen, E.M.; Hayes, J.L.; Hicke, J.A.; Kelsey, R.G.; Lundquist, J.; Negrón, J.F.; Seybold, S.J. Climate change and bark beetles of the western United States and Canada: Direct and indirect effects. Bioscience 2010, 60, 602–613. [Google Scholar] [CrossRef]
  15. Fettig, C.J.; Runyon, J.B.; Homicz, C.S.; James, P.M.A.; Ulyshen, M.D. Fire and insect interactions in North American forests. Curr. For. Rep. 2022, 8, 301–316. [Google Scholar] [CrossRef]
  16. Fettig, C.J.; Klepzig, K.D.; Billings, R.F.; Munson, A.S.; Nebeker, T.E.; Negrón, J.F.; Nowak, J.T. The effectiveness of vegetation management practices for prevention and control of bark beetle outbreaks in coniferous forests of the western and southern United States. For. Ecol. Manag. 2007, 238, 24–53. [Google Scholar] [CrossRef]
  17. Thistle, H.W.; Peterson, H.G.; Allwine, G.; Lamb, B.K.; Strand, T.; Holsten, E.H.; Shea, P.J. Surrogate pheromone plumes in three forest trunk spaces: Composite statistics and case studies. For. Sci. 2004, 50, 610–625. [Google Scholar] [CrossRef]
  18. Fettig, C.J.; McMillin, J.D.; Anhold, J.A.; Hamud, S.M.; Borys, R.R.; Dabney, C.P.; Seybold, S.J. The effects of mechanical fuel reduction treatments on the activity of bark beetles (Coleoptera: Scolytidae) infesting ponderosa pine. For. Ecol. Manag. 2006, 230, 55–68. [Google Scholar] [CrossRef]
  19. Seybold, S.J.; Huber, D.P.W.; Lee, J.C.; Graves, A.D.; Bohlmann, J. Pine monoterpenes and pine bark beetles: A marriage of convenience for defense and chemical communication. Phytochem. Rev. 2006, 5, 143–178. [Google Scholar] [CrossRef]
  20. Fettig, C.J.; Mortenson, L.A.; Audley, J.P. Tree mortality following thinning and prescribed burning in central Oregon. Forests 2021, 12, 1677. [Google Scholar] [CrossRef]
  21. Sherman, L.M.; Anderson, P.D.; Fettig, C.J. Forest Dynamics After Thinning and Fuel Reduction in the Pringle Falls Experimental Forest—Establishment and Early Observations of the Lookout Mountain Thinning and Fuels Reduction Study; USDA Forest Service Gen. Tech. Rep. PNW-GTR-1015; Pacific Northwest Research Station: Portland, OR, USA, 2023; p. 168.
  22. Powell, D.C. Eastside Screens Chronology; White Paper F14-SO-WP-SILV-53; Pacific Northwest Region, Umatilla National Forest: Pendleton, OR, USA, 2013; p. 42.
  23. Furniss, R.L.; Carolin, V.M. Western Forest Insects; USDA Forest Service Misc. Pub. 1339; Washington Office: Washington, DC, USA, 1977; p. 654. [Google Scholar]
  24. Olsen, W.K.; Schmid, J.M.; Mata, S.A. Stand characteristics associated with mountain pine beetle infestations in ponderosa pine. For. Sci. 1996, 42, 310–327. [Google Scholar] [CrossRef]
  25. Harrison, X.A. A comparison of observation-level random effect and beta-binomial models for modelling overdispersion in binomial data in ecology and evolution. Peer J. 2015, 3, e1114. [Google Scholar] [CrossRef]
  26. Douma, J.C.; Weedon, J.T. Analysing continuous proportions in ecology and evolution: A practical introduction to beta and Dirichlet regression. Methods Ecol. Evol. 2019, 10, 1412–1430. [Google Scholar] [CrossRef]
  27. Zuur, A.; Leno, E.; Walker, N.; Saveliev, A.; Smith, G. Mixed Effects Models and Extensions in Ecology with R; Springer: New York, NY, USA, 2009; p. 574. [Google Scholar]
  28. R Core Team. R: A Language and Environment for Statistical Computing. 2020. Available online: https://R-project.org/ (accessed on 28 December 2020).
  29. Guillaume, M.; Chagnon, C.; Achim, A.; Caspersen, J.; D’Orangeville, L.; Sánchez-Pinillos, M.; Thiffault, N. Opportunities and limitations of thinning to increase resistance and resilience of trees and forests to global change. Forestry 2022, 95, 595–615. [Google Scholar]
  30. Hood, S.M.; Cluck, D.R.; Smith, S.L.; Ryan, K.C. Using bark char codes to predict post-fire cambium mortality. Fire Ecol. 2008, 4, 57–73. [Google Scholar] [CrossRef]
  31. Fettig, C.J.; McKelvey, S.R. Resiliency of an interior ponderosa pine forest to bark beetle infestations following fuel-reduction and forest-restoration treatments. Forests 2014, 5, 153–176. [Google Scholar] [CrossRef]
  32. Hood, S.M. Mitigating Old Tree Mortality in Long-Unburned, Fire-Dependent Forests: A Synthesis; USDA Forest Service Gen. Tech. Rep. RMRS-GTR-238; Rocky Mountain Research Station: Fort Collins, CO, USA, 2010; p. 71.
  33. Berryman, A.A.; Ferrell, G.T. The fir engraver beetle in western states. In Dynamics of Forest Insect Populations: Patterns, Causes, Implications; Berryman, A.A., Ed.; Plenum Press: New York, NY, USA, 1988; pp. 556–577. [Google Scholar]
  34. Filip, G.M.; Klopfenstein, N.B.; Maffei, H.M.; Shaw III, C.G.; Lockman, B. Armillaria Root Disease in Conifers of Western North America; USDA Forest Service FIDL-188; Forest Health Protection: Washington, DC, USA, 2024; p. 23.
  35. Goheen, E.M.; Willhite, E.A. Field Guide to the Common Diseases and Insect Pests of Oregon and Washington Conifers; USDA Forest Service R6-NR-FID-PR-01-06; Forest Health Protection: Portland, OR, USA, 2006; p. 325.
  36. USDA Forest Service. Major Forest Insect and Disease Conditions in the United States: 2023; USDA Forest Service FS–1238; Forest Health Protection: Washington, DC, USA, 2024; p. 26.
  37. Filip, G.M.; Maffei, H.; Chadwick, K.L. Forest health decline in a central Oregon mixed-conifer forest revisited after wildfire: A 25-year case study. West. J. Appl. For. 2007, 22, 278–284. [Google Scholar] [CrossRef]
  38. Bentz, B.; Vandygriff, J.; Jensen, C.; Coleman, T.; Maloney, P.; Smith, S.; Grady, A.; Schen-Langenheim, G. Mountain pine beetle voltinism and life history characteristics across latitudinal and elevational gradients in the western United States. For. Sci. 2014, 60, 434–449. [Google Scholar] [CrossRef]
  39. Weidman, R.H. A study of windfall loss of western yellow pine in selection cuttings fifteen to thirty years old. J. For. 1920, 18, 616–622. [Google Scholar]
  40. Chen, J.; Franklin, J.F.; Spies, T.A. Vegetation responses to edge environments in old-growth Douglas-fir forests. Ecol. Appl. 1992, 2, 387–396. [Google Scholar] [CrossRef]
  41. Bernal, A.A.; Kane, J.M.; Knapp, E.E.; Zald, H.S.J. Tree resistance to drought and bark beetle-associated mortality following thinning and prescribed fire treatments. For. Ecol. Manag. 2023, 530, 120758. [Google Scholar] [CrossRef]
Figure 1. Mean percentage (±SEM) of trees killed by all causes 2–9 years after forest restoration and fuel reduction treatments were implemented on the Lookout Mountain Thinning and Fuels Reduction Study, central Oregon, U.S. Treatment codes represent residual stand densities expressed as a percentage of the upper management zone (UMZ; indicative of low, medium, and high densities), except for the untreated control (UC). Means (±SEM) followed by the same letter are not significantly different (p > 0.05).
Fire 08 00109 g001
Figure 2. Mean percentage (± SEM) of trees killed by bark beetles (all bark beetle species) 2–9 years after forest restoration and fuel reduction treatments were implemented on the Lookout Mountain Thinning and Fuels Reduction Study, central Oregon, U.S. Top: means compared among treatments. Treatment codes represent residual stand densities expressed as a percentage of the upper management zone (UMZ; indicative of low, medium, and high densities), except for the untreated control (UC). Bottom: means compared among dbh classes (1 = 10.2–20.3, 2 = 20.4–30.5, 3 = 30.6–40.6, 4 = 40.7–50.8, and 5 = >50.8 cm). Means (± SEM) followed by the same letter are not significantly different (p > 0.05).
Fire 08 00109 g002
Figure 3. Mean percentage (±SEM) of ponderosa pine (Pinus ponderosa) killed by western pine beetle (Dendroctonus brevicomis) 2–9 years after forest restoration and fuel reduction treatments were implemented on the Lookout Mountain Thinning and Fuels Reduction Study, central Oregon, U.S. Top: means compared among treatments. Treatment codes represent residual stand densities expressed as a percentage of the upper management zone (UMZ; indicative of low, medium, and high densities), except for the untreated control (UC). Bottom: means compared among dbh classes (1 = 10.2–20.3, 2 = 20.4–30.5, 3 = 30.6–40.6, 4 = 40.7–50.8, and 5 = >50.8 cm). Means (±SEM) followed by the same letter are not significantly different (p > 0.05).
Fire 08 00109 g003
Figure 4. Mean percentage (±SEM) of fir (Abies) killed by fir engraver (Scolytus ventralis) 2–9 years after forest restoration and fuel reduction treatments were implemented on the Lookout Mountain Thinning and Fuels Reduction Study, central Oregon, U.S. Treatment codes represent residual stand densities expressed as a percentage of the upper management zone (UMZ; indicative of low, medium, and high densities), except for the untreated control (UC). Means (±SEM) followed by the same letter are not significantly different (p > 0.05).
Fire 08 00109 g004
Figure 5. Mean percentage (±SEM) of pines (Pinus) killed by mountain pine beetle (Dendroctonus ponderosae) 2–9 years after forest restoration and fuel reduction treatments were implemented on the Lookout Mountain Thinning and Fuels Reduction Study, central Oregon, U.S. Top: means compared among treatments. Treatment codes represent residual stand densities expressed as a percentage of the upper management zone (UMZ; indicative of low, medium, and high densities), except for the untreated control (UC). Bottom: means compared among dbh classes (1 = 10.2–20.3, 2 = 20.4–30.5, 3 = 30.6–40.6, 4 = 40.7–50.8, and 5 = >50.8 cm). Means (±SEM) followed by the same letter are not significantly different (p > 0.05).
Fire 08 00109 g005
Figure 6. Mean percentage (±SEM) of pines (Pinus) killed by pine engraver (Ips pini) 2–9 years after forest restoration and fuel reduction treatments were implemented on the Lookout Mountain Thinning and Fuels Reduction Study, central Oregon, U.S. Top: means compared among treatments. Treatment codes represent residual stand densities expressed as a percentage of the upper management zone (UMZ; indicative of low, medium, and high densities), except for the untreated control (UC). Bottom: means compared among dbh classes (1 = 10.2–20.3, 2 = 20.4–30.5, 3 = 30.6–40.6, 4 = 40.7–50.8, and 5 = >50.8 cm). Means (±SEM) followed by the same letter are not significantly different (p > 0.05).
Fire 08 00109 g006aFire 08 00109 g006b
Figure 7. Mean percentage (±SEM) of tree mortality attributed to wind 2–9 years after forest restoration and fuel reduction treatments were implemented on the Lookout Mountain Thinning and Fuels Reduction Study, central Oregon, U.S. Top: means compared among treatments. Treatment codes represent residual stand densities expressed as a percentage of the upper management zone (UMZ; indicative of low, medium, and high densities), except for the untreated control (UC). Bottom: means compared among dbh classes (1 = 10.2–20.3, 2 = 20.4–30.5, 3 = 30.6–40.6, 4 = 40.7–50.8, and 5 = >50.8 cm). Means (±SEM) followed by the same letter are not significantly different (p > 0.05).
Fire 08 00109 g007
Figure 8. Mean percentage (±SEM) of tree mortality attributed to suppression 2–9 years after forest restoration and fuel reduction treatments were implemented on the Lookout Mountain Thinning and Fuels Reduction Study, central Oregon, U.S. Top: means compared among treatments. Treatment codes represent residual stand densities expressed as a percentage of the upper management zone (UMZ; indicative of low, medium, and high densities), except for the untreated control (UC). Bottom: means compared among dbh classes (1 = 10.2–20.3, 2 = 20.4–30.5, 3 = 30.6–40.6, 4 = 40.7–50.8, and 5 = >50.8 cm). Means (±SEM) followed by the same letter are not significantly different (p > 0.05).
Fire 08 00109 g008
Table 1. Occurrences of thinning, masticating, prescribed burning, and censusing of tree mortality on the Lookout Mountain Thinning and Fuels Reduction Study, central Oregon, U.S.
BlockThinMasticatePrescribed Burn 1First Census 2Second Census 3
420112012201320142022
220122013201420152023
120132014201520162024
320132014201520162024
1 Prescribed burning occurred in spring, except for experimental unit 12 (block 1) which was burned in fall. 2 Results are reported in [20]. Data collected one year after treatments were implemented. 3 Results are reported in this paper. Data collected nine years after treatments were implemented.
Table 2. Primary causes of tree mortality 2–9 years after forest restoration and fuel reduction treatments were implemented on the Lookout Mountain Thinning and Fuels Reduction Study, central Oregon, U.S.
CauseNumber of TreesPercentage of
Tree Mortality
Primary Tree Species
Affected
Bark beetles400244.1Pinus ponderosa
Dendroctonus brevicomis163118.0Pinus ponderosa
Scolytus ventralis158017.4Abies grandis
Dendroctonus ponderosae5265.8Pinus ponderosa
Ips pini1451.6Pinus ponderosa
Scolytus tsugae770.8Tsuga heterophylla
Pityogenes spp.190.2Pinus contorta
Ips latidens170.2Pinus ponderosa
Ips emarginatus7<0.1Pinus ponderosa
Unknown factors268229.5Pinus ponderosa
Wind195821.6Pinus ponderosa
Suppression3273.6Pinus ponderosa
Snow breakage610.7Pinus ponderosa
Prescribed fire190.2Pinus ponderosa
Western gall rust150.2Pinus contorta
Stem cankers8<0.1Abies grandis
Mechanical5<0.1Pinus ponderosa
Dwarf mistletoe4<0.1Pinus ponderosa
Woodborers3<0.1Pinus ponderosa
Totals9084100
Table 3. Summary of key findings from the second census of tree mortality on the Lookout Mountain Thinning and Fuels Reduction Study, central Oregon, U.S.
AgentHighest Levels of Tree Mortality (Treatment) 1Highest Levels of Tree Mortality (Dbh Class) 2,3Correlation with Stand Density 2,4Change 5
AllUCns+++
Bark beetlesUC3,5++
D. brevicomisUC3,4,5+-
S. ventralisUCnsns++
D. ponderosaeUC2+++
I. pini75 UMZ, UC1,2ns--
UnknownUCns+++
Wind100 UMZ2,3+++
SuppressionUC1+++
1 UC = untreated control, 75 UMZ = thinned to 75% of the upper management zone, 100 UMZ = thinned to 100% of the upper management zone [21]. 2 ns = not significant (p > 0.05). 3 1 = 10.2–20.3, 2 = 20.4–30.5, 3 = 30.6–40.6, 4 = 40.7–50.8, and 5 = >50.8 cm. 4 + = positive correlation. 5 + = ≤50% increase, ++ = >50% increase, - = ≤50% decrease, -- = >50% decrease; all comparisons are statistically significantly (p < 0.008). Prescribed fire is not listed (due to so few trees being killed by prescribed fire during our second census).
Disclaimer/Publisher’s Note: The statements, opinions and data contained in all publications are solely those of the individual author(s) and contributor(s) and not of MDPI and/or the editor(s). MDPI and/or the editor(s) disclaim responsibility for any injury to people or property resulting from any ideas, methods, instructions or products referred to in the content.

