Article

Study on Leakage and Diffusion Law Under the Combined Laying of Gas Pipelines and Power Channels

1
School of Safety Science and Engineering, Henan Polytechnic University, Jiaozuo 454003, China
2
Electric Power Research Institute, State Grid Anhui Electric Power Co., Ltd., Hefei 230601, China
3
Hefei Institute for Public Safety Research, Tsinghua University, Hefei 230601, China
*
Author to whom correspondence should be addressed.
Fire 2025, 8(12), 454; https://doi.org/10.3390/fire8120454
Submission received: 29 October 2025 / Revised: 22 November 2025 / Accepted: 24 November 2025 / Published: 26 November 2025
(This article belongs to the Special Issue Confined Space Fire Safety and Alternative Fuel Fire Safety)

Abstract

With the continuous development of the times and the natural gas industry, the number of composite laying between natural gas pipelines and power channels has increased. Once a gas pipeline leaks, it is easy to enter the power channel and cause serious explosion accidents. This article uses ANSYS/Fluent numerical simulation software to establish a composite laying model for buried gas pipelines and conducts numerical simulation research on gas pipeline leakage, obtaining the leakage laws of gas under different pressure levels, leakage hole diameters, and soil types. The results show that the concentration of gas and leakage entering the power channel increases linearly with the increase in pressure. However, as the pressure continues to increase, the impact on diffusion weakens. It has been demonstrated that an increase in the diameter of the leakage hole results in accelerated diffusion, leading to an increased diffusion rate into the power channel. It is evident that the magnitude of the viscous resistance coefficient and inertial resistance coefficient of the soil directly correlates with the ease with which gas can diffuse within the soil.

1. Introduction

With the continuous upgrading of underground infrastructure in urban buildings, design flaws have led to a complex network of new and old gas pipelines criss-crossing with non-gas pipelines. This has created significant challenges for the maintenance and renewal of aging gas pipelines. Consequently, China’s gas pipeline system has entered a phase of frequent accidents. Given the highly flammable and explosive nature of natural gas, such incidents pose a severe risk of causing significant damage to surrounding residents and facilities [1,2,3]. In recent years, gas explosions have occurred frequently, as detailed in Table 1. During installation, urban gas pipelines often run parallel to or intersect with municipal utility lines such as storm drains, drainage pipes, and sewage pipes. Compounded by the complex layout of underground spaces, any gas leak can readily spread to adjacent drainage systems or enclosed areas like inspection chambers. When gas accumulates to explosive concentrations within confined spaces, it can trigger severe safety incidents, posing significant threats to public safety and endangering lives and property.
In recent years, many scholars have conducted extensive research on related topics. For instance, Jayarathne [4] evaluated six diffusion coefficient parameter functions (DPFs) by comparing predicted and measured values for minerals, clays, and sandy soils to accurately represent the diffusion rate of gases within the soil. Myna Miroslav [5] has developed a novel sensing system designed to detect individual concentrations, enabling the desired concentration to be recorded continuously and with greater accuracy. Parvini Mehdi [6] investigated the impact of gas leakage within soil using two submodels. Dadkani Peiman [7] discovered that gas leaks during hot seasons and fire incidents during cold seasons affect broader areas. Bonnaud Caroline [8] investigated the impact of small leaks on buried gas pipelines through experiments and modeling. Ebrahimi-Moghadam A [9] developed a numerical method for investigating leakage in above-ground and buried urban distribution natural gas pipelines. Houssin-Agbomson [10] employed experimental methods to study leaks in a high-pressure pipeline, specifically assessing the risks associated with leakage incidents. Wakoh and Hirano [11] proposed a predictive equation for concentrations of combustible gas leakage. Wilkening and Baraldi [12] utilized numerical simulation to compare the distinct leakage processes of high-pressure hydrogen pipelines versus gas pipelines under pinhole leakage conditions. Bai Minghao [13] proposed a theoretical framework for evaluating urban safety resilience based on a triangular model, establishing an evaluation indicator system that encompasses fire hazards, regional characteristics, and fire resilience. Żakowski, Krzysztof [14] discussed the most important field methods for assessing stray current risks in natural gas pipelines. Torno [15] conducted an analysis of the relationship between methane emissions and primary ventilation. In a secondary investigation, they examined the effect of adding auxiliary ventilation fans to primary ventilation openings; finally, they examined the temporal evolution of methane levels. In the aforementioned discussion, Komarov Alexander [16] explored the mathematical modeling of outdoor accidental deflagration explosions. It has been demonstrated that basing computational experiments on the linear equations of continuum motion is most reasonable. Moloudi Reza [17] proposed a novel approach to evaluate gas release rates and release mass. This approach entailed the introduction of a dimensionless equation in order to simulate quasi-one-dimensional transient compressible flow in ruptured gas pipelines. Malakhov [18] employed the commercial STAR-CCM+ code to conduct numerical simulations verifying hydrogen distribution within semi-enclosed spaces, comparing the simulated results with experimental data. Mahgerefteh Haroun [19] presented a numerical model for simulating fluid dynamics following a rupture in pressurized pipeline networks containing multicomponent hydrocarbon mixtures. Abhulimen Kingsley E [20] proposed a new model for optimal detection of liquid pipeline leaks. Gupta Payal [21] introduced a leak monitoring system, termed the Leak Analysis System. This system employs a probabilistic approach to determine the location and leakage rate of leaks in low-pressure gas distribution networks. Tauseef [22] utilized CFD to evaluate heavy gas diffusion in the presence of obstacles. Ding Yuqi [23] investigated the impact of gas interactions between the interior and exterior of the pipeline on leakage, developing a three-dimensional diffusion model that links the pipeline and air domains. Silgado-Correa [24] proposed a mathematical model to predict the fluid dynamics of accidental cloud flows, finding that the dimensionless flammable cloud is related to the accidental leakage rate, wind speed, and fluid properties. Yassin Khaled [25] investigated the dispersion of hydrogen leaks in enclosed buildings, as well as the optimal design of ventilation outlets for hydrogen systems in confined spaces. Mohanty Shuvam [26] proposed and validated a computational fluid dynamics (CFD) model using experimental data on the diffusion of methane through a 100-millimeter-thick layer of sand into the atmosphere. Srour Ola [27] conducted a study to investigate the effects of pipeline pressure, burial depth, and release direction on the watershed. Penchev Miroslav [28] established that, whilst the blending of hydrogen with natural gas has been demonstrated to enhance the volumetric flow rate of gas leaks, hydrogen itself does not exhibit a heightened propensity for leakage in comparison to methane. Bagheri Mojtaba [29] investigated the probability of fatalities caused by gas release and the severity of gas leak exposure risks. Moghadam Dezfouli [30] determined the gas leakage rate from household gas pipelines branching off from natural gas distribution pipelines and their connections. Bagheri Mojtaba [31] utilized CFD simulation results based on optimal design to evaluate acid natural gas emissions in silty, sandy, and gravelly soils. Venkata Rao G [32] conducted a series of controlled leakage detection experiments under varying soil moisture levels and soil types to reflect performance metrics under changing soil conditions. Javad Bezaatpour [33] developed a three-dimensional numerical model to investigate the relationship between the leakage and propagation rates of natural gas from buried pipelines and the actual conditions of the soil. Agarwal A [34] used computational fluid dynamics techniques to study the potential impact of natural gas leaks from pipelines.
Currently, domestic and international scholars primarily focus on the leakage diffusion patterns of buried gas pipelines in isolation, with limited research on leakage diffusion patterns in areas where buried gas pipelines are laid in combination with other pipelines. Therefore, the author employs Fluent numerical simulation software to establish relevant physical models and investigate the leakage diffusion patterns of gas pipelines in composite installation zones. Given that power pipelines are more prone to generating electrical sparks, once gas leaks from buried pipelines diffuse and infiltrate into these pipelines, forming accumulations, they may ultimately lead to severe gas explosion accidents. Consequently, other pipelines in this study are set as power pipelines, aiming to provide insights for preventing such incidents.

2. Model Building

2.1. Physical Model

The specific physical model setup is shown in Figure 1 and Figure 2. Four concentration measurement points were established: Point 1 is positioned directly above the leak hole, 50 mm from the hole. Point 2 is located directly above the leakage gap, 20 mm from the gap. Point 3 is situated 200 mm to the right of point 1, elevated 120 mm above point 1. Point 4 is positioned 80 mm directly above point 2. The entire process occurs at a constant temperature. The explosive limits of methane gas range from 5% to 15% (by volume). To facilitate comparison of calculation results, these values are converted to mass fraction. Calculations indicate that the lower explosive limit (LEL) of methane is approximately 0.02833 by mass fraction.

2.2. Theoretical Basis

The process by which gases leak and diffuse in soil is governed by three fundamental conservation laws: conservation of mass, conservation of momentum, and conservation of energy. These equations are expressed mathematically as the continuity equation, the momentum equation, and the energy equation, respectively [35].
1.
Continuity Equation:
ρ t + ρ u x x + ρ u y y + ρ u z z = 0
In the equation, ρ is the density of the gas, kg·m−3; t is time, s; ux, uy, and uz are the component velocities in the x, y, and z directions.
2.
Momentum Equation:
The leakage and diffusion process of methane in soil satisfies the momentum equation:
ρ u x t + ρ u x u = p x + τ x x x + τ y x y + τ z x z + ρ f x
ρ u y t + ρ u y u = p y + τ xy x + τ yy y + τ zy z + ρ f y
ρ u z t + ρ u z   u = p z + τ xz x + τ yz y + τ zz z ρ f z
In the equation, τxx, τxy, and τxz are the components of viscous forces, while fx, fy, and fz represent the unit mass forces in different directions, measured in m·s−2.
3.
Energy Equation:
The leakage and diffusion process of methane in soil satisfies the energy equation:
ρ E t +   u ρ E + P = k eff T j h j J j + τ eff   u + S h
In the equation, E is the total energy of the control element, J·kg−1; keff is the effective heat transfer coefficient, W·m−1·K−1; hj is the enthalpy value of component j, J·kg−1; Jj is the diffusion flux of component j, kg·m−2·s−1; and Sh is the chemical reaction heat, J.
After comprehensive consideration, this paper ultimately selected the k-ε standard turbulence model for calculations, setting the model’s default state to fully turbulent and neglecting molecular viscous effects. To reduce computational load, temperature changes during leakage processes are temporarily disregarded.

2.3. Initial and Boundary Condition Setup

The component model selects a non-reactive component transport model, defining the components as methane–air and assuming natural gas composition as 100% methane. The soil section is set as a porous medium, with specific soil parameters as shown in Table 2. Table 3 presents the specific operating conditions set, with the primary variables being pipeline pressure, leak aperture size, and buried soil environment. In actual production, gas pipelines are categorized into low-pressure, medium-pressure, and high-pressure pipelines; hence, pressure is set as a variable. Furthermore, in real-world incidents, when pinhole leaks occur in gas pipelines, the aperture sizes often vary, so leak aperture size is also set as a variable. Finally, since the soil environments surrounding buried gas pipelines vary significantly in actual production, soil type was selected as a variable. It has been determined that the pressure at the leakage point is equivalent to the pipeline pressure. The aperture through which fluid can escape is designated as a pressure inlet, the upper soil surface as a pressure outlet, and the lateral and bottom surfaces of the soil domain as symmetric boundaries. The primary methane volume fraction allocated to the soil domain is set at 0%. A pressure solver is employed to solve the continuity equation, momentum equation, and component equation. Pressure–velocity coupling is implemented using the PISO algorithm, with a second-order upwind scheme selected for spatial differentiation. The time step was set to 0.1 s, with a total physical calculation duration of 100 s. The maximum iteration count per time step was set to 20.
For the convenience of numerical simulation calculations, this paper assumes the fuel gas is 100% pure methane. However, in actual production and daily life, commercial natural gas often contains 5–10% ethane or propane. Therefore, compared to real-world conditions, the simulated results may exhibit slight deviations in the lower explosive limit (LEL) and exert some influence on viscosity. In reality, diffusion rates for mixed gases may be slower than simulated due to molecular weight differences. Furthermore, this model design primarily considers soil type, whereas actual scenarios require accounting for soil-specific reactions (microbial oxidation), external factors like wind pressure gradients and capillary groundwater rise, and the dynamic environments where urban gas leaks typically occur. The omission of these considerations may limit the model’s universality.

2.4. Grid Partitioning and Irrelevance Verification

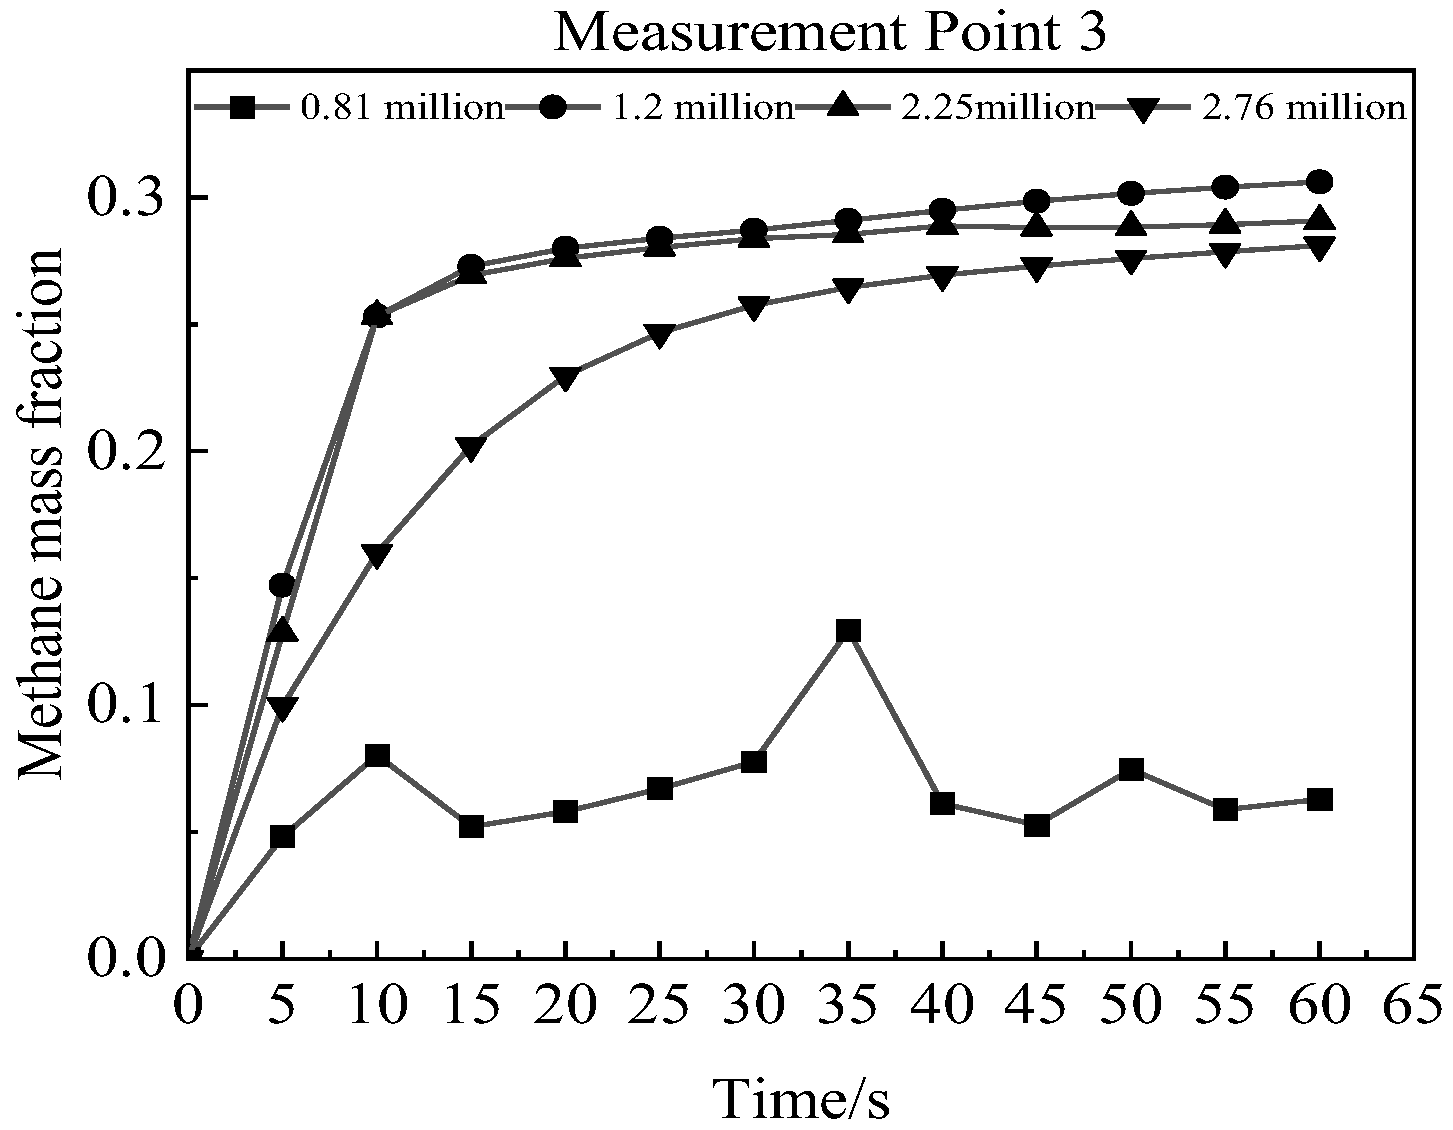
Structured meshes were generated using ICEM to ensure mesh quality and accuracy, with mesh refinement applied near leakage openings and seepage cracks. Four mesh configurations were evaluated, and the simulation ultimately employed a 2.25 million-cell mesh following comparative analysis. The methane concentration comparison results at the three specific measurement points are shown in Figure 3 below.

3. Experimental Validation of the Model

To ensure the validity and accuracy of the numerical simulation model, this chapter simulates gas leakage under composite installation of power lines and gas pipelines in real-world conditions by constructing a relevant experimental platform. A corresponding model is established in ANSYS 2022/Fluent with a view to validate the accuracy and effectiveness of the numerical simulation model, laying the groundwork for subsequent research on gas leakage patterns based on numerical simulation. First, the design of the experimental platform is described, followed by an explanation of how to conduct experiments under different operating conditions using this platform.

3.1. Design of the Experimental Platform

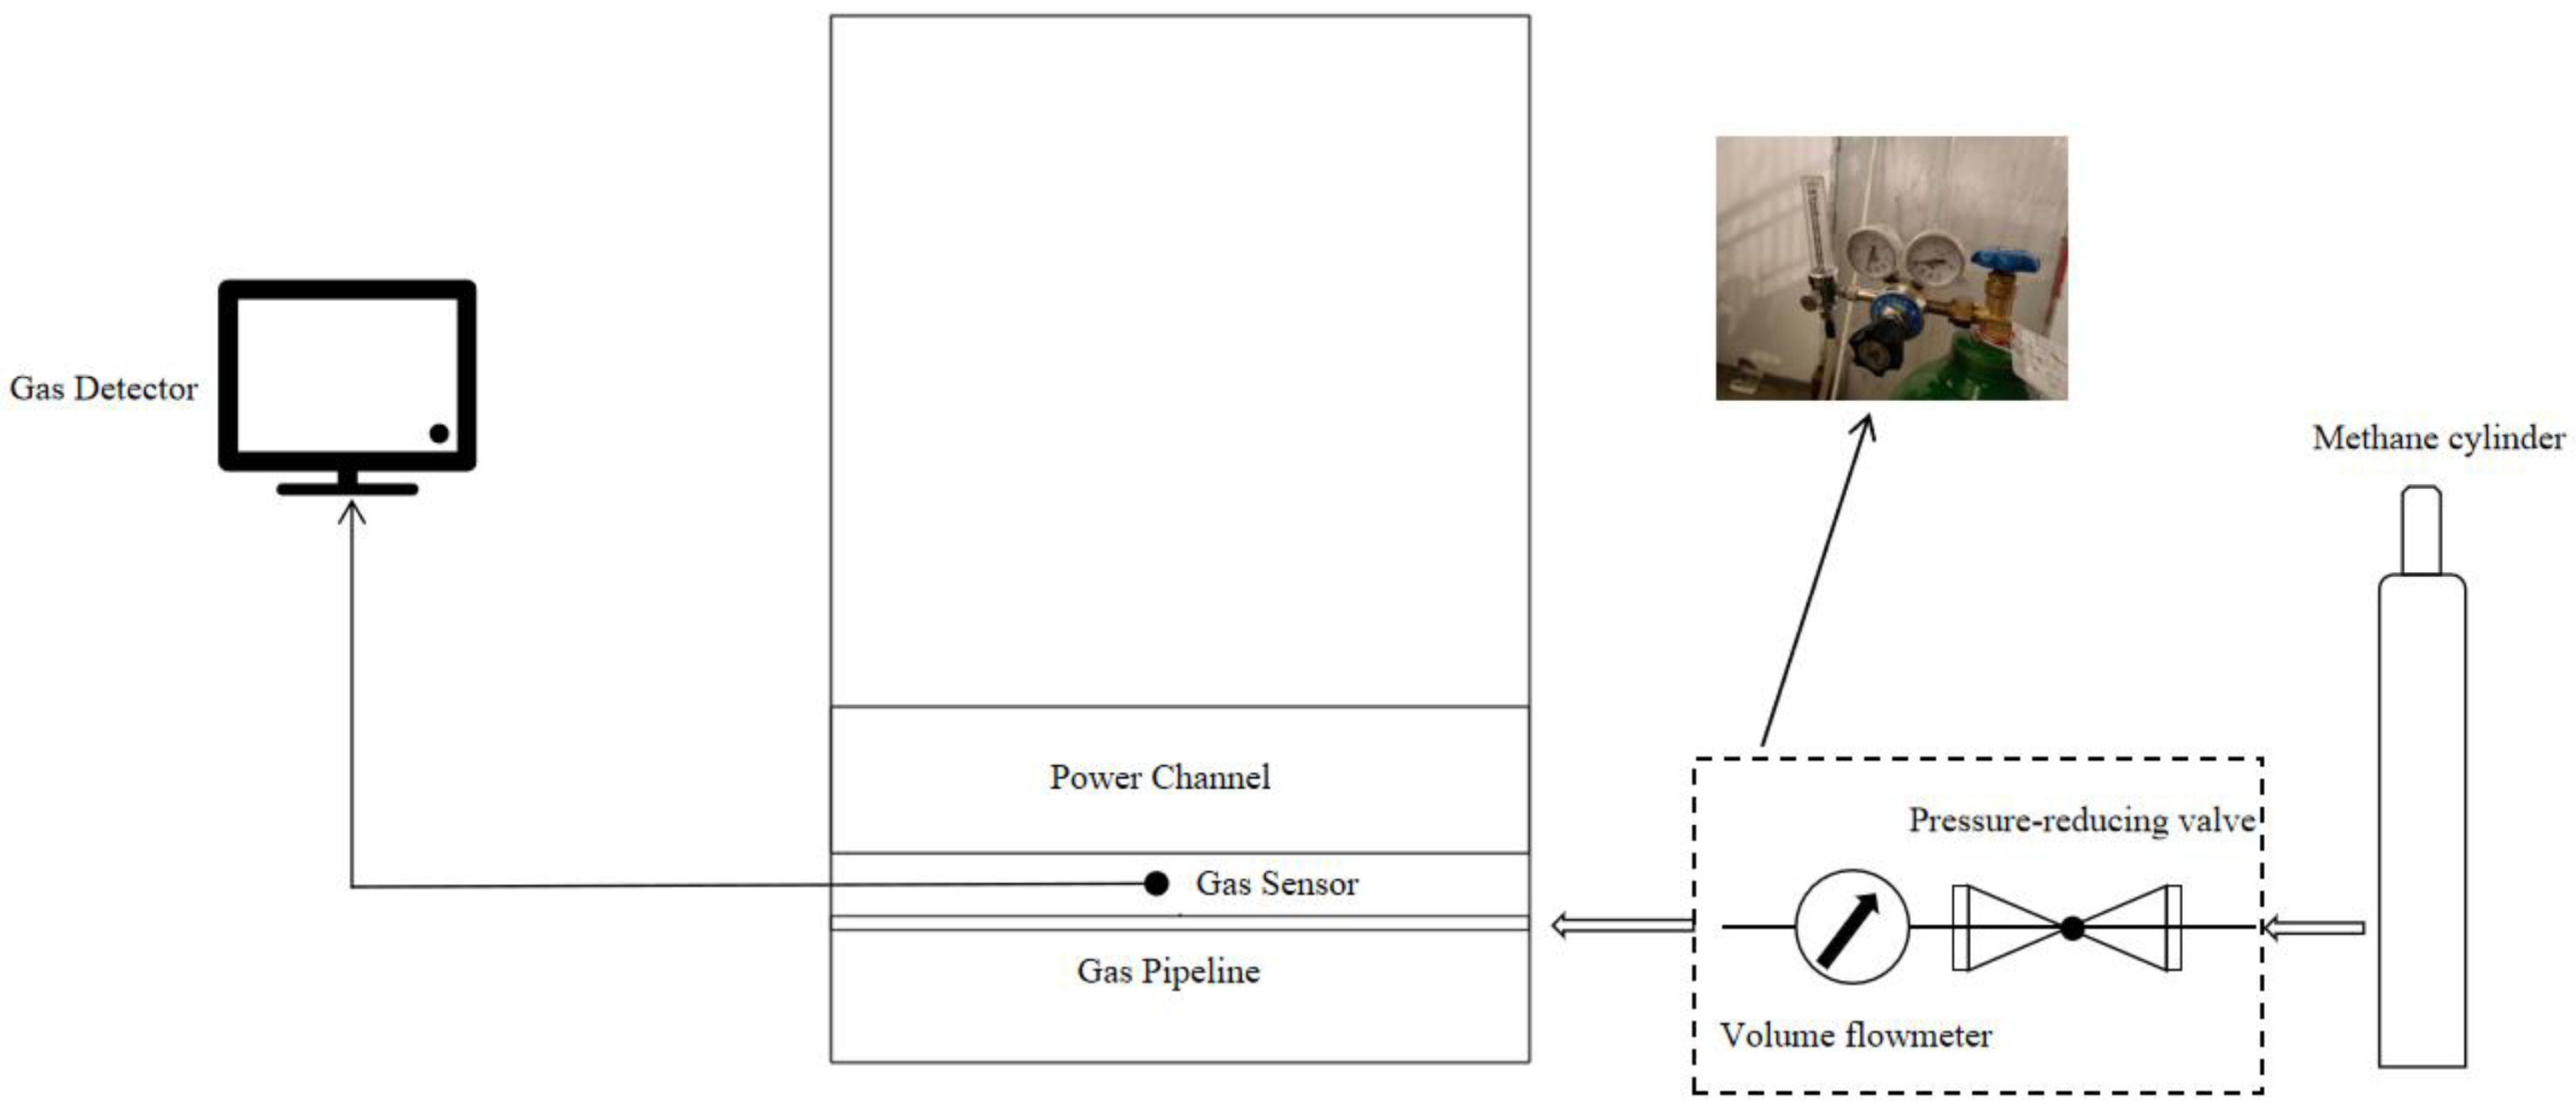
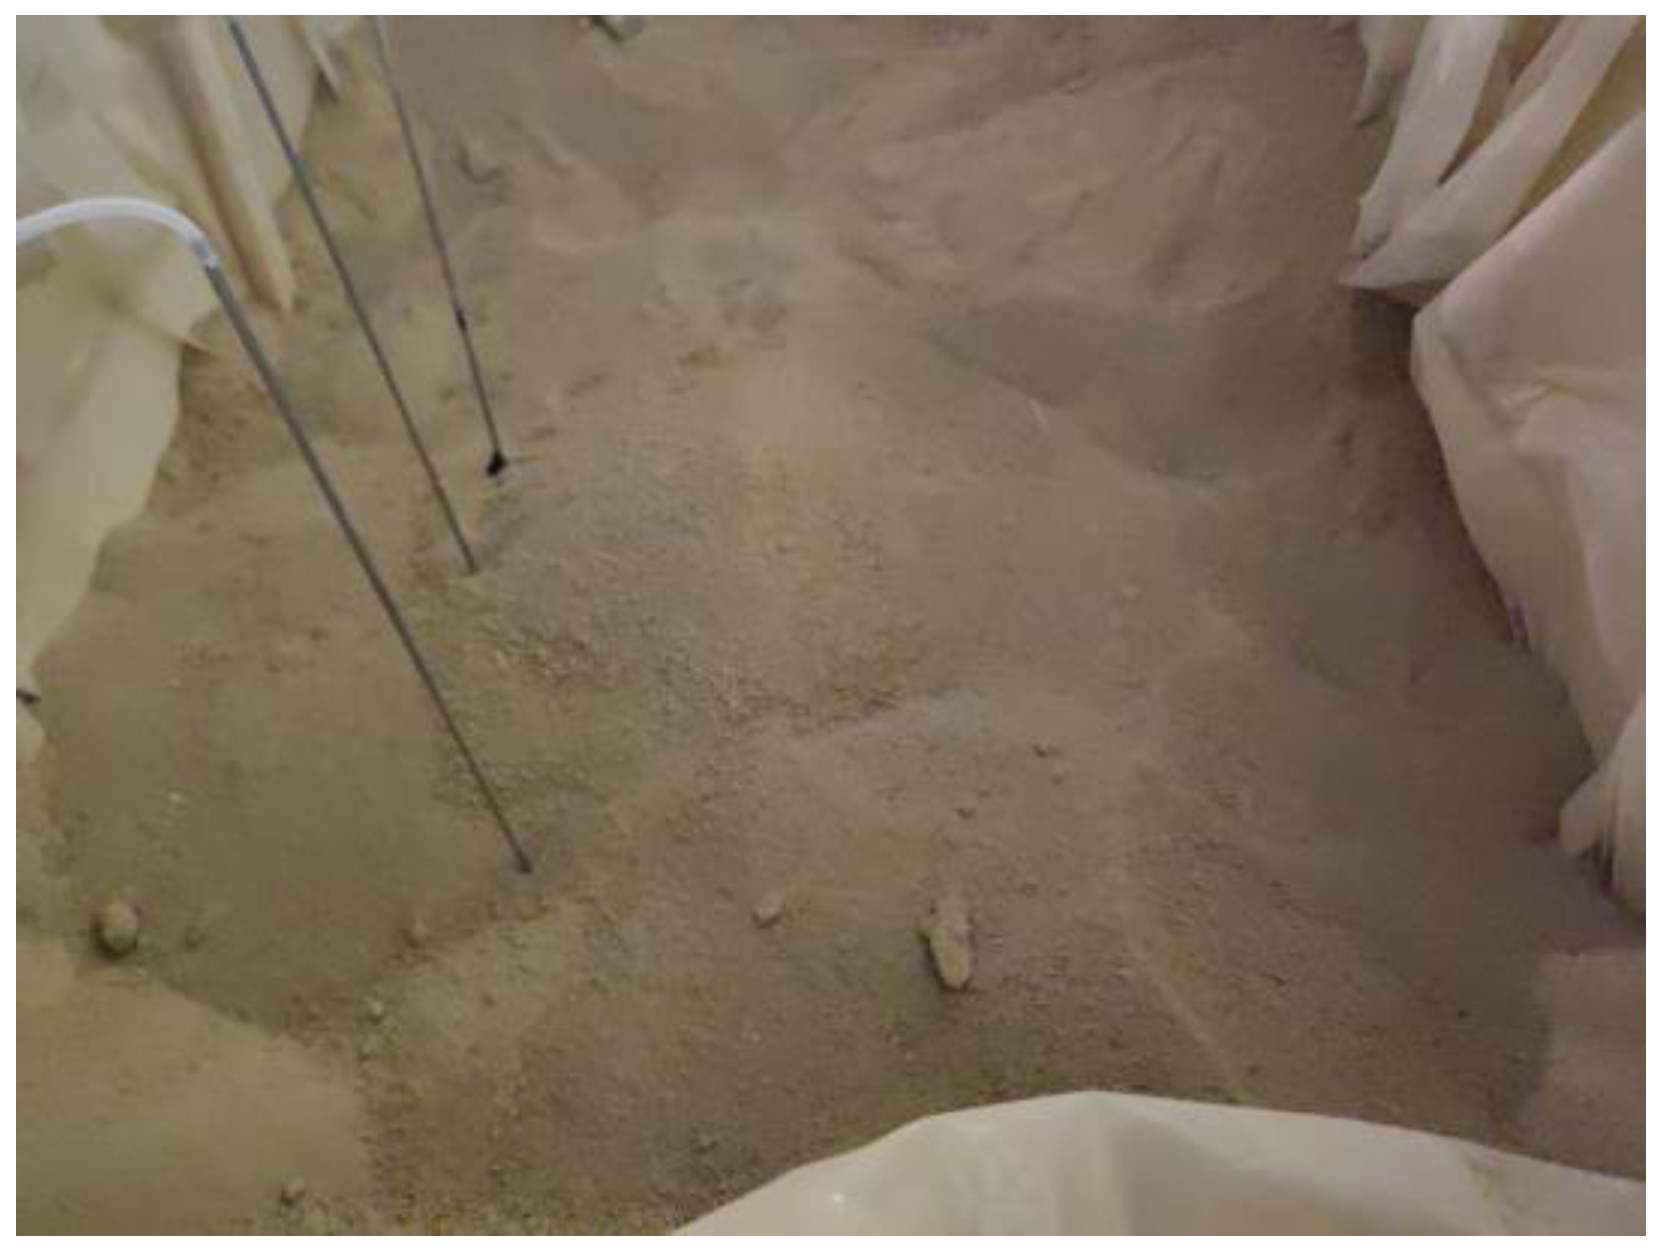
Figure 4 and Figure 5 present the design diagram of the experimental platform and the specific experimental site, which closely approximate actual conditions. The experimental platform primarily consists of three components: the gas control section, the sandbox section, and the gas recording section. The gas control section comprises a volumetric flow meter, a pressure reducer, and a methane cylinder, enabling control of the gas pressure entering the experimental pipeline and real-time monitoring of methane cylinder gas levels. The sandbox section features a main chamber measuring 1.5 × 1 × 1.2 m. The soil installed within has a porosity of 0.38, a plasticity index of 10, and a clay content of 30%. A 2 cm-diameter simulated gas pipeline is buried 20 cm from the bottom of the sandbox. A 3 mm-diameter leak hole is positioned in the center of the pipeline. A model of an electrical conduit, scaled to the correct proportions, is buried 10 cm above the pipeline, directly beneath the pipeline wall. A methane concentration gas sensor is embedded between these two structures. The specific measurement point is set 10 cm above the leak hole. The third section is the gas recording unit, primarily consisting of an APES-L (Manufacturing company for Empaer, Shenzhen, China) series pump-suction handheld gas detector. Its main function is to record methane concentrations collected by the gas sensor under various experimental conditions. Specific experimental conditions are detailed in Table 4.

3.2. Experimental Procedure

The objective of this experiment is to document methane concentration variations at different measurement points under varying operating conditions, with pipeline pressure serving as the primary regulating factor. The experimental results will be compared and validated to assess the accuracy and effectiveness of the numerical simulation model. Specific experimental steps are as follows:
  • Conduct preliminary experiments to determine optimal conditions for the formal experiment and verify the scientific validity and feasibility of the experimental design.
  • Open the methane cylinder, adjust the pipeline pressure, and begin recording changes in methane concentration at the measurement point under different operating conditions.
  • Stop recording, close the methane cylinder, and wait for methane gas to dissipate from the soil.
  • Repeat the above steps until experiments under all operating conditions are completed.

3.3. Model Validation

Based on the experimental platform setup, a corresponding model was established in ANSYS 2022/Fluent to simulate methane concentration changes at specific measurement points under different operating conditions. The resulting methane concentration curves were compared with experimentally measured data, and the calculated errors were used to iteratively optimize the numerical simulation settings until the error tolerance criteria were met. The final results showed an average error of 3.76%, validating the accuracy of the numerical simulation calculations. The comparison results between the experimental data and the simulated data are shown in Figure 6 below. However, due to limitations in the experimental site conditions, there are discrepancies between the dimensions of the gas pipelines and electrical conduits, as well as the soil environment and the actual leakage patterns observed in real-world composite installations of buried gas pipelines. This prevents the experiment from fully replicating the leakage scenarios of actual buried pipelines. The reduced dimensions of the gas pipeline and electrical conduit may introduce discrepancies between experimental outcomes and actual conditions, potentially causing deviations from real-world leakage results. These factors somewhat diminish the accuracy of the experimental findings.

4. Analysis of Numerical Simulation Results

4.1. Simulation Results at Different Pressures

As illustrated in Figure 7, the diffusion process of composite-laid gas pipelines in soil is influenced by variations in pipeline pressure. At the same time interval, higher pressures result in larger areas of high methane concentration. Over the same time period, as pressure increases, the area within the lower explosive limit (LEL) zone expands. Specifically, at 0.2 MPa pressure, the hazardous area diameter is less than 1 m; at 0.4 MPa, the hazardous zone diameter reaches approximately 1 m; and at 0.6 MPa, the hazardous zone diameter significantly exceeds 1 m. The diagram further reveals that as pressure increases, the methane diffusion area continuously expands, and the region with a methane concentration of 0.02833 also grows. As previously calculated, the lower explosive limit (LEL) concentration for methane is precisely 0.02833. Therefore, as pipeline pressure continues to rise, the area within the methane gas’s lower explosive limit expands, increasing the risk zone for explosion incidents. In summary, increased gas pipeline pressure directly leads to an expansion of the methane LEL range.
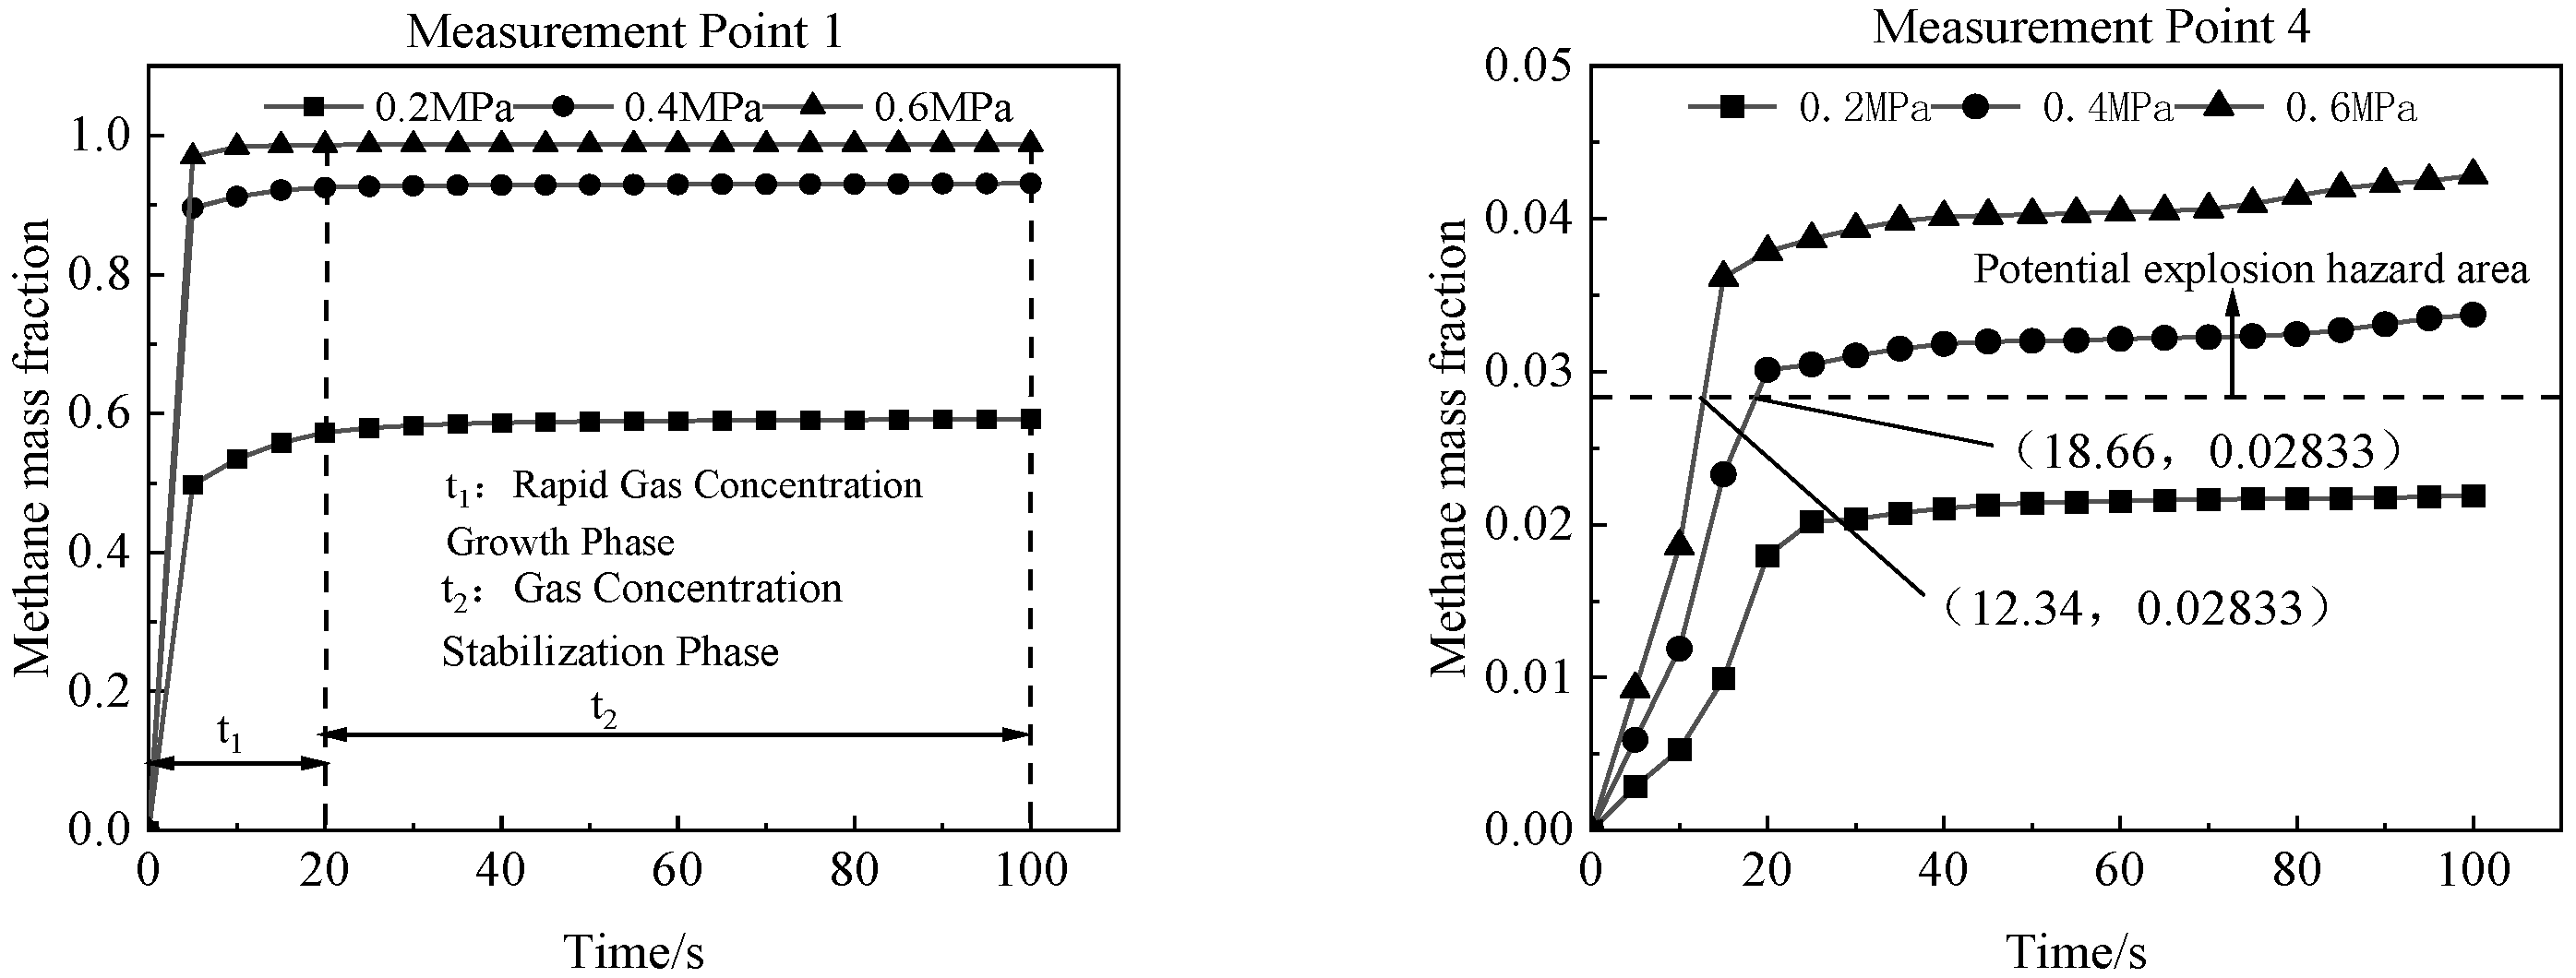
As shown in Figure 8, within 5 s, the methane concentration at measurement point 1 rapidly increased and eventually stabilized under all three pressure conditions, with similar leakage rates. As pressure increased, the methane mass fraction at steady state correspondingly rose, and the methane leakage rate also increased accordingly. Measurement point 4 is located inside the electrical conduit. It can be concluded that an increase in pipeline pressure from 0.2 MPa to 0.6 MPa results in an increase in methane concentration within the electrical conduit to a certain extent. At pressures of 0.4 and 0.6 MPa, the methane concentration reaches its explosive limit, making the conduit prone to explosion when it encounters electrical sparks.

4.2. Simulation Results for Different Leak Hole Sizes

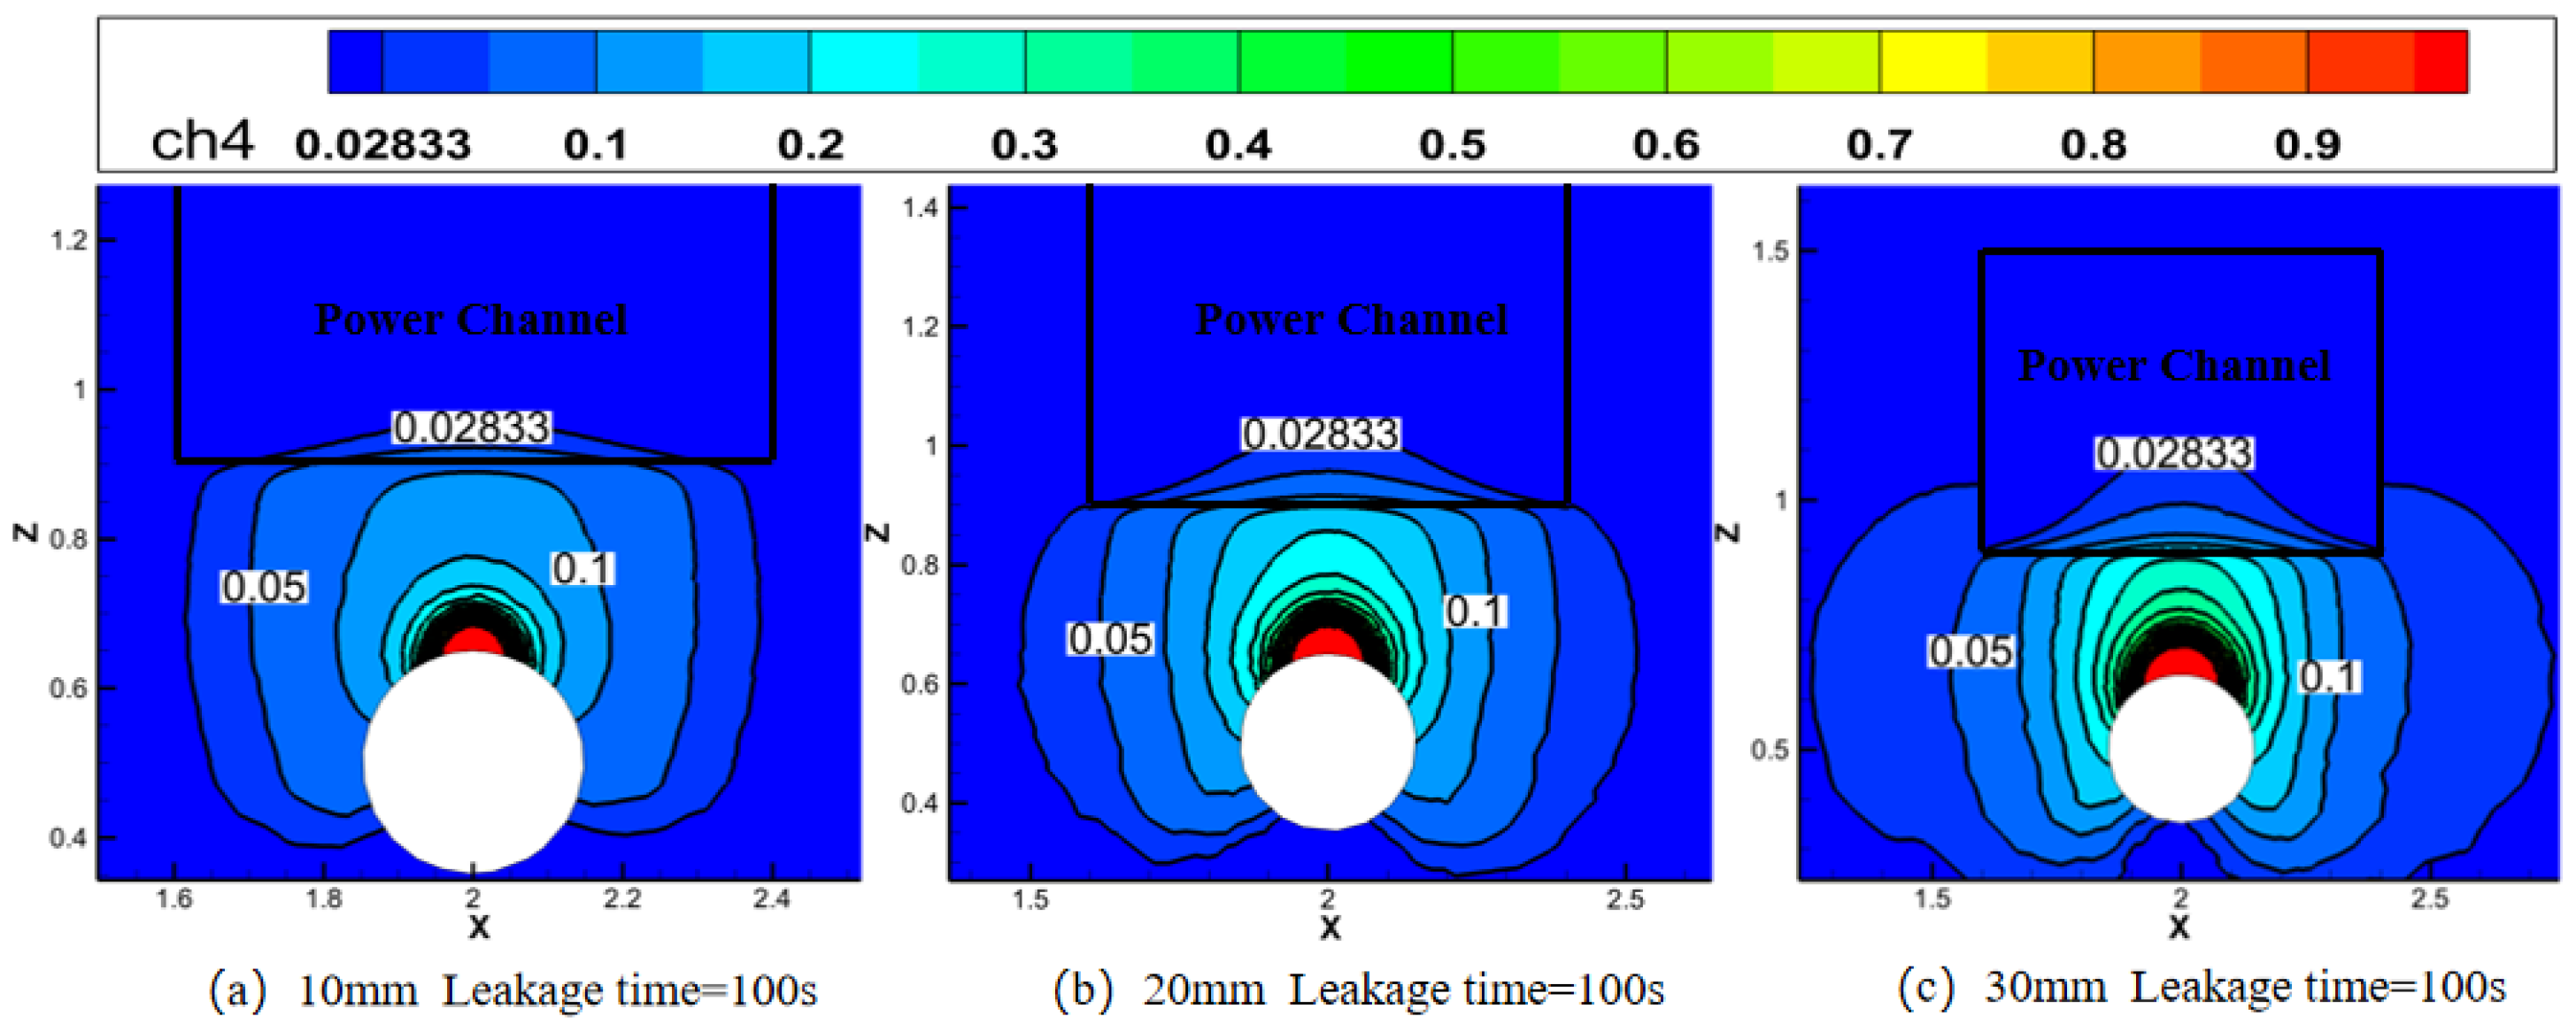
Concurrently, an augmentation in the dimensions of the leak hole results in a perpetual expansion of the area exhibiting a high concentration of methane. Figure 9 shows the x-z plane cloud diagram of gas leak diffusion under composite laying conditions for different leak hole sizes. For a 10 mm aperture, the methane lower explosive limit (LEL) zone diameter remained within approximately 1 m. At a 20 mm aperture, this diameter was also about 1 m. When the aperture increased to 30 mm, the diameter reached approximately 1.5 m. This demonstrates that as the leakage aperture grows, the methane diffusion area continuously expands. The figure also shows that, as the leakage aperture increases, the proportion of methane diffusing into the interior of the power channel increases.
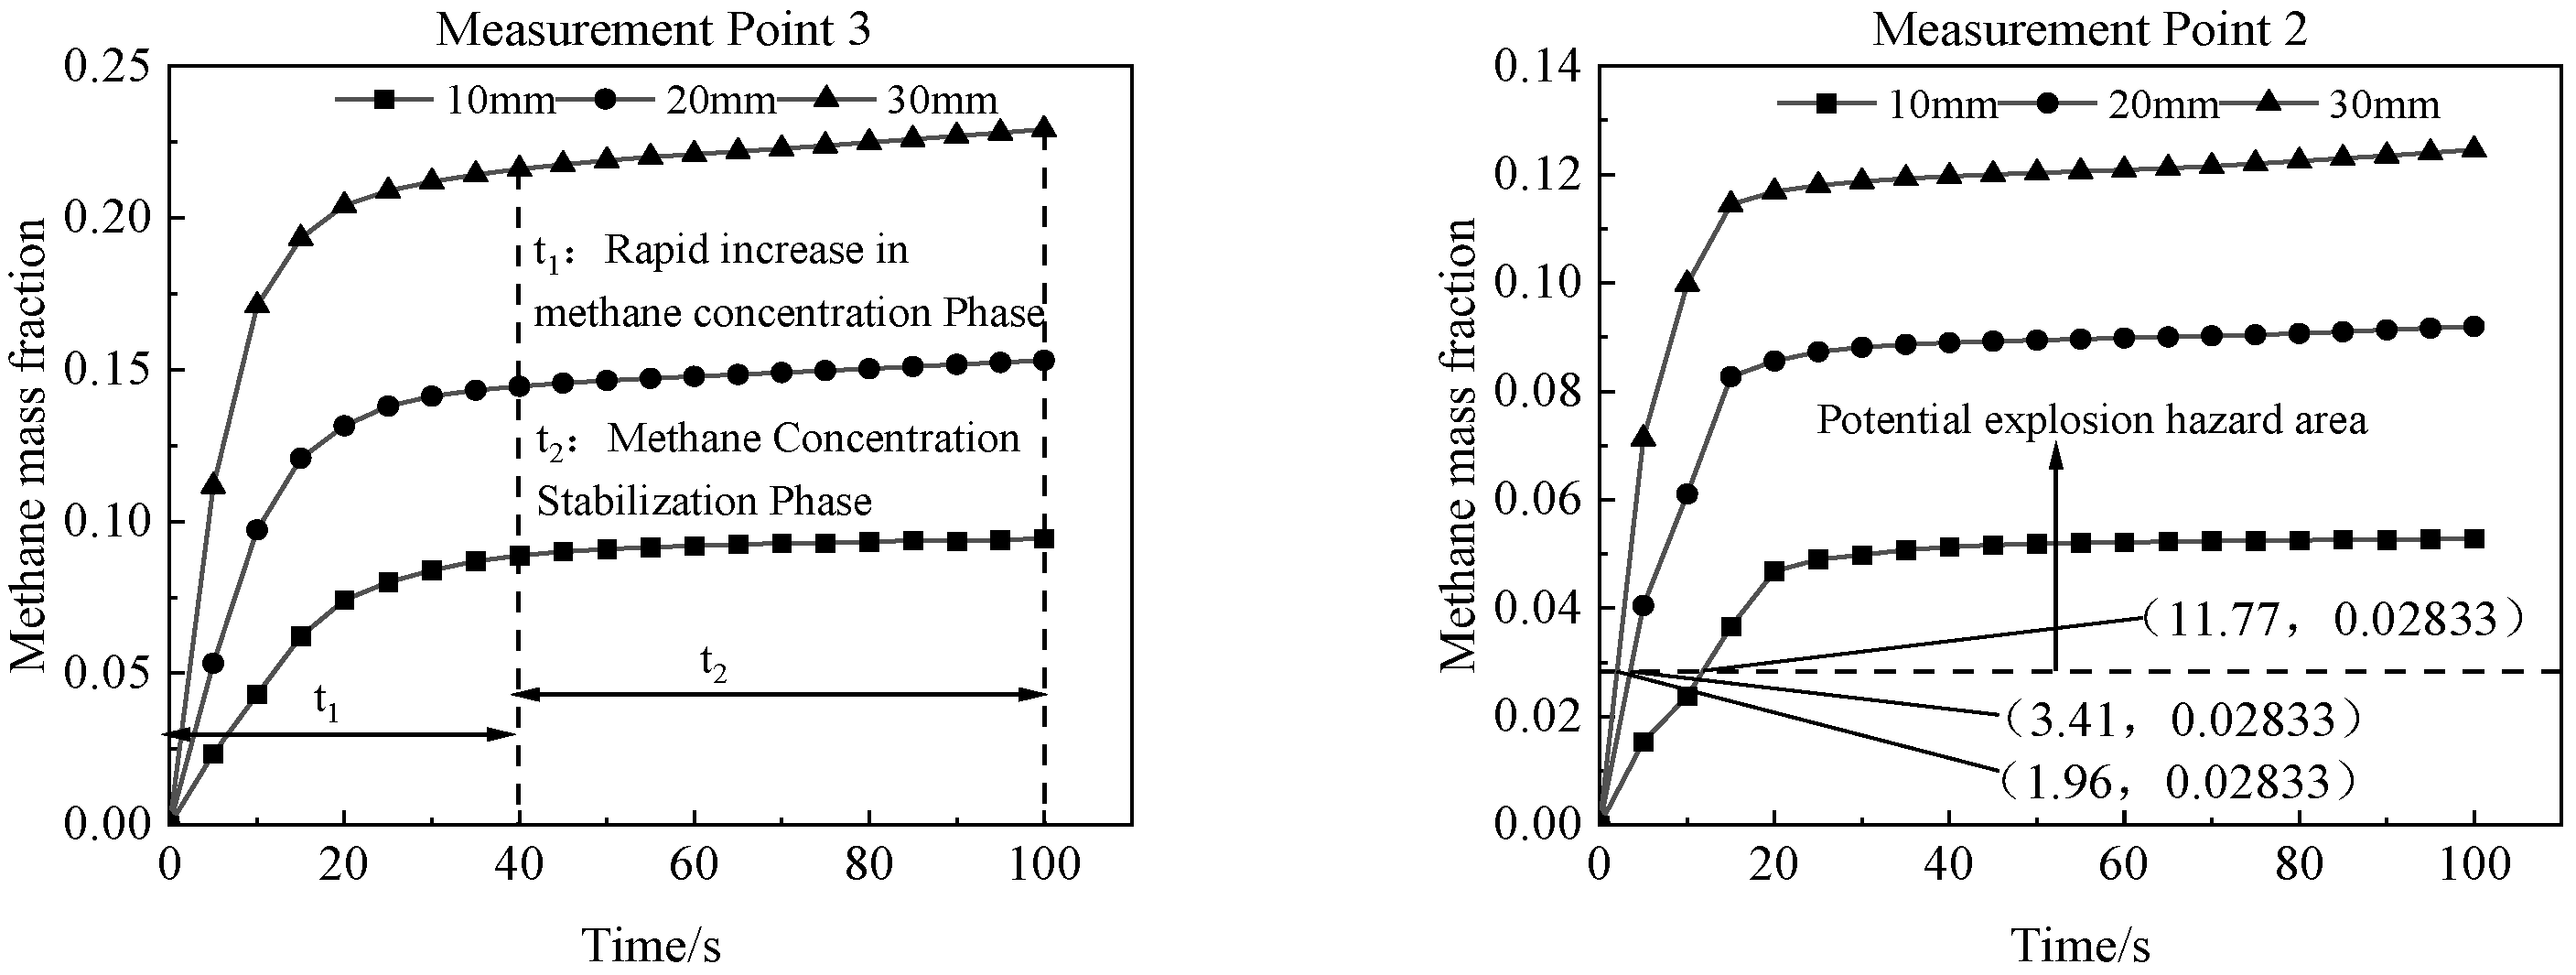
The methane mass fraction variation curve at measurement point 3 is shown in Figure 10. Measurement point 3 is positioned adjacent to the leakage hole. At this point, the leakage hole size significantly impacts the methane leakage rate, specifically accelerating the leakage rate as the hole size increases. Measurement point 2 is located within the electrical conduit. Comparing the methane mass fraction change curves at both measurement points reveals that increasing the leak hole size from 10 mm to 20 mm significantly expands the methane accumulation zone within the electrical conduit and shortens the time required to reach the lower explosive limit. Furthermore, methane concentrations at both measurement points stabilize within 20 s.

4.3. Simulation Results for Different Buried Soils

As shown in Figure 11, demonstrated methane diffusion under different soil conditions, due to differences in soil conditions, the extent of high methane concentration zones varies within the same time period: clay, with its high viscosity and inertial resistance coefficients, exhibits nearly stagnant diffusion; loam occupies an intermediate position; and sand, possessing low viscosity and inertial resistance coefficients, shows the greatest diffusion range for gas leakage.
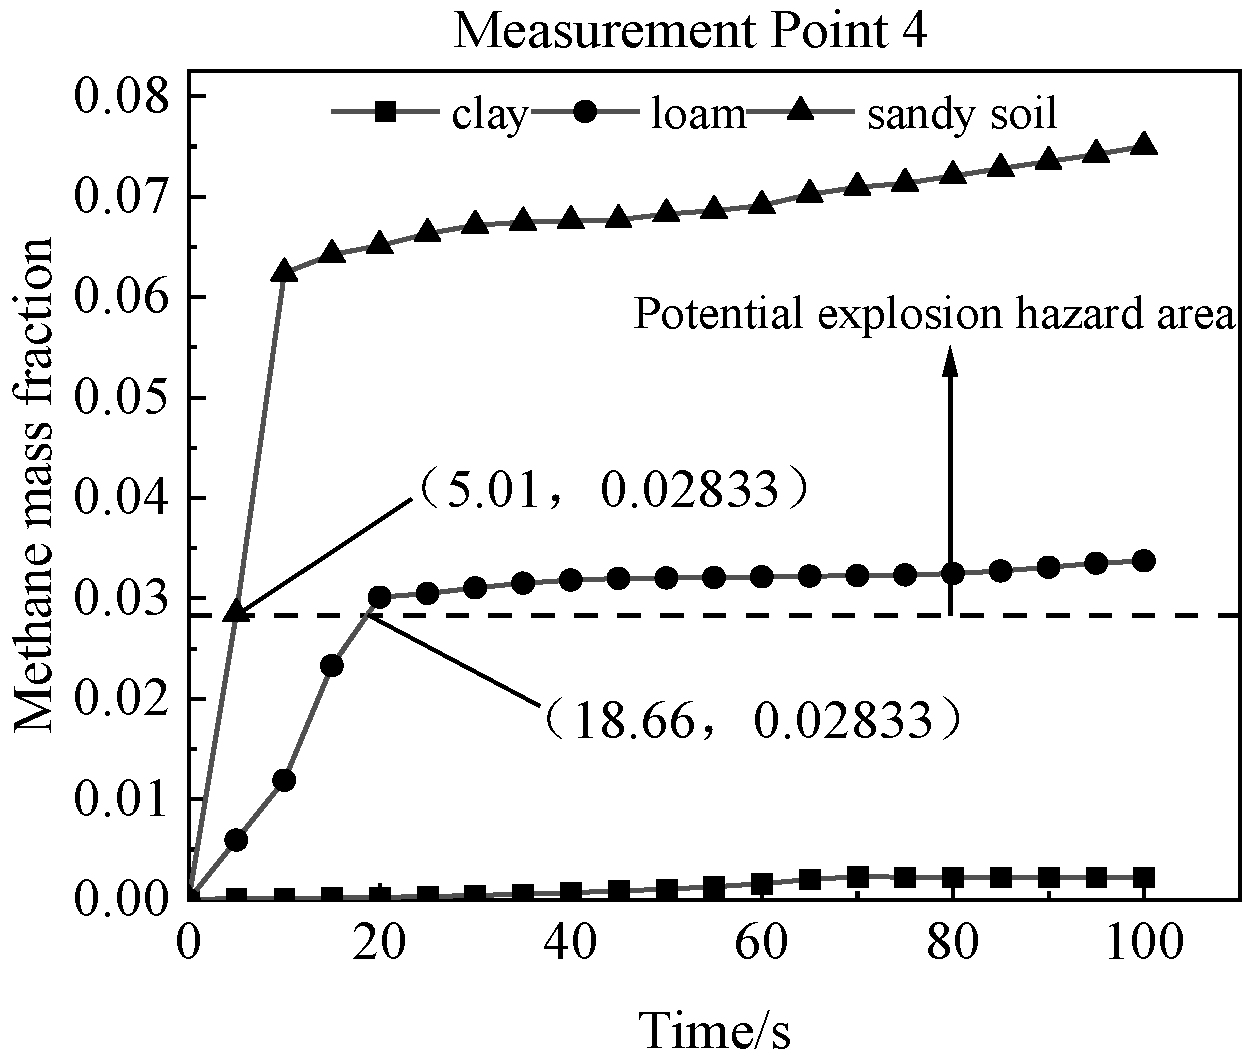
As shown in Figure 12, analysis of methane concentration curves over time at four monitoring points reveals that gas leakage rates exceed those in loamy soil conditions and under sandy soil conditions, while leakage rates approach zero under clay conditions. Results indicate that within 10 s, methane concentrations inside electrical conduits rapidly approach the lower explosive limit under sandy soil conditions. Under clay conditions, gas diffusion into electrical conduits is negligible, while loamy soil conditions exhibit intermediate characteristics.

5. Conclusions

This study created a three-dimensional numerical model of pinhole leaks in urban gas pipeline networks in composite laying conditions. Focusing on the coordinated laying scenario of gas pipelines and power conduits, systematic numerical simulations were conducted to investigate the leakage diffusion characteristics of buried pipelines. The following conclusions were drawn:
Under varying pipeline pressure conditions, as pipeline pressure increases, the range of gas pipeline leakage diffusion in soil increases., the lower explosive limit (LEL) range of methane widens, and the portion of leakage diffusion entering electrical conduits also increases, exhibiting an approximate linear relationship. Methane leakage rates consequently rise. Upon detecting a leak, personnel must issue an early warning and alert within 0 to 20 s.
Under varying leak hole sizes, as the leak hole increases in size, the range of gas pipeline leakage diffusion in soil increases, the lower explosive limit (LEL) range of methane widens, and the portion of leakage diffusion entering electrical conduits also grows. Furthermore, as the leak hole size increases, the methane leakage rate also rises. Following a leak occurrence, personnel should issue an early warning and alert within 0 to 25 s.
Under different soil conditions, gas pipeline leaks show minimal diffusion in clay soils, resulting in a low probability of explosion incidents in electrical conduits. In sandy soils, gas leaks diffuse extremely rapidly, penetrating a significant portion of electrical conduits and posing a high risk of explosion. Conditions in loamy soils fall between these two extremes.
In actual production, when encountering gas pipeline leaks in buried sections within complex installation areas, the above conclusions can assist emergency personnel in handling such incidents and provide valuable support for monitoring and preventing their occurrence.

Author Contributions

Resources, M.F., G.N., L.Z. and X.Z.; Writing—original draft, C.G.; Writing—review & editing, C.G. and J.C. All authors have read and agreed to the published version of the manuscript.

Funding

State Grid Anhui Electric Power Co., Ltd. Science and Technology Project (52120524000A).

Institutional Review Board Statement

Not applicable.

Informed Consent Statement

Not applicable.

Data Availability Statement

The raw data supporting the conclusions of this article will be made available by the authors on request.

Conflicts of Interest

Authors Minghao Fan and Lin Zhu were employed by the company Electric Power Research Institute of State Grid Anhui Electric Power Co., Ltd. The remaining authors declare that the research was conducted in the absence of any commercial or financial relationships that could be construed as a potential conflict of interest.

References

  1. Wu, X.; Zhao, X.; Fang, W.; Wang, J.; Tang, F. Numerical simulation study on leakage and diffusion of urban buried gas pipeline adjacent to electric pipeline. J. Saf. Sci. Technol. 2024, 20, 125–131. [Google Scholar]
  2. Zhu, Q.; Yi, S.; Chen, Y.; Liu, Y. Time effect early warning model for failure risk of buried gas pipeline. Fire Sci. Technol. 2021, 40, 1780–1784. [Google Scholar]
  3. Luo, T.; Ma, H.; Hu, K.; Han, J.; Deng, R. Analysis of gas diffusion mechanism of gas leakage in buried gas pipeline. Chin. J. Appl. Mech. 2021, 38, 2405–2410. [Google Scholar]
  4. Jayarathne, J.R.R.N.; Kolodziej, R.S.; Riddick, S.N.; Zimmerle, D.J.; Smits, K.M. Influence of soil-gas diffusivity on expansion of leaked underground natural gas plumes and application on simulation efforts. J. Hydrol. 2023, 625, 130049. [Google Scholar] [CrossRef]
  5. Mynarz, M.; Tulach, A.; Bojko, M. CFD-based simulation of flammable gas dispersion in a complex geometry. J. Loss Prev. Process Ind. 2025, 94, 105551. [Google Scholar] [CrossRef]
  6. Parvini, M.; Gharagouzlou, E. Gas leakage consequence modeling for buried gas pipelines. J. Loss Prev. Process Ind. 2015, 37, 110–118. [Google Scholar] [CrossRef]
  7. Dadkani, P.; Noorzai, E.; Ghanbari, A.; Gharib, A. Risk analysis of gas leakage in gas pressure reduction station and its consequences: A case study for Zahedan. Heliyon 2021, 7, e6911. [Google Scholar] [CrossRef]
  8. Bonnaud, C.; Cluzel, V.; Corcoles, P.; Dubois, J.-P.; Louvet, V.; Maury, M.; Narbonne, A.; Orefice, H.; Perez, A.; Ranty, J.; et al. Experimental study and modelling of the consequences of small leaks on buried transmission gas pipeline. J. Loss Prev. Process Ind. 2018, 55, 303–312. [Google Scholar] [CrossRef]
  9. Ebrahimi-Moghadam, A.; Farzaneh-Gord, M.; Deymi-Dashtebayaz, M. Correlations for estimating natural gas leakage from above-ground and buried urban distribution pipelines. J. Nat. Gas Sci. Eng. 2016, 34, 185–196. [Google Scholar] [CrossRef]
  10. Houssin-Agbomson, D.; Blanchetiere, G.; Mccollum, D.; Saint-Macary, C.; Mendes, R.F.; Jamois, D.; Barbalat, M.; Foissac, A.; Lubet, T. Consequences of a 12-mm diameter high pressure gas release on a buried pipeline. Experimental setup and results. J. Loss Prev. Process Ind. 2018, 54, 183–189. [Google Scholar] [CrossRef]
  11. Wakoh, H.; Hirano, T. Diffusion of leaked flammable gas in soil. J. Loss Prev. Process Ind. 1991, 4, 260–264. [Google Scholar] [CrossRef]
  12. Wilkening, H.; Baraldi, D. CFD modelling of accidental hydrogen release from pipelines. Int. J. Hydrogen Energy 2007, 32, 2206–2215. [Google Scholar] [CrossRef]
  13. Bai, M.; Liu, Q. Evaluating Urban Fire Risk Based on Entropy-Cloud Model Method Considering Urban Safety Resilience. Fire 2023, 6, 62. [Google Scholar] [CrossRef]
  14. Żakowski, K.; Szociński, M.; Krakowiak, S. Assessment Methods for DC Stray Current Corrosion Hazards in Underground Gas Pipelines: A Review Focused on Rail Traction Systems. Energies 2025, 18, 5570. [Google Scholar] [CrossRef]
  15. Torno, S.; Toraño, J. Methane Emission Outbursts in the Mine Face of Two Galleries: Computational Fluid Dynamics Analysis and On-Site Calibration. Energies 2023, 16, 7298. [Google Scholar] [CrossRef]
  16. Komarov, A.; Korolchenko, D.; Gromov, N.; Korolchenko, A.; Jafari, M.; Gravit, M. Specific Aspects of Modeling Gas Mixture Explosions in the Atmosphere. Fire 2023, 6, 201. [Google Scholar] [CrossRef]
  17. Moloudi, R.; Abolfazli Esfahani, J. Modeling of gas release following pipeline rupture: Proposing non-dimensional correlation. J. Loss Prev. Process Ind. 2014, 32, 207–217. [Google Scholar] [CrossRef]
  18. Malakhov, A.A.; Avdeenkov, A.V.; du Toit, M.H.; Bessarabov, D.G. CFD simulation and experimental study of a hydrogen leak in a semi-closed space with the purpose of risk mitigation. Int. J. Hydrogen Energy 2020, 45, 9231–9240. [Google Scholar] [CrossRef]
  19. Mahgerefteh, H.; Oke, A.; Atti, O. Modelling outflow following rupture in pipeline networks. Chem. Eng. Sci. 2006, 61, 1811–1818. [Google Scholar] [CrossRef]
  20. Abhulimen, K.E.; Susu, A.A. Liquid pipeline leak detection system: Model development and numerical simulation. Chem. Eng. J. 2004, 97, 47–67. [Google Scholar] [CrossRef]
  21. Gupta, P.; Thein Zan, T.T.; Wang, M.; Dauwels, J.; Ukil, A. Leak detection in low-pressure gas distribution networks by probabilistic methods. J. Nat. Gas Sci. Eng. 2018, 58, 69–79. [Google Scholar] [CrossRef]
  22. Tauseef, S.M.; Rashtchian, D.; Abbasi, S.A. CFD-based simulation of dense gas dispersion in presence of obstacles. J. Loss Prev. Process Ind. 2011, 24, 371–376. [Google Scholar] [CrossRef]
  23. Ding, Y.; Xu, P.; Lu, Y.; Yang, M.; Zhang, J.; Liu, K. Research on Pipeline Leakage Calculation and Correction Method Based on Numerical Calculation Method. Energies 2023, 16, 7255. [Google Scholar] [CrossRef]
  24. Silgado-Correa, K.J.; Ferreira, T.D.; Vianna, S.S.V. Leak release momentum and the convective flow influence on the calculation of flammable cloud. J. Loss Prev. Process Ind. 2020, 65, 104123. [Google Scholar] [CrossRef]
  25. Yassin, K.; Kelm, S.; Reinecke, E. Numerical Simulation of Dispersion and Ventilation of Hydrogen Clouds in Case of Leakage Inside a Large-Scale Industrial Building. Hydrogen 2025, 6, 40. [Google Scholar] [CrossRef]
  26. Mohanty, S.; Brennan, S.; Molkov, V. CFD modelling of methane dispersion from buried pipeline leaks: Experimental validation and hazard distance estimation. Process Saf. Environ. Prot. 2024, 187, 1540–1557. [Google Scholar] [CrossRef]
  27. Srour, O.; Kakosimos, K.E.; Vechot, L.N. Toward a high-fidelity model for the identification of underground gas flow regimes resulting from buried pipeline releases. J. Nat. Gas Sci. Eng. 2022, 108, 104832. [Google Scholar] [CrossRef]
  28. Penchev, M.; Martinez-Morales, A.A.; Lim, T.; Raju, A.S.K.; Yilmaz, M.; Akinci, T.C. Leakage rates of hydrogen-methane gas blends under varying pressure conditions. Int. J. Hydrogen Energy 2025, 143, 912–920. [Google Scholar] [CrossRef]
  29. Bagheri, M.; Sari, A. A time-dependent CFD approach to consequence assessment of sour natural gas leakage from buried high-pressure transmission pipelines. J. Loss Prev. Process Ind. 2024, 91, 105389. [Google Scholar] [CrossRef]
  30. Moghadam Dezfouli, A.; Saffarian, M.R.; Behbahani-Nejad, M.; Changizian, M. Experimental and numerical investigation on development of a method for measuring the rate of natural gas leakage. J. Nat. Gas Sci. Eng. 2022, 104, 104643. [Google Scholar] [CrossRef]
  31. Bagheri, M.; Sari, A. Study of natural gas emission from a hole on underground pipelines using optimal design-based CFD simulations: Developing comprehensive soil classified leakage models. J. Nat. Gas Sci. Eng. 2022, 102, 104583. [Google Scholar] [CrossRef]
  32. Venkata Rao, G.; Kolodziej, R.S.; Zimmerle, D.J.; Smits, K.M. Performance of mobile survey solutions for natural gas pipeline leaks under different soil type and moisture conditions. Gas Sci. Eng. 2025, 140, 205650. [Google Scholar] [CrossRef]
  33. Bezaatpour, J.; Fatehifar, E.; Rasoulzadeh, A. CFD investigation of natural gas leakage and propagation from buried pipeline for anisotropic and partially saturated multilayer soil. J. Clean. Prod. 2020, 277, 123940. [Google Scholar] [CrossRef]
  34. Agarwal, A.; Molwane, O.B.; Pitso, I. Analytical investigation of the influence of natural gas leakage & safety zone in a pipeline flow. Mater. Today Proc. 2021, 39, 547–552. [Google Scholar]
  35. Liang, J. Study on Leakage Estimation and Diffusion Characteristics of Buried Gas Transmission Pipeline. Master’s Thesis, China University of Petroleum (East China), Qingdao, China, 2019. [Google Scholar]
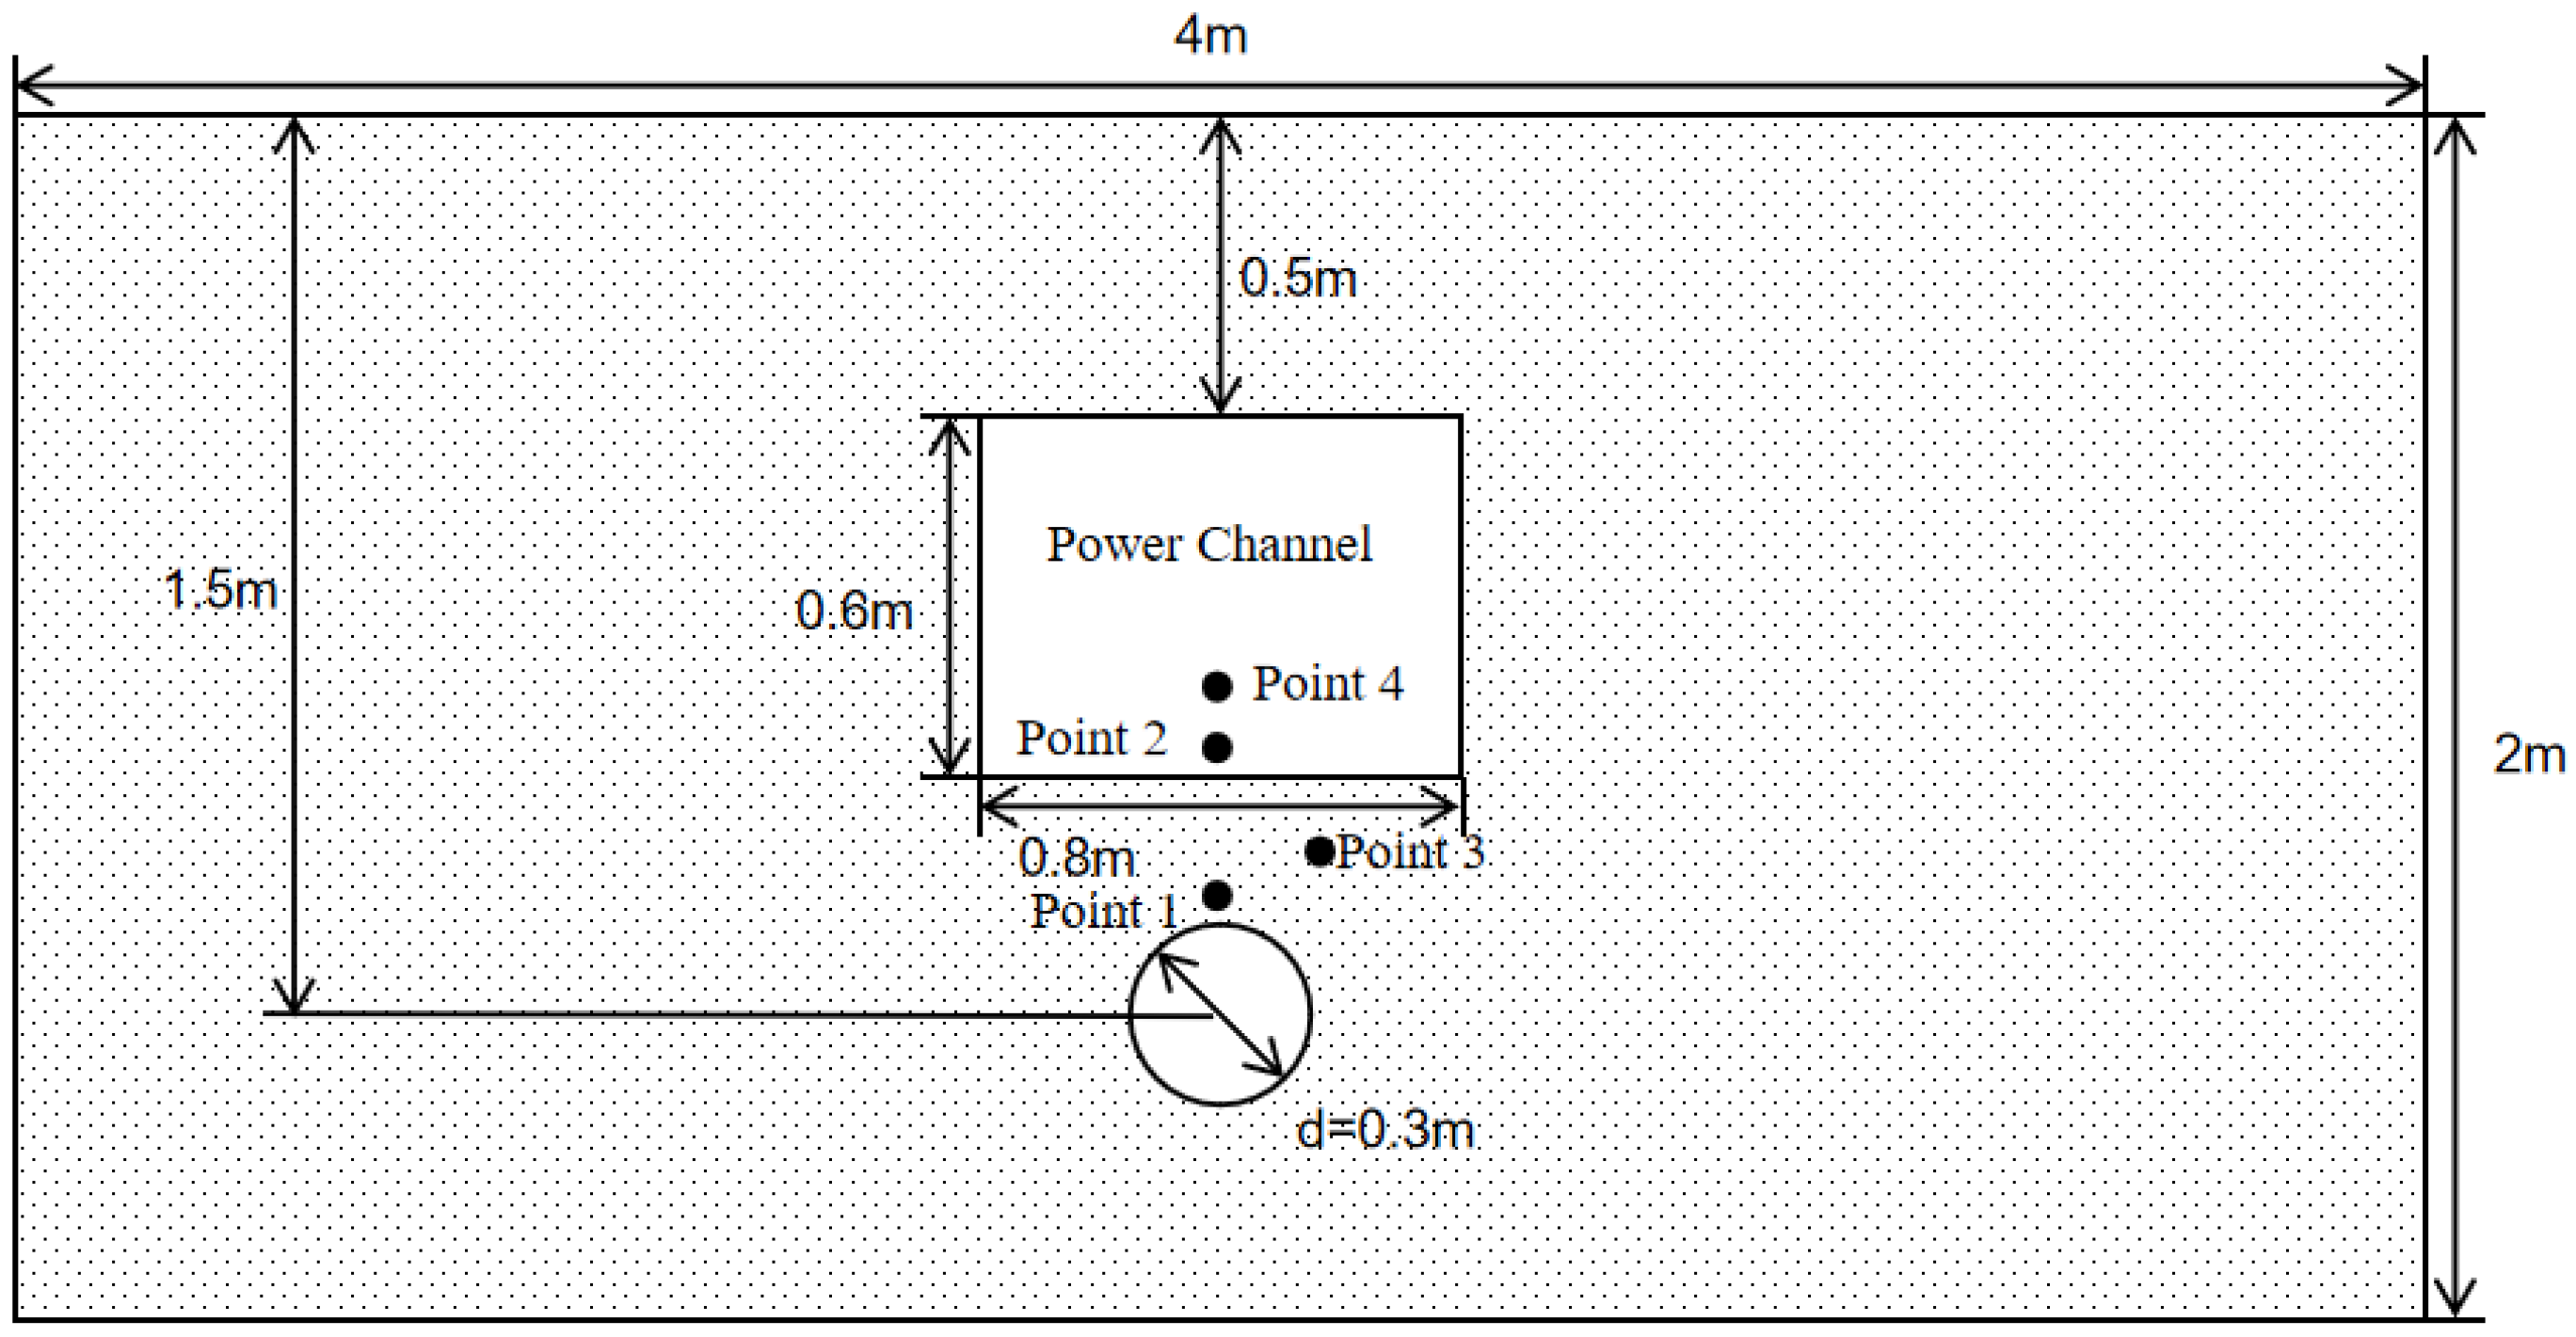
Figure 1. Section diagram of buried gas pipeline under composite laying.
Fire 08 00454 g001
Figure 2. Three-dimensional schematic diagram of buried gas pipeline under composite laying.
Fire 08 00454 g002
Figure 3. Comparison diagram of methane concentration at the same measuring point with different grid sizes.
Fire 08 00454 g003
Figure 4. Experimental platform design diagram.
Fire 08 00454 g004
Figure 5. Experimental site.
Fire 08 00454 g005
Figure 6. Verification of numerical method reliability.
Fire 08 00454 g006
Figure 7. Methane diffusion nephelogram in x-z plane under different pressures (the numbers in the white sections represent the mass fraction of methane).
Fire 08 00454 g007
Figure 8. Change curve of methane mass fraction at measuring points 1 and 4 under different pressures.
Fire 08 00454 g008
Figure 9. X-z surface methane diffusion nephelogram under different leakage hole diameters (the numbers in the white sections represent the mass fraction of methane).
Fire 08 00454 g009
Figure 10. Variation curve of methane mass fraction at measuring points 2 and 3 under different apertures.
Fire 08 00454 g010
Figure 11. Methane diffusion nephogram under different soil types.
Fire 08 00454 g011
Figure 12. Change curve of methane mass fraction at four measuring points under different soil types.
Fire 08 00454 g012
Table 1. Gas explosion incident report.
Serial NumberTimeBrief Description of the IncidentCause of the Accident
113 March 2024An explosion occurred in Yanjiao Town, Sanhe City, Langfang, resulting in seven deaths and 27 injuries.A gas leak occurred during transportation, ultimately leading to an explosion.
224 October 2023An explosion occurred at Cuiyuan Residential Community in Heping Subdistrict, Meihekou City, Jilin Province, resulting in one fatality, one person seriously injured, and 15 others sustaining minor abrasions.Improper operation by residents during gas usage ultimately led to the accident.
321 June 2023A major gas explosion occurred at Fuyang Barbecue Restaurant in Xingqing District, Yinchuan City, Ningxia Hui Autonomous Region, resulting in 31 deaths and seven injuries.Improper handling of liquefied petroleum gas cylinders caused a leak and an explosion.
429 October 2022An explosion occurred in a shop in Ganzhou, Jiangxi Province, resulting in four deaths and 18 injuries.The gas pipeline leaked under overpressure conditions, ultimately leading to an explosion.
521 June 2022A gas explosion occurred near the intersection of Beicheng East Road and Wusu Road in Baodi District, Tianjin, resulting in 23 injuries.The accident was caused by non-compliant construction practices.
610 September 2021A pipeline liquefied petroleum gas leak and explosion occurred on Commercial Street in Pulandian District, Dalian City, Liaoning Province. The incident resulted in nine fatalities and four injuries.Indoor gas leaked due to corrosion and exploded upon contact with an open flame.
Table 2. Table of soil parameters.
Soil TypesAverage Diameter (mm)PorosityViscous Resistance CoefficientInertial Resistance Coefficient
sandy soil0.50.252.14 × 10103.34 × 105
loam0.050.432.43 × 10115.01 × 105
clay0.010.32.71 × 10139.06 × 106
Table 3. Specific working condition setting table.
NumberPipeline Pressure (MPa)Leakage Hole Diameter (mm)Leakage Hole OrientationSoil Types
10.220Upwardloam
20.420Upwardloam
30.620Upwardloam
40.410Upwardloam
50.430Upwardloam
60.420Upwardclay
70.420Upwardsandy soil
Table 4. Experimental operating conditions setup.
NumberLeak Pressure (MPa)Leakage TimeLeakage Aperture
10.13 min3 mm
20.153 min3 mm
30.23 min3 mm
Disclaimer/Publisher’s Note: The statements, opinions and data contained in all publications are solely those of the individual author(s) and contributor(s) and not of MDPI and/or the editor(s). MDPI and/or the editor(s) disclaim responsibility for any injury to people or property resulting from any ideas, methods, instructions or products referred to in the content.