Integrating Entropy Weight TOPSIS and BIM-Based Evacuation Simulation for Safety Assessment of High-Occupancy Buildings
Abstract
1. Introduction
2. Related Work
2.1. Evacuation Planning and Design in High-Occupancy Buildings
2.2. Simulation and Modeling Approaches in Evacuation Research
2.3. Safety and Risk Management Evaluation Method
2.4. Integration of BIM and Microscopic Simulation in Evacuation Research
3. Materials and Methods
3.1. Indicator System
3.2. Determination of Indicator Values
- (1)
- Building area (A1), unit: m2. The total floor area of the high-occupancy building, reflecting its overall scale. This can be obtained from architectural drawings or verified on-site.
- (2)
- Number of floors (A2). Represents the total number of floors in the building, as greater height generally increases the complexity of vertical evacuation. This can be confirmed through design documents or field inspection.
- (3)
- Occupant capacity (A3). The maximum number of people the building can accommodate, serving as a key reference for evacuation demand. Determined from architectural design documents.
- (4)
- Average width of evacuation routes (B1), unit: m. Measure the widths of all evacuation routes (corridors, stairways, etc.) and calculate the average.
- (5)
- Total area of evacuation routes (B2), unit: m2. The sum of the floor areas of all evacuation passages, including corridors, stairways, and other designated routes.
- (6)
- Number of exits (B3), unit: exits per 1000 occupants. Based on the building design, calculate the number of exits provided per 1000 occupants. Building codes generally require at least two exits per floor and per 1000 occupants. The result should meet or exceed local code requirements.
- (7)
- Vertical evacuation capacity (B4), unit: persons/min. The evacuation throughput of vertical routes (elevators, stairways). Calculated based on the number and size of elevators/stairs and the number of people they can evacuate per minute.
- (8)
- Proportion of unobstructed evacuation routes (B5), unit: %. Inspect all evacuation passages for obstructions (e.g., medical devices, furniture) and calculate the proportion of unobstructed routes.
- (9)
- Average evacuation distance from key areas (B6), unit: m. Measure the distances from key areas (e.g., high-density spaces or areas with mobility-impaired occupants) to the nearest exits and compute the average.
- (10)
- Completeness of emergency lighting (C1), unit: %. Check all emergency lighting fixtures and calculate the proportion functioning properly.
- (11)
- Duration of emergency lighting (C2), unit: hours. Measure how long the emergency lighting system can operate during a power outage.
- (12)
- Proportion of functioning evacuation signs (C3), unit: %. Inspect evacuation signage and calculate the percentage that is clearly visible and functional under emergency conditions.
- (13)
- Number and distribution of fire extinguishers (C4), unit: units/1000 m2. Record the number and distribution of extinguishers within the building, which should meet design standards relative to floor area.
- (14)
- Number of fire hydrants (C5). Count the hydrants on each floor, ensuring that each hydrant provides adequate water pressure for firefighting.
- (15)
- Coverage of sprinkler system (C6), unit: m2. Assess the coverage area of the sprinkler system, ensuring all high-risk areas are included.
- (16)
- Availability of emergency medical equipment (C7), unit: %. Check the availability of medical equipment (e.g., stretchers, oxygen tanks) and calculate the percentage available relative to requirements.
- (17)
- Annual expenditure on equipment maintenance (C8), unit: CNY. The yearly cost for repairing and replacing safety equipment, including fire protection systems, emergency evacuation tools, and personal protective equipment.
- (18)
- Occupant density (D1), unit: persons/m2. Measure occupant density across different building areas, especially in crowded spaces such as waiting rooms or diagnostic areas. Multiple measurements at different times can be averaged.
- (19)
- Security staff allocation (D2), unit: persons/100 staff. The number of security personnel per 100 building staff.
- (20)
- Qualification rate of security staff training (D3), unit: %. Review security staff training records to determine the proportion who have passed emergency management and evacuation training.
- (21)
- Qualification rate of general staff training (D4), unit: %. Review general staff evacuation training records to determine the proportion who passed.
- (22)
- Frequency of evacuation drills (D5), unit: drills per year. Determined by the number of evacuation exercises conducted annually.
- (23)
- Expenditure on staff training (D6), unit: CNY. Annual investment in staff training, especially for safety and emergency personnel, including courses, certifications, and exercises.
- (24)
- Evacuation time (E1), unit: min. Obtained through BIM-based microscopic evacuation simulation. High-fidelity simulation data objectively reflect evacuation performance, avoiding subjective bias and ensuring close linkage to building physical characteristics.
- (25)
- Emergency response time (E2), unit: min. The time between the onset of an emergency and the initiation of emergency response procedures.
- (26)
- Recovery time after evacuation (E3), unit: hours. The time required for the building to resume normal operations after evacuation is completed.
- (27)
- Number of incidents (E4), unit: events/year. Count the number of incidents threatening occupant safety (e.g., fires, accidents) that occurred in the previous year.
- (28)
- Effectiveness of emergency communication system (F1), unit: %. Evaluate the coverage of the emergency communication system (e.g., speakers, alarms, digital displays) as a proportion of total building area.
- (29)
- Coverage of intelligent surveillance system (F2), unit: %. Assess the coverage of surveillance systems (e.g., video monitoring, tracking) across key areas such as entrances, evacuation routes, waiting zones, and corridors.
- (30)
- Proportion of real-time personnel tracking (F3), unit: %. The proportion of priority populations (e.g., vulnerable groups) tracked using real-time positioning technologies.
- (31)
- Frequency of evacuation simulation use (F4), unit: times/year. The frequency with which evacuation simulation systems are applied to evaluate and optimize evacuation plans.
- (32)
- Degree of emergency system integration (F5), unit: %. The percentage of integration between the emergency communication system and other critical systems (e.g., fire alarms, building automation, information systems, access control, staff notification systems).
3.3. Calculation Process
3.4. Evacuation Simulation Validation Based on BIM and Pathfinder
4. Results
4.1. Case Description and Input Indicators
4.2. Evaluation and Analysis of Safety Evacuation Model Based on Static Indicators
4.3. BIM-Pathfinder-Based Evacuation Simulation
4.4. Comprehensive Evaluation and Adjustment Integrating Dynamic Simulation Data
5. Discussion
6. Conclusions
Author Contributions
Funding
Data Availability Statement
Conflicts of Interest
Abbreviations
| MCDM | Multi-Criteria Decision-Making |
| AHP | Analytic Hierarchy Process |
| DEA | Data Envelopment Analysis |
| TOPSIS | Technique for Order Preference by Similarity to Ideal Solution |
| BIM | Building Information Modeling |
| IFC | Industry Foundation Classes |
| FDS | Fire Dynamics Simulator |
References
- Wang, L.; Xiang, Z.; Chen, Y.; Li, D.; Wang, J. Simulation and Optimization of Emergency Evacuation of Huoshenshan Hospital Based on Bim and Pathfinder. In SHS Web of Conferences, 2022; EDP Sciences: Les Ulis, France, 2022; p. 01004. [Google Scholar]
- Azari, P.; Li, S.; Shaker, A.; Sattar, S. Georeferencing building information models for BIM/GIS integration: A review of methods and tools. ISPRS Int. J. Geo-Inf. 2025, 14, 180. [Google Scholar] [CrossRef]
- Snohová, A.; Kučera, P. Comparative study of sfpe and steering modes in pathfinder to optimise evacuation routes. Buildings 2024, 14, 2361. [Google Scholar] [CrossRef]
- Dong, L.; Wu, J.; Wang, W.; Hu, W. A pathfinder-based safe evacuation model for ultradeep underground public space. Saf. Secur. Eng 2020, 10, 475–482. [Google Scholar] [CrossRef]
- Yang, L.; Zhou, B.; Wu, T. Performance-based evacuation optimization for teaching building with heterogeneous populations: Simulation and numerical studies. Fire 2023, 6, 273. [Google Scholar] [CrossRef]
- Zheng, H.; Zhang, S.; Zhu, J.; Zhu, Z.; Fang, X. Evacuation in buildings based on bim: Taking a fire in a university library as an example. Int. J. Environ. Res. Public Health 2022, 19, 16254. [Google Scholar] [CrossRef]
- Kim, H.-J.; Lee, S.-H.; Hong, W.-H. Sensitivity analysis on the staircase evacuation time for occupant input attributes of evacuation simulation tools-focused on simulex, buildingexodus, pathfinder. J. Archit. Inst. Korea Plan. Des. 2013, 29, 319–326. [Google Scholar]
- Lyu, Y.; Wang, H. Fire evacuation for people with functional disabilities in high-rise buildings: A scoping review. Buildings 2025, 15, 634. [Google Scholar] [CrossRef]
- Chen, N.; Liu, W.; Bai, R.; Chen, A. Application of computational intelligence technologies in emergency management: A literature review. Artif. Intell. Rev. 2019, 52, 2131–2168. [Google Scholar] [CrossRef]
- Albahri, A.; Khaleel, Y.L.; Habeeb, M.A.; Ismael, R.D.; Hameed, Q.A.; Deveci, M.; Homod, R.Z.; Albahri, O.; Alamoodi, A.; Alzubaidi, L. A systematic review of trustworthy artificial intelligence applications in natural disasters. Comput. Electr. Eng. 2024, 118, 109409. [Google Scholar] [CrossRef]
- Damaševičius, R.; Bacanin, N.; Misra, S. From sensors to safety: Internet of emergency services (ioes) for emergency response and disaster management. J. Sens. Actuator Netw. 2023, 12, 41. [Google Scholar] [CrossRef]
- Lotfi, N.; Behnam, B.; Peyman, F. A bim-based framework for evacuation assessment of high-rise buildings under post-earthquake fires. J. Build. Eng. 2021, 43, 102559. [Google Scholar] [CrossRef]
- Akter, J.; Sultana, S.; Hossain, M.M.; Datta, S.D.; Tutul, M.T.E. A BIM-based simulation and evacuation assessment to improve fire safety management. J. Build. Pathol. Rehabil. 2026, 11, 44. [Google Scholar] [CrossRef]
- Kim, S.; Ma, J.; Lee, J.; Hong, T.; An, J.; Jeong, K. Framework of BIM-based quantitative evaluation for enhancing fire safety performance of buildings. J. Manag. Eng. 2024, 40, 04023061. [Google Scholar] [CrossRef]
- Akizuki, Y. Evacuation route design based on visibility for reducing evacuation delays. Fire Saf. J. 2024, 144, 104099. [Google Scholar] [CrossRef]
- Wang, D.; Liang, S.; Chen, B.; Wu, C. Investigation on the impacts of natural lighting on occupants’ wayfinding behavior during emergency evacuation in underground space. Energy Build. 2022, 255, 111613. [Google Scholar] [CrossRef]
- Wang, J.; Li, J.; Li, J.; Feng, J.; Xu, S.; Liu, J.; Wang, Y. Performance optimization of the obstacle to corner bottleneck under emergency evacuation. J. Build. Eng. 2022, 45, 103658. [Google Scholar] [CrossRef]
- Lin, C.S.; Wu, M.E. A study of evaluating an evacuation time. Adv. Mech. Eng. 2018, 10, 1687814018772424. [Google Scholar] [CrossRef]
- Zhou, J.; Jia, X.; Jia, J. Effects of Different Staircase Design Factors on Evacuation of Children from Kindergarten Buildings Analyzed via Agent-Based Simulation. Healthcare 2020, 8, 56. [Google Scholar] [CrossRef]
- Cimellaro, G.P.; Ozzello, F.; Vallero, A.; Mahin, S.; Shao, B. Simulating earthquake evacuation using human behavior models. Earthq. Eng. Struct. Dyn. 2017, 46, 985–1002. [Google Scholar] [CrossRef]
- Mazzetto, S. Interdisciplinary perspectives on agent-based modeling in the architecture, engineering, and construction industry: A comprehensive review. Buildings 2024, 14, 3480. [Google Scholar] [CrossRef]
- Huang, B.; Wang, J.; Yuan, C. Fire resilience evaluation of a historic university building in china. Appl. Sci. 2025, 15, 9131. [Google Scholar] [CrossRef]
- Rahmani, A.; Salem, M. Simulation of fire in super high-rise hospitals using fire dynamics simulator (fds). Electron. J. Gen. Med. 2020, 17, 5. [Google Scholar] [CrossRef] [PubMed]
- Chanthakhot, W.; Ransikarbum, K. Integrated IEW-TOPSIS and fire dynamics simulation for agent-based evacuation modeling in industrial safety. Safety 2021, 7, 47. [Google Scholar] [CrossRef]
- Lam, C.; Cruz, A. Topological network and fuzzy ahp modeling framework for the suitability analysis of evacuation shelters: A case study in japan. Int. J. Disaster Risk Reduct. 2024, 111, 104696. [Google Scholar] [CrossRef]
- Chandrawati, T.B.; Ratna, A.A.P.; Sari, R.F. Priority search simulation for flood evacuation routes using fuzzy ahp approach. J. Appl. Eng. Sci. 2022, 20, 19–28. [Google Scholar] [CrossRef]
- Herrera-Restrepo, O.; Triantis, K.; Trainor, J.; Murray-Tuite, P.; Edara, P. A multi-perspective dynamic network performance efficiency measurement of an evacuation: A dynamic network-dea approach. Omega 2016, 60, 45–59. [Google Scholar] [CrossRef]
- Zhang, J.; Huang, D.; You, Q.; Kang, J.; Shi, M.; Lang, X. Evaluation of emergency evacuation capacity of urban metro stations based on combined weights and topsis-gra method in intuitive fuzzy environment. Int. J. Disaster Risk Reduct. 2023, 95, 103864. [Google Scholar] [CrossRef]
- Soltaninejad, M.; Noorzai, E.; Faraji, A. Enhancing the level of confidence in the safe fire evacuation operation employing a combination of BIM and fuzzy topsis method. Smart Sustain. Built Environ. 2025, 14, 163–189. [Google Scholar] [CrossRef]
- Qi, X.-W.; Zhang, J.-L.; Zhao, S.-P.; Liang, C.-Y. Tackling complex emergency response solutions evaluation problems in sustainable development by fuzzy group decision making approaches with considering decision hesitancy and prioritization among assessing criteria. Int. J. Environ. Res. Public Health 2017, 14, 1165. [Google Scholar] [CrossRef]
- Gao, Y.; Xiong, G.; Hu, Z.; Chai, C.; Li, H. Bridge digital twin for practical bridge operation and maintenance by integrating gis and bim. Buildings 2024, 14, 3731. [Google Scholar] [CrossRef]
- Cao, Y.; Xu, C.; Aziz, N.M.; Kamaruzzaman, S.N. BIM–GIS integrated utilization in urban disaster management: The contributions, challenges, and future directions. Remote Sens. 2023, 15, 1331. [Google Scholar] [CrossRef]
- Lv, W.; Deng, F.; Wang, J.; Han, Y.; Yang, S. Large-scale real-time evacuation modeling during urban floods: A coupled agent-based multi-model framework. Simul. Model. Pract. Theory 2025, 140, 103075. [Google Scholar] [CrossRef]
- Rüppel, U.; Schatz, K. Designing a BIM-based serious game for fire safety evacuation simulations. Adv. Eng. Inform. 2011, 25, 600–611. [Google Scholar] [CrossRef]
- Choi, J.; Choi, J.; Kim, I. Development of BIM-based evacuation regulation checking system for high-rise and complex buildings. Autom. Constr. 2014, 46, 38–49. [Google Scholar] [CrossRef]
- Gao, S.; Chang, C.; Liu, Q.; Zhang, M.; Yu, F. Study on the optimization for emergency evacuation scheme under fire in university building complex. Heliyon 2023, 9, e14277. [Google Scholar] [CrossRef] [PubMed]
- Han, F.; Liu, L.; Zhang, Y. Pathfinder-Based Simulation and Optimisation of Personnel Evacuation Modelling of a Shopping Mall. J. Phys. Conf. Ser. 2021, 1757, 012112. [Google Scholar] [CrossRef]
- Liu, Z.; Gu, X.; Hong, R. Fire protection and evacuation analysis in underground interchange tunnels by integrating BIM and numerical simulation. Fire 2023, 3, 139. [Google Scholar] [CrossRef]
- Wang, J.; Luo, Y.; Zhou, X.; Zhao, W.; Lei, Y.; Xie, W. Impact of assistance behavior on evacuation efficiency in high-rise hospital inpatient buildings: An agent-based simulation study. J. Build. Eng. 2025, 113780. [Google Scholar] [CrossRef]
- Rauscher, J. Evacuation strategy planning special requirements for hospital departments. In Proceedings of the Fire and Evacuation Modeling Technical Conference (FEMTC) 2020, Virtual, 9–11 September 2020. [Google Scholar]
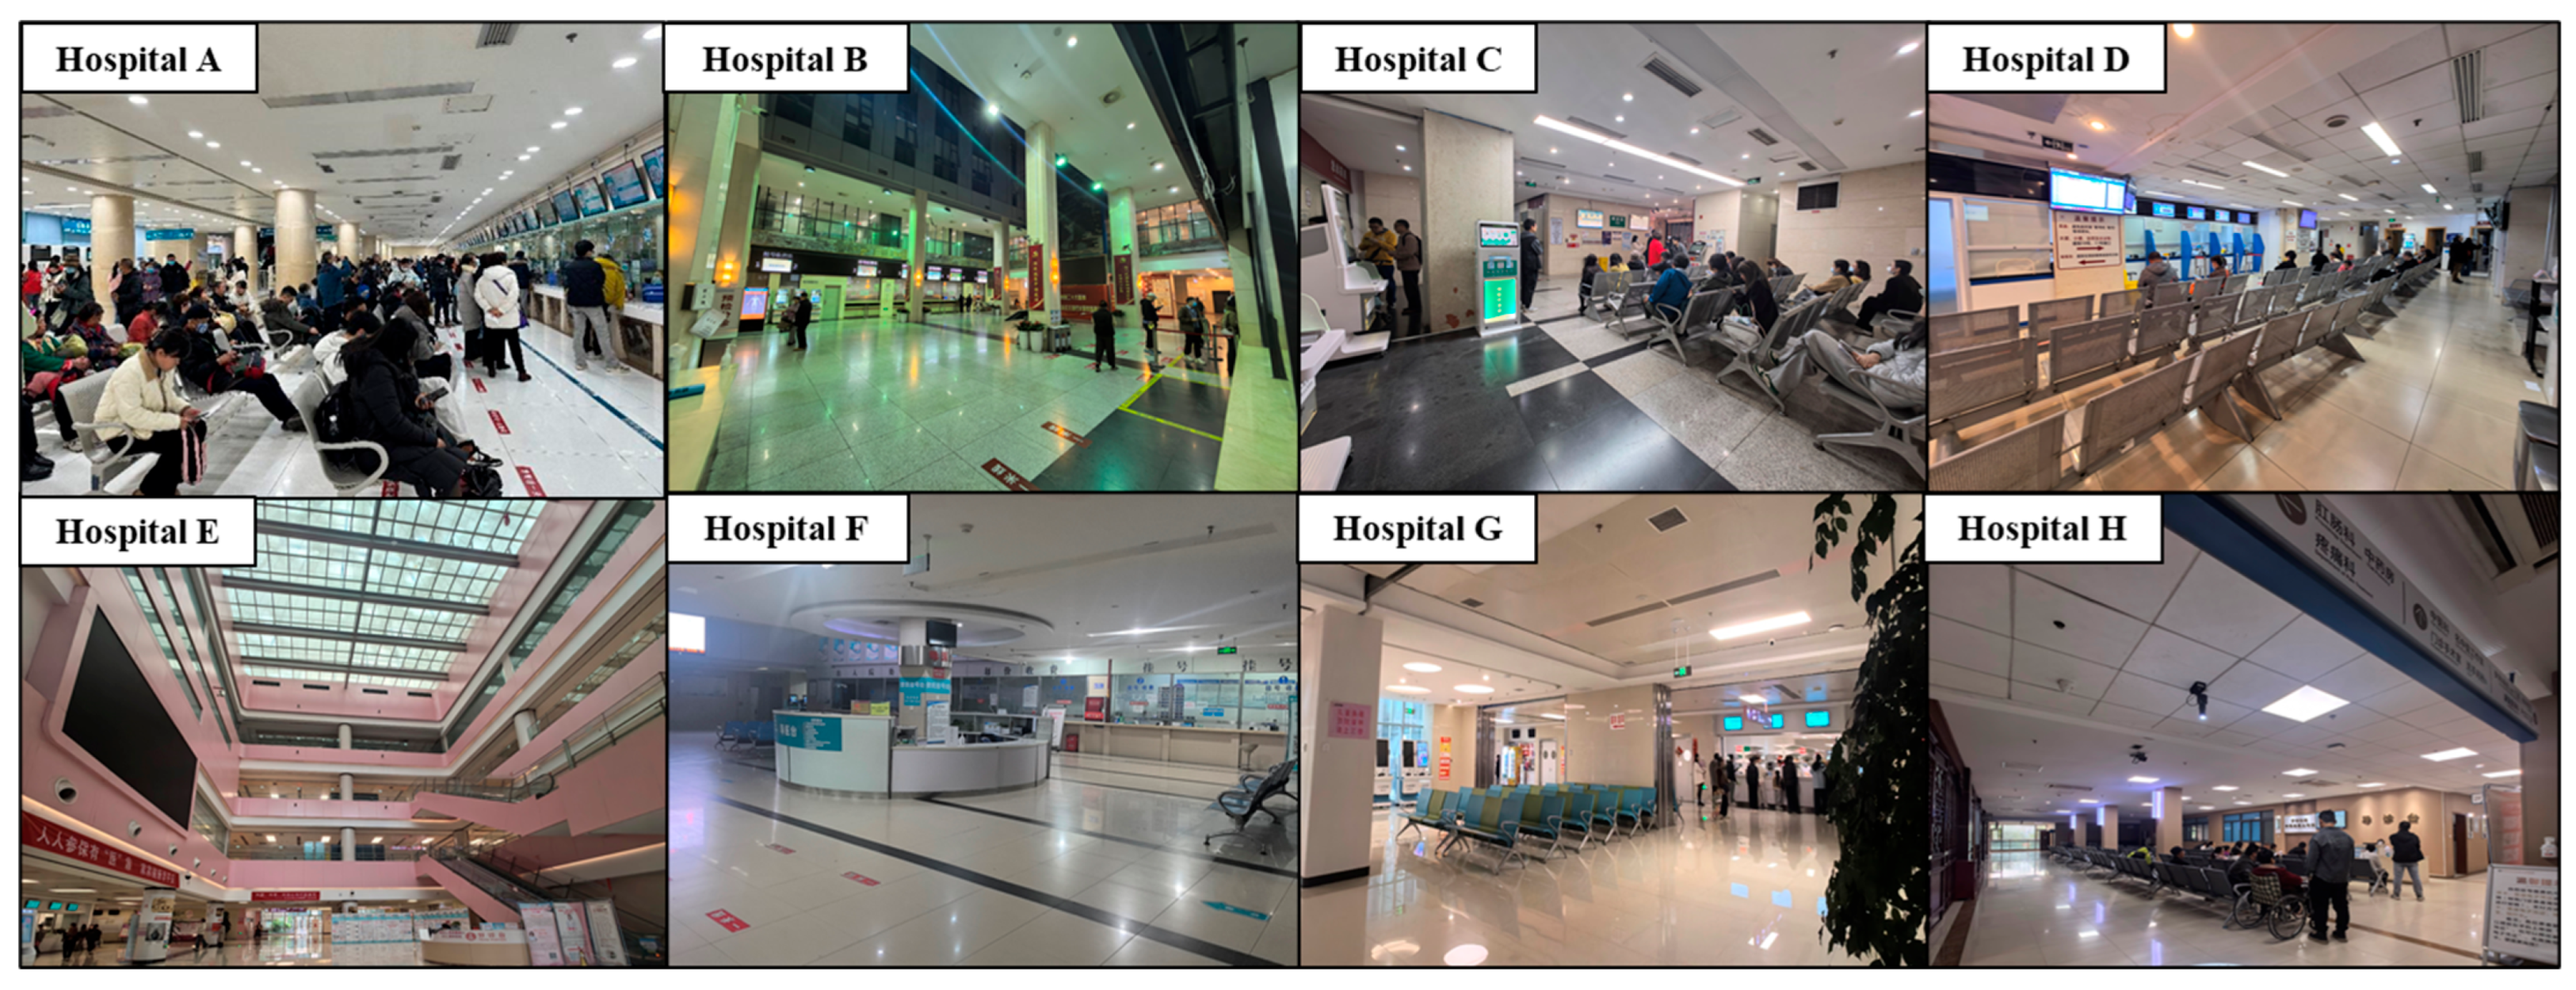


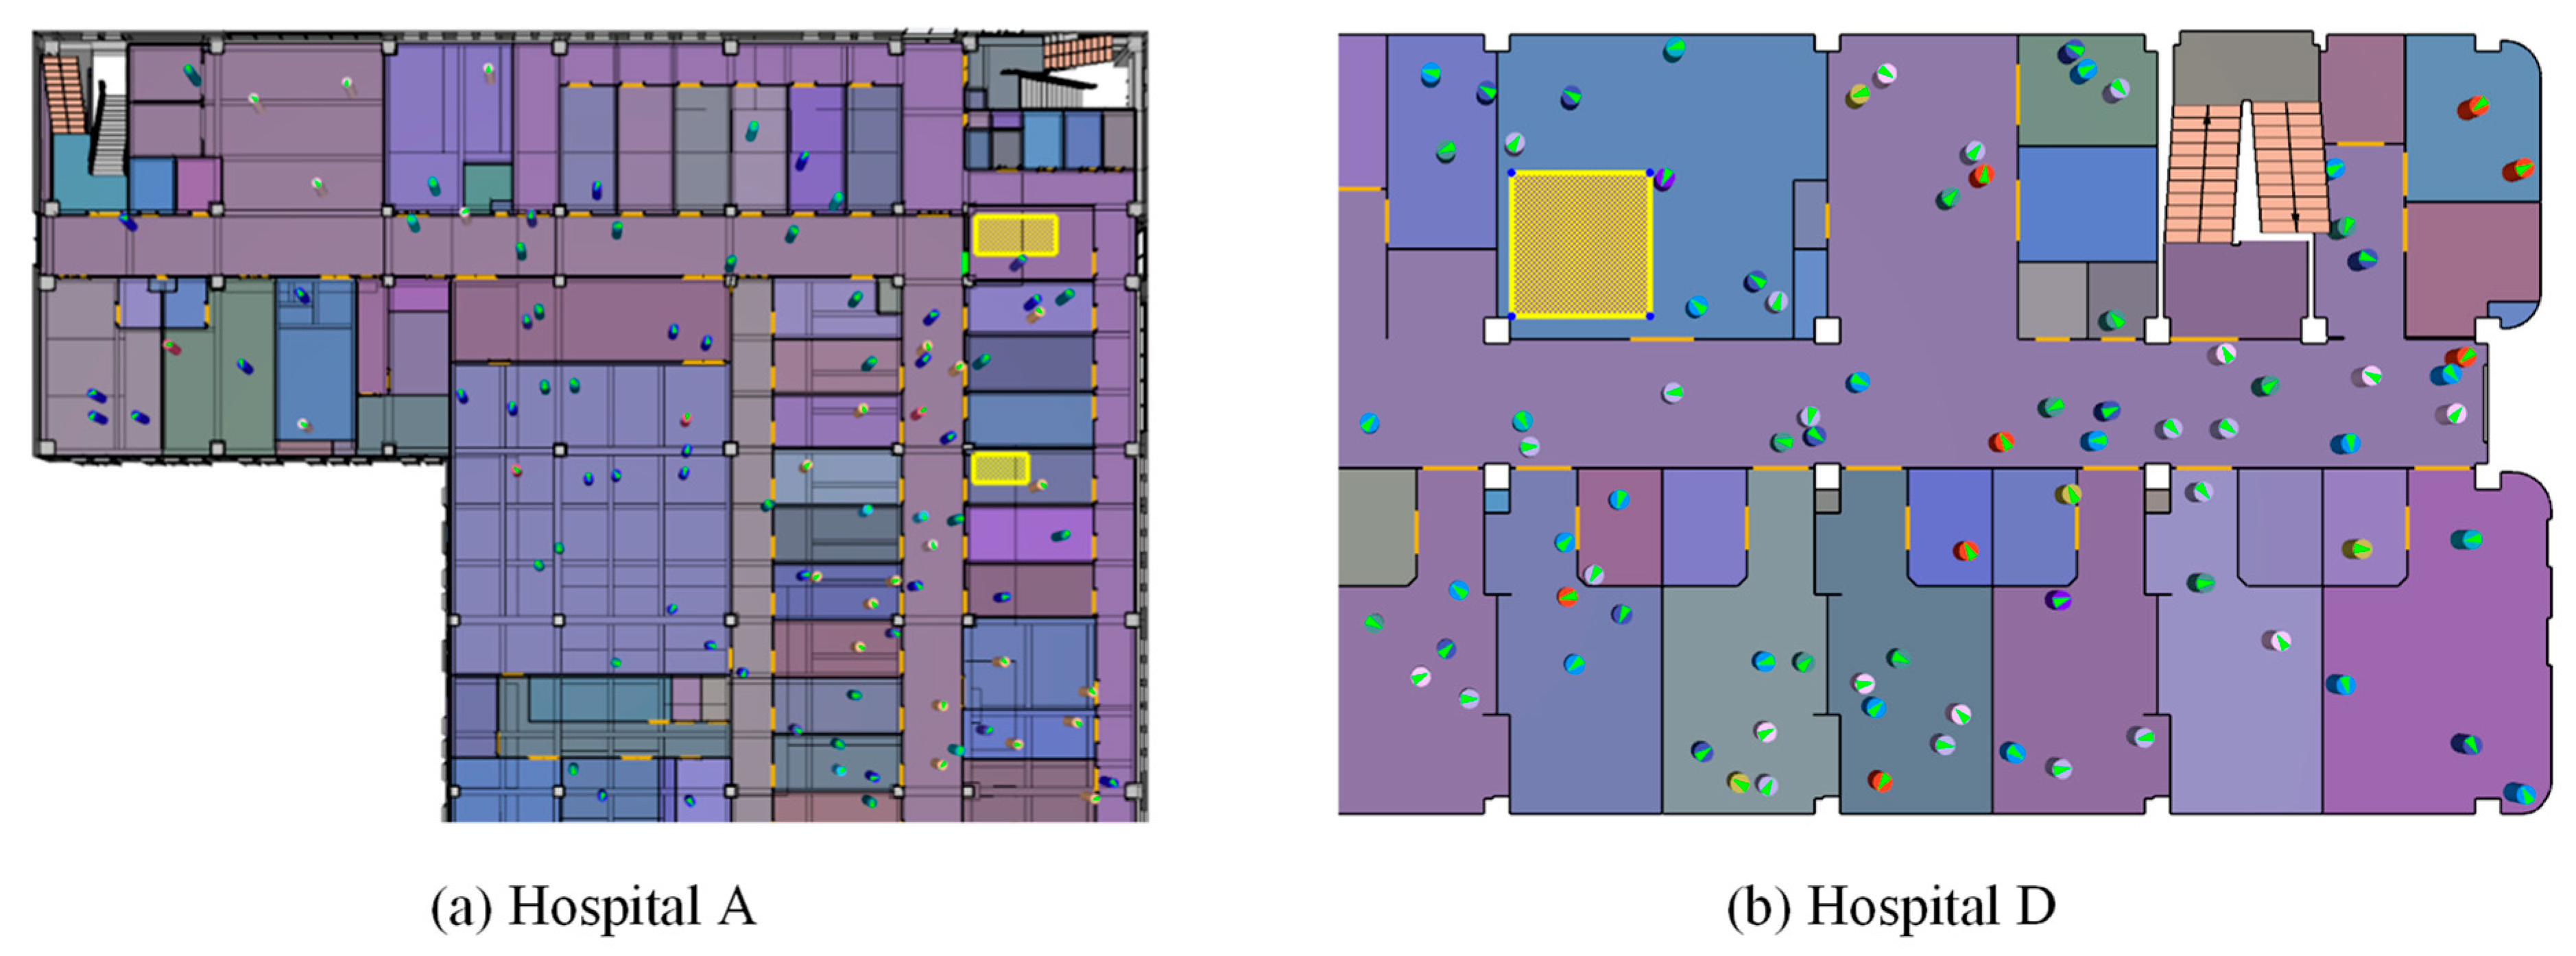
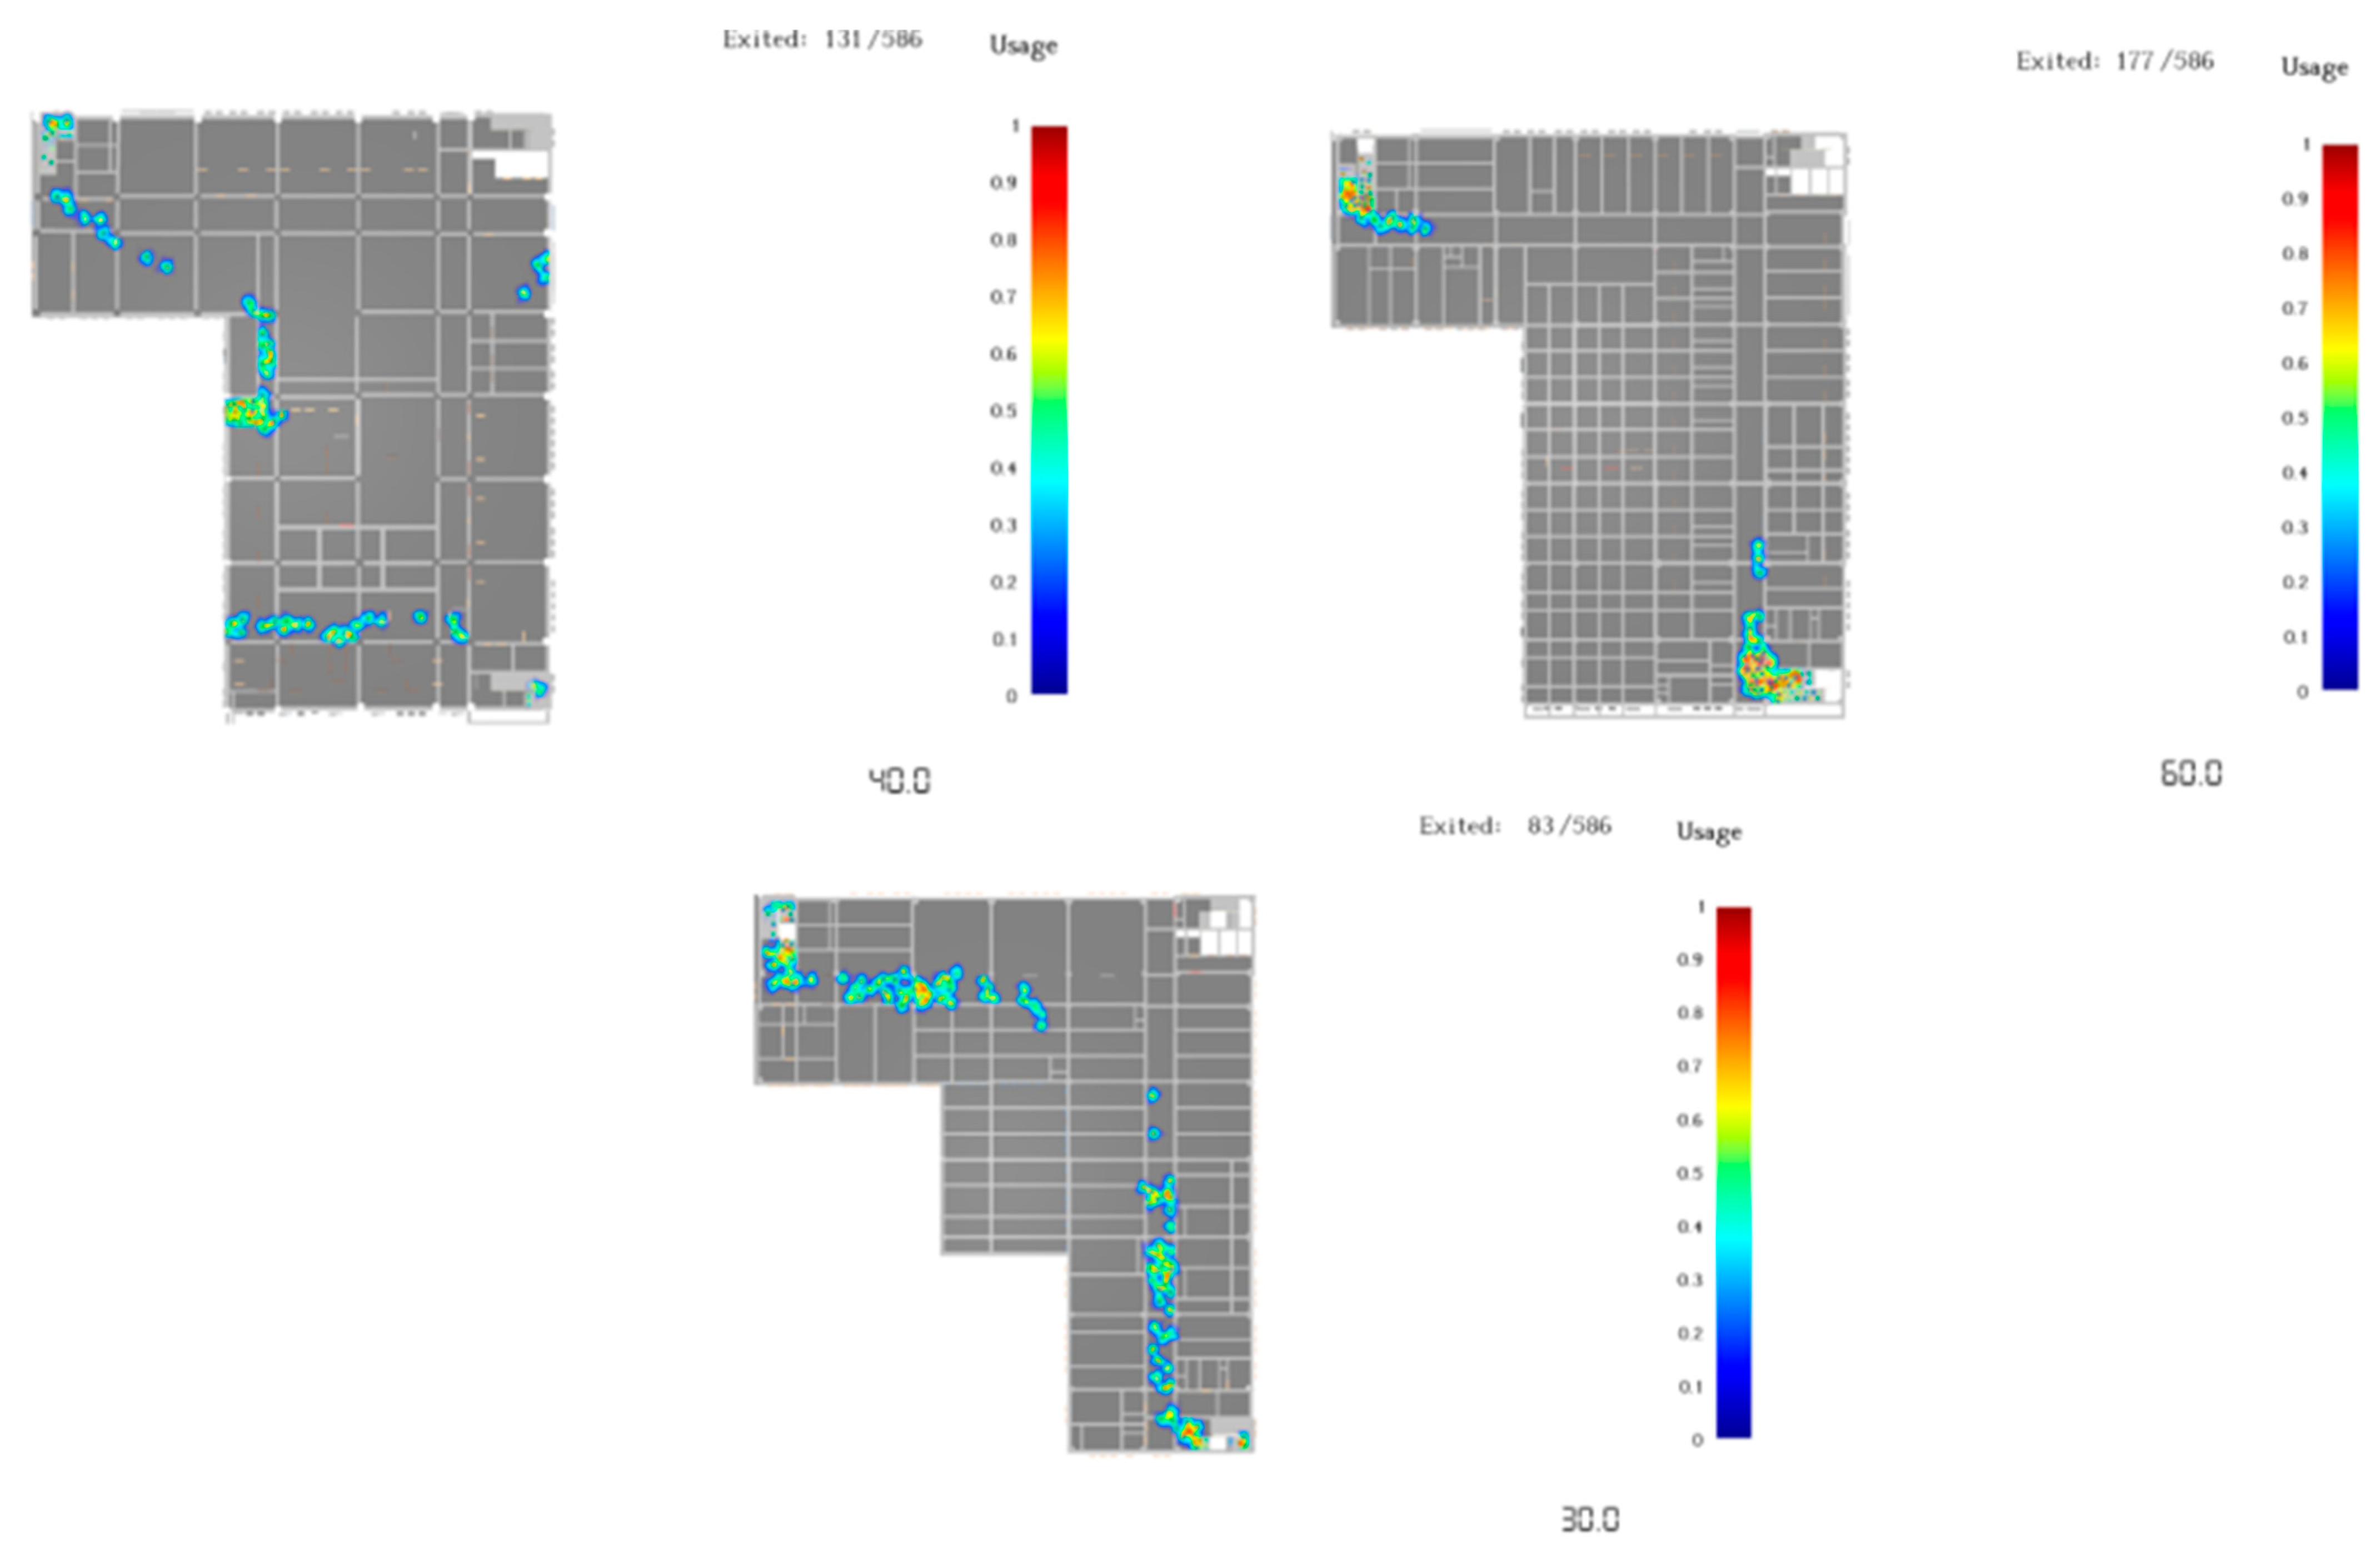
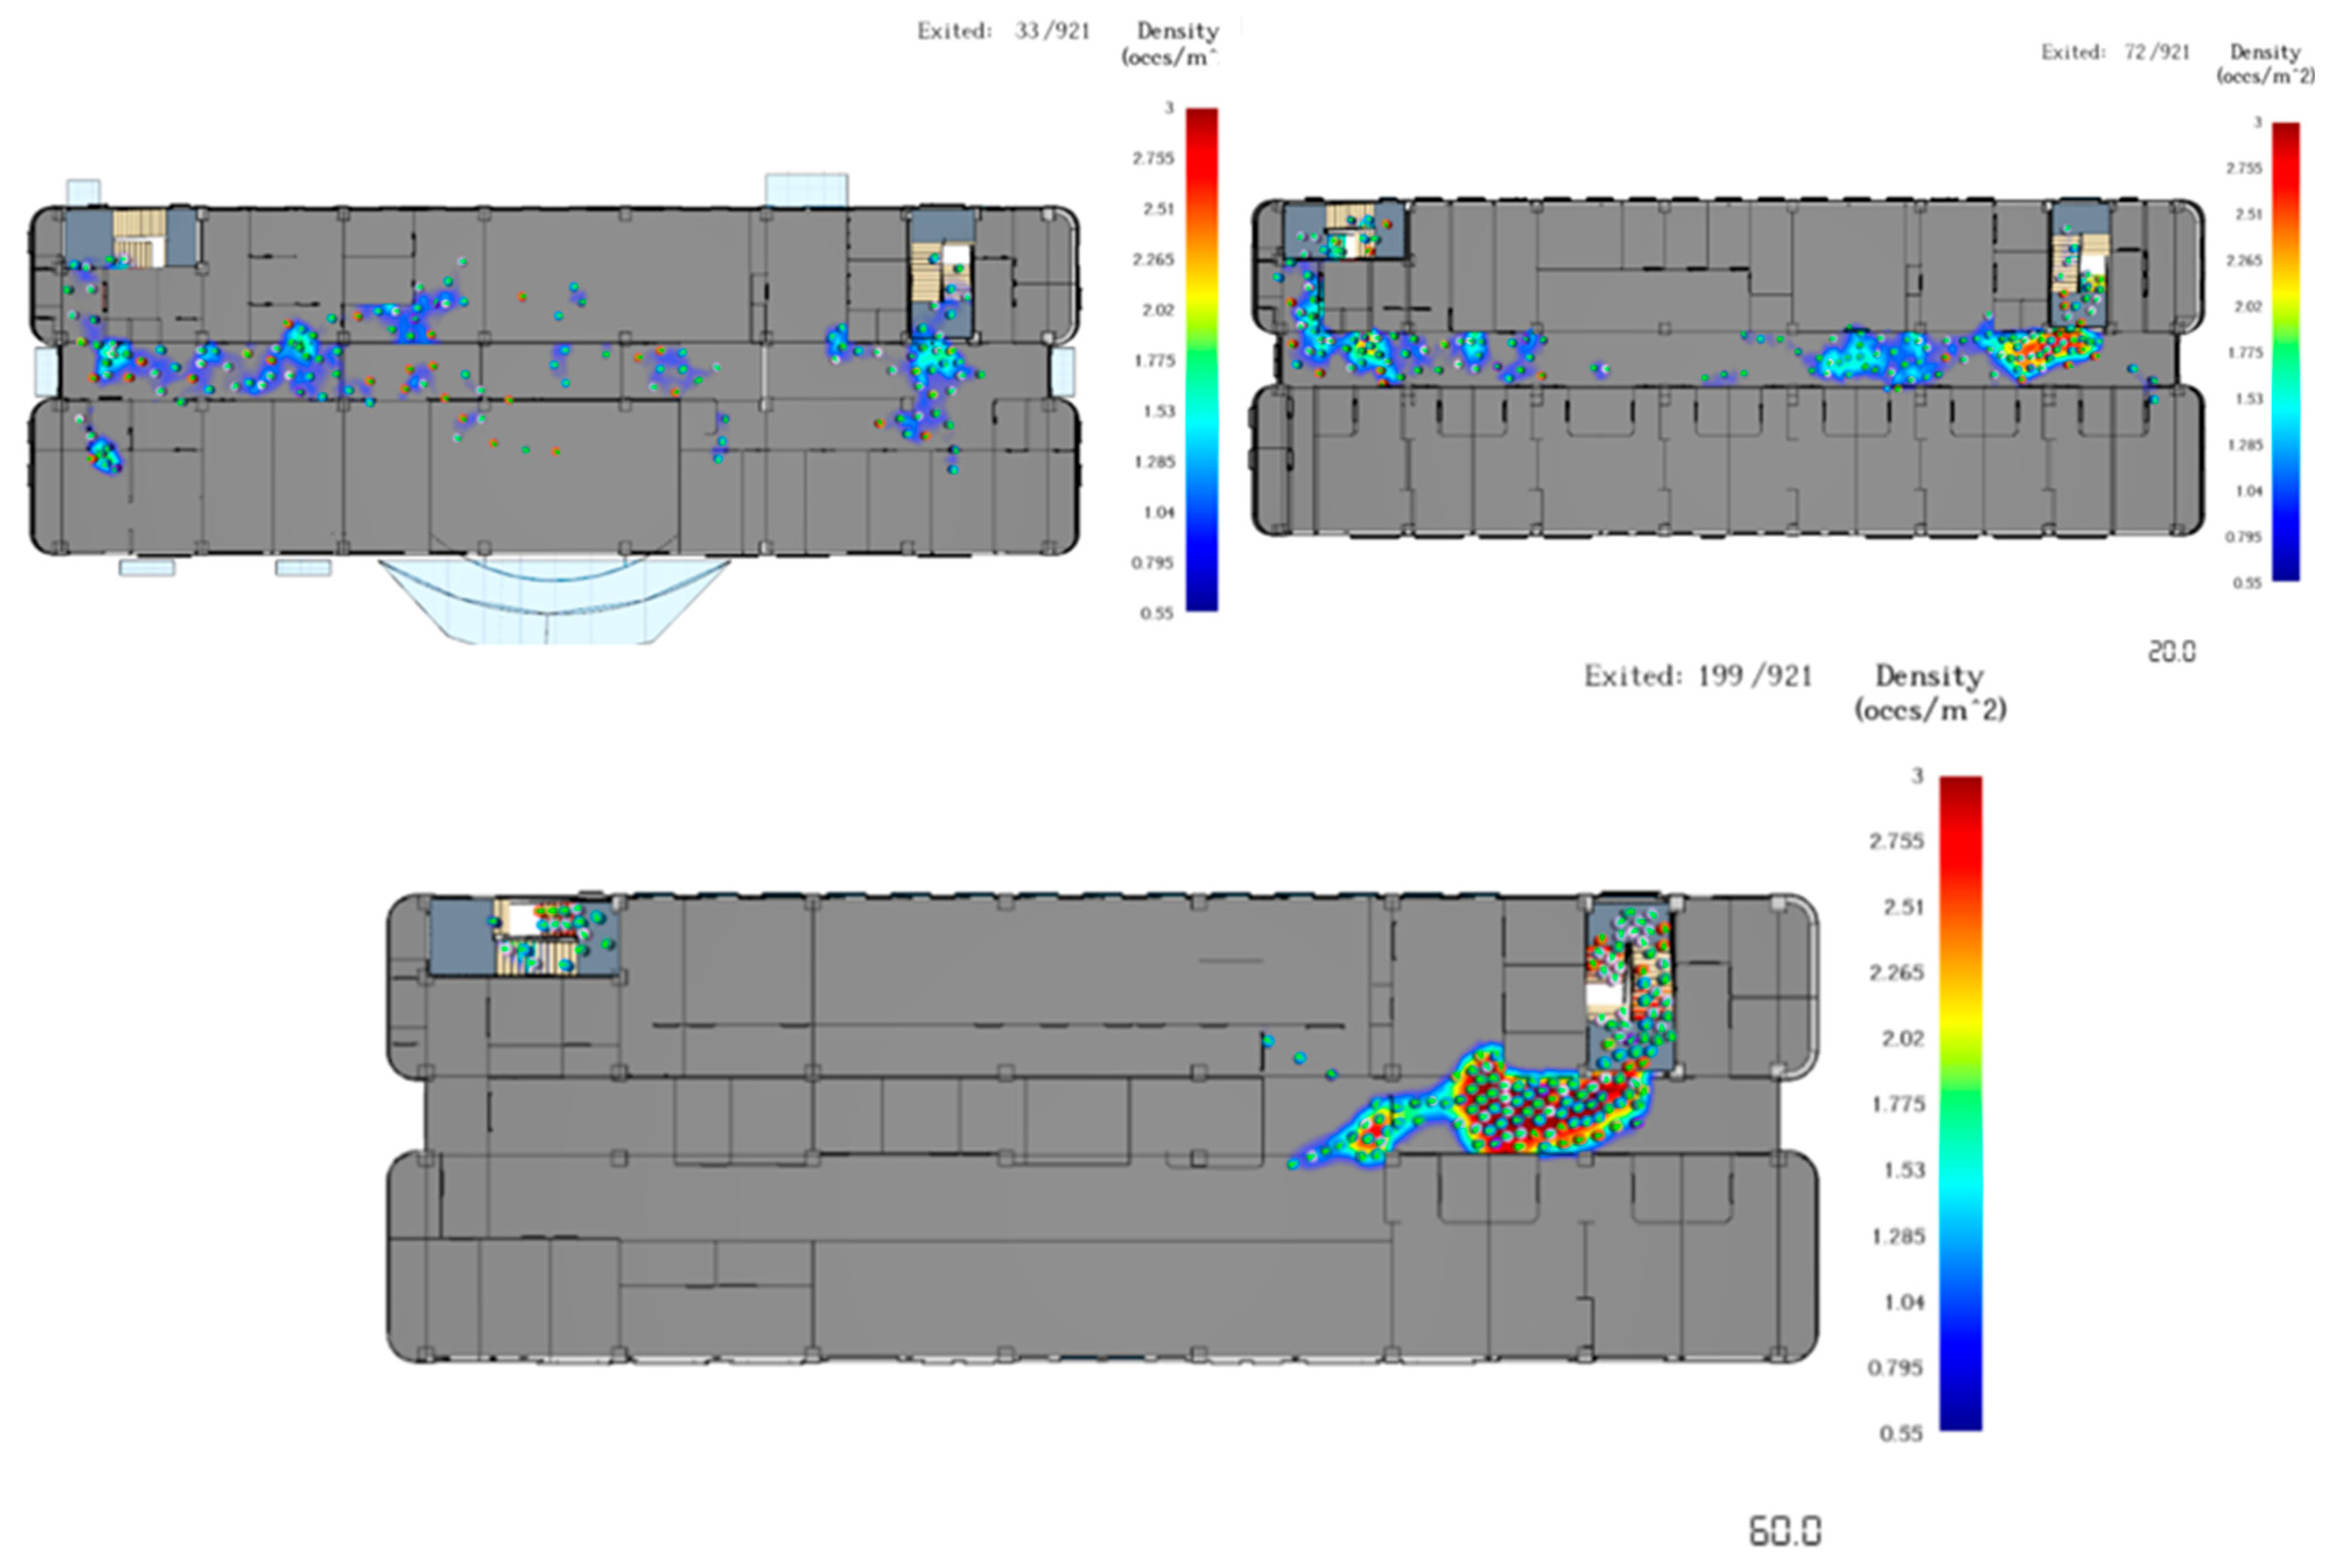
| Level 1 | Level 2 | Level 3 |
|---|---|---|
| Effectiveness of Safety Evacuation Management Models for High-Occupancy Buildings | Building Scale (A) | Building area (A1) |
| Number of floors (A2) | ||
| Occupant capacity (A3) | ||
| Design and Layout (B) | Average width of evacuation routes (B1) | |
| Total area of evacuation routes (B2) | ||
| Number and distribution of exits (B3) | ||
| Vertical evacuation capacity (B4) | ||
| Proportion of unobstructed evacuation routes (B5) | ||
| Average evacuation distance from key areas (B6) | ||
| Emergency Facilities (C) | Completeness of emergency lighting (C1) | |
| Duration of emergency lighting (C2) | ||
| Proportion of functioning evacuation signs (C3) | ||
| Number and distribution of extinguishers (C4) | ||
| Number of fire hydrants (C5) | ||
| Coverage of sprinkler system (C6) | ||
| Availability of emergency medical equipment (C7) | ||
| Annual expenditure on equipment maintenance (C8) | ||
| Personnel and Emergency Management (D) | Occupant density (D1) | |
| Security staff allocation (D2) | ||
| Qualification rate of security staff training (D3) | ||
| Qualification rate of general staff training (D4) | ||
| Frequency of evacuation drills (D5) | ||
| Expenditure on staff training (D6) | ||
| Evacuation Efficiency and Safety (E) | Evacuation time (E1) | |
| Emergency response time (E2) | ||
| Recovery time after evacuation (E3) | ||
| Number of incidents per year (E4) | ||
| Information Management and Technical Support (F) | Effectiveness of emergency communication system (F1) | |
| Coverage of intelligent surveillance system (F2) | ||
| Proportion of real-time personnel tracking (F3) | ||
| Frequency of evacuation simulation use (F4) | ||
| Degree of integration of emergency systems (F5) |
| No. | Indicator | A | B | C | D | E | F | G | H |
|---|---|---|---|---|---|---|---|---|---|
| 1 | Building Area (A1) | 5000 | 8000 | 6000 | 4000 | 7000 | 3000 | 9000 | 10,000 |
| 2 | Number of Floors (A2) | 5 | 8 | 6 | 4 | 7 | 3 | 9 | 10 |
| 3 | Waiting Area Capacity (A3) | 300 | 500 | 350 | 250 | 450 | 200 | 600 | 700 |
| 4 | Average Width of Evacuation Routes (B1) | 2 | 2.5 | 2.2 | 1.8 | 2.4 | 1.5 | 2.7 | 3 |
| 5 | Total Area of Evacuation Routes (B2) | 600 | 900 | 750 | 550 | 850 | 450 | 1000 | 1100 |
| 6 | Number of Exits (B3) | 2.0 | 2.5 | 2.2 | 1.8 | 2.4 | 1.5 | 2.7 | 3.0 |
| 7 | Vertical Evacuation Capacity (B4) | 100 | 120 | 110 | 90 | 115 | 80 | 130 | 140 |
| 8 | Evacuation Route Clearance Ratio (B5) | 90% | 95% | 92% | 85% | 94% | 80% | 96% | 98% |
| 9 | Average Evacuation Distance in Key Areas (B6) | 20 | 15 | 18 | 22 | 17 | 25 | 14 | 12 |
| 10 | Completeness of Emergency Lighting (C1) | 95% | 98% | 96% | 90% | 97% | 88% | 99% | 100% |
| 11 | Duration of Emergency Lighting (C2) | 3 | 4 | 3.5 | 2.5 | 3.8 | 2 | 4.5 | 5 |
| 12 | Proportion of Functional Evacuation Signage (C3) | 90% | 95% | 92% | 88% | 93% | 85% | 97% | 99% |
| 13 | Number and Distribution of Fire Extinguishers (C4) | 10 | 12 | 11 | 9 | 12 | 8 | 13 | 14 |
| 14 | Number of Fire Hydrants (C5) | 3 | 3.5 | 3.2 | 2.8 | 3.3 | 2.5 | 3.7 | 4 |
| 15 | Coverage of Sprinkler Fire Suppression Systems (C6) | 600 | 850 | 700 | 500 | 780 | 400 | 400 | 900 |
| 16 | Availability Percentage of First-Aid Equipment (C7) | 85% | 90% | 87% | 80% | 88% | 75% | 92% | 95% |
| 17 | Annual Maintenance Expenditure for Equipment (C8) | 10,000 | 15,000 | 12,000 | 9000 | 13,000 | 8500 | 16,000 | 18,000 |
| 18 | Personnel Density (D1) | 1.5 | 2 | 1.8 | 1.2 | 1.9 | 1 | 2.2 | 2.5 |
| 19 | Security Staff Deployment (D2) | 3 | 4 | 4 | 3 | 4 | 2 | 4 | 5 |
| 20 | Pass Rate of Security Personnel Training (D3) | 85% | 90% | 88% | 80% | 89% | 78% | 92% | 95% |
| 21 | Personnel Training Pass Rate (D4) | 90% | 92% | 91% | 85% | 91% | 83% | 94% | 96% |
| 22 | Frequency of Evacuation Drills (D5) | 6 | 8 | 7 | 5 | 7 | 4 | 9 | 10 |
| 23 | Expenditure on Personnel Training (D6) | 800 | 750 | 780 | 820 | 770 | 840 | 720 | 700 |
| 24 | Emergency Response Time (E2) | 5 | 6 | 5.5 | 6.5 | 5.2 | 7 | 4.8 | 4.5 |
| 25 | Post-Evacuation Recovery Time (E3) | 1 | 2 | 1.5 | 2.5 | 1.8 | 3 | 1.2 | 1 |
| 26 | Number of Incidents (E4) | 90% | 95% | 93% | 88% | 94% | 85% | 97% | 90% |
| 27 | Effectiveness of Emergency Communication Systems (F1) | 85% | 88% | 86% | 80% | 87% | 78% | 90% | 92% |
| 28 | Coverage of Intelligent Monitoring Systems (F2) | 80% | 85% | 82% | 75% | 83% | 72% | 88% | 90% |
| 29 | Real-Time Personnel Positioning Technology (F3) | 5 | 6 | 5.5 | 4 | 5.8 | 3 | 7 | 8 |
| 30 | Usage Frequency of Evacuation Simulation Systems (F4) | 80% | 85% | 82% | 75% | 83% | 70% | 88% | 90% |
| 31 | Integration Level of Emergency Systems (F5) | 65% | 60% | 85% | 70% | 75% | 60% | 85% | 95% |
| Building | Euclidean Distances | Relative Closeness | Ranking | |
|---|---|---|---|---|
| Euclidean Distance to Positive Ideal Solution | Euclidean Distance to Negative Ideal Solution | |||
| A | 0.12181 | 0.078 | 0.39102 | 6 |
| B | 0.07164 | 0.134 | 0.65080 | 3 |
| C | 0.09389 | 0.103 | 0.52232 | 5 |
| D | 0.15044 | 0.059 | 0.28323 | 7 |
| E | 0.08039 | 0.117 | 0.59248 | 4 |
| F | 0.18470 | 0.059 | 0.24252 | 8 |
| G | 0.07244 | 0.154 | 0.67959 | 2 |
| H | 0.06092 | 0.190 | 0.75730 | 1 |
| Personnel Type | Range (m/s) | Mean (m/s) | Standard Deviation (m/s) |
|---|---|---|---|
| Doctor | 0.70–1.10 | 0.90 | 0.14 |
| Nurse | 0.80–1.20 | 1.00 | 0.15 |
| Administrative Staff | 0.65–1.05 | 0.85 | 0.13 |
| Support Staff | 0.85–1.25 | 1.05 | 0.16 |
| Logistics Staff | 0.75–1.15 | 0.95 | 0.14 |
| Patient (Self-Mobile) | 0.65–1.05 | 0.85 | 0.13 |
| Patient (Moderate) | 0.35–0.55 | 0.45 | 0.07 |
| Patient (Severe) | 0.05–0.15 | 0.10 | 0.03 |
| Family Members | 0.60–1.20 | 0.95 | 0.18 |
| Personnel Type | F1 | F2 | F3 | F4 |
|---|---|---|---|---|
| Doctor | 20 | 25 | 15 | 10 |
| Nurse | 35 | 37 | 30 | 40 |
| Administrative Staff | 15 | 8 | 6 | 5 |
| Support Staff | 8 | 8 | 4 | 5 |
| Logistics Staff | 6 | 6 | 6 | 6 |
| Patient (Self-Mobile) | 60 | 23 | 15 | 10 |
| Patient (Moderate) | 0 | 10 | 20 | 20 |
| Patient (Severe) | 0 | 5 | 5 | 10 |
| Family Members | 40 | 30 | 40 | 30 |
| Personnel Type | F1 | F2 | F3 | F4 | F5 | F6 |
|---|---|---|---|---|---|---|
| Doctor | 20 | 25 | 30 | 30 | 30 | 25 |
| Nurse | 35 | 35 | 35 | 35 | 35 | 30 |
| Administrative Staff | 10 | 8 | 8 | 8 | 8 | 8 |
| Support Staff | 5 | 5 | 5 | 5 | 5 | 5 |
| Logistics Staff | 5 | 5 | 5 | 5 | 5 | 5 |
| Patient (Self-Mobile) | 40 | 25 | 25 | 20 | 15 | 15 |
| Patient (Moderate) | 0 | 10 | 20 | 10 | 20 | 20 |
| Patient (Severe) | 0 | 5 | 5 | 10 | 15 | 15 |
| Family Members | 30 | 30 | 25 | 30 | 30 | 30 |
| Evaluation Indicator | A Hospital | D Hospital | Difference Analysis |
|---|---|---|---|
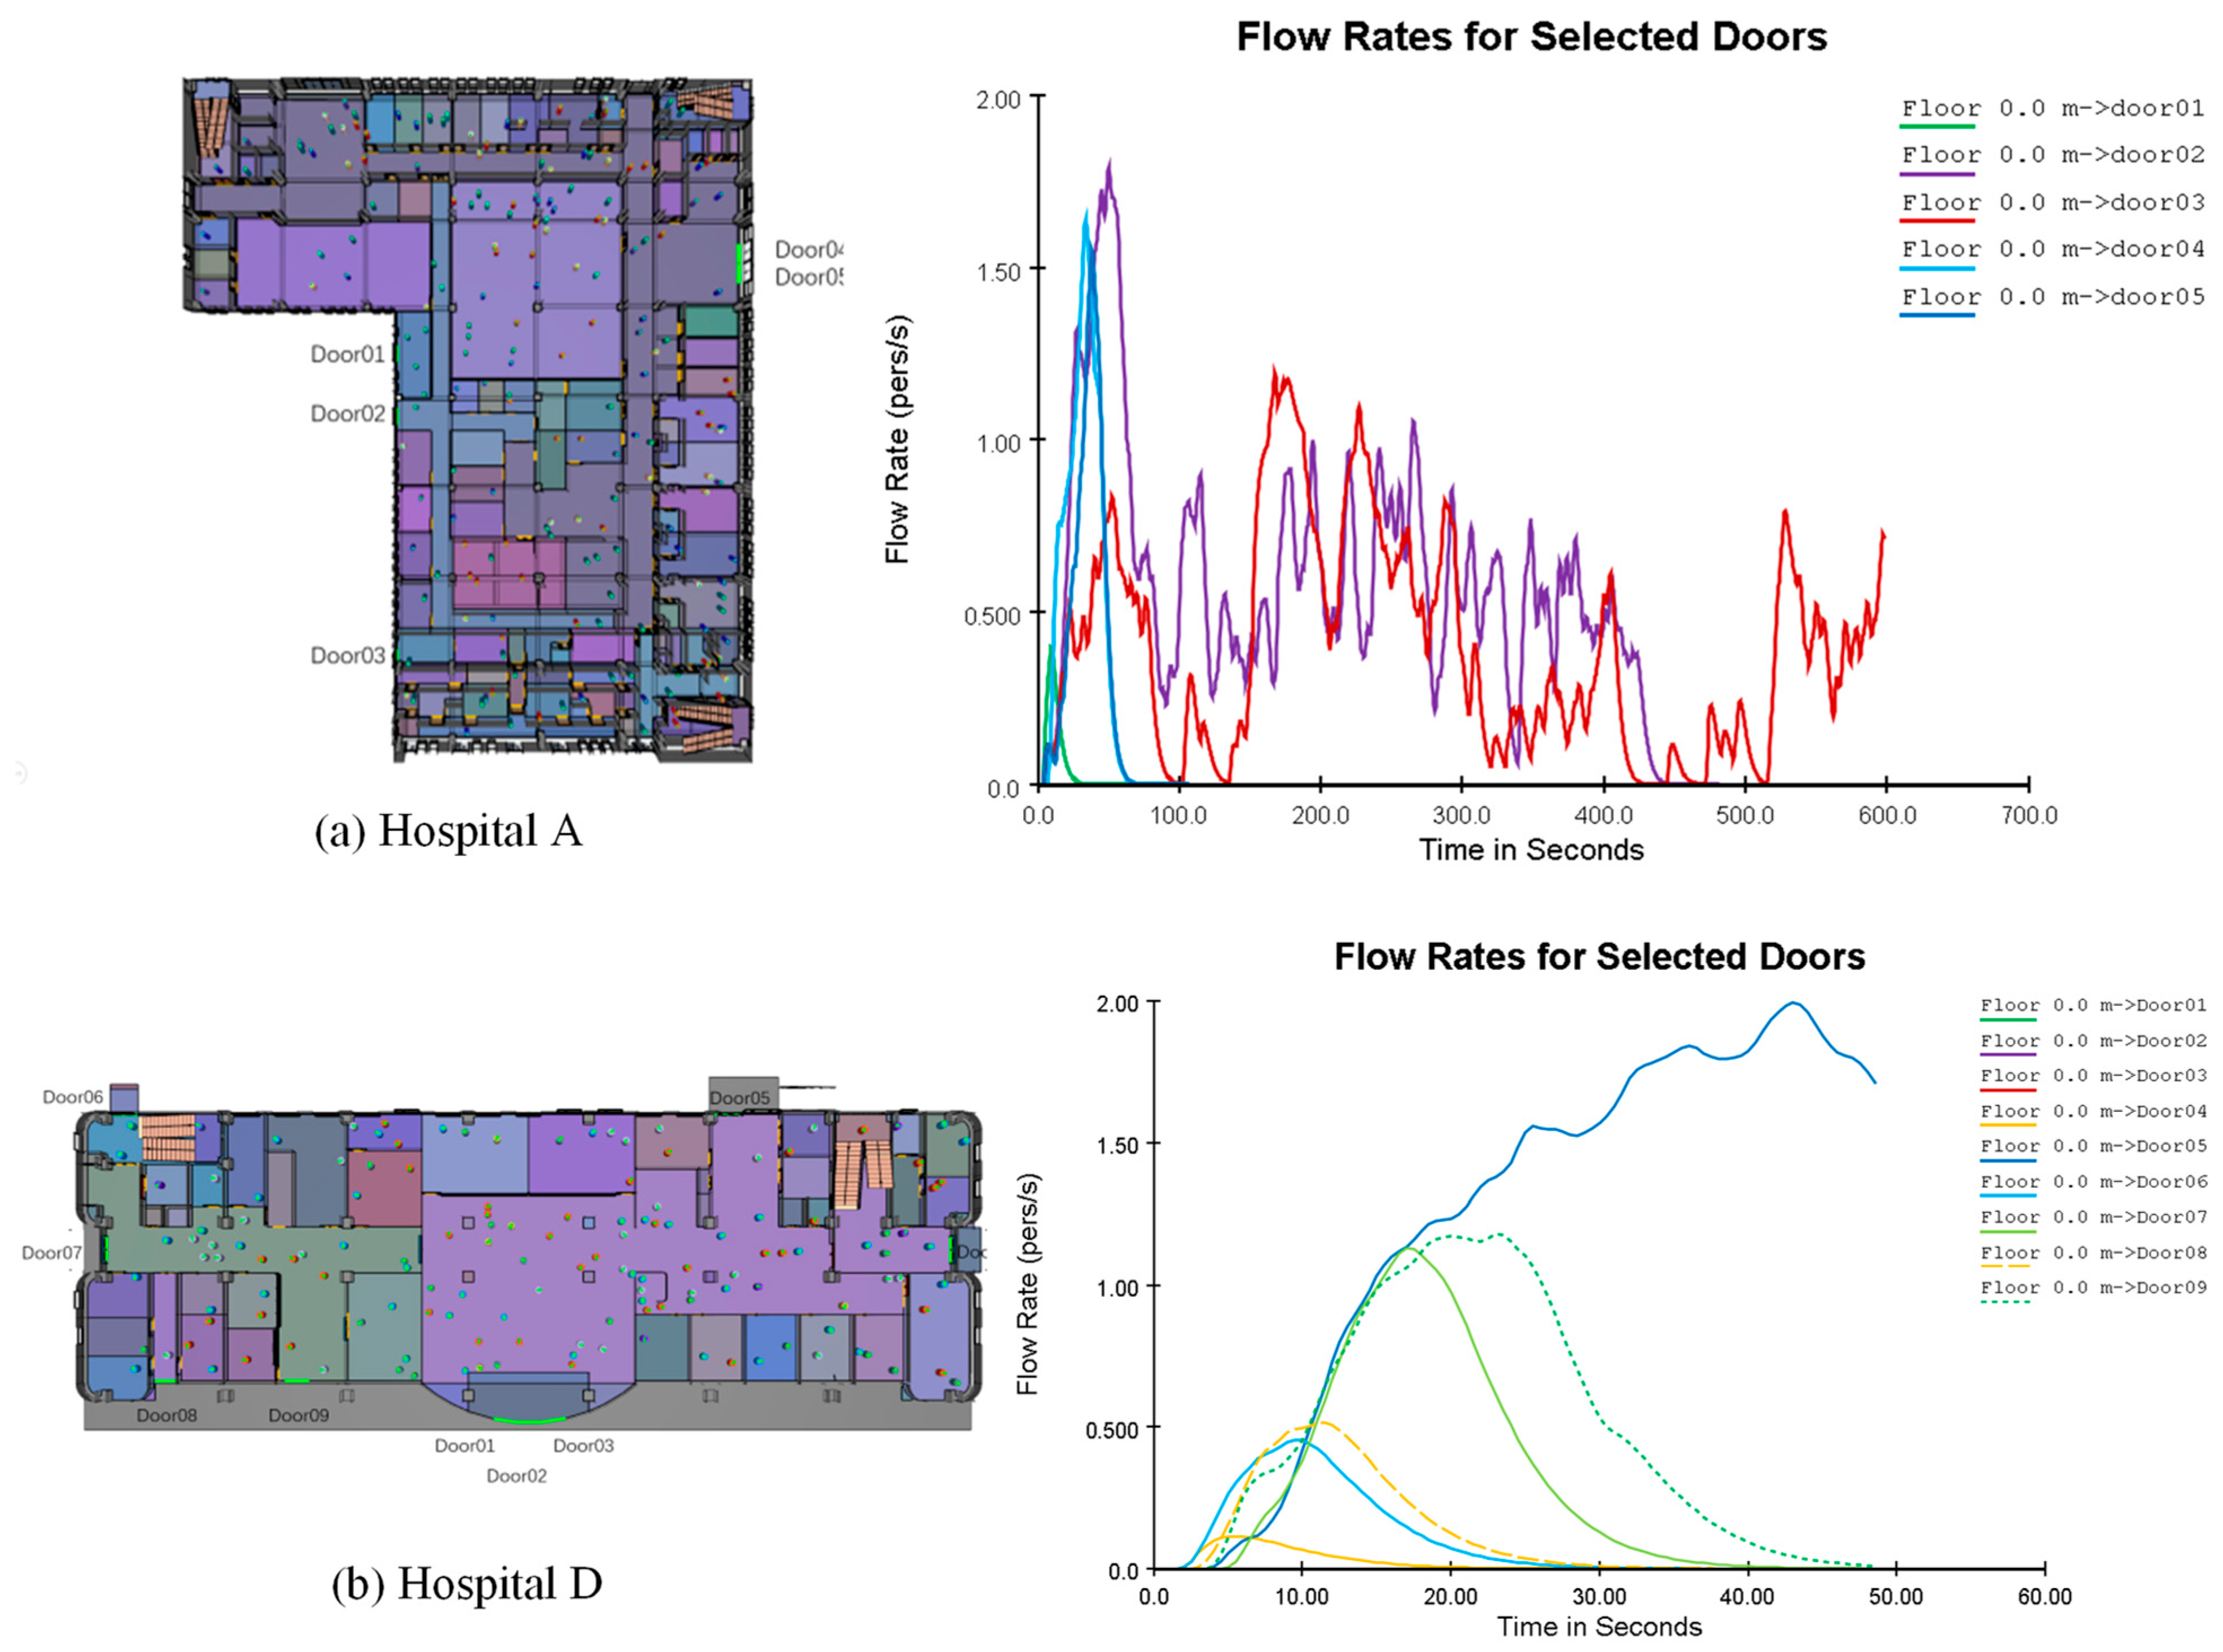
| Total Evacuation Time (s) | 598.3 | 690.0 | A Hospital demonstrates higher efficiency |
| Last Person Evacuation Time (s) | 625.4 | 735.2 | A Hospital shows better tail-end evacuation performance |
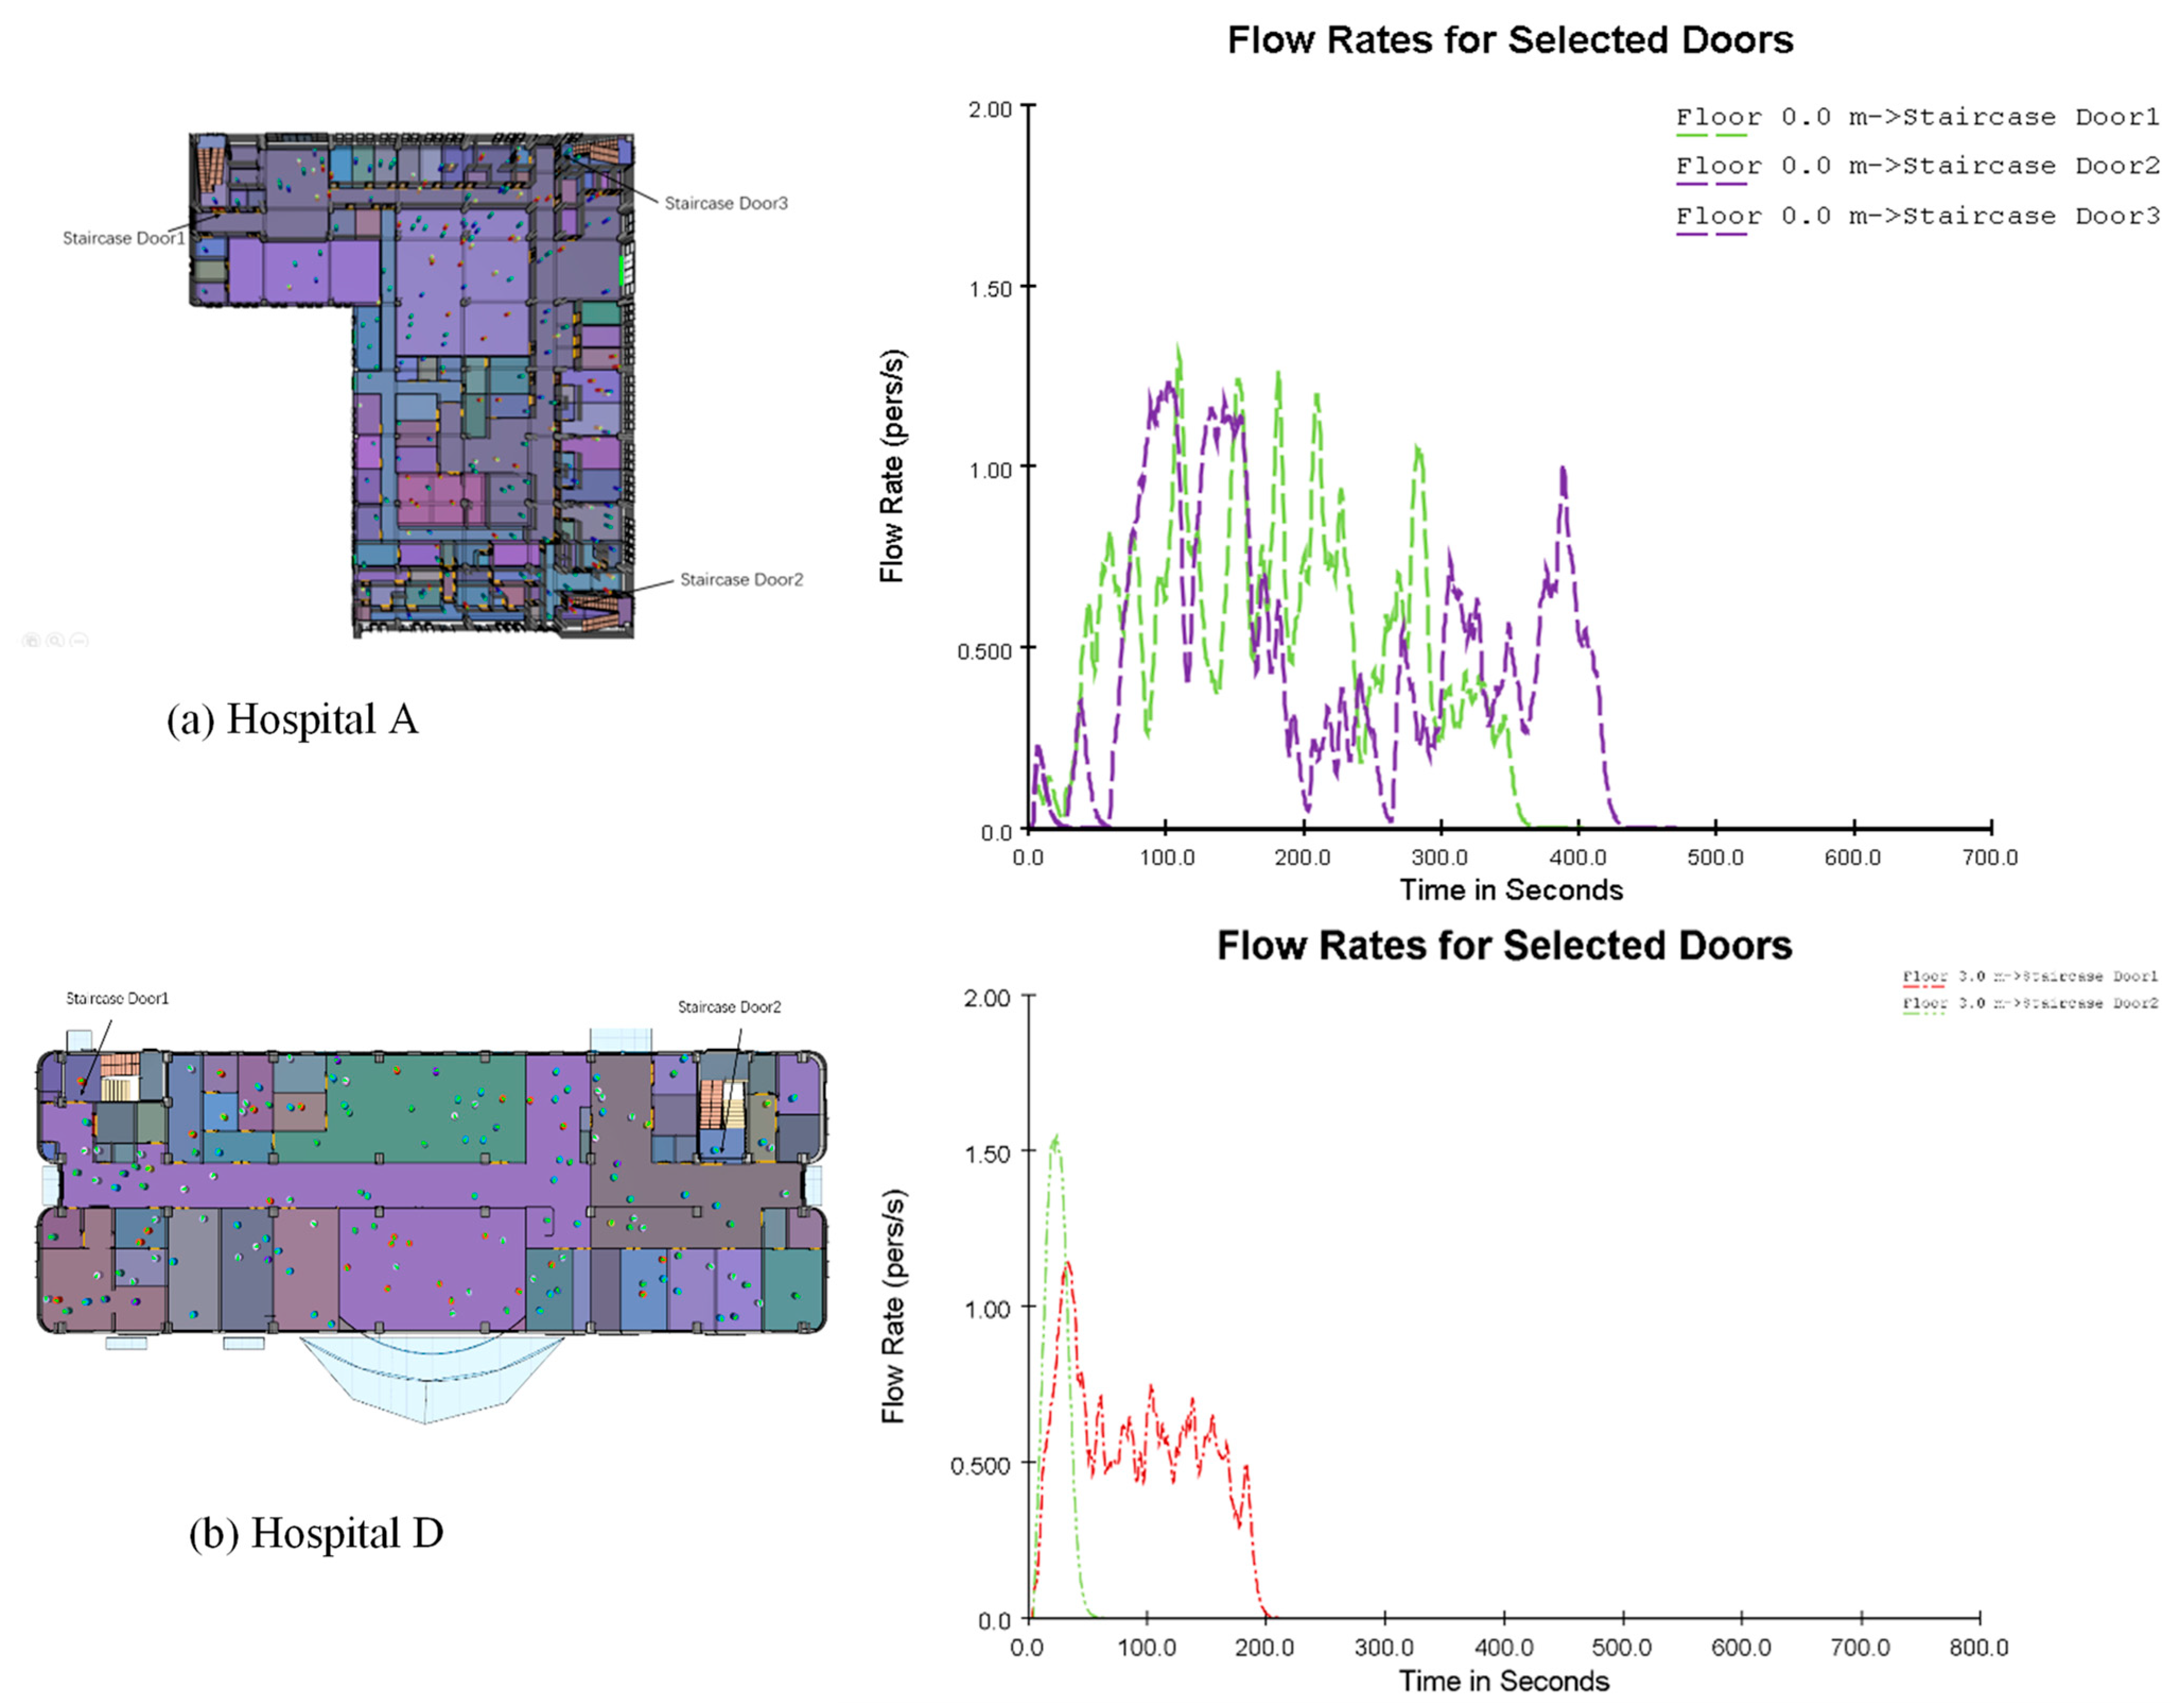
| Maximum Congestion Density (persons/m2) | 1.78 (main exit) | 1.99 (intersection of main corridor and stairs) | D Hospital exhibits more severe congestion |
| Exit Utilization Balance | High; flow distributed evenly across exits | Very low; main exit overcrowded | A Hospital has a more reasonable exit distribution |
| Indicator | A | B | C | D | E | F | G | H |
|---|---|---|---|---|---|---|---|---|
| Evacuation Time (E1) | 9 min 58 s | 8 min 5 s | 9 min 11 s | 11 min 30 s | 9 min 33 s | 13 min 17 s | 7 min 9 s | 6 min 15 s |
| Ranking | 6 | 3 | 4 | 7 | 5 | 8 | 2 | 1 |
| Building | Euclidean Distances | Relative Closeness | Ranking | |
|---|---|---|---|---|
| Euclidean Distance to Positive Ideal Solution | Euclidean Distance to Negative Ideal Solution | |||
| A | 0.12551 | 0.077 | 0.37961 | 6 |
| B | 0.07478 | 0.131 | 0.63681 | 3 |
| C | 0.09766 | 0.101 | 0.50818 | 5 |
| D | 0.15133 | 0.064 | 0.29679 | 7 |
| E | 0.08558 | 0.114 | 0.57163 | 4 |
| F | 0.18445 | 0.066 | 0.26439 | 8 |
| G | 0.07784 | 0.149 | 0.65723 | 2 |
| H | 0.06629 | 0.185 | 0.73569 | 1 |
Disclaimer/Publisher’s Note: The statements, opinions and data contained in all publications are solely those of the individual author(s) and contributor(s) and not of MDPI and/or the editor(s). MDPI and/or the editor(s) disclaim responsibility for any injury to people or property resulting from any ideas, methods, instructions or products referred to in the content. |
© 2025 by the authors. Licensee MDPI, Basel, Switzerland. This article is an open access article distributed under the terms and conditions of the Creative Commons Attribution (CC BY) license (https://creativecommons.org/licenses/by/4.0/).
Share and Cite
Huang, Y.; Lu, S.; Ju, X.; Dao, J.; Chen, X.; Deng, H.; Wang, Z. Integrating Entropy Weight TOPSIS and BIM-Based Evacuation Simulation for Safety Assessment of High-Occupancy Buildings. Fire 2025, 8, 455. https://doi.org/10.3390/fire8120455
Huang Y, Lu S, Ju X, Dao J, Chen X, Deng H, Wang Z. Integrating Entropy Weight TOPSIS and BIM-Based Evacuation Simulation for Safety Assessment of High-Occupancy Buildings. Fire. 2025; 8(12):455. https://doi.org/10.3390/fire8120455
Chicago/Turabian StyleHuang, Yijing, Shun Lu, Xiaoyu Ju, Jicao Dao, Xiaoping Chen, Hanying Deng, and Zhenjia Wang. 2025. "Integrating Entropy Weight TOPSIS and BIM-Based Evacuation Simulation for Safety Assessment of High-Occupancy Buildings" Fire 8, no. 12: 455. https://doi.org/10.3390/fire8120455
APA StyleHuang, Y., Lu, S., Ju, X., Dao, J., Chen, X., Deng, H., & Wang, Z. (2025). Integrating Entropy Weight TOPSIS and BIM-Based Evacuation Simulation for Safety Assessment of High-Occupancy Buildings. Fire, 8(12), 455. https://doi.org/10.3390/fire8120455


