Abstract
The neutral point of a 10 kV distribution network often adopts an arc suppression coil or high resistance grounding mode to ensure the reliability of the power supply. The single-phase grounding fault current is below 10 A, and the distribution network can continue to operate with the fault for up to 2 h. However, long-time arc faults may ignite cables and cause electrical fires, causing further damage to adjacent cables and seriously affecting the safety of the power grid. To study the combustion characteristics of a single-phase grounding fault of a distribution network cable under the action of a long-term small current arc, the cable fault ignition test was carried out by using the arc ignition method of welding tin wire fuses. Then, the temperature distribution of the cable channel in an electrical fire was simulated, based on an FDS simulation, and the damage of adjacent cables under typical layout was further analyzed. The results show that the 10 kV cable was quickly ignited by the high temperature arc within 0.04 s after the breakdown and damage of the cable. Flammable XLPE insulation melted or even dripped off at a high temperature in fire. Thus, the fire spread to both ends when burning. Under the condition of 4–10 A, the maximum flame temperatures above the arc fault point reached 725 °C, 792 °C, 812 °C and 907 °C, respectively. According to the network structure, some protection, such as fireproof tape, needs to be applied directly above the faulty cable when the fault current exceeds 6 A.
1. Introduction
With the expansion of the urban distribution network, cable tunnels are growing rapidly, and the amount of cables is very large. Cable tunnel fire accidents occur frequently [1,2,3,4] and the cable fire caused by an arc fault accounts for a considerable proportion of all cable fires [5,6]. Xi’an, Chongqing, Dalian and other cities have experienced many channel fires caused by single-phase grounding faults of 10 kV distribution cables [7]. The Shaanxi Weiqu substation 35 kV outlet cable trench fire resulted in a 110 kV Weiqu substation and 330 kV Nanjiao substation fire, a fault loss load of 243,000 kilowatts and great social impact on 18 June 2016 [8]. The power channel resources are tight. At present, the high-voltage distribution network is widely laid, and the failure rate of the distribution network cable is extremely high. More than 80% of single-phase grounding faults are arc grounding faults [9]. The fault arc that penetrates the insulation layer between the wire core and the metal shielding layer can persist for a long time. The high-temperature ionized gas temperature of the arc column can reach 6500 K under the action of a continuous minimum current that can form an arc. The arc temperature increases with the increase in the current and can even be as high as four times the surface temperature of the sun [10,11,12]. Hence, the combustibles in the tunnel are easily ignited and cause damage to the adjacent cables in the tunnel. Therefore, the arc combustion characteristics of a 10 kV distribution network cable single-phase grounding fault and the cable damage near the tunnel were studied. This study has great significance for the security of power systems.
Domestic and foreign scholars focused on the arc ignition methods of a 10 kV cable and the spread law of cable fire or electrical fire in buildings, based on FDS, but few methods obtained a continuous arc. Studies on the risk of cable ignition were lacking. At the same time, the FDS simulation methods considering the limitations of the interaction between the layers of the cable in the actual tunnel and the environmental factors were also lacking. Liu et al. [13] conducted internal ignition tests for 10 kV cables under single-phase ground fault conditions, but the experiment only ignited the arc for 0.5 s and the cable was not ignited. Okano et al. [14] developed an arc initiation experimental platform using a 90 kV capacitor bank. As a result, only an arc with a duration of 0.5 ms was generated, and no continuous arc was obtained, and the cable was not ignited. Xu [15] combined this with FDS simulation to explore the influence of arc fire power on an arc ignition cable on the arc ignition 1 kV cable test platform. The critical arc power required to ignite the cable in a short time was obtained. However, there are some limitations in the study of arc ignition focusing on 1 kV specific types of cables, and the research on the continuous cable ignition process and the long-term impact of fire on the surrounding environment and building structures is lacking. Tang et al. [16] set up a heat source inside the fault cable model. The simulation only obtained the fire development process when the single-phase ground fault occurs in the cable. But the damage risk of arc ignition to each layer of cable in the actual tunnel environment was not analyzed. Niu et al. [17] carried out fire research in the established FDS simulation model of full-scale fire utility tunnel. The research focused on macroscopic phenomena, such as the fire development process and smoke temperature. However, the research based on specific test scenarios has certain limitations. In addition, the specific mechanism of cable fire in buildings, such as the specific mechanism of an arc ignition cable in a utility tunnel, is not studied in depth. Therefore, an experimental method that can successfully simulate the fault arc ignition of cables and sustain the arc is needed and the combustion characteristics of the cable under different arc conditions should be analyzed. At the same time, an FDS simulation method considering the real tunnel environment and the interaction of multi-layer cables is needed to provide a reference for effective measures to reduce the damage of the fault arc.
The high current breakdown protection of distribution network is fast-acting and has a short duration. Fewer continuous fire accidents were caused. On the contrary, the distribution network can continue to operate with the fault for up to 2 h. Continuous fire accidents may be caused. This study focuses on the long-term continuous small-current single-phase ground faults in 10 kV distribution cables. First, an experimental platform for the arc ignition of 10 kV cables was established and the arc ignition method of fusing was adopted. Arc ignition tests were conducted under different current conditions to analyze the combustion characteristics of the cables. Then, based on the combustion characteristics of the cables and the arc power, fire dynamic simulations (FDS) were used to establish an equivalent heat source model for the arc ignition process. Finally, a simulation model of the cable tunnel was simulated to obtain the temperature distribution of the adjacent cables, and the damage to cables in different layers of the tunnel under typical arc conditions was analyzed.
2. Arc Experiment for 10 kV Cable Single-Phase Ground Fault
2.1. Experiment Principle
The direct grounding operation mode in a high-voltage power network can result in fault currents ranging from hundreds to thousands of amperes. At this time, the protection device can act quickly when the cable fails, and will generally not cause a continuous cable fault. However, in 10 kV high-voltage distribution networks, the neutral point is often grounded through high-resistance grounding methods to ensure a reliable power supply. According to the national standard, GB/T 50064-2014 [18], and the industry standard, DL/T 620-1997 [19], the system can operate with a fault for 2 h when a single-phase ground fault occurs. The ignition phenomenon of the fault phase cable is due to the long-term existence of the fault arc. This study focuses on single-phase ground faults in 10 kV distribution cables. In the fault loop, the fault phase voltage is zero, and the non-faulted phase voltage increases to the line voltage. The voltage in the fault loop can reach 5.77 kV. The current-limiting protection resistance is about 500 Ω. The actual fault current is approximately 10 A and can persist for a long time in this case. However, arcs at low currents are prone to extinction and are difficult to maintain. Therefore, this study selects four small-current conditions, ranging from 4 to 10 A, to explore the combustion characteristics of the cable sheath under different conditions.
The arc ignition experiment in this study requires the generation of a current around 10 A. Equipment capacity requirements were higher. However, once the arc is formed, a relatively small voltage is sufficient to sustain the arc for a long duration. But conventional high-voltage testing equipment has a small rated current on the high-voltage side, typically in the microampere range, with a short duration. The sustaining voltage for an arc per centimeter of length is approximately 30 V under atmospheric conditions [20]. Based on this principle, the arc initiation method used in this study involves the melting of a fuse. The arc is generated in the insulation gap of the cable, located between the cable conductor and the external grounding electrode. A through gap is created in the insulation layer, and a solder wire is placed as the fuse. The current is adjusted to the experimental set value at both ends of the fuse, which results in a low voltage at the ends of the fuse. As the current flows through the circuit, the fuse generates heat due to its resistance, and the heat continues to accumulate until the fuse melts. The voltage across the fuse then jumps to the power supply voltage. The resulting metal vapor is ionized under the strong electric field, creating a conductive channel that further forms the arc. This high-temperature arc ignites the cable, leading to the initiation of the combustion process.
2.2. Experiment Set-Up and Method
The experimental platform for the arc ignition of 10 kV cables is shown in Figure 1. The experimental circuit consisted of four components: the power supply equipment, current-limiting resistor, cable and grounding electrode. Additionally, current coils and voltage dividers were incorporated into the platform to measure the arc voltage and current waveforms to measure the arc characteristic parameters during the ignition process. Additionally, a 50 Hz AC stabilized power supply box (made by Wuhan Huadian Meilun Electric Power Technology Co., Ltd., Wuhan, China) was designed to meet the experimental conditions, with a maximum output current of 10 A and a rated voltage of 5 kV. The power supply box provided continuous and stable power. The protective current-limiting resistor was a ripple resistor with a rated power of 10 kW and a resistance value of 100 Ω. The data acquisition system was divided into electrical quantity collection and temperature collection devices. The electrical quantity collection system consisted of the voltage divider and current coils, with the measured data uploaded to the data acquisition card at a collection frequency of 5 kHz. The temperature collection system used K-type thermocouples (a diameter of 1 mm and a length of 200 mm; made by Dongtai Lingchuang Precision Measurement and Control Co., Ltd., Yancheng, China), with a maximum measurement temperature of 1300 °C (measurement accuracy between ± 3 °C and ± 5.5 °C). Three thermocouples were placed in parallel at 5 cm and 10 cm above the cable surface, respectively. The central thermocouple was positioned directly above the arc, and the left and right thermocouples were each placed 5 cm away from the center.
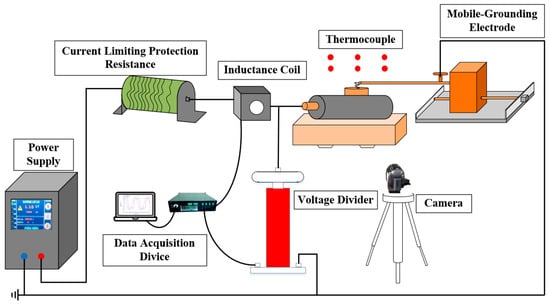
Figure 1.
The 10 kV cable arc experiment circuit.
The cable model used in this experiment was a YJV22-8.7/10 kV-1*70 (made by Shan DongFangke Cable Co., Ltd., Jinan, China), with a length of 200 mm. In the case of a single-phase ground fault, the low current arc penetrated the insulation layer between the wire core and the grounding electrode. To facilitate the connection of the wire core to the high voltage before the test, a through gap (about 2 mm in diameter) was made in the insulation layer of the 10 kV cable, and a solder wire was arranged as the fuse. In addition, a 5 mm long insulation layer was removed at one end of the cable to facilitate the core access to high voltage. A hole was drilled at the bottom of the other end of the electrode, and screws were inserted on both sides of the hole to fix the fuse. The grounding electrode was fixed on the stepping motor to prevent movement. The arc ignition device was composed of a test electrode and fuse. The length of the test electrode was 15 cm. The arc ignition test platform was shown in Figure 2. Experiments were carried out under four current conditions of 4,6,8 and 10 A, respectively, to study the ignition characteristics of cables under different working conditions.
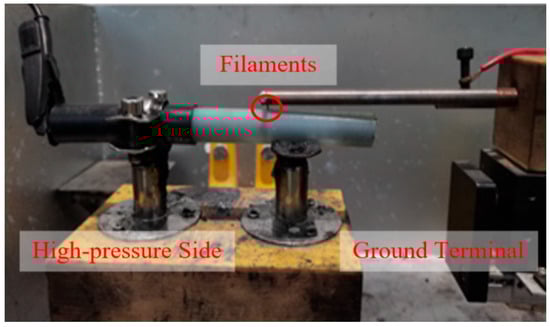
Figure 2.
The 10 kV cable arc ignition experiment set-up.
When the fuse was thick, the fusing time was too long, which caused the equipment to heat up notably and affect the test process. These two cases were not conducive to the normal conduct of the test. Hence, solder wires of different specifications were selected as fuses. The melting point of the solder wire was low, and it would fuse instantaneously when the heat accumulated to a certain extent. However, the melting times of different specifications of solder wire were different under different current conditions. Therefore, before the start of the formal test, the fusing effect of different specifications of solder wire under different current conditions was tested. The test results are shown in Table 1, below. Taking the 4 A current condition as an example, when the solder wire specification was 0.2 mm, the resistance of the solder wire was high and the heat was intense because of the negative correlation between the resistance and the diameter. It melted rapidly when the current was 3 s, and it could not be maintained until the current increased to a larger working condition. Some contact resistance would inevitably appear in the circuit, which might cause the 0.2 mm solder wire to fuse in advance and lead to failure of the test. The melting time of the 0.6 mm and 0.8 mm solder wires was too long, and the heating of the test equipment was too intense, which affected the normal operation of the test. Therefore, 0.4 mm solder wire should be selected under the 4 A condition. Based on this, 0.6 mm, 0.8 mm and 0.8 mm solder wires were selected for 6, 8 and 10 A, respectively.

Table 1.
Fusing time for solder wires of different specifications under different current conditions.
2.3. Experiment Results Analysis
The ignition experiments of 10 kV cable under 4–10 A conditions were carried out on the arc ignition experimental platform. The ignition characteristics were analyzed from three aspects: arc ignition time, temperature and cable mass loss after combustion. In the case that the cable combustion process had a continuous effect on the arc, the movement of the grounding electrode was controlled to ensure that each group had the same arcing time, and the fixed arcing time was 120 s.
2.3.1. Characteristics of Arc Ignition Time Under Different Current Conditions
Preliminary Stage of Arc Ignition
Figure 3 shows the preliminary ignition process of the 10 kV cable under 4–10 A conditions. The ignition time of the 10 kV cable under the 4–10 A arc conditions was very short. The ignition time was from 0.03 s to 0.04 s. The XLPE material of the cable insulation layer had no flame retardancy, and its limiting oxygen index was about 18%. XLPE material was ignited easily. Then, the fire gradually intensified at about 0.14 s. The fire of the cable burning developed faster with the increase in the current at the same time during the gradual development of the fire.
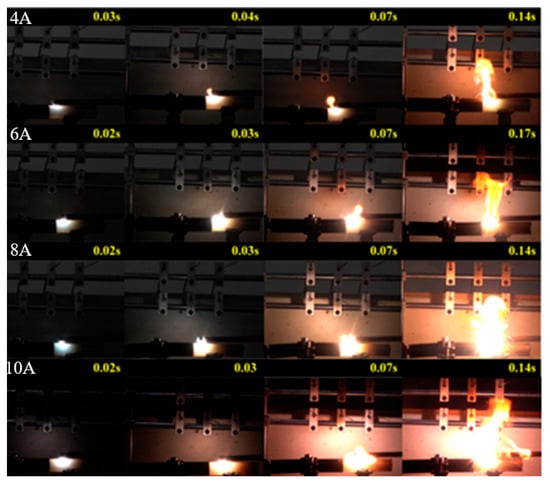
Figure 3.
Preliminary stage process of 10 kV cable arc ignition.
The Combustion Stage After Arc Ignition
Figure 4 shows the combustion phase of the 10 kV cable after the arc ignition under 4–10 A conditions. The flame intensity decreased significantly under 4–10 A conditions after a brief period of intense combustion. The larger the current, the shorter the start time of the fire reduction, as shown in Table 2. The times that the combustion fire started to decrease under the 4–10 A conditions were 37 s, 28 s, 16 s and 12 s, respectively. This phenomenon was attributed to a large amount of ablation of the insulating material around the arc during the combustion process. After the combustion material was largely consumed, the stable and intense combustion became difficult to sustain, even with a high arc temperature, leading to a significant decline in flame intensity. At the same time, the combustion might create carbonized channels, allowing the arc to persist in an unstable manner. As the voltage became insufficient to maintain the arc, the flame intensity decreased, eventually leading to arc extinction. The experiment results show that the 10 kV cable was not extinguished immediately without the high-temperature arc, but the cable experienced spontaneous combustion when the power supply arc was turned off at 120 s, as shown in Figure 4.

Figure 4.
The combustion process of 10 kV cable after arc ignition.
Table 2.
The time characteristics of 10 kV cable combustion process under various arc conditions.
Figure 5 shows the ablation characteristics of the 10 kV cable under the four arc conditions. Under the 4 A and 6 A arc conditions, the flame extended to the left of the cable until the flame burned to the fixed bracket and could not continue to spread. The flame was extinguished at this time. However, under the 8 A and 10 A arc conditions, the flame spread towards both ends of the cable during self-ignition. The left side of the arc position was extinguished when it burned to the fixed bracket. But, on the right side of the arc, the flame was extinguished after the cable was completely ablated without blocking.

Figure 5.
The ablation appearance of the 10 kV cable under four working conditions of arc. (a) 4 A, (b) 6 A, (c) 8 A and (d) 10 A.
The self-ignition time of the 10 kV cable under various arc conditions is shown in Table 2. The self-ignition time showed no significant correlation with the arc current. The spontaneous combustion process of the cable under 4–10 A lasted for 744 s, 570 s, 720 s and 630 s, respectively. Figure 5 shows the ablation appearance of 10 kV cable under four working conditions of the arc. In the process of the cable’s spontaneous combustion after the arc extinguishing, the cable first burnt violently in the arc area. Then, the carbide produced by the combustion melted and dropped downward. When the combustion in the arc area was depleted, the flame in the arc area was gradually extinguished. Then, the flames began to spread. Under the 4 A and 6 A arc conditions, the flame extended to the left of the cable until the flame burned to the fixed bracket and could not continue to spread. The flame was extinguished at this time. However, under the 8 A and 10 A arc conditions, the flame spread towards both ends of the cable during self-ignition. The left side of the arc was extinguished when it burned to the fixed bracket. But, on the right side of the arc position, the flame was extinguished after the cable was completely ablated without blocking.
2.3.2. Temperature Characteristics of Arc Ignition Under Different Current Conditions
The ignition speed of the cable was extremely fast. The cross-linked polyethylene (XLPE) insulation material exhibited good combustion characteristics under the high-temperature arc conditions. After ignition, the two points directly above the arc experienced the fastest temperature rise among the six characteristic temperature measurement points arranged above the cable, and the highest temperature occurred at the point 5 cm directly above the arc. The temperature rise in all thermocouples under different current conditions is shown in Figure 6. Under the 4–10 A conditions, the highest temperature at the 5 cm point directly above the fault location reached 725 °C, 792 °C, 812 °C, and 907 °C, respectively. The higher the current, the faster the combustion development was after ignition, and the higher the peak temperature was. Additionally, after burning for different durations under the four arc conditions, the temperature could no longer be maintained at high levels, due to the significant ablation and melting of the insulating material around the arc region. Then, the temperature curved for the two monitoring points, with the most significant temperature rise showing a sharp decline. The cable entered the self-ignition phase after the arc was cut off. A large amount of insulating material was ablated, and flames spread toward both ends of the cable. Therefore, the temperature of the intermediate thermocouple decreased to the lowest, and the temperature at both ends of the cable increased.
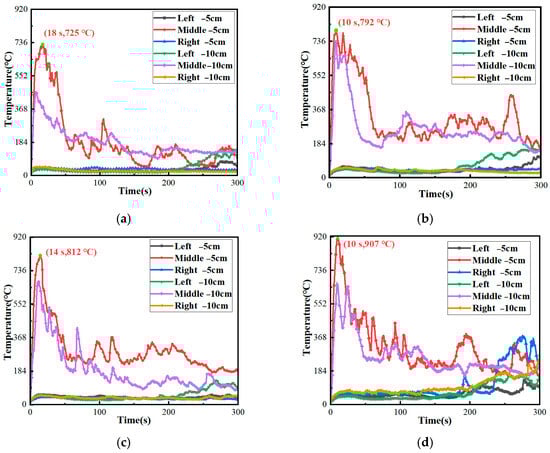
Figure 6.
The thermocouple temperature under four current conditions. (a) 4 A, (b) 6 A, (c) 8 A and (d) 10 A.
2.3.3. The Mass Loss of Arc Ignition Under Different Current Conditions
Figure 7 shows the appearance of the 10 kV cable after combustion. Under the 4 A and 6 A conditions, the flame spread toward the high-voltage connection end, nearly burning the entire section up to the fixed support, and the internal wire-core had been partially exposed. Under the 8 A and 10 A conditions, the flame spread toward both ends of the cable, causing a larger area of ablation.
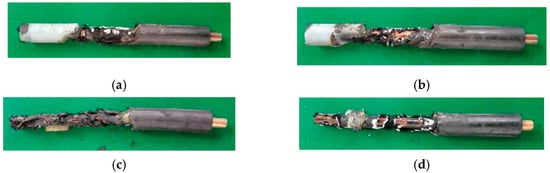
Figure 7.
The cable appearance diagram after combustion under four working conditions of arc. (a) 4 A, (b) 6 A, (c) 8 A and (d) 10 A.
The ablation and mass loss of the 10 kV cable under different arc current conditions are shown in Table 3. Both the quality loss and ignition loss of the experimental cable increased with the arc current’s conditions. The burning behavior of the cable changed from spreading in one direction to spreading toward both ends from 6 A to 8 A. Therefore, the quality and ignition loss of the cable increased significantly during this period. In addition, combined with the above experimental phenomena, the results show that the current affected the degree of cable combustion. The temperature, quality loss and ignition loss increased with the increase in current.
Table 3.
The ablation amount and mass loss of 10 kV cable under various arc conditions.
3. FDS Fire Simulation Based on Equivalent Fire Source
Based on the aforementioned cable ignition experiments, a cable ignition simulation model was established in FDS (2024) and a cylindrical fire source was set inside the cable model to be equivalent to the arcing process. Using numerical inversion methods, the temperature rise data from the simulated cable ignition process was compared and validated with experimental temperature rise data. The heat source parameters were gradually adjusted to achieve an equivalent simulation of the arc ignition process within dynamic fire simulations. The equivalent heat source was then used for the FDS of the cable tunnels, and the overtemperature damage to the outer sheath of the cables at various levels within the tunnel was analyzed. The damage to each layer of cables under different low-current arc fault conditions was analyzed based on this analysis.
3.1. Simulation Tunnel Model
The simulation model in this study represented a 10 kV cable tunnel in a certain region. A model measuring 10 m × 2.0 m × 2.1 m (length × width × height) was established based on the actual layout of the cable tunnel, as shown in Figure 8. A hole was placed at the midpoint of the faulty phase cable, 5 m from the fault point, to simulate the fault arc ignition process. A cylindrical heat source was positioned inside the hole to represent the arc. The hole diameter was set to 1 cm, and the fire source diameter was 0.5 mm. Thermocouples were arranged on the surface of the outer sheath of the cables in the tunnel to measure the temperature changes during the fault. Then, the cable damage was analyzed. Additionally, both sides of the tunnel were set as open boundaries to allow free airflow, with an ambient temperature of 20 °C and the remaining boundaries of the tunnel were assigned the thermal–physical properties of concrete. Because the 10 kV cable mainly generated arcs in the insulation layer, the outer sheath of the cable was removed in both the test and simulation. Thus, the 10 kV cable model consisted of a simplified two-layer structure: the copper core and the insulation layer. The material parameters for each layer of the cable were shown in Table 4. A combustion reaction was applied to the insulation layer, and the arc duration was selected based on the experiment. Additionally, the simulation time was set to 120 s.
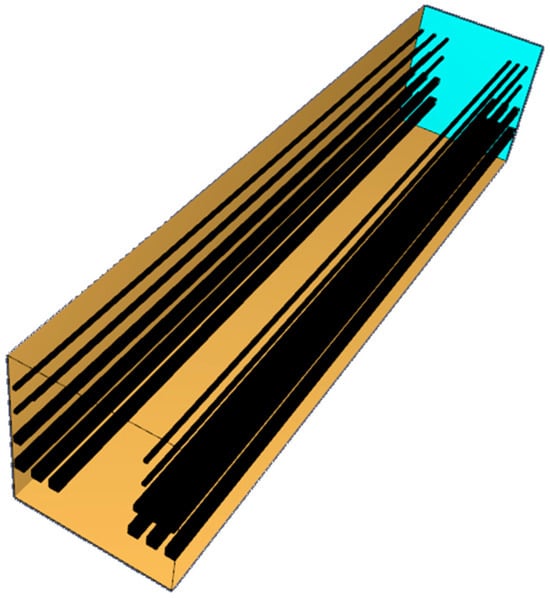
Figure 8.
Cable tunnel simulation model.
Table 4.
Material parameter.
A simulation region of 20 cm × 5 cm × 20 cm was established, based on the dimensions of the test cable. The mesh size was set to 1 cm × 1 cm × 1 cm in the areas around the holes in the non-primary combustion zone. For the combustion region, the mesh size was adjusted according to mesh sensitivity analysis and the empirical value of the mesh size was between 1/4 and 1/16 of the characteristic flame diameter, with a suitable range for application being 1/8 to 1/12. According to the sensitivity requirement formula of McGrattan et al. [21], the accuracy of the mesh depends on the power of the fire source. The characteristic flame diameter, D* [22], was calculated using Equation (1):
where
- Q represents the heat release rate of the heat source in kilowatts (kW);
- is the air density, taken as 1.2 kg/m3;
- is the specific heat capacity of air, taken as 1 kJ/(kg·K);
- is the ambient air temperature, taken as 293 K;
- g is the gravitational acceleration, taken as 9.81 m/s2.
The calculated mesh size range was approximately 3.2 mm to 4.8 mm, based on the characteristic parameters of the heat source. The model dimensions should be multiples of the mesh size, placing the model at the mesh boundaries to improve the model’s accuracy. Therefore, the entire combustion region within the hole was meshed with 5 mm × 5 mm × 5 mm grid cells in this model.
3.2. Equivalent Fire Source Simulation Method
The arc discharge acted as the external heat source during the cable ignition process. The thermal process could be theoretically characterized by the equivalent fire source model. The selection of the equivalent heat source power primarily depended on the arc power. According to the principle of energy conservation, the energy input from the arc was dissipated into the surrounding environment, primarily through three modes: heat conduction, thermal radiation and convective heat transfer. Only a portion of this energy participates in the ignition of the cable’s insulation material in practice. Thus, a thermal conversion coefficient, kr, was introduced. Based on the IEEE 1584 standards, the initial value of the thermal conversion coefficient is set to 0.4 [23]. The initial value of the fire source power was obtained by calculating the arc power and the heat transfer coefficient.
According to the ignition time of the cable under each current condition in Section 2, the arc voltage and current waveforms were taken before the ignition of the cable under each current condition. The instantaneous arc power at each moment was calculated, and the instantaneous power change curve was plotted. The total energy generated by the arc from ignition to cable ignition was used to calculate the average arc power during this process by integrating the curve, which was taken as the arc power for each current condition. The 10 A condition was taken as an example. The arc voltage–current waveform and power waveform of the 10 kV cable before ignition are shown in Figure 9. The initial equivalent heat source power for each arc condition was calculated based on this arc power and the thermal conversion coefficient of 0.4, and the results are shown in Table 5. The initial arc powers of 4–10 A are 132 W, 192 W, 258 W and 347 W, respectively.
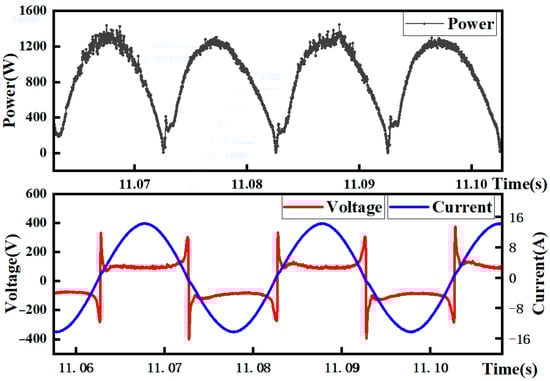
Figure 9.
The arc characteristic waveform before ignition of 10 kV cable under 10 A condition.
Table 5.
Low current arc power and initial equivalent fire source power of 10 kV cable.
In the cable ignition experiment, the temperature variations in the cable combustion process under arc exposure were monitored by six thermocouples. The position of the thermocouple remained fixed. But, due to the effects of the arc, the flame height and position fluctuated frequently during the combustion process, according to the temperature curves of the ignition tests in Section 2. The temperature at the 5 cm point, directly above the gap in the 10 kV cable’s hole, showed the most significant variation. Thus, this point was selected for the temperature rise characteristic curve during free arc combustion to serve as the validation data. By comparing it with the simulated temperature rise data, the equivalent heat source power was validated.
At the same time, in the simulation, once the heat release rate of the heat source reached its maximum value, the flame combustion process stabilized. This made the combination of experiment and simulation more difficult. Therefore, this study simplified the temperature-rise curve of the 10 kV cable during the arc combustion. The temperature curve would not change after reaching the highest temperature in the simulation. Firstly, the numerical simulation of the cable ignition process was carried out according to the fire source power that was calculated when the heat transfer coefficient was 0.4. The temperature rise data of cable combustion obtained by simulation were compared with the experimental data, as shown in Figure 10. The results show that under the condition of 6–10 A, the combustion temperature of the cable measured by the simulation was higher than that of the test data, by using the equivalent fire source power of 0.4 heat transfer coefficient.
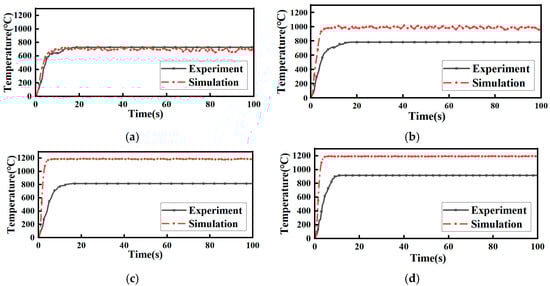
Figure 10.
Simulation and experimental verification of fire source power when the heat transfer coefficient is 0.4. (a) 4 A, (b) 6 A, (c) 8 A and (d) 10 A.
Secondly, to enhance the equivalency of the fire source to the arc ignition process in the cable during simulation, the heat conversion coefficient and fire source power were gradually adjusted, based on the temperature rise data from both the simulation and the experiment. This process continued until the maximum temperature value after the temperature rise stabilized closely matched the experimental data. After adjusting the equivalent fire source power for the 10 kV cable’s small-current arc, a comparison between the simulation and experimental temperature rise data for the four arc conditions was carried out, as shown in Figure 11. Because the ignition process of the 10 kV cable developed rapidly in the test and the temperature-rise time was short, the default heat-release rate of 1 s was adopted in the simulation model.
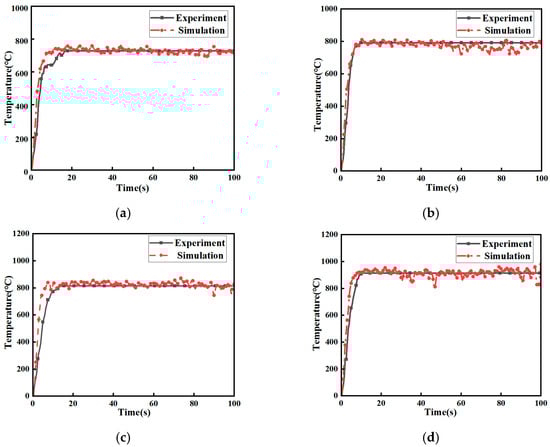
Figure 11.
Verification of equivalent fire source power of 10 kV cable low current arc. (a) 4 A, (b) 6 A, (c) 8 A and (d) 10 A.
Finally, the improved and adjusted heat conversion coefficient and equivalent fire source power were shown in Table 6. The results showed that the heat conversion coefficient of the 10 kV cable under 4–10 A arc conditions decreased with the increase in the arc current, which corresponds to 0.41, 0.31, 0.24 and 0.2, respectively. The reason was that the energy was concentrated in the insulation gap in the ignition experiment. With the increase in current, the arc gap energy and arc power increased, and the energy accompanied by arc ignition and ejection accounted for a large part in the conservation of energy. As the current increased, the proportion of this part increased. At this time, the energy that could actually cause the cable to burn would be reduced accordingly [24]. Therefore, kr decreased with the increase in current. However, the equivalent fire source power still increased with the increase in current and the equivalent fire source powers under the four arc conditions of 4–10 A were 136 W, 150 W, 154 W and 173 W, respectively.
Table 6.
Heat conversion coefficient and equivalent fire source power of 10 kV cable arc.
3.3. Temperature-Rise Characteristics and Damage Analysis of Adjacent Cables
The cable tunnel model is shown in Figure 8. The actual cable tunnel layout was used as a reference. The internal layout of the cable tunnel is shown in Figure 12, and the 10 kV fault phase cable was set in the third layer of the intermediate phase. The equivalent fire source power under the 4–10 A current conditions obtained in Table 6 was the equivalent fire source power of the fault phase cable.
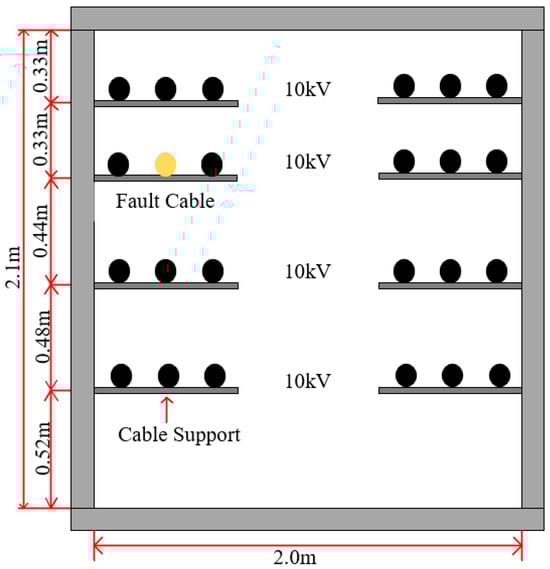
Figure 12.
Cable tunnel layout diagram.
The 10 kV cable in the third layer of the intermediate phase was ignited by an arc fault. The range ignited by the arc was concentrated around the insulation breakdown position because the breakdown fault point was small. Thus, the surface temperature rise in the cable’s outer sheath on the first and second layers and the adjacent phase cable outer sheath on the third layer were at a low temperature and did not pose any damage. However, the flame developed upward during the combustion process of the fault cable. The hot gas generated by the combustion flowed upward. Therefore, the surface temperature of the cable’s outer sheath, located on the upper layer of the fault point, rises significantly. The temperature distribution of the upper cable outer sheath of the 10 kV fault-phase cable is shown in Figure 13. The temperature distribution of the arc fault cable combustion in 4–10 A is shown in Figure 14. The results show that the temperature of the outer sheath of the cable directly above the fault cable is more than 200 °C.
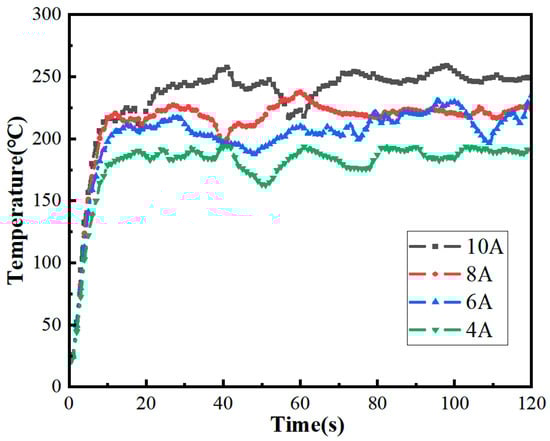
Figure 13.
Temperature rise distribution of upper cable sheath of 10 kV fault phase cable.
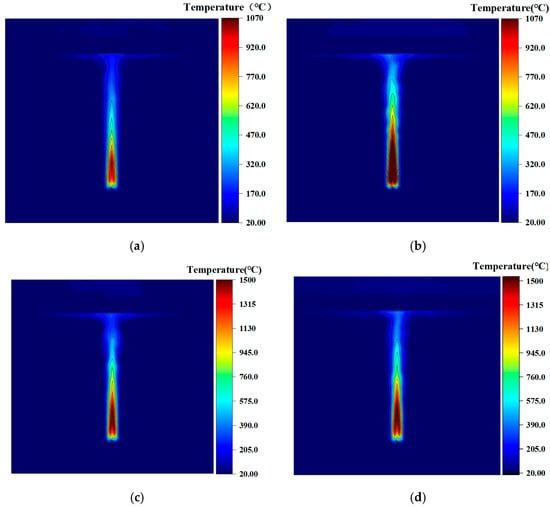
Figure 14.
Temperature distribution contour map in 4–10 A. (a) 4 A, (b) 6 A, (c) 8 A and (d) 10 A.
The data of cable ignition characteristics obtained from the experiment is shown as follows. The arc could exist for a long time after the burning of the 10 kV cable under the action of the arc. However, the fire situation of the four arc conditions decreased significantly at 37 s, 28 s, 16 s and 12 s after the arcing, respectively, because of the lack of comburent. According to the upper limit of the long-term operating temperature of the cable specified in the IEC standard, PVC is 70 °C [25], and the PVC material began to soften after reaching 120 °C and underwent a glass transition. A UL94 test on the flammability of PVC showed that when the temperature reaches 200 °C, PVC is ignited and decomposed to release HCL gas [26]. Combined with the temperature rise in the upper cable outer sheath of the fault cable under each arc condition of the 10 kV cable shown in Figure 13 and Figure 14, the maximum temperature of the upper cable outer sheath is shown in Table 7. The results show that the combustion process of the 10 kV cable under the action of the arc developed rapidly and violently. The temperature of the outer sheath of the upper cable at the fault point exceeded 120 °C under the conditions of the 4–10 A arc, and the temperature rise exceeded 200 °C under the conditions of the 6–10 A arc. The temperature reached the material decomposition temperature limit. Therefore, the upper cable was damaged.
Table 7.
The maximum temperature and damage of the upper cable sheath at the fault point.
4. Conclusions
- (1)
- The cable’s XLPE insulation material lacks flame retardancy. Thus, the ignition times of the 10 kV cable are extremely short, ranging from 0.03 s to 0.04 s. In the process of the combustion, the fire decreased within 12–37 s because of the rapid melting of the XLPE material around the arc. After the arc was cut off, the ignited cable experienced a spontaneous combustion process for about 10 min. Additionally, under the conditions of 8–10 A, the fire spread to both ends of the cable and continued to burn for a period of time. The method of fusing the solder wire provides a reference for the study of arc fault.
- (2)
- The larger the current of the arc is, the faster the arc energy diffuses, and the smaller the heat conversion coefficient is. The heat conversion coefficients under the four arc conditions of 4–10 A are 0.41, 0.31, 0.24 and 0.2, respectively. Therefore, the equivalent fire source power is 136 W, 150 W, 154 W and 173 W, respectively. The equivalent fire source power method simplifies the simulation to restore the real tunnel and to explore the damage of the arc.
- (3)
- The maximum flame temperatures at the fault point under the 4–10 A conditions could reach 725 °C, 792 °C, 812 °C and 907 °C, respectively. The temperature of the upper cable position could reach 182 °C, 207 °C, 219 °C and 230 °C, respectively. The temperature of the upper cable reached the softening and decomposition temperature threshold of the cable outer sheath material. Thus, the cable was damaged. According to the network structure, when the fault current exceeded 6 A, the upper part of the fault cable needed to be protected by fire-proof board or fire-proof tape. However, the outer sheath of other cables did not reach the damage temperature and did not need protection. Based on this, the specific standards and protective measures for subsequent protection can be further studied.
Author Contributions
Writing—review and editing, Z.P. and Y.D.; Writing—original draft, Y.D.; Data curation, S.W. and Z.R.; Conceptualization, W.G.; Methodology, K.Y. All authors have read and agreed to the published version of the manuscript.
Funding
This study was supported by the technology project managed by the headquarters of State Grid Corporation of China, “Early protection warning and flexible disposal technology for electrical fires in distribution cables” (520201250016-159-ZN). The funding unit is the State Grid Beijing Electric Power Company (2025.3-2027.12; 65 persons supported). The authors appreciate the support deeply.
Institutional Review Board Statement
Not applicable.
Informed Consent Statement
Not applicable.
Data Availability Statement
The raw data are held by the author and may be made available upon request.
Conflicts of Interest
The authors declare no conflicts of interest. The authors declare that this study received funding from State Grid Beijing Electric Power Company. The funders had no role in the design of the study; in the collection, analyses, or interpretation of data; in the writing of the manuscript; or in the decision to publish the results.
References
- Chen, C.; Bao, Y.; Zuo, B.; Zhang, J.; Wang, Y. Experimental Investigation of Flame Spread Characteristics in Cable Fires Within Covered Trays Under Different Tilt Angles. Fire 2025, 8, 272. [Google Scholar] [CrossRef]
- Hua, N.; Khorasani, N.E.; Tessari, A.; Ranade, R. Experimental Study of Fire Damage to Reinforced Concrete Tunnel Slabs. Fire Saf. J. 2022, 127, 103504. [Google Scholar] [CrossRef]
- Li, G.; Guo, J.; Kang, Y.; Huang, Q.; Zhao, J.; Liu, C. Classification and Prevention of Electrical Fires: A Comprehensive Review. Fire 2025, 8, 154. [Google Scholar] [CrossRef]
- Qin, R.; Zhang, X.; Li, Y.; Wei, J.; Ding, C.; Jiao, Y. Influence of Cable Spacing on Flame Interaction and Combustion Characteristics of Parallel Thermoplastic Cables. Fire 2025, 8, 258. [Google Scholar] [CrossRef]
- Li, C.; Chen, J.; Tan, X.; Hu, L.; Zhang, W.; Cao, J.; Liu, X.; Wu, S. Overview of Typical Fire Source Simulation Methods for Cable Combustion. Fire Sci. Technol. 2021, 40, 345–351. [Google Scholar]
- Sedahmed, M.S.M.; Hassaan, E.M.M. Inner Thermal Structure Evolution of Fire-Resistant Medium-Voltage Cable Under External Heat Flux with Varying Conductor Radius. Fire 2025, 8, 204. [Google Scholar] [CrossRef]
- Liu, J.; Zhang, X.H.; Zhang, X.Q.; Zhang, Z.H.; Xu, B.Y.; Xu, Y.; Li, R. Prevention of Cable Tunnel Fires Due to Small Current Ground Faults in Grounding Systems. Power Syst. Prot. Control 2023, 51, 21–29. [Google Scholar]
- Power Industry Transmission and Distribution Technical Cooperation Network; Professional Technical Committee of Power Cables and Accessories. Fire Prevention Technology of Power Cables and Case Analysis; China Water & Power Press: Beijing, China, 2018; pp. 5–6. [Google Scholar]
- Wu, H.R.; Li, X.H.; Stade, D.; Schau, H. Arc Fault Model for Low-Voltage AC Systems. IEEE Trans. Power Deliv. 2005, 20, 1204–1205. [Google Scholar] [CrossRef]
- Lee, R.H. The Other Electrical Hazard: Electric Arc Blast Burns. IEEE Trans. Ind. Appl. 1982, IA-18, 246–251. [Google Scholar] [CrossRef]
- Babrauskas, V. Research on Electrical Fires: The State of the Art. Fire Saf. Sci. 2008, 9, 3–18. [Google Scholar] [CrossRef]
- Babrauskas, V. Ignition Handbook; Fire Science Publishers: Issaquah, WA, USA; Society of Fire Protection Engineers: Issaquah, WA, USA, 2003. [Google Scholar]
- Liu, S.R.; Hu, Y.X.; Zheng, J.K.; Su, X.T.; Xu, Y. Dynamic Fire Simulation of Tunnel Fire Ignited by Single-Phase Arc Ground Fault in 10 kV Cable. High Volt. Technol. 2021, 47, 4341–4348. [Google Scholar]
- Okano, Y.; Kaneko, E.; Hayashida, T. Study on Polymer Insulators in Air Discharge. In Proceedings of the 2013 2nd International Conference on Electric Power Equipment-Switching Technology (ICEPE-ST), Matsue, Japan, 20–23 October 2013; IEEE: New York, NY, USA, 2013; pp. 1–4. [Google Scholar]
- Xu, Z.H.; Zhu, Z.Y.; Jing, Z.Y.; Wu, S. Study of Arc Ignition Process in 1 kV Distribution Cables. Fire Saf. Sci. 2023, 32, 135–143. [Google Scholar]
- Tang, P.Y.; Pei, S.S.; Peng, Y.; Tang, T.; Wang, J.H.; Chen, K. Numerical Simulation Study of Cable Ground Fault Fires. Sichuan Electr. Power Technol. 2024, 47, 86–91. [Google Scholar]
- Niu, K.; Xu, D.J.; Zhang, J.; Gao, Y.S. Experimental and Numerical Simulation Study on Cable Fire in Utility Tunnel. Ind. Saf. Environ. Prot. 2024, 50, 1–5. [Google Scholar]
- GB/T 50064-2014; Standard for Overvoltage Protection and Insulation Coordination in AC Electrical Installations. China Planning Press: Beijing, China, 2014.
- DL/T 620-1997; Standard for Overvoltage Protection and Insulation Coordination in AC Electrical Installations. China Electric Power Press: Beijing, China, 1997.
- Guan, Z. Fundamentals of High Voltage Engineering; China Electric Power Press: Beijing, China, 2003. [Google Scholar]
- McGrattan, K.B.; Baum, H.R.; Rehm, R.G. Large eddy simulations of smoke movement. Fire Saf. J. 1998, 30, 161–178. [Google Scholar] [CrossRef]
- UL 1699; Standard for Safety for Arc-Fault Circuit Interrupters. Underwriters Laboratories Inc.: Northbrook, IL, USA, 2023.
- IEEE 1584; Guide for Performing Arc-Flash Hazard Calculations. IEEE Standards Association: Piscataway, NJ, USA, 2018.
- Sung, C.J.; Law, C.K. Extinction mechanisms of near-limit premixed flames and extended limits of flammability. Symp. Int. Combust. 1996, 28, 1465–1473. [Google Scholar] [CrossRef]
- IEC 60502; Power Cables with Extruded Insulation and Their Accessories for Rated Voltages from 1 kV (Um = 1.2 kV) Up to 30 kV (Um = 36 kV). International Electrotechnical Commission: Geneva, Switzerland, 2021.
- UL 94; Tests for Flammability of Plastic Materials for Parts in Devices and Appliances. Underwriters Laboratories Inc.: Northbrook, IL, USA, 1998.
Disclaimer/Publisher’s Note: The statements, opinions and data contained in all publications are solely those of the individual author(s) and contributor(s) and not of MDPI and/or the editor(s). MDPI and/or the editor(s) disclaim responsibility for any injury to people or property resulting from any ideas, methods, instructions or products referred to in the content. |
© 2025 by the authors. Licensee MDPI, Basel, Switzerland. This article is an open access article distributed under the terms and conditions of the Creative Commons Attribution (CC BY) license (https://creativecommons.org/licenses/by/4.0/).