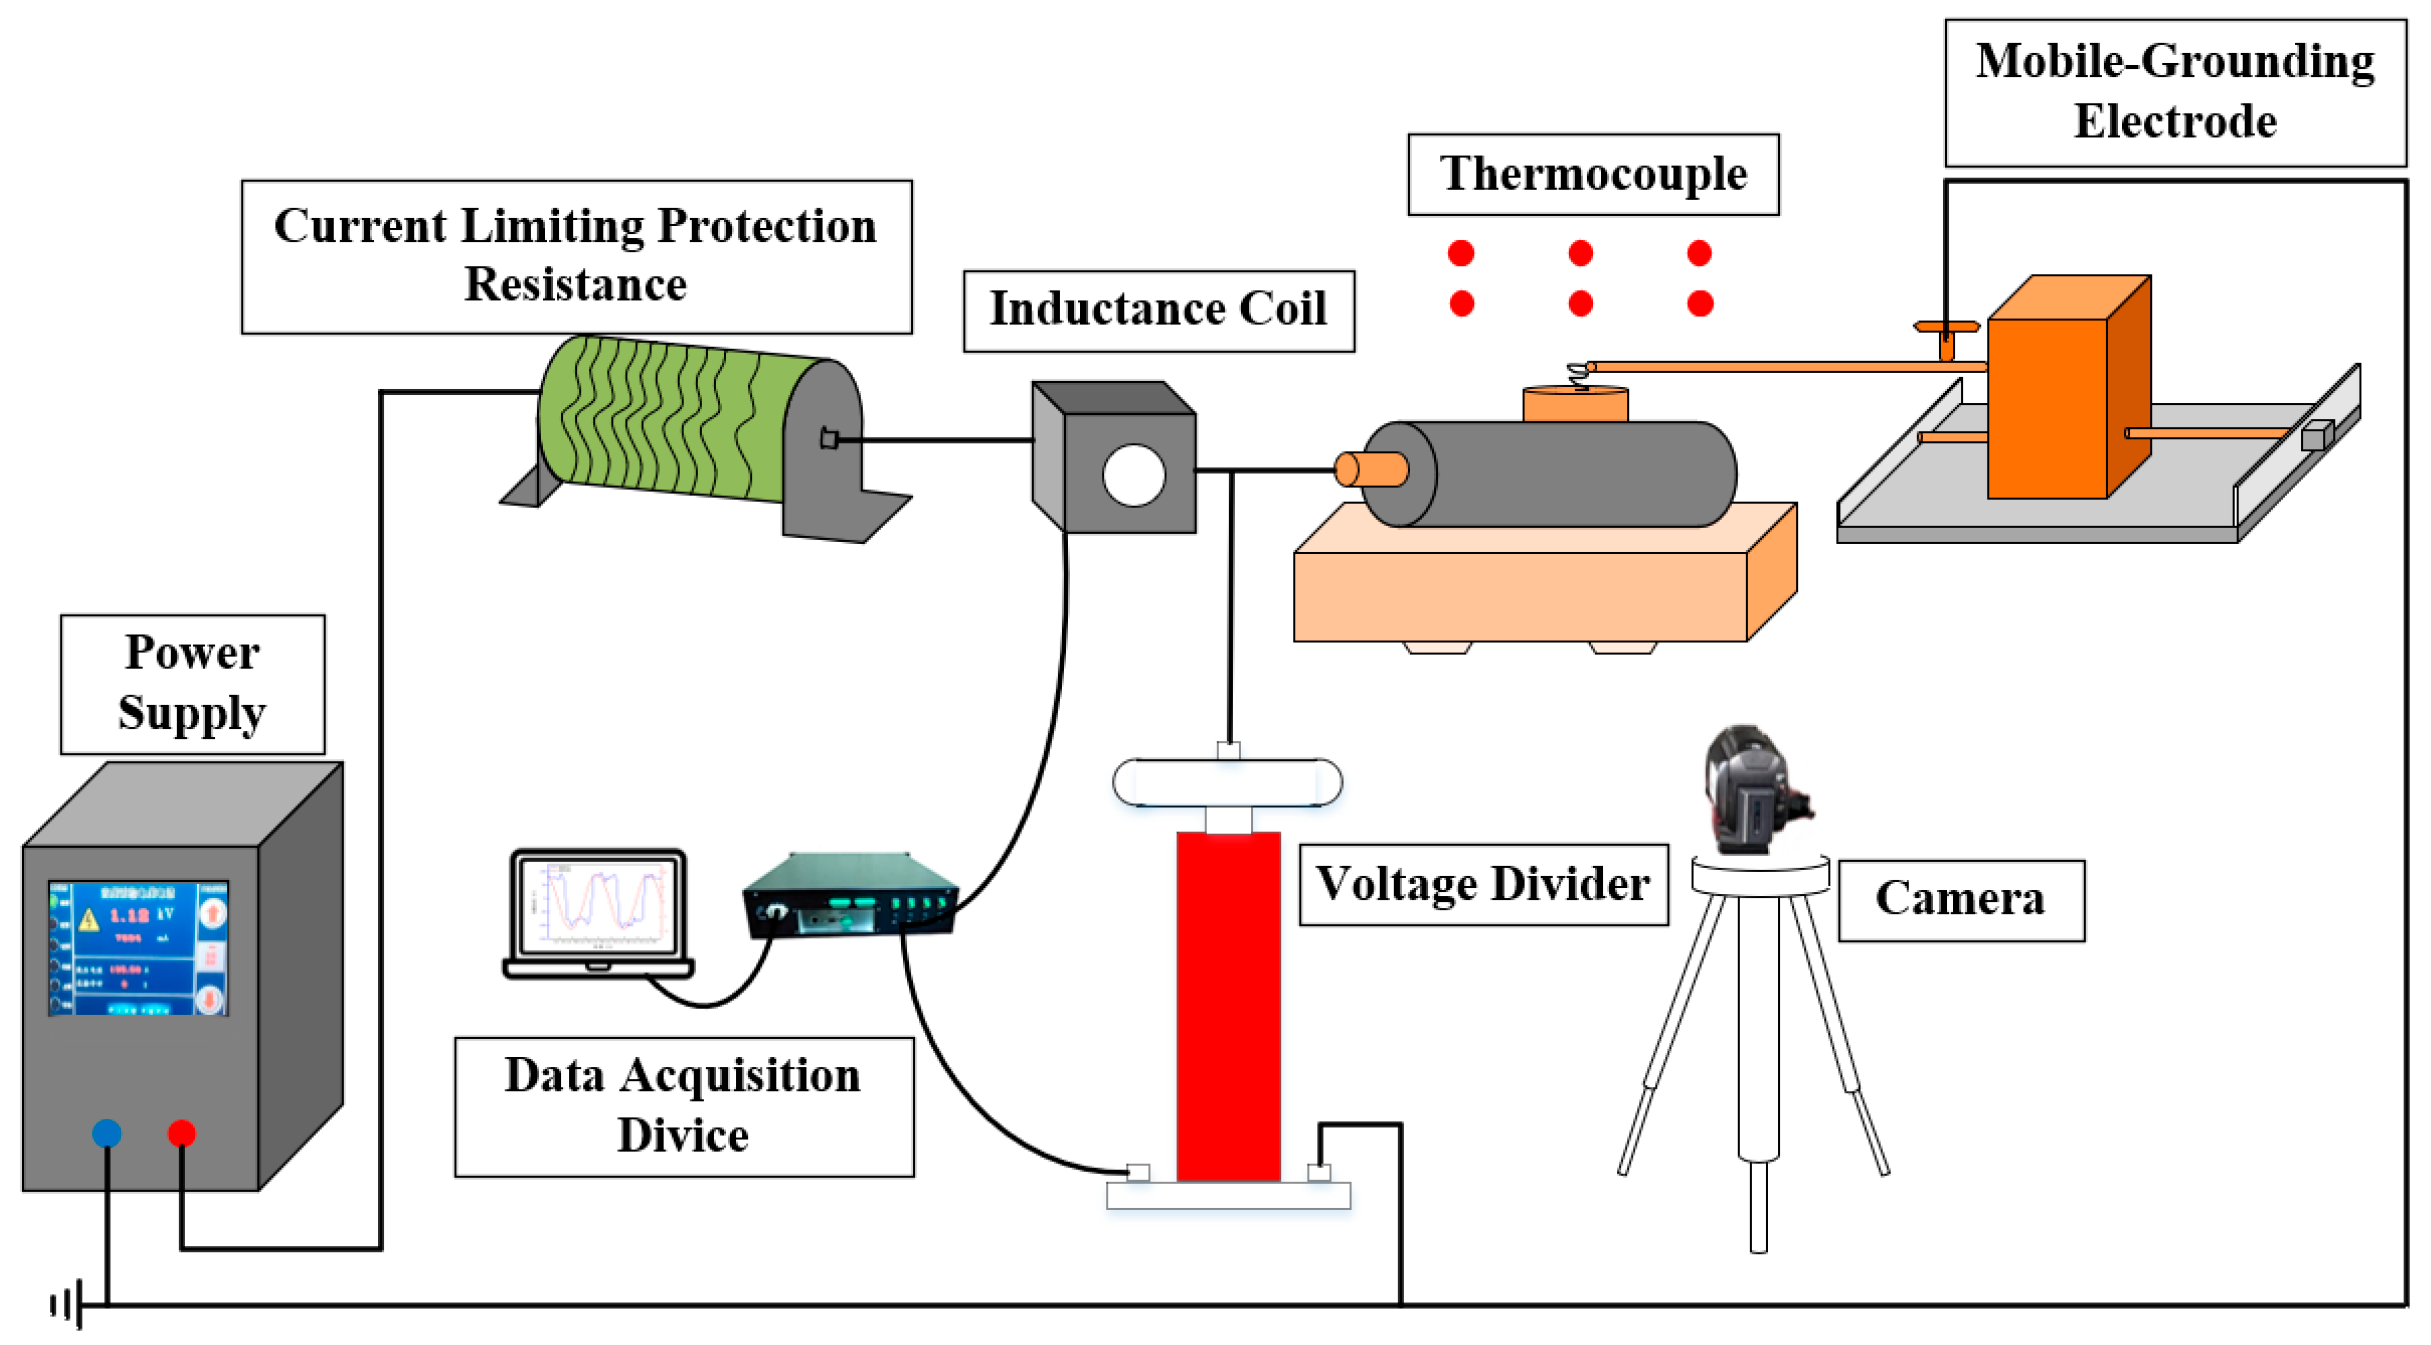
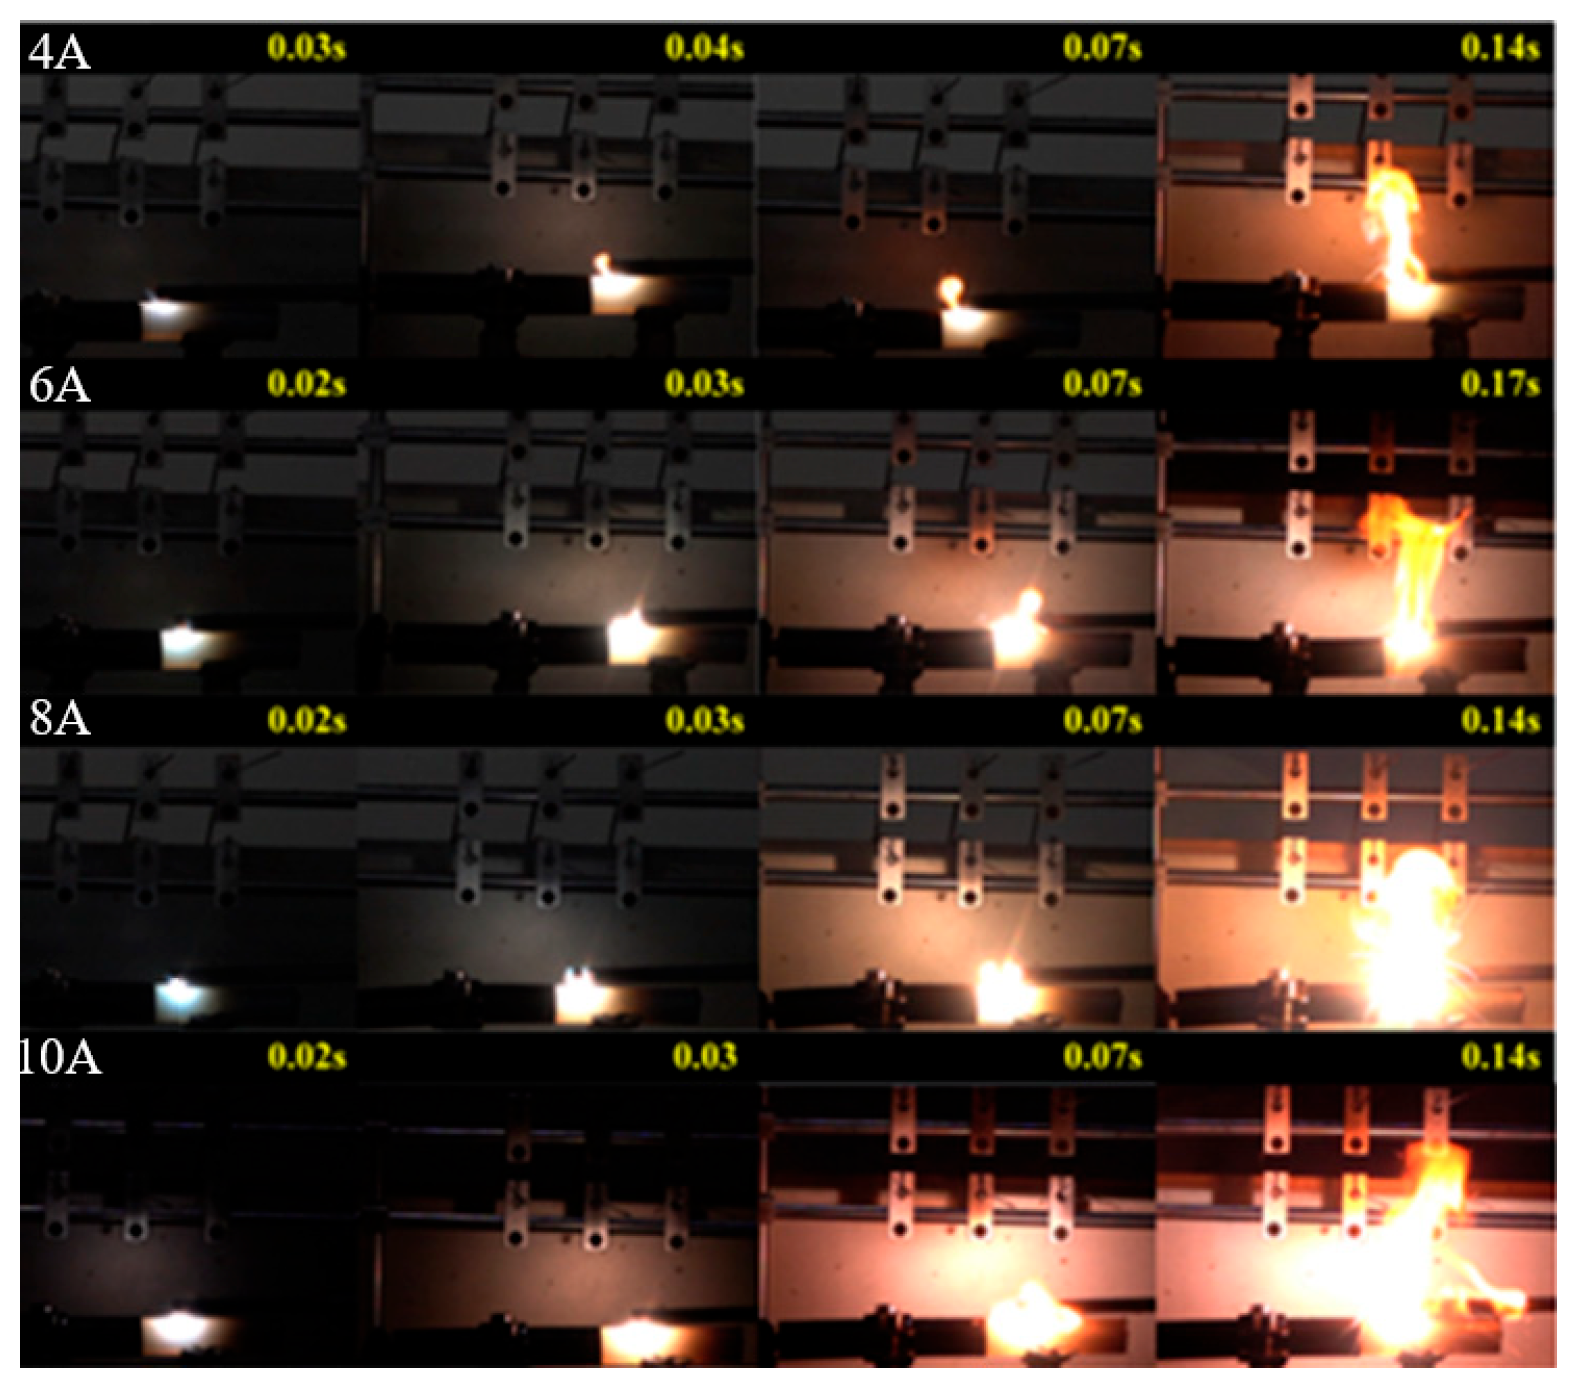
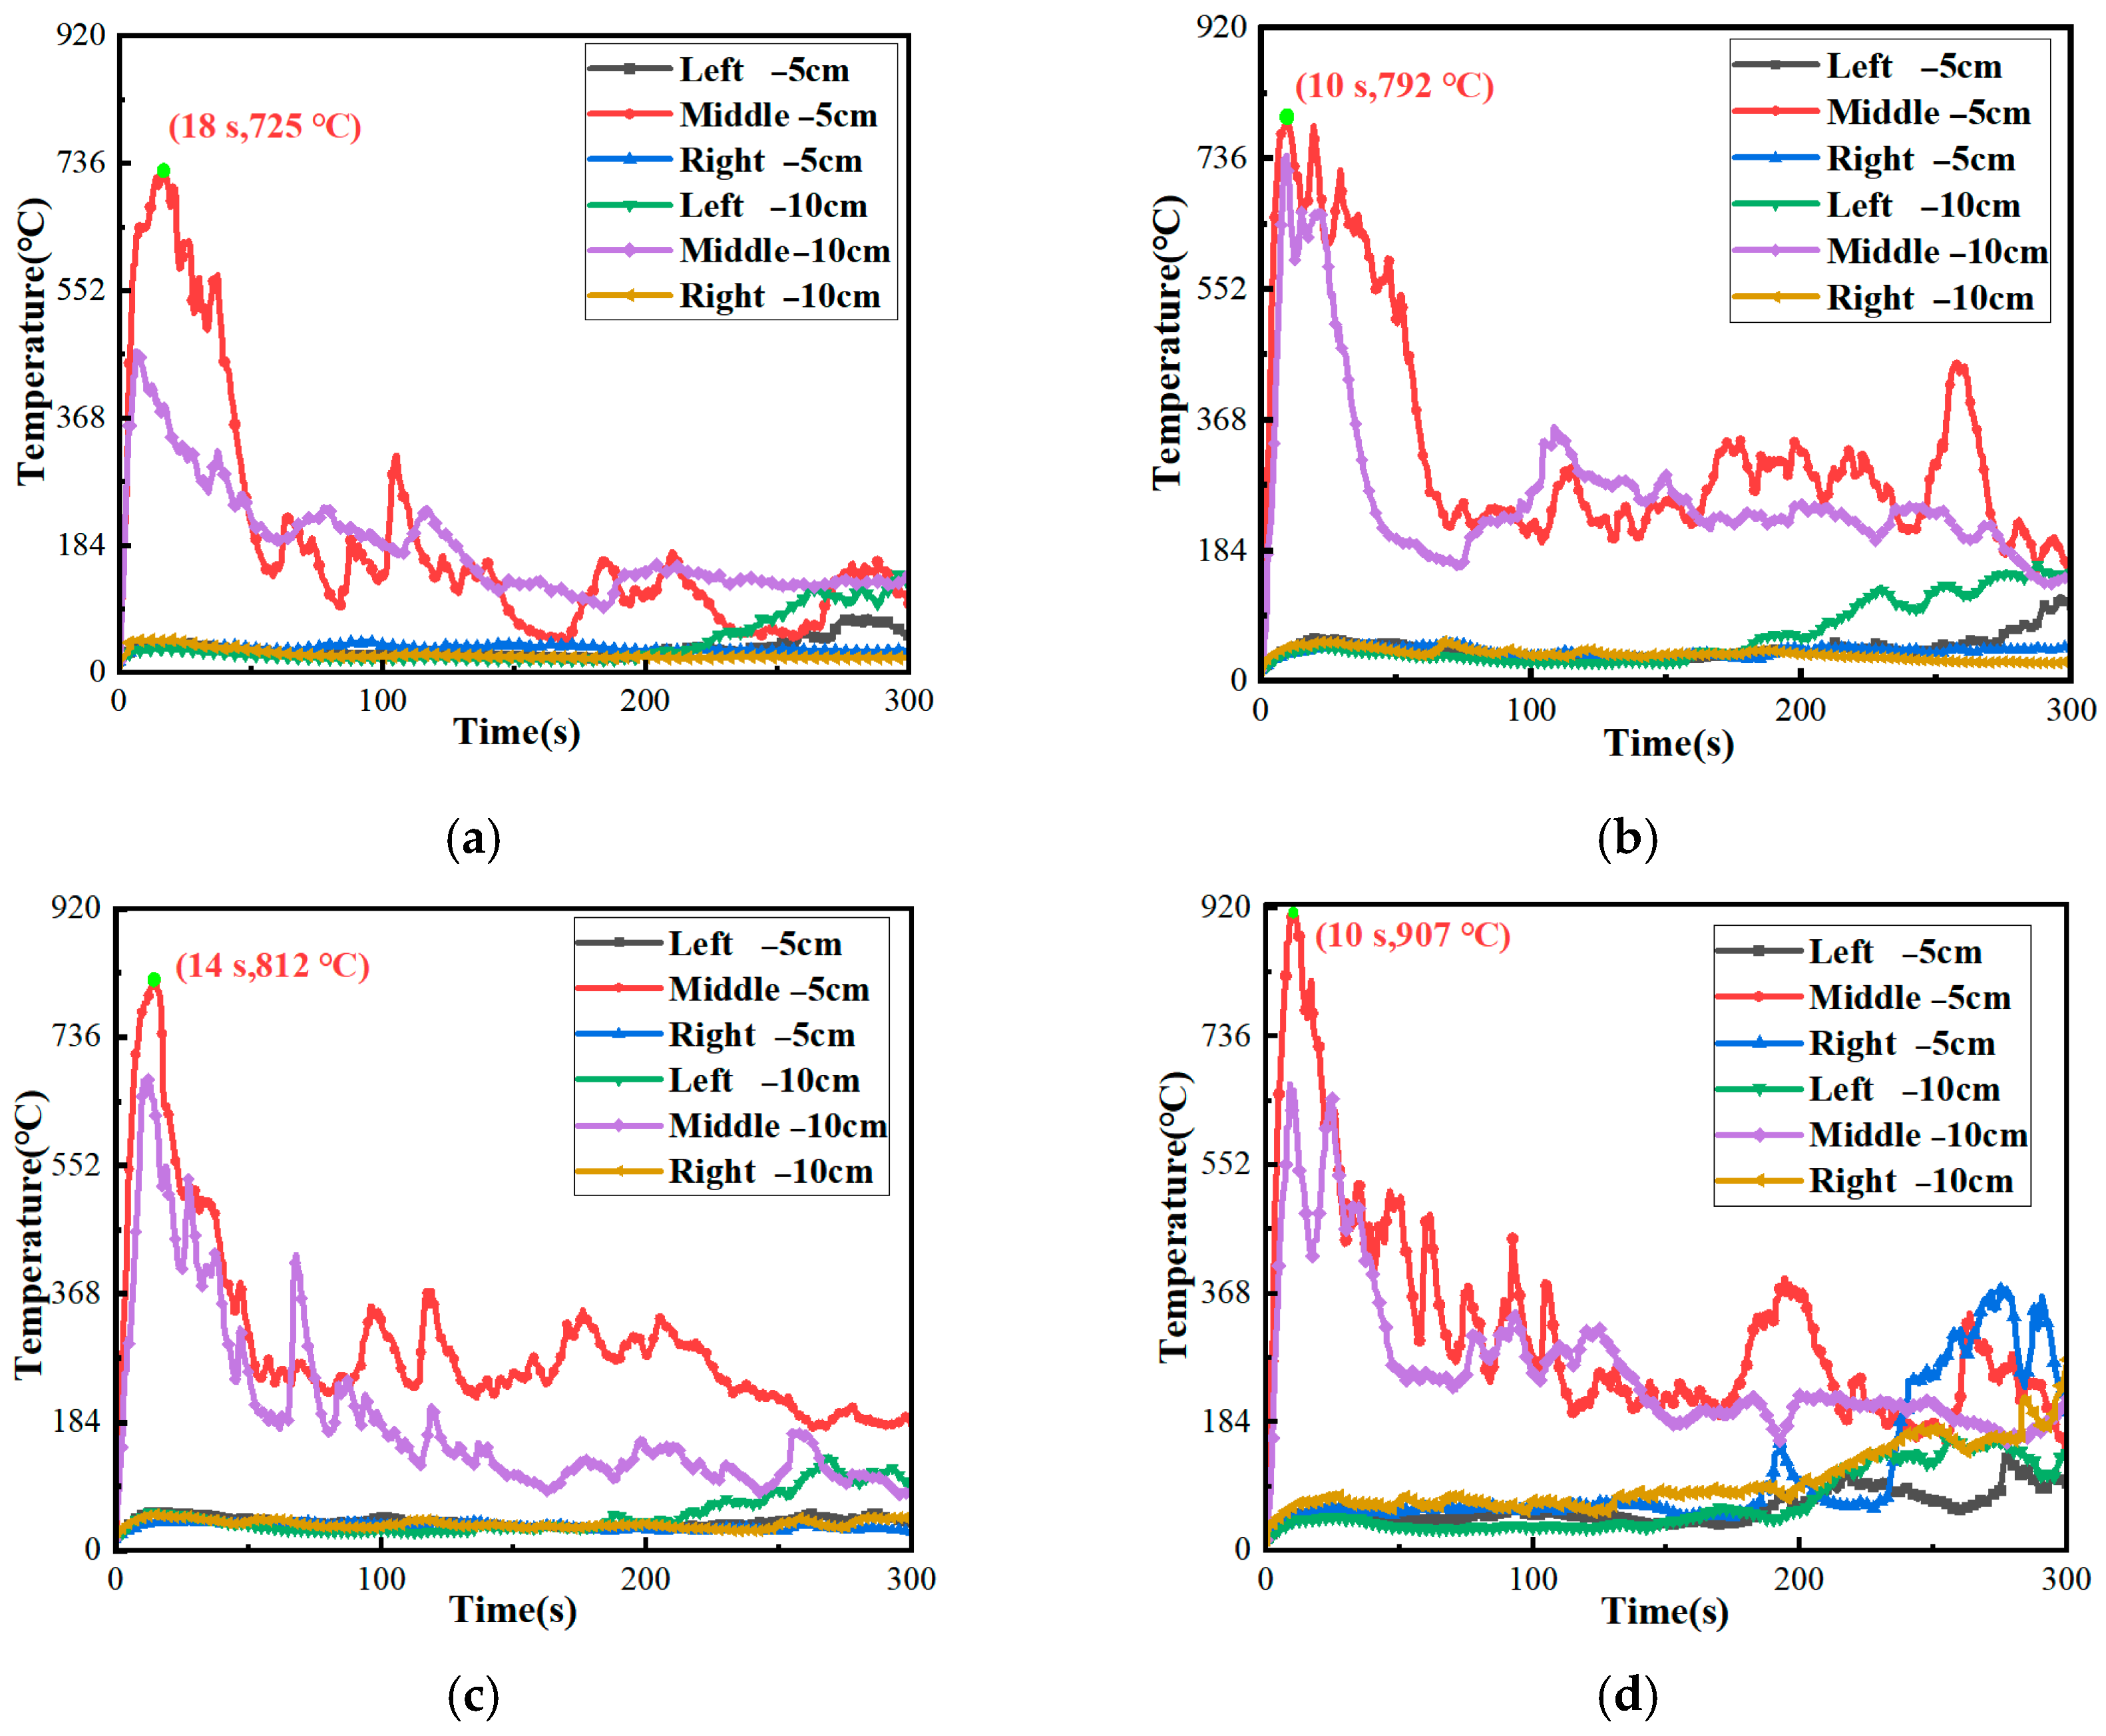
Based on the aforementioned cable ignition experiments, a cable ignition simulation model was established in FDS (2024) and a cylindrical fire source was set inside the cable model to be equivalent to the arcing process. Using numerical inversion methods, the temperature rise data from the simulated cable ignition process was compared and validated with experimental temperature rise data. The heat source parameters were gradually adjusted to achieve an equivalent simulation of the arc ignition process within dynamic fire simulations. The equivalent heat source was then used for the FDS of the cable tunnels, and the overtemperature damage to the outer sheath of the cables at various levels within the tunnel was analyzed. The damage to each layer of cables under different low-current arc fault conditions was analyzed based on this analysis.
3.1. Simulation Tunnel Model
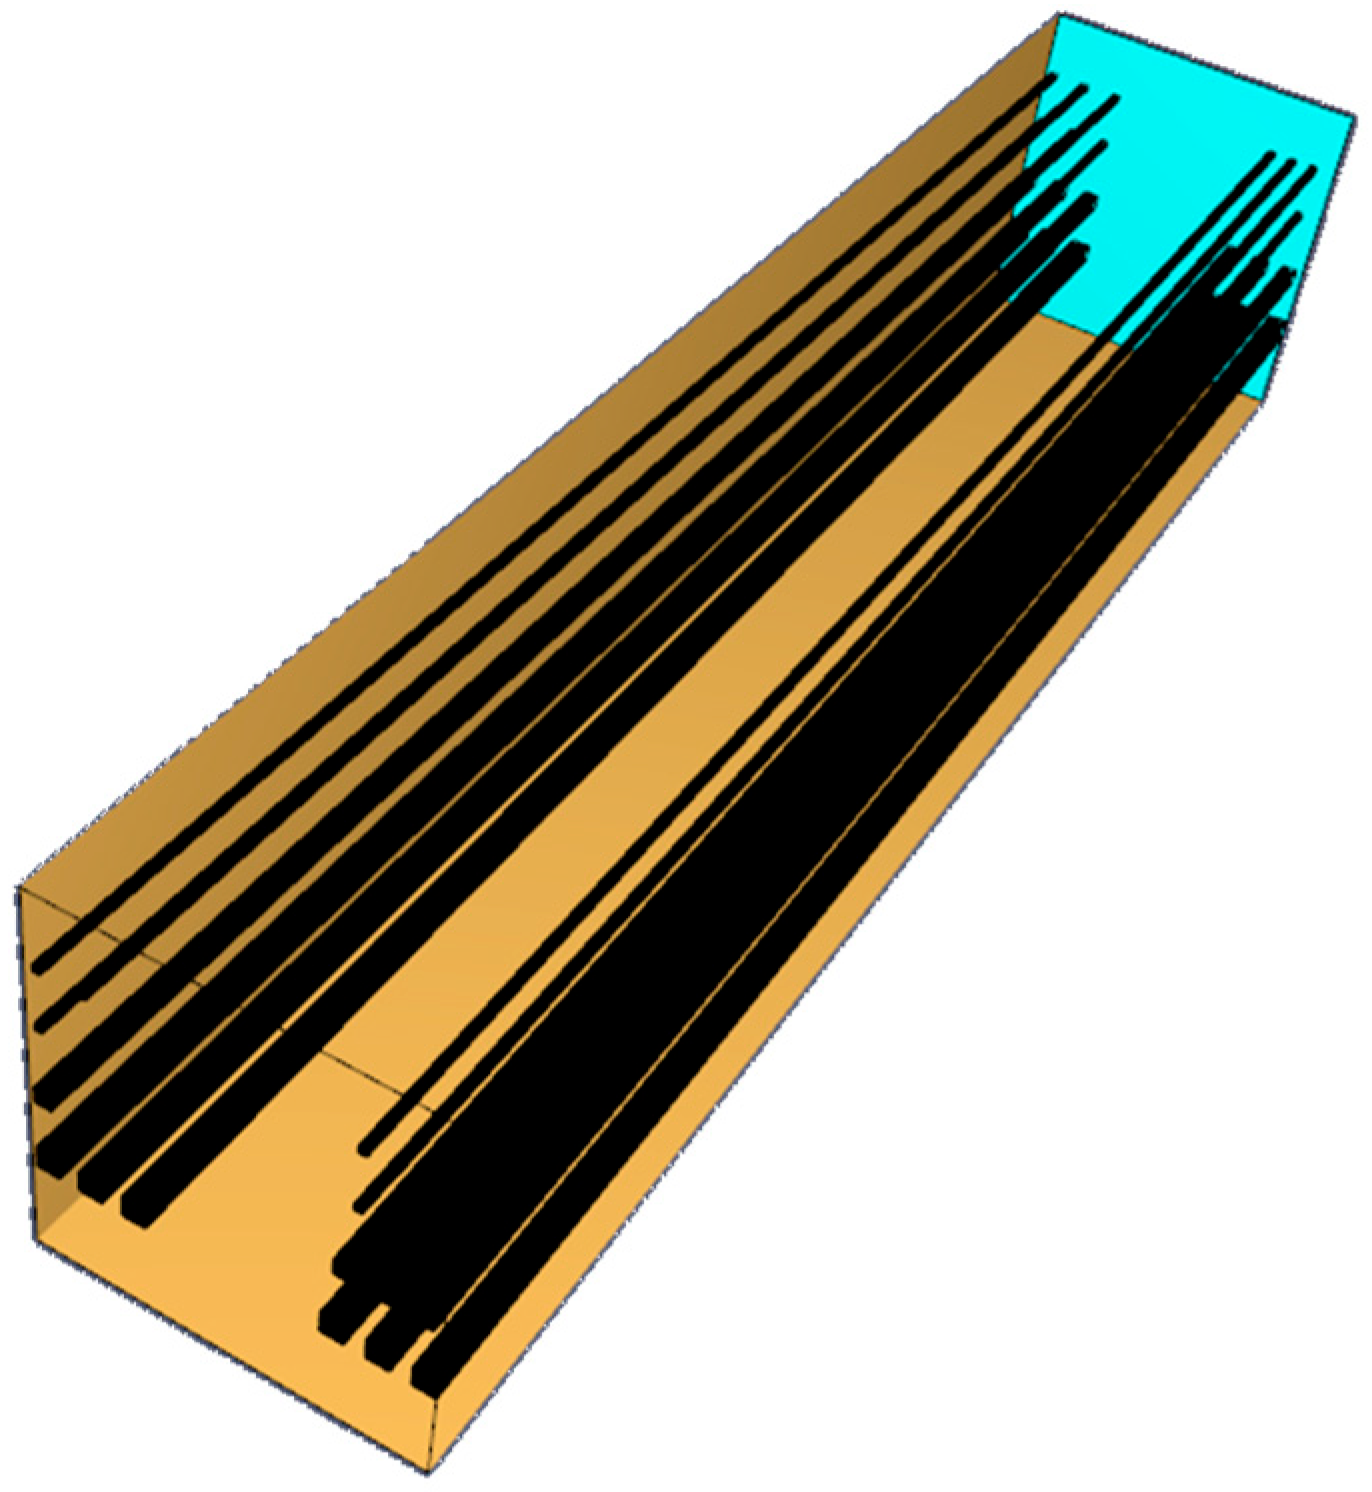
The simulation model in this study represented a 10 kV cable tunnel in a certain region. A model measuring 10 m × 2.0 m × 2.1 m (length × width × height) was established based on the actual layout of the cable tunnel, as shown in
Figure 8. A hole was placed at the midpoint of the faulty phase cable, 5 m from the fault point, to simulate the fault arc ignition process. A cylindrical heat source was positioned inside the hole to represent the arc. The hole diameter was set to 1 cm, and the fire source diameter was 0.5 mm. Thermocouples were arranged on the surface of the outer sheath of the cables in the tunnel to measure the temperature changes during the fault. Then, the cable damage was analyzed. Additionally, both sides of the tunnel were set as open boundaries to allow free airflow, with an ambient temperature of 20 °C and the remaining boundaries of the tunnel were assigned the thermal–physical properties of concrete. Because the 10 kV cable mainly generated arcs in the insulation layer, the outer sheath of the cable was removed in both the test and simulation. Thus, the 10 kV cable model consisted of a simplified two-layer structure: the copper core and the insulation layer. The material parameters for each layer of the cable were shown in
Table 4. A combustion reaction was applied to the insulation layer, and the arc duration was selected based on the experiment. Additionally, the simulation time was set to 120 s.
A simulation region of 20 cm × 5 cm × 20 cm was established, based on the dimensions of the test cable. The mesh size was set to 1 cm × 1 cm × 1 cm in the areas around the holes in the non-primary combustion zone. For the combustion region, the mesh size was adjusted according to mesh sensitivity analysis and the empirical value of the mesh size was between 1/4 and 1/16 of the characteristic flame diameter, with a suitable range for application being 1/8 to 1/12. According to the sensitivity requirement formula of McGrattan et al. [
21], the accuracy of the mesh depends on the power of the fire source. The characteristic flame diameter,
D* [
22], was calculated using Equation (1):
where
Q represents the heat release rate of the heat source in kilowatts (kW);
is the air density, taken as 1.2 kg/m3;
is the specific heat capacity of air, taken as 1 kJ/(kg·K);
is the ambient air temperature, taken as 293 K;
g is the gravitational acceleration, taken as 9.81 m/s2.
The calculated mesh size range was approximately 3.2 mm to 4.8 mm, based on the characteristic parameters of the heat source. The model dimensions should be multiples of the mesh size, placing the model at the mesh boundaries to improve the model’s accuracy. Therefore, the entire combustion region within the hole was meshed with 5 mm × 5 mm × 5 mm grid cells in this model.
3.2. Equivalent Fire Source Simulation Method
The arc discharge acted as the external heat source during the cable ignition process. The thermal process could be theoretically characterized by the equivalent fire source model. The selection of the equivalent heat source power primarily depended on the arc power. According to the principle of energy conservation, the energy input from the arc was dissipated into the surrounding environment, primarily through three modes: heat conduction, thermal radiation and convective heat transfer. Only a portion of this energy participates in the ignition of the cable’s insulation material in practice. Thus, a thermal conversion coefficient, kr, was introduced. Based on the IEEE 1584 standards, the initial value of the thermal conversion coefficient is set to 0.4 [
23]. The initial value of the fire source power was obtained by calculating the arc power and the heat transfer coefficient.
According to the ignition time of the cable under each current condition in
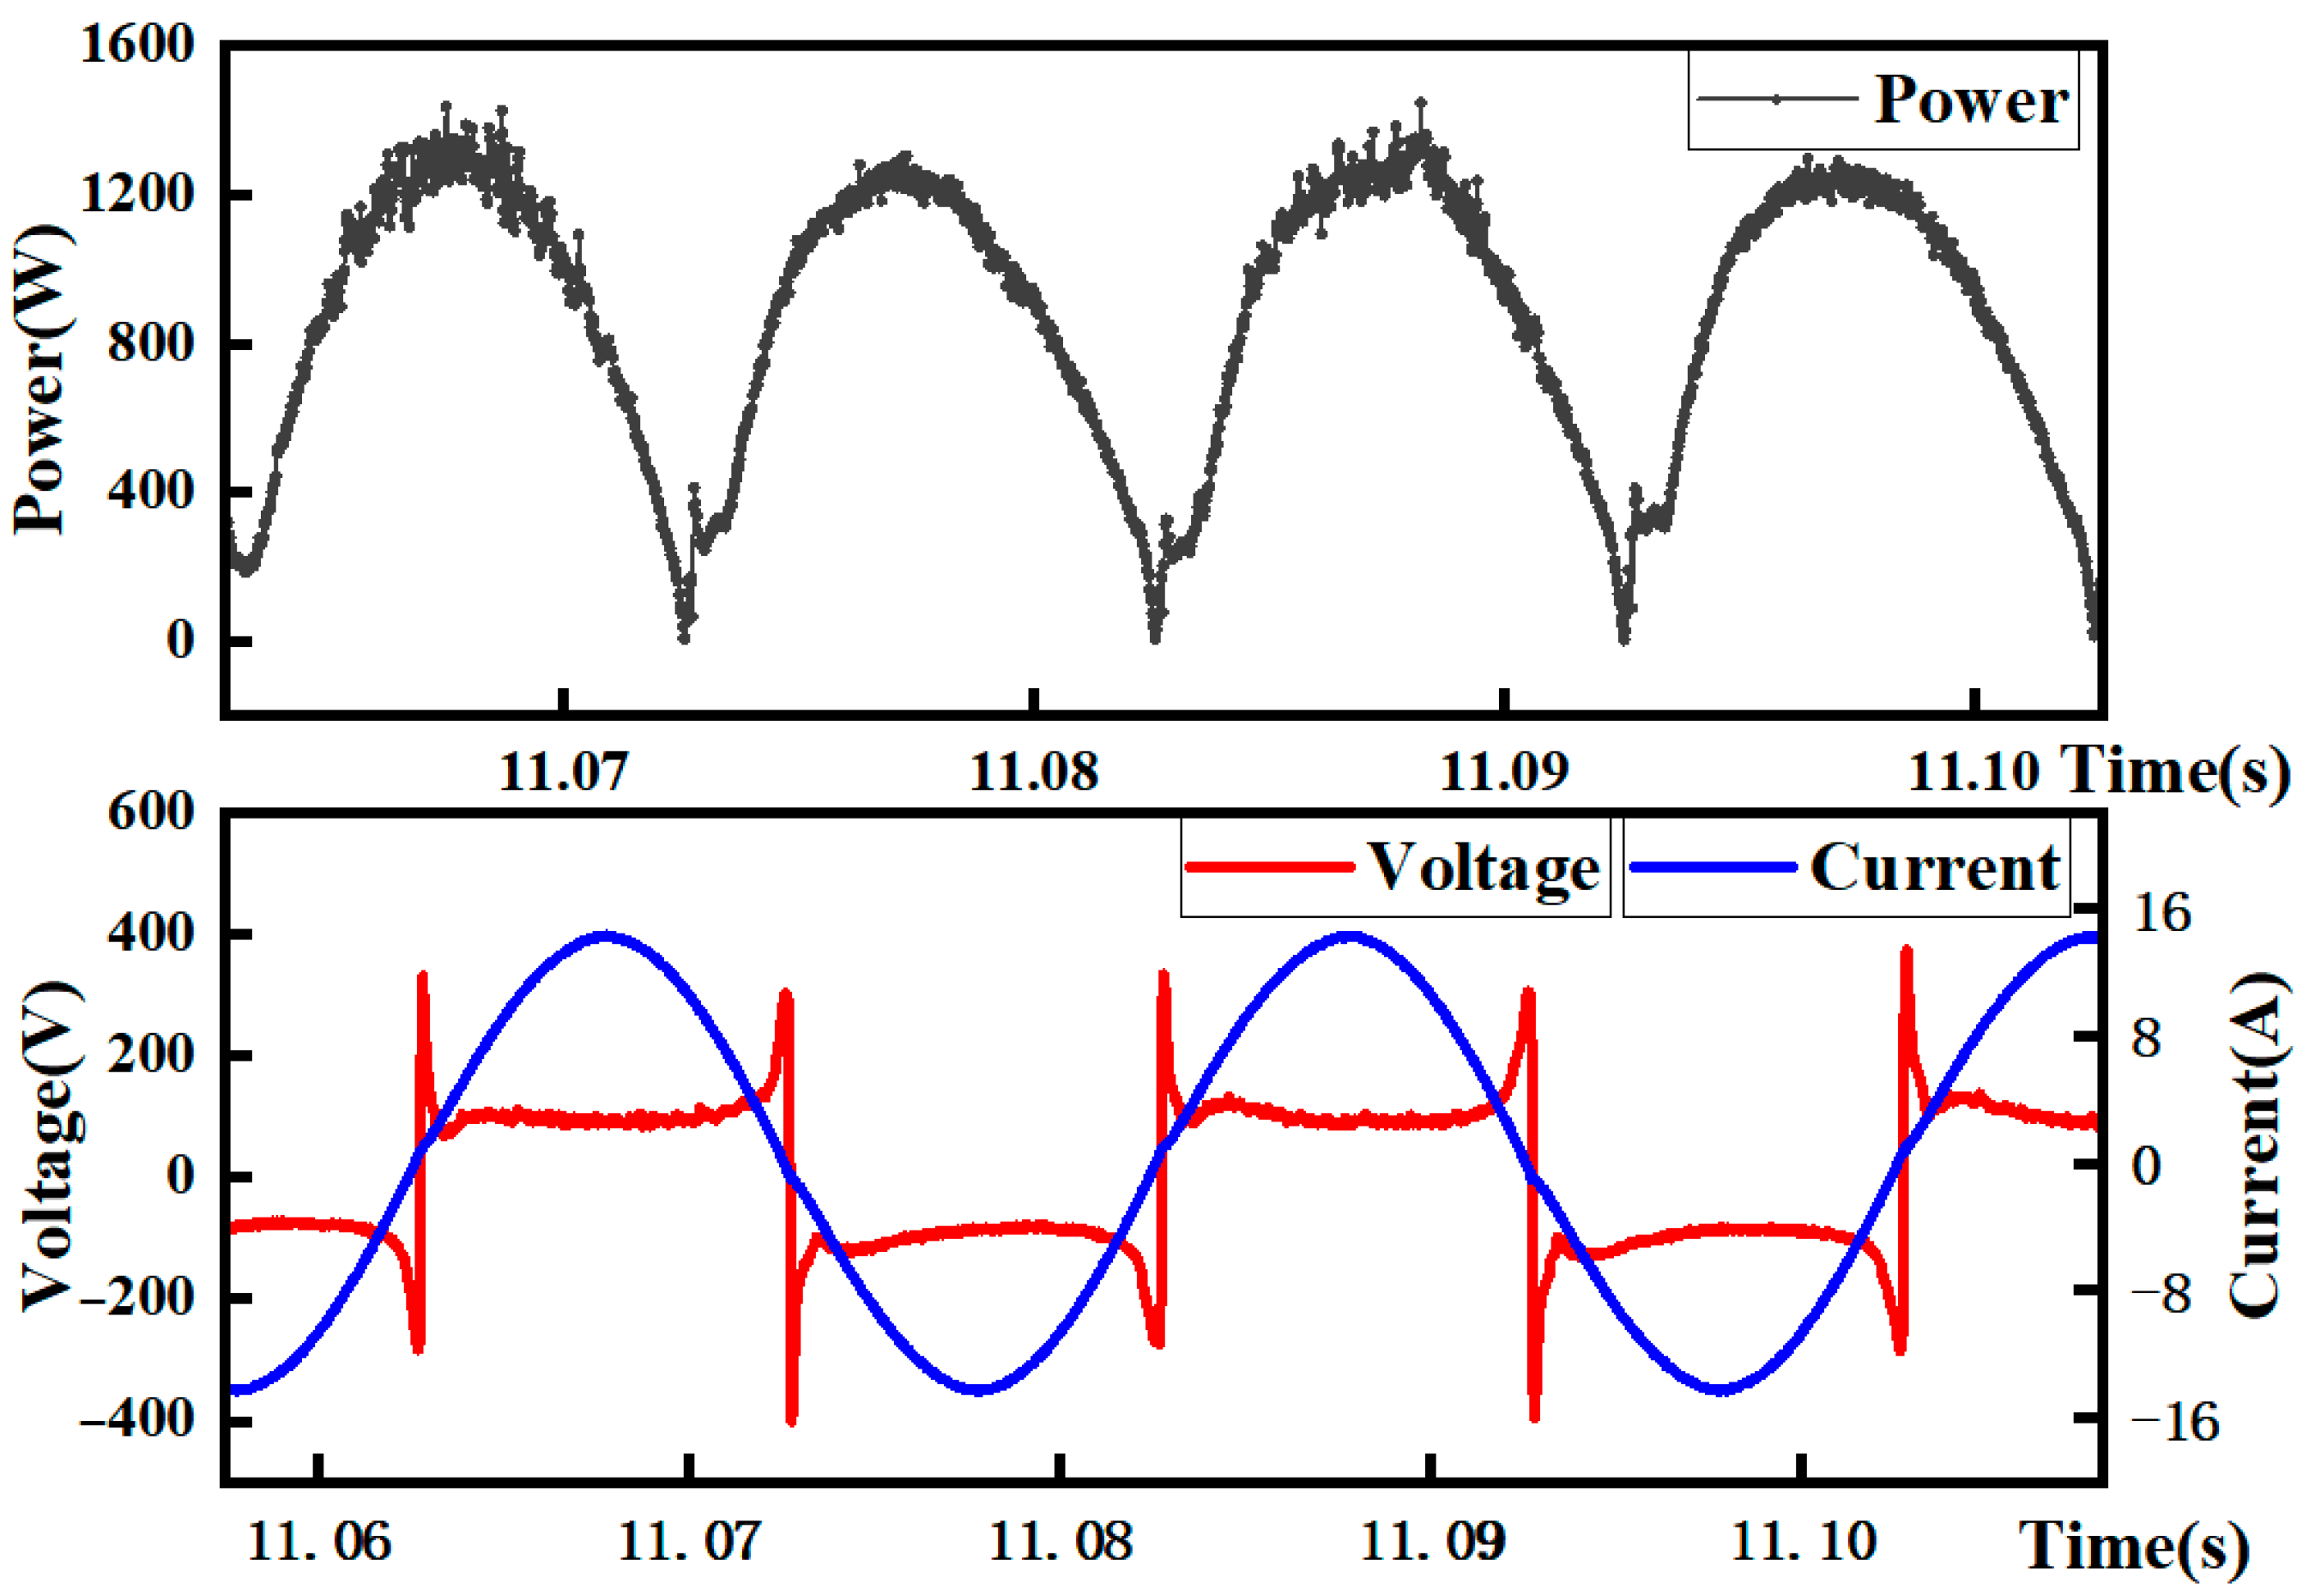
Section 2, the arc voltage and current waveforms were taken before the ignition of the cable under each current condition. The instantaneous arc power at each moment was calculated, and the instantaneous power change curve was plotted. The total energy generated by the arc from ignition to cable ignition was used to calculate the average arc power during this process by integrating the curve, which was taken as the arc power for each current condition. The 10 A condition was taken as an example. The arc voltage–current waveform and power waveform of the 10 kV cable before ignition are shown in
Figure 9. The initial equivalent heat source power for each arc condition was calculated based on this arc power and the thermal conversion coefficient of 0.4, and the results are shown in
Table 5. The initial arc powers of 4–10 A are 132 W, 192 W, 258 W and 347 W, respectively.
In the cable ignition experiment, the temperature variations in the cable combustion process under arc exposure were monitored by six thermocouples. The position of the thermocouple remained fixed. But, due to the effects of the arc, the flame height and position fluctuated frequently during the combustion process, according to the temperature curves of the ignition tests in
Section 2. The temperature at the 5 cm point, directly above the gap in the 10 kV cable’s hole, showed the most significant variation. Thus, this point was selected for the temperature rise characteristic curve during free arc combustion to serve as the validation data. By comparing it with the simulated temperature rise data, the equivalent heat source power was validated.
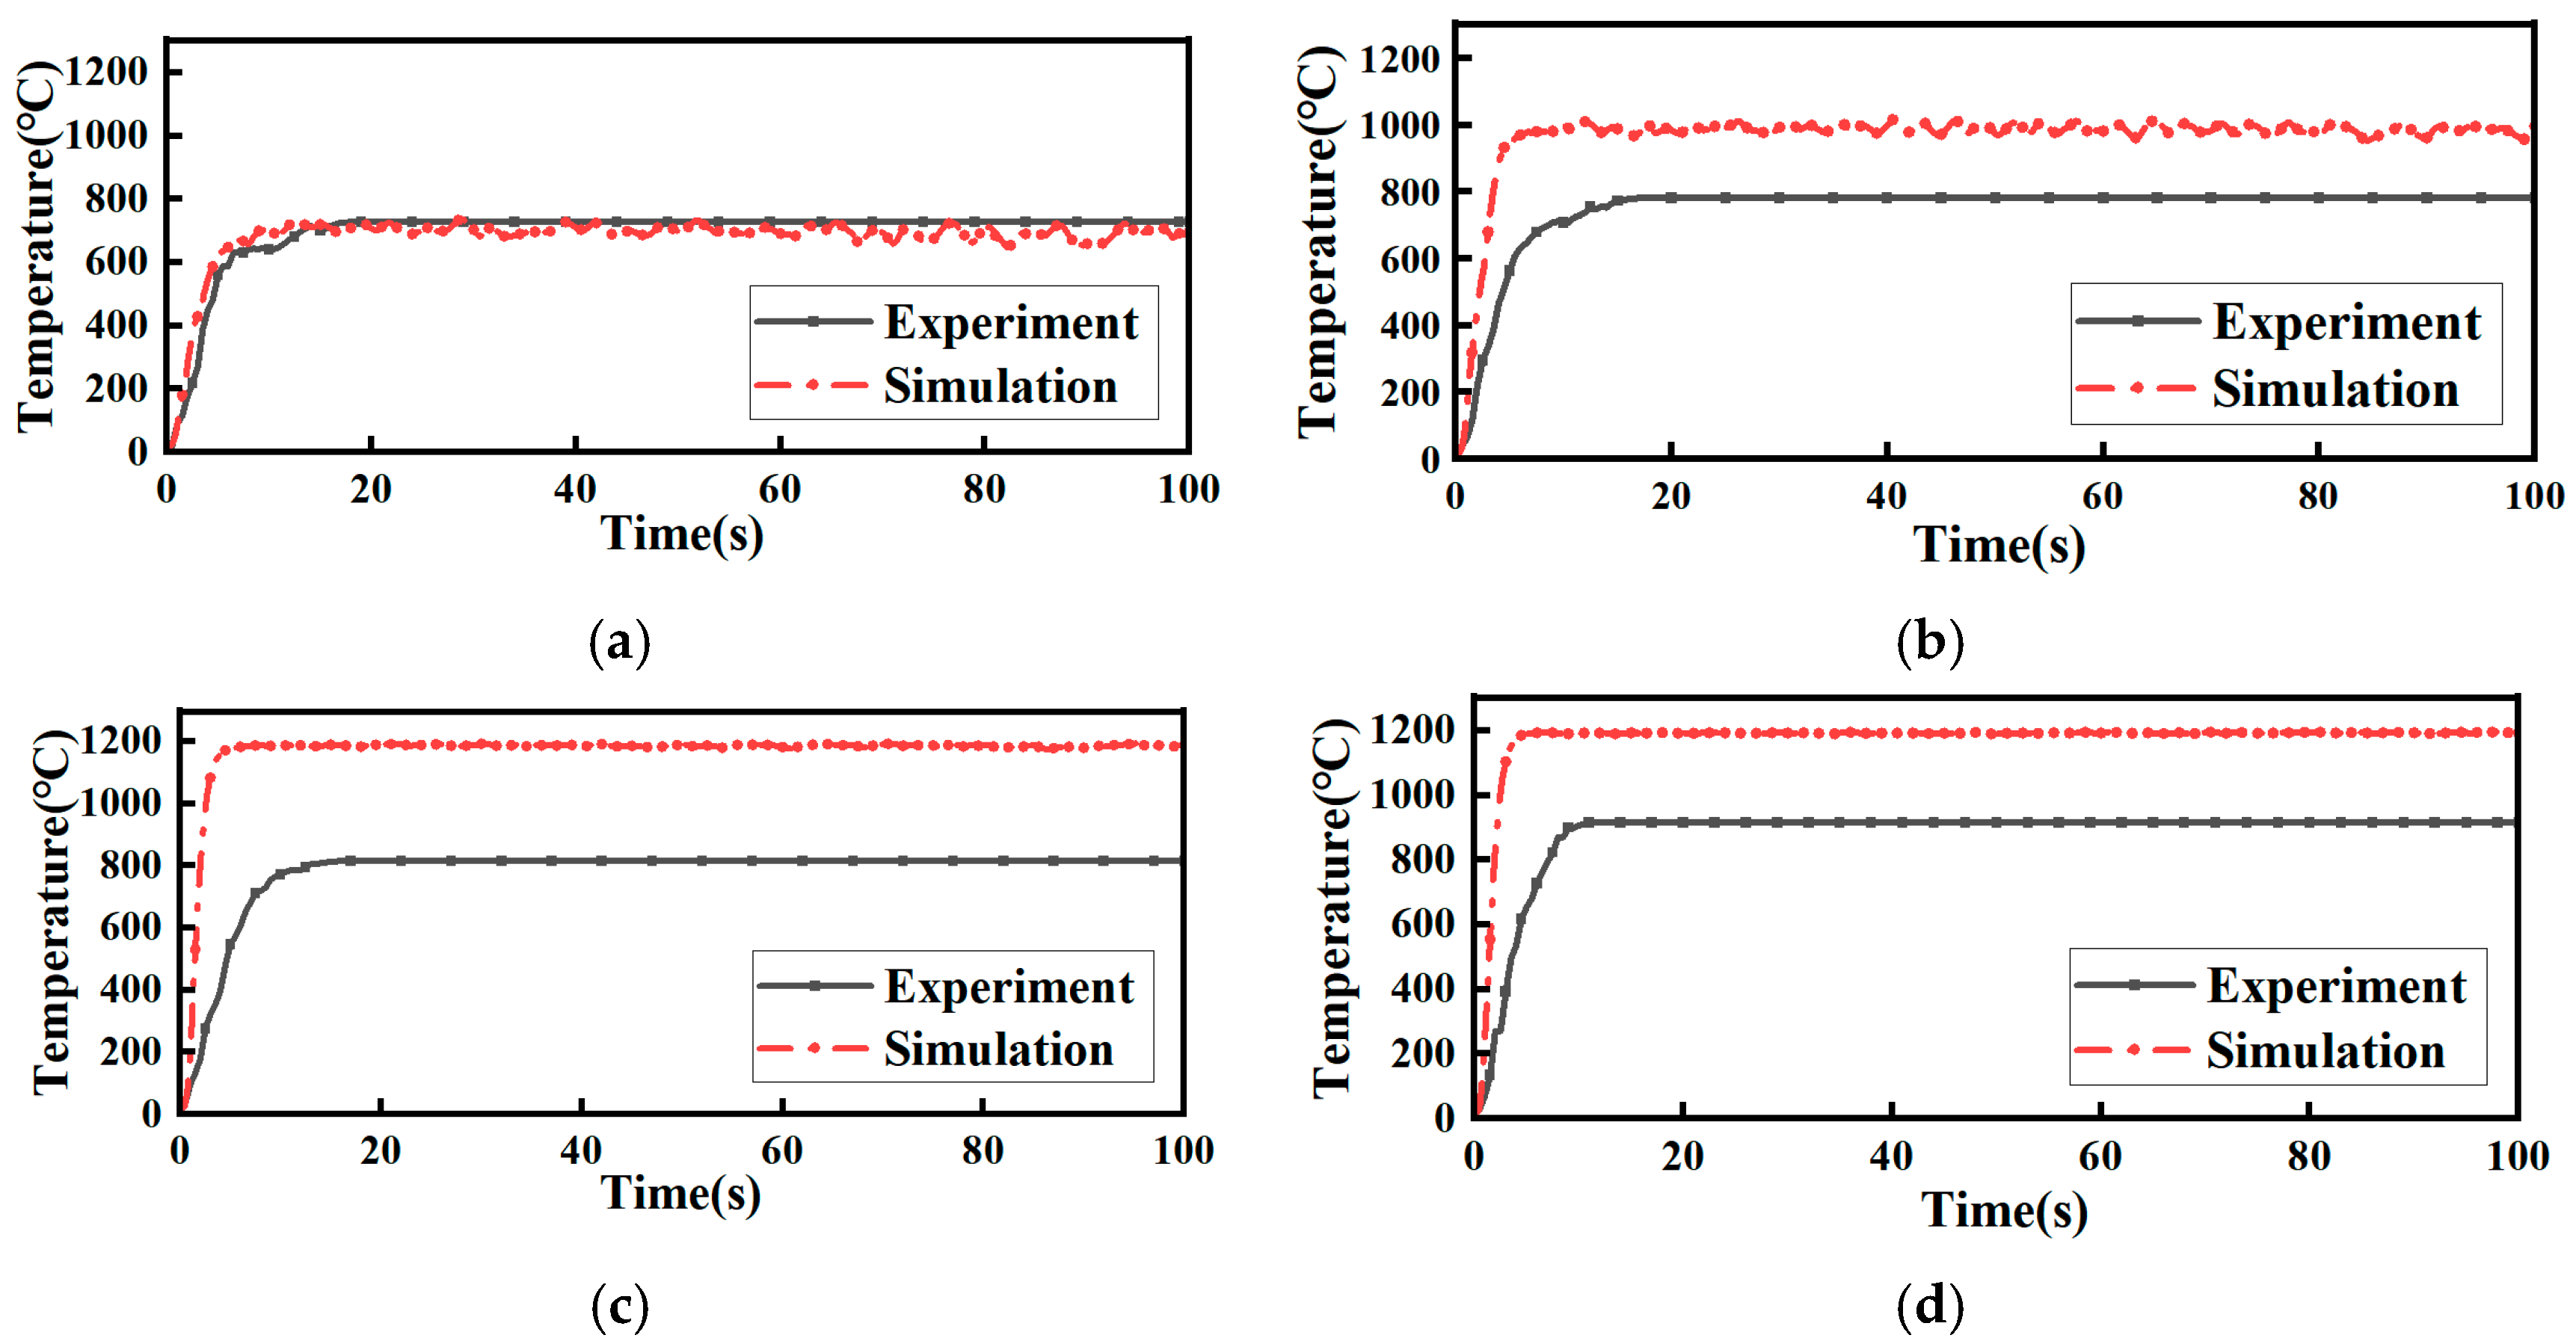
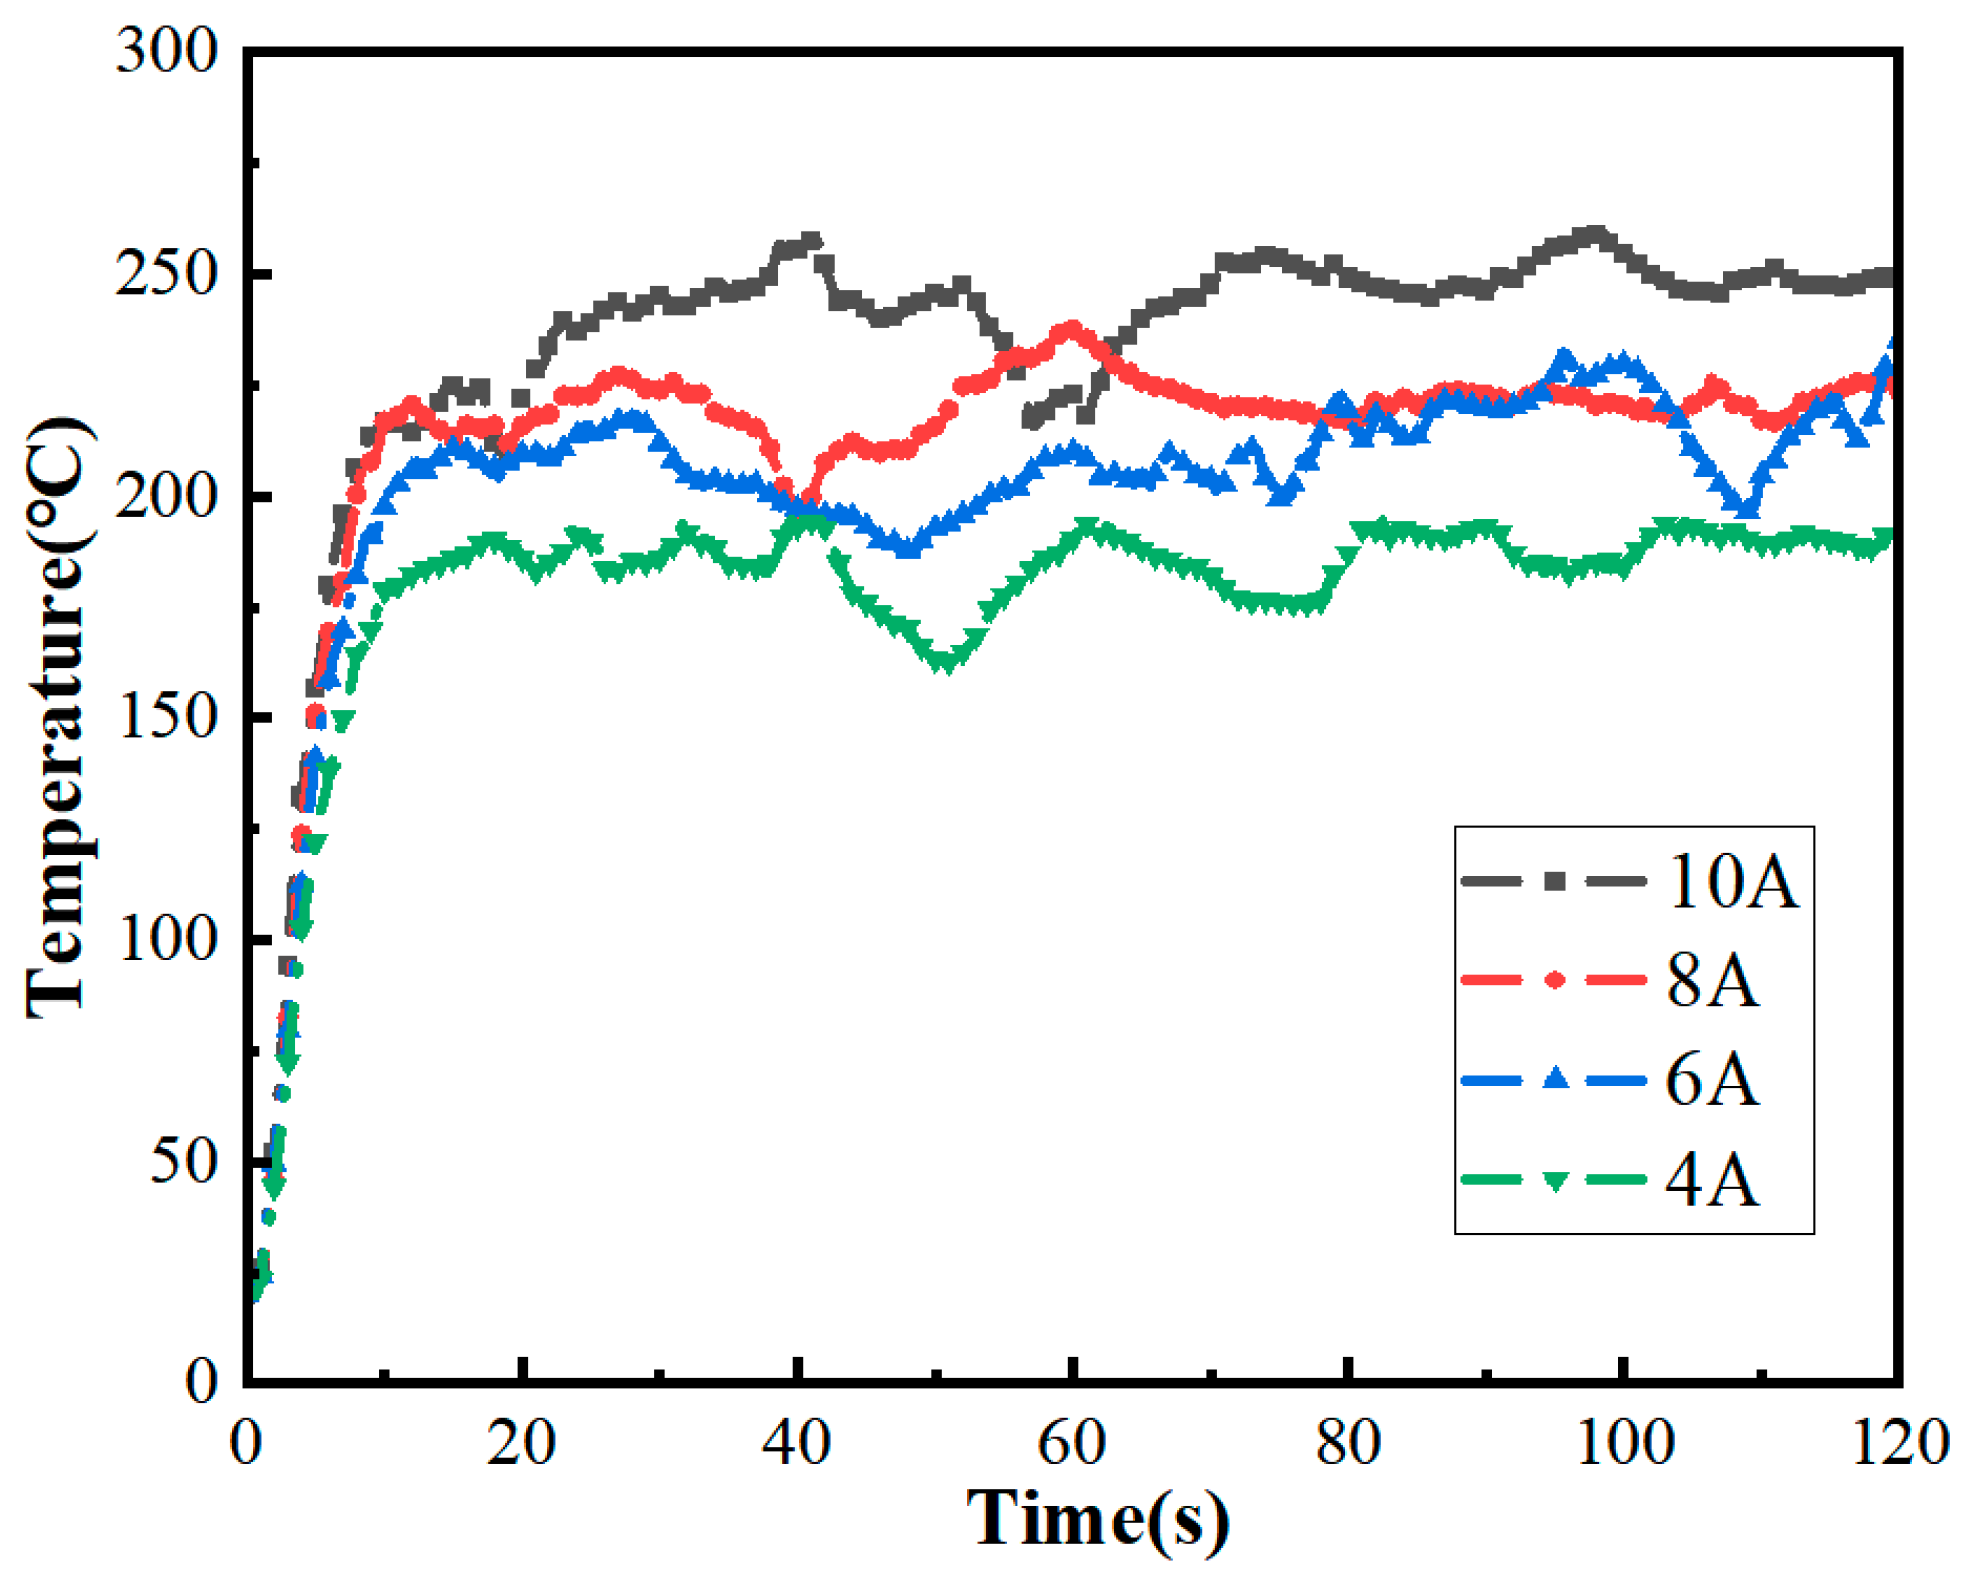
At the same time, in the simulation, once the heat release rate of the heat source reached its maximum value, the flame combustion process stabilized. This made the combination of experiment and simulation more difficult. Therefore, this study simplified the temperature-rise curve of the 10 kV cable during the arc combustion. The temperature curve would not change after reaching the highest temperature in the simulation. Firstly, the numerical simulation of the cable ignition process was carried out according to the fire source power that was calculated when the heat transfer coefficient was 0.4. The temperature rise data of cable combustion obtained by simulation were compared with the experimental data, as shown in
Figure 10. The results show that under the condition of 6–10 A, the combustion temperature of the cable measured by the simulation was higher than that of the test data, by using the equivalent fire source power of 0.4 heat transfer coefficient.
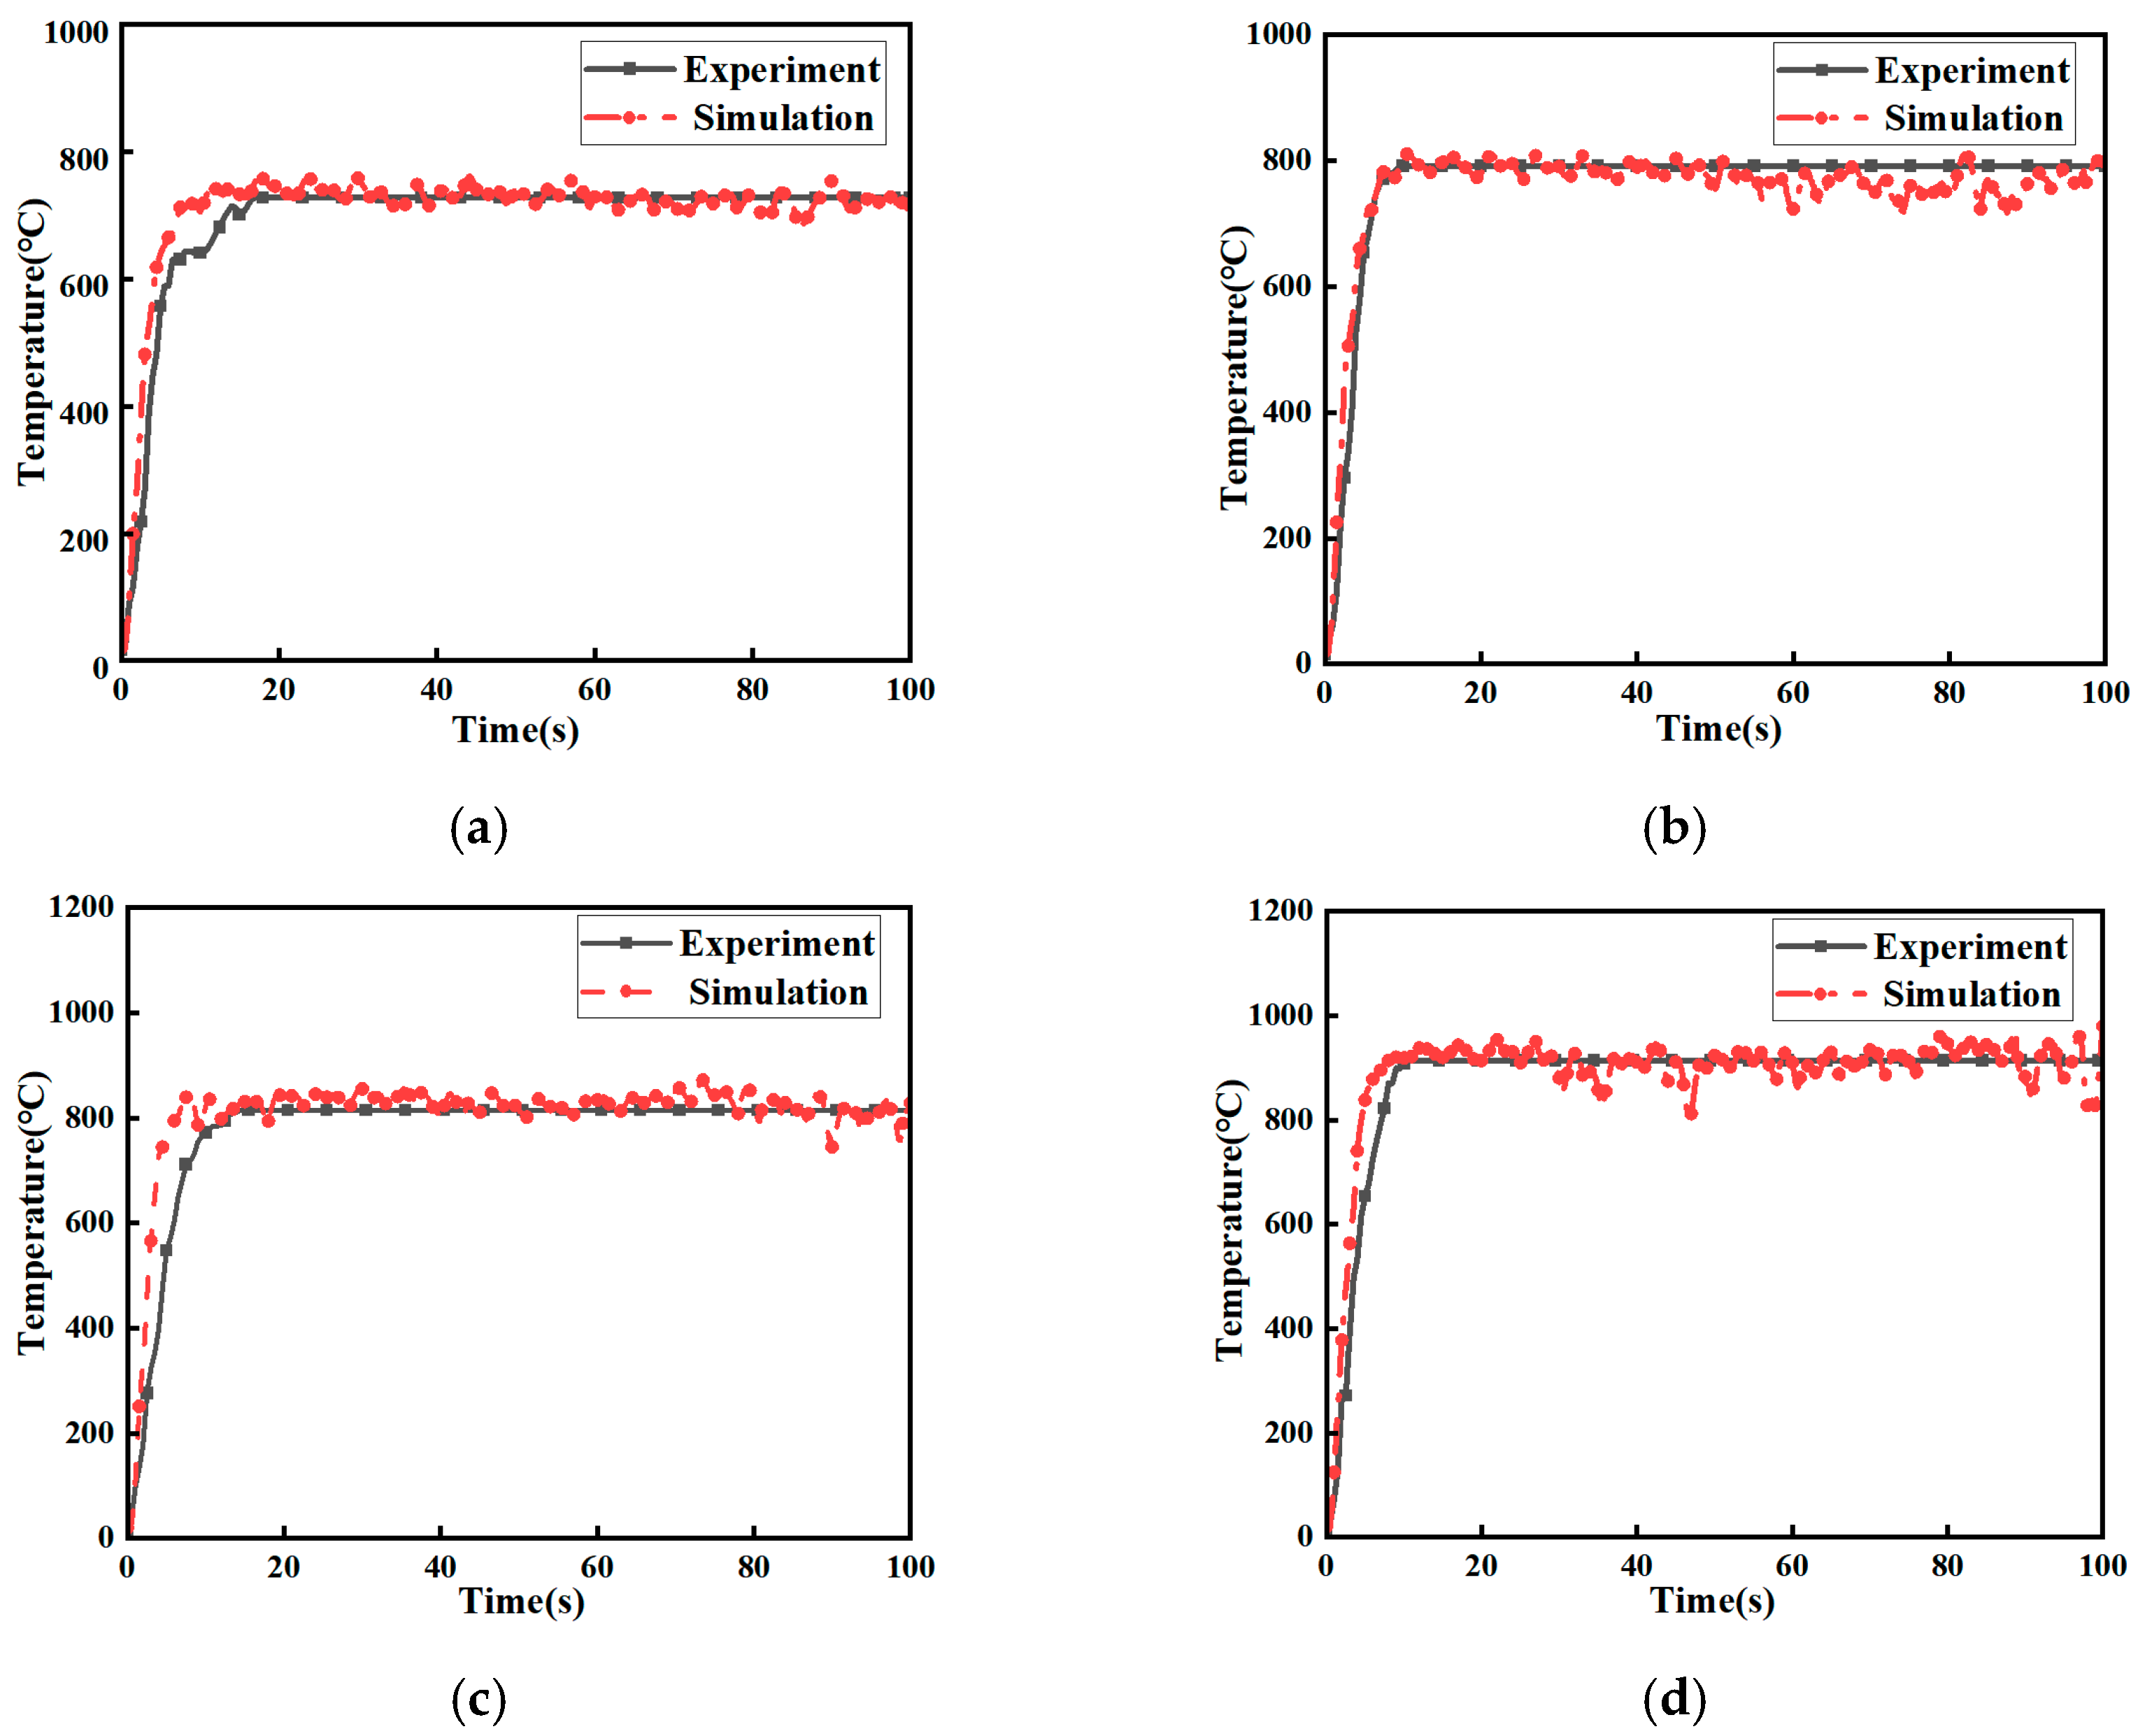
Secondly, to enhance the equivalency of the fire source to the arc ignition process in the cable during simulation, the heat conversion coefficient and fire source power were gradually adjusted, based on the temperature rise data from both the simulation and the experiment. This process continued until the maximum temperature value after the temperature rise stabilized closely matched the experimental data. After adjusting the equivalent fire source power for the 10 kV cable’s small-current arc, a comparison between the simulation and experimental temperature rise data for the four arc conditions was carried out, as shown in
Figure 11. Because the ignition process of the 10 kV cable developed rapidly in the test and the temperature-rise time was short, the default heat-release rate of 1 s was adopted in the simulation model.
Finally, the improved and adjusted heat conversion coefficient and equivalent fire source power were shown in
Table 6. The results showed that the heat conversion coefficient of the 10 kV cable under 4–10 A arc conditions decreased with the increase in the arc current, which corresponds to 0.41, 0.31, 0.24 and 0.2, respectively. The reason was that the energy was concentrated in the insulation gap in the ignition experiment. With the increase in current, the arc gap energy and arc power increased, and the energy accompanied by arc ignition and ejection accounted for a large part in the conservation of energy. As the current increased, the proportion of this part increased. At this time, the energy that could actually cause the cable to burn would be reduced accordingly [
24]. Therefore, kr decreased with the increase in current. However, the equivalent fire source power still increased with the increase in current and the equivalent fire source powers under the four arc conditions of 4–10 A were 136 W, 150 W, 154 W and 173 W, respectively.
3.3. Temperature-Rise Characteristics and Damage Analysis of Adjacent Cables
The cable tunnel model is shown in
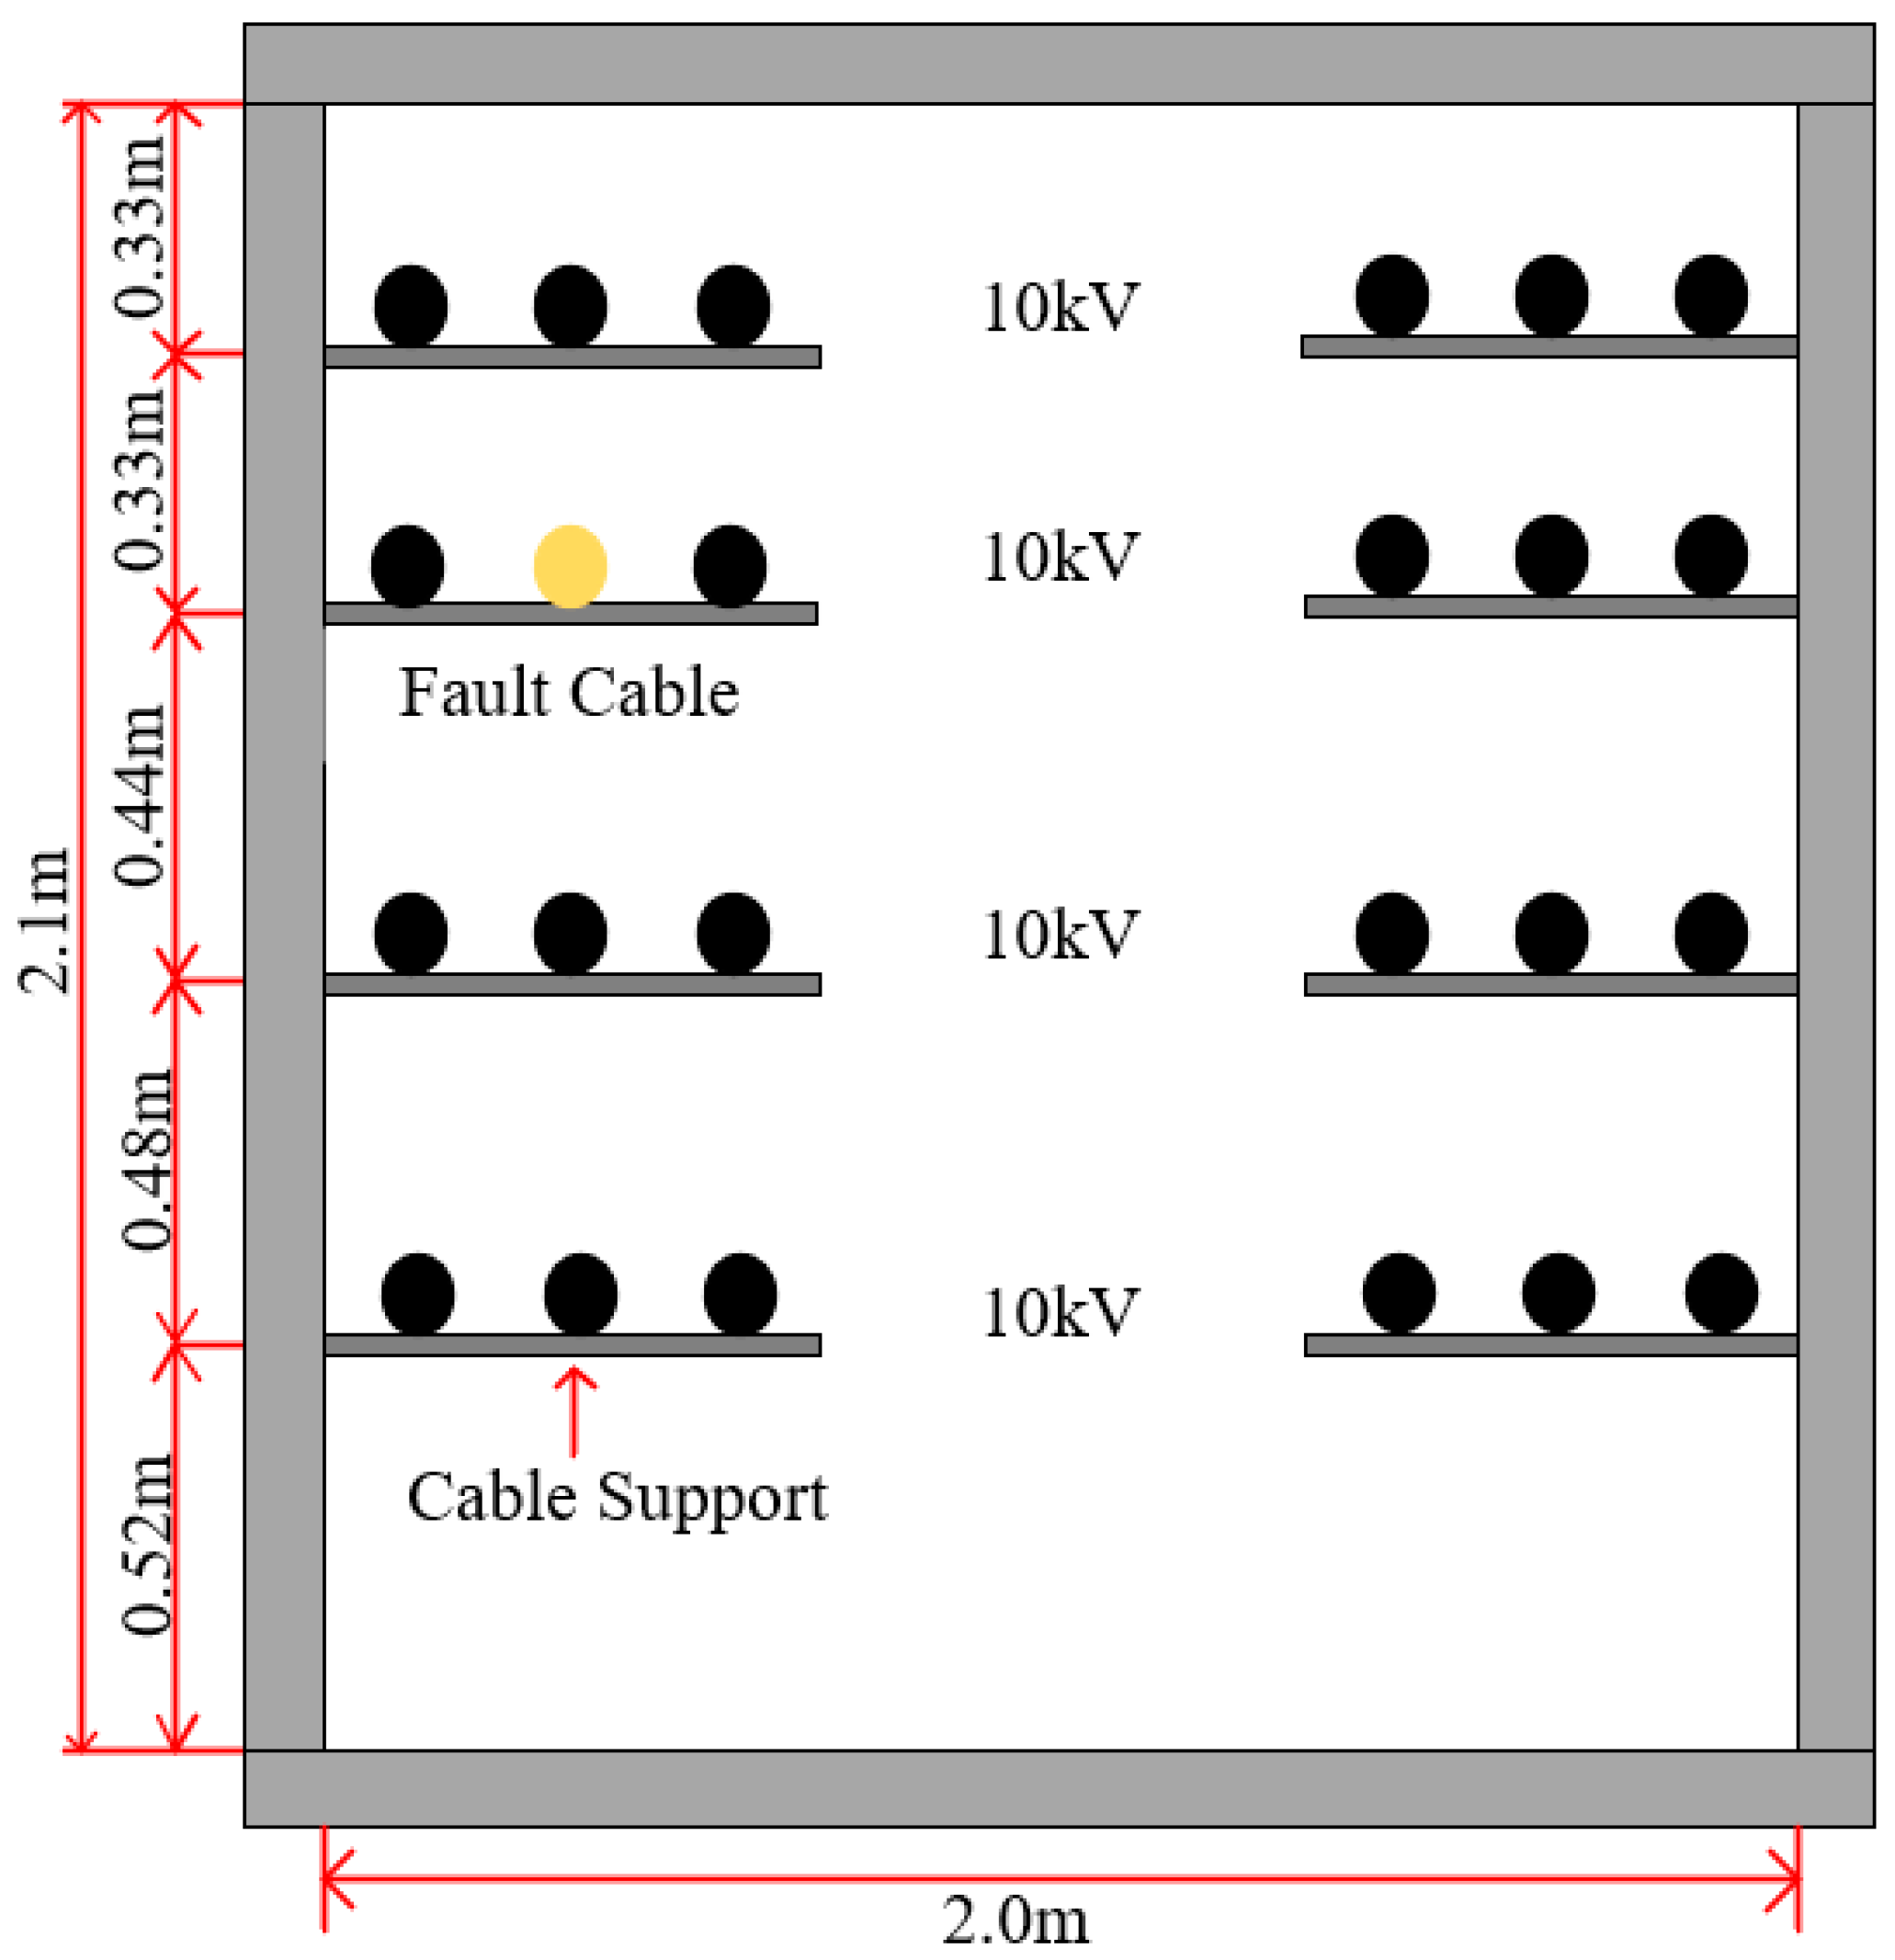
Figure 8. The actual cable tunnel layout was used as a reference. The internal layout of the cable tunnel is shown in
Figure 12, and the 10 kV fault phase cable was set in the third layer of the intermediate phase. The equivalent fire source power under the 4–10 A current conditions obtained in
Table 6 was the equivalent fire source power of the fault phase cable.
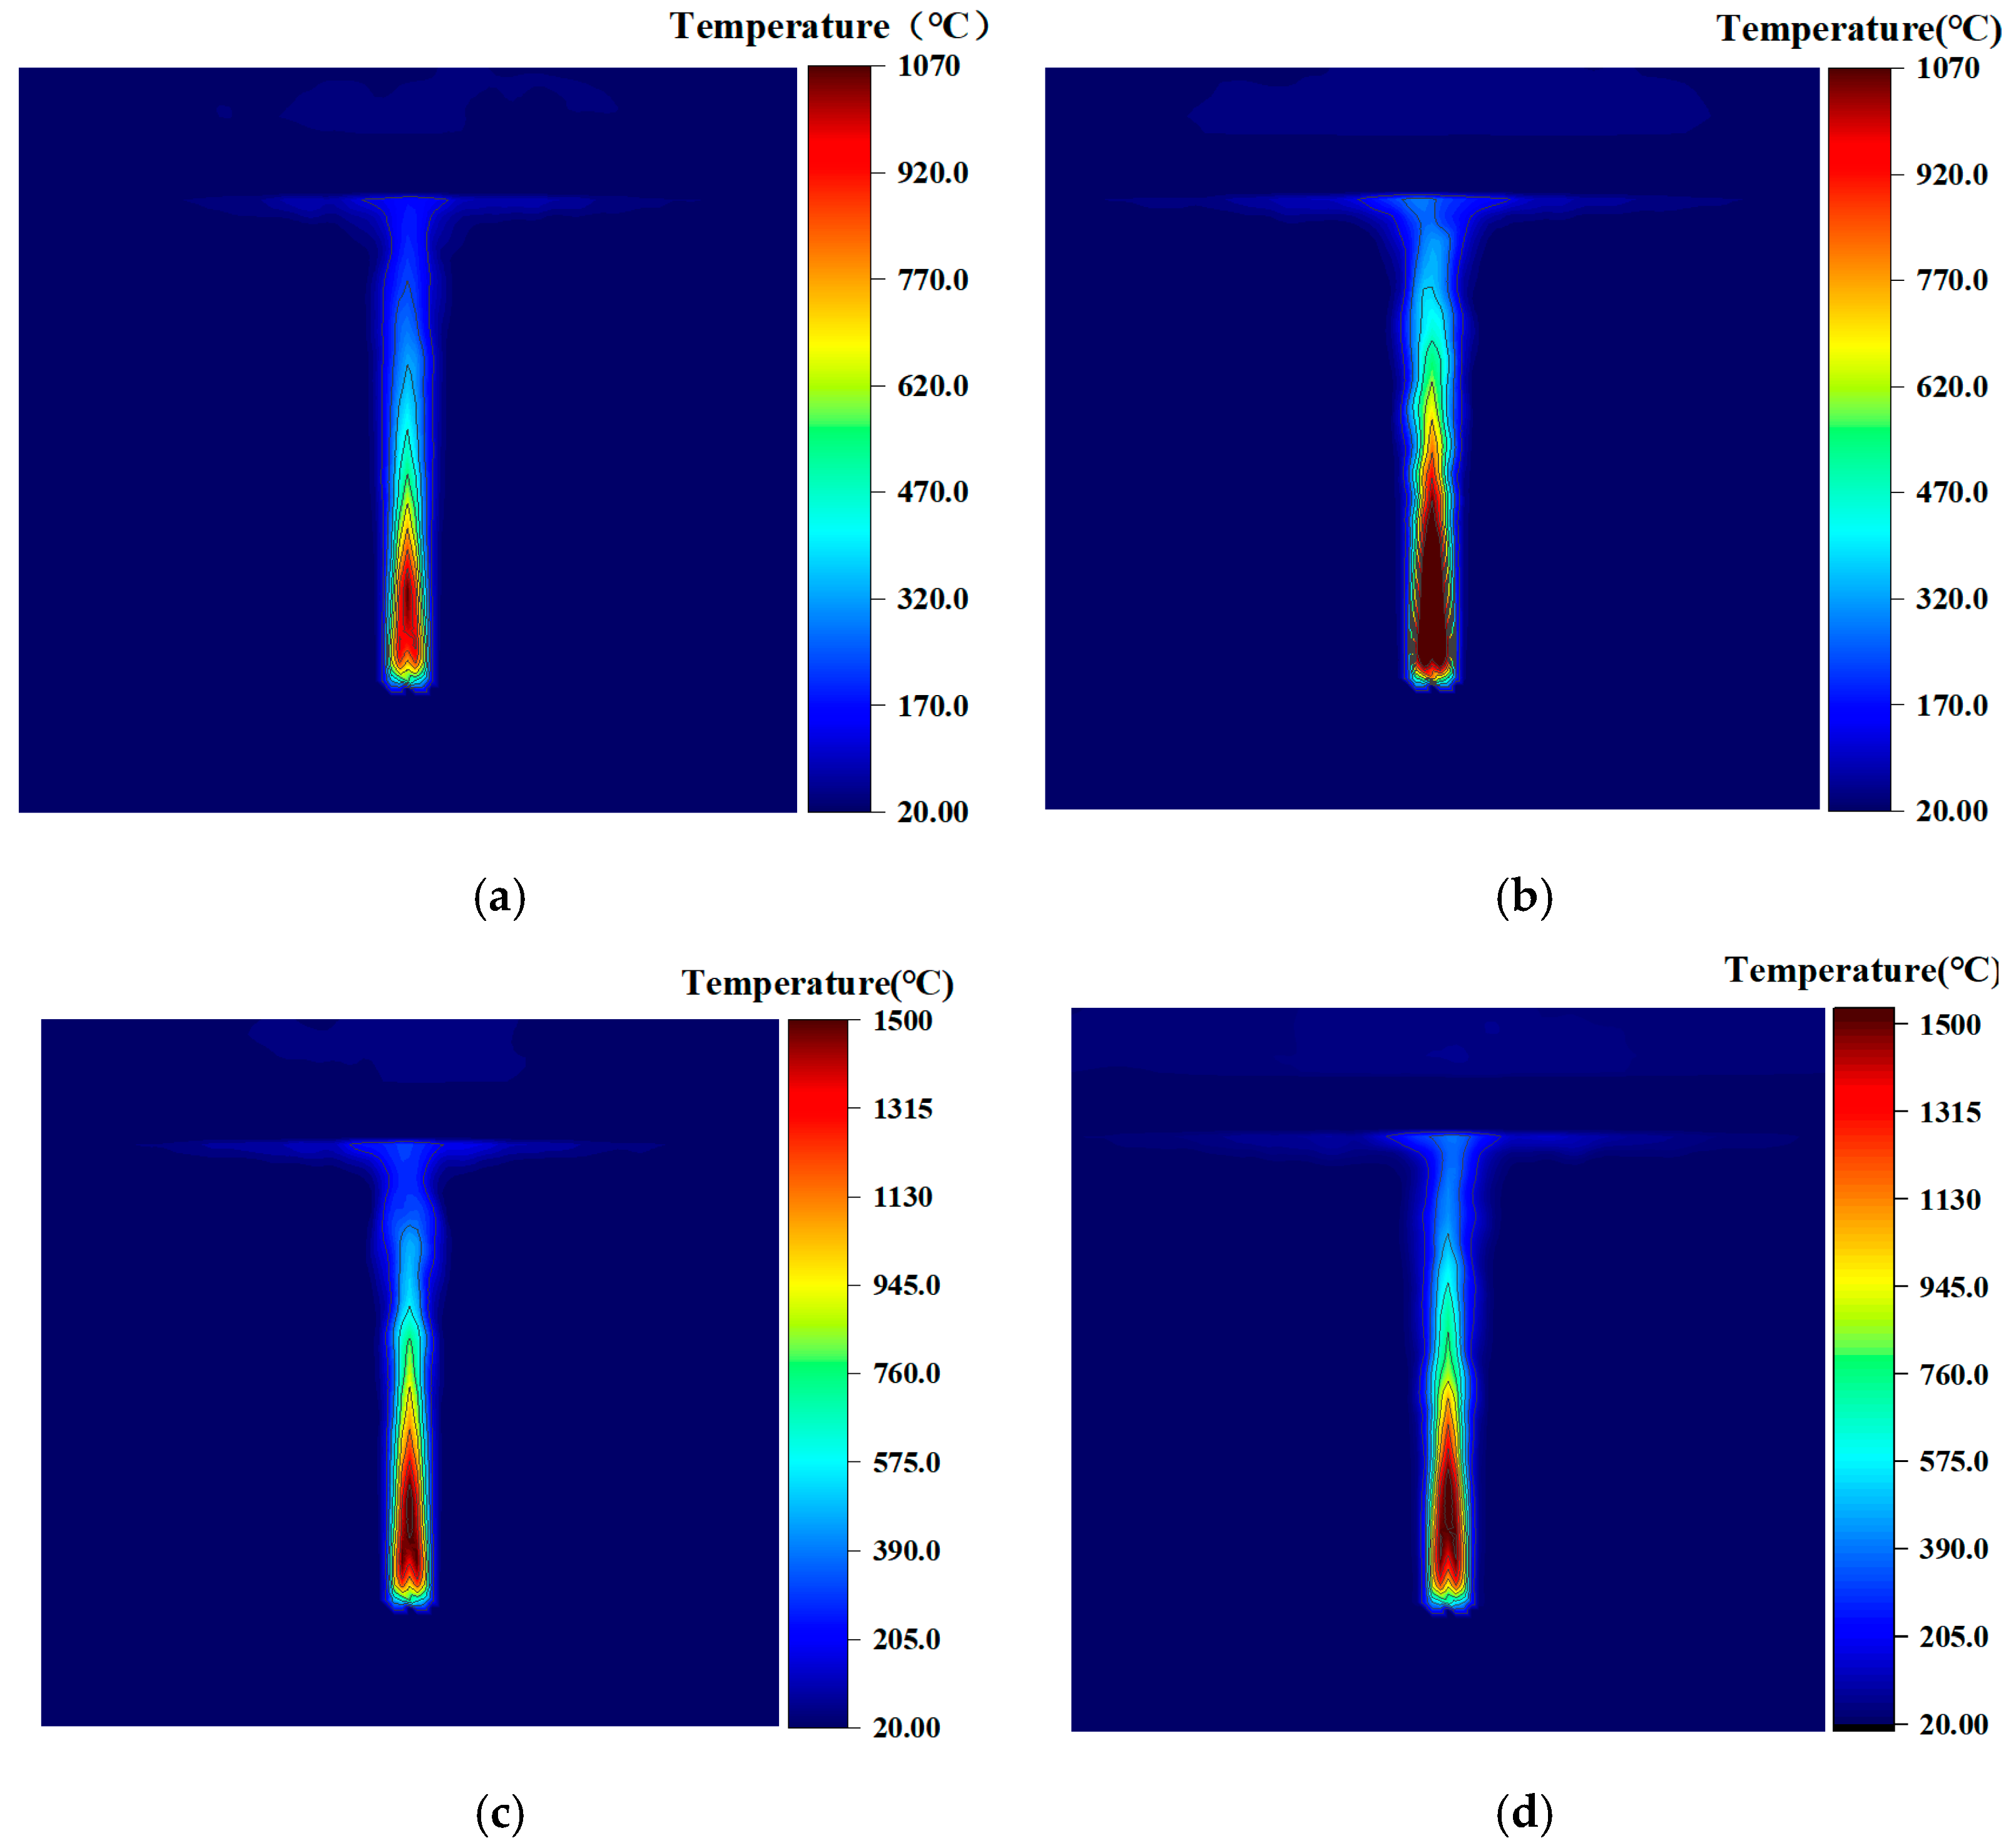
The 10 kV cable in the third layer of the intermediate phase was ignited by an arc fault. The range ignited by the arc was concentrated around the insulation breakdown position because the breakdown fault point was small. Thus, the surface temperature rise in the cable’s outer sheath on the first and second layers and the adjacent phase cable outer sheath on the third layer were at a low temperature and did not pose any damage. However, the flame developed upward during the combustion process of the fault cable. The hot gas generated by the combustion flowed upward. Therefore, the surface temperature of the cable’s outer sheath, located on the upper layer of the fault point, rises significantly. The temperature distribution of the upper cable outer sheath of the 10 kV fault-phase cable is shown in
Figure 13. The temperature distribution of the arc fault cable combustion in 4–10 A is shown in
Figure 14. The results show that the temperature of the outer sheath of the cable directly above the fault cable is more than 200 °C.
The data of cable ignition characteristics obtained from the experiment is shown as follows. The arc could exist for a long time after the burning of the 10 kV cable under the action of the arc. However, the fire situation of the four arc conditions decreased significantly at 37 s, 28 s, 16 s and 12 s after the arcing, respectively, because of the lack of comburent. According to the upper limit of the long-term operating temperature of the cable specified in the IEC standard, PVC is 70 °C [
25], and the PVC material began to soften after reaching 120 °C and underwent a glass transition. A UL94 test on the flammability of PVC showed that when the temperature reaches 200 °C, PVC is ignited and decomposed to release HCL gas [
26]. Combined with the temperature rise in the upper cable outer sheath of the fault cable under each arc condition of the 10 kV cable shown in
Figure 13 and
Figure 14, the maximum temperature of the upper cable outer sheath is shown in
Table 7. The results show that the combustion process of the 10 kV cable under the action of the arc developed rapidly and violently. The temperature of the outer sheath of the upper cable at the fault point exceeded 120 °C under the conditions of the 4–10 A arc, and the temperature rise exceeded 200 °C under the conditions of the 6–10 A arc. The temperature reached the material decomposition temperature limit. Therefore, the upper cable was damaged.
