Article

Investigations of the Fire Behavior of Functionally Graded Concrete Slabs with Mineral Hollow Spheres

Institute for Lightweight Structures and Conceptual Design (ILEK), University of Stuttgart, Pfaffenwaldring 14, 70569 Stuttgart, Germany
*
Authors to whom correspondence should be addressed.
Fire 2024, 7(7), 256; https://doi.org/10.3390/fire7070256
Submission received: 21 May 2024 / Revised: 25 June 2024 / Accepted: 16 July 2024 / Published: 18 July 2024
(This article belongs to the Special Issue Advances in Building Fire Safety Engineering)

Abstract

Functionally Graded Concrete (FGC) allows for a significant reduction in the mass of concrete components while maintaining their structural and functional requirements and improving recycling capacity. This is achieved by inserting spherical mineral hollow bodies into the structure where no material is required. Within the scope of this work, the behavior of FGC slabs exposed to fire is investigated both experimentally and numerically and compared to a corresponding solid cross-section. Therefore, FGC specimens are placed in a test furnace and subjected to fire exposure for 90 min. The temperature distribution, bending load-bearing capacity, and spalling behavior are investigated. The results of the numerical simulation of the solid cross-section are in good agreement with the values provided in the building code. However, for the FGC cross-section, differences in temperature at characteristic measurement points between the experimental and numerical results are observed, presumably due to convection. The experimental results suggest that the bending load-bearing capacity of the investigated FGC cross-section could be potentially greater than that of a corresponding solid cross-section. Furthermore, as expected through analytical analysis, the fire tests confirm that no spalling of the FGC specimens occurred.

1. Introduction

The construction sector is responsible for 35% of global energy consumption, over 50% of global CO2 emissions and 60% of global resource consumption [1], thus contributing significantly to accelerating climate change and resource scarcity. Cement in particular, essentially used in the production of concrete, accounts for about 8% of global anthropogenic CO2 emissions alone [2].
The technology of Functionally Graded Concrete (FGC) has been developed and investigated as a potential solution to significantly reduce the required material for concrete structures, thus allowing the reduction in resource consumption, embodied emissions, and waste production [3]. FGC components are designed by intentionally inserting cavities into the concrete elements while fulfilling all structural and functional requirements. The present work deals with the principle of meso-gradation, where spherical mineral hollow bodies are placed into concrete components.
The concept of inserting voids into load-bearing concrete structures is already known from ancient construction technologies and is nowadays commonly applied using synthetic-based hollow bodies [4,5,6]. In contrast to current voided slab systems, the technology of FGC uses mineral hollow bodies which ensure that the concrete component does not contain synthetic-based materials, thereby facilitating mono-material recycling. The mineral hollow bodies are manufactured in a rotational molding process, whereby a hollow mold is filled with a liquid concrete suspension and continuously rotated until the suspension has hardened. The resulting concrete hollow bodies can be currently manufactured with diameters up to 30 c m and have a wall thickness of 1 to 4mm. The gradation is enabled by the placement of hollow spheres of various diameters within the structure based on the distribution of principal stresses. Compared to current voided slab technologies that use a single size of hollow body, the integration of hollow bodies of different sizes allows for a higher degree of utilization and greater material savings [7].
The load-bearing behavior under normal temperature conditions of uni- and biaxial voided slabs has been the subject of several investigations [8,9,10]. In [11], small-scale specimens of voided slab cutouts were subjected to fire in a furnace, and subsequently their remaining load-bearing capacity was tested. Ref. [12] provides a comprehensive summary of the results of fire tests of full-scale voided slabs with synthetic-based hollow bodies. In [13], the flexural capacity of cutouts of solid and FGC-slabs subjected to fire was numerically investigated. The present study examines and compares the mechanical behavior of solid and FGC slabs that are exposed to fire based on analytical, numerical, and experimental observations.

2. Methodology

To determine temperature distribution, load-bearing capacity and spalling behavior of FGC slabs in the case of fire, numerical and experimental investigations were performed. For the experimental investigations, cut-outs of a FGC component were exposed to fire from underneath in a small-scale test furnace according to [14]. The setup of the numerical simulation is based on the boundary conditions present in the furnace. In addition, a cut-out of a conventional solid slab was numerically simulated to obtain a comparison with the FGC slabs.

2.1. Experimental Setup

The experiments were conducted in a small-scale test furnace at the 
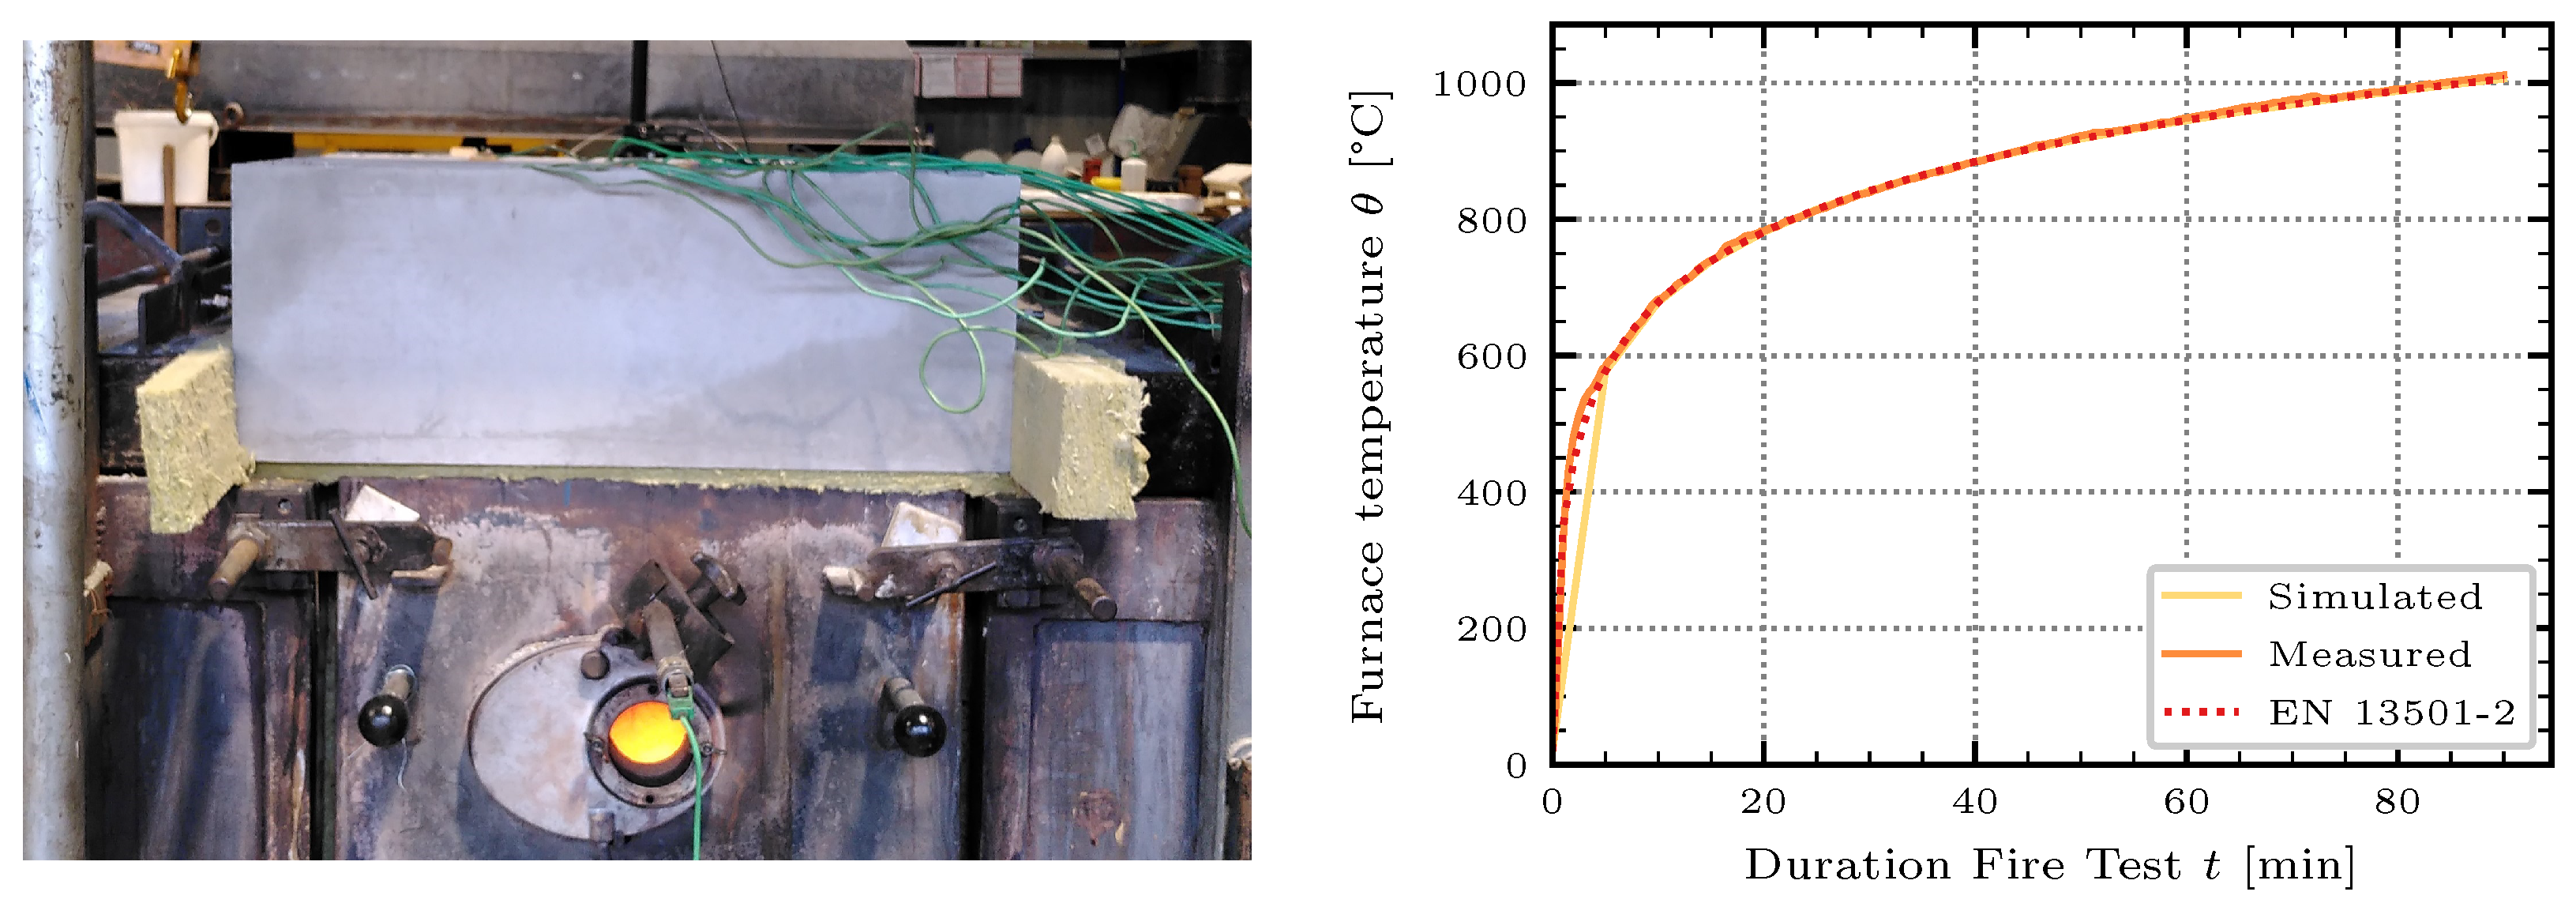
Materials Testing Institute at the University of Stuttgart, Germany (MPA Stuttgart). The small-scale test furnace consists of a combustion chamber and an atomizing oil burner in accordance with the specifications of [14]. The combustion chamber is bounded on all sides by firebricks and refractory concrete, with an opening at the top to place the test specimens (cf. Figure 1).
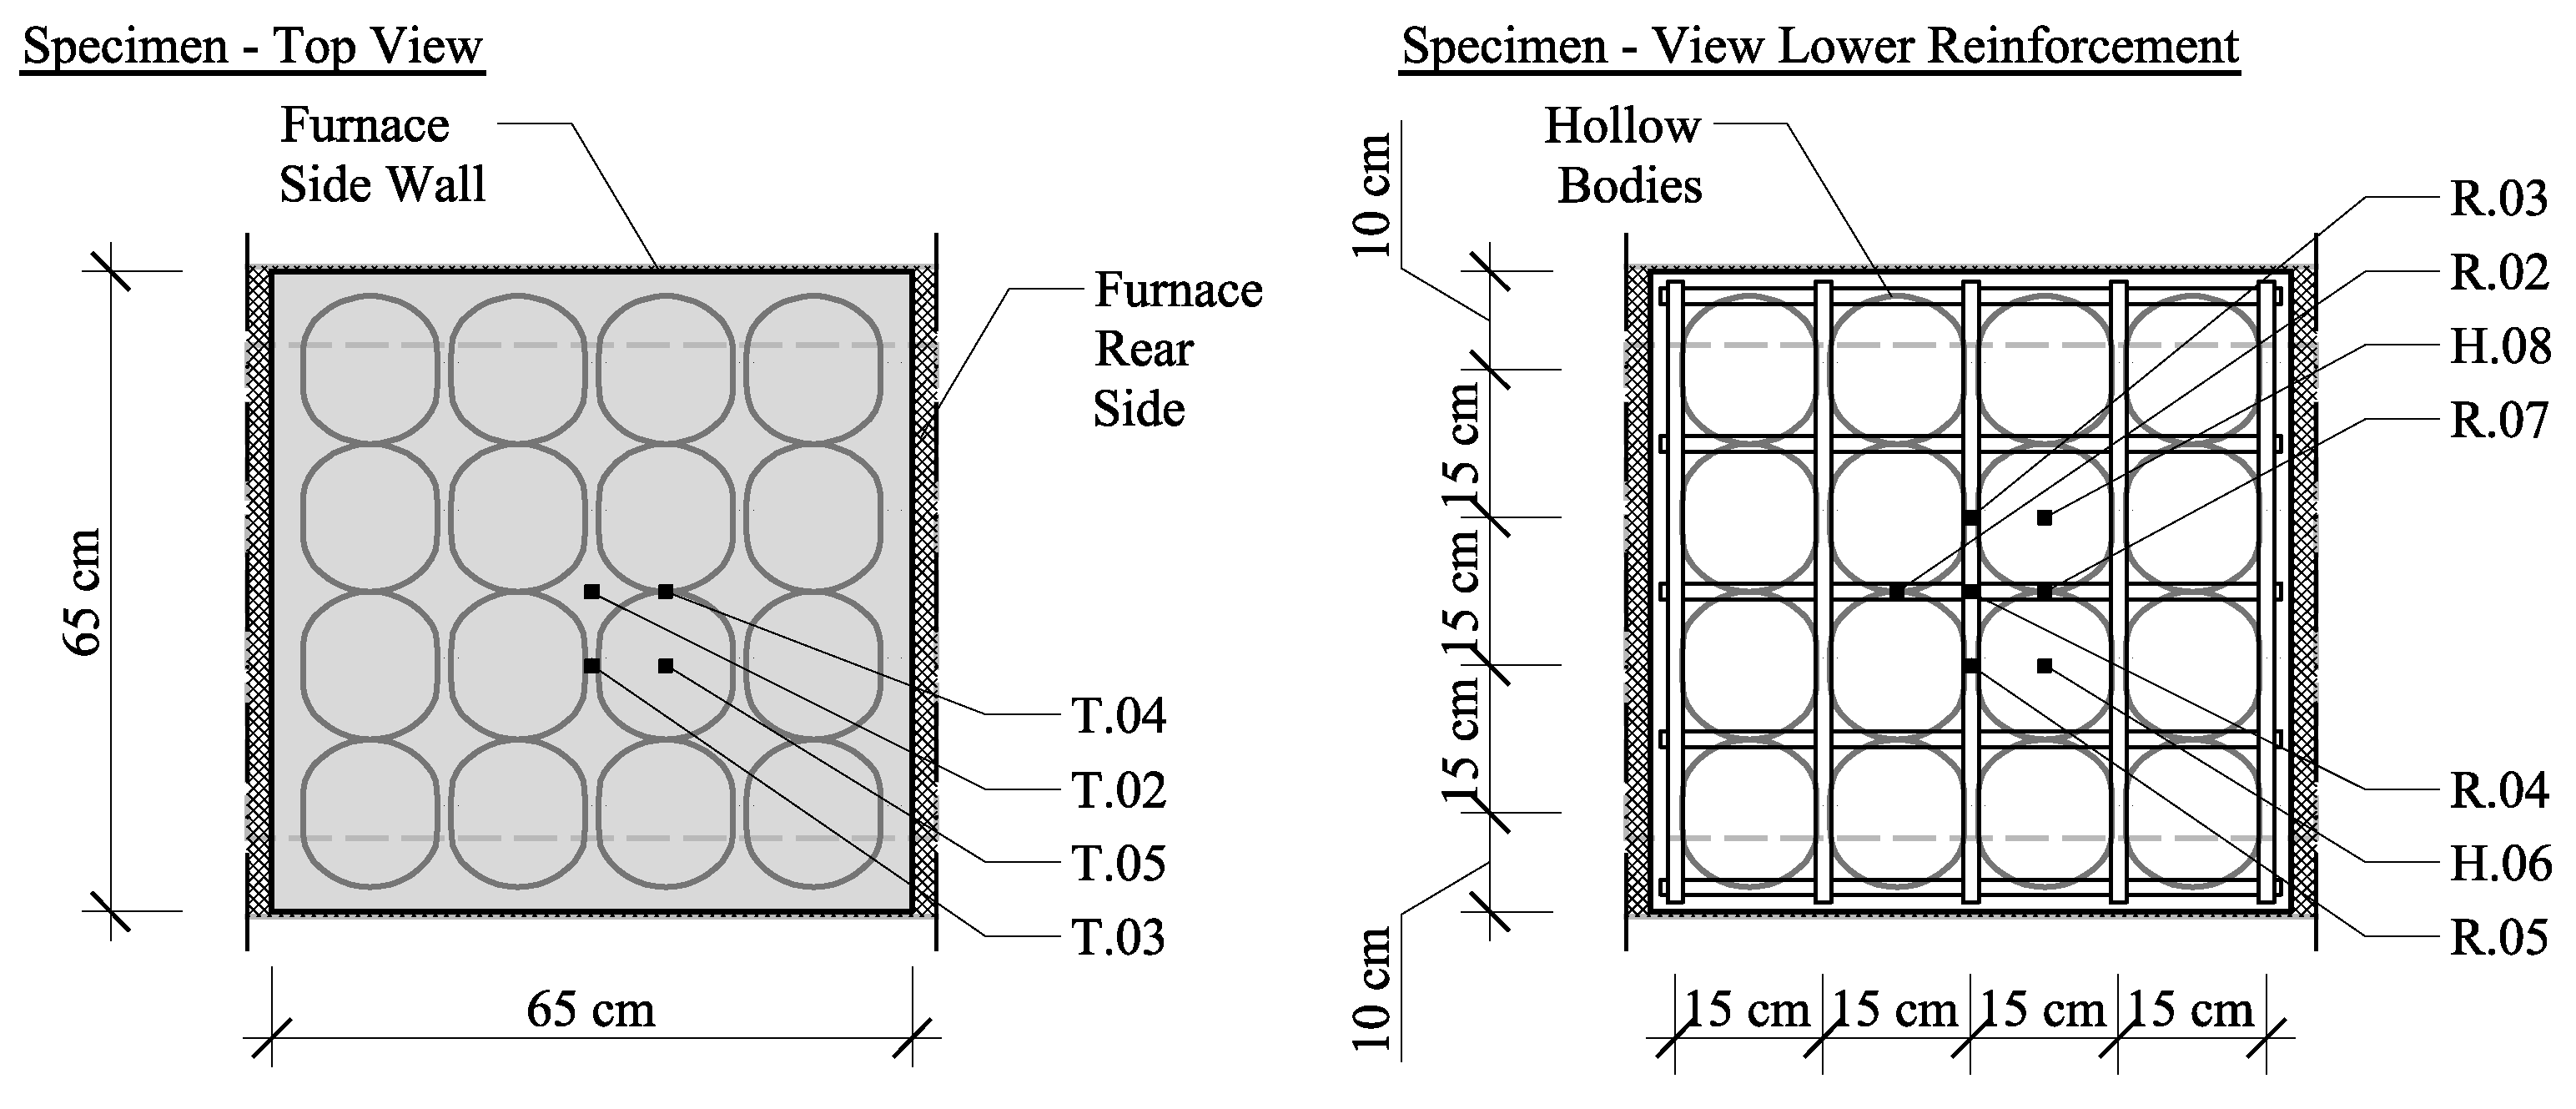
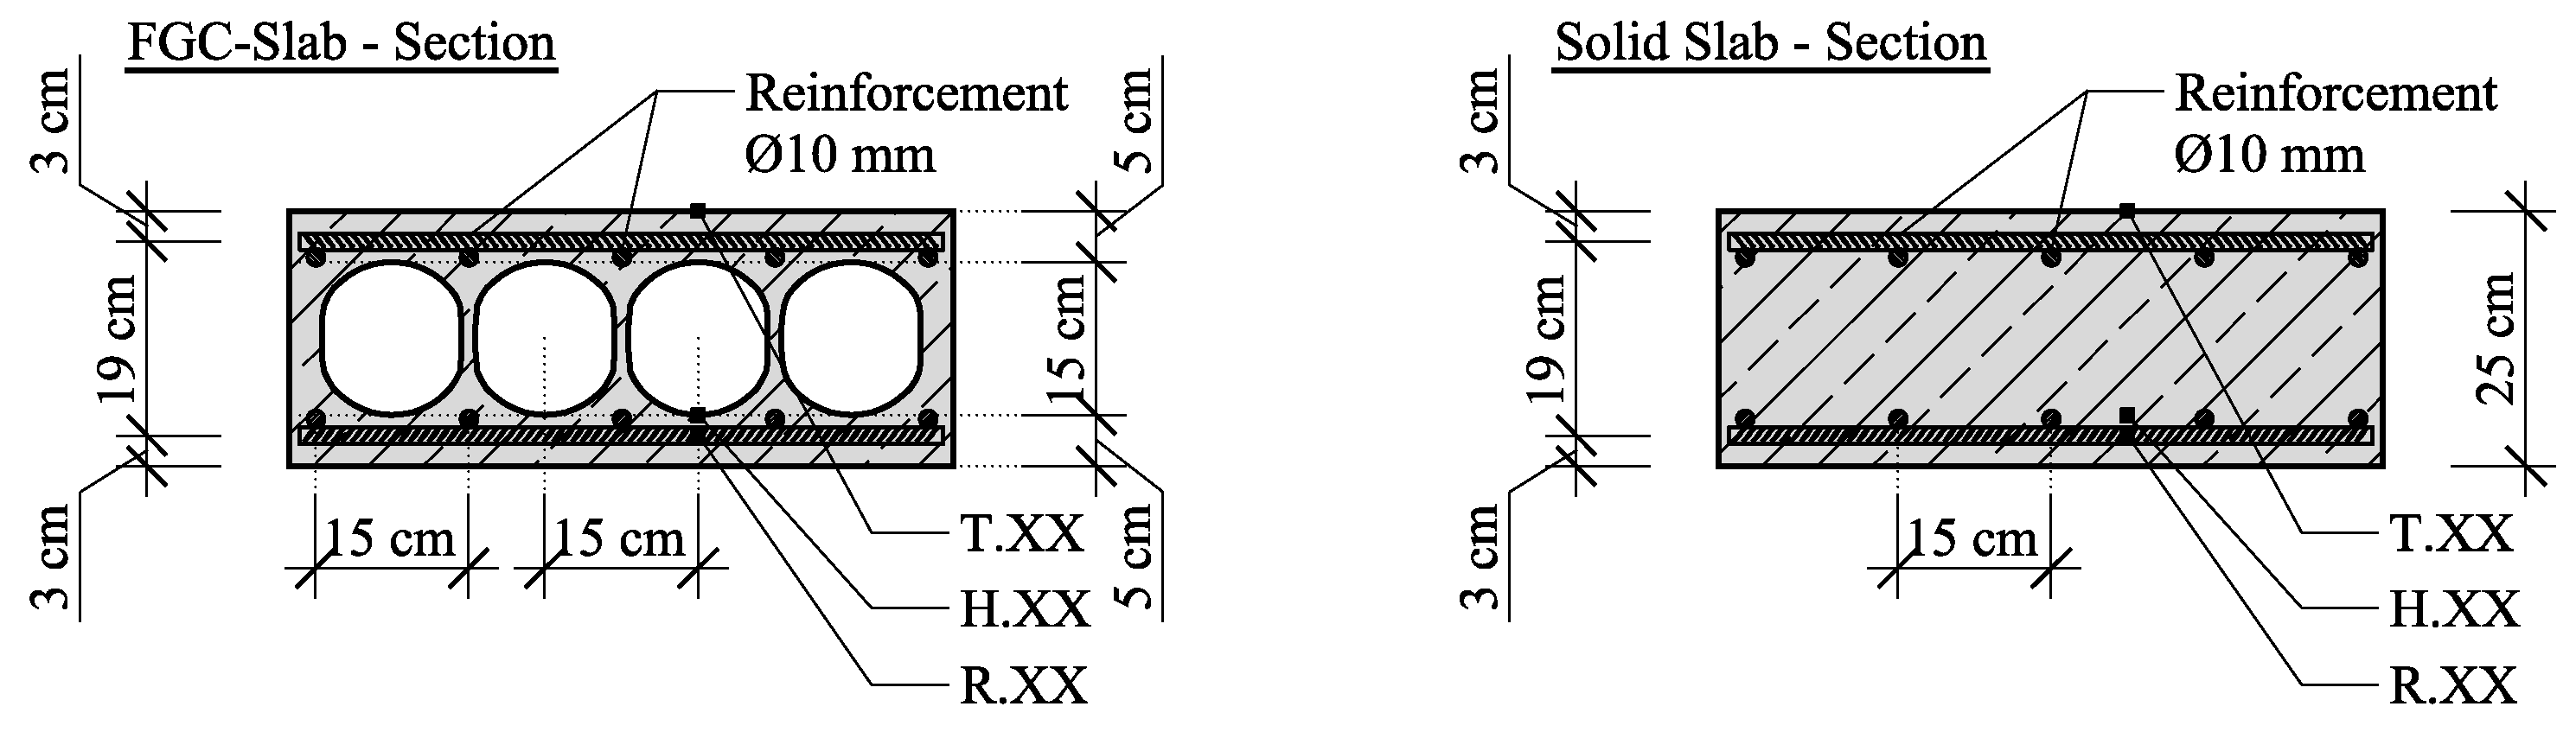
The dimensions of the slab cutout are 65 cm × 65 cm with a thickness of 25 cm. The nearly spherical mineral hollow bodies have a diameter of 15 cm and a wall thickness of 1 to 4mm, with a cover layer of 5 cm below and above the hollow bodies.
The concrete mixture used in this study was provided by Godel Beton GmbH, Stuttgart, Germany and produced in a local concrete plant. The binder composition included Portland cement (CEM I 42.5 R), blast furnace cement (CEM III/B 32.5 N-LH/SR), and fly ash (FA). River sand (RS) was used as fine aggregate 0/2mm with a density of 2.60   k g / d m 3 . The coarse aggregates (CAs) 2/16mm had a density of 2.69   k g / d m 3 . Superplasticizer and stabilizer were added as additives (AD) to the mixture. Table 1 shows the composition of the mixture adopted in this study.
Prior to concreting, the reinforcement, hollow bodies, and thermocouples were installed in the formwork (cf. Figure 1). The specimens were demolded after 7 days. To ensure that the concrete had a low moisture content, the test specimens were stored for 100 days in a closed storage chamber at 50 to 70% relative humidity in accordance with [15] before they were subjected to the fire test. The moisture content of the specimens was not determined.
The three test specimens, denoted with AC, were each exposed over 90 min to fire from underneath with the Standard Time Temperature Curve (STTC) according to [16]. The curve describes the temperature profile in the event of a fire. The combustion temperature θ at a given time t can be calculated as a function of the fire duration using the following equation:
θ = 20 + 345 · l o g ( 8 · t + 1 ) ,
Two sheathed thermocouples of type K (NiCr-Ni), IEC 60584-1 Class 1 [17] are installed in the combustion chamber to continuously monitor and control the combustion temperature and therefore the fire exposure of the test specimens. The results of the temperature measurements in the combustion chamber compared to the STTC can be taken from Figure 2.
To measure the temperature distribution of the cut-outs during the fire test, thermocouples of type K (NiCr-Ni), IEC 60584-1 Class 1 [17] were installed at characteristic points both inside and on the surface of the specimens. The experimental setup and the location of the sensors are shown in Figure 3 and Figure 4.
To compare the FGC and the solid concrete components in terms of their fire behavior, analytical calculations and numerical simulations of a cut-out of a solid slab were performed. The geometric dimensions and material properties of both were selected identically.
Compared to the applicable permissible values for solid cross-sections [18], the reinforcement cover of the FGC components was increased by 5   m m , as preliminary investigations [12] indicated an increased steel temperature when maintaining the same reinforcement cover. This assumption will be subsequently validated.

2.2. Numerical Investigations

To obtain a comprehensive understanding of the temperature distribution within the component, a non-linear heat transfer analysis was performed in the Abaqus 2021 FEM software environment. All input data required to perform the simulation are contained in [19].
The concrete as well as the reinforcement were simulated using eight-node linear heat transfer solid elements (DC3D8), see also Figure 5. The wall thickness of the mineral hollow bodies was considered to be 2.0   m m . As an approximation, the air contained in the hollow bodies was not considered in the numerical model due to the comparatively low thermal conductivity ( λ a i r , 20 ° C 0.025 W / m · K λ c o n c r e t e , 20 ° C 1.4–2.0 W / m · K ); for discussions, see also Section 4. This means that a heat flow in the numerical model can only occur through the concrete cross-section.
The mechanical properties of the utilized concrete and reinforcement can be found in Table 2, and the thermal properties are given and discussed in Section 2.4. The heat flux on the surfaces of the specimens due to convection and radiation from the underneath fire exposure and the surrounding air was modeled using surface film and surface radiative interactions (Figure 6).

2.3. Influence of Mesh Size and Boundary Conditions

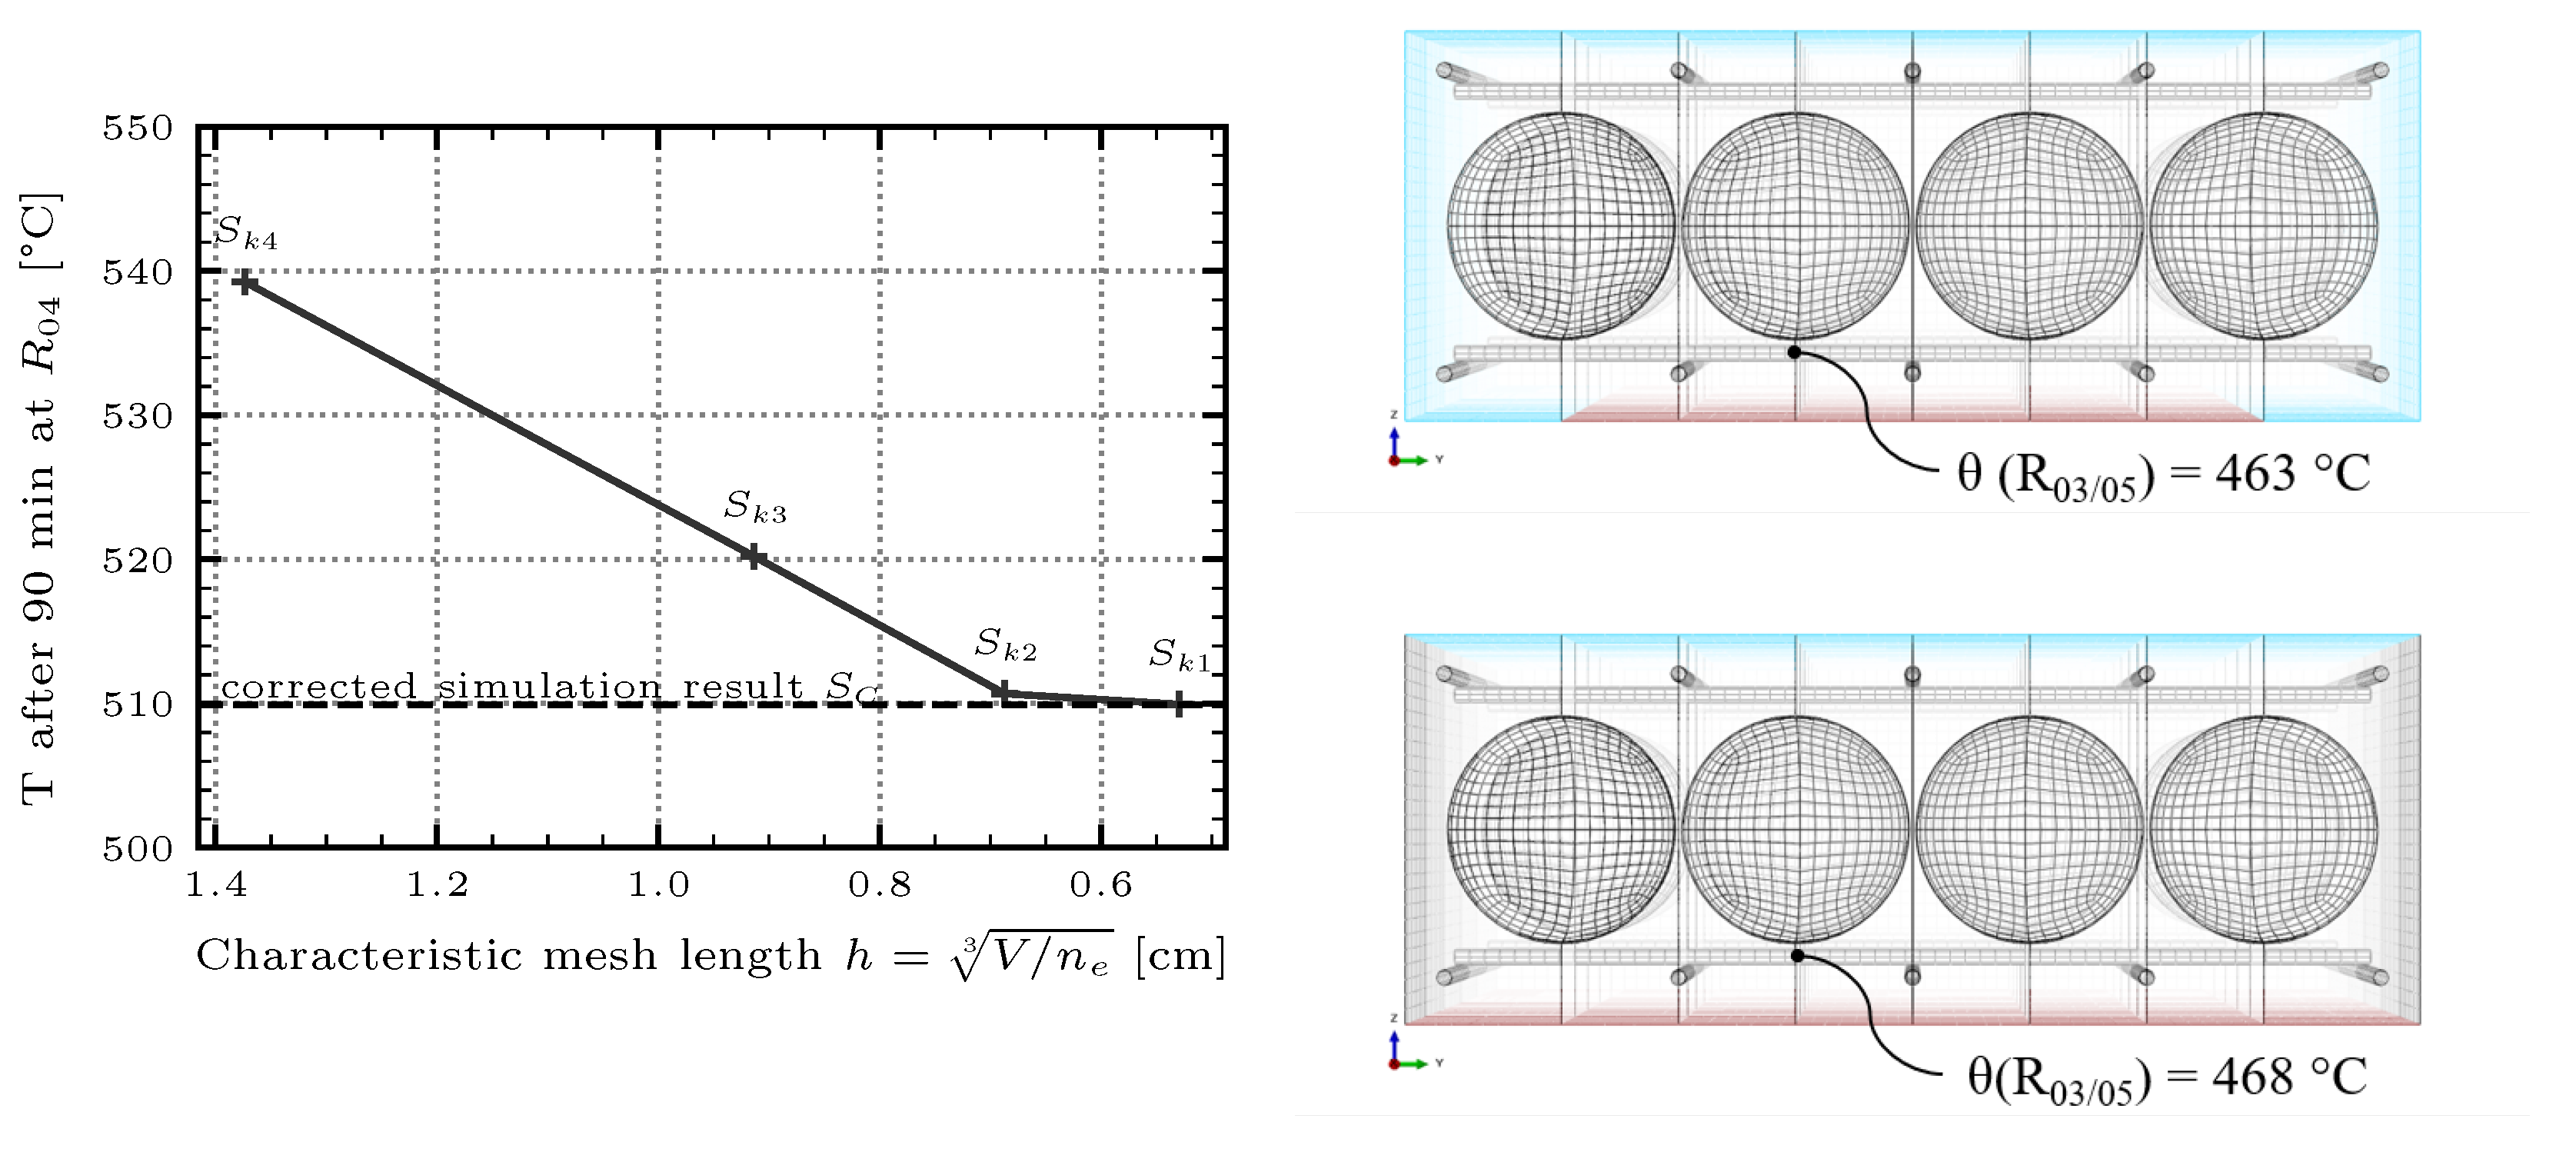
A convergence study according to [23] was conducted to determine the influence of the mesh size on the results. Therefore, the edge length of the solid elements was refined in multiple steps by a factor of 2 . The temperature determined at the measurement point R 04 was used as the convergence parameter. The results are shown in Figure 6.
As a result, iterative convergence could be identified, and the approximate numerical error of the simulation could be estimated according to [23]. For all subsequent simulations, the mesh with the parameter h 3 0.9   c m was selected, as this provided sufficiently accurate results within reasonable computing time. The relative error between the solution S k 3 computed on the grid h 3 0.9   c m and the corrected simulation result S c is less than 2%. Detailed results of the convergence study can be found in [19].
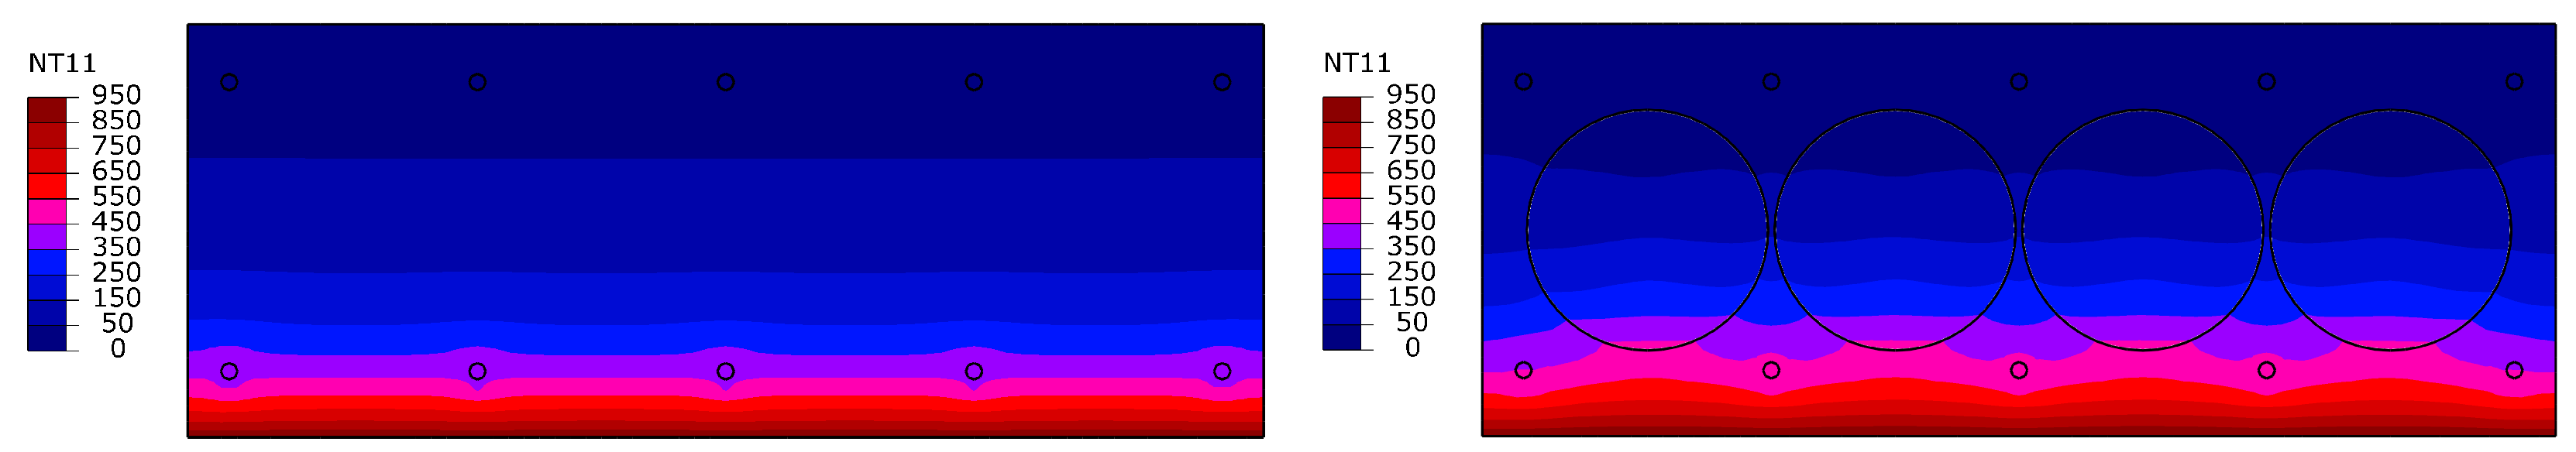
Furthermore, the influence of the boundary conditions of the small-scale test furnace was analyzed. Images from a thermographic camera indicated that heat is radiated from the uninsulated side faces of the specimen. Likewise, due to the lateral support on the walls of the fire chamber, a lateral strip underneath the specimen with a width of approximately 10   c m was not directly exposed to fire from the combustion chamber.
In order to demonstrate that the influence of the aforementioned boundary conditions at the measurement locations in the center of the specimen can be neglected, a numerical model with the boundary conditions of the small-scale test furnace was created (cf. Figure 6). A conservative approach was chosen in which both the two uninsulated faces as well as the lateral strip underneath the specimen were modeled as a heat sink at room temperature.
The comparison of the results of the modeling as a quasi-infinite cut-out and with the boundary conditions in the small-scale test furnace is shown in Figure 6. Although the influence on the temperature on the exterior faces can be observed, it becomes evident that the temperature differences due to the boundary conditions at the measurement points distant from the exterior faces are negligible (max. 1.5%). The detailed results are shown in [19]. Consequently, it can be stated that the results from the tests performed in the small-scale test furnace provide reliable temperature profiles also for concrete components with larger lateral dimensions such as continuous slabs.

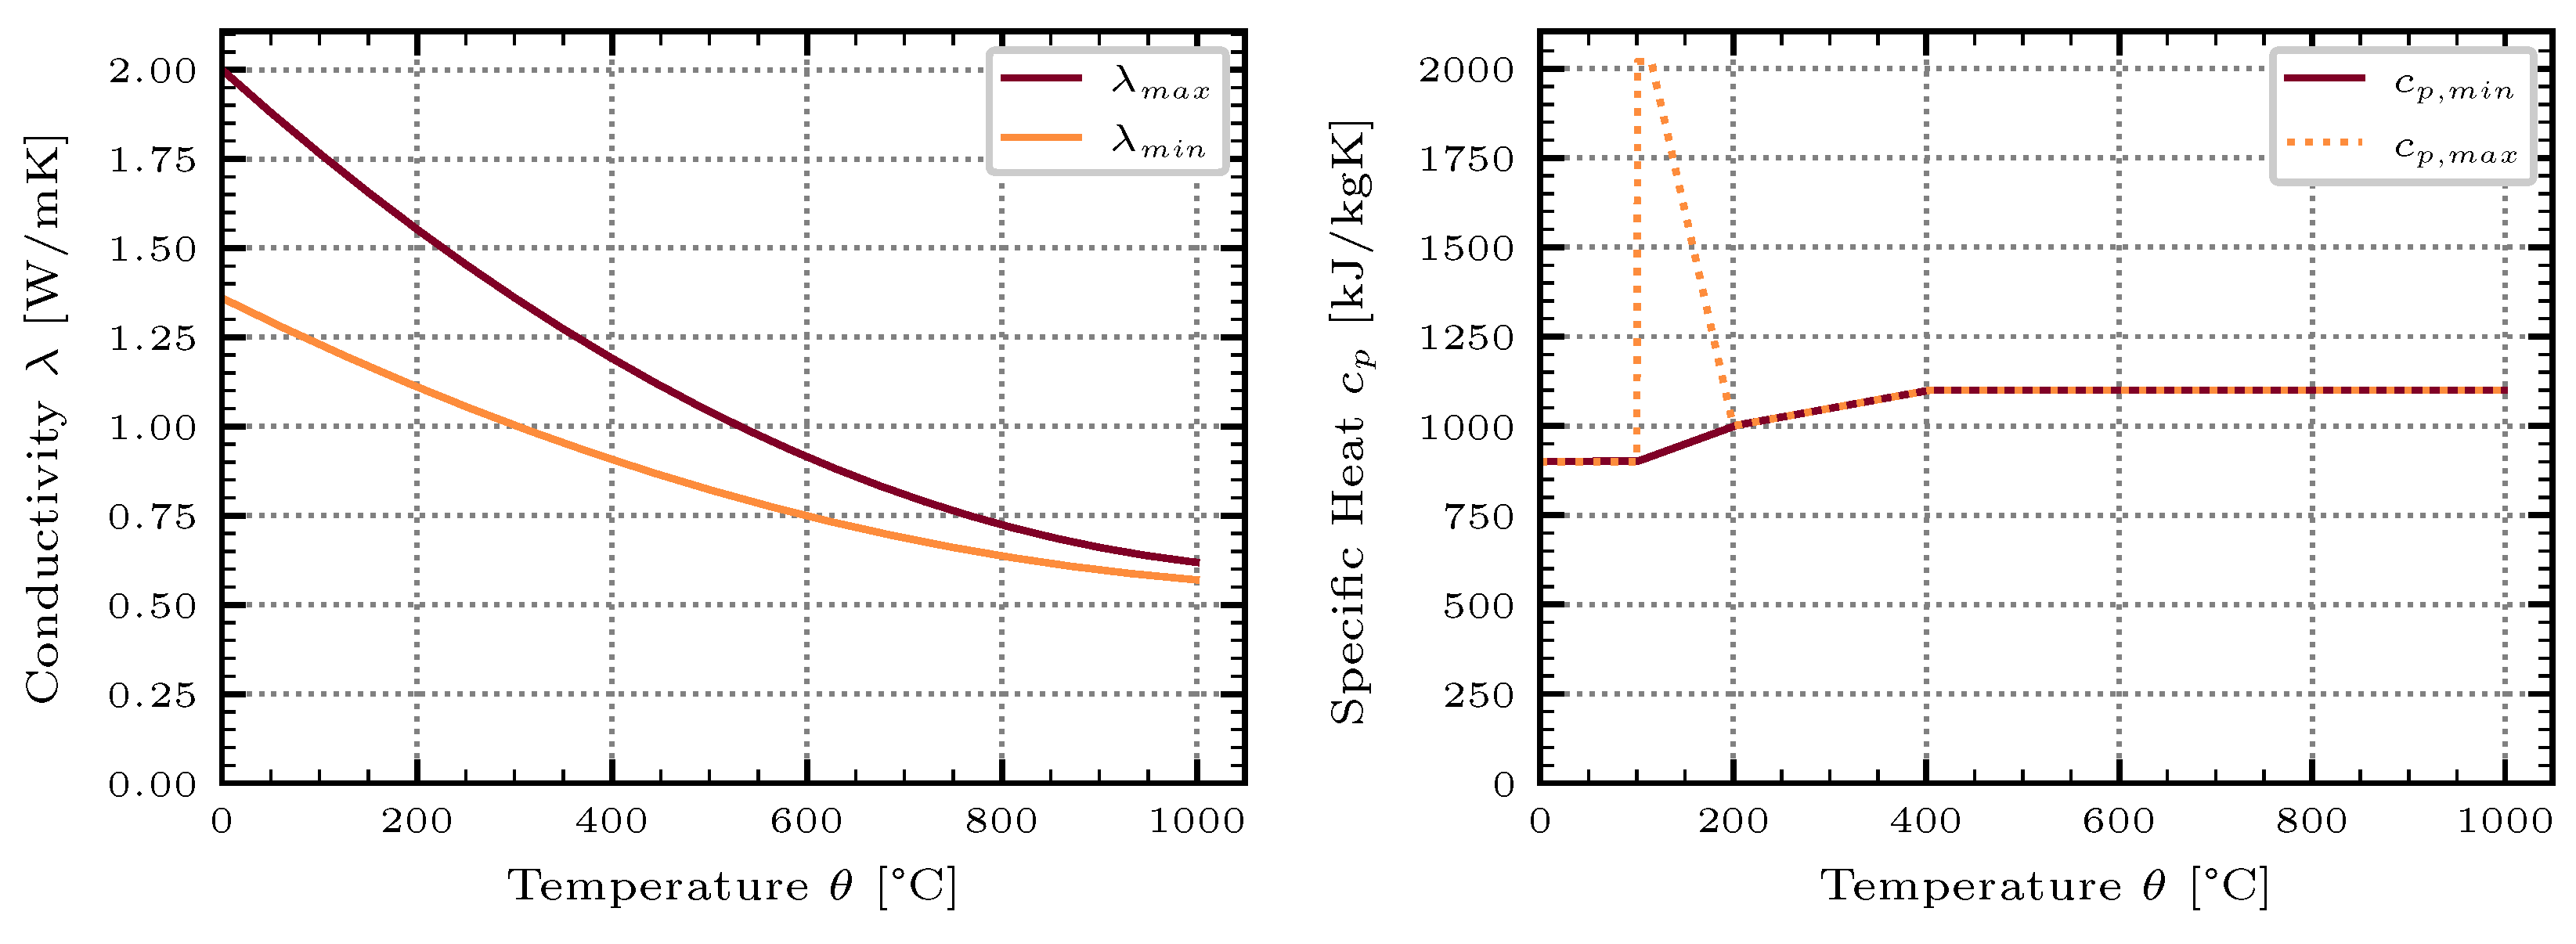
2.4. Influence of Thermal Conductivity and Specific Heat

In addition to the mesh parameters, the temperature-dependent thermal conductivity λ and specific heat capacity c p of the concrete have a significant influence on the quality of the results of the numerical simulation. These depend, in particular, on the moisture content, mixture composition, and density of the utilized concrete. As these parameters can generally be subject to large variations, upper and lower limits that lead to rapid (low specific heat capacity, high thermal conductivity) and slow (high specific heat capacity, low thermal conductivity) heating of the examined component were investigated (cf. Figure 7). The corresponding values are based on [18]. All subsequent simulations were conducted with both, the lower and upper limits of the temperature-dependent curves of λ and c p .

3. Results

3.1. Comparison between Experimental and Numerical Results

To validate the numerical simulations, the temperatures after 90   min of fire exposure are compared to the experimental results at the characteristic measuring points shown in Figure 3 on the fire-facing and fire-averse faces of the specimens. Measurement points that due to symmetry should exhibit similar temperature development are grouped together in the subsequent evaluation. For the fire-facing side, the points of interest are located directly below the hollow spheres and on the lowest reinforcement layer between the hollow spheres. At the fire-averse side, these are located above and between the hollow spheres. A complete compilation of the results at all measurement points for a fire duration of 30, 60 and 90 min can be found in [19].
Presumably due to damage during the fabrication, the sensors at the measurement points H 06 and H 08 of specimen C do not provide plausible readings and were therefore excluded from the evaluation. The results of the numerical simulation are given as lower and upper limits for the thermal conductivity and specific heat capacity as specified in Section 2.4.
Figure 8 shows a comparison between the results of the FGC specimen obtained from the numerical simulation and the experiments after 90 min of fire exposure. The experiments show certain variations concerning the temperature changes, e.g., at the measurement point R 02 / 07 , the standard deviation is T 90 min , s t d = 16.0   K , which, however, in relation to the mean value T 90 min , m e a n = 414.2   ° C corresponds to a coefficient of variation T 90 min , V a r K = 3.9%. These variations can be considered negligible with regard to the overall validity of the results.
More noticeable are the differences between the results from the experiment and the numerical simulation. All measurement points on the fire-facing side recorded significantly lower temperatures after 90 min fire exposure in the experiment than in the simulation. At the same time, when looking at the fire-adverse side, it can be observed that the temperatures in the numerical simulation underestimate the temperatures that were measured in the experiment. The measured temperatures are well outside the computed lower and upper limits for thermal conductivity and specific heat capacity. A particularly large discrepancy can be noticed below the hollow spheres at the measurement points H 06 / 08 .
For a better understanding of these differences, the temperature development after 30, 60 and 90 min fire exposure at the measurement points below and above the hollow spheres is depicted in Figure 9.
It can be deduced from Figure 9 that after a fire duration of more than 30 min , the values of the numerical simulation strongly diverge from those of the experiment. The same applies to the temperature measurements at the lowest reinforcement layer that are, for the sake of clarity, not shown in Figure 9. For an interpretation of these results, see also Section 4.

3.2. Comparison of the Temperature Distribution

To visualize the effect of the hollow spheres on the behavior in case of fire, Figure 10 shows the temperature distribution in the solid and the FGC-cross-section after 90 min of fire exposure. A heat accumulation with higher temperatures compared to that of the solid cross-section appears to form below the hollow spheres. The same effect has been observed in the numerical simulations conducted in [12,13].
In the numerical simulations of the present study, the heat accumulation was also apparent when comparing the temperatures beneath the hollow spheres ( H 06 / 08 ), which were in a similar range to the temperatures at the reinforcement ( R 02 / 07 ). In contrast, the experimental results showed significantly lower temperatures at H 06 / 08 than at R 02 / 07 ; see also Table 3 and Figure 11. This discrepancy raises the question of the validity of the heat accumulation beneath the hollow bodies observed in the numerical simulations here and in [12,13]. If a heat accumulation as observed in the numerical simulation occurred, one would expect the temperature difference between H 06 / 08 and R 02 / 07 to be similar to that in the numerical simulation. To confirm this, measurement points at different depths would be required.
In Figure 12, the determined values for the FGC cross-section are compared with the numerically computed values for a solid cross-section at the specified measurement points after 90 min fire duration for the fire-facing and fire-averse faces of the specimen. Since significant differences between simulation and experiment are evident for the FGC cross-section, only the experimentally determined results are used for the comparison with a solid component.
For the solid cross-section, it can be shown that the implemented numerical model provides reliable results, which is demonstrated by the comparison with the benchmark values of [18] as depicted in Figure 12. The temperature distribution is in accordance with [18], determined for a specific heat capacity of 1.5% and the lower limit of the thermal conductivity λ m i n .
It can also be seen that, contrary to the results of the numerical analysis of hollow sphere slabs performed here and in [12,13], the temperature at the lower reinforcement layer and below the hollow spheres is lower than the temperature at the same location in the solid cross-section. At the same time, it can be seen that the temperature on the fire-averse side of the FGC cross-section is higher than the temperature of the solid cross-section but not in a critical range. For a possible explanation, refer to Section 4.

3.3. Estimation of the Load Bearing Capacity

Due to the limitations of the small-scale test furnace, which only allow to conduct experiments with unloaded specimens, analytical methods are employed to determine the bending load-bearing capacity under fire exposure using the experimentally obtained temperature distributions in the concrete cross-section and the reinforcement. As the focus of the application of the FGC technology is on concrete slabs, where bending stresses are predominant, the bending load-bearing behavior is of particular interest. For FGC slabs, the bending capacity can be determined using the same methods as for a solid slabs, provided that the hollow spheres are located outside the concrete compression zone [24,25].
To determine the bending capacity under fire exposure, the maximum values of the experimentally determined temperatures of the FGC cross-section and of the numerical simulation of the solid cross-section are used. Based on these temperatures, the tensile strength of steel and the compressive strength of concrete must be reduced accordingly. Since no temperatures above 100   ° C are observed in the concrete compression zone, the concrete compressive strength does not need to be reduced. The temperature-dependent tensile strengths of the reinforcement are determined using the reduction factors according to [18].
Two calculations methods, the simplified calculation method according to ([18] Appendix E) and the design method for bending without axial force according to ([22] Section 7.3.2), are applied using the characteristic material properties given in Table 2. Both are limited on the determination of the cross-sections one-way flexural capacity. The design method for bending without axial force is applied under the common prerequisites of the parabola–rectangle stress–strain relation of concrete, equilibrium of internal forces in the cracked state of the concrete, and the limitation of reinforcement and concrete strains [21,22].
In the case of the simplified calculation method, the bending resistance at normal temperature is calculated first and then multiplied by the reduction in tensile strength of the steel. In the case of the design method for bending without axial force, the bending resistance is calculated iteratively, taking into account the reduced tensile strength in the equilibrium of internal forces. A compilation of the results is shown in Table 4, and more details can be found in Appendix A.
The comparison shows that both methods lead to similar results. It can be observed that the increased temperature at the level of the reinforcement of the solid cross-section reduces the steel tensile strength and, in the same magnitude, the bending capacity by approximately 24% compared to that of the FGC cross-section. It is important to highlight that the reinforcement temperature is determined through two distinct methods, once through experiments and once through numerical simulations. To confirm these findings, it is imperative to conduct experiments on both a FGC and a solid section under identical conditions in order to ensure comparability.

3.4. Concrete Spalling

In addition to the load-bearing capacity, the spalling behavior of FGC-slabs must also be assessed in order to evaluate their behavior under fire exposure. It should be considered here that the air contained in the hollow spheres expands due to the temperature change. Whether this expansion can lead to explosive spalling, meaning the detachment of large concrete fragments below or above the hollow bodies due to the air expansion, is examined analytically and experimentally. Neglecting the elastic expansion of the hollow spheres as well as water migration and evaporation into the sphere, the change in state is isochoric, i.e., the volume of the air contained in the hollow spheres remains the same with changing temperatures.
Therefore, as a first estimation, the positive pressure p 2 generated in the sphere during heating can be quantified with Gay-Lussac’s law [26]. The temperature inside the hollow sphere is assumed to be equal to the temperature measured in the experiments on the outer wall of the hollow sphere T 2 = 240   ° C = 513   K . As a reference temperature, the room temperature before the fire test T 1 = 20   ° C = 293   K and an atmospheric pressure of p 1 = 1   bar = 0.1   M Pa are assumed. The positive pressure p 2 inside the hollow spheres can be calculated as follows:
p 2 = p 1 · T 2 T 1 = 0.1   M Pa · 513   K 293   K = 0.175   M Pa = 1.75   bar
Due to the comparatively low resulting pressure inside the mineral hollow sphere, no spalling of the exterior concrete is expected. Furthermore, during the fire tests of the three specimens, no larger spalling or detachment of large concrete fragments that would indicate explosive spalling behavior due to the expansion of the air contained in the hollow bodies is observed (cf. Figure 13).

3.5. Thermal Insulation

A further criterion for all separating elements, such as slabs, under fire exposure is thermal insulation. According to [18], this is considered to be fulfilled if the mean temperature increase on the fire-averse face does not exceed 140   K , and the maximum temperature increase does not exceed 180   K at any point. The measured values on the fire-averse face depicted in Figure 12 are below these limit values, thereby also providing proof of thermal insulation.

4. Discussion of the Influence of Convection

From Figure 8 and Figure 9, it is evident that after a fire exposure greater than 30 min , the temperatures in the FGC cross-section obtained from the numerical simulations differ from the results obtained from the experimental investigations, especially below the hollow spheres. This can presumably be attributed to the influence of natural convection within the hollow sphere due to the heating of the air contained therein, which is not considered in the conducted non-linear heat transfer analysis.
A qualitative assessment of this effect can be made using the Nusselt number N u , which describes the ratio of the heat transfer due to convection q α to the heat transfer due to conduction q λ of a fluid. The influence of convection in the hollow spheres was already noted in [27] on the basis of the work of [28].
According to [27], even for conservatively estimated temperature differences of θ = 5 K occurring between the wall of the hollow body and the fluid, a Nusselt number N u 15 results. The influence of the heat flow of the air due to convection q α in relation to the heat flow of the air due to heat conduction q λ is therefore considerably greater. This illustrates the considerable influence of natural convection, which is not accounted for in the numerical simulations performed here or in [12,13].
A further indication of this effect is that for all specimens, the temperatures on the fire-averse face measured directly above the hollow spheres are slightly higher than the temperatures measured above the concrete webs between the hollow spheres (see Figure 12). It therefore seems plausible that the heat flux does not only occur through the concrete webs but also by convection through the fluid contained in the hollow spheres.
To confirm and quantify this effect, it is necessary to conduct Computational Fluid Dynamics (CFD) simulations that can consider the natural convection within the hollow spheres.

5. Conclusions

In this contribution, the behavior of cut-outs of solid and FGC slabs exposed to fire is evaluated and compared. As shown in Table 4, the results suggest that the bending load-bearing capacity of FGC-slabs exposed to fire for the present cross-section may potentially be greater than the bending load-bearing capacity of a corresponding massive slab exposed to fire. To confirm these observations, it would be beneficial to conduct loaded large-scale fire tests and numerical simulations that consider the simultaneous impact of fire exposure and loading.
In addition, it was analytically calculated that the expansion of the air contained in the hollow bodies does not lead to considerably larger stresses that would cause explosive spalling in the cross-section. This was confirmed by the experimental results of the fire tests, where no explosive spalling, meaning the detachment of large concrete fragments, of the FGC-component was observed. The same was also stated in fire tests conducted in [12]. For future experiments, it would be advantageous to install monitoring devices to measure the positive pressure inside the spheres caused by the heating. Furthermore, the proof of thermal insulation has been provided, and it can be stated that the investigated FGC component fulfills the fire resistance criteria R, load-bearing capacity, and I, thermal insulation, for a fire duration of at least 90 min .
A comparison of the numerically and experimentally obtained results of the FGC components revealed discrepancies that could be attributed to the influence of natural convection. To gain a comprehensive understanding of this phenomenon, further investigations should include CFD simulations that can effectively capture the effect.
This paper provides new insights into the load-bearing behavior of FGC components under fire exposure, which is a crucial factor for their structural design. The results of this study provide guidance for the design of FGC structural elements in future applications and demonstrate the applicability of FGC structures in buildings that require up to R90 fire resistance. The findings emphasize the potential benefits of using FGC in terms of reducing mass and, thereby, minimizing the environmental footprint of concrete construction.

Author Contributions

Conceptualization, B.S.; methodology, B.S. and C.N.H.; software, B.S. and C.N.H.; validation, B.S.; formal analysis, B.S.; investigation, B.S. and C.N.H.; resources, B.S.; data curation, B.S.; writing—original draft preparation, B.S.; writing—review and editing, B.S., C.N.H. and L.B.; visualization, B.S.; supervision, B.S. and L.B.; project administration, B.S. and L.B.; funding acquisition, L.B. All authors have read and agreed to the published version of the manuscript.

Funding

This research was funded by the Deutsche Forschungsgemeinschaft (DFG, German Research Foundation) under Germany’s Excellence Strategy–EXC 2120/1–390831618.

Institutional Review Board Statement

Not applicable.

Informed Consent Statement

Not applicable.

Data Availability Statement

Supplementary data associated with this article are openly available in DaRUS at https://doi.org/10.18419/darus-4194 [19] (accessed on 25 June 2024).

Conflicts of Interest

The authors declare no conflicts of interest.

Appendix A

Table A1. Calculation of the characteristic one-way bending resistance under normal temperature conditions using design method for cross-sections subjected to bending without axial force according to ([22] Section 7.3.2).
Characteristic ValueFGC-SlabSolid Slab
Reinforcement tensile strength f y k ( θ ) 500   M Pa 500   M Pa
Reinforcement cross section a s 5.24   c m 2 / m 5.24   c m 2 / m
Concrete compressive strength f c m ( θ ) 43.5   M Pa 43.5   M Pa
Height of compression zonex 1.14   c m 1.14   c m
Internal force in concrete/reinforcement F s k = F c k 261.8   k N / m 261.8   k N / m
Lever arm of internal forcesz 21.6   c m 21.6   c m
Bending resistance M r k 56.5   k N m / m 56.5   k N m / m
Table A2. Calculation of the characteristic one-way bending resistance under fire exposure using design method for cross-sections subjected to bending without axial force according to ([22] Section 7.3.2). Due to the heating, the reinforcement strength is reduced according to [18].
Characteristic ValueFGC-SlabSolid Slab
Reinforcement temperature after 90   min θ f i , 90 428   ° C 498   ° C
Strength reduction factor k s ( θ ) 0.790.61
Reduced reinforcement tensile strength f y k , f i ( θ ) 396   M Pa 303   M Pa
Height of compression zonex 1.00   c m 0.86   c m
Internal force in concrete/reinforcement F s k = F c k 207.3   k N / m 158.5   k N / m
Lever arm of internal forcesz 21.6   c m 21.7   c m
Bending resistance M R k , f i 44.9   k N m / m 34.4   k N m / m
Table A3. Calculation of the characteristic one-way bending resistance under fire exposure using the simplified calculation method according to ([18] Appendix E, Equation (E3)).
Characteristic ValueFGC-SlabSolid Slab
Bending resistance at normal temperature M r k 56.5   k N m / m 56.5   k N m / m
Reinforcement temperature after 90   min θ f i , 90 428   ° C 498   ° C
Strength reduction factor k s ( θ ) 0.790.61
Bending resistance at fire exposure M R k , f i 44.8   k N m / m 34.2   k N m / m

References

  1. Sobek, W. Non Nobis-über das Bauen in der Zukunft, Volume 1: Ausgehen Muss Man Von Dem, Was Ist; Avedition: Stuttgart, Germany, 2022. [Google Scholar]
  2. Miller, S.A.; John, V.M.; Pacca, S.A.; Horvath, A. Carbon Dioxide Reduction Potential in the Global Cement Industry by 2050. Cem. Concr. Res 2018, 114, 115–124. [Google Scholar] [CrossRef]
  3. Blandini, L. Lightweight and sustainable concrete structures: The ILEK research strategy. In Proceedings of the 6th Fib International Congress, Oslo, Norway, 12–16 June 2022; pp. 1294–1303. [Google Scholar]
  4. Albert, A.; Pfeffer, K.; Schnell, J. Hohlkörperdecken. Beton-Kalender 2017, 106, 519–549. [Google Scholar] [CrossRef]
  5. Nabil, A.; Gamal, M.; Heiza, K.; Hekal, G.M. Voided Slabs As A New Construction Technology-A Review. In Proceedings of the International Conference on Advances in Structural and Geotechnical Engineering, Hurghada, Egypt, 6–9 March 2023. [Google Scholar]
  6. Varshney, H.; Jauhari, N.; Bhatt, H. A Review Study on Bubble Deck Slab. Int. J. Res. Appl. Sci. Eng. Technol. 2017, 5, 2136–2139. [Google Scholar] [CrossRef]
  7. Schmeer, D.; Sobek, W. Gradientenbeton. Beton-Kalender 2019, 108, 456–476. [Google Scholar] [CrossRef]
  8. Schnellenbach-Held, M. Tragverhalten zweiachsiger Hohlkörperdecken. Der Prüfingenieur 2009, 35, 36–46. [Google Scholar] [CrossRef]
  9. Chung, J.; Park, J.; Choi, H. An Analytical Study on the Impact of Hollow Shapes in Biaxial Hollow Slabs. In Proceedings of the 7th International Conference on Fracture Mechanics of Concrete and Concrete Structures (FraMCos-7), Jeju, Republic of Korea, 23–28 May 2010. [Google Scholar]
  10. Schmeer, D. Mesogradierung von Betonbauteilen: Herstellung und Tragverhalten von Betonbauteilen Mit Integrierten Mineralischen Hohlkugeln. Ph.D. Thesis, University of Stuttgart, Stuttgart, Germany, 2021. [Google Scholar]
  11. Alawsi, M.A.; Mhalhal, J.M.; Al-Gasham, T.S.; Abid, S.R. Damage assessment of RC voided slabs experienced extreme fire flame. In Proceedings of the IOP Conference Series: Materials Science and Engineering, Erbil, Iraq, 20–22 December 2020; Volume 1058, p. 012051. [Google Scholar] [CrossRef]
  12. MFPA Leipzig GmbH. Gutachterliche Stellungnahme Cobiax Hohlkörpermodule für Ortbetondecken: Brandschutztechnisches Bemessungskonzept. 2016. Available online: https://www.cobiax.com/intl/de/downloads/ (accessed on 29 April 2024).
  13. Miller, O.; Gericke, O.; Nigl, D.; Kovaleva, D.; Blandini, L. Simulation-Based Investigations of the Load-Bearing Behavior of Concrete Hollow Sphere Slabs Exposed to Fire. Fire 2022, 5, 197. [Google Scholar] [CrossRef]
  14. DIN EN 4102-8:2003-10; Fire Behaviour of Building Materials and Building Components—Part 8: Small Scale Test Furnace. Beuth Verlag GmbH: Berlin, Germany, 2003. [CrossRef]
  15. DIN 4102-2:1977-09; Fire Behaviour of Building Materials and Building Components—Part 2: Building Components; Definitions, Requirements and Tests. Beuth Verlag GmbH: Berlin, Germany, 1977. [CrossRef]
  16. DIN EN 13501-2:2023-12; Fire Classification of Construction Products and Building Elements—Part 2: Classification Using Data from Fire Resistance Tests, Excluding Ventilation Services; German Version EN 13501-2:2023. Beuth Verlag GmbH: Berlin, Germany, 2023. [CrossRef]
  17. DIN EN 60584-1:2013; Thermocouples—Part 1: EMF specifications and tolerances (IEC 60584-1:2013); German version EN 60584-1:2013. Beuth Verlag GmbH: Berlin, Germany, 2014. [CrossRef]
  18. DIN EN 1992-1-2:2010-12; Eurocode 2: Design of Concrete Structures—Part 1–2: General Rules–Structural Fire Design; German Version EN 1990:2004 + AC:2008. Beuth Verlag GmbH: Berlin, Germany, 2010. [CrossRef]
  19. Strahm, B.; Haufe, C.; Blandini, L. Dataset: Replication Data for: Investigations on the Fire Behavior of Functionally Graded Concrete Slabs with Mineral Hollow Spheres, V1, DaRUS. 2024. Available online: https://darus.uni-stuttgart.de/dataset.xhtml?persistentId=doi:10.18419/darus-4194 (accessed on 25 June 2024).
  20. DIN EN 12390-3:2019-10; Testing Hardened Concrete—Part 3: Compressive Strength of Test Specimens; German version EN 12390-3:2019. Beuth Verlag GmbH: Berlin, Germany, 2019. [CrossRef]
  21. Zilch, K.; Zehetmaier, G. Bemessung im Konstruktiven Betonbau: Nach DIN 1045-1 und DIN EN 1992-1-1; Springer: Berlin/Heidelberg, Germany; New York, NY, USA, 2006. [Google Scholar] [CrossRef]
  22. Fib Model Code for Concrete Structures 2010; fib CEB-FIP; Ernst & Sohn: Berlin, Germany, 2013.
  23. Stern, F.; Wilson, R.V.; Coleman, H.W.; Paterson, E.G. Comprehensive Approach to Verification and Validation of CFD Simulations—Part 1: Methodology and Procedures. J. Fluids Eng. 2001, 123, 793–802. [Google Scholar] [CrossRef]
  24. Pfeffer, K. Untersuchung zum Biege- und Durchstanztragverhalten von Zweiachsigen Hohlkörperdecken. Ph.D. Thesis, Technical University of Darmstadt, Düsseldorf, Germany, 2002. [Google Scholar]
  25. Sagadevan, R.; Rao, B.N. Effect of Void Former Shapes on One-way Flexural Behaviour of Biaxial Hollow Slabs. Int. J. Adv. Struct. Eng. 2019, 11, 297–307. [Google Scholar] [CrossRef]
  26. Gay-Lussac, L.J. Sur la dilatation des gaz et des vapeurs. Ann. De Chim. 1802, 43, 137–175. [Google Scholar]
  27. Schmeer, D.; Schönemann, B.; Arkhipkina, O.; Haase, W.; Garrecht, H.; Sawodny, O.; Sobek, W. Entwicklung Einer Ökologischen und Ökonomischen Bauweise Durch den Einsatz Vorgefertigter Multifunktionaler Wandbauteile aus Gradiertem Beton; Forschungsinitiative ZukunftBau; Fraunhofer IRB Verlag: Stuttgart, Germany, 2020; Volume F 3194. [Google Scholar]
  28. Schmidt, E. Versuche zum Wärmeübergang bei natürlicher Konvektion. Chem. Ing. Tech. 1956, 28, 175–180. [Google Scholar] [CrossRef]
Figure 1. (Left) Formwork with installed hollow bodies, reinforcement and thermocouples prior to concreting. (Right) Setup of the small-scale test furnace at the MPA Stuttgart.
Fire 07 00256 g001
Figure 2. (Left) Side view of the experimental setup, with specimen placed on a small-scale test furnace. (Right) Standard Time Temperature Curve (STTC) according to [16] used for the simulations and the experiment, measured in the combustion chamber.
Fire 07 00256 g002
Figure 3. (Left) Top view of the FGC specimens depicting the position of the thermocouples on top of the plate (T). (Right) Cut view of the FGC specimens depicting the position of thermocouples on the lower reinforcement layers (R) and below the hollow bodies (H).
Fire 07 00256 g003
Figure 4. Cross-sections of the investigated FGC-component (Left) and the solid component (Right). Additionally, the vertical position of the thermocouples on top of the plate (T), at the lower reinforcement layers (R) and below the hollow bodies (H), is illustrated.
Fire 07 00256 g004
Figure 5. Isometric view (Left) and cut-through (Right) of the numerical model and mesh of the FGC specimen.
Fire 07 00256 g005
Figure 6. (Left) Results of the mesh convergence study. (Right) Cut through the numerical model showing the surface boundary conditions (BC) (blue: room temperature, red: fire exposure) and the temperature at measurement point R 03 / 05 after 90 min of fire exposure. (Right Top) BC as in small-scale test furnace. (Right Bottom) BC as quasi-infinite slab cut-out.
Fire 07 00256 g006
Figure 7. Upper and lower limits of the thermal conductivity λ (Left) and specific heat capacity c p (Right) of concrete according to [18]. High conductivity λ m a x and low specific heat c p , m i n lead to rapid heating and vice versa. The curve c p , m a x depicts the specific heat capacity for concrete with a moisture content of 3.0%. The peak of the specific heat capacity for c p , m a x at θ = 100   ° C is related to the release and phase change of the bound moisture.
Fire 07 00256 g007
Figure 8. Experimentally (Exp) and numerically (Sim) determined temperatures of the FGC specimen at the measurement points after 90 min fire exposure. (Left) Fire-facing side. (Right) Fire-averse side.
Fire 07 00256 g008
Figure 9. Experimentally (Exp) and numerically (Sim) determined temperatures of the FGC specimen during fire exposure. (Left) Fire-facing side at measurement points H 06 / 08 . (Right) Fire-averse side at measurement point T 05 .
Fire 07 00256 g009
Figure 10. Section of the numerically determined temperature distribution after 90 min fire exposure. (Left) solid cross-section, (Right) FGC cross-section.
Fire 07 00256 g010
Figure 11. Vertical temperature profiles after 90 min fire exposure of the FGC cross-section from the experiment (Exp) and the simulation (Sim). (Left) Vertical profile between the hollow bodies. (Right) Vertical profile in the center of the hollow bodies.
Fire 07 00256 g011
Figure 12. Determined temperatures at characteristic measurement points after 90 min fire exposure of the solid cross-section (SS) and the FGC-cross-section (FGC) from the experiment (Exp), the simulation (Sim) and [18] (EC2). (Left) Fire-facing side. (Right) Fire-averse side.
Fire 07 00256 g012
Figure 13. Images of the fire-facing side of the specimen after 90 min of fire exposure. (Left) Overall view of the specimen, (Right) Detail showcasing a spalled surface.
Fire 07 00256 g013
Table 1. Composition of the utilized concrete mixture as provided by Godel Beton GmbH.
TypeCEM ICEM IIIFARSCAw/z RatioAD
kg/m3 kg/m3 kg/m3 kg/m3 kg/m3 kg/m3
Quantity 140.0 200.0 180.0 655.9 899.6 0.52 8.17
Table 2. Summary of the mechanical properties of hardened concrete and reinforcement used.
PropertyValueData Source
f c m , c u b e , d r y 53.1 M Pa Material test acc. to [20]
f c m , c y l , d r y 43.5 M Pa f c m , c y l , d r y = 0.82 · f c m , c u b e , d r y [21]
f c m , c y l 40.1 M Pa f c m , c y l = 0.92 · f c m , c y l , d r y [21]
E c m 33,360 MPa E c m = 22 , 000 · ( f c m , c y l / 10 ) 0.3 [21]
f y 500.0 M Pa Taken from [22]
Table 3. Comparison of the results from simulation and experiment at the measurement points R 02 / 07  and H 06 / 08  after 90 min of fire exposure.
Data Source R 02 / 07 H 06 / 08 Temperature Difference Δ
T mean Coordinate z T mean Coordinate z
Simulation 511.5   ° C 25   m m 469.0   ° C 50   m m 42.5   K
Experiment 414.2   ° C 25   m m 219.5   ° C 50   m m 194.7   K
Table 4. Comparison of the resulting bending load-bearing capacity under fire exposure. For the evaluation, the peak temperatures obtained from the experiments for the FGC cross-section and from the numerical simulations for the solid cross-section are utilized.
Characteristic ValueFGC-SlabSolid Slab
Characteristic bending resistance M R k 56.5   k N m / m 56.5   k N m / m
Steel temperature θ f i , 90 428 °C498 °C
Reduction factor k s ( θ ) 0.790.61
Reduced steel tensile strength f y k , f i ( θ ) 396   M Pa 303   M Pa
Simplified calculation method [18] M R k , f i 44.8   k N m / m 34.2   k N m / m
Design method for bending [22] M R k , f i 44.9   k N m / m 34.4   k N m / m
Disclaimer/Publisher’s Note: The statements, opinions and data contained in all publications are solely those of the individual author(s) and contributor(s) and not of MDPI and/or the editor(s). MDPI and/or the editor(s) disclaim responsibility for any injury to people or property resulting from any ideas, methods, instructions or products referred to in the content.

