Article

Evaluating the Combustion Performance of the Usual Timbers in Furniture Using a Grey Correlation Method Based on Thermolysis, Ignition, and Flame Spread

1
College of Safety Science and Engineering, Xi’an University of Science and Technology, Xi’an 710054, China
2
Shaanxi Key Laboratory of Prevention and Control of Coal Fire, Xi’an 710054, China
*
Author to whom correspondence should be addressed.
Fire 2024, 7(7), 218; https://doi.org/10.3390/fire7070218
Submission received: 28 May 2024 / Revised: 14 June 2024 / Accepted: 21 June 2024 / Published: 26 June 2024

Abstract

Timber is the most widely used material for furniture in view of its characteristics of light mass, high strength, easy processing, coloring, and decorative appearance. However, the flammability of wood has been frequently associated with increased fire intensity and the rapid spread of fire in buildings. In this paper, the combustion performance of six kinds of common furniture timber was investigated based on thermogravimetric analysis at 25–500 °C, cone calorimetry with 50 kW/m2 thermal radiation intensity, and flame spread experiments with 3 kW/m2 thermal radiation intensity. The ignition, weight loss, thermogenesis, smoke, and flame spread characteristics of these timbers were obtained. Subsequently, a comprehensive index system including thermal stability, heat release ability, smoke production capacity, and flame spreading speed was constructed to evaluate the combustion performance of the selected timbers. In addition, a grey correlation method relying on the game theory to assign weight was proposed for the quantitative analysis of the relevant evaluation indexes. As a result, the combustion performance of the six kinds of timber, which was defined as a specific value from poor to good, was as follows: pine (0.8696) > Chinese fir (0.8568) > Oriented Strandboard (OSB) (0.8425) > density board (0.8122) > plywood (0.8087) > elm (0.7909). Timber with poor combustion performance contributes to the reduction in fire risk in buildings. Our suggestions are of great significance for selecting furniture timber from the perspective of the prevention and control of building fires.

1. Introduction

Building fires are the most common of all urban fire disasters. Undoubtedly, the widespread use of flammable materials in buildings has played an important role in increased fire intensity and the rapid spread of fire. Among other combustible types, furniture has been proven to offer a critical influence due to its higher fire loads and flammable characteristics. Solid wood and wood-based composite panels are the two main sources of timber furniture [1], with a good texture, structural stability, large format, and other features [2,3,4]. However, compared with other furniture materials, such as metal, glass, and plastics, timber has better heat production capacity and flames tend to spread faster [5,6,7]. Therefore, evaluating the combustion performance of timber can provide some reference when making furniture selections, which is conducive to reduce the intensity of burning and the speed of fire development.
Three aspects including heat, smoke, and toxicity can reflect the combustion performance of materials [6,7,8]. Whether it is the EU standard [9] or the Chinese standard [10], timbers are generally divided into various combustible material grades, including flooring, decorative panels, and ceiling materials, in the fire classification system of construction products and building elements. However, for different types of timber, little attention has been paid to their differences in combustion performance. For the specific combustion properties, some scholars have further analyzed the combustion of timber and other materials in terms of heat and smoke through traditional analytical techniques, such as thermogravimetric analysis and the cone calorimeter (CONE) experiment [11,12,13]. Islam et al. [14] introduced combustion efficiency for evaluation by determining the heat release rate (HRR) and peak heat release rate (HRRpeak) by CONE. The combustion efficiency of co-hydrothermal-carbonization-derived hydrochar (49.2–75.2%) was lower than that of raw corn stover (77.2–89.9%) or control hydrochar (75.2–77.9%). Renner et al. [15] investigated the flammability of different wood species with their bark. It was found that oak with bark recorded a significantly lower mass loss rate and had the highest char residue based on the thermogravimetric results. However, the beech, oak, and spruce without bark had higher HRRpeak and heat release capacities compared with the samples with bark. Based on the CONE experimental result, Hansen-Bruhn et al. [16] compared the HRRpeak and total heat release (THR) of three plywood samples and proposed a simple flammability ranking based on the THR. The evaluation of the combustion performance of materials in the above studies was generally based on a single indicator, such as combustion efficiency, HRR, or THR. However, the comprehensive evaluation of combustion performance has not been found to be effective due to the lack of correlation analysis and quantitative methods.
In terms of the evaluation of combustion properties of timbers, Zhang et al. [17] calculated the combustion performance indexes such as ignition index, flammability index and combustibility index of the main components to evaluate the flame-retardant properties of organic fireproof plugging material. Zhu et al. [18] studied the burning properties of the pyrolysis residues of plastics with different particle sizes in terms of ignition index and comprehensive combustion characteristic index. The index evaluation method provides a single response to the composite combustibility of materials. Li et al. [19] used the ignition index, burning intensity, burnout index, and activation energy as evaluation indexes. The relative comparison method was proposed to give the weights of the evaluation indexes, and the linear weighted synthesis method was used to evaluate the catalyst activity. However, some deficiencies are inevitable, such as the difficulty of determining the evaluation criteria, that the contribution of each index is not reasonably defined, and that the evaluation results are easily affected by subjective factors. Janković et al. [20] studied the combustion characteristics (including reactivity evaluation, ignition index, burnout index, combustion performance index, and combustion stability index) of plane tree seeds and found that the plane tree seeds had stable high combustion activity. However, it is difficult to achieve a comprehensive quantitative result for multi-index evaluation. Therefore, we proposed the entropy weight and CRITIC methods to obtain weights. The entropy weight method focuses on the discreteness of the indexes, while the CRITIC method does the opposite and favors correlation. The combined weights could be determined by the game theory, which combines a number of weighting methods. Transformation of multiple indexes results into single-object projects through the grey correlation method is performed to obtain the degree of association. These methods are used in many evaluations, including mine cable fire hazards [21,22,23], the health of power transformers, and coal and gas protrusion risk.
In this paper, the thermogravimetric analysis, cone calorimetry, and flame spread experiments were constructed, firstly, for six kinds of common furniture timbers. Subsequently, an assessment index system for the combustion performance of timber, including ignition, weight loss, thermogenesis, smoke and flame spread was established. To improve the accuracy of the assessment, an entropy and CRITIC combined weighting method was applied to obtain reasonable weights. Subsequently, comprehensive evaluation results were finally available through the grey correlation method. Objectively, evaluating the combustion properties of timber can provide guidance for selecting furniture and reduce the destructiveness of building fires.

2. Materials and Methods

2.1. Materials

Timber materials were selected from six species as follows: elm, pine, Chinese fir, plywood, density board, and Oriented Strandboard (OSB). These species have been widely used as a choice of furniture material in construction over the years. To determine the moisture content of the samples, the six types of timber were dried. It should be noted that the samples were dried at a temperature of 103 ± 2 °C, and the mass was measured every two hours until it was stable. The moisture content of the samples was determined gravimetrically according to the drying method. In addition, the density of the samples was determined by the volume method. The density and moisture content of timber are listed in Table 1.

2.2. Methods

2.2.1. Thermogravimetric Measurements

As shown in Figure 1, the thermogravimetric experiments were mainly carried out using the S65 combustion chamber (S65 combustion chamber with an independent cavity to simulate the environment required for the combustion of materials, built-in weighing device, and external sensors that can collect data on the mass and temperature changes, water chiller, and so on). The experimental samples were sieved timber chips of the six kinds of timber after drying. The initial mass was 4 g. The experimental atmosphere was nitrogen, the gas flow rate was set to 1 L/min, the temperature increase rate was 20 °C/min, and the temperature range was 25–500 °C. To minimize the experimental error and obtain the mass loss variations, the experiment was repeated at least three times or more for each sample.

2.2.2. Cone Calorimeter Experiment

A conical calorimeter manufactured by FTT (Derby, UK) was used, following the ISO 5660-1:2015 standard [24], with a thermal radiation intensity of 50 kW/m2. The experimental samples of 100 mm × 100 mm × 12 mm were placed in a square experimental tray with a side length of 100 mm × 100 mm. All the samples were wrapped in aluminum foil to cover the sides and bottom of the samples, and the ambient temperature during the experimental process was about 26 ± 2 °C, while the relative humidity was 50 ± 5%. The parameters extracted according to ISO 5660-1 were time to ignition (TTI), THR, HRRpeak, smoke produce rate (SPR), and the concentration of CO and CO2.

2.2.3. Flame Spread Experiment

A small-sized flame spreading experimental platform was independently built. As shown in Figure 2, the combustion rack, video acquisition system, and heat source control system constitute the experimental platform. The combustion rack, with a base size of 100 cm × 50 cm and an overall height of 80 cm, was made of stainless steel. The electric heating plate was mounted above the stand to provide 3 kW/m2 of heat source radiation. Surface flame spread was captured using a digital camera for image acquisition. The sampling frame rate was 25 frames/s. The MATLAB program was used to process the video to obtain the change relationship of the flame front distance over time, and then the first derivative of the curve was solved to obtain the flame spread speed. If the flame spread distance was below 5 cm, the flame spread could not be maintained. The six types of timber with the dimensional size of 300 mm × 20 mm × 3 mm were fixed at one end at a height of 15 cm from the heating plate and ignited using a linear ignition source. The experiment was repeated at least three times or more for each sample to obtain a more accurate speed of flame spread.

2.2.4. Comprehensive Evaluation Methods

The normalized data were processed to determine the index weights by the entropy weight method and CRITIC method, respectively [25,26], and the combination weights were determined using the game theory [27]. The specific calculation method to normalize the data is shown below.
Normalization of Data Processing
The standardized processing formula of the entropy weight method is as follows:
Positive Indicators
u i j = x i j m i n ( x i j ) m a x ( x i j ) m i n ( x i j )
Negative Indicators
u i j = m a x ( x i j ) x i j m a x ( x i j ) m i n ( x i j )
In the formula, uij is the jth index of the ith sample object after normalization; min (xij) is the minimum value in the original data; and max (xij) is the maximum value in the original data.
Entropy Weight Method
In information theory, entropy is a measure of uncertainty. The entropy weight method is an objective weighting method, which calculates the information entropy according to the degree of variation of each index [28,29]. If the degree of variation is larger, the information entropy is smaller, the weight is higher, and the indicator has a greater impact on the evaluation results.
The normalized data are calculated by the following steps [30]:
(1) Calculate the contribution of the index, Pij.
P i j = u i j j = 1 n u i j
In the formula, uij is the jth index of the ith sample object after normalization, and Pij is the contribution of the ith object to the jth index.
(2) Calculate the entropy value Ej of the index.
E j = 1 ln n i n P i j ln P i j
(3) Calculate the weight of each evaluation index.
W j = 1 E j j = 1 n 1 E j , j = 1 , 2 , , n
CRITIC Method
The CRITIC method is a comprehensive weighting method for dealing with the correlation between the indexes. Its weight is mainly determined by comparative strength and conflict [31]. For the comprehensive evaluation of multiple indicators, the CRITIC method eliminates the influence of some indicators with strong correlation and reduces the duplication of information between the indicators, which is more conducive to obtaining credible evaluation results.
The normalized data are calculated by the following steps [32]:
(1) Calculate the standard deviation of the jth index.
δ j = i = 1 n ( u i j u j ¯ ) 2 n 1 , j = 1 , 2 , , m
u j ¯ = 1 n i = 1 n u i j , j = 1 , 2 , , m
δj is the standard deviation of the jth evaluation index., and u j ¯ is the average of the jth evaluation index.
(2) Calculate the conflict coefficient within the jth index, Rj.
R j = j = 1 m 1 r i j , i j     j = 1 , 2 , , m
rij is the correlation coefficient between the ith index and the jth index, and the specific calculation formula is as follows:
r i j i , j = 1 n u i u i ¯ u j u j ¯ i = 1 n u i u i ¯ 2 j = 1 n u j u j ¯ 2 , i j
u i ¯ and u j ¯ are the mean values of the ith and jth index in n objects.
(3) Calculate the quantity of information contained in the jth index, Cj.
C j = δ j R j , i j     j = 1 , 2 , , m
(4) Calculate the weight of each jth index, Wj.
W j = C j k = 1 m C j
Game Theory Method
The game theory method is used to determine the weight of the index, which can balance multiple weighting methods [33]. It is feasible to obtain more reasonable indicator weights through game theory. The combined weighting method of game theory was used to combine the weights of indicators which were obtained by the entropy weight method and CRITIC method. Considering the mutual influence and restriction between the indexes, we chose the M weighting methods, as we could then construct M weight vectors uk= [uk1, uk2, …, ukm], k = 1, 2, …, M, where m was the number of indicators. According to our methods and indexes, M took 2, while m took 10 in this process.
(1) Any linear combination of different vectors is as follows [34]:
u = k = 1 L a k u k T , a k > 0
u is the comprehensive weight vector; and ak is a linear combination coefficient.
(2) To coordinate the preference between different weighting methods and obtain a reasonable weight, ak is optimized, and the deviation between u and uk is minimized.
u 1 u 1 T u 1 u 2 T u 1 u L T u 2 u 1 T u 2 u 2 T u 2 u L T u L u 1 T u L u 2 T u L u L T a 1 a 2 a L = u 1 u 1 T u 2 u 2 T u L u L T
(3) The obtained (a1, a2...) is normalized to obtain the weight preference as follows:
a k = a k k = 1 L a k
(4) The comprehensive weight vector obtained by using game theory is as follows:
u = k = 1 L a k · u k T
Grey Correlation Method
The grey correlation method is a multivariable analysis method that can be used to solve the multi-index decision problem [35]. It can indicate the degree of similarity or difference between factors by the degree of correlation between the factors. The specific calculation steps are as follows [36]:
(1) Determine the reference sequence and comparison sequence.
X 0 k = x 0 1 , x 0 2 , , x 0 m , , k = 1 , 2 , m
X i k = x i 1 , x i 2 , , x i m , , k = 1 , 2 , n
X0(k) is the reference sequence, which is a set of data characterizing poor combustion performance derived from the second-level index layer. Xi(k) is the comparison sequence of C1–C10 for each type of timber in the comprehensive evaluation index system, while m and n are the sequence dimensions, respectively.
(2) Calculate the grey correlation coefficient.
After the dimensionless processing of the experimental data, the correlation coefficient is calculated.
ξ i ( i ) = m i n i m i n j Δ ( j ) + ρ m a x i m a x j Δ i ( j ) Δ i ( j ) + ρ m a x i m a x j Δ i ( j )
Δ(j) is the absolute difference between each comparison sample to be evaluated and the reference sample, where miniminjΔ(j) refers to the minimum deviation value, maximaxjΔi(j) refers to the maximum deviation value, ρ is the resolution coefficient, and ρ∈ is [0,1].
(3) Calculate the correlation degree.
The combined weight is brought into the following formula, and the final calculation of the grey correlation degree Ri is as follows:
R i = j = 1 n W j ξ i ( i )

3. Results and Discussion

3.1. Combustion Performance Analysis

3.1.1. Analysis of Thermolysis

The thermal degradation behavior of the timber samples from the thermogravimetric test results is shown in Figure 3. It can be observed that there were three stages in the pyrolysis process, including the following: (1) Light pyrolysis: the initial mass loss occurred due to water evaporation, and then a small amount of polymer (lignin, etc.) began to degrade [37,38,39] and thus the mass of timber was slightly reduced. (2) Fast pyrolysis: the mass loss of timber was accelerated and the Chinese fir, pine, elm, plywood, density board, and OSB samples reached the maximum rate of mass loss at 195 °C, 282 °C, 270 °C, 211 °C, 222 °C, 278 °C, respectively. (3) High-temperature combustion: the final residue of the timber was slowly decomposed, while some carbon was generated with the temperature increase. In addition, the thermal stability of timber can be reflected by the total mass loss. From Figure 3a, the total mass loss of the Chinese fir, pine, elm, plywood, density board, OSB were 92.25%, 91%, 76.03%, 81.7%, 80.36%, and 80.58%, respectively.
The activation energy can be related to the thermal stability of a material, which represents how much energy is required for a reaction. The higher the activation energy, the better the stability when heated. The thermal decomposition process of timber was analyzed by the Coats–Redfern method [40,41,42], and the activation energy results of the Chinese fir, pine, elm, plywood, density board, and OSB were 18.83 kJ·mol−1, 23 kJ·mol−1, 29.42 kJ·mol−1, 23.10 kJ·mol−1, 23.91 kJ·mol−1, and 23.13 kJ·mol−1, respectively. It could be observed that the Chinese fir was poor in thermal stability with the lowest activation energy. Furthermore, the activation energy of the elm was higher than the other timbers and is thus appropriate for furniture.

3.1.2. Analysis of Heat Characteristic

The HRR with 50 kW/m2 thermal radiation intensity was plotted against their corresponding time for the timbers in Figure 4.
It can be noted that there are two peaks in all the curves of Figure 4. The six selected timbers reached the first peak at about 45 s and, among them, the heat release rate of the density board was the highest, which was 197 kW/m2, while the lowest one was the Chinese fir, with a value of 135 kW/m2. As a carbon layer formed, the transfer of heat from the outside to the inside was impeded and the rate of heat release was reduced. However, the carbon layer further oxidized and cracked, allowing heat to enter the interior of the timber thus leading to the second peak [43]. The second peak of the elm and plywood was close at about 248 kW/m2. The second peak of the pine, OSB, and density board were 142 kW/m2,175 kW/m2, and 210 kW/m2, respectively, and appeared at around 400–500 s. Based on these results, the indices representing the heat release capacity of the different timbers have been calculated and are summarized in Table 2.
The heat release index (HRI) determined the ability of timber to release heat in a fire, which was the logarithmic value of the sum of the heat released during the first 6 min of the test. According to Table 2, although the Chinese fir had the highest moisture content, the plywood displayed higher TTI than the other timbers, indicating that plywood was more thermally stable. However, it was observed that the peak heat release rate of elm and the HRI of pine were the highest in all the timbers, which was also reflected violent combustion reactions in fires. Therefore, it is difficult to accurately judge the burning performance of timber by a single index.

3.1.3. Analysis of Smoke Production Characteristic

The SPR curves of timbers with 50 kW/m2 heat radiation intensity are depicted in Figure 5.
Two significant peaks were found in the combustion process. The first peak of the density board, plyboard, elm, pine, and Chinese fir was mainly concentrated at 30 s, while the value of OSB appeared later. Moreover, it was found that the second peak was higher than the first peak, except for the Chinese fir. The second peak of the elm, plywood, density board, and pine were concentrated at about 0.028 m/s2. Generally, the first peak of the SPR was caused by the release of volatile matter. More gases were released as the pore structure of char became larger, making the second peak higher. The flammability of the timbers was characterized by the highest peak of the SPR when the timbers were subjected to fire.
The detailed data of the smoke characteristics of timber are shown in Table 3.
Smoke factor (SF) was characterized as the tendency of timber to produce smoke when combustion occurred. It was the multiplication of the peak heat release rate of the timber and the total amount of smoke produced. The obtained data indicate that the highest peak concentration of CO was in the density board at 0.021%, and the lowest was in the pine at 0.008%. Moreover, the peak concentration of CO was the same in the plywood and OSB. In contrast, the density board showed more damage to people in the fire. Overall, the average peak concentration of CO2 in the wood-based composite panels is higher than in solid wood, which may be caused by the complex composition of the wood-based composite panels. It was noted that the SF of the OSB was highest with 104.34. If the value of the SF was larger, the visibility was worse.

3.1.4. Analysis of Flame Spread

In order to obtain the accurate speed of flame spread, the flame front distance was processed. The results are shown in Figure 6.
It was observed that the flame spread speed of solid wood was faster than the wood-based composite panel. Chinese fir had the fastest flame spread speed with 0.09660 cm/s in the three kinds of solid wood, and this could be ascribed to the differences in the density. Timber with higher density contains more lignocellulose and a small amount of pores and thus the thermal conductivity increases with the increase in density [44,45]. Simultaneously, the density of the elm was close to that of pine, with the values of 0.635 g/cm3 and 0.533 g/cm3, therefore the flame spread speeds were also similar. However, the physical properties and structure of the wood-based composite panels may be changed by adhesives or chemicals, and the flame spread speed may be affected.

3.2. Evaluation of Combustion Performance of Timber

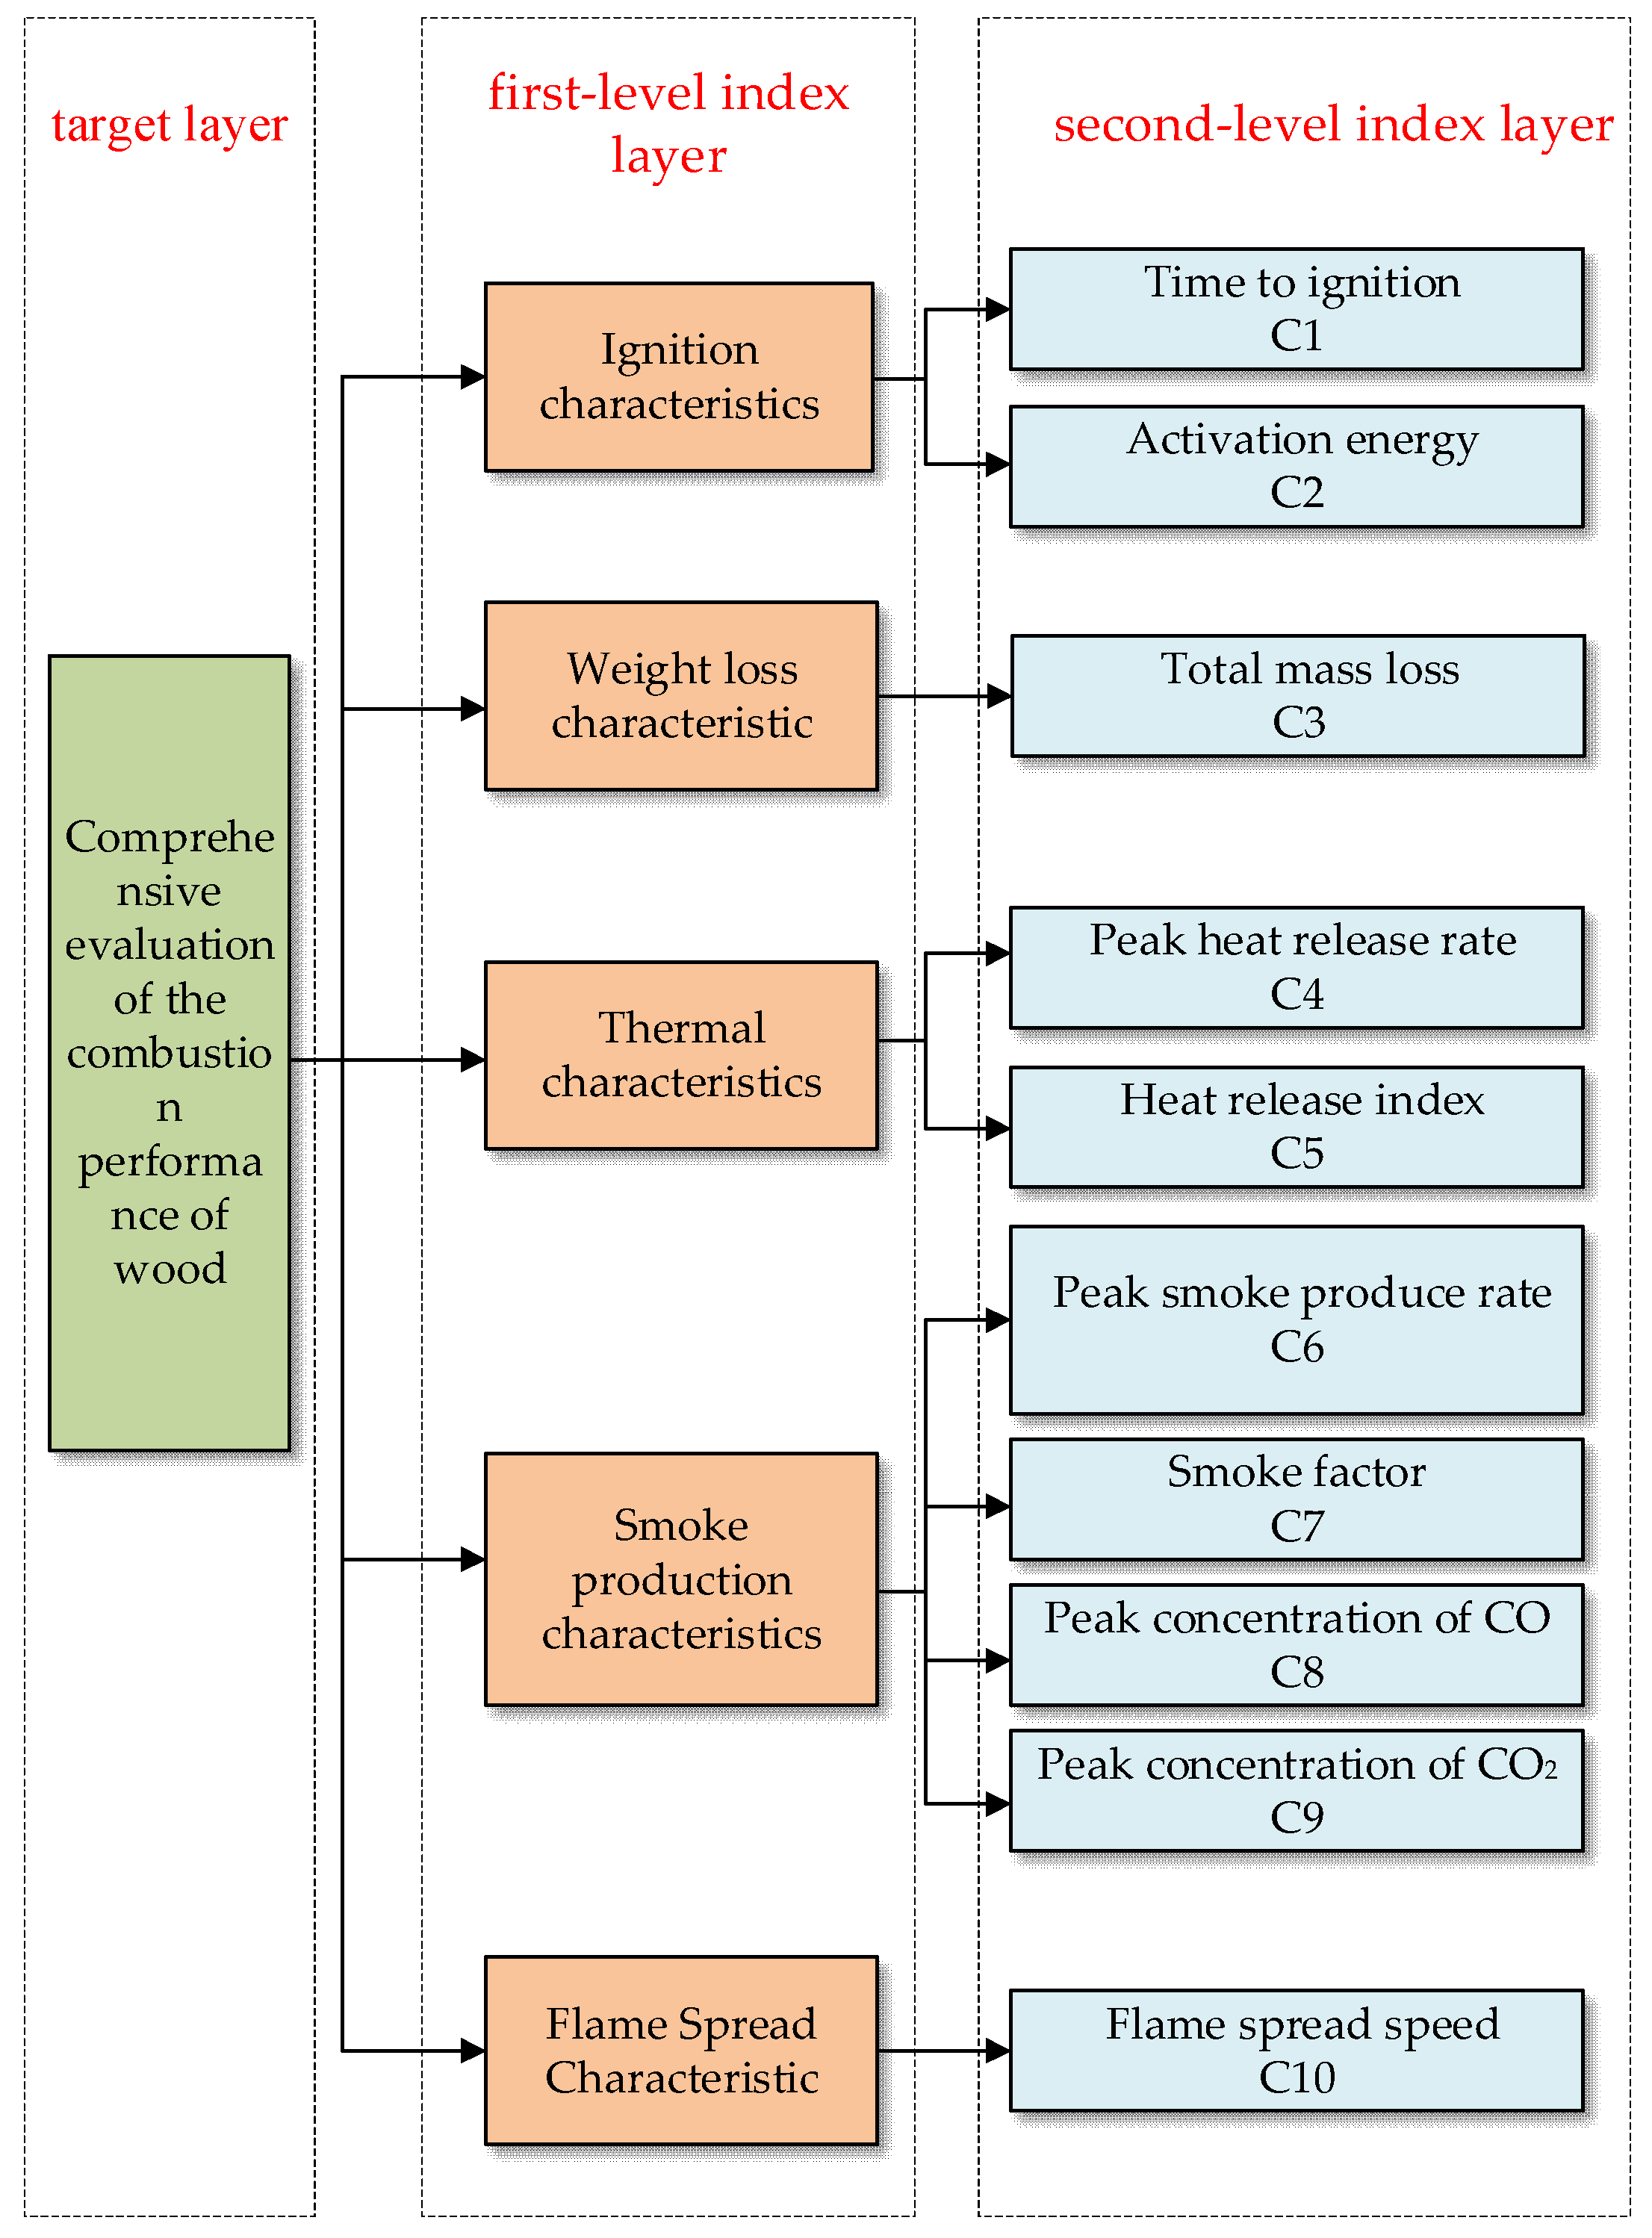
3.2.1. Comprehensive Evaluation Index System

Based on the results of thermogravimetric analysis, cone calorimetry, and flame spread experiments, a comprehensive evaluation index system was constructed and is presented in Figure 7.
To make the evaluation results more comprehensive, we constructed three evaluated gradations, namely the target layer, first-level index layer, and second-level index layer, respectively. It was apparent that the first-level index layer represented almost all the combustion-related characteristics. The specific index, which represented the thermal stability, heat release ability, smoke production capacity, and flame spreading of the selected timbers, could be seen in the second-level index layer. In short, the difference in combustion performance of the timbers could be investigated from the measured parameters of C1–C10.

3.2.2. Weights of Indexes

By focusing on the discreteness in the indexes [46,47] using entropy weight method, the weight calculation of each index could be realized. According to Equations (1)–(5), the information entropy and weight of each combustion characteristic index of the samples were calculated and are shown in Table 4.
According to Equations (6)–(11), the results of the CRITIC method for each index factor of the samples are shown in Table 5.
From the results of Table 4, the Ej was higher and the information from the indexes was lower, therefore the impact on evaluation was lower. In addition, the δj/ u j ¯ and Cj were higher index and the greater weight assigned to the index in Table 5. As the correlation between indexes increased, then the Rj was smaller. Moreover, the combined weight was close to the weight of the entropy weight method and CRITIC method, indicating that the two methods were ideal in weight calculation. The entropy weight method focuses on discreteness, while the CRITIC method does the opposite and favors correlation. Therefore, understanding how to combine the advantages of above methods and thus obtain more comprehensive and actual results was very critical.
Based on the game theory, the combined weights of each index were as follows: C1 (0.0836), C2 (0.0737), C3 (0.0960), C4 (0.1147), C5 (0.0745), C6 (0.2568), C7 (0.0730), C8 (0.0702), C9 (0.0851), C10 (0.0724). It was found that C6 had the highest contribution among the ten indexes during the burning period, while C8 had the least effect on fire. Therefore, we can indicate that the smoke production rate is the most important factor for the combustion performance of timber, followed by the heat release rate.

3.2.3. Evaluation of Combustion Characteristics of the Grey Correlation Method

The evaluation results of the six kinds of timber calculated according to the grey correlation method are shown in Table 6.
The difference in combustion performance between the timbers were compared by a weighted relevance degree (Ri), which expressed the relationship between the burning properties of the timber and the reference sequence. The larger Ri meant that the better the thermal stability of the timber, the worse the combustion performance. The Ri of all the timber in Table 6 was close to 0.8, which indicated that the influence of each index on combustion performance was relatively balanced. Moreover, the Ri showed that elm exhibited high combustion performance, which indicated that the proportion of elm in the selection of furniture materials should be reduced. Meanwhile, it was necessary to improve the usage rate of pine or Chinese fir in furniture to ensure safety.

4. Conclusions

Flammability experiments of six furniture timbers were conducted to establish a comprehensive evaluation system for fire hazards, which was composed of thermal stability, heat release ability, smoke production capacity, and flame spreading speed.
The highest mass loss rate, 92.25%, was obtained for the Chinese fir during the thermal decomposition process, while the elm had the lowest mass loss rate of 76.03% from 25 °C to 500 °C. A similar conclusion about the activation energy for six timbers was found, which revealed that the thermal stability of the elm was considered greater than the other timbers. From the CONE experiments, the elm showed a significantly higher peak of HRR among the timbers at about 251.71 kW/m2, while the OSB was the highest value in HRI. However, the smoke production characteristics of timber were more complicated due to their different compositions. The density board was the highest in the peak concentration of CO at about 0.021%, while the elm was the highest in the peak concentration of CO2 at about 0.586%, and their values of SF was not significant among all the timbers. Furthermore, the flame spread rate of the density board was the slowest with 0.03973 cm/s, probably due to its multiple compositions. Utilizing the experimental data, an index system, which comprises 5 primary indices and 10 secondary indices, was established. The weight calculation results of the secondary indices from the entropy weight method and CRITIC method exhibited an obvious difference that the discreteness of entropy weight method was far better than that of CRITIC method, while the correlation of the CRITIC method for each index was superior to that of the entropy weight method. Consequently, a modified evaluation method combining the entropy weight method and the CRITIC method was proposed, which effectively associated the discreteness and the correlation of indexes and thus showed that the smoke production rate was the most critical factor for the fire hazards. Eventually, based on the grey correlation method, the combustion performance of timber was evaluated comprehensively, from poor to good, as follows: pine (0.8696) > Chinese fir (0.8568) > OSB (0.8425) > density board (0.8122) > plywood (0.8087) > elm (0.7909). Compared to the burnout index, the combustion performance index, and other evaluation methods, it is obvious that our results are more comprehensive in the consideration of combustion performance. Therefore, it is suggested that in the selection of building materials, reference should be made to the ranking of combustion performance determined in this study.

Author Contributions

Conceptualization, methodology, validation, formal analysis, investigation, resource, writing—review and editing, funding acquisition, Z.Y.; methodology, validation, formal analysis, writing—original draft, date curation, J.S.; Investigation, methodology, validation, L.X. and H.Z. All authors have read and agreed to the published version of the manuscript.

Funding

This research was funded by the National Natural Science Foundation of China (No. 52274227).

Institutional Review Board Statement

Not applicable.

Informed Consent Statement

Not applicable.

Data Availability Statement

Data are contained within the article.

Conflicts of Interest

The authors declare no conflicts of interest.

References

  1. Zhang, Z.; Zhu, J.; Qi, Q. Research on the Recyclable Design of Wooden Furniture Based on the Recyclability Evaluation. Sustainability 2023, 15, 16758. [Google Scholar] [CrossRef]
  2. Richter, F.; Jervis, F.X.; Huang, X.; Rein, G. Effect of oxygen on the burning rate of wood. Combust. Flame 2021, 234, 111591. [Google Scholar] [CrossRef]
  3. Švajlenka, J.; Kozlovská, M. Evaluation of the efficiency and sustainability of timber-based construction. J. Clean. Prod. 2020, 259, 120835. [Google Scholar] [CrossRef]
  4. Wimmers, G. Wood: A construction material for tall buildings. Nat. Rev. Mater. 2017, 2, 17051. [Google Scholar] [CrossRef]
  5. Caniato, M.; Marzi, A.; da Silva, S.M.; Gasparella, A. A review of the thermal and acoustic properties of materials for timber building construction. J. Build. Eng. 2021, 43, 103066. [Google Scholar] [CrossRef]
  6. Alexakis, D.E. Suburban areas in flames: Dispersion of potentially toxic elements from burned vegetation and buildings. Estimation of the associated ecological and human health risk. Environ. Res. 2020, 183, 109153. [Google Scholar] [CrossRef] [PubMed]
  7. Chen, T.; Sjöblom, J.; Ström, H. Numerical investigations of soot generation during wood-log combustion. Appl. Energy 2022, 325, 119841. [Google Scholar] [CrossRef]
  8. Singh, D.; Tassew, D.D.; Nelson, J.; Chalbot, M.C.G.; Kavouras, I.G.; Tesfaigzi, Y.; Demokritou, P. Physicochemical and toxicological properties of wood smoke particulate matter as a function of timber species and combustion condition. J. Hazard. Mater. 2023, 441, 129874. [Google Scholar] [CrossRef]
  9. BS EN 13501-1: 2018; Fire Classification of Construction Products and Building Elements. Classification Using Data from Reaction to Fire Tests. BSl Standards Publication: London, UK, 2019.
  10. GB 8624-2012; Classification for Burning Behavior of Building Materials and Products, General Administration of Quality Supervision, Inspection and Quarantine (AOSIQ). The Standardization Administration (SAC) of the People’s Republic of China: Beijing, China, 2012.
  11. Spearpoint, M.J.; Quintiere, J.G. Predicting the piloted ignition of wood in the cone calorimeter using an integral model—Effect of species, grain orientation and heat flux. Fire Saf. J. 2001, 36, 391–415. [Google Scholar] [CrossRef]
  12. Massuque, J.; de Sousa, K.I.R.; Trugilho, P.F. Effect of fibre and vessel biometry on wood combustibility of native Miombo tree species. South. For. 2021, 83, 269–275. [Google Scholar] [CrossRef]
  13. Xu, W.; Wu, X.; Wen, Q.; Li, S.; Song, Y.; Shi, B. Effects of collagen fiber addition on the combustion and thermal stability of natural rubber. J. Leather Sci. Eng. 2020, 2, 27. [Google Scholar] [CrossRef]
  14. Islam, M.T.; Reza, M.T. Evaluation of fuel and combustion properties of hydrochar derived from Co-hydrothermal carbonization of biomass and plastic. Biomass Bioenergy 2023, 172, 106750. [Google Scholar] [CrossRef]
  15. Renner, J.-S.; Mensah, R.-A.; Jiang, L.; Xu, Q. A critical assessment of the fire properties of different wood species and bark from small-and bench-scale fire experiments. J. Therm. Anal. Calorim. 2023, 148, 1423–1434. [Google Scholar] [CrossRef]
  16. Hansen-Bruhn, I.; Hull, T.R. Flammability and burning behaviour of fire protected timber. Fire Saf. J. 2023, 140, 103918. [Google Scholar] [CrossRef]
  17. Zhang, J.-Q.; Huang, D.-Y.; Luo, S.; Huang, Y.-B.; Guo, Y.; Liu, R.; Ding, Y. Assessment of micro-scale thermal behaviors and combustion performance of organic fireproof plugging material in air atmosphere. J. Vinyl Addit. Technol. 2022, 28, 788–798. [Google Scholar] [CrossRef]
  18. Zhu, H.-M.; He, D.-L.; Duan, H.; Yin, H.; Chen, Y.-F.; Chao, X.; Zhang, X.-M.; Gong, H.-F. Study on coupled combustion behaviors and kinetics of plastic pyrolysis by-product for oil. Energy 2023, 262, 125452. [Google Scholar] [CrossRef]
  19. Li, Y.-C.; Wang, Y.-L.; Wang, J.-F.; Cui, S.-P.; Li, Z.-M.; Meng, W.-Y. Research on coal combustion catalysts for cement kiln via comprehensive evaluation method based on combustion characteristics. Case Stud. Therm. Eng. 2023, 50, 103440. [Google Scholar] [CrossRef]
  20. Janković, B.; Dodevski, V. The combustion performances and thermo-oxidative degradation kinetics of plane tree seeds (PTS) (Platanus orientalis L.). Energy 2018, 154, 308–318. [Google Scholar] [CrossRef]
  21. Wang, W.-F.; Huo, Y.-H.; Kang, F.; Ren, H.; Wang, Z.-X.; Yang, B. Comprehensive evaluation of mine cable fire hazards based on entropy weight-grey correlation method. J. Therm. Anal. Calorim. 2023, 148, 4843–4851. [Google Scholar] [CrossRef]
  22. Manoj, T.; Ranga, C.; Abu-Siada, A.; Ghoneim, S.S. Analytic Hierarchy Processed Grey Relational Fuzzy Approach for Health Assessment of Power Transformers. IEEE Trans. Dielectr. Electr. Insul. 2024, 31, 1480–1489. [Google Scholar] [CrossRef]
  23. Qi, Y.; Xue, K.-L.; Wang, W.; Cui, X.-C.; Liang, R.; Wu, Z.-W. Coal and gas protrusion risk evaluation based on cloud model and improved combination of assignment. Sci. Rep. 2024, 14, 4551. [Google Scholar] [CrossRef]
  24. ISO 5660-1:2015; Reaction-to-Fire Tests—Heat Release, Smoke Production and Mass Loss Rate. Part 1: Heat Release Rate (Cone Calorimeter Method) and Smoke Production Rate (Dynamic Measurement). The International Organization for Standardization (ISO): Geneva, Switzerland, 2015.
  25. Ma, L.; Zuo, Z.; Zhao, B.; Li, L. Weight Calculation of GSM-R Network Quality of Service Evaluation Indexes Based on Analytic Hierarchy Process and Entropy Weight Method. In Proceedings of the 2020 International Symposium on Automation, Information and Computing (ISAIC 2020), Beijing, China, 2–4 December 2020. [Google Scholar]
  26. Chen, Y.-L.; Shen, S.-L.; Zhou, A.-N. Assessment of red tide risk by integrating CRITIC weight method, TOPSIS-ASSETS method, and Monte Carlo simulation. Environ. Pollut. 2022, 314, 120254. [Google Scholar] [CrossRef]
  27. Gao, Z.; Ma, D.; Guo, X.; Wang, W.; Wang, Z. The comprehensive assessment method of concrete damage after disastrous fire based on game theory-normal cloud model. Math. Probl. Eng. 2019, 2019, 5159497. [Google Scholar] [CrossRef]
  28. Shi, D.-C.; Guo, Y.-J.; Gu, X.-X.; Feng, G.-Z.; Xu, Y.; Sun, S. Evaluation of the ventilation system in an LNG cargo tank construction platform (CTCP) by the AHP-entropy weight method. Build. Simul. 2022, 15, 1277–1294. [Google Scholar] [CrossRef]
  29. Wan, Q.; Yu, Y. Power load pattern recognition algorithm based on characteristic index dimension reduction and improved entropy weight method. Energy Rep. 2020, 6, 797–806. [Google Scholar] [CrossRef]
  30. Chen, Z. Port logistics function evaluation model based on entropy weight TOPSIS method. Discret. Dyn. Nat. Soc. 2022, 2022, 5006900. [Google Scholar] [CrossRef]
  31. Haktanir, E.; Kahraman, C. A Novel CRITIC Based Weighted FMEA Method: Application to COVID-19 Blood Testing Process. J. Mult.-Valued Log. Soft Comput. 2021, 37, 247–275. [Google Scholar]
  32. Zhang, Q.; Liu, C.; Guo, S.; Wang, W.; Luo, H.; Jiang, Y. Evaluation of the rock burst intensity of a Cloud Model based on the CRITIC method and the Order Relation Analysis Method. Min. Metall. Explor. 2023, 40, 1849–1863. [Google Scholar] [CrossRef]
  33. Han, X.; Zhao, S.; Wei, Z.; Bai, W. Planning and overall economic evaluation of photovoltaic-energy storage station based on game theory and analytic hierarchy process. IEEE Access 2019, 7, 110972–110981. [Google Scholar] [CrossRef]
  34. Ju, W.; Wu, J.; Kang, Q.; Jiang, J.; Xing, Z. Fire risk assessment of subway stations based on combination weighting of game theory and topsis method. Sustainability 2022, 14, 7275. [Google Scholar] [CrossRef]
  35. Ren, S.-J.; Wang, C.-P.; Xiao, Y.; Deng, J.; Tian, Y.; Song, J.-J.; Cheng, X.-J.; Sun, G.-F. Thermal properties of coal during low temperature oxidation using a grey correlation method. Fuel 2020, 260, 116287. [Google Scholar] [CrossRef]
  36. Li, Z.; Zhang, M.; Yang, Z.; Liu, Y.; Yu, J. Exothermic characteristics of coal during low-temperature oxidation based on grey correlation method. Energy Rep. 2022, 8, 6744–6752. [Google Scholar] [CrossRef]
  37. Wang, S.-S.; Zou, C.; Yang, H.-P.; Lou, C.; Cheng, S.-Z.; Peng, C.; Wang, C.; Zou, H.-R. Effects of cellulose, hemicellulose, and lignin on the combustion behaviours of biomass under various oxygen concentrations. Bioresour. Technol. 2021, 320, 124375. [Google Scholar] [CrossRef]
  38. Hu, J.; Jiang, X.-X. Pyrolysis characteristics and kinetics of lignin: Effect of starting lignins. Energy Sources Part A 2022, 44, 8096–8108. [Google Scholar] [CrossRef]
  39. Hao, H.-L.; Tam, L.H.; Lu, Y.; Lau, D. An atomistic study on the mechanical behavior of bamboo cell wall constituents. Compos. Part B 2018, 151, 222–231. [Google Scholar] [CrossRef]
  40. Elmay, Y.; Jeguirim, M.; Trouvé, G.; Said, R. Kinetic analysis of thermal decomposition of date palm residues using Coats–Redfern method. Energy Sources Part A 2016, 38, 1117–1124. [Google Scholar] [CrossRef]
  41. Huang, X.-J.; Mo, W.-L.; Ma, Y.-Y.; He, C.-Q.; Syls, Y.; Wei, X.-Y.; Fan, X.; Yang, X.-Q.; Zhang, S.-P. Pyrolysis kinetic analysis of sequential extract residues from Hefeng subbituminous coal based on the Coats-Redfern method. ACS Omega 2022, 7, 21397–21406. [Google Scholar] [CrossRef]
  42. Chen, L.; Hu, J.; Han, Q.; Xie, A.-Q.; Zhou, Z.; Yang, Z.-K.; Tang, Q.-W.; Mi, B.-B.; Wu, F.-F. Application of distributed activation energy model and Coats-Redfern integration method in the study of industrial lignin pyrolysis kinetics. Biomass Convers. Biorefinery 2022, 1–11. [Google Scholar] [CrossRef]
  43. Sanned, E.; Mensah, R.A.; Försth, M.; Das, O. The curious case of the second/end peak in the heat release rate of wood: A cone calorimeter investigation. Fire Mater. 2023, 47, 498–513. [Google Scholar] [CrossRef]
  44. Ngohe-Ekam, P.S.; Meukam, P.; Menguy, G.; Girard, P. Thermophysical characterisation of tropical wood used as building materials: With respect to the basal density. Constr. Build. Mater. 2006, 20, 929–938. [Google Scholar] [CrossRef]
  45. Wang, E.; Shi, Z.; Chen, M.; Tang, S.; Zhang, X.; Zhang, W. Investigation of effective thermal conductivity of SIC foam ceramics with various pore densities. Open Phys. 2022, 20, 58–65. [Google Scholar] [CrossRef]
  46. Shen, Z.; Zhao, Q.; Fang, Q. Analysis of green traffic development in Zhoushan based on entropy weight TOPSIS. Sustainability 2021, 13, 8109. [Google Scholar] [CrossRef]
  47. Li, Y.; Zhang, Q.; Wang, L.; Liang, L. Regional environmental efficiency in China: An empirical analysis based on entropy weight method and non-parametric models. J. Clean. Prod. 2020, 276, 124147. [Google Scholar] [CrossRef]
Figure 1. Thermogravimetric experimental system. (1. S65 combustion chamber; 2. data collection system; 3. nitrogen cylinder; 4. water chiller; 5. insulating brick; 6. weighing instrument; and 7. crucible protrusion platform).
Fire 07 00218 g001
Figure 2. Small-scale flame speed experimental platform. (1. Heat controller; 2. electric heating plate; 3. timber; 4. combustion rack; 5. computer; and 6. camera).
Fire 07 00218 g002
Figure 3. (a) Mass loss curves of timber samples in N2 with heating rate of 20 °C/min; (b) Mass loss rate curves of timber samples in N2 with heating rate of 20 °C/min.
Fire 07 00218 g003
Figure 4. Heat release rate curves of timbers with 50 kW/m2 thermal radiation intensity.
Fire 07 00218 g004
Figure 5. Smoke production rate of timbers under 50 kW/m2 thermal radiation intensity.
Fire 07 00218 g005
Figure 6. Flame spread speed under the thermal radiation intensity of 3 kW/m2.
Fire 07 00218 g006
Figure 7. Comprehensive evaluation index system for combustion performance of timber.
Fire 07 00218 g007
Table 1. Density and moisture content parameters for the six timber species.
SampleDensity (g/cm3)Moisture Content (%)
Chinese fir0.2906.95
Pine0.5336.02
Elm0.6356.32
Plywood0.5456.35
Density board0.6586.90
OSB0.5665.98
Table 2. Experimental results of thermal characteristic parameters.
SampleTTI(s)HRRpeak (kW/m2)HRI
Chinese fir9135.131.90
Pine17180.101.99
Elm21251.711.94
plywood35247.181.92
Density board19210.681.95
OSB17186.792.02
Table 3. Experimental results of smoke characteristic parameters.
SampleSPRpeak (m2/s)Peak Concentration of CO (%)Peak Concentration of CO2 (%)SF (kW/m2)
Chinese fir0.0237000.0120.27724.95
Pine0.0132000.0080.35049.17
Elm0.0283000.0170.58680.12
Plywood0.0272000.0090.52167.99
Density board0.0284000.0210.47464.12
OSB0.0280840.0090.394104.34
Table 4. Calculation results of entropy weight method.
Index FactorsEj1-EjWeight
C10.84510.15490.0836
C20.86460.13540.0730
C30.82380.17620.0951
C40.78640.21360.1152
C50.86530.13650.0737
C60.51510.48490.2616
C70.86550.13450.0726
C80.87160.12840.0693
C90.84320.15680.0846
C100.86790.13210.0713
Table 5. CRITIC method calculation results.
Index Factors δ j / u j ¯ RjCjWeight
C10.3299.1913.0220.0852
C20.32010.7913.4570.0975
C30.40011.0384.4110.1244
C40.3799.1873.4840.0983
C50.3719.4923.5260.0995
C60.3928.9483.5090.0990
C70.3409.1473.1090.0877
C80.4038.6773.4980.0987
C90.3719.5883.5540.1002
C100.37610.3273.8790.1094
Table 6. Evaluation results of grey correlation method.
SampleRiSampleRi
Chinese fir0.8568Plywood0.8087
Pine0.8696Density board0.8122
Elm0.7909OSB0.8425
Disclaimer/Publisher’s Note: The statements, opinions and data contained in all publications are solely those of the individual author(s) and contributor(s) and not of MDPI and/or the editor(s). MDPI and/or the editor(s) disclaim responsibility for any injury to people or property resulting from any ideas, methods, instructions or products referred to in the content.

