Article

Wildfire Susceptibility Prediction Based on a CA-Based CCNN with Active Learning Optimization

College of Mechanical and Electronic Engineering, Nanjing Forestry University, Nanjing 210037, China
*
Author to whom correspondence should be addressed.
Fire 2024, 7(6), 201; https://doi.org/10.3390/fire7060201
Submission received: 21 May 2024 / Revised: 10 June 2024 / Accepted: 13 June 2024 / Published: 16 June 2024

Abstract

:
Wildfires cause great losses to the ecological environment, economy, and people’s safety and belongings. As a result, it is crucial to establish wildfire susceptibility models and delineate fire risk levels. It has been proven that the use of remote sensing data, such as meteorological and topographical data, can effectively predict and evaluate wildfire susceptibility. Accordingly, this paper converts meteorological and topographical data into fire-influencing factor raster maps for wildfire susceptibility prediction. The continuous convolutional neural network (CCNN for short) based on coordinate attention (CA for short) can aggregate different location information into channels of the network so as to enhance the feature expression ability; moreover, for different patches with different resolutions, the improved CCNN model does not need to change the structural parameters of the network, which improves the flexibility of the network application in different forest areas. In order to reduce the annotation of training samples, we adopt an active learning method to learn positive features by selecting high-confidence samples, which contributes to enhancing the discriminative ability of the network. We use fire probabilities output from the model to evaluate fire risk levels and generate the fire susceptibility map. Taking Chongqing Municipality in China as an example, the experimental results show that the CA-based CCNN model has a better classification performance; the accuracy reaches 91.7%, and AUC reaches 0.9487, which is 5.1% and 2.09% higher than the optimal comparative method, respectively. Furthermore, if an accuracy of about 86% is desired, our method only requires 50% of labeled samples and thus saves about 20% and 40% of the labeling efforts compared to the other two methods, respectively. Ultimately, the proposed model achieves the balance of high prediction accuracy and low annotation cost and is more helpful in classifying fire high warning zones and fire-free zones.

1. Introduction

Wildfire poses a serious threat to ecosystems and human society. The frequency and intensity of wildfires are on the rise globally, which causes huge losses to the ecological environment, economy, and people’s safety and belongings. To effectively manage forest areas and reduce fire risks, it has become an urgent and important task to establish efficient wildfire susceptibility models and delineate fire risk level zones.
Wildfire susceptibility is influenced by various factors, such as climate, topography, vegetation, and human factors. Among them, meteorological and topographical factors are the two most critical indicators [1,2,3,4]. Meteorological factors include precipitation, temperature, humidity, wind speed, etc., which are closely related to fire occurrence and its intensity. Topographical factors, such as elevation, slope, and aspect, play an important part in influencing the incidence, spread, and movement of wildfires [5,6]. During the past decades, meteorological and topographical information has been obtained through various channels, such as remote sensing for obtaining detailed information on vegetation conditions, soil moisture, and fire traces [7,8], while GIS is used for mapping fire dynamics and generating fire hazard maps [9,10].
Traditional machine learning methods such as random forests [11], logistic regression [12], support vector machines [8], multilayer perceptron neural networks [13], and artificial neural networks [14,15] have been used for predicting wildfire susceptibility. However, such strategies require the selection of specific features based on a particular region, and thus, a given model can only be applicable to the task of fire susceptibility prediction in a particular scene. In addition, when dealing with complex nonlinear problems, machine learning has a relatively weak generalization capability, which hampers its ability to capture complex relationships and distributions of data.
The convolutional neural network (CNN) has found extensive applications in object recognition, target detection, robotics, and natural language processing, thanks to its powerful feature learning capabilities [16,17] in recent years. Zhang et al. [18] have attempted to use Yunnan Province as a study area and have predicted forest fire susceptibility using a CNN model. They verified the effectiveness of CNN in the task of modeling forest fire susceptibility. Although CNN can fully utilize neighborhood information and extract multi-level representations from input data, it still faces some challenges [19]. Since convolution kernels of CNN are discrete, structural parameters, including the sizes of convolutional kernels and convolutional steps, need to be readjusted when facing input images with different resolutions. To address the above limitations, a CCNN architecture was built by equipping a CNN with continuous convolutional kernels [20]. CCNN eliminates the down-sampling layers and task-dependent structural parameter settings required by current CNN architectures and is therefore suitable for tasks on data of arbitrary resolutions, dimensions, and lengths.
The attention mechanism enhances the model’s ability to express features of the input images by focusing more on key information in the image. In this work, we embed the CA module into the feature extraction network of CCNN so as to enhance the model’s feature expression capability. In addition, we introduce an active learning method based on two types of complementary training strategies, which can achieve high prediction performance with as few training samples as possible, thus reducing the annotation cost. The proposed model predicts wildfire susceptibility. In the method, meteorological and topographical data are processed by ArcGIS software, including rasterization, projection, resampling, and other operations, and these data are converted into raster maps of fire-influencing factors. The raster maps are then partitioned into small patches as inputs of the proposed model. As far as we know, the most similar to this work is the literature [18]; however, the aspects of our method that differ from the literature [18] are mainly in the following two points: (1) Instead of CNN structure in the literature [18], the proposed method adopts CCNN and improve feature extraction network of CCNN based on CA module. The model can process input patches of different sizes without modifying the structural parameters of the network, such as sizes of convolution kernels and convolution steps, which makes the network application more flexible. (2) We introduce an active learning method during the training process, which improves the discriminative ability of the network and reduces the annotation cost. The following points summarize the contributions of this work:
  • In order to capture the spatial distribution characteristics of pixels and the correlation between local regions in the fire-influencing factor raster map, we embed the CA module into the feature extraction network of CCNN in order to aggregate different location information into channels and thereby model the global information of the fire-influencing factor raster map;
  • We adopt an active learning approach based on two types of complementary learning strategies in order to improve the network’s discriminative performance by prioritizing the selection of fire-influencing factor patches with high confidence. Compared with traditional learning methods, the model can achieve a balance of high prediction accuracy and low annotation cost;
  • We adopt the CA-based CCNN to output the fire probability of fire-influencing factor raster patches. Instead of fixed input patches used in CNN, the proposed method allows different patch sizes without changing the structural parameters of the model, which contributes to improving the application flexibility of the wildfire susceptibility prediction model in different scenes.

2. Study Area and Data Sources

2.1. Study Area

As shown in Figure 1, Chongqing Municipality is located in southwestern China, and its geographical location is between N Lat. 28°10′ to 32°13′ and E Long. 105°11′ to 110°11′. Chongqing is densely vegetated, with more than 55 percent of the area covered by forests. Vegetation types are diverse, with subtropical evergreen broad-leaved forests and deciduous broad-leaved forests at low and middle altitudes and alpine mixed coniferous and broad-leaved forests, alpine meadows, and mixed coniferous and broad-leaved forests at high altitudes. Due to the rich vegetation, wildfires are relatively frequent. The terrain is complex, with mountains accounting for more than 70% of the topographical areas. Chongqing is well known as the ‘stove’ in China. In summer, the highest temperature can reach 42 °C, and the average temperature is above 32 °C; therefore, wildfires occur more frequently.

2.2. Data Sources

Historical wildfire data sources from the Fire Information for Resource Management System website (https://firms.modaps.eosdis.nasa.gov/map/) (accessed on 6 October 2023) provided by the National Aeronautics and Space Administration. Records were derived from the fire products provided by Moderate-resolution Imaging Spectroradiometer (MODIS) from the Terra and Aqua satellites. The product covers information such as the time of fire occurrence, geographic location, and confidence of the fire point. And the spatial resolution is 1 km. We selected fire point records of years from 2012 to 2017 with frequent wildfires.
In this work, topographical and meteorological factors are used for fire susceptibility prediction. The topographical data, including elevation, slope, and aspect, are obtained from the Geospatial Data Cloud site (https://www.gscloud.cn/) (accessed on 6 October 2023) of the Computer Network Information Center, Chinese Academy of Sciences, and further calculated to obtain slope, elevation, and aspect by using the geographic data processing software. Four meteorological factors, including temperature, precipitation, wind speed, and relative humidity, are from the National Earth System Science Data Center, National Science & Technology Infrastructure of China (http://www.geodata.cn) (accessed on 6 October 2023). The spatial resolution is 1 km, and the temporal resolution is month-by-month. As the occurrence of wildfires in Chongqing shows obvious seasonality, therefore, we apply the data in summer for modeling, namely, from June to August.

3. Methods

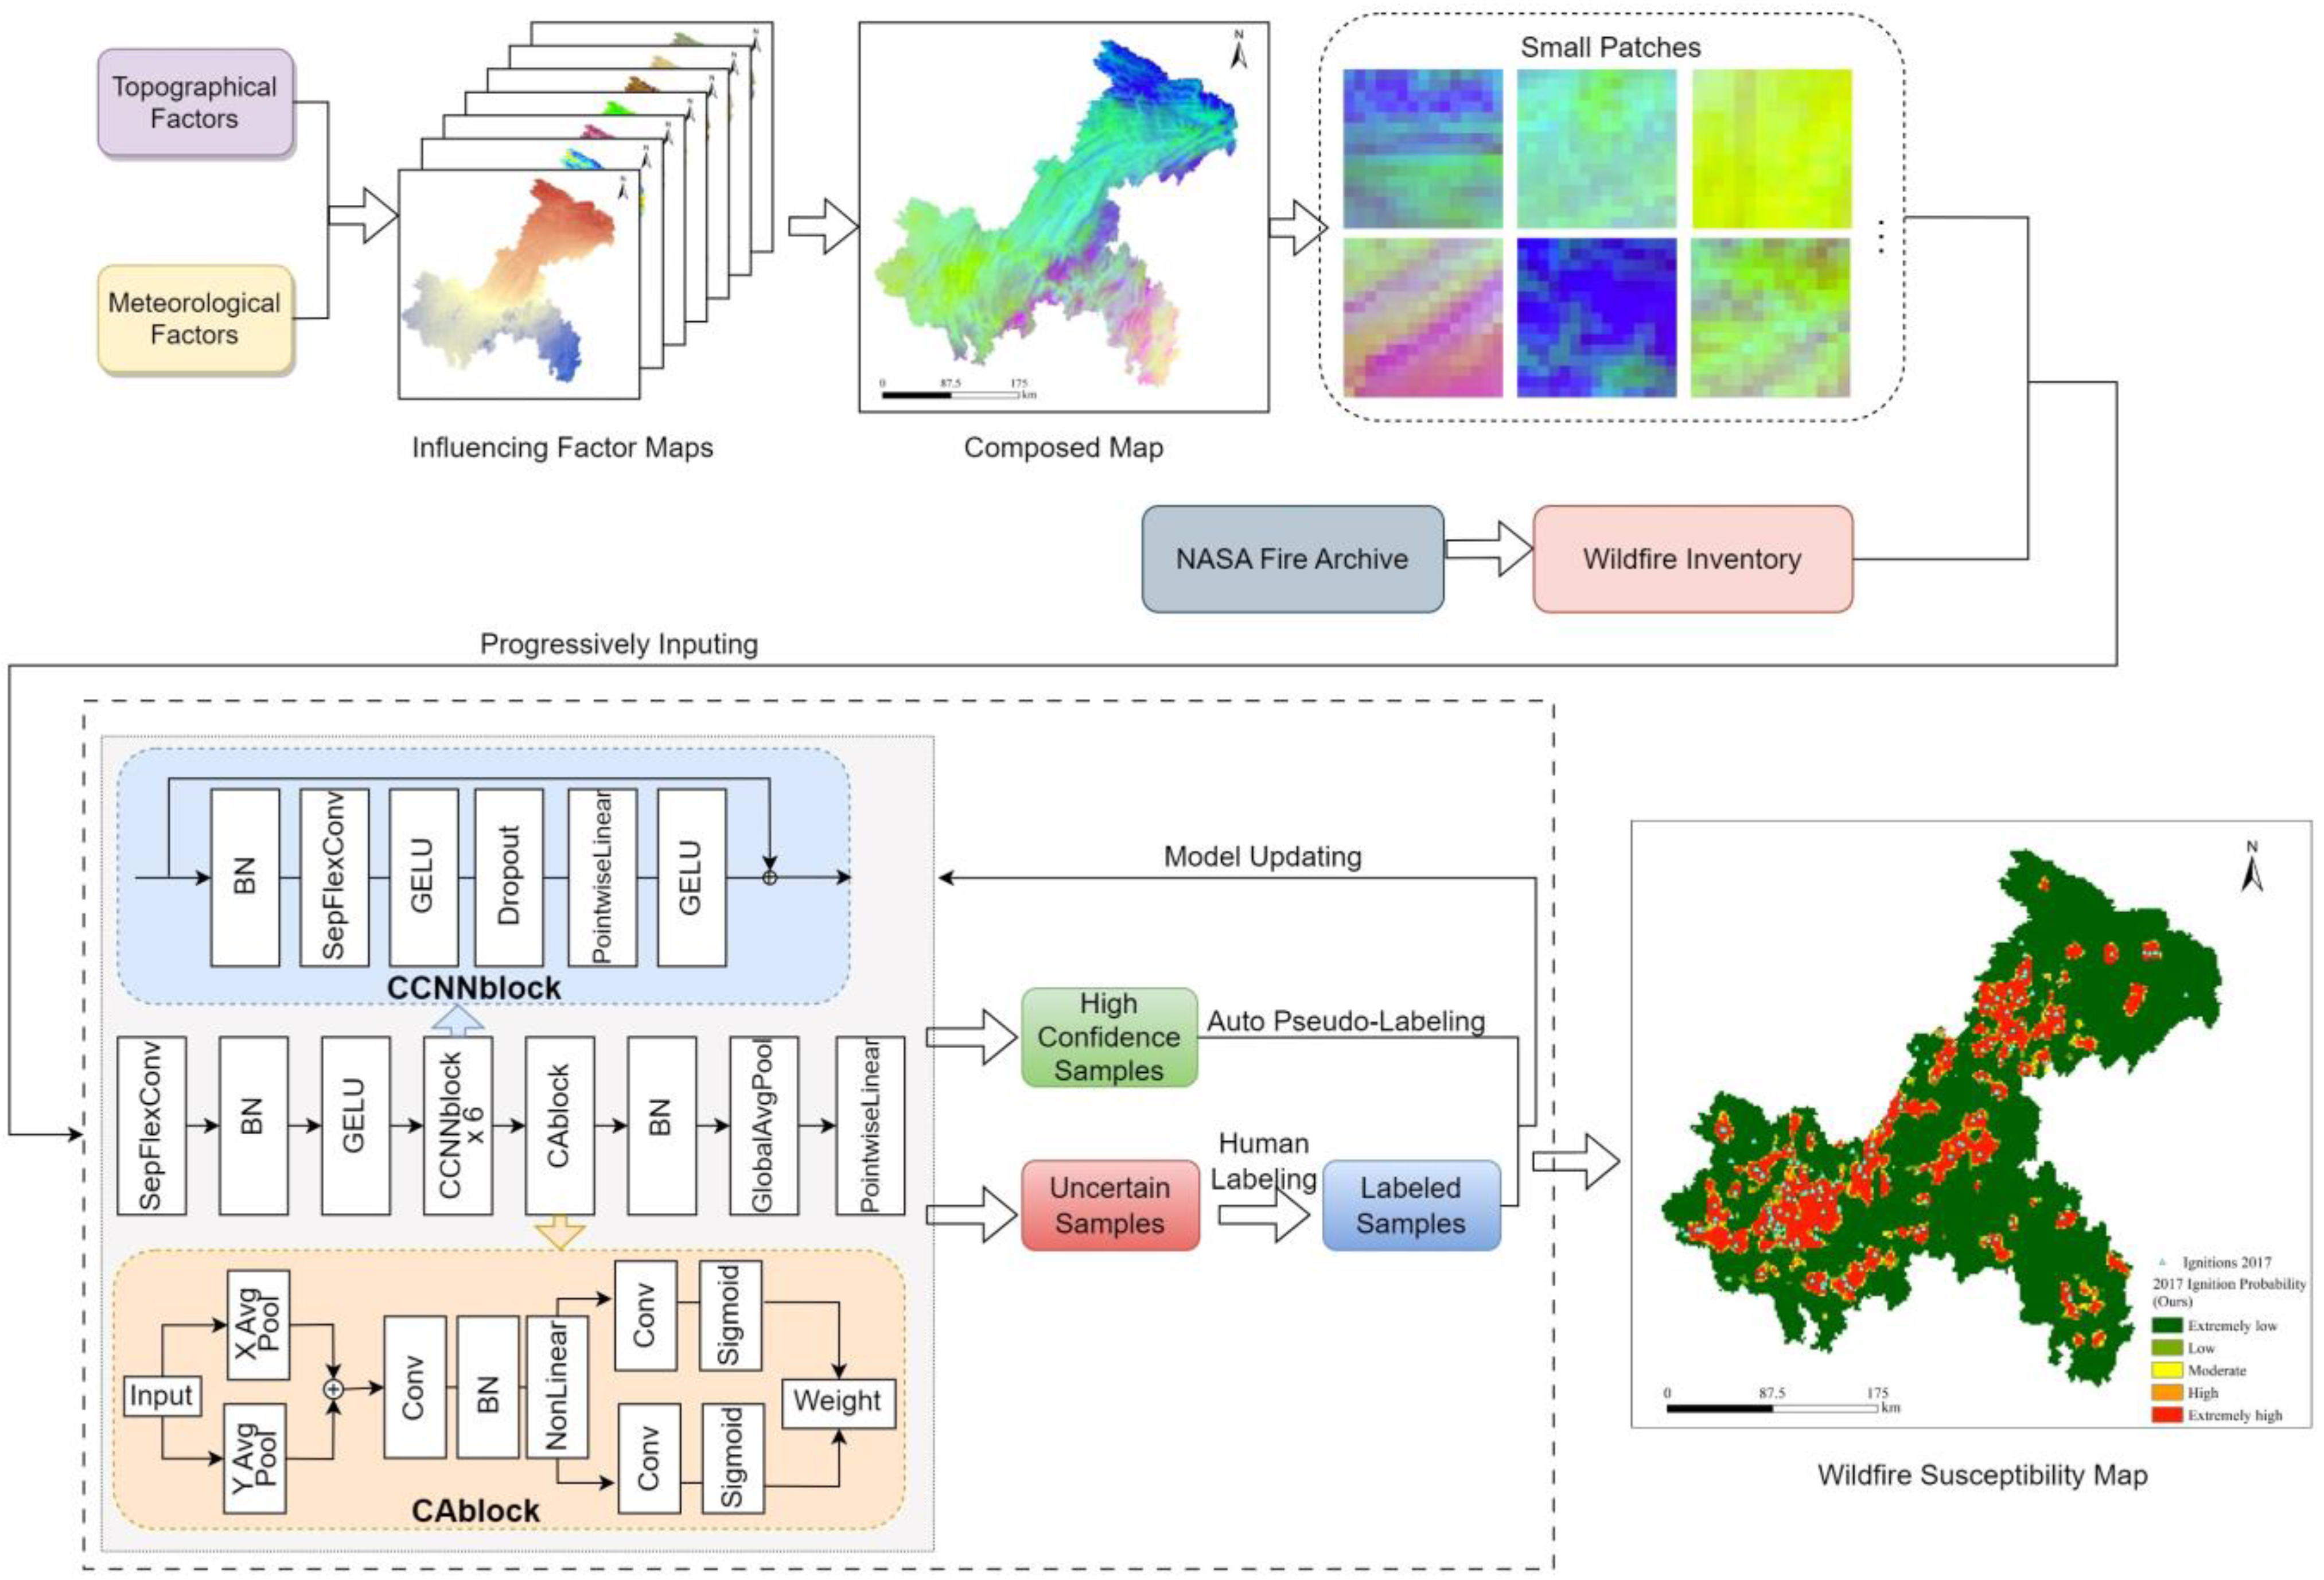
Figure 2 illustrates the proposed model for wildfire susceptibility prediction. The raster maps of fire-influencing factors are generated by using the software ArcGIS, and then they are integrated into one raster image, which is segmented into small image patches. The proposed model takes the patches as the inputs and predicts the fire risk probability of each patch. The CA module is embedded into the backbone network in order to capture long-range dependencies while retaining precise location information. This design can more accurately capture the spatial distribution characteristics in image patches of fire risk raster maps, thereby more comprehensively capturing the dependency relationships between features. To solve the problems of few-sample prediction and massive sample annotation, an active learning optimization approach, i.e., two types of complementary training strategy, is used to prioritize the screening of uncertain patches and patches with high confidence, where high-confidence patches are automatically assigned with pseudo-labels, which improves the model’s learning capability while reducing the labeling cost.

3.1. Generation of Fire-Influencing Factor Raster Maps

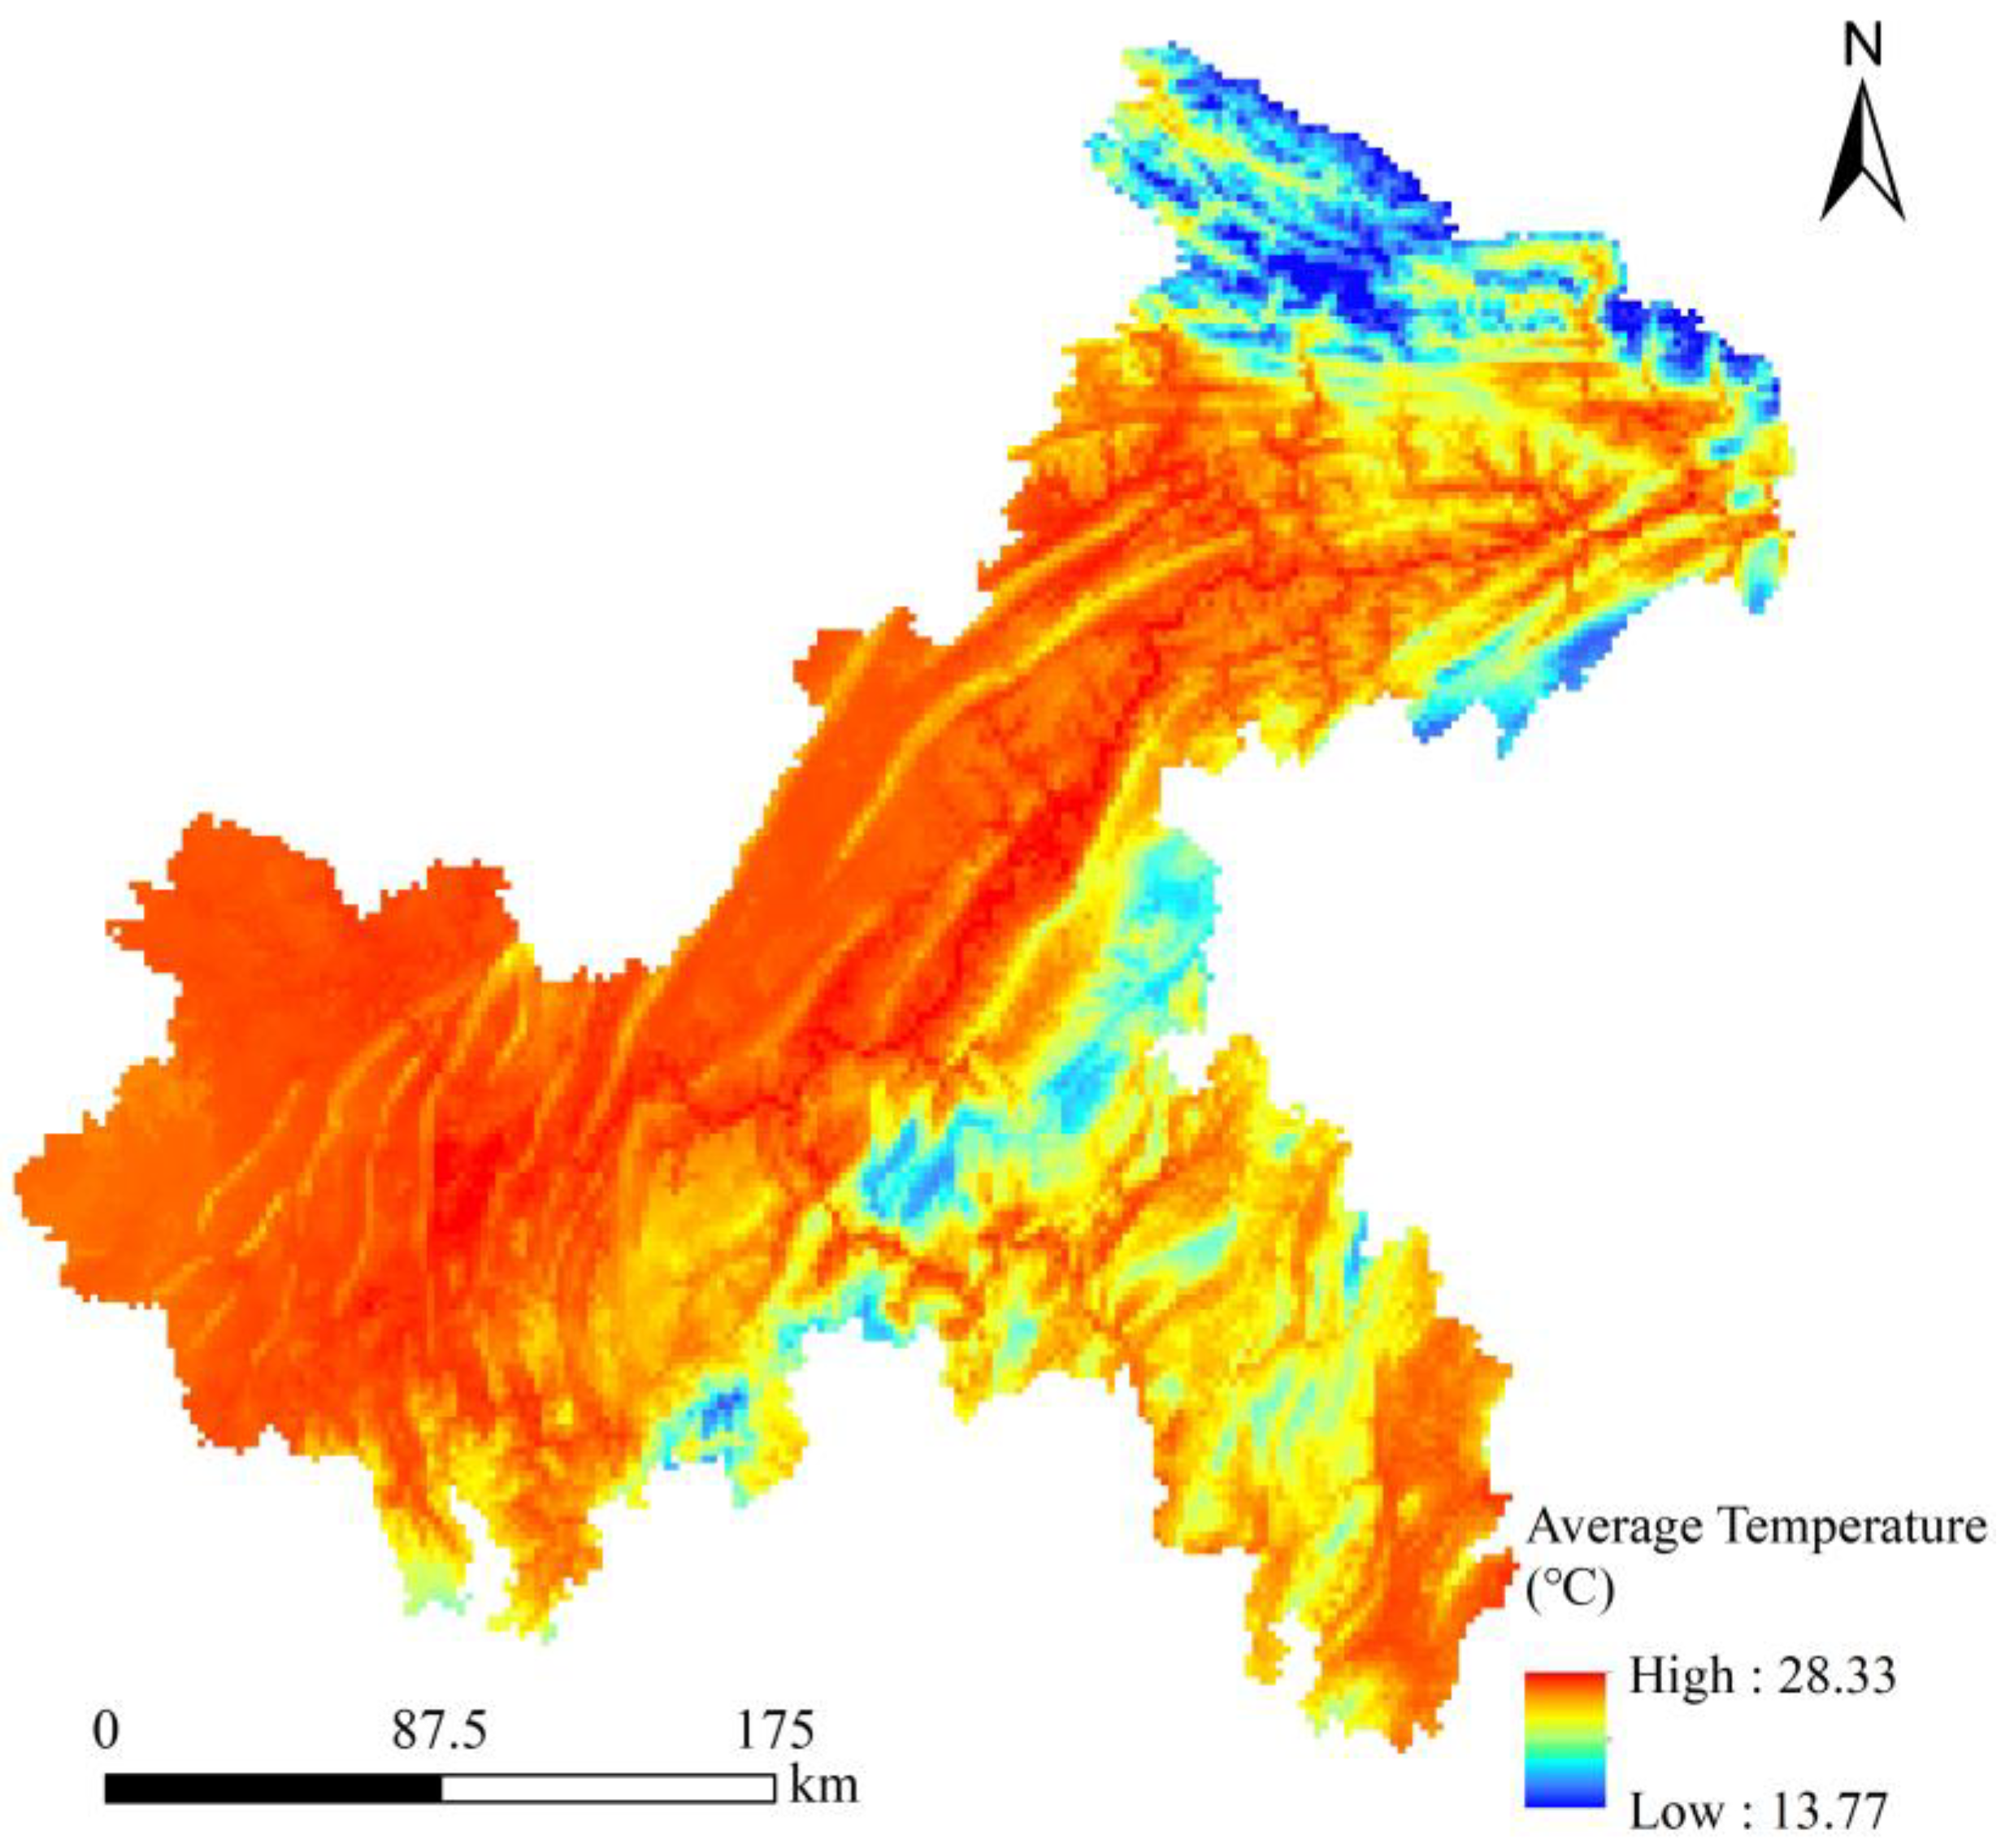
The data of seven influencing factors are utilized for wildfire susceptibility modeling. For each meteorological factor, the 3-month average value (June to August) is used to generate its raster map. We convert all influencing factor data into a raster format with the same data type, coordinate system, and resolution. Subsequently, the 7 factor raster maps of a year after the normalization operation were integrated into one raster map using the composite bands tool. All fire-influencing factor data from 2012 to 2017 were processed in the same way to generate 6 integrated raster maps. Taking the average temperature as an example, Figure 3 shows a raster map of this influencing factor in 2017.

3.2. The Model Input

The pixels in the raster map correspond to the geographical coordinates on the map, so the fire susceptibility prediction model evaluates the fire risk level of location points in different geographical coordinates. The fire-influencing factor data of a pixel in the raster map are approximately equal to that of its neighboring pixels; that is, the pixels in an image block usually have the same or similar fire risk level. Therefore, we segment the raster map fusing 7 fire-influencing factor information into small patches. Each patch was expressed as a 3D array with the dimension of n × n × c , where n is the patch size and c denotes the number of influencing factors.

3.3. The Structure of the CA-Based CCNN Model

In the frame of the CA-based CCNN model, the input data have 7 channels corresponding to 7 factors. After the convolution of 7 channel directions is calculated separately, the point-by-point convolution is performed. Therefore, 7 feature maps are weighted and combined in the depth direction to generate the new feature map. The convolution kernel uses SepFlexConv [20] with a stride of 1 and the same padding mode. SepFlexConv has fewer parameters and computation costs compared with the conventional convolution. Each convolutional layer is succeeded by a batch normalization (BN) layer and a Gaussian error linear unit (GELU). A total of 6 CCNN blocks are subsequently connected. The CA module is embedded after the CCNN blocks and followed by a BN layer, a global average pooling layer, and a point-wise linear connection layer.
The distinctiveness of CCNN is the introduction of a continuous convolutional kernel to handle classification tasks with different resolutions, dimensions, and lengths. The continuous convolutional kernel regards the convolution kernel as a continuous function parameterized with the help of a small neural network G K e r n a l acting as a kernel generator network [21]. In this study, the kernel generator network is parameterized as a 3-layer MAGNet with 64 hidden units [22]. The neural network maps the coordinate c i R D ( D is the data dimension) to the value of the convolution kernel at the corresponding position. A convolution kernel of equal size is constructed by transmitting a vector containing k coordinates [ c i ] i [ 1 , , k ] through G K e r n a l . Thereafter, the input signal is convolved with the generated convolution kernel to obtain the output feature representation. Parameterizing the convolution kernel by a neural network can be viewed as a way of embedding data information in the neural network weights to construct continuous data representations [23,24]. The parameterization addresses the discrete characteristic of standard convolutional kernels, enabling the construction of convolutional kernels that are independent of resolution.
The CA module [25] is designed as follows: firstly, we adopt a mean pooling operation both horizontally and vertically to obtain two attention maps embedded with direction-specific information and then splice them into one attention map. Next, the spliced attention map is passed to a learning module with a convolutional layer, a BN layer, and a nonlinear connection layer. The learning module generates horizontal and vertical feature maps, which undergo a convolution operation, respectively. Ultimately, the Sigmoid activation function is employed to compute the attention weights, and the final feature map is generated by multiplying the weights into the input features.

3.4. Active Learning Training Strategy

To solve the problem of large sample annotation and few-sample predictions, we introduce an active learning method based on two types of complementary learning strategies [26]. Let D U and D L denote the unlabeled sample sets and labeled sample sets, respectively. At the beginning, D U contains all the unlabeled training samples, while D L is empty. Subsequently, two types of samples are used for training the network, i.e., uncertain samples and high-confidence samples, which are selected from D U according to their fire probability calculated by the model.
We determine the uncertain samples based on the criterion of least confidence. The maximum value between the fire probability and non-fire probability of a sample is defined as the confidence of the sample. The confidence l c i is calculated as
l c i = max j p ( y i = j |   x i ;   w )
where x i denotes the i th sample and j represents the j th classifier. y i = j represents the label of x i . w are the model parameters. p y i = j   x i ;   w ) denotes the probability that x i belongs to the j th classifier. The K samples with the lowest confidence values are chosen as uncertain samples.
The high-confidence samples facilitate the learning of fire features as a way to improve the discriminative performance of the model. The model can easily discern samples with high confidence; thus, they can be automatically assigned pseudo-labels by the model. We select samples with high confidence from D U based on the entropy. The entropy e n i is calculated as
e n i = j = 1 m p y i = j   x i ;   w ) log p y i = j   x i ;   w )
The sample x i in D U is chosen as high-confidence samples if the entropy e n i is less than the threshold δ . The samples with high confidence are automatically assigned pseudo-labels of 1 or 0. The initial threshold δ 0 is set to a large value to ensure high reliability of pseudo-label assignment. After each iteration, samples with high confidence are returned to D U , and their pseudo-labels are removed. After each iteration, we update the threshold.
The selected uncertain samples need to be manually labeled and then added to the labeled sample set D L , while the model automatically assigns pseudo-labels to samples with high confidence. As the number of iterations increases, more uncertain samples are selected; at the same time, the model has higher performance, which made the model achieve a balance between the number of sample annotations and model performance. Since we automatically assign pseudo-labels to high-confidence samples without manual labeling, the cost of manual labeling is greatly reduced.

4. Experiments

In this section, the configurations of experiments and parameters of the training process are provided, and then the metrics used in this work are introduced.

4.1. Implement Details

Our framework is implemented using PyTorch Lightning 1.6.4. The configurations of the computer are as follows: a GPU (RTX 2080Ti) and a CPU (Intel i9-9900K). We employ AdamW [27] as the optimizer with a weight decay set to 0. The default learning rate is 0.01. In addition, we introduce a cosine annealing learning rate scheduler [28] along with a linear learning rate warm-up stage of 10 epochs for optimization. The dropout rate is set to 0.15 to prevent overfitting.
The fire points listed on the inventory from NASA represent the origin or center of a fire region rather than the actual fire region; therefore, we adopted buffer analysis [29] to expand fire point data into a fire region. Drawing on the literature [18], a buffer zone was set within 5 km around the fire point, and pixels inside the buffer zone were labeled as 1 (i.e., fire), while pixels outside the buffer zone were labeled as 0 (i.e., non-fire). All fire point data from 2012 to 2017 were processed to generate six ignition raster maps. The annual raster maps from 2012 to 2016 are used for model training and are divided into n × n × 7 3D patches, where n is set to 15, 25, or 35. A total of 5000 patches, including 2500 fire samples and 2500 non-fire samples, are randomly chosen for model training. The training and validation sets consist of 4000 and 1000 samples, respectively. The data from 2017 served as the testing set. A total of 10% of the labeled samples in the training set are randomly selected for network initialization.

4.2. Metrics

In this work, the prediction for wildfire susceptibility is realized by a binary classification method. Thus, we use metrics such as sensitivity, specificity, positive predictive value (PPV for short), and negative predictive value (NPV for short) and accuracy to evaluate the model performance [9]. The calculation of the five metrics is as follows:
Sensitivity = T P T P + F N Specificity = T N F P + T N PPV = T P F P + T P NPV = T N F N + T N Accuracy = T P + T N T P + T N + F P + F N
The overall performance of the model is assessed using the area under the curve of the receiver operating characteristic (i.e., ROC-AUC) [30,31,32]. A higher AUC value, closer to 1, indicates better prediction performance [33]. A U C is calculated as follows:
A U C = 1 + TPR FPR 2

5. Results

In this section, we verify that our method achieves high prediction accuracy at different patch sizes. At the same time, our method is compared with several state-of-the-art methods, and wildfire susceptibility maps are generated, respectively. Finally, the effectiveness of the two types of complementary learning strategies in reducing training samples is verified.

5.1. Ablation Study

We conducted experiments with different sizes of patches, and as shown in Table 1, the best prediction performance was achieved at the patch size of 25 × 25; hence, the 25 × 25 patch was chosen for the subsequent experiments in this work.
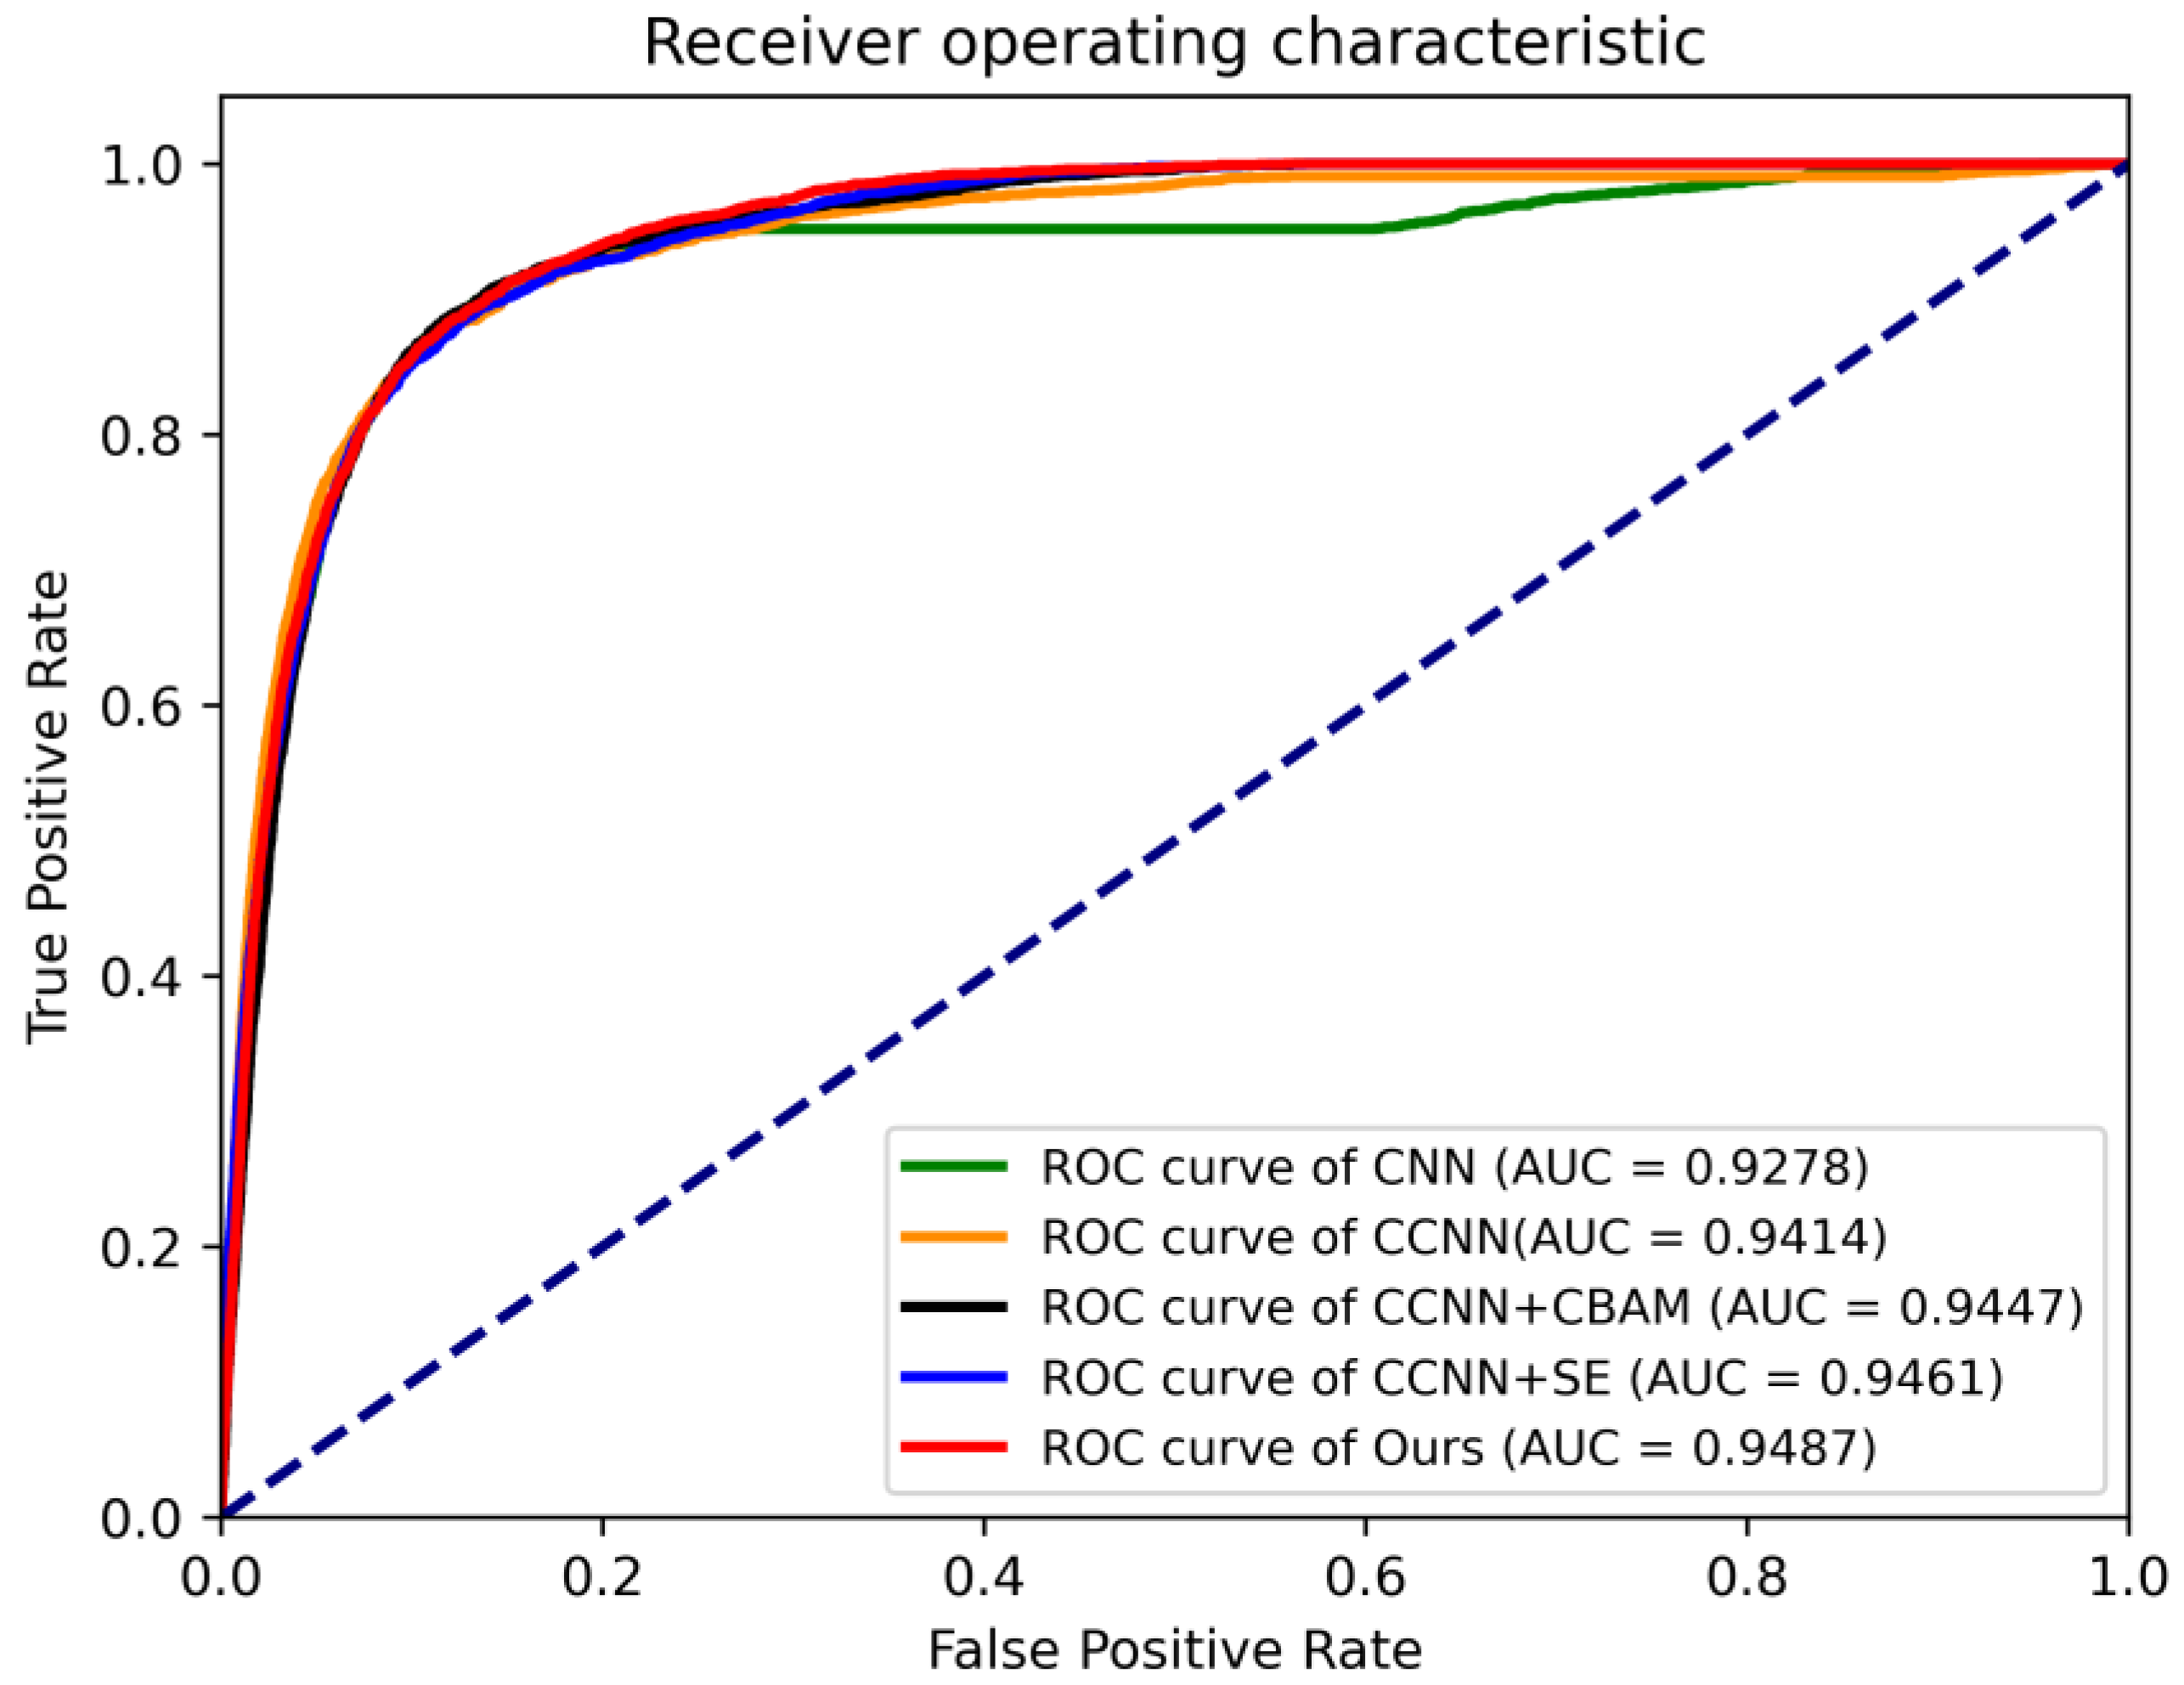
CNN is more suitable for classifying such small-sized input patches than other deep learning models; thus, we compared our method with the CNN-based method proposed by [18]. Additionally, we evaluated our method against CCNN, CCNN + SE, and CCNN + CBAM models. As shown in Table 2, our method outperforms these models across several metrics, including sensitivity, specificity, PPV, NPV, and accuracy. Figure 4 demonstrates the ROC curves for the five methods on the testing set. The A U C of our method is 0.9487, which is 2.09% higher than the CNN-based method and 0.73% higher than the CCNN method. Furthermore, the AUC of our method exceeds that of the CCNN model using two other additional attentional mechanisms. This indicates a better overall fit between the CA-based CCNN wildfire susceptibility prediction model and the testing set.

5.2. Comparison with State-of-the-Art Machine Learning Methods

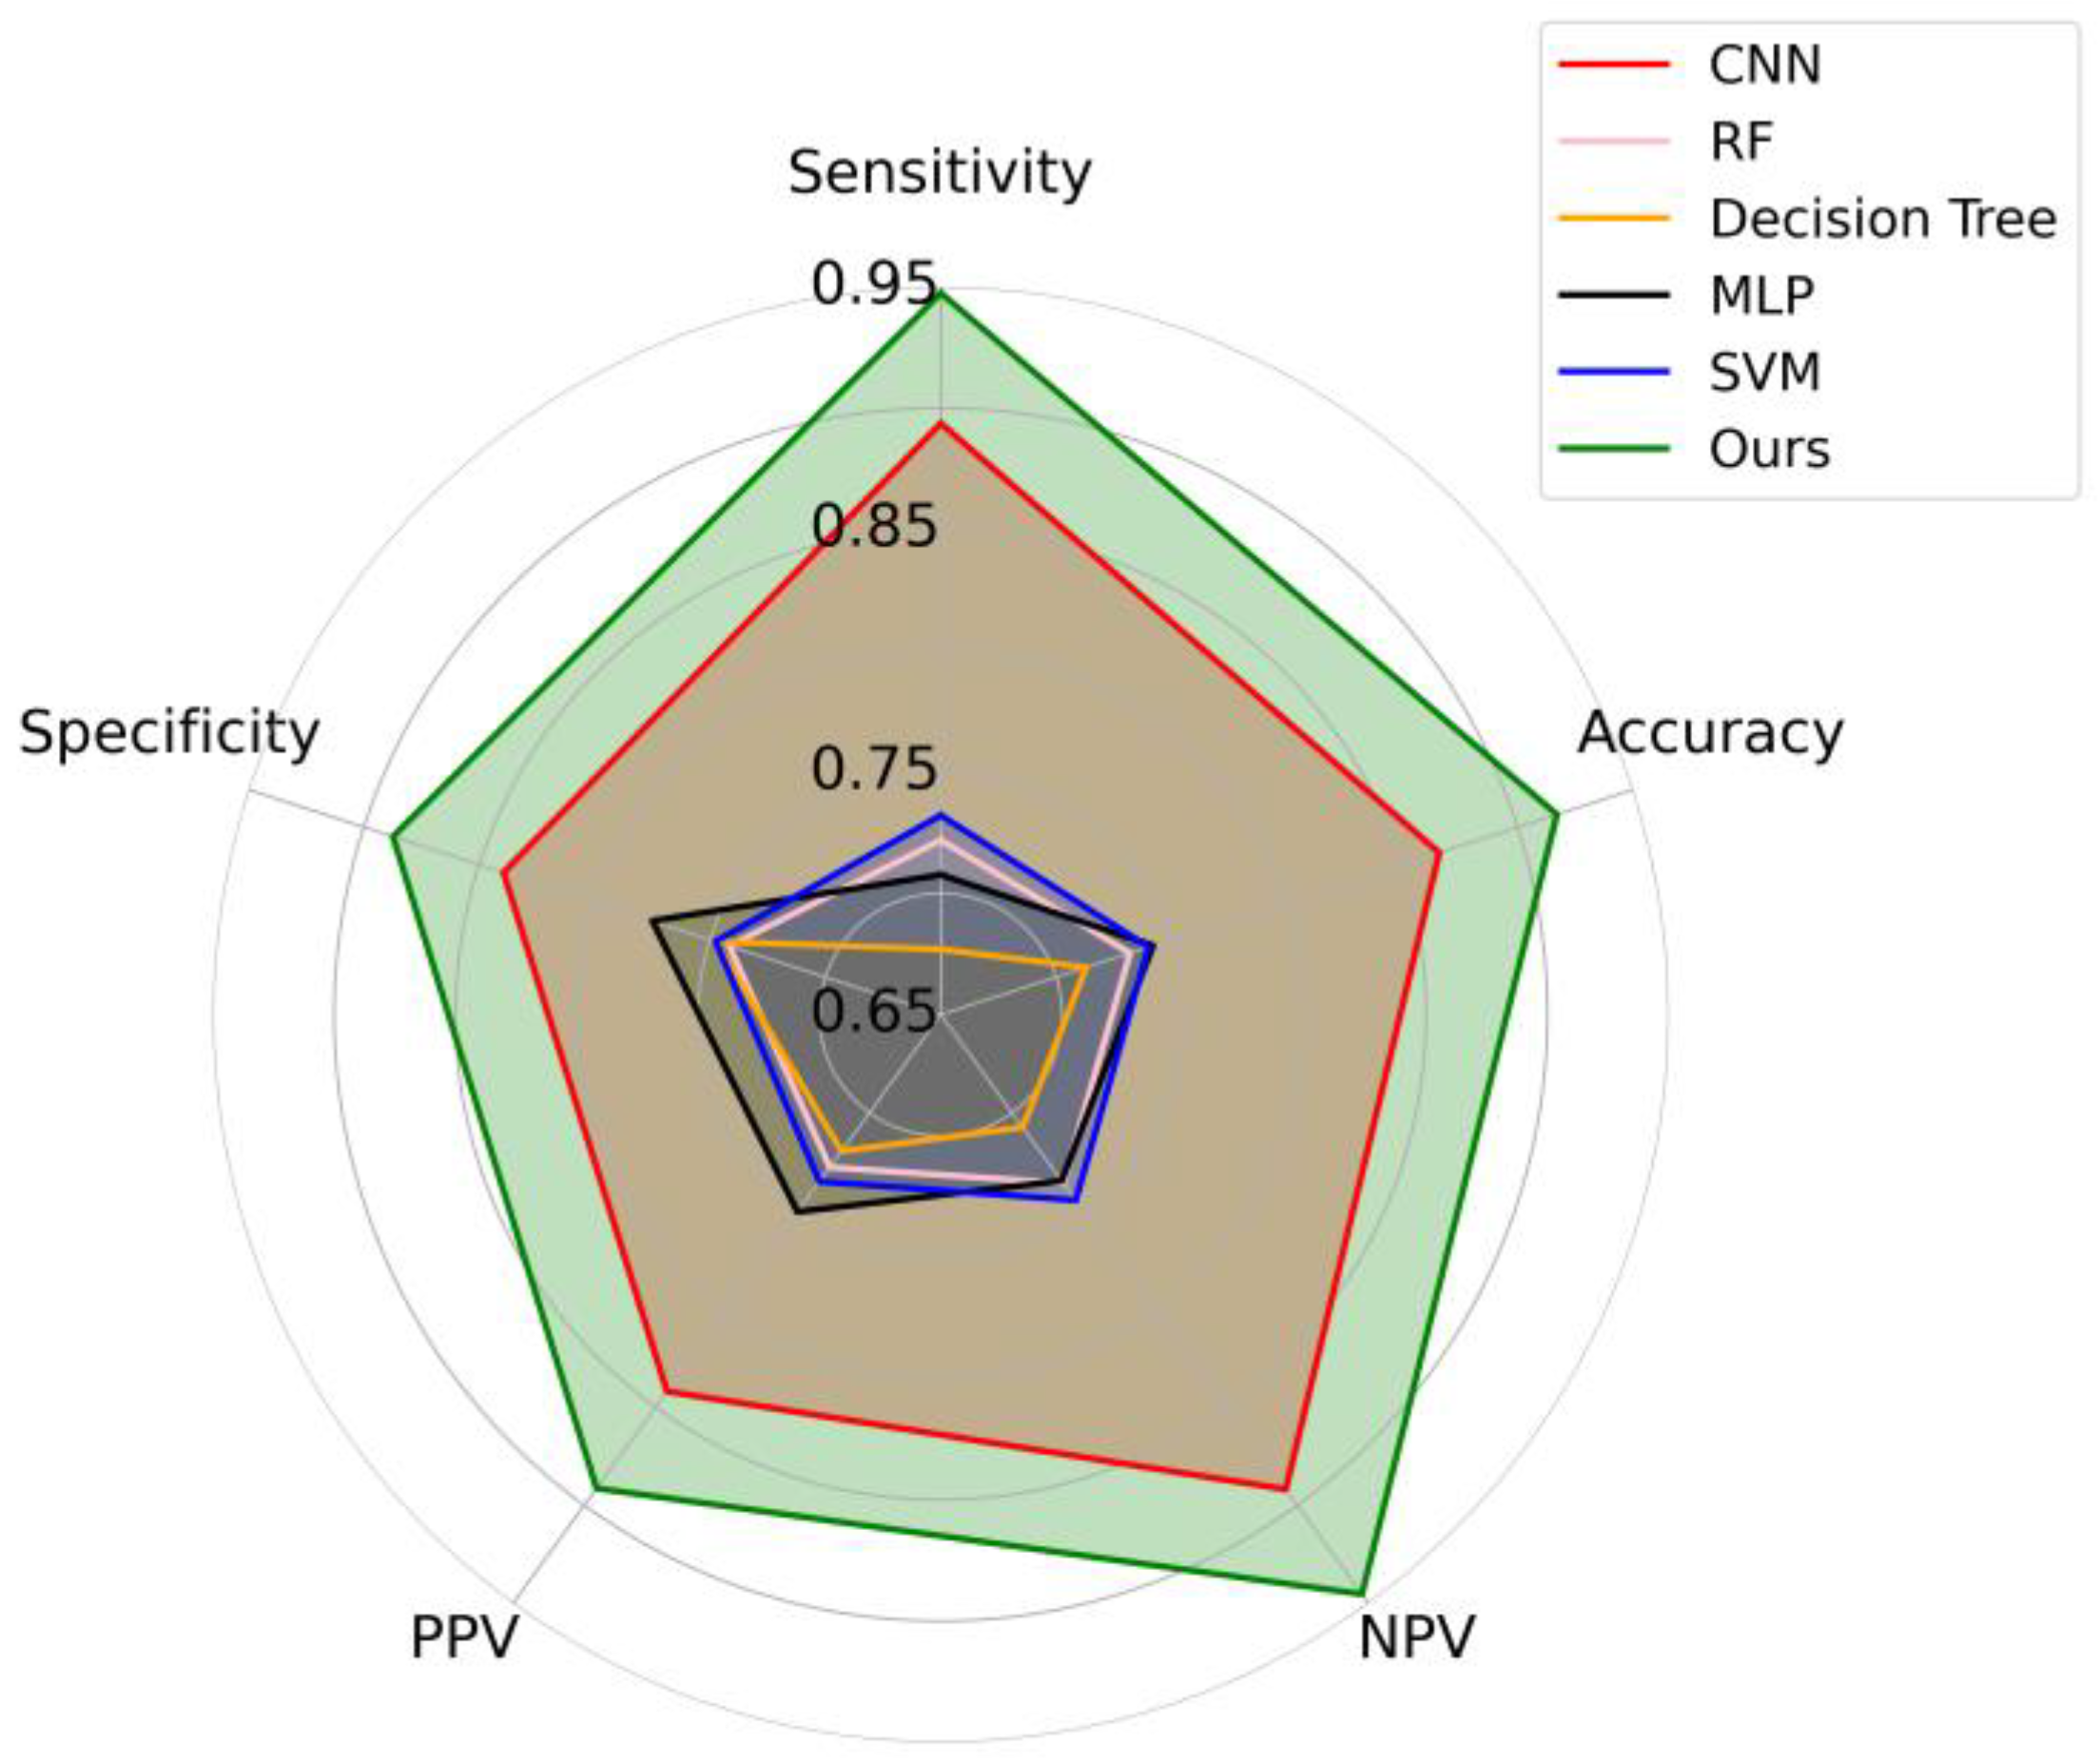
In addition to CNN, we also use machine learning methods for comparative experiments. The experimental results are shown in Table 3 and Figure 5, where our method shows higher sensitivity (94.74%), specificity (88.74%), PPV (89.14%), and NPV (94.53%) than the four machine learning methods on the validation set. And the overall accuracy of the method in this work reaches 91.7%, which is more than 15% higher than the machine learning methods. Similarly, CNN-based methods have achieved high performance. These results indicate that the raster-based scheme may outperform traditional machine learning methods in wildfire susceptibility tasks.

5.3. Wildfire Susceptibility Maps

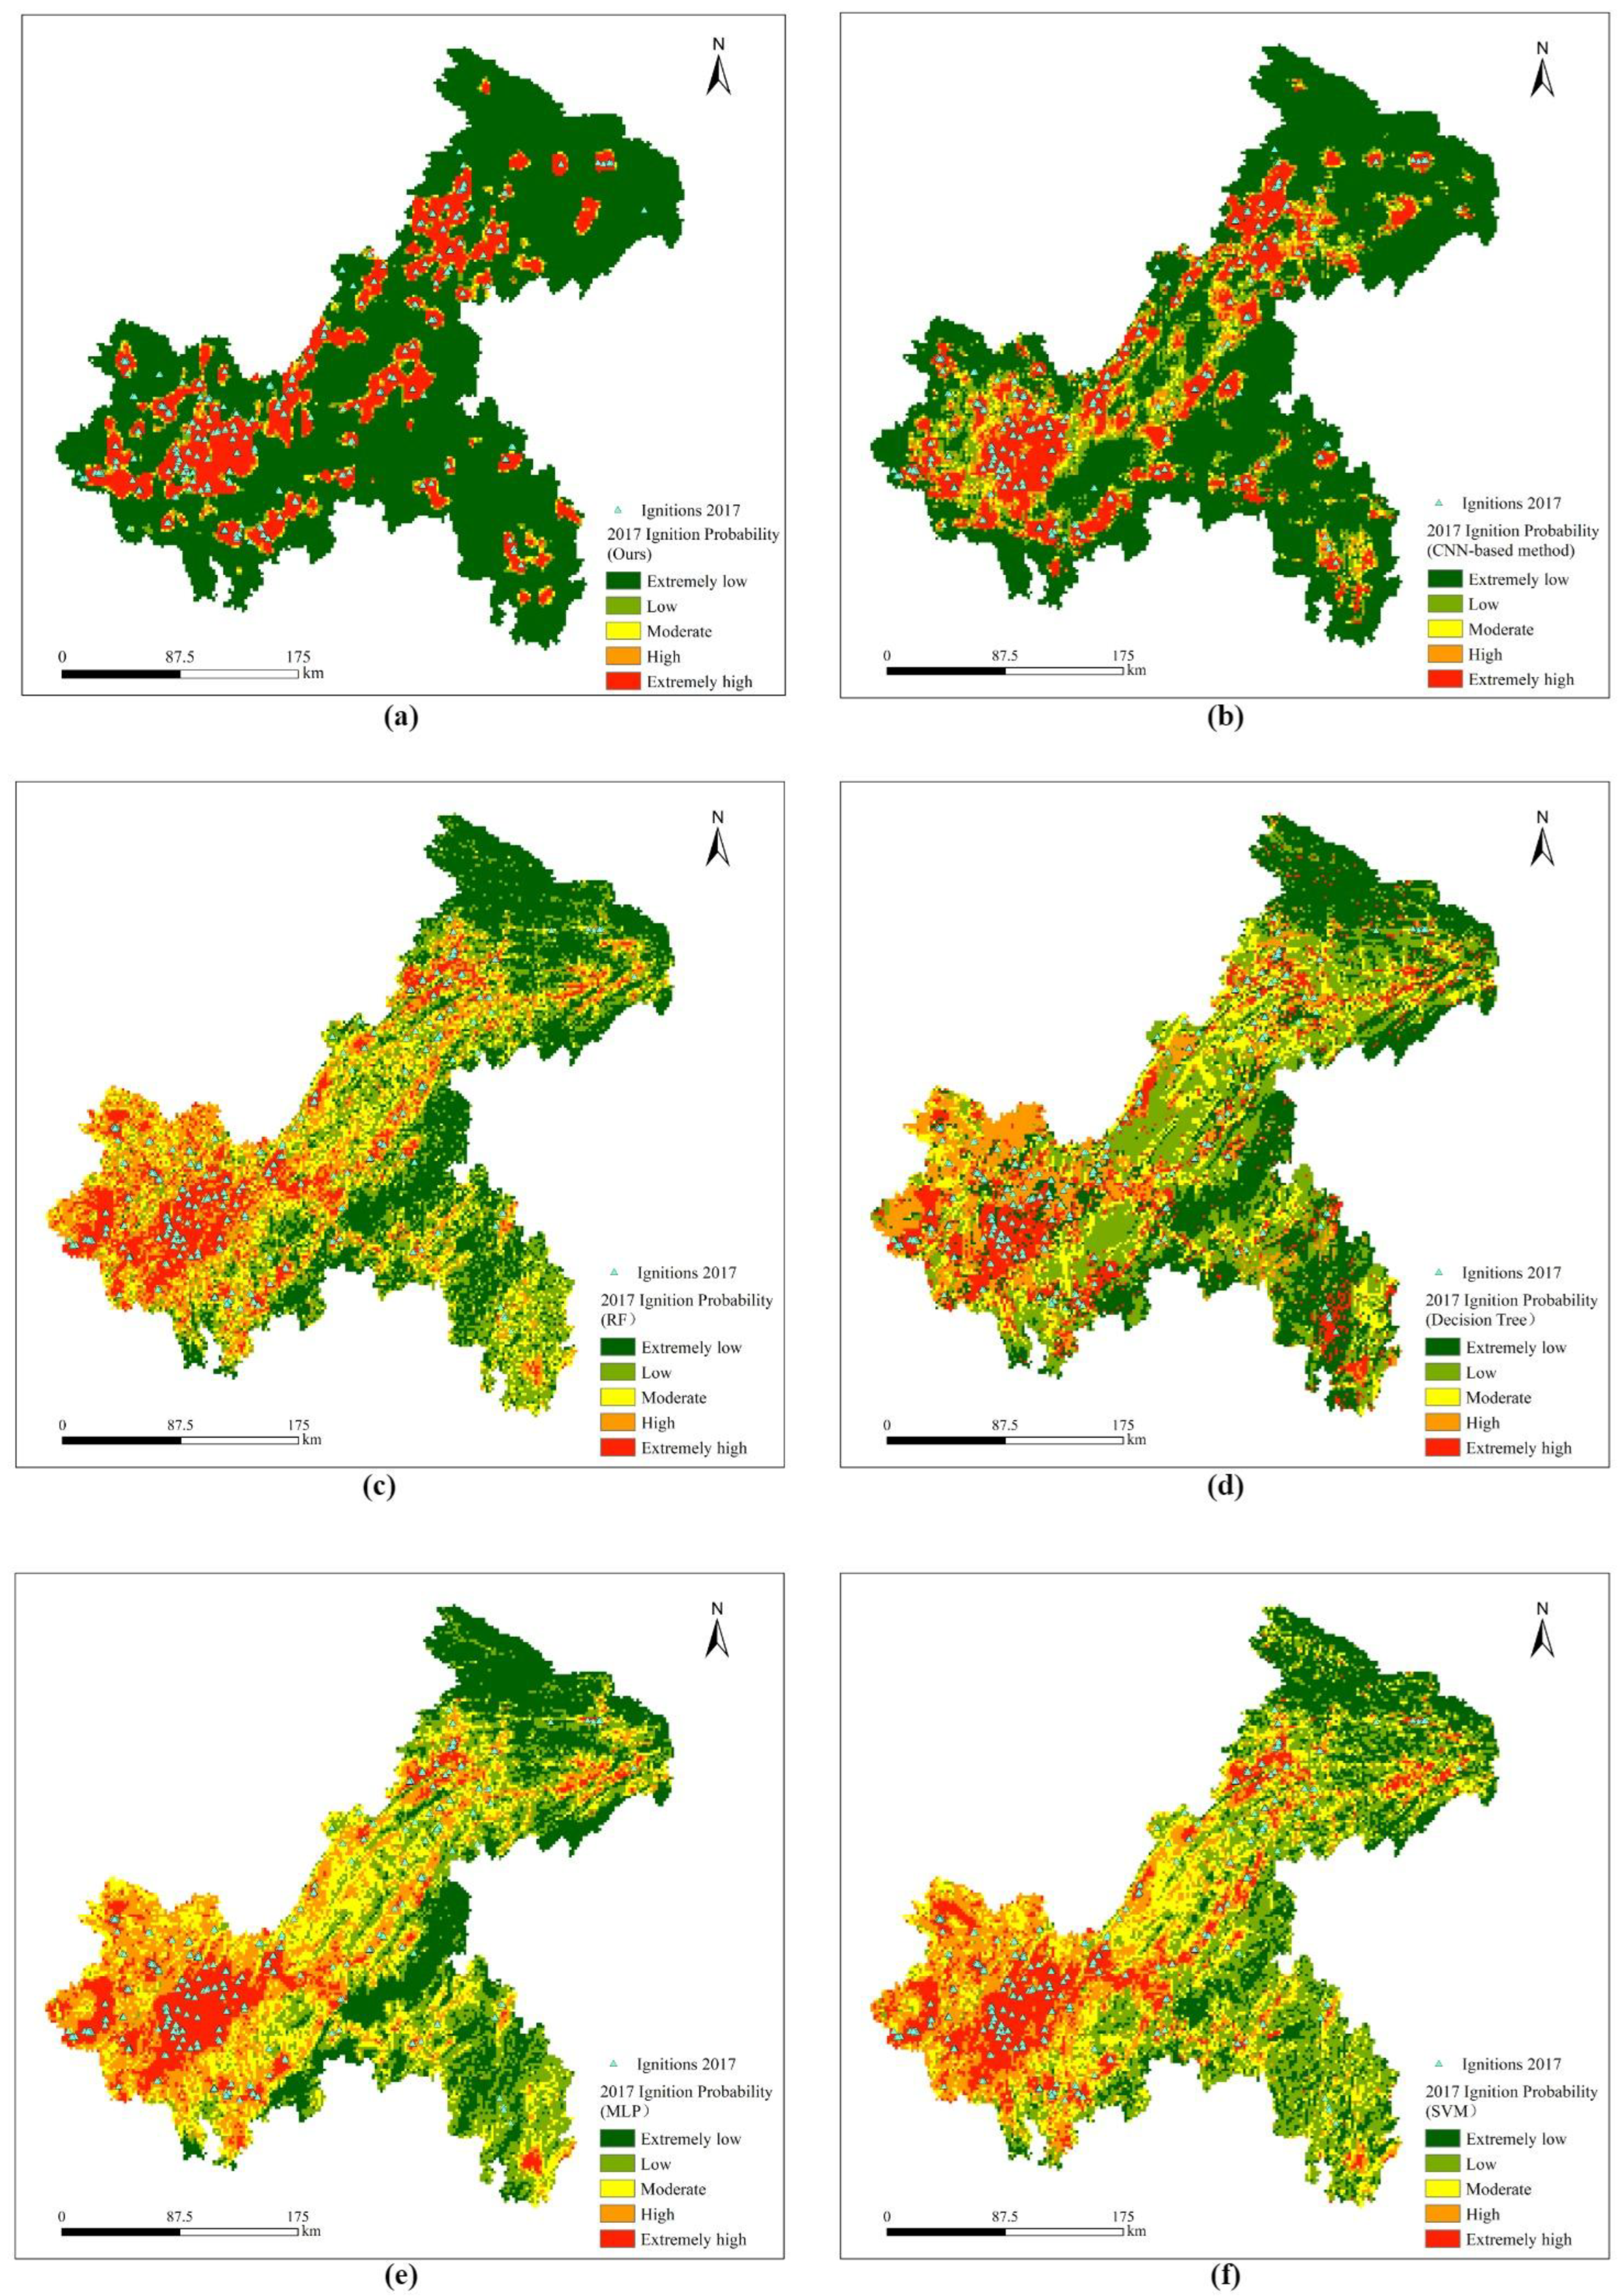
Wildfire susceptibility was predicted using the testing set. We utilize fire probability predicted by the model to generate the wildfire susceptibility map and then classify wildfire susceptibility into five classes: extremely low, low, moderate, high, and extremely high, by selecting the Natural Breaks method in ArcGIS for the threshold setting.
Figure 6 displays wildfire susceptibility maps generated by our method and five state-of-the-art methods, respectively. In these maps, blue triangular arrows represent fire points. The extremely high fire susceptibility approximately indicates the occurrence of a fire. The areas with extremely high fire susceptibility predicted by our method are consistent with the actual fire location. However, the MLP, SVM, and RF methods incorrectly classify these areas as low- and medium-susceptibility zones. In comparison with the CNN-based method, the susceptibility map predicted by our method offers slightly more accurate delineation in the extremely low and extremely high susceptibility classes.

5.4. Verification of Training Efficiency of Two Types of Complementary Learning Strategy

In order to demonstrate the training efficiency of the active learning strategy used in this work, two training methods, i.e., randomly selecting samples and only selecting uncertain samples [34], were used for the comparison. The parameters of the active learning strategy are set as follows: δ 0 = 0.05 and K = 400.
Figure 7 displays the classification accuracy curve of these three methods under different percentages of labeled samples. The proposed method exhibits superior prediction accuracy compared to the other two methods with the same percentage of labeled samples, particularly when the percentage of labeled samples is low (20–60%), with the superiority becoming more pronounced.

6. Discussions

6.1. Fire-Influencing Factors and Fire Susceptibility Prediction

Overall, wildfires in Chongqing occur mainly in forested areas. In particular, the southwest region of Chongqing has low elevation and high temperature in summer, which heightens the likelihood of fire occurrence. Wind speed increases with the increment of slope gradient in the forest areas in the north–central region. Therefore, these two regions are prone to frequent fires, which is consistent with the prediction results of our method. Therefore, there is a direct causal relationship between fire susceptibility and the selected fire-influencing factors, including topographical and meteorological factors.

6.2. Advantages of CCNN

Compared with CNN, CCNN applies a continuous convolutional kernel, enabling the creation of convolutional kernels independent of resolution and thus increasing the flexibility of the model to be applied in different regions. As seen in Table 2 and Figure 6, the model parameters, such as the size of the convolutional kernel and convolutional strides, were determined after training. The superior performance of the proposed method is not affected by the size of input patches due to the introduction of continuous convolutional kernels into CCNN.

6.3. The Basis for CA Module Selection

Currently, the widely employed attention mechanisms include the Squeeze-and-Excitation (SE) mechanism, CBAM mechanism, and CA mechanism. We introduce the CA mechanism in order to capture the spatial distribution characteristics of pixels in the fire-influencing factor raster map. As shown in Table 2, our method has higher prediction accuracy than CCNN + CBAM and CCNN + SE. Because CA aggregates different location information into channels of the network, the correlation between local regions is captured [25]. Due to discrete pixels in one patch, we utilize CA to model the long-range dependencies between pixels. SE mechanism focuses solely on the encoded inter-channel information, overlooking the significance of positional information [35]. CBAM is limited to capturing local relationships [36]. Therefore, CA is selected to model the global information in the patches of fire-influencing factor raster map.

6.4. Labeling Cost

By analyzing Figure 7, we find that if an accuracy of about 86% is desired, the methods of only selecting uncertain samples and randomly selecting samples require about 70% and 90% labeled training samples, respectively. In contrast, our method requires only 50% labeled samples, saving about 20% and 40% labeling efforts. Thus, the proposed method can save the labeling cost under the demand for relatively high prediction accuracy. We also observe that the method of only selecting uncertain samples has slightly higher prediction accuracy than the other two comparative methods when the proportion of labeled training samples is 70%. This is because the best training samples are accidentally chosen; that is, this excellent performance is random and uncertain.

6.5. Wildfire Susceptibility Map

As shown in Figure 6, we mark the fire risk level on the map of Chongqing. Therefore, the fire susceptibility map includes geographic information of the predicted area, achieving the visualization of fire risk prediction. In addition, as seen in Figure 2, after the fire-influencing factor raster map is input into the model, it is segmented into small patches so that we can simultaneously output the prediction results for all regions of Chongqing. On the contrary, traditional machine learning methods can only predict the fire risk of a small area and output the fire risk value of that area.

7. Conclusions

In this work, we proposed a CA-based CCNN model with active learning optimization for wildfire susceptibility prediction. Due to the CCNN architecture, the model is compatible with different input patch sizes, which contributes to applying the pre-trained fire susceptibility prediction model to different forest areas. In addition, the model adopted CA to build the long-range dependencies for discrete pixels in small fire-influencing factor patches. Experimental results indicated that the CCNN + CA model had higher prediction accuracy than the comparative state-of-the-art methods. Furthermore, compared with traditional machine learning methods, the model saved the labeling cost by using an active learning method. It was worth mentioning that we utilized the model to generate a fire susceptibility map that visualized the fire risk level with geographic information. In future work, we will take into account the influence of anthropogenic activities on wildfire occurrence to reveal the interests and conflicts between wildfires and human activities. We will also draw lessons from the continuous convolution approach of CCNN into lightweight convolutional networks so as to further reduce complexity.

Author Contributions

Conceptualization, Q.Y. and Y.Z.; formal analysis, Z.X.; methodology, Q.Y.; validation, Y.Z., Z.Y. and Z.X.; software, Z.Y.; investigation, Q.Y.; resources, Y.Z.; data curation, Y.Z.; writing—original draft preparation, Q.Y.; writing—review and editing, Z.Y.; visualization, Q.Y.; supervision, Y.Z.; project administration, Q.Y.; funding acquisition, Y.Z. All authors have read and agreed to the published version of the manuscript.

Funding

This research received no external funding.

Institutional Review Board Statement

Not applicable.

Informed Consent Statement

Not applicable.

Data Availability Statement

Datasets are available from the corresponding author upon reasonable request.

Conflicts of Interest

The authors declare no conflicts of interest.

References

  1. Bui, D.T.; Le, H.V.; Hoang, N.D. GIS-based spatial prediction of tropical forest fire danger using a new hybrid machine learning method. Ecol. Inform. 2018, 48, 104–116. [Google Scholar] [CrossRef]
  2. Sachdeva, S.; Bhatia, T.; Verma, A.K. GIS-based evolutionary optimized Gradient Boosted Decision Trees for forest fire susceptibility mapping. Nat. Hazards 2018, 92, 1399–1418. [Google Scholar] [CrossRef]
  3. Razavi-Termeh, S.V.; Sadeghi-Niaraki, A.; Choi, S.M. Ubiquitous GIS-Based Forest Fire Susceptibility Mapping Using Artificial Intelligence Methods. Remote Sens. 2020, 12, 1689. [Google Scholar] [CrossRef]
  4. McEvoy, A.; Nielsen-Pincus, M.; Holz, A.; Catalano, A.J.; Gleason, K.E. Projected Impact of Mid-21st Century Climate Change on Wildfire Hazard in a Major Urban Watershed outside Portland, Oregon USA. Fire 2020, 3, 70. [Google Scholar] [CrossRef]
  5. Nguyen, N.T.; Dang, B.T.N.; Pham, X.C.; Nguyen, H.T.; Bui, H.T.; Hoang, N.D.; Bui, D.T. Spatial pattern assessment of tropical forest fire danger at Thuan Chau area (Vietnam) using GIS-based advanced machine learning algorithms: A comparative study. Ecol. Inform. 2018, 46, 74–85. [Google Scholar] [CrossRef]
  6. Cicione, A.; Gibson, L.; Wade, C.; Spearpoint, M.; Walls, R.; Rush, D. Towards the Development of a Probabilistic Approach to Informal Settlement Fire Spread Using Ignition Modelling and Spatial Metrics. Fire 2020, 3, 67. [Google Scholar] [CrossRef]
  7. Maeda, E.E.; Formaggio, A.R.; Shimabukuro, Y.E.; Arcoverde, G.F.B.; Hansen, M.C. Predicting forest fire in the Brazilian Amazon using MODIS imagery and artificial neural networks. Int. J. Appl. Earth Obs. Geoinf. 2009, 11, 265–272. [Google Scholar] [CrossRef]
  8. Mohajane, M.; Costache, R.; Karimi, F.; Pham, Q.B.; Essahlaoui, A.; Nguyen, H.; Laneve, G.; Oudija, F. Application of remote sensing and machine learning algorithms for forest fire mapping in a Mediterranean area. Ecol. Indic. 2021, 129, 107869. [Google Scholar] [CrossRef]
  9. Bui, D.T.; Bui, Q.T.; Nguyen, Q.P.; Pradhan, B.; Nampak, H.; Trinh, P.T. A hybrid artificial intelligence approach using GIS-based neural-fuzzy inference system and particle swarm optimization for forest fire susceptibility modeling at a tropical area. Agr. Forest Meteorol. 2017, 233, 32–44. [Google Scholar] [CrossRef]
  10. Sivrikaya, F.; Küçük, O. Modeling forest fire risk based on GIS-based analytical hierarchy process and statistical analysis in Mediterranean region. Ecol. Inform. 2022, 68, 15. [Google Scholar] [CrossRef]
  11. Pourtaghi, Z.S.; Pourghasemi, H.R.; Aretano, R.; Semeraro, T. Investigation of general indicators influencing on forest fire and its susceptibility modeling using different data mining techniques. Ecol. Indic. 2016, 64, 72–84. [Google Scholar] [CrossRef]
  12. Bui, D.T.; Le, K.T.T.; Nguyen, V.C.; Le, H.D.; Revhaug, I. Tropical Forest Fire Susceptibility Mapping at the Cat Ba National Park Area, Hai Phong City, Vietnam, Using GIS-Based Kernel Logistic Regression. Remote Sens. 2016, 8, 347. [Google Scholar] [CrossRef]
  13. Vasconcelos, M.J.P.D.; Silva, S.; Tome, M.; Alvim, M.; Pereira, J.M.C. Spatial prediction of fire ignition probabilities: Comparing logistic regression and neural networks. Photogramm. Eng. Remote Sens. 2001, 67, 73–81. [Google Scholar]
  14. Dimuccio, L.A.; Ferreira, R.; Cunha, L.; de Almeida, A.C. Regional forest-fire susceptibility analysis in central Portugal using a probabilistic ratings procedure and artificial neural network weights assignment. Int. J. Wildland Fire 2011, 20, 776–791. [Google Scholar] [CrossRef]
  15. Satir, O.; Berberoglu, S.; Donmez, C. Mapping regional forest fire probability using artificial neural network model in a Mediterranean forest ecosystem. Geomat. Nat. Hazards Risk 2016, 7, 1645–1658. [Google Scholar] [CrossRef]
  16. Dong, Z.; Pei, M.T.; He, Y.; Liu, T.; Dong, Y.M.; Jia, Y.D. Vehicle Type Classification Using Unsupervised Convolutional Neural Network. In Proceedings of the 22nd International Conference on Pattern Recognition (ICPR), Swedish Soc Automated Image Anal, Stockholm, Sweden, 24–28 August 2014; pp. 172–177. [Google Scholar]
  17. Yan, X.; Liu, Y.; Xu, Y.; Jia, M. Multistep forecasting for diurnal wind speed based on hybrid deep learning model with improved singular spectrum decomposition. Energy Convers. Manag. 2020, 225, 113456. [Google Scholar] [CrossRef]
  18. Zhang, G.L.; Wang, M.; Liu, K. Forest Fire Susceptibility Modeling Using a Convolutional Neural Network for Yunnan Province of China. Int. J. Disaster Risk Sci. 2019, 10, 386–403. [Google Scholar] [CrossRef]
  19. Huang, Z.; Zhu, T.; Li, Z.; Ni, C. Non-Destructive Testing of Moisture and Nitrogen Content in Pinus Massoniana Seedling Leaves with NIRS Based on MS-SC-CNN. Appl. Sci. 2021, 11, 2754. [Google Scholar] [CrossRef]
  20. Knigge, D.M.; Romero, D.W.; Gu, A.; Gavves, E.; Bekkers, E.; Tomczak, J.M.; Hoogendoorn, M.; Sonke, J. Modelling Long Range Dependencies in N-D: From Task-Specific to a General Purpose CNN. arxiv 2023, arXiv:2301.10540. [Google Scholar]
  21. Romero, D.W.; Kuzina, A.; Bekkers, E.J.; Tomczak, J.M.; Hoogendoorn, M. CKConv: Continuous Kernel Convolution For Sequential Data. arxiv 2021, arXiv:2102.02611. [Google Scholar]
  22. Romero, D.W.; Bruintjes, R.J.; Tomczak, J.M.; Bekkers, E.J.; Hoogendoorn, M.; Gemert, J.C.V. FlexConv: Continuous Kernel Convolutions with Differentiable Kernel Sizes. arxiv 2021, arXiv:2110.08059. [Google Scholar]
  23. Fathony, R.; Sahu, A.K.; Willmott, D.; Kolter, J.Z. Multiplicative filter networks. In Proceedings of the 9th International Conference on Learning Representations (ICLR), Virtual Event, Austria, 3–7 May 2021. [Google Scholar]
  24. Park, J.J.; Florence, P.; Straub, J.; Newcombe, R.; Lovegrove, S. DeepSDF: Learning Continuous Signed Distance Functions for Shape Representation. In Proceedings of the 32nd IEEE/CVF Conference on Computer Vision and Pattern Recognition (CVPR), Long Beach, CA, USA, 16–20 June 2019; pp. 165–174. [Google Scholar]
  25. Hou, Q.B.; Zhou, D.Q.; Feng, J.S. Coordinate Attention for Efficient Mobile Network Design. In Proceedings of the IEEE/CVF Conference on Computer Vision and Pattern Recognition (CVPR), Electr Network, Virtual, 19–25 June 2021; pp. 13708–13717. [Google Scholar]
  26. Wang, K.Z.; Zhang, D.Y.; Li, Y.; Zhang, R.M.; Lin, L. Cost-Effective Active Learning for Deep Image Classification. IEEE Trans. Circuits Syst. Video Technol. 2017, 27, 2591–2600. [Google Scholar] [CrossRef]
  27. Loshchilov, I.; Hutter, F. Decoupled Weight Decay Regularization. arxiv 2017, arXiv:1711.05101. [Google Scholar]
  28. Loshchilov, I.; Hutter, F. SGDR: Stochastic Gradient Descent with Warm Restarts. arxiv 2016, arXiv:1608.03983. [Google Scholar]
  29. Cao, Y.X.; Wang, M.; Liu, K. Wildfire Susceptibility Assessment in Southern China: A Comparison of Multiple Methods. Int. J. Disaster Risk Sci. 2017, 8, 164–181. [Google Scholar] [CrossRef]
  30. Fadhillah, M.F.; Lee, S.; Lee, C.W.; Park, Y.C. Application of Support Vector Regression and Metaheuristic Optimization Algorithms for Groundwater Potential Mapping in Gangneung-si, South Korea. Remote Sens. 2021, 13, 1196. [Google Scholar] [CrossRef]
  31. Hakim, W.L.; Achmad, A.R.; Lee, C.W. Land Subsidence Susceptibility Mapping in Jakarta Using Functional and Meta-Ensemble Machine Learning Algorithm Based on Time-Series InSAR Data. Remote Sens. 2020, 12, 3627. [Google Scholar] [CrossRef]
  32. Han, J.; Nur, A.S.; Syifa, M.; Ha, M.; Lee, C.W.; Lee, K.Y. Improvement of Earthquake Risk Awareness and Seismic Literacy of Korean Citizens through Earthquake Vulnerability Map from the 2017 Pohang Earthquake, South Korea. Remote Sens. 2021, 13, 1365. [Google Scholar] [CrossRef]
  33. Hosmer, D.W.; Lemeshow, S.; Sturdivant, R.X. Applied Logistic Regression, 3rd ed.; Wiley: Hoboken, NJ, USA, 2013. [Google Scholar]
  34. Demir, B.; Bruzzone, L. A Novel Active Learning Method in Relevance Feedback for Content-Based Remote Sensing Image Retrieval. IEEE Trans. Geosci. Remote Sens. 2015, 53, 2323–2334. [Google Scholar] [CrossRef]
  35. Wang, H.; Zhu, Y.; Green, B.; Adam, H.; Yuille, A.; Chen, L.C. Axial-DeepLab: Stand-Alone Axial-Attention for Panoptic Segmentation. arxiv 2020, arXiv:2003.07853. [Google Scholar]
  36. Hou, Q.B.; Zhang, L.; Cheng, M.M.; Feng, J.S. Strip Pooling: Rethinking Spatial Pooling for Scene Parsing. In Proceedings of the IEEE/CVF Conference on Computer Vision and Pattern Recognition (CVPR), Electr Network, Seattle, WA, USA, 14–19 June 2020; pp. 4002–4011. [Google Scholar]
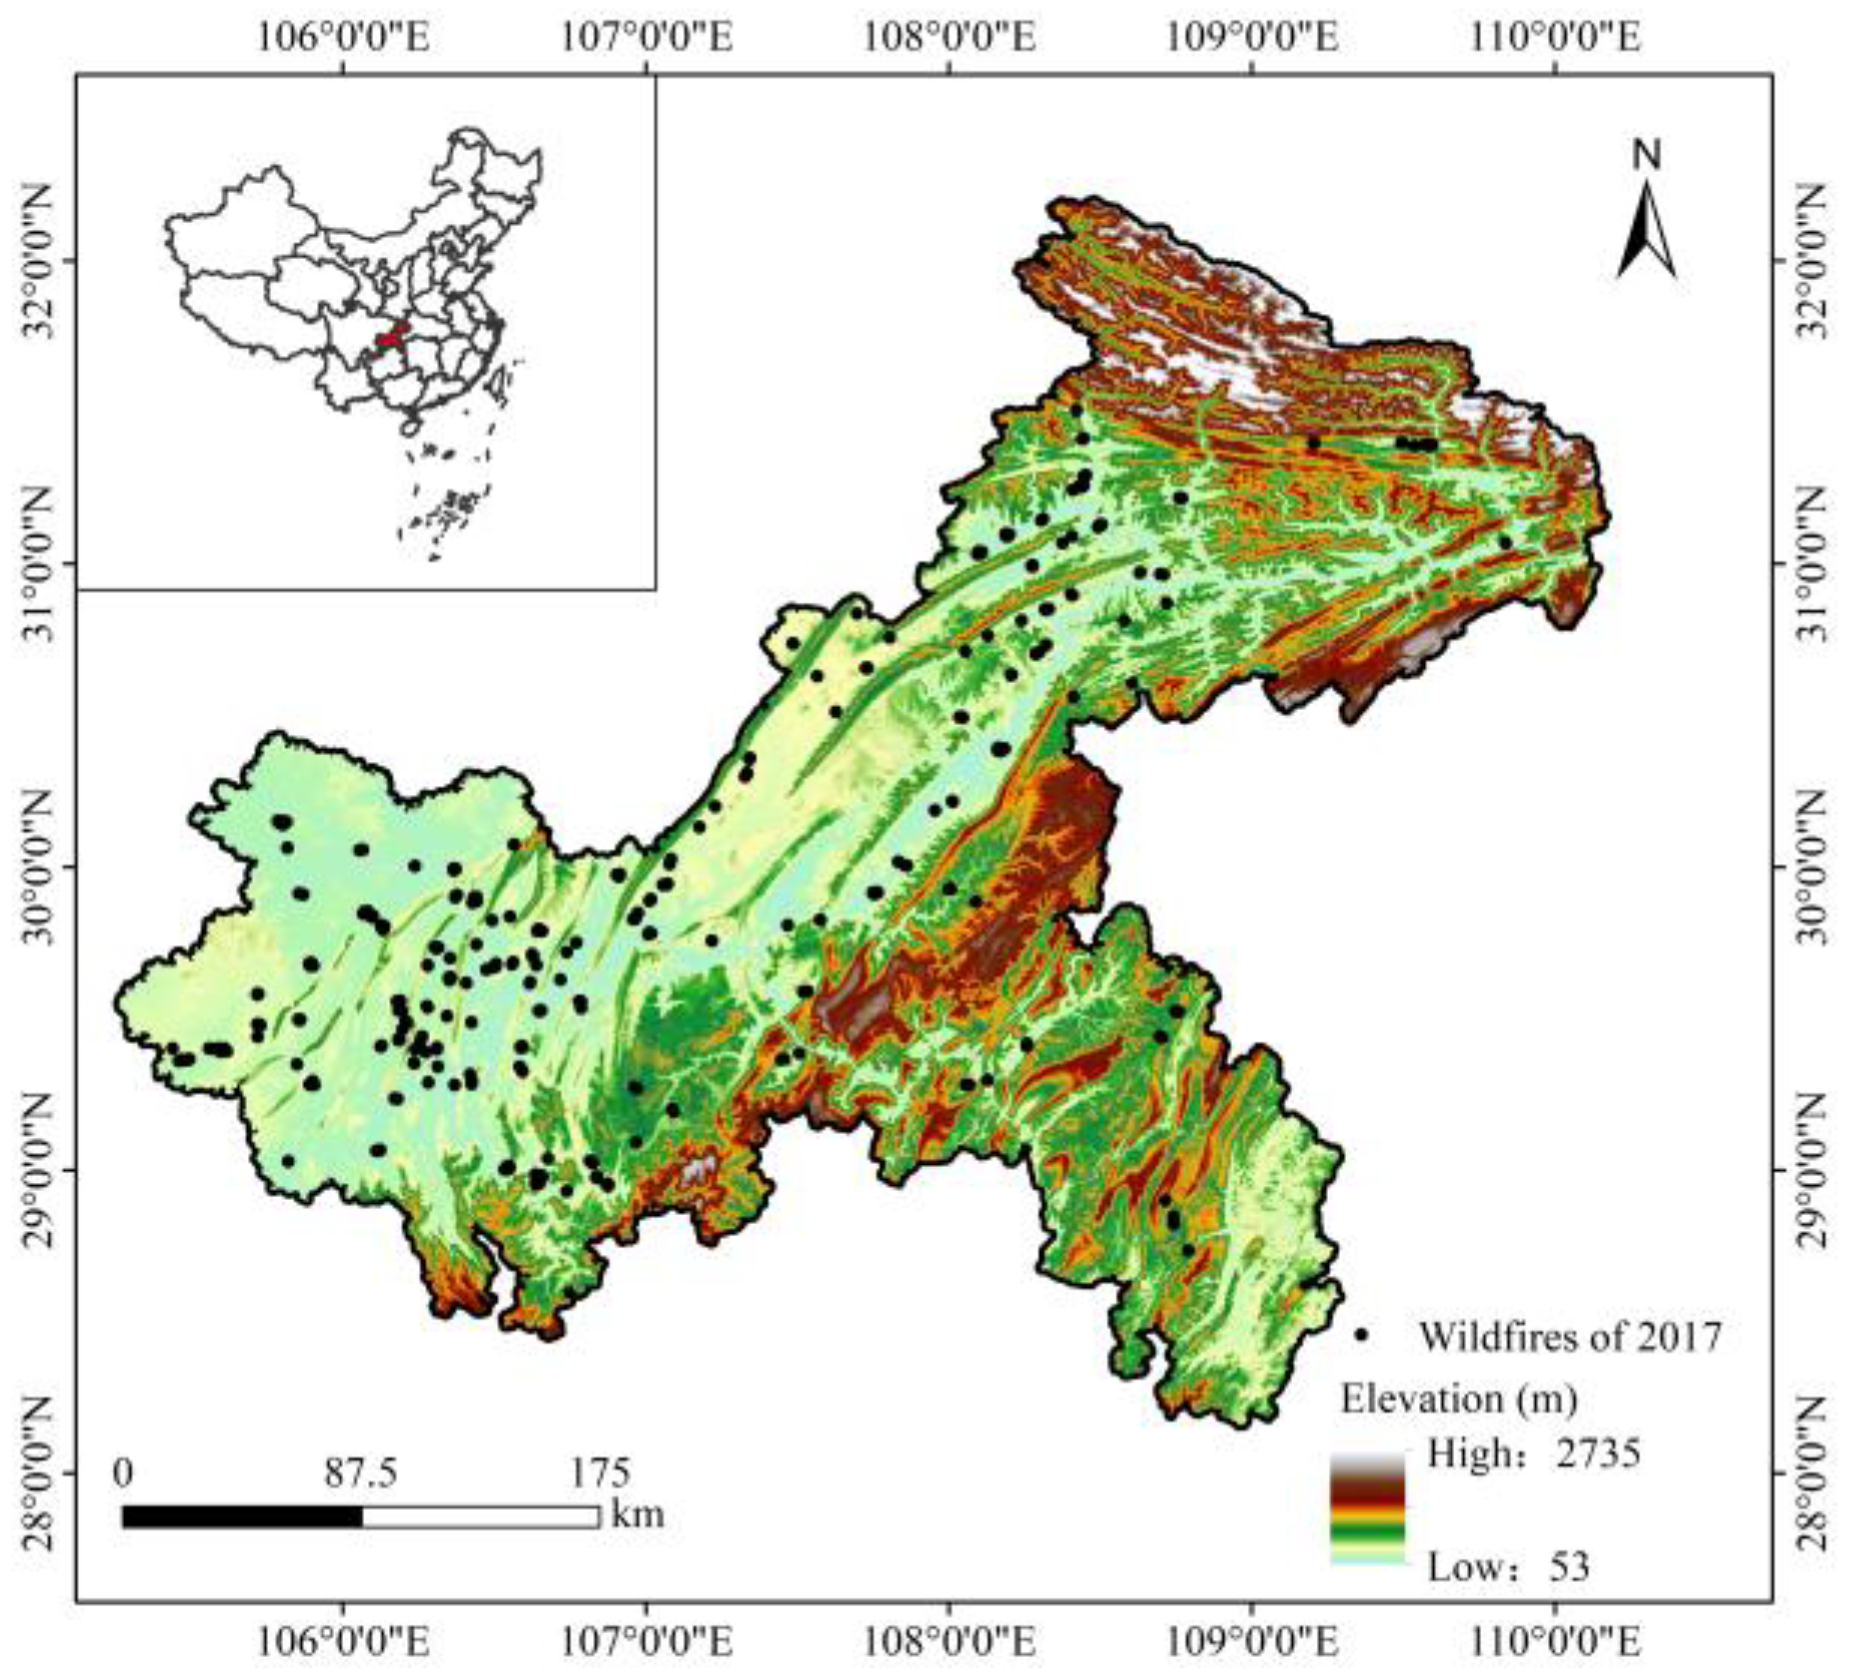
Figure 1. Location of Chongqing Municipality, in China, and distribution of wildfires in 2017.
Fire 07 00201 g001
Figure 2. The model framework for the wildfire susceptibility prediction.
Fire 07 00201 g002
Figure 3. Raster map of the average temperature in Chongqing, China, in 2017.
Fire 07 00201 g003
Figure 4. ROC curves and AUC of the five methods.
Fire 07 00201 g004
Figure 5. Radar maps of metrics derived from six different models on the validation set.
Fire 07 00201 g005
Figure 6. Wildfire susceptibility maps derived from different methods for Chongqing Municipality, China, in 2017. (a) Our method; (b) CNN-based method; (c) RF; (d) Decision Tree; (e) MLP; (f) SVM.
Fire 07 00201 g006
Figure 7. Classification accuracy with different percentages of labeled samples.
Fire 07 00201 g007
Table 1. Performance comparison with different input patch sizes.
Input Size 15 × 1525 × 2535 × 35
TrainingTP200520052000
TN199219931988
FP216
FN116
Sensitivity (%)99.9599.9599.70
Specificity (%)99.9099.9599.70
PPV (%)99.9099.9599.70
NPV (%)99.9599.9599.70
Accuracy (%)99.9399.9599.70
ValidatingTP466468472
TN447449440
FP595766
FN282622
Sensitivity (%)94.3394.7495.55
Specificity (%)88.3488.7486.96
PPV (%)88.7689.1487.73
NPV (%)94.1194.5395.24
Accuracy (%)91.3091.7091.20
Table 2. Performance comparison of our method with state-of-the-art methods.
Models OursCNN-Based Method [18]CCNNCCNN + SECCNN + CBAM
TrainingTP20051992200120001997
TN19931918197819841983
FP171161011
FN119569
Sensitivity (%)99.9599.0699.7599.7099.55
Specificity (%)99.9596.4399.2099.5099.45
PPV (%)99.9596.5699.2199.5099.45
NPV (%)99.9599.0299.7599.7099.55
Accuracy (%)99.9597.7599.4899.6099.50
ValidatingTP468437464463460
TN449429436448444
FP5782705862
FN2652303134
Sensitivity (%)94.7489.3793.9393.7293.12
Specificity (%)88.7483.9586.1788.5487.75
PPV (%)89.1484.286.8988.8788.12
NPV (%)94.5389.1993.5693.5392.89
Accuracy (%)91.7086.6090.0091.1090.40
Table 3. Performance comparison of our method with machine learning methods.
Models OursCNNRFDecision TreeMLPSVM
TrainingTP200519922003169515301611
TN199319181985174215551558
FP1714247434431
FN1198316481400
Sensitivity (%)99.9599.0699.6084.2976.0880.11
Specificity (%)99.9596.4399.8087.5878.1878.33
PPV (%)99.9596.5699.8087.2877.9078.89
NPV (%)99.9599.0299.6084.6576.3879.57
Accuracy (%)99.9597.7599.7085.9377.1379.23
ValidatingTP468437353331346358
TN449429379382396382
FP5782132129115129
FN2652136158143131
Sensitivity (%)94.7489.3772.1967.6970.7673.21
Specificity (%)88.7483.9574.1774.7677.5074.76
PPV (%)89.1484.272.7871.9675.0573.51
NPV (%)94.5389.1973.5970.7473.4774.46
Accuracy (%)91.7086.6073.2071.3074.2074.00
Disclaimer/Publisher’s Note: The statements, opinions and data contained in all publications are solely those of the individual author(s) and contributor(s) and not of MDPI and/or the editor(s). MDPI and/or the editor(s) disclaim responsibility for any injury to people or property resulting from any ideas, methods, instructions or products referred to in the content.