1. Introduction
It has become commonplace to acknowledge that climate change, or, more accurately, the climate crisis, affects countries across every continent to varying degrees. It is disrupting national economies and has had a major impact on people, communities, and countries of the present and the future. The increase in the number of forest fires, the burning of land, and the occurrence of mega-fires are included in the estimates of almost all climate models. It is widely recognized that the climate crisis, rather than merely climate change, is affecting countries around the globe to various extents. This crisis is disrupting national economies and significantly impacting individuals, communities, and nations in both the present and future. The escalation in forest fires, land burning, and the emergence of mega-fires are anticipated outcomes included in almost all climate model projections.
Wildfires stand out as a predominant disruptive force in nearly all forest vegetation zones globally, leading to significant emissions of gaseous and particulate compounds that have substantial physical, biological, and environmental ramifications [
1]. The Mediterranean region is identified as a critical “hot-spot” for climate change [
2].
Furthermore, the ongoing climate conditions play a pivotal role in influencing wildfires, especially under extreme circumstances [
3,
4]. The escalation in the frequency and severity of heatwaves [
5,
6] has precipitated a noteworthy surge in wildfires across Mediterranean regions in recent decades, with expectations of heightened prevalence in the future due to climate change [
7].
Over the past few decades, combating climate change has emerged as one of the most pressing global challenges to safeguard future generations from its severe consequences. Global warming has led to a rapid rise in the Earth’s temperature [
8,
9].
Wildfires and human-induced fires pose significant threats to forests [
10,
11], even with the current level of monitoring. Studies indicate a correlation between wildfires and moisture, projecting that future temperature increases will result in drier forests and an increased frequency of days with extreme weather conditions conducive to fire outbreaks [
12]. Numerous studies unequivocally document escalating wildfires attributed to global climate change, specifically the rise in temperature (heatwaves) [
13] and the lengthening of dry periods [
14,
15].
Under severe weather conditions, such as heatwaves or extremely hot and dry summers combined with strong winds, forest fires may escalate to catastrophic proportions, termed mega-fire events. These events not only result in biodiversity loss, soil erosion, desertification, economic threats, and threats to human lives, but also significant greenhouse gas emissions into the atmosphere [
16]. Forest fires have the potential to turn into catastrophic mega-fire events under severe weather conditions, such as heatwaves or extremely hot and dry summers combined with strong winds. These events lead not only to biodiversity loss, soil erosion, desertification, economic implications, and threats to human lives, but also to enormous greenhouse gas emissions into the atmosphere [
16]. When biomass is burned, greenhouse gases and particulate matter are emitted directly into the atmosphere [
17,
18]. These emissions have a profound impact on our climate, affecting atmospheric chemistry, biogeochemical cycles, and overall climate dynamics. The gases and aerosols released during biomass combustion play a crucial role in shaping our planet’s climate system, contributing to changes in temperature, precipitation patterns, and other environmental factors. Thus, understanding the release of these substances from biomass burning is essential for comprehending and addressing climate change and its associated impacts [
19].
Carbon emissions are a fundamental contributor to climate change [
20,
21]. In this context, Khan et al. explored the correlation between climate change and carbon emission risk [
22]. Eskander et al. examined greenhouse gas emissions from the perspective of climate change legislation across 133 nations, spanning seventeen years from 1999 to 2016 [
23]. Jiang et al. investigated the relationship between climatic change and greenhouse gas emissions, identifying releasing greenhouse gases as a primary cause of climate change [
24].
Numerous studies have addressed ecological risk assessments related to fire hazards [
25], risks to ecosystem services from forest fires [
26], fire smoke risk to populations [
27], and extensive literature on fire risk assessment [
28,
29,
30,
31,
32] and fire danger in the Mediterranean. Despite various studies linking the increase in greenhouse gases to climate change, there is a notable absence of studies connecting climate trends affecting forest fire behavior with an increase in the rate of combustion gas emissions. Therefore, this study’s overarching objective is to address the escalating emission rates of PM
2.5, PM
10, CO, CO
2, and CH
4 resulting from the influence of climate trends on forest fire behavior in a Mediterranean environment.
The emission of combustion products from forest fires exerts a profound influence on the health and well-being of a growing human populace. Safeguarding public safety necessitates the utilization of climate model projections at strategic, tactical, and operational levels. Policies that effectively mitigate the impacts of these emissions can be created by integrating data from models that simulate combustion product release rates with the European Civil Protection Mechanism directives. This is a multidimensional approach to enhancing protection for human health as wildfires continue to occur.
2. Materials and Methods
2.1. Emission Gases from Wildfires
Wildfires dramatically alter atmospheric composition, especially in terms of particulate matter (PM) concentration forms, such as PM2.5 and PM10, and gases, including carbon monoxide (CO) and carbon dioxide (CO2), as well as methane (CH4). Emissions, including CO, CO2, and CH4, when released into the public, have far-reaching implications on public health.
Particulate matter refers to minute particles hanging in the air that may penetrate the lungs to reach the bloodstream. Substances such as PM come with severe risks to human health, considering that PM can reach the blood. PM2.5 is vital in the development of respiratory and cardiovascular problems, while increasing illness for people living with asthma. PM includes larger particles than PM, but the former is harmful to human health, particularly for people with other respiratory conditions.
Carbon monoxide (CO) is a colorless, odorless gas produced during incomplete combustion of organic matter, such as vegetation, during wildfires. CO interferes with the body’s ability to transport oxygen in the bloodstream, leading to symptoms such as headaches, dizziness, and even death in high concentrations.
Carbon dioxide (CO2) is a gas heretofore associated with climate change and global warming when it comes to human health. While it is not harmful in the near term, it can aggravate respiratory health and exacerbate fire impacts by extending the frequency and duration of extreme weather events.
Furthermore, another greenhouse gas emitted during wildfires is methane (CH4). Methane released into the atmosphere exacerbates atmospheric warming and, consequently, climate change. Exposure to methane is not only a cause of global warming, but is also linked to respiratory irritation and other health issues.
In conclusion, the emissions of PM2.5, PM10, CO, CO2, and CH4 generated by wildfires are detrimental to public health and environmental quality. Since the most vulnerable categories, including children, older adults, and individuals with preexisting respiratory or cardiovascular conditions, are more susceptible to damages due to wildfire emissions, it is critical to implement strategies to minimize the emissions generated from wildfire events.
2.2. MAGICC 2.4
The Model for the Assessment of Greenhouse Gas-Induced Climate Change (MAGICC 2.4) may be described as a complex of interacting models, and it is one of the simple climate models defined by Hulme et al. (2000) [
33]. While not emulating general circulation models (GCMs), MAGICC 2.4 uses a sequence of simplified models as consistent substitutes for the highly intricate, fully three-dimensional, and dynamic GCMs. The primary function of MAGICC 2.4 is to act as a framework that calculates the change in the annual-mean global surface air temperature and the global mean sea-level change following the emission scenarios for greenhouse gases and sulfur dioxide. MAGICC 2.4 was designed to comply with the analogous framework offered by Raper et al. (1996) [
34]. It is worth noting that the user-approved MAGICC 2.4 has the ability to choose from a large number of available predefined emission scenarios or design custom ones, which allows for a variety of model parameters to quantify an ensemble of inherent uncertainties in climate projections. Moreover, MAGICC 2.4 has become one of the most widely known tools in the Intergovernmental Panel on Climate Change’s (IPCC) assessment methodology. Beyond that, although MAGICC 2.4 is a fully functioning tool that can operate autonomously, the SCENGEN 2.4 partnership connects it to several other tools, which significantly increases its efficiency. In fact, MAGICC 2.4 and SCENGEN 2.4 complement one another by enhancing the depth and analytical sharpness of both tools. Ultimately, this symbiotic relationship enables researchers and policymakers to more thoroughly analyze the underlying drivers and manifold consequences of the global warming phenomenon.
2.3. SCENGEN 2.4
It is crucial to note that, although SCENGEN 2.4 is not a climate model, it is a seminal climate research and scenario analysis tool. Instead, it serves as a comprehensive suite composed of the results of multiple general circulation model (GCM) experiments and thorough datasets involving global and regional climate observations. By working hand-in-hand with MAGICC 2.4, SCENGEN 2.4 processes combined datasets and user-specified primary climate scenario parameters in real time to extrude custom climate scenarios. Over years of refinement, SCENGEN 2.4 has developed into a complex, fully programmed software system developed to supplement and extend the utility of MAGICC 2.4.
Beyond being a supplement to MAGICC 2.4, SCENGEN 2.4 can function as a standalone tool, albeit with somewhat downgraded options. While SCENGEN 2.4 has not yet received its formal blessing from the Intergovernmental Panel on Climate Change (IPCC), the databases included in SCENGEN 2.4 are the result of widespread testing and have been extensively used in a plethora of IPCC assessments, including the Third Assessment Report set to be released in 2001. A high level of experience is synonymous with SCENGEN 2.4, and therefore, the level of trust in it: the complexity of SCENGEN 2.4 enables the generation of a diverse set of scenarios.
The conducted experiments cover the following:
Simulation of climatic conditions during 1961–1990, a well-known decade worldwide;
Modeling of climatic patterns from 2060 to 2089 within the 1S92A scenario outlined by the IPCC;
Simulation of climatic conditions from 2060 to 2089 based on the 1S92C scenario outlined by the IPCC.
It is assumed that the average rate of CO2 emissions in the 1980s, marking a certain period, is 1.1 Gt C (Carbon), and that a doubling of CO2 levels would cause a 2.5 °C rise in the average global surface temperature. The specified 1S92A and 1S92C scenarios applied for the given simulations likely involve increases in greenhouse gas emission rates over the next century.
The simulations suggest that the average CO2 emission rate back in the 1980s, which should be considered as a temporal benchmark, was 1.1 Gt C (Carbon). Furthermore, it is also presumed that a twofold increase in CO2 levels would cause the average global surface temperature to grow by 2.5 °C. Moreover, two scenarios, 1S92A and 1S92C, which were previously utilized in the simulations presented above, have been built to consider potential increases in greenhouse gas emissions over the next hundred years.
These examples are presented to illustrate probable paths for greenhouse gas emissions within the next century, taking into account the perceived trends in global climate. [
35]. These scenarios differ in their underlying assumptions regarding global demographic shifts, economic processes, and the rate of technological progress. In these examples, scenario 1S92A appears to be rather pessimistic about future emission developments, projecting the CO
2 level to reach 20.40 Gt C by 2010, compared to 6.10 Gt C in 1990. Conversely, scenario 1S92C appears to be moderately optimistic, anticipating a CO
2 level of 4.80 Gt C by 2100, down from 6.10 Gt C in 1990.
The simulations employed a variety of climatic models, including HadCM2, UKTR, CSIRO-TR, ECHAM4, UKHI-EQ, CSIRO-EQ, ECHAM3, UIUC-EQ, CCC-EQ, GFDL-TR, BMRC-EQ, CGCM1-TR, NCAR-DOE, and CCSR-NIES. These models offer detailed and comprehensive insights into the potential trends of future climate based on various emission scenarios [
36].
The temperature trends in our region, as indicated by the dynamical simulations for the period from 2060 to 2084, show significant changes. Under the 1S92A scenario, the average temperature in hot months is expected to increase by 3.5 °C, whereas the maximum temperature in the hottest summers will rise by 3.0 °C. Moreover, under the 1S92C scenario, the average temperature increase is projected at 2.5 °C, with the maximum temperature rising by 2.0 °C.
Furthermore, according to initial results, there are expected to be drastic changes in the amounts of precipitation during summer. It is projected that the average amount of rainfall will be reduced by between 20% and 40%. Moreover, there will likely be a slight reduction in the average wind speed across South Greece by 2%, contrasted by a marginal increase of 2% in North Greece and the surrounding islands, as observed in both the 1S92A and 1S92C scenarios. These findings underscore the complex and region-specific implications of climate change on meteorological parameters, necessitating comprehensive adaptation and mitigation strategies [
36].
2.4. FARSITE 4
FARSITE 4 is a space–time model of simulation of the spread and the behavior of fires depending on the landscape, the fuel, and the weather conditions. The configuration approach uses a practice of the Huygens principle for the spread of waves for the simulation of an increase in a fire front. FARSITE 4 accepts meteorological data that describe the meteorological conditions during a fire, i.e., the speed and direction of the wind, the air temperature, the relevant humidity, and clouds.
In order to study the fires in Rafina and Voutzas in July 2005 and whether climatic trends influenced their behavior, a digital terrain model with a horizontal resolution of 25 m × 25 m was used for the area of interest. Meteorological data (wind speed, temperature, precipitation, cloud cover, and relative humidity) were input into FARSITE 4 from the data of the nearest meteorological stations of the airport “Eleftherios Venizelos” (
Table 1 and
Table 2). To create the fuel models, the study area was photo-interpreted using Quickbird imagery, and it was found that the use of fuel models 2, 7, 8, and 10 [
37] best simulated the Voutsas fire, while the use of fuel models 8, 122, and 164 [
38] best simulated the Rafina fire [
39].
For this region, the canopy height was estimated at 10.0 m, the crown base height was estimated at 4.8 m, and the crown bulk density was estimated at 0.16 kg/m
3 [
40]. Measurements from the weather stations in eastern Attica (El. Venizelos and Marathon) showed that the maximum temperature on that day reached 39 °C in Rafina at 15:00. The wind speed was greater than or equal to 30 km/h (5 Beaufort). The direction was usually northeast (NE). The humidity was close to 20%. Subsequently, the live and dead fuel moisture contents per fuel model at the beginning of the simulation were estimated as follows: contained dead fuel moisture: 1 h TL: 5%, 10 h TL: 6%, and 100 h TL: 10%. Live fuel moisture grass and woody: 100%.
Finally, for the simulations of the fires, their durations, which were the time periods from the start of the fire until the moment of its control, were determined for Rafina (from 28/7/2005 at 10:45 to 28/7/2005 at 18:00) and for Neos Voutzas (from 28/7/2005 at 13:25 to 28/7/2005 at 20:00), as well as the ignition points, which were identified by the Arson Crimes Department (D.A.E.) of the Hellenic Fire Service. It was estimated that the fires occurred in the area with coordinates N: 38°01′, E: 24°00′.
3. Results and Discussion
To ensure the accuracy of the simulations, we focused on the initial four hours following the ignition of the fires, as the influence of climatic trends beyond this timeframe may extend beyond the area of interest and impact the outcomes.
Since the simulations of fires with the influence of climatic trends are outside the boundaries of the area of interest and affect the result, the simulations will be conducted for the first four (4) hours after the start of the fire. The fire in Neos Voutzas, from 13:25 L.T. (Local Time) to 17:25 L.T., with the meteorological conditions prevailing on 28 July 2005, was simulated first. Then, the fire in Rafina, from 10:45 L.T. to 14:45L.T, was generated.
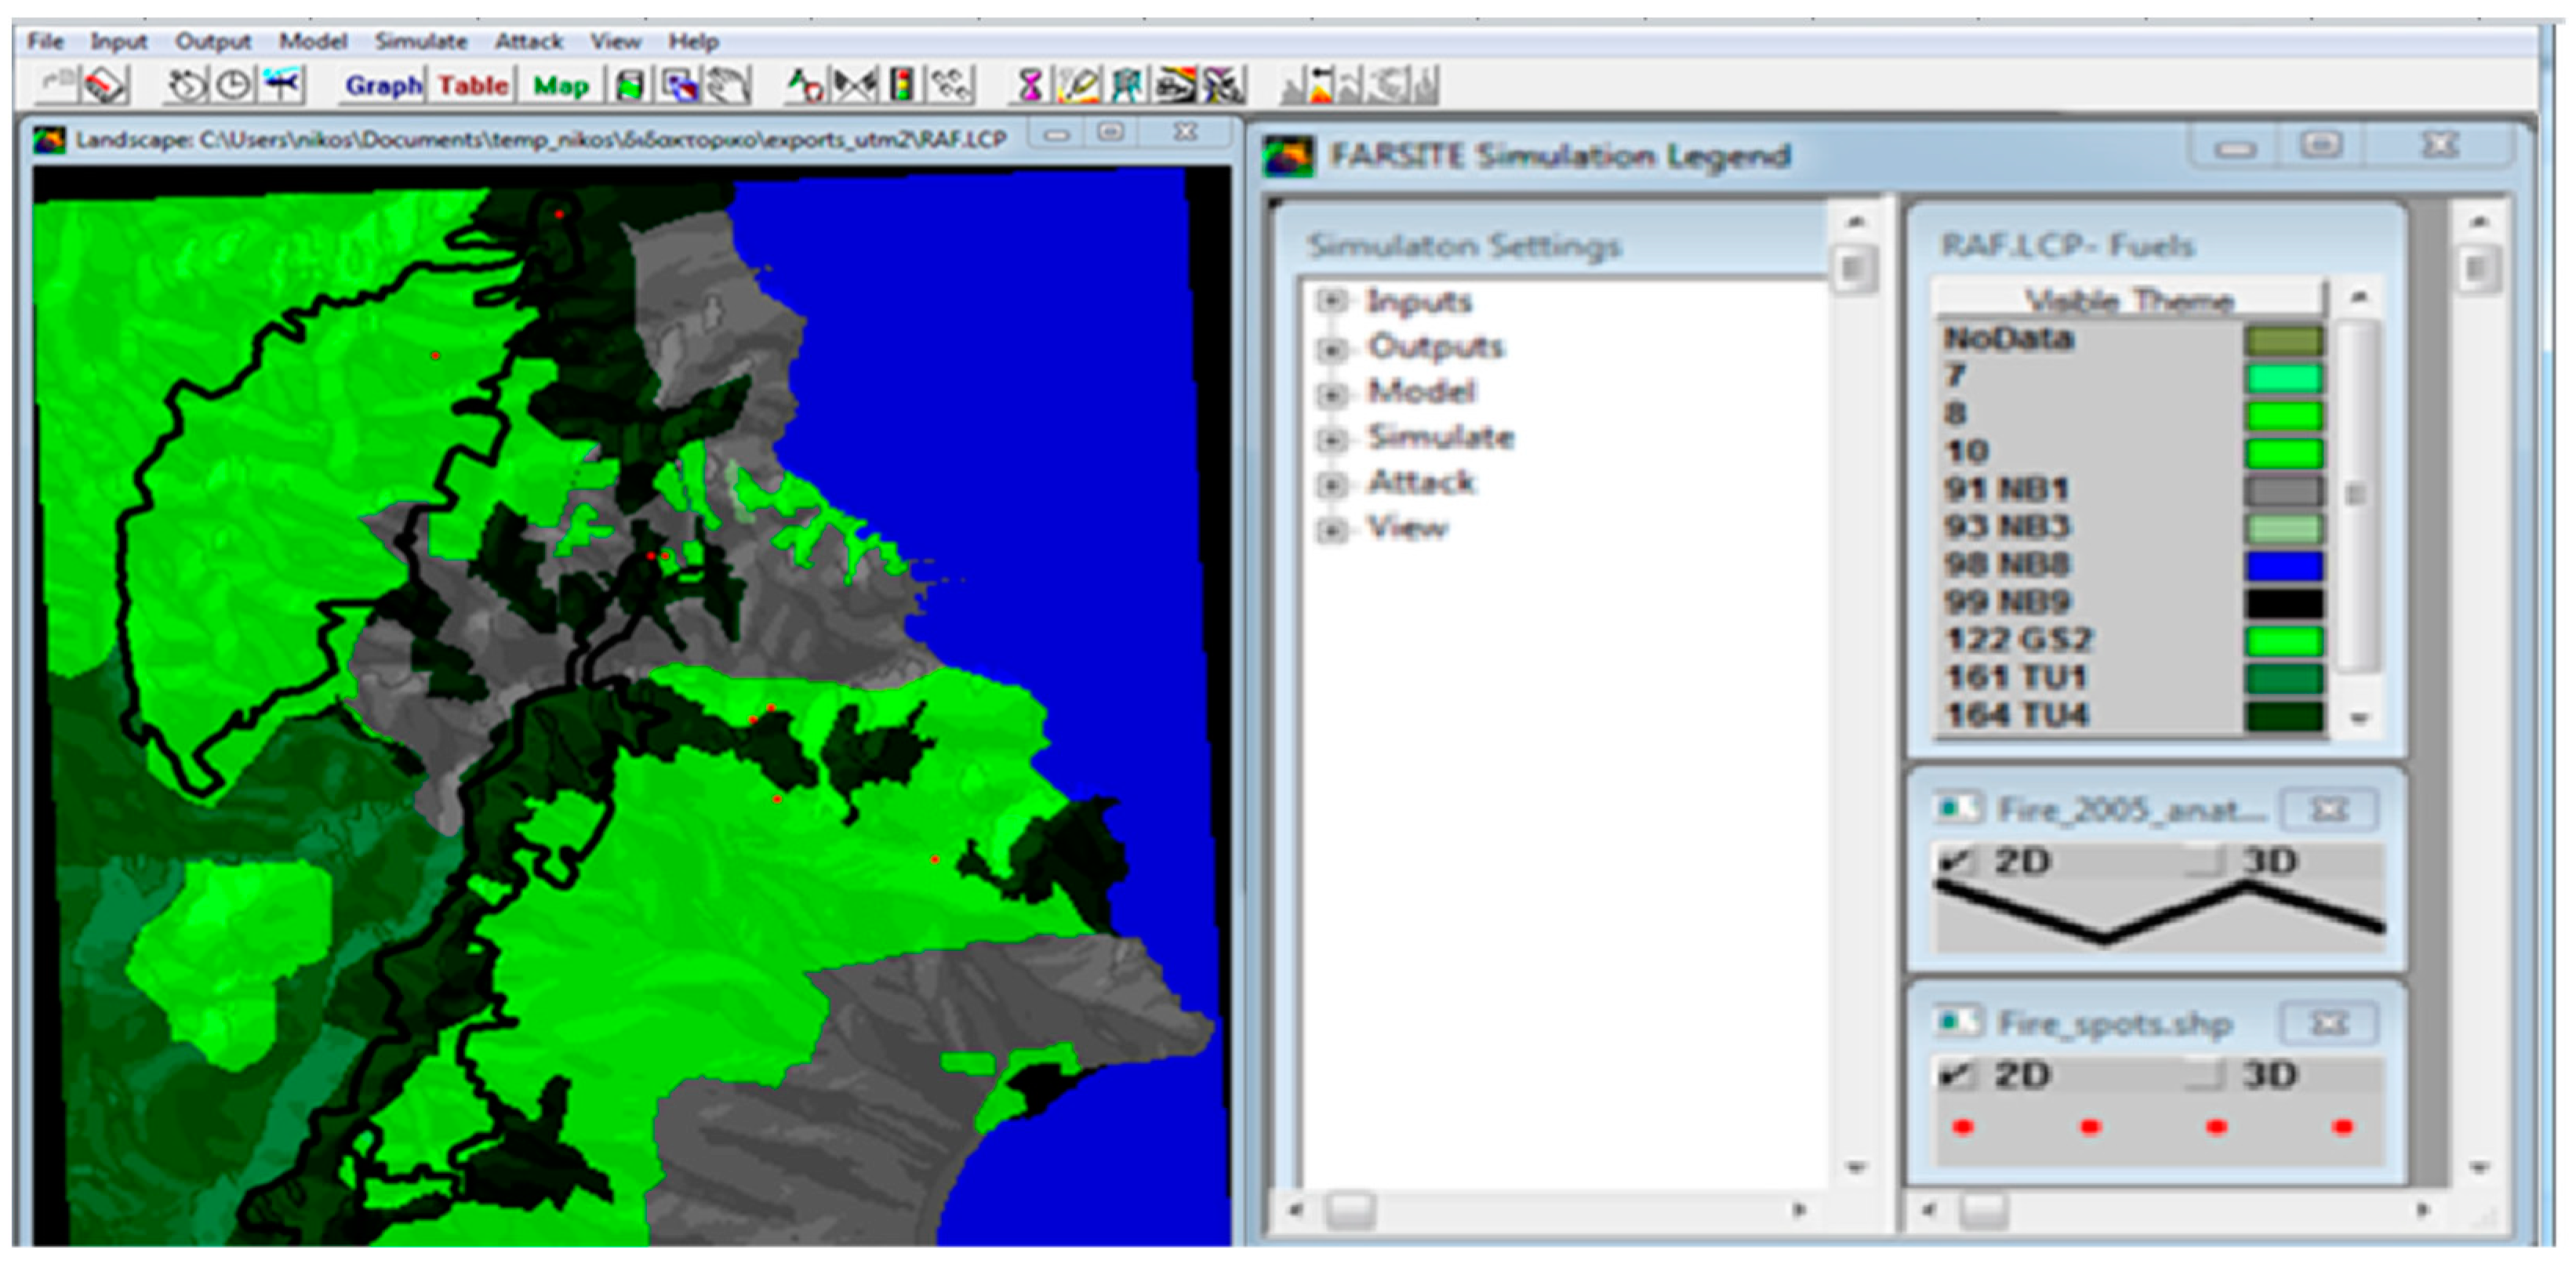
Initially, the forest fire in Neos Voutzas was simulated for the first four (4) hours according to the conditions prevailing on the day of the fire. The total burned areas of both forest fires considered herein are shown as black outlines in the study areas (
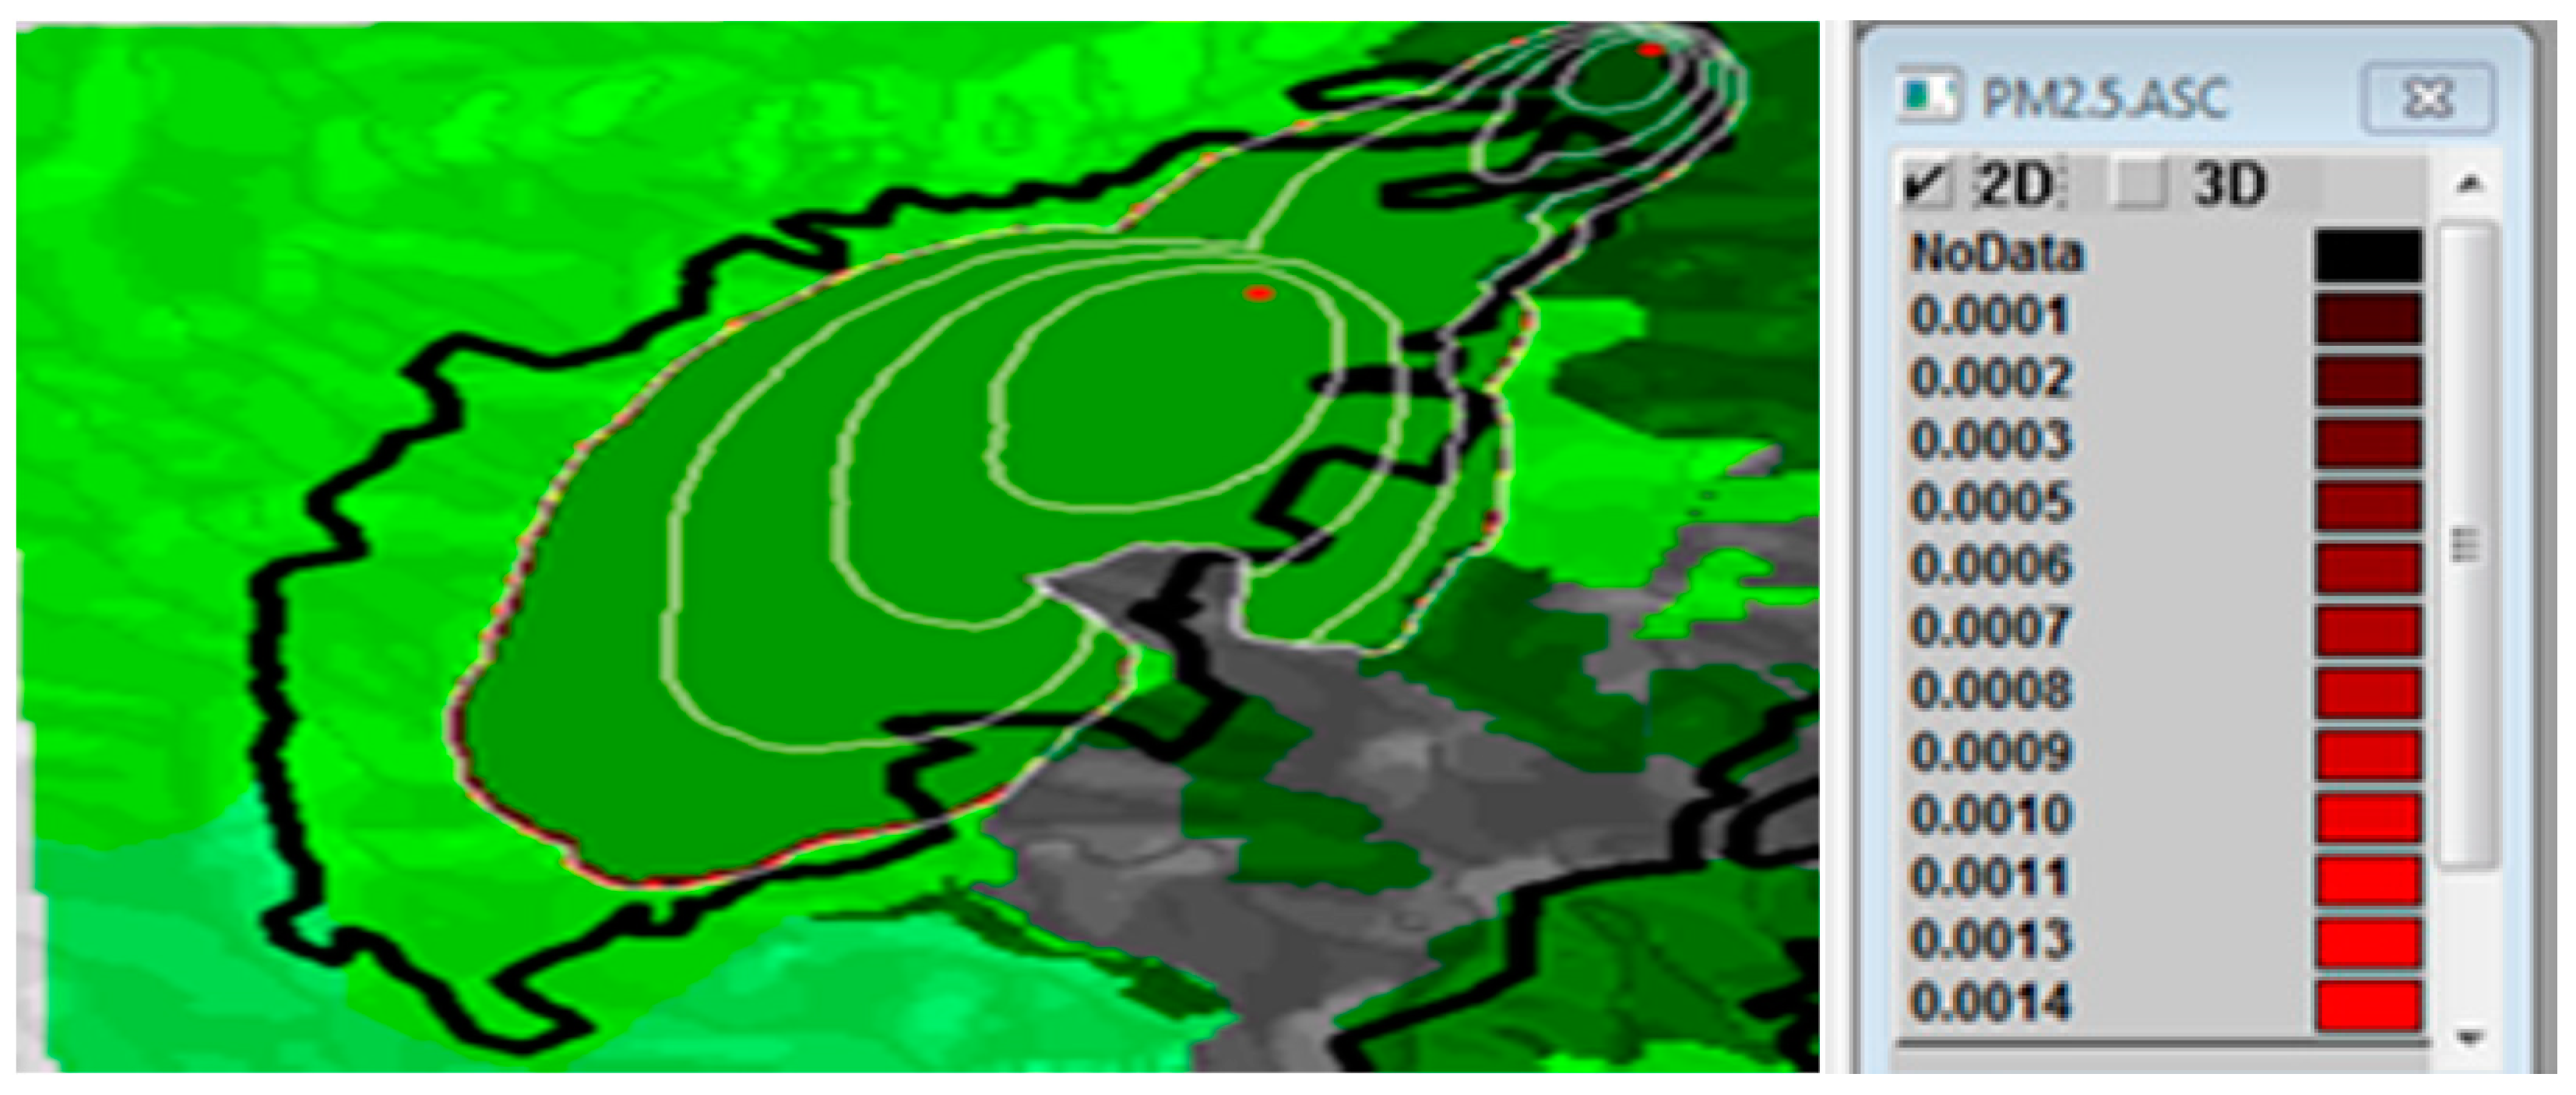
Figure 1). The FARSITE 4 model was employed to simulate the progression of the fire, resulting in a PM
2.5 release rate along the fire front approximating 0.0014 Mg/ha/min (
Figure 2). In a comparable vein, the PM
10 release rate along the fire front was estimated to be approximately 0.0016 Mg/ha/min. Moreover, the release rate of CO along the fire front approached 0.0169 Mg/ha/min, while the release rate of CO
2 was close to 0.0008 Mg/ha/min. Similarly, the release rate of CH
4 along the fire front was calculated to be approximately 0.1512 Mg/ha/min. Please refer to
Supplementary Materials for Figures S1–S4, which provide additional visual representations supporting the findings presented in this study.
Case Study 1: The maximum temperature increased by 1 °C, the relevant humidity of the air decreased by 5%, and the moisture of the dead fuel decreased by 1%, whereas the wind speed remained steady.
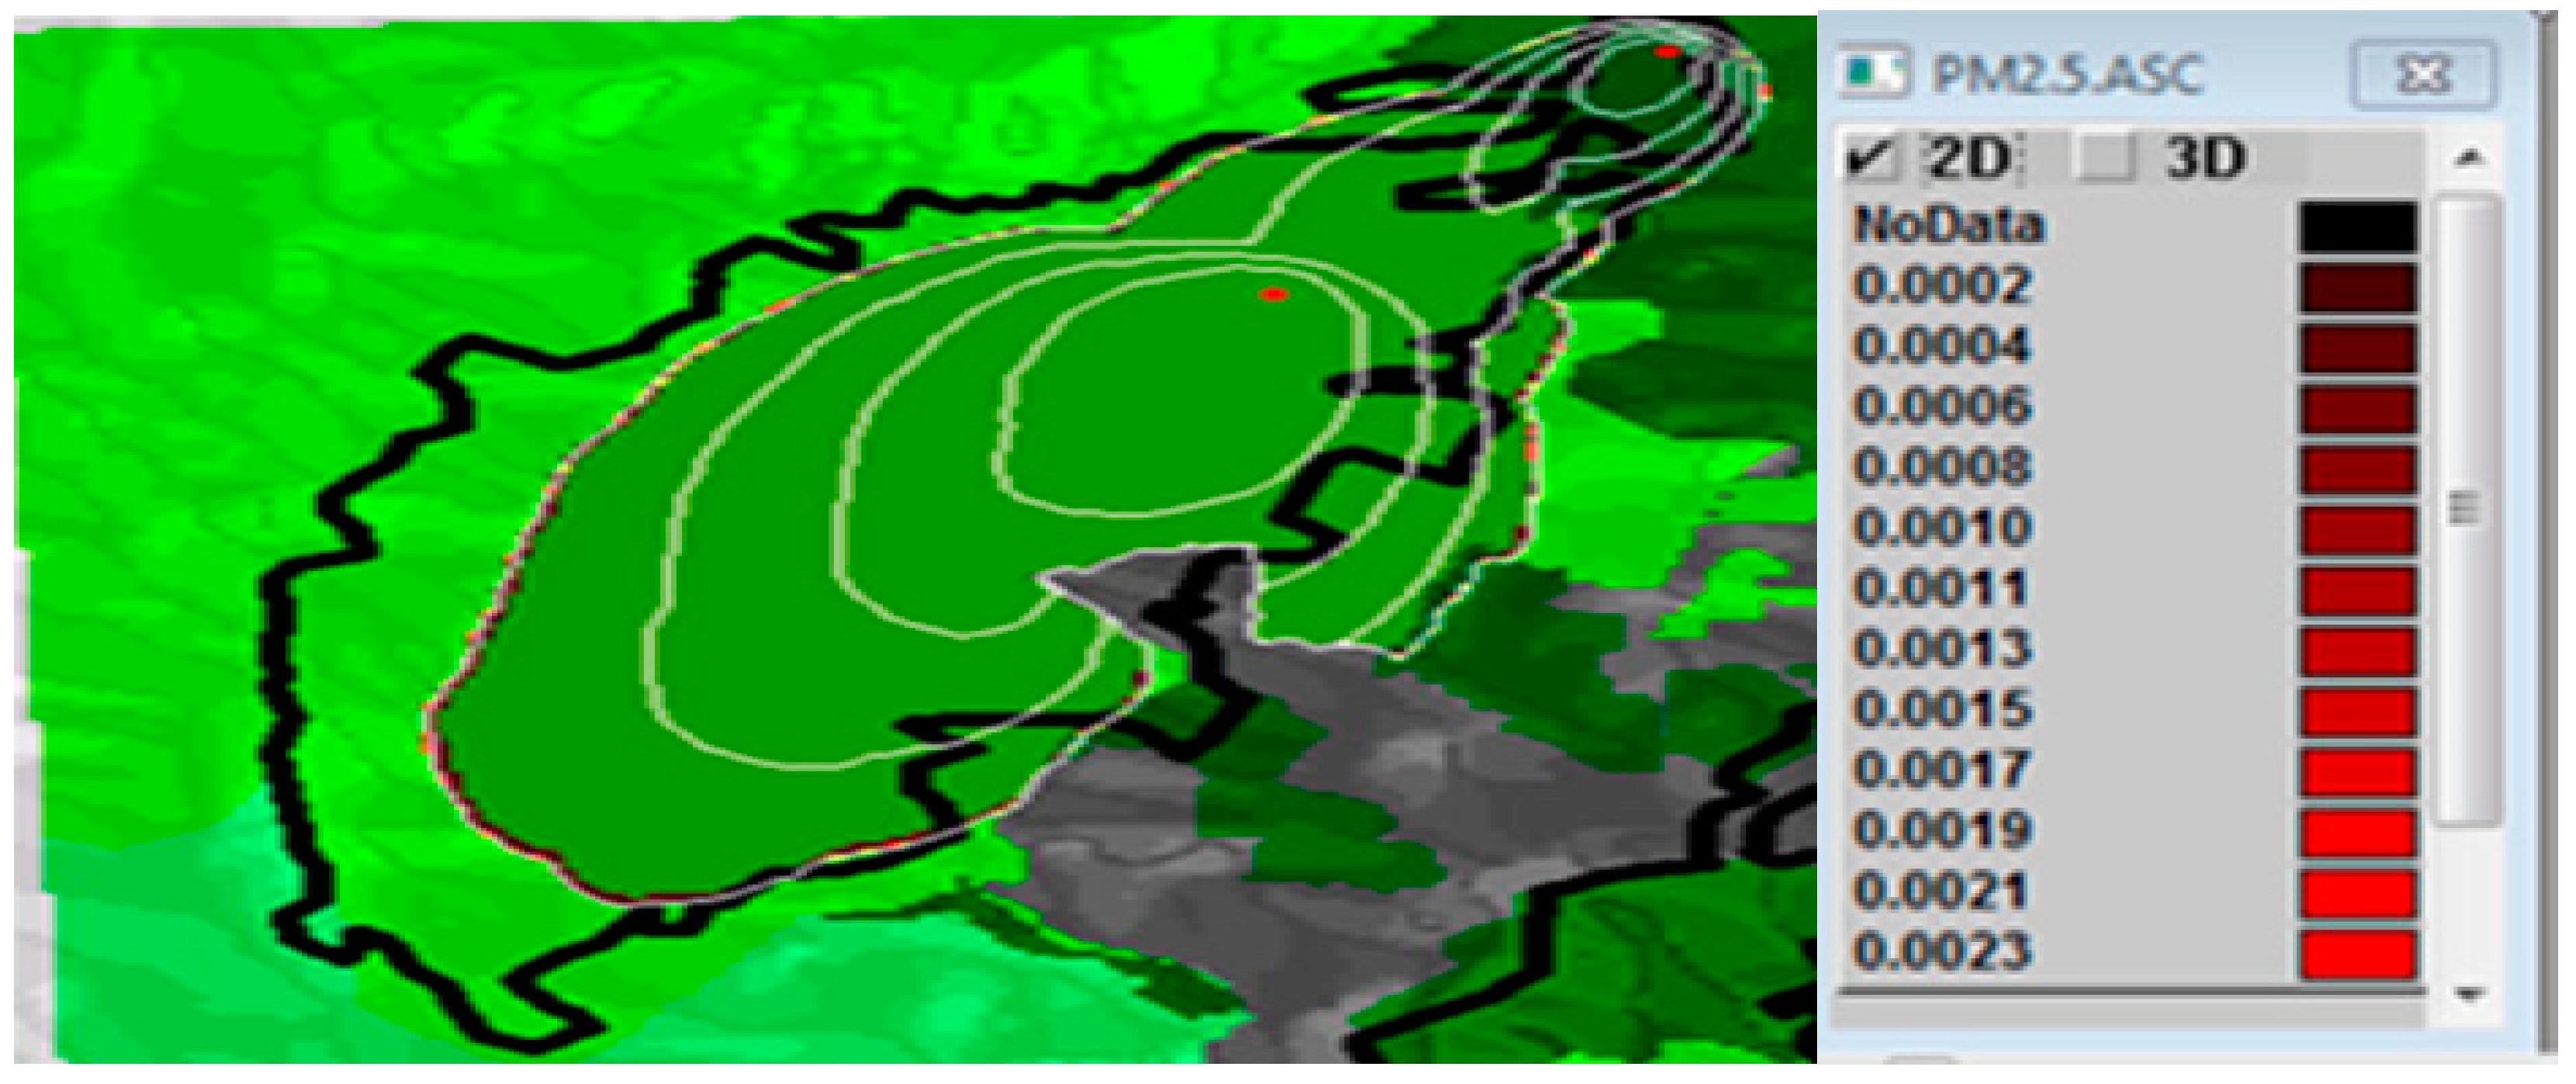
FARSITE 4 simulated the new fire in Neos Voutzas, and the PM
2.5 release rate along the fire front was close to 0.0023 Mg/ha/min (
Figure 3). By analogy, the PM
10 release rate along the fire front was close to 0.0027 Mg/ha/min. The CO release rate along the fire front was close to 0.0284 Mg/ha/min. The CO
2 release rate along the fire front was close to 0.0013 Mg/ha/min. Similarly, the CH
4 release rate along the fire front was close to 0.2490 Mg/ha/min. Please refer to the
Supplementary Materials for Figures S5–S8, which offer additional visual representations complementing the findings discussed in this study.
Case Study 2: The maximum temperature increased by 2 °C, the relevant humidity of the air decreased by 8%, and the moisture of the dead fuel decreased by 2%, whereas the wind speed remained steady.
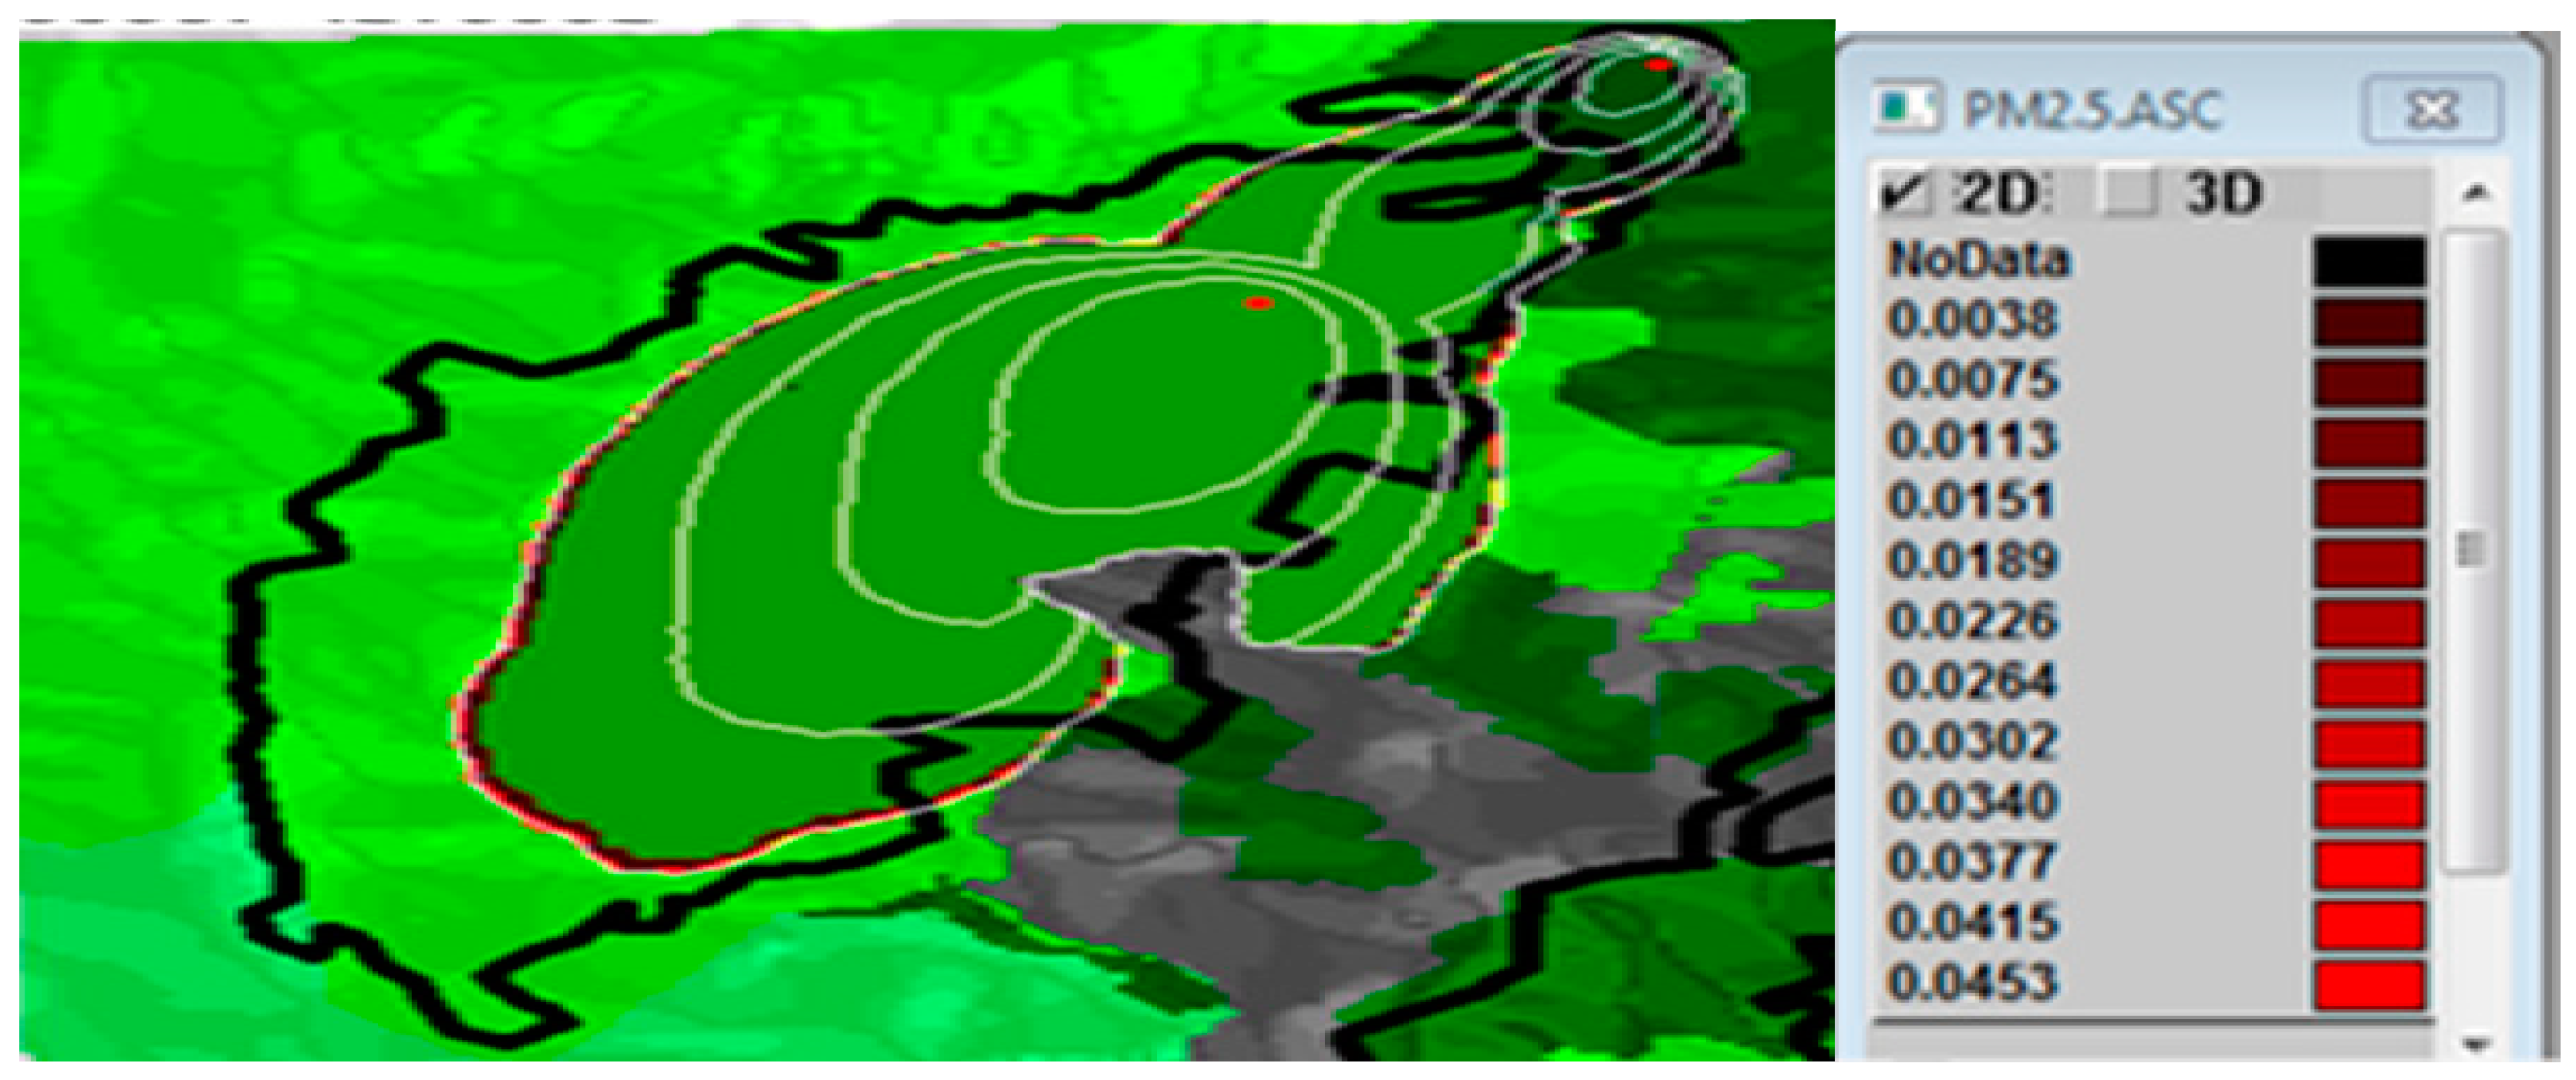
FARSITE 4 conducted simulations for the new fire scenario in Neos Voutzas, revealing a PM
2.5 release rate along the fire front of approximately 0.0453 Mg/ha/min (
Figure 4). Analogously, the PM
10 release rate along the fire front was estimated to be close to 0.0534 Mg/ha/min. Additionally, the release rate of CO along the fire front was approximately 0.4635 Mg/ha/min, while the release rate of CO
2 approached 0.0236 Mg/ha/min. Similarly, the release rate of CH
4 along the fire front was calculated to be close to 10.5905 Mg/ha/min.
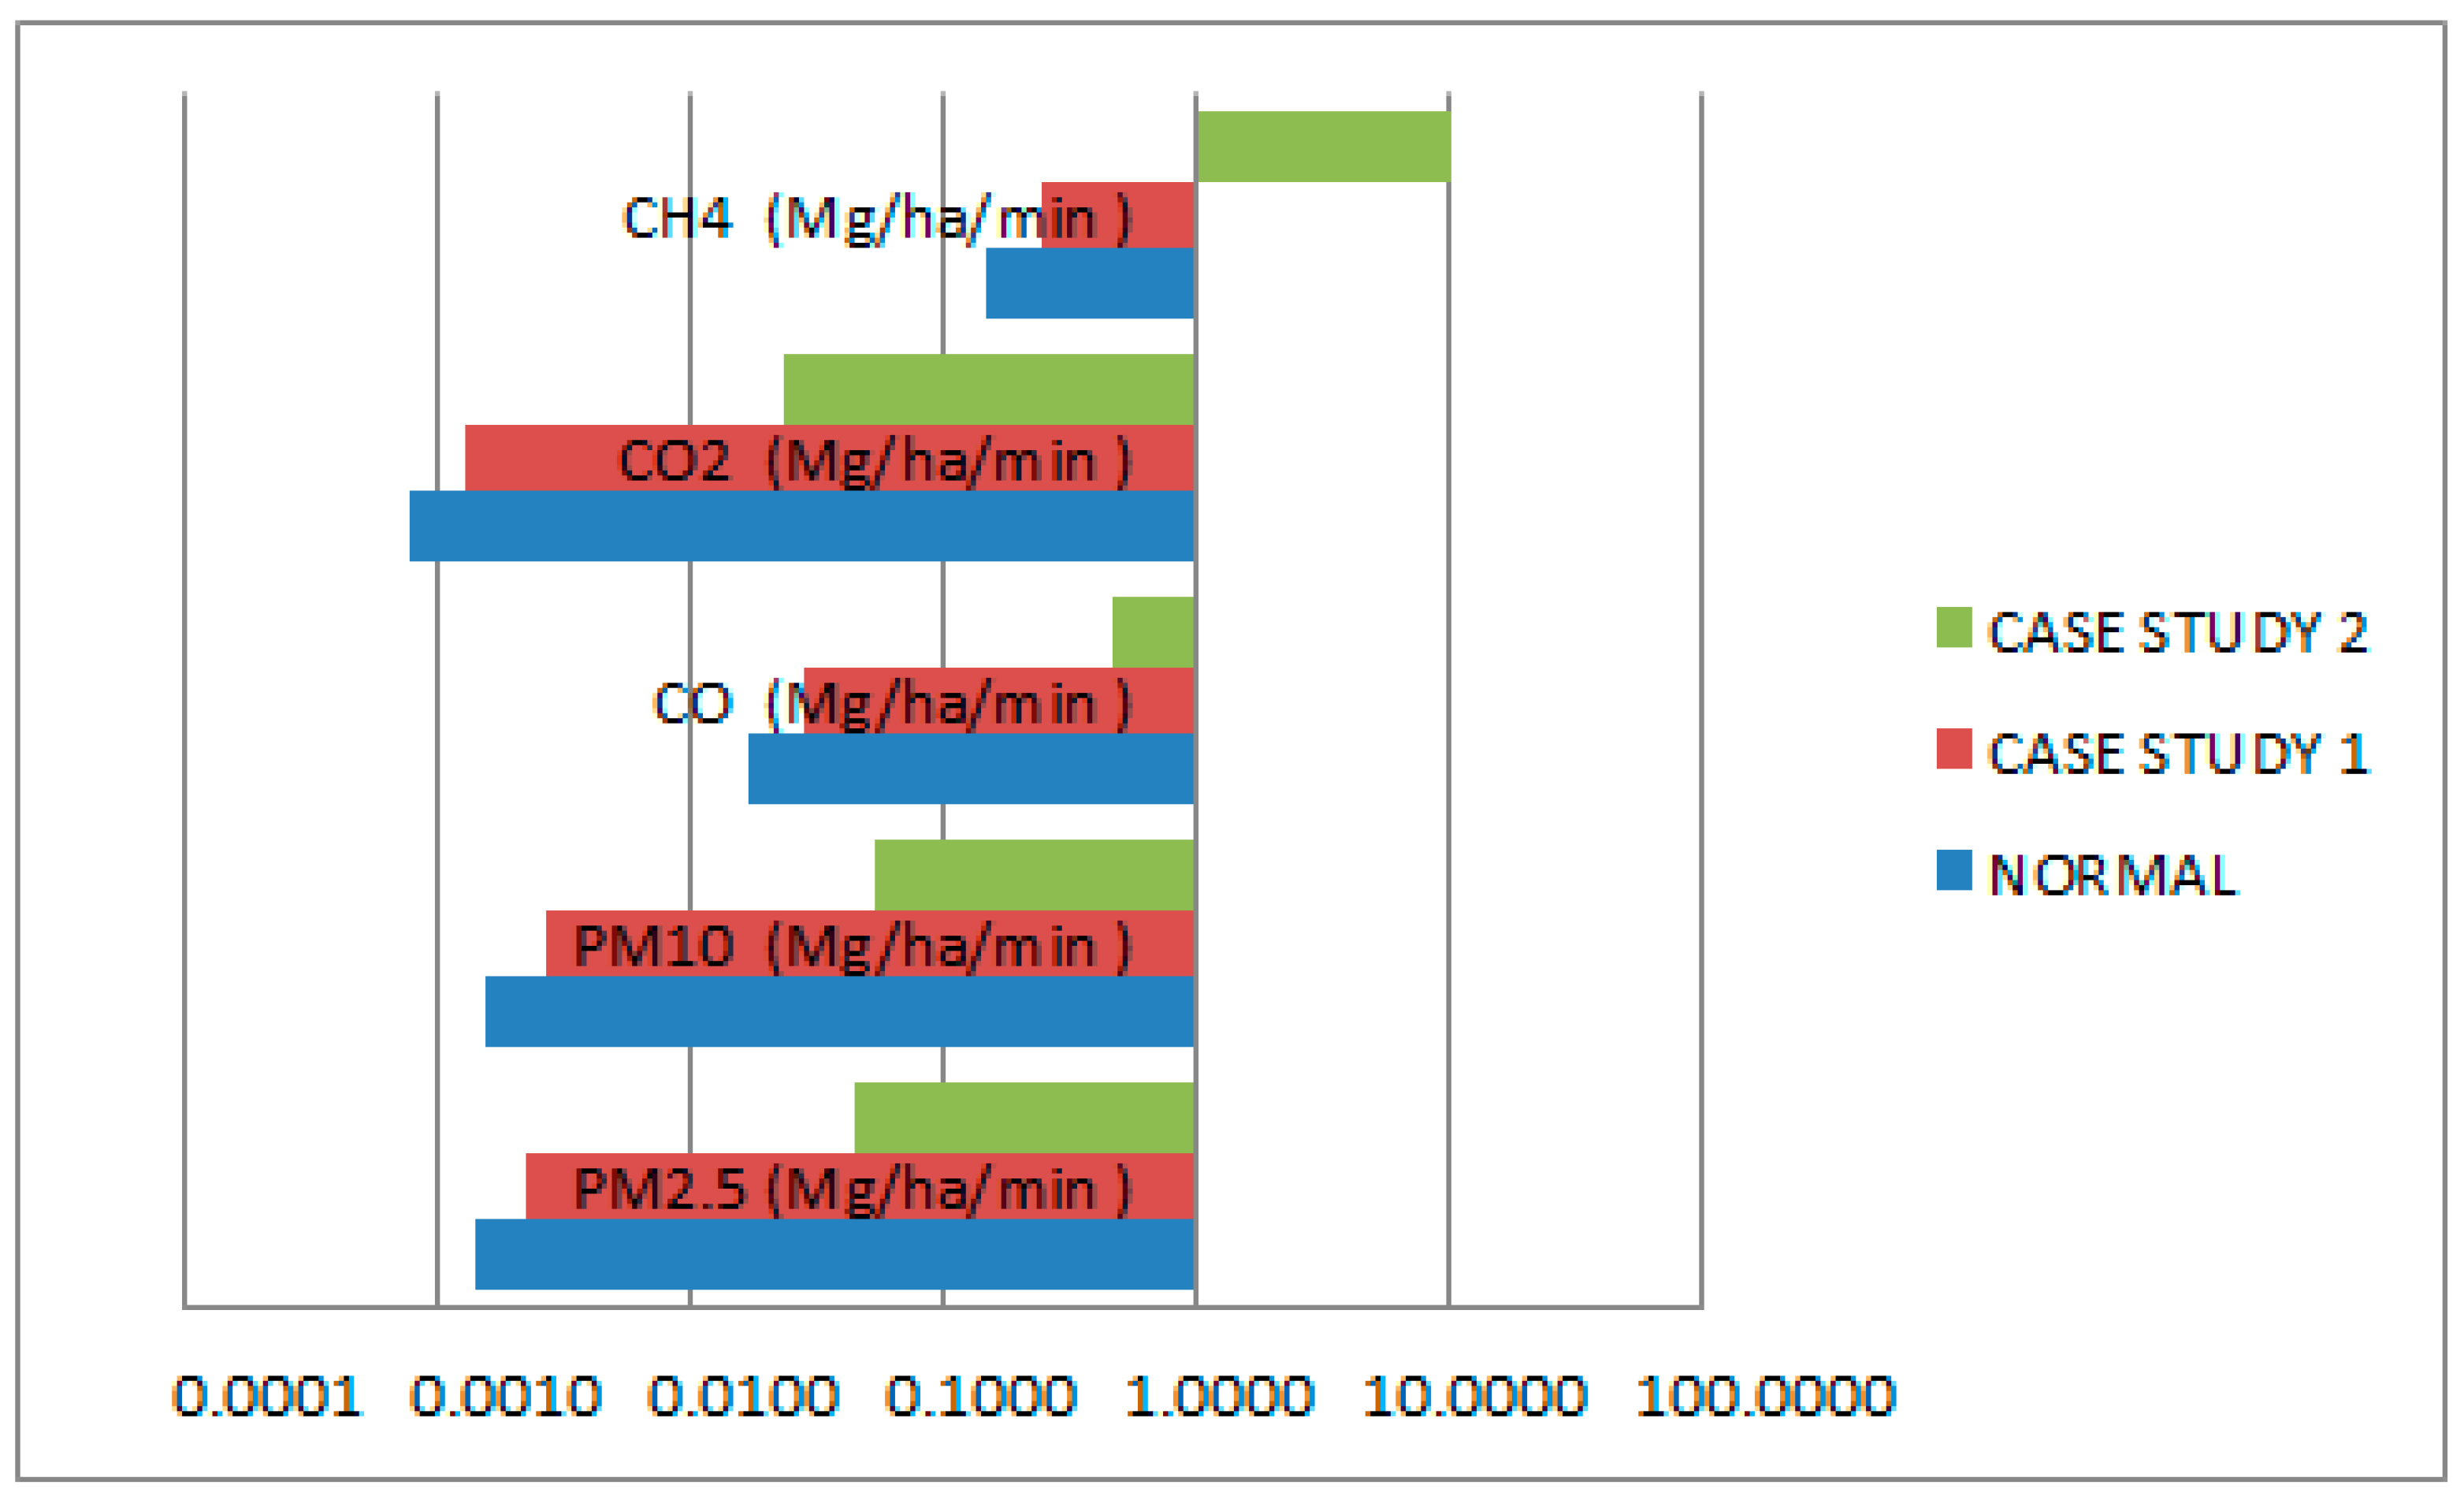
Figure 5 illustrates the emission rates from two case studies and the normal scenario of the Neos Voutzas wildfire. It became apparent that, as the temperature increased by one or two degrees Celsius, there was a significant rise in the gas emission rate from the wildfires. This temperature elevation directly impacts the combustion behavior of biomass during such events, resulting in heightened and prolonged burning of fuel materials. Consequently, the emission rates of pollutants such as of PM
2.5, PM
10, CO, CO
2, and CH
4 experience increases due to these intensified combustion processes.
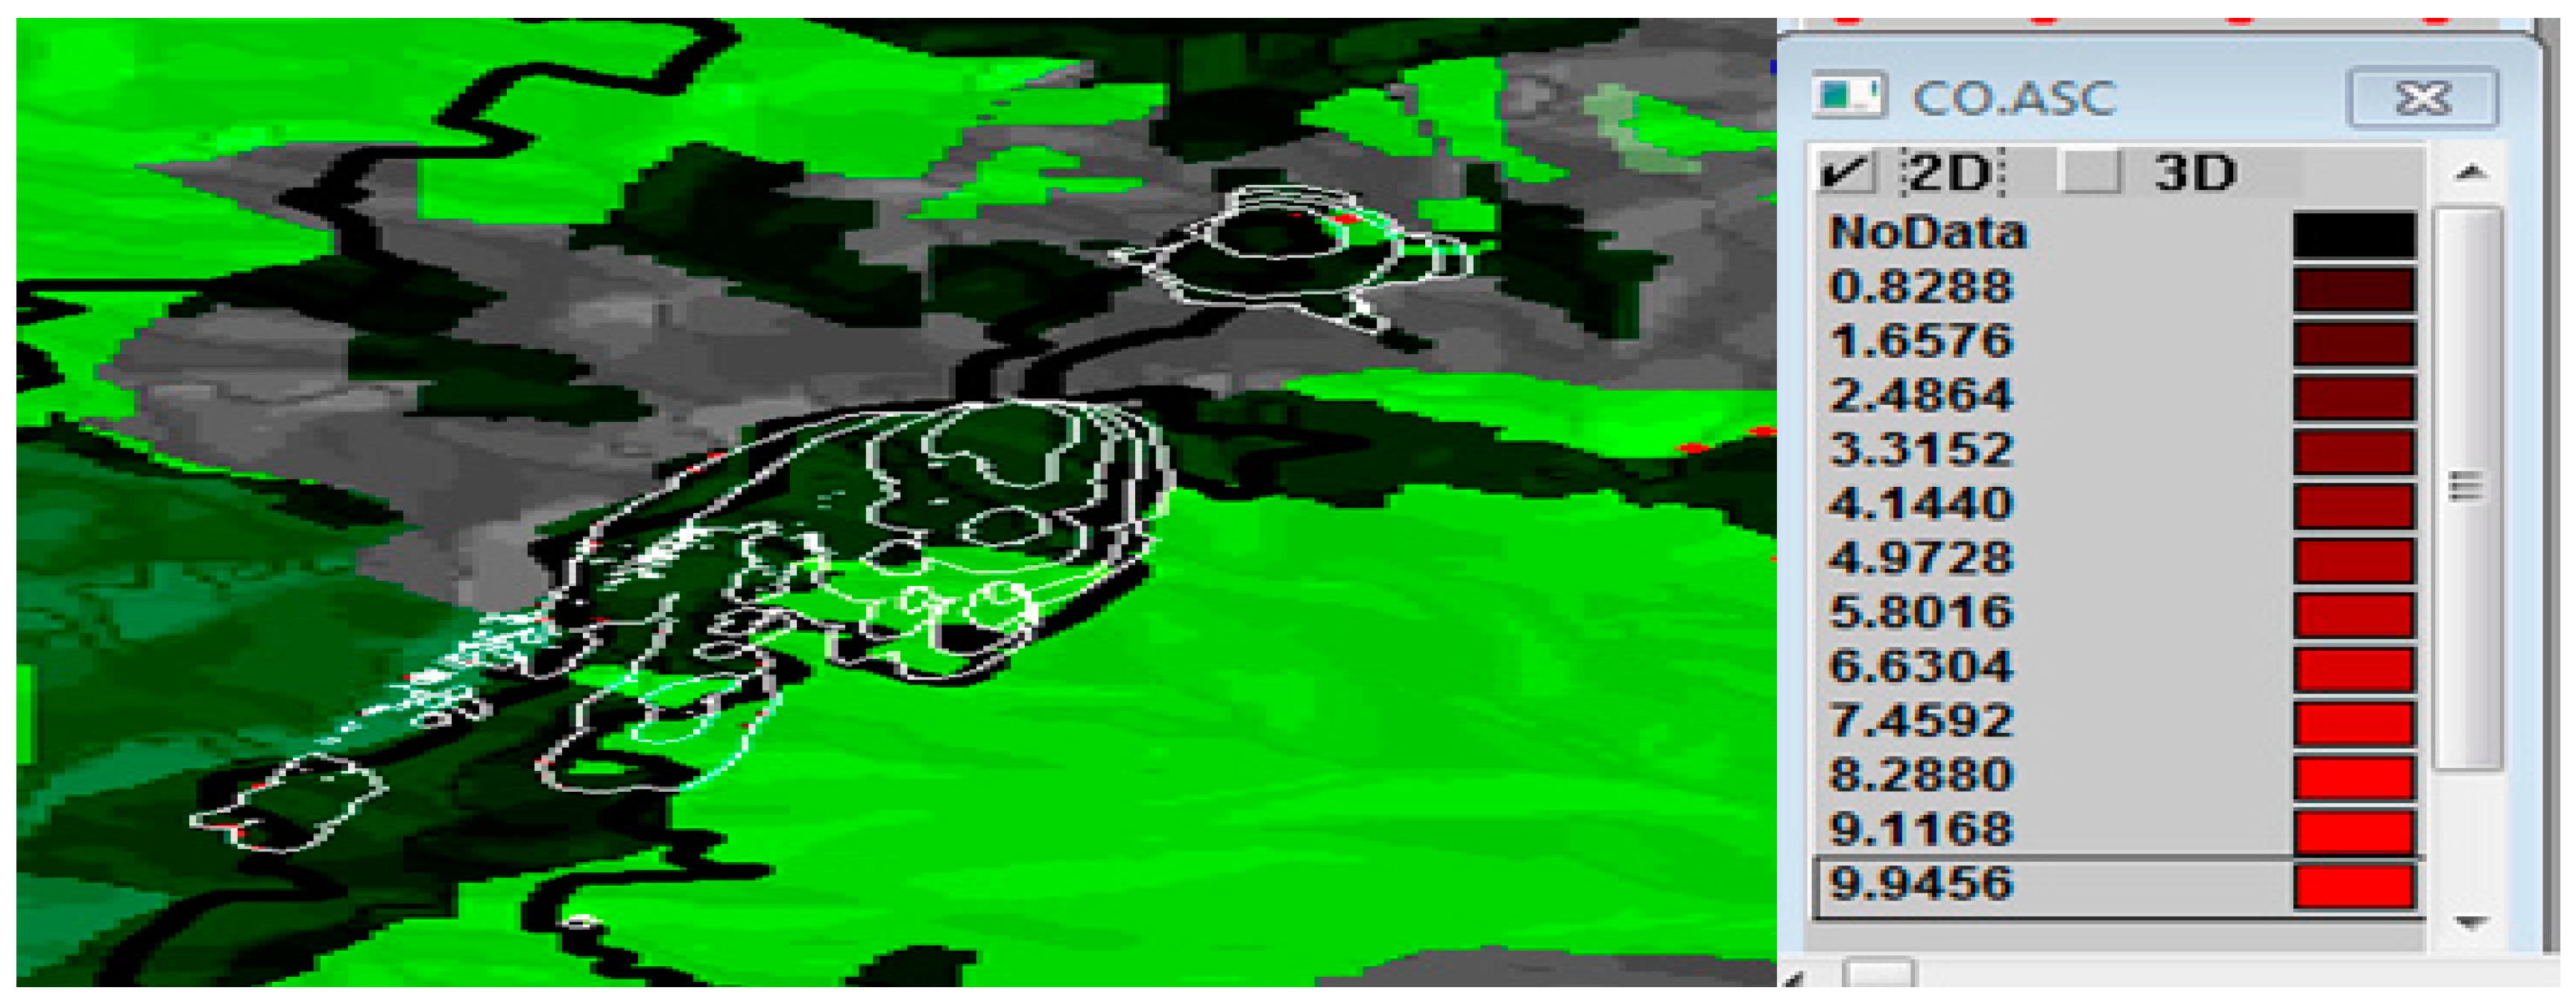
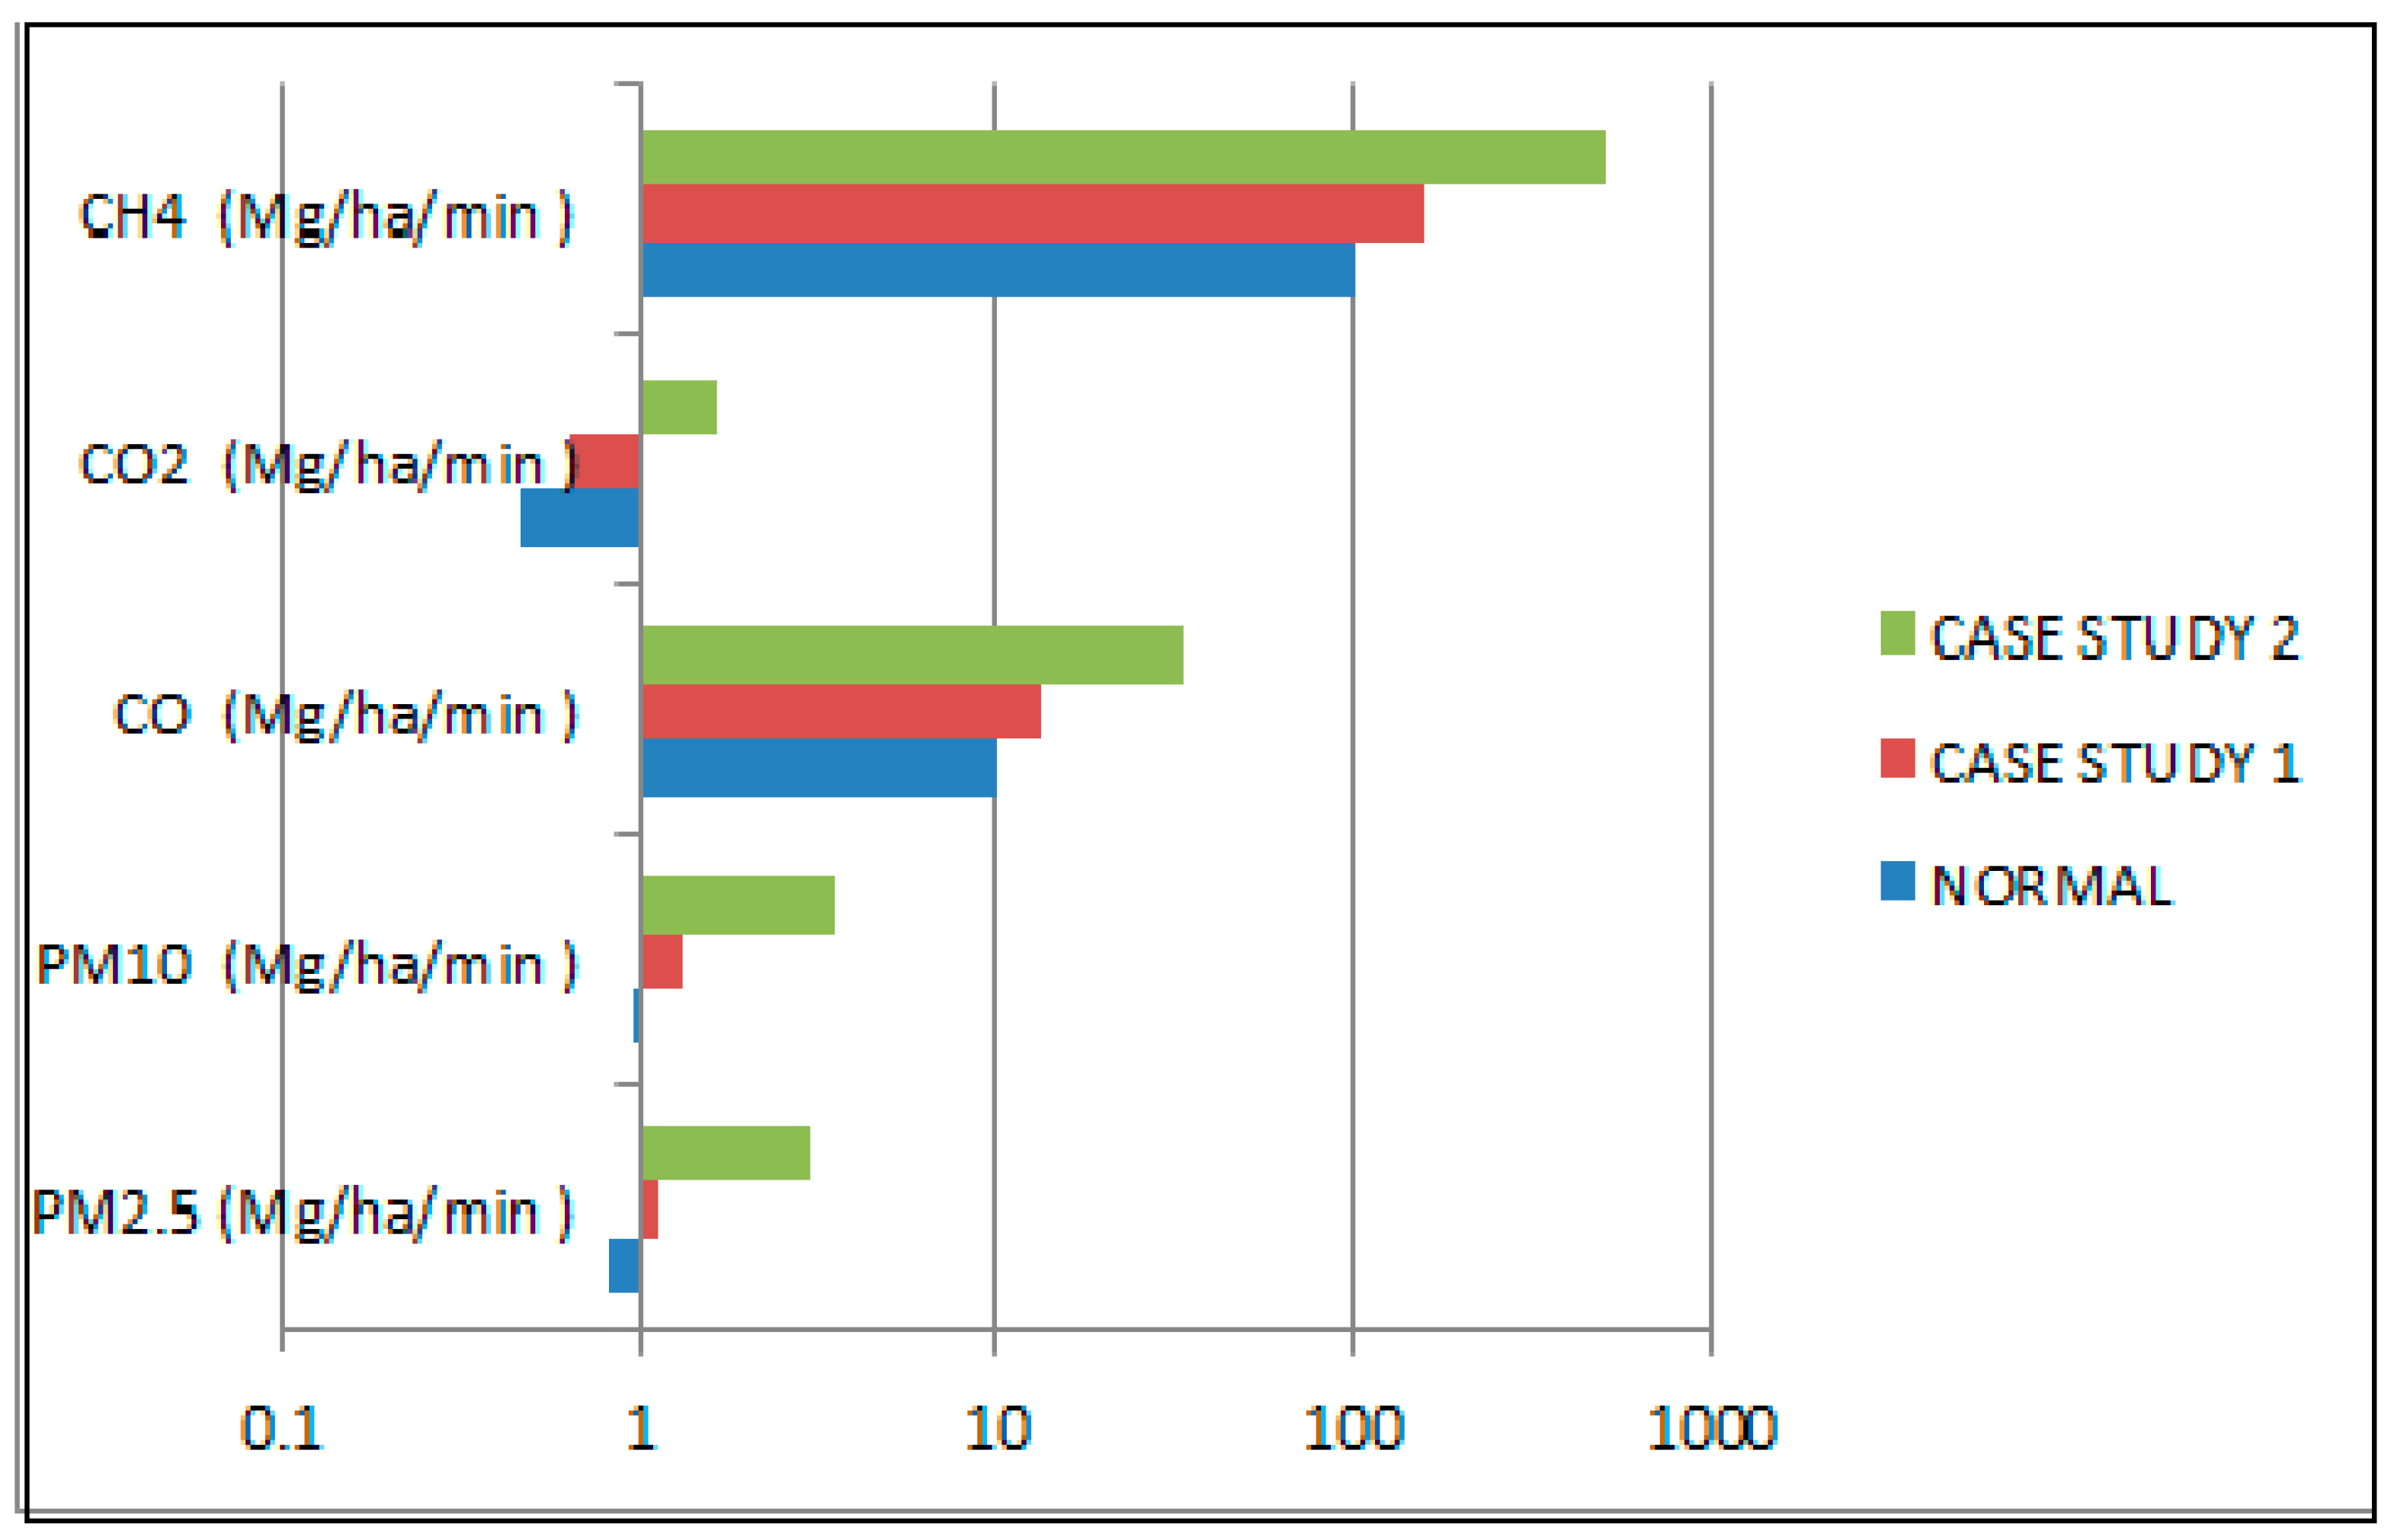
Then, the forest fire in Rafina was simulated for the first four (4) hours according to the conditions prevailing on the day of the fire. FARSITE 4 conducted simulations, indicating a CO release rate along the fire front of approximately 9.9456 Mg/ha/min (
Figure 6). Correspondingly, the PM
2.5 release rate along the fire front was estimated to be close to 0.8202 Mg/ha/min, while the PM
10 release rate approached 0.9679 Mg/ha/min. Furthermore, the release rate of CO
2 along the fire front was calculated to be close to 0.4708 Mg/ha/min. Similarly, the release rate of CH
4 along the fire front was determined to be approximately 101.6196 Mg/ha/min. Please refer to
Supplementary Materials for Figures S13–S16, which provide additional visual representations supporting the findings presented in this study.
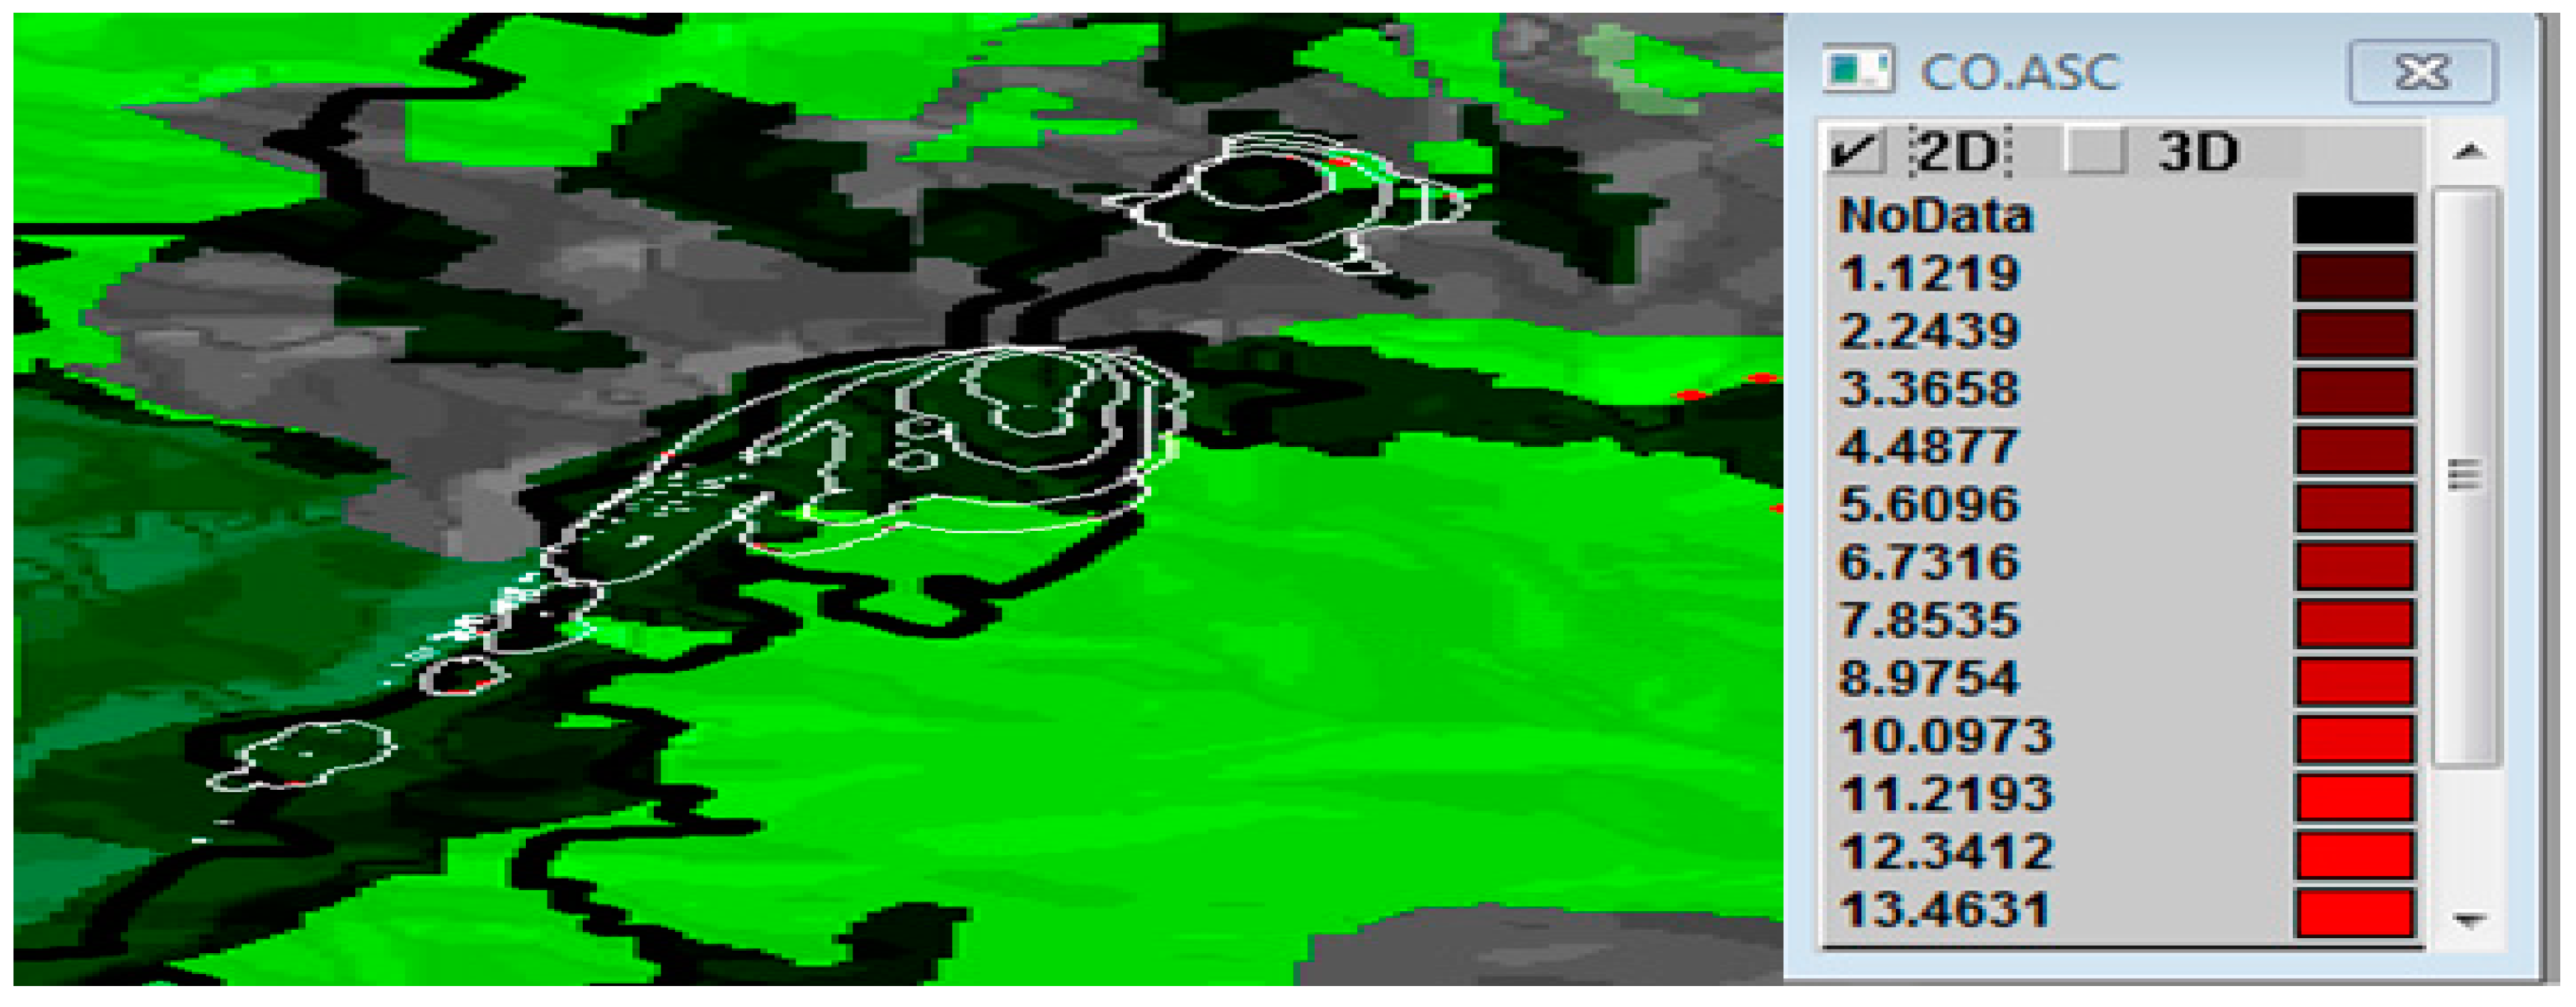
Case Study 1: The maximum temperature increased by 1 °C, the relevant humidity of the air decreased by 5%, and the moisture of the dead fuel decreased by 1%, whereas the wind speed remained steady. FARSITE 4 simulated the new fire in Rafina, and the CO release rate along the fire front was close to 13.4631 Mg/ha/min (
Figure 7). By analogy, the PM
2.5 release rate along the fire front was close to 1.1337 Mg/ha/min. The PM
10 release rate along the fire front was close to 1.3378 Mg/ha/min. The CO
2 release rate along the fire front was close to 0.6429 Mg/ha/min. Similarly, the CH
4 release rate along the fire front was close to 156.9365 Mg/ha/min. Please refer to the
Supplementary Materials for Figures S17–S20, which offer additional visual representations complementing the findings discussed in this study.
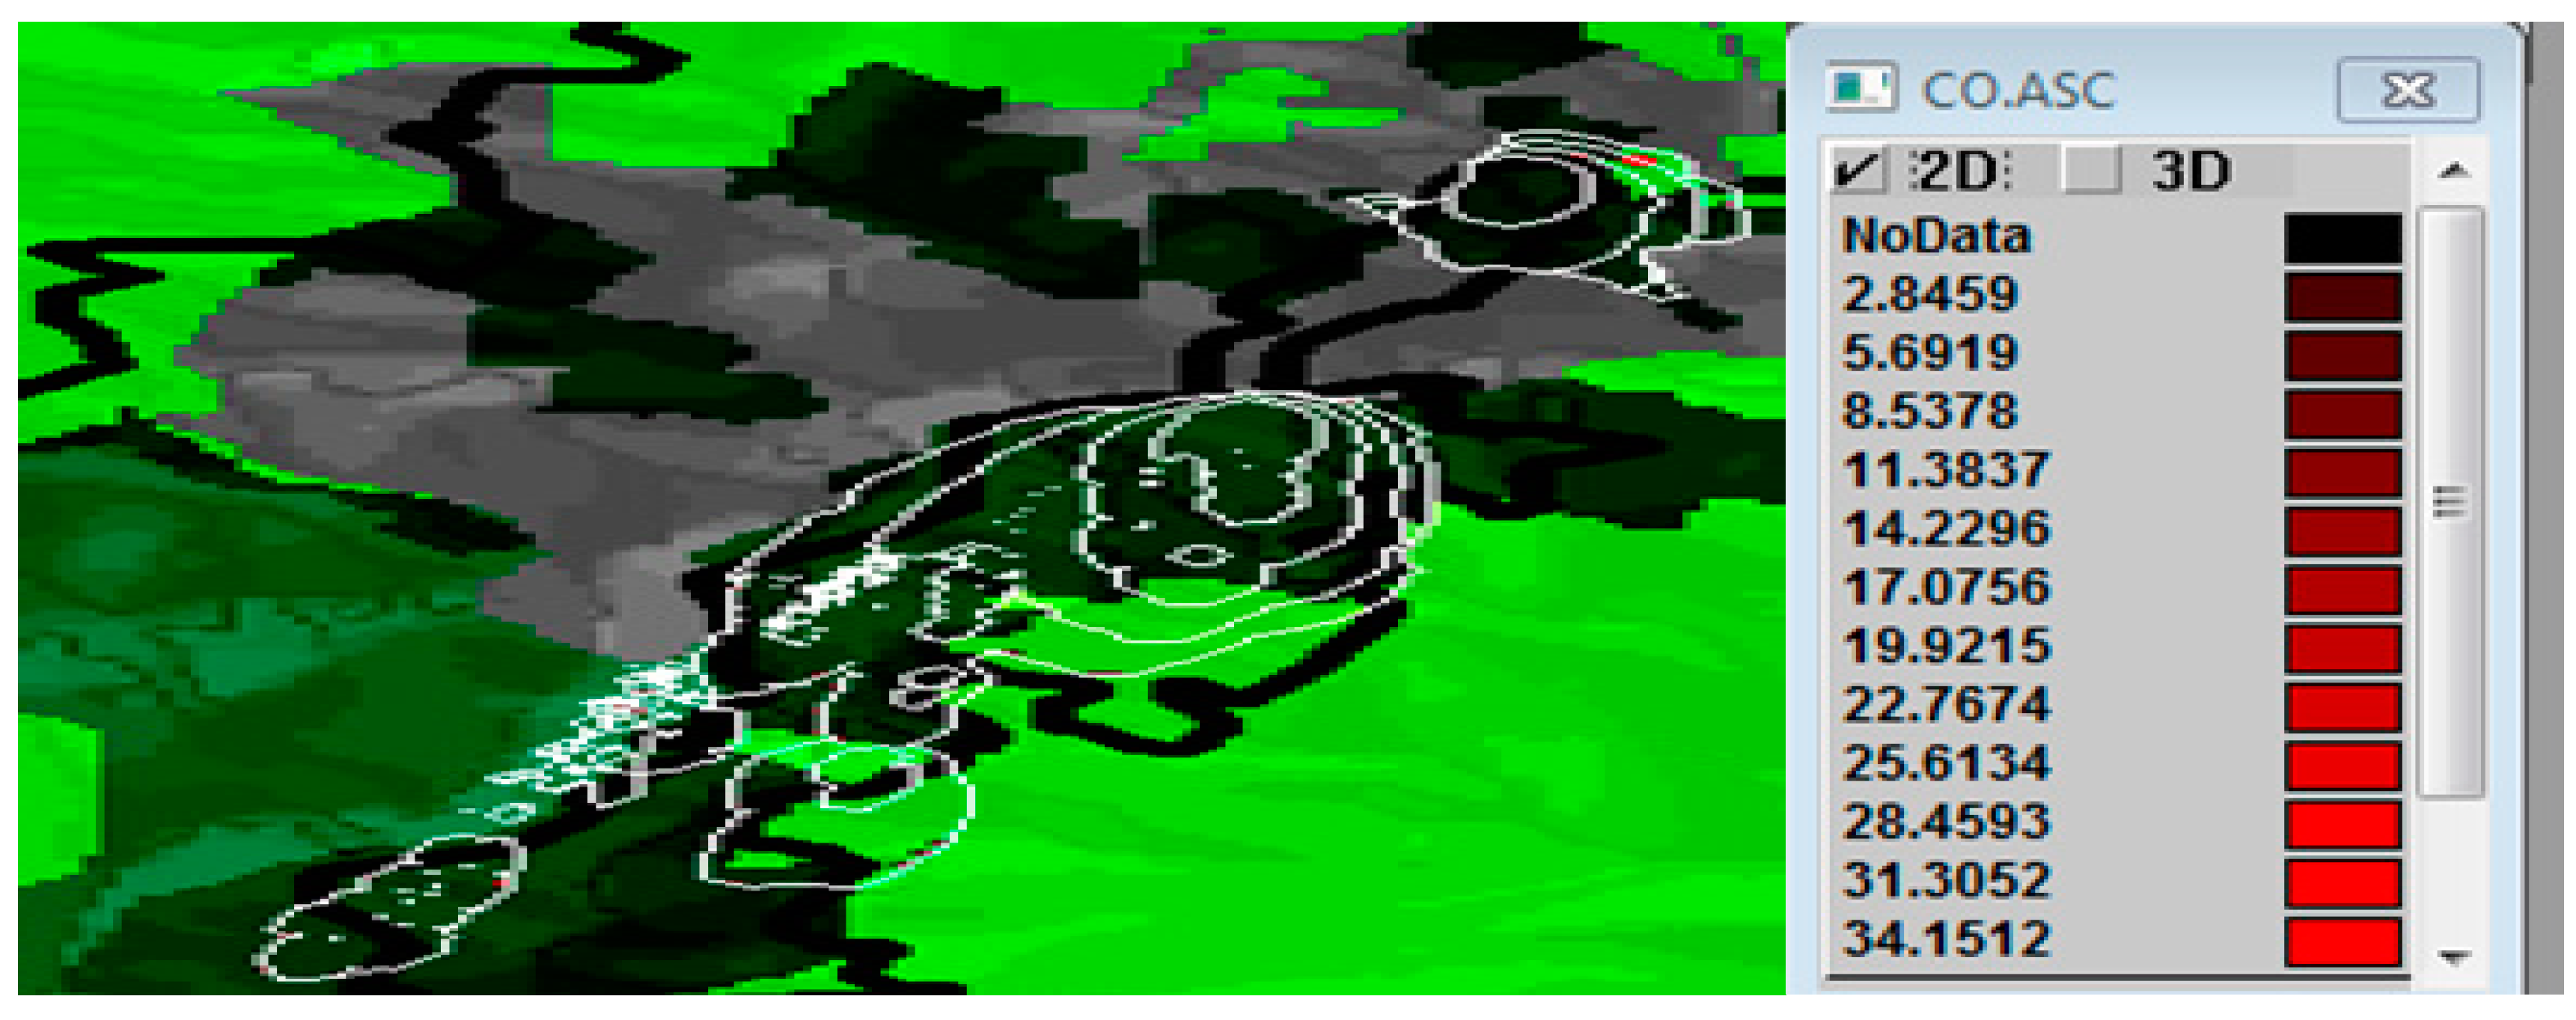
Case Study 2: The maximum temperature increased by 2 °C, the relevant humidity of the air decreased by 8%, and the moisture of the dead fuel decreased by 2%, whereas the wind speed remained steady. FARSITE 4 simulated the new fire in Rafina, revealing a CO release rate along the fire front of approximately 34.1512 Mg/ha/min (
Figure 8). Additionally, the PM
2.5 release rate along the fire front was estimated to be close to 3.0219 Mg/ha/min, while the PM
10 release rate approached 3.5659 Mg/ha/min. Moreover, the release rate of CO
2 along the fire front was calculated to be close to 1.6652 Mg/ha/min. Similarly, the release rate of CH
4 along the fire front was determined to be approximately 519.0742 Mg/ha/min. Please refer to the
Supplementary Materials for Figures S21–S24, which provide additional visual representations that support and complement the findings discussed in this study.
Figure 9 illustrates the emission rates from two case studies and the normal scenario of the Rafina wildfire. As in the case of Neo Voutza, as temperatures increased by one or two degrees Celsius, there was a significant rise in the emission rates of gases from the wildfires. More specifically, the emission rates of PM
2.5, PM
10, CO, CO
2, and CH
4 are increasing due to climate trends.
While numerous studies have investigated the impact of wildfires on climate change, particularly in regions prone to extensive forest fires, there is a notable gap in research concerning the specific linkage between emission rates from wildfires and climate change. Despite the increasing frequency and severity of wildfires in various parts of Europe, including the Mediterranean region, comprehensive studies focusing on the direct relationship between wildfire rate emissions and climate change effects remain limited.
Understanding this relationship is crucial for assessing the broader implications of wildfires on regional and global climate dynamics. Wildfires emit significant quantities of greenhouse gases and aerosols into the atmosphere, which can influence atmospheric chemistry, alter biogeochemical cycles, and contribute to climate variability. Nevertheless, the direct effect of these emission rates on the dynamics of climate change in Europe, including the connected feedback mechanisms and regional climate patterns, is not thoroughly understood and warrants further investigation.
Due to increased interest in the dynamics of the increasing frequency and intensity of wildfires in Europe, coupled with projections concerning more intense and frequent extreme weather events due to climate change, relevant research is crucial. Inclusive, systematic studies that determine the exact emission rates of wildfires and their consequences for climate change adaptation and mitigation efforts across Europe remain pivotal for policy making, preparedness planning, and minimizing the adverse effects of wildfires on ecosystems and public health.
