

Structural Performance of Outdoor Mechanical Garages under Combustion Conditions

Abstract
1. Introduction
2. Small-Scale Fire Design of Experiments
2.1. Small-Scale Fire Design of Experiments
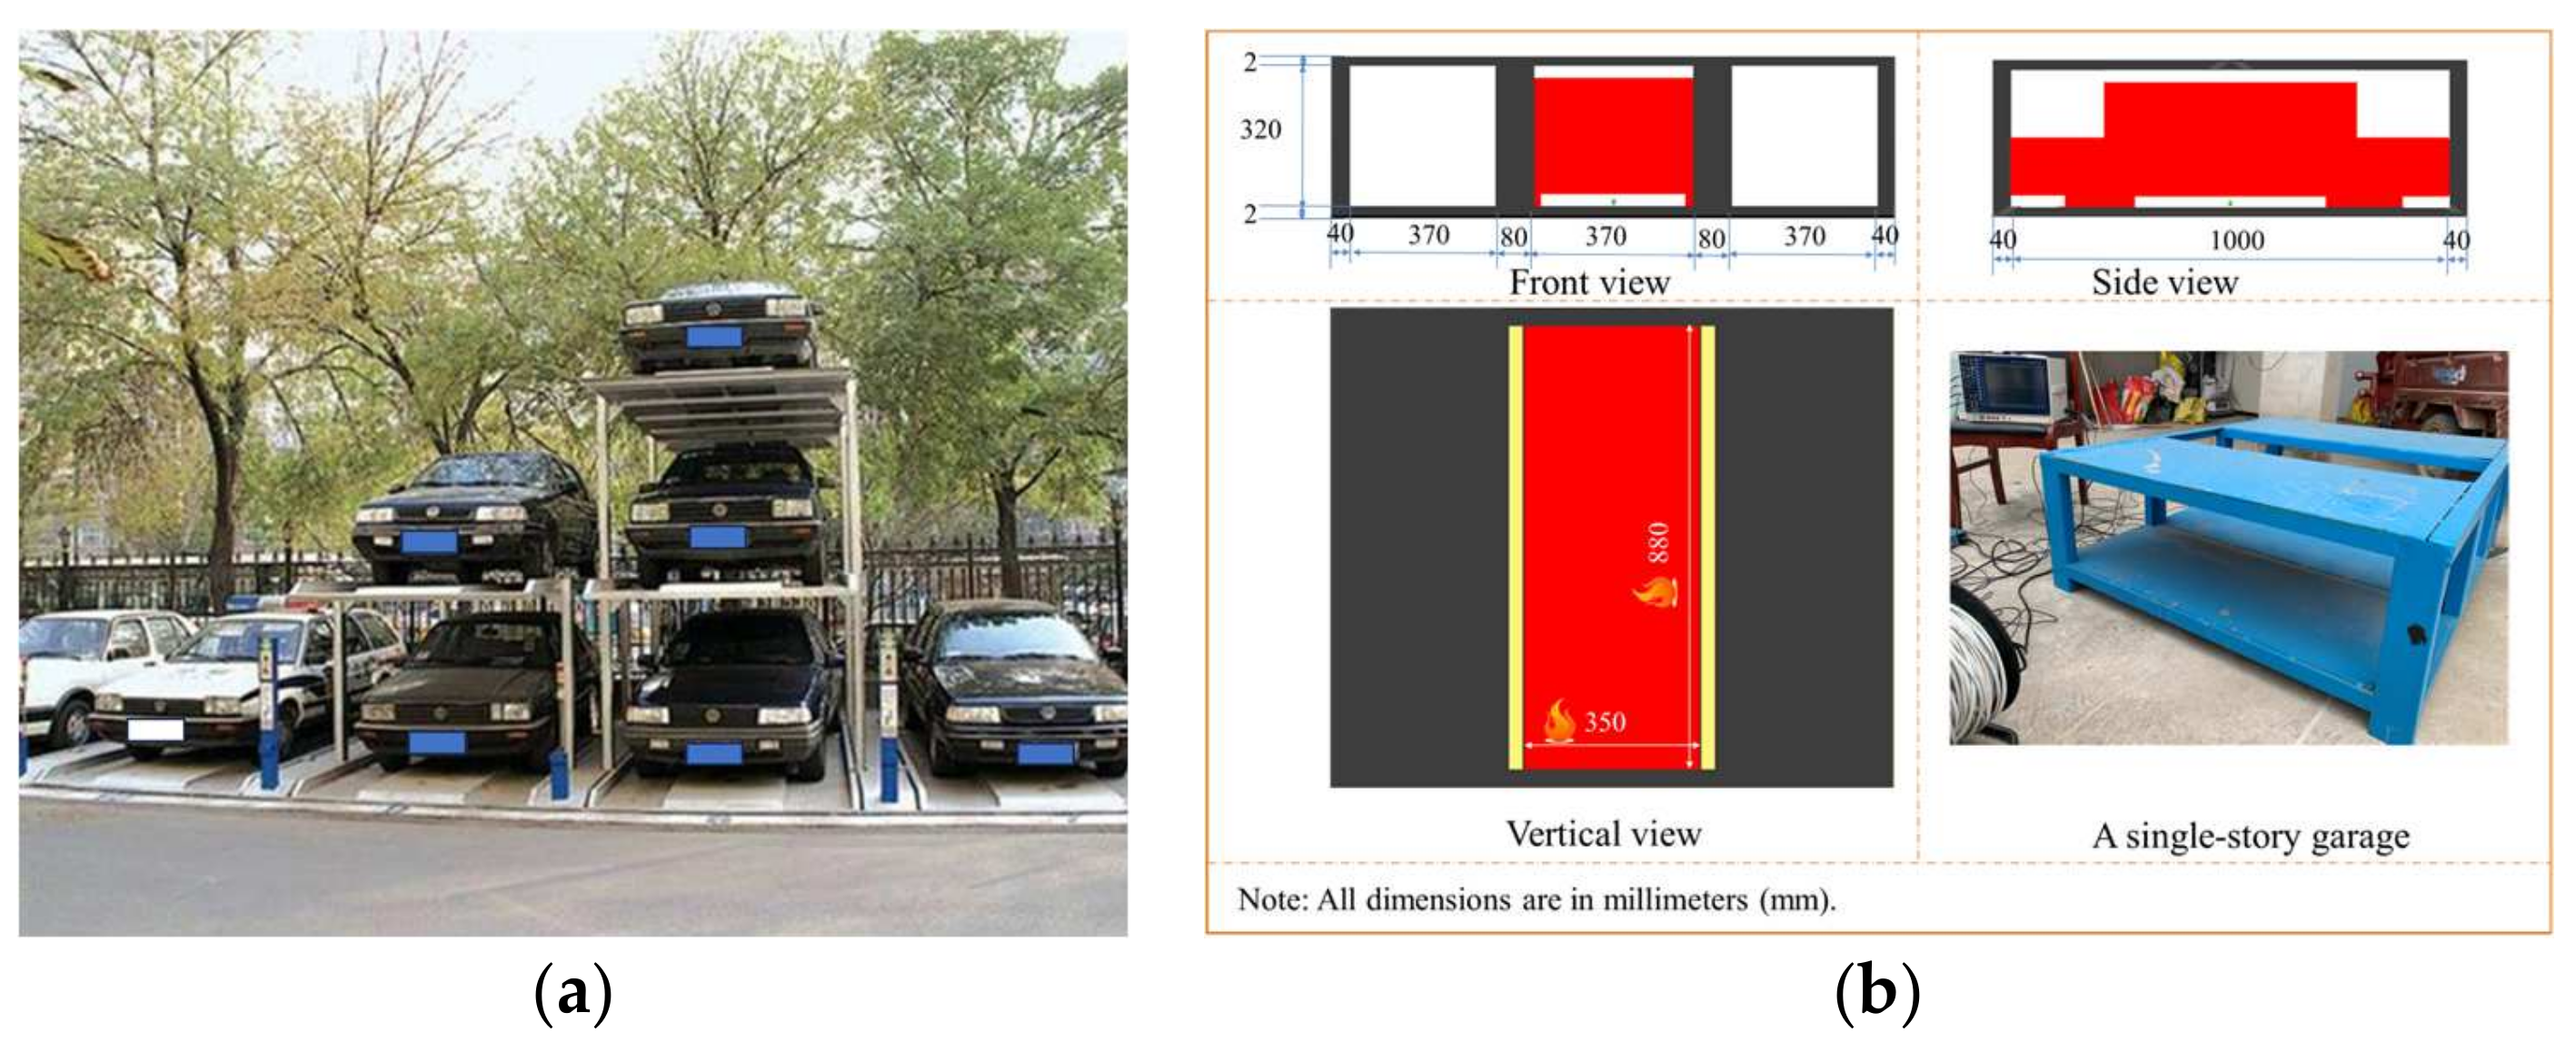
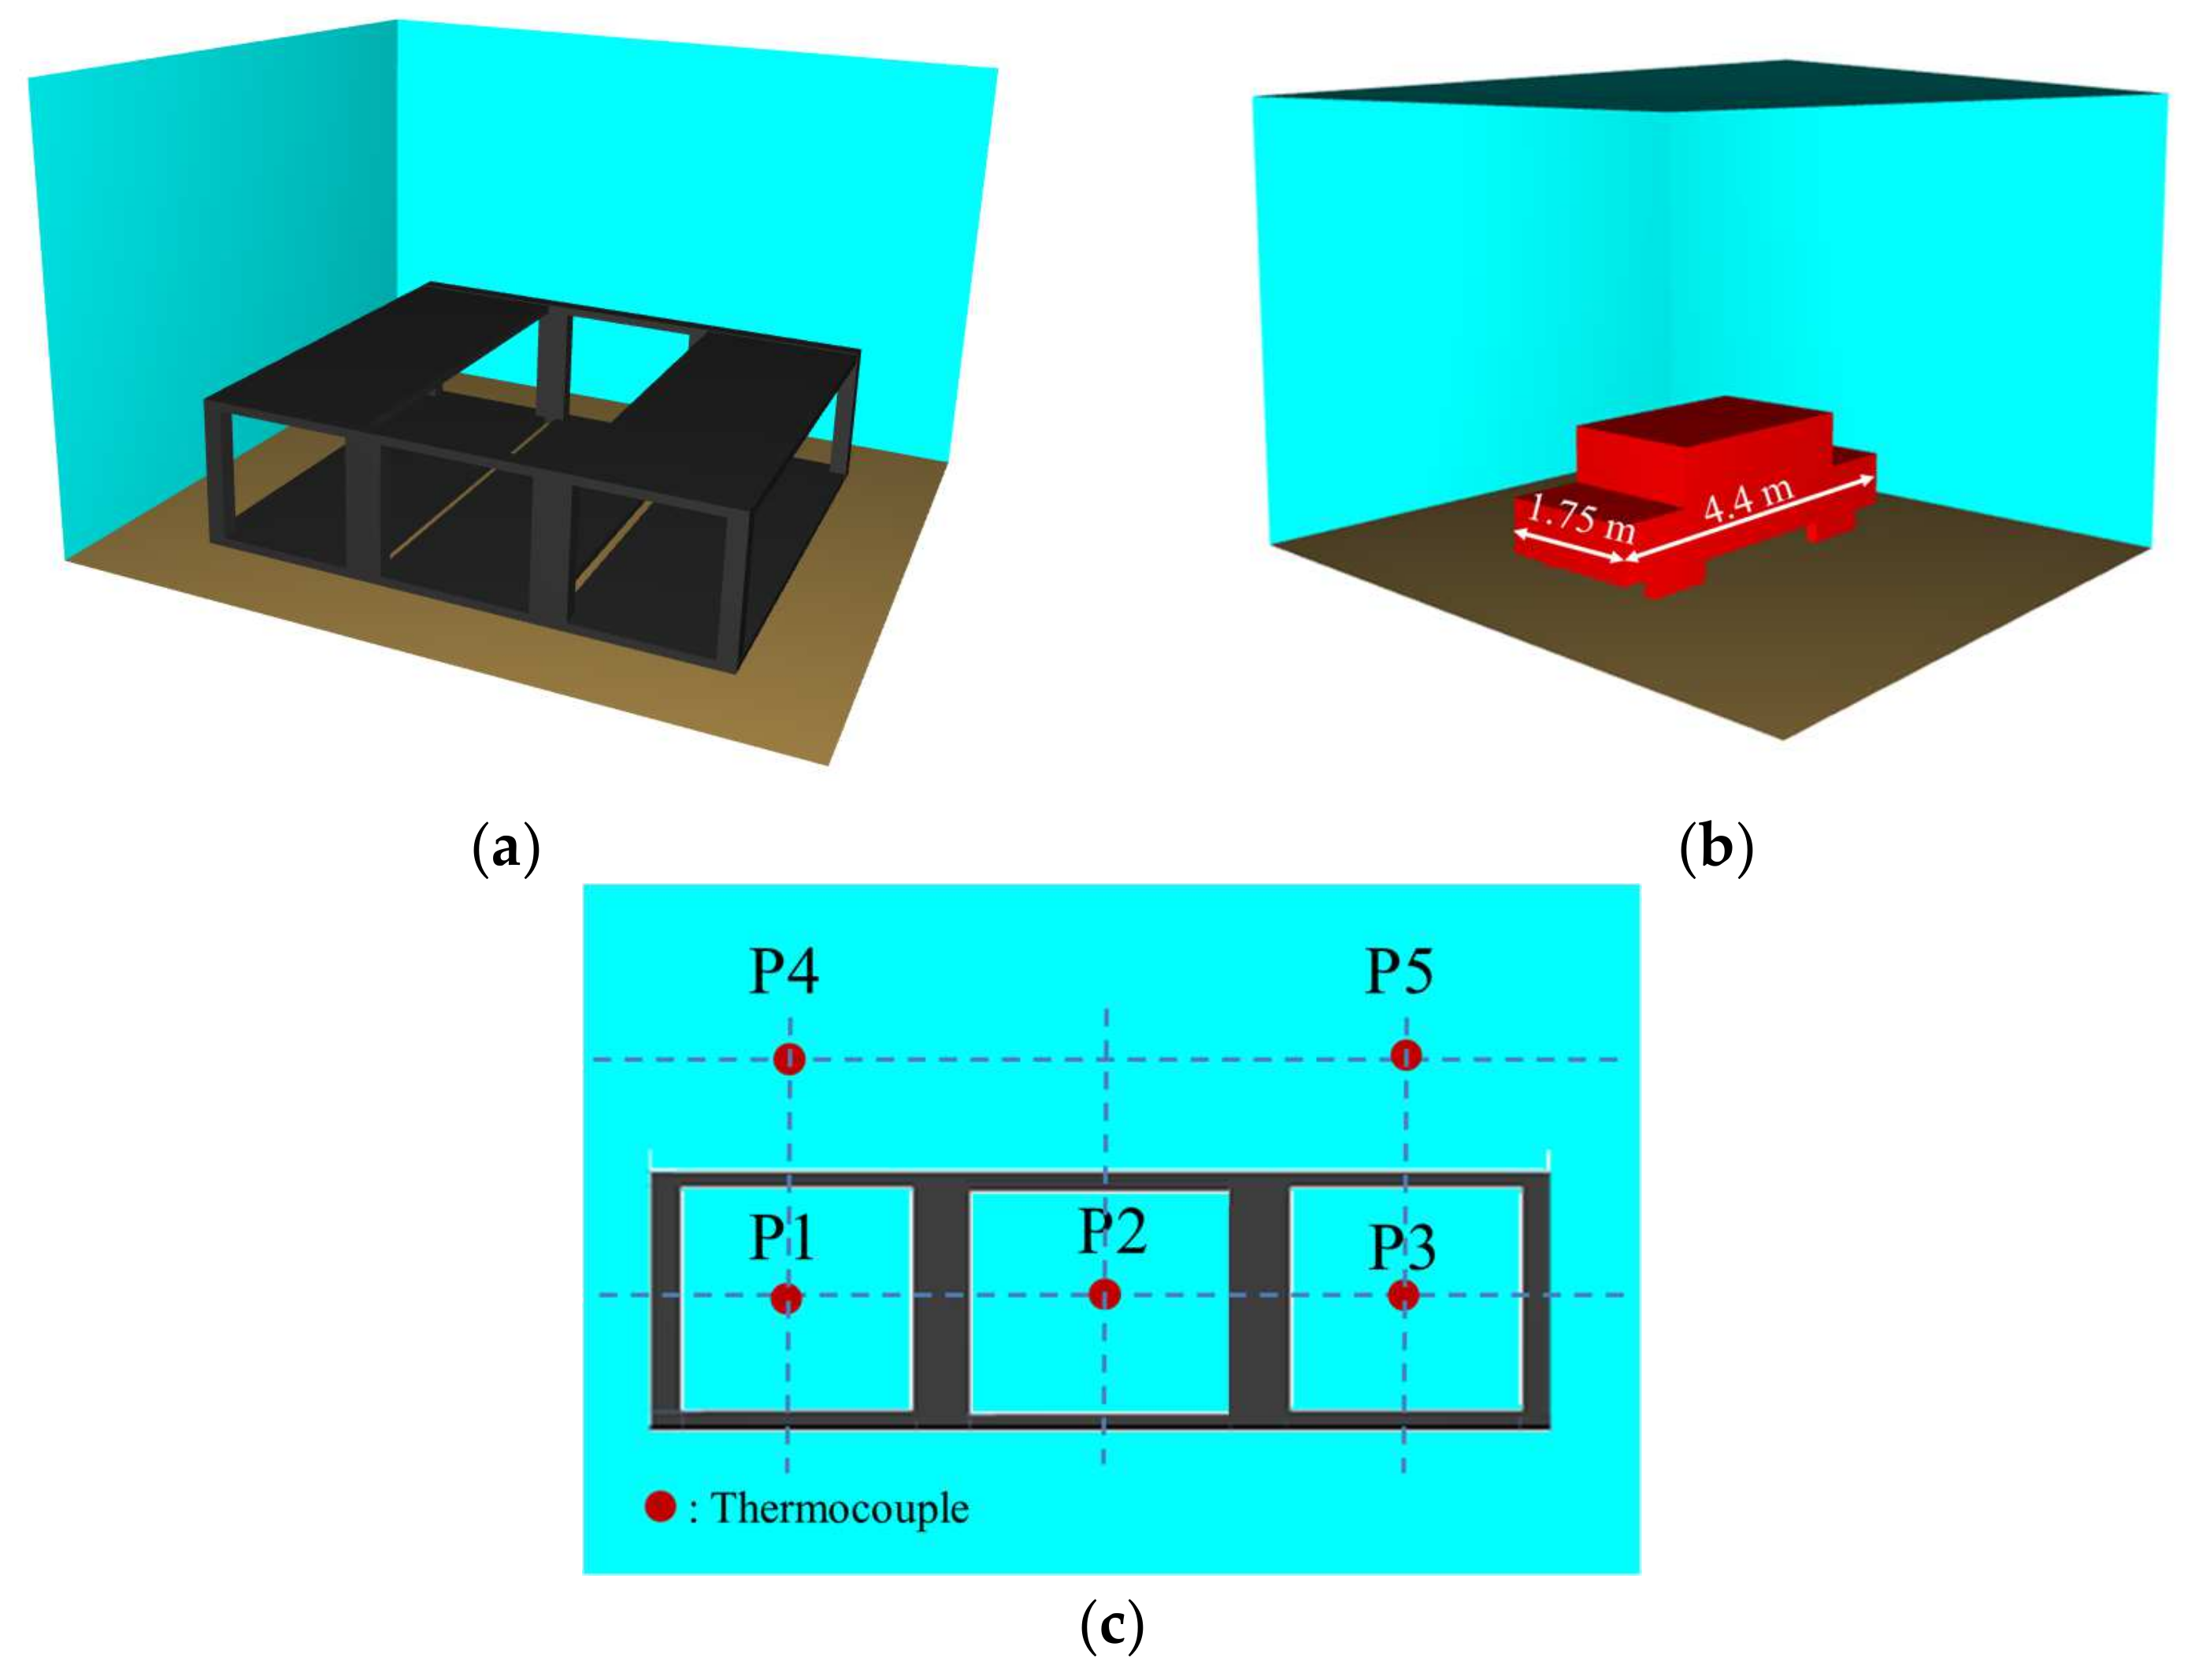
2.1.1. Experimental Model Design
2.1.2. Case Condition Design
2.2. Analysis of Experiment Results
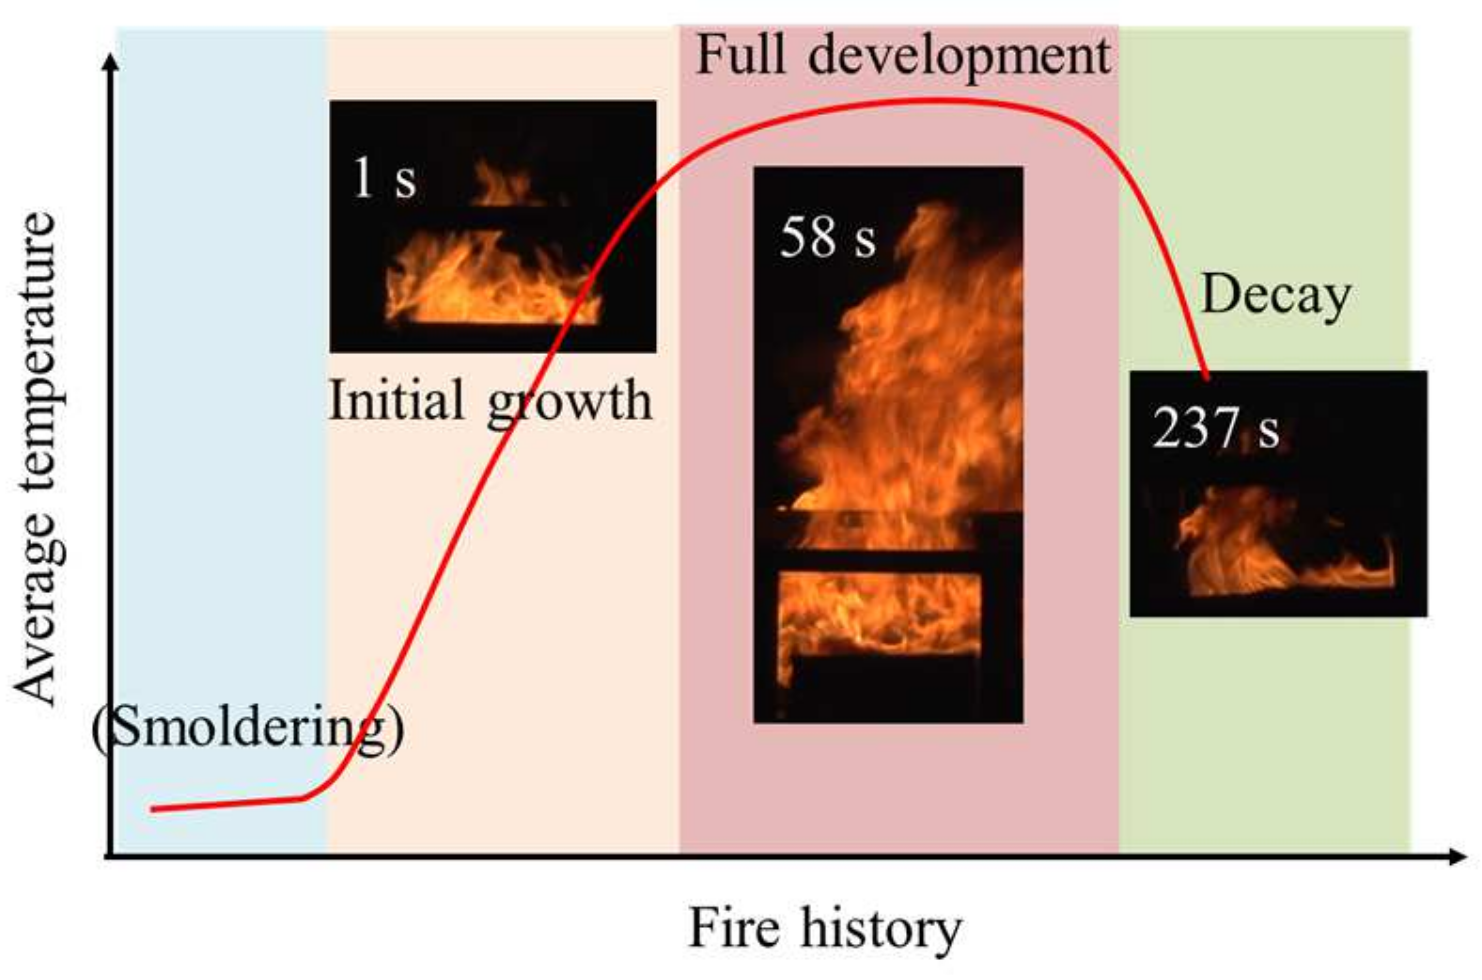
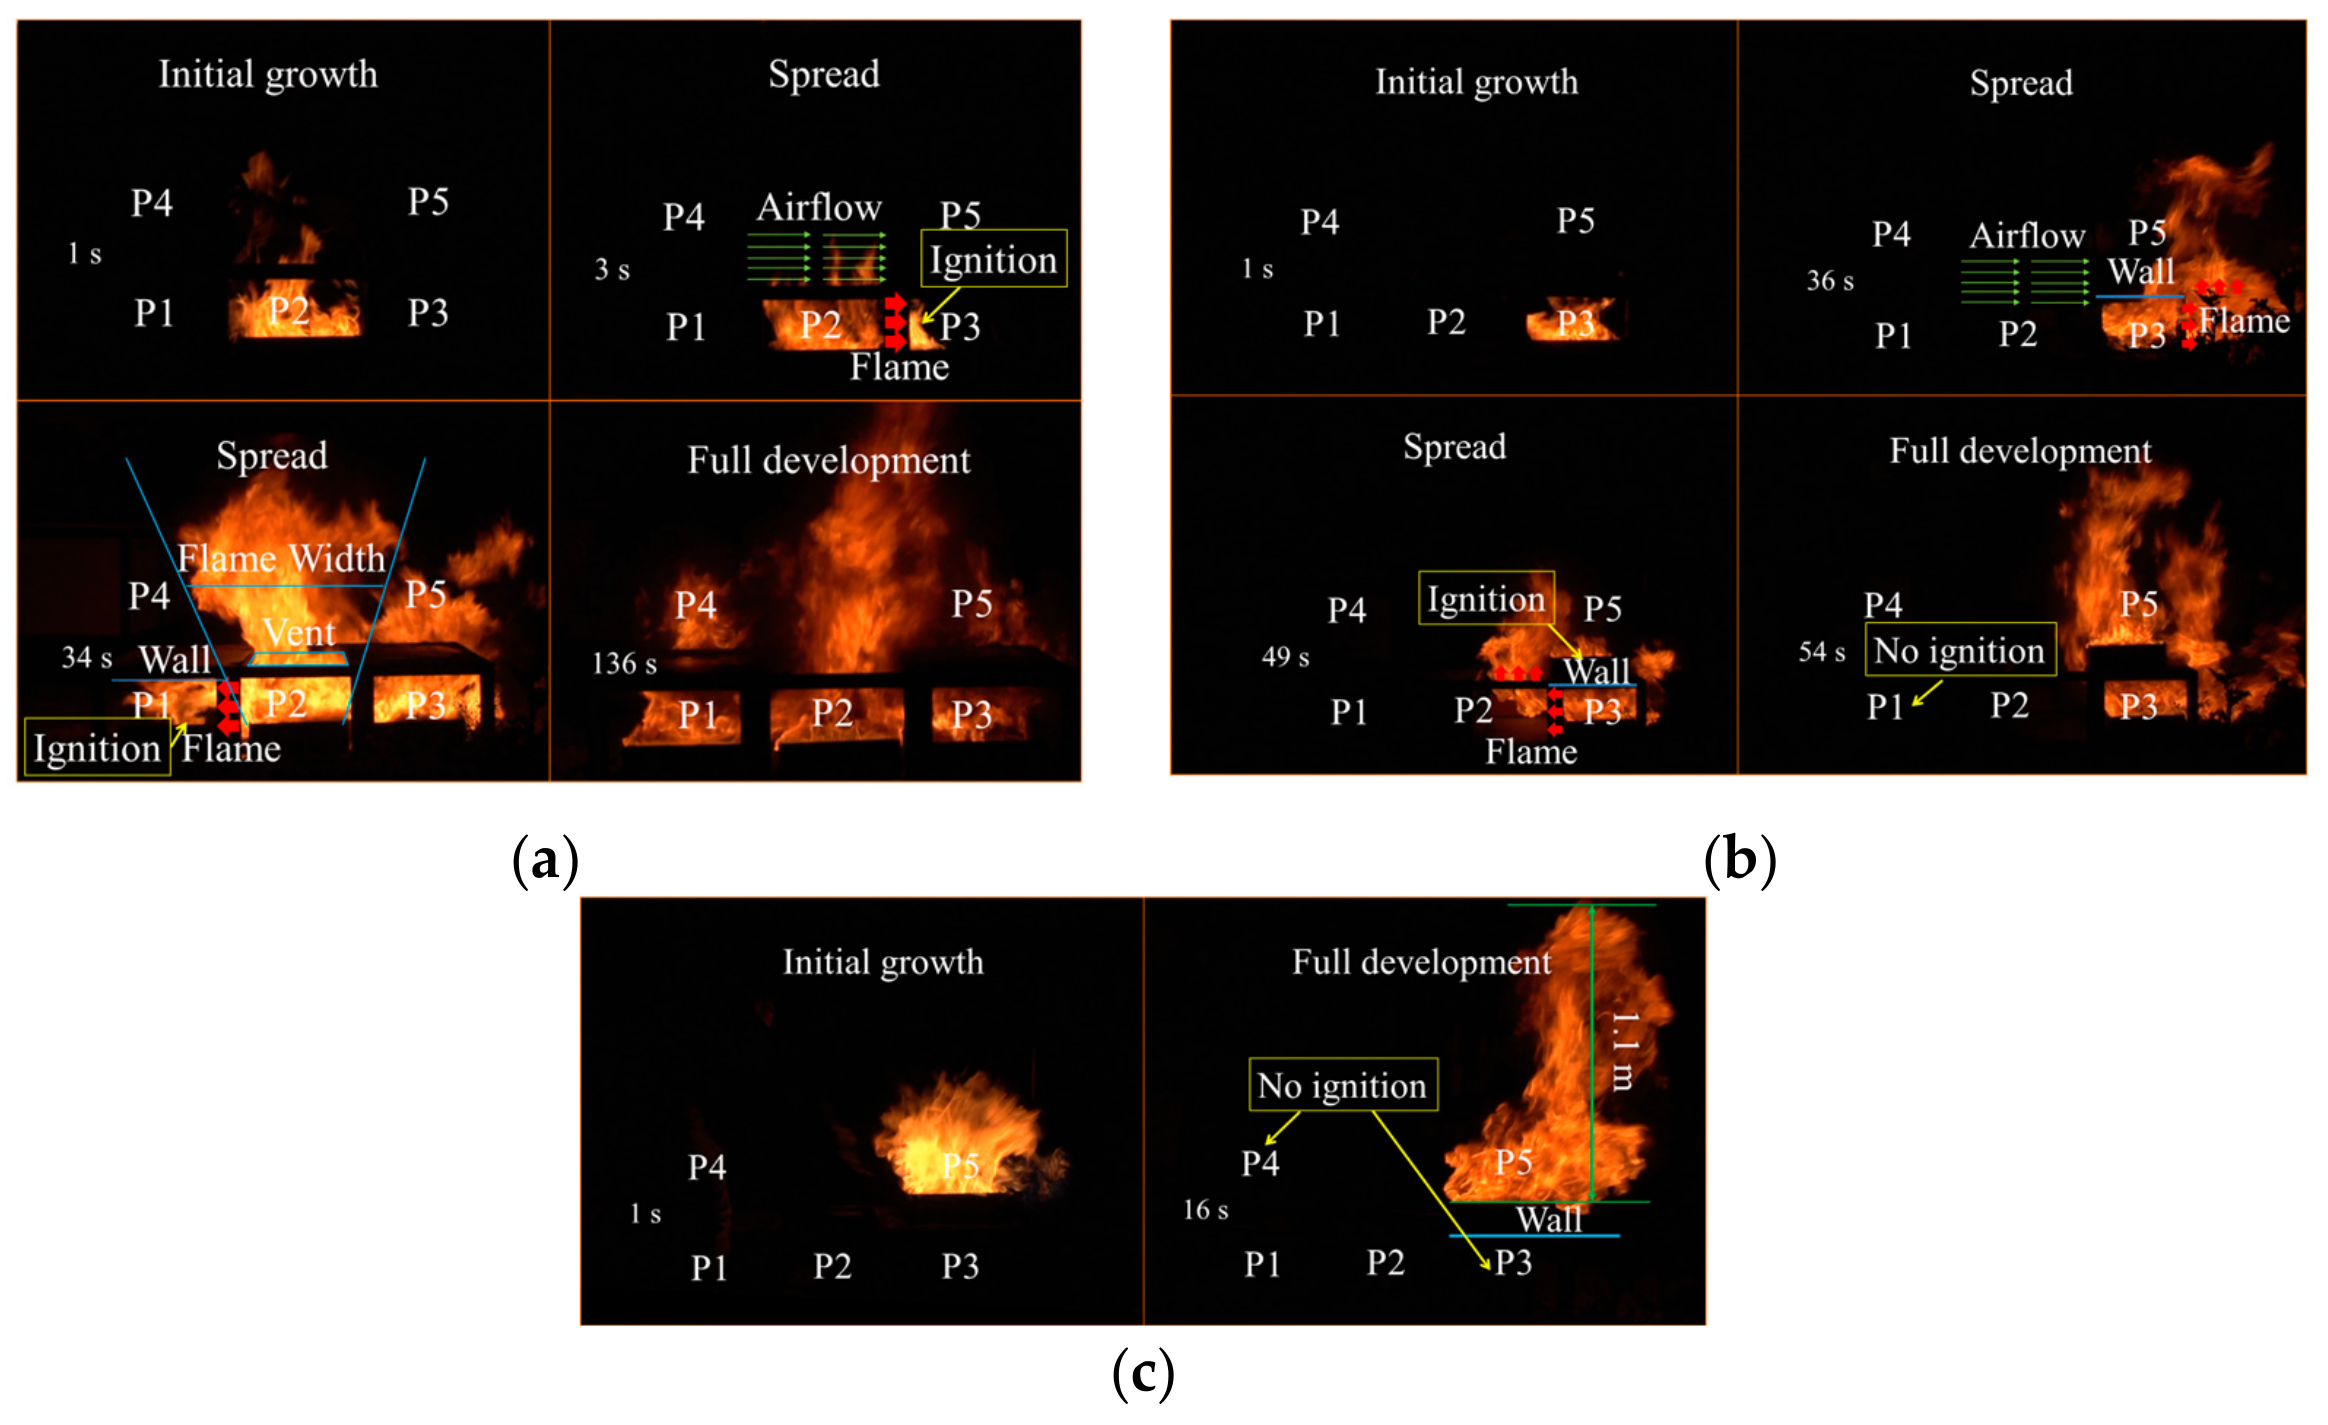
2.2.1. Experimental Flame Behavior
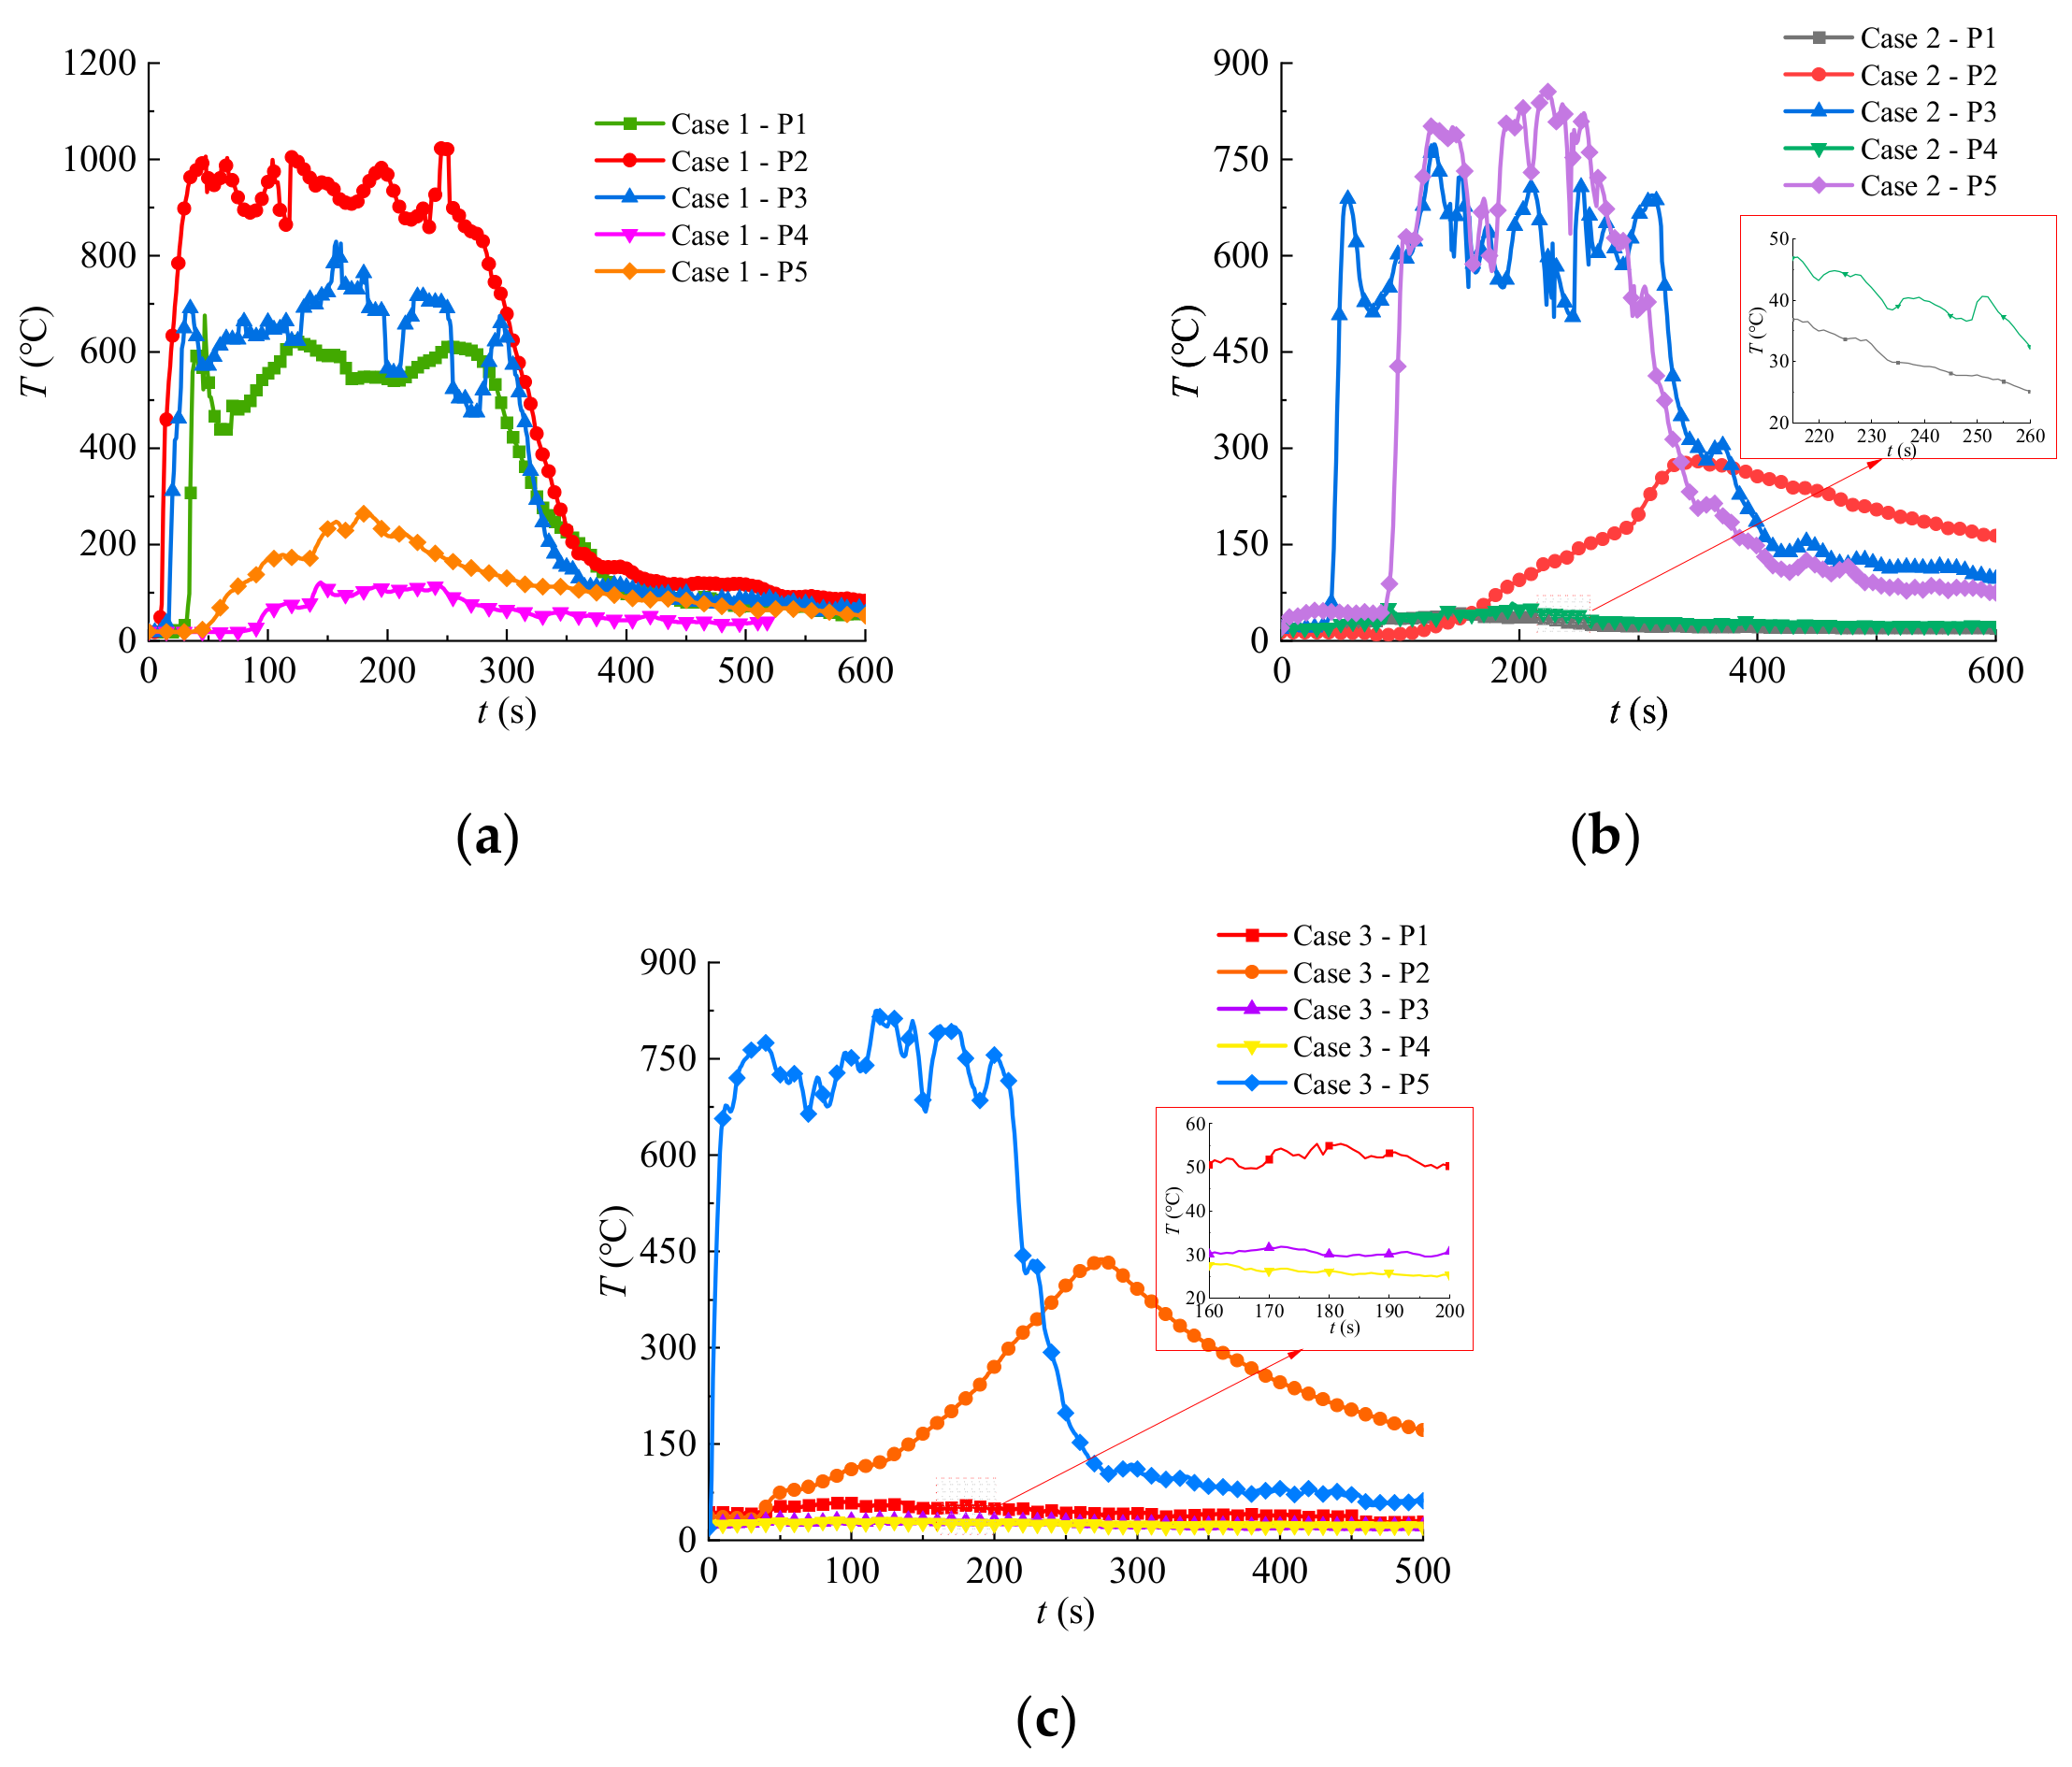
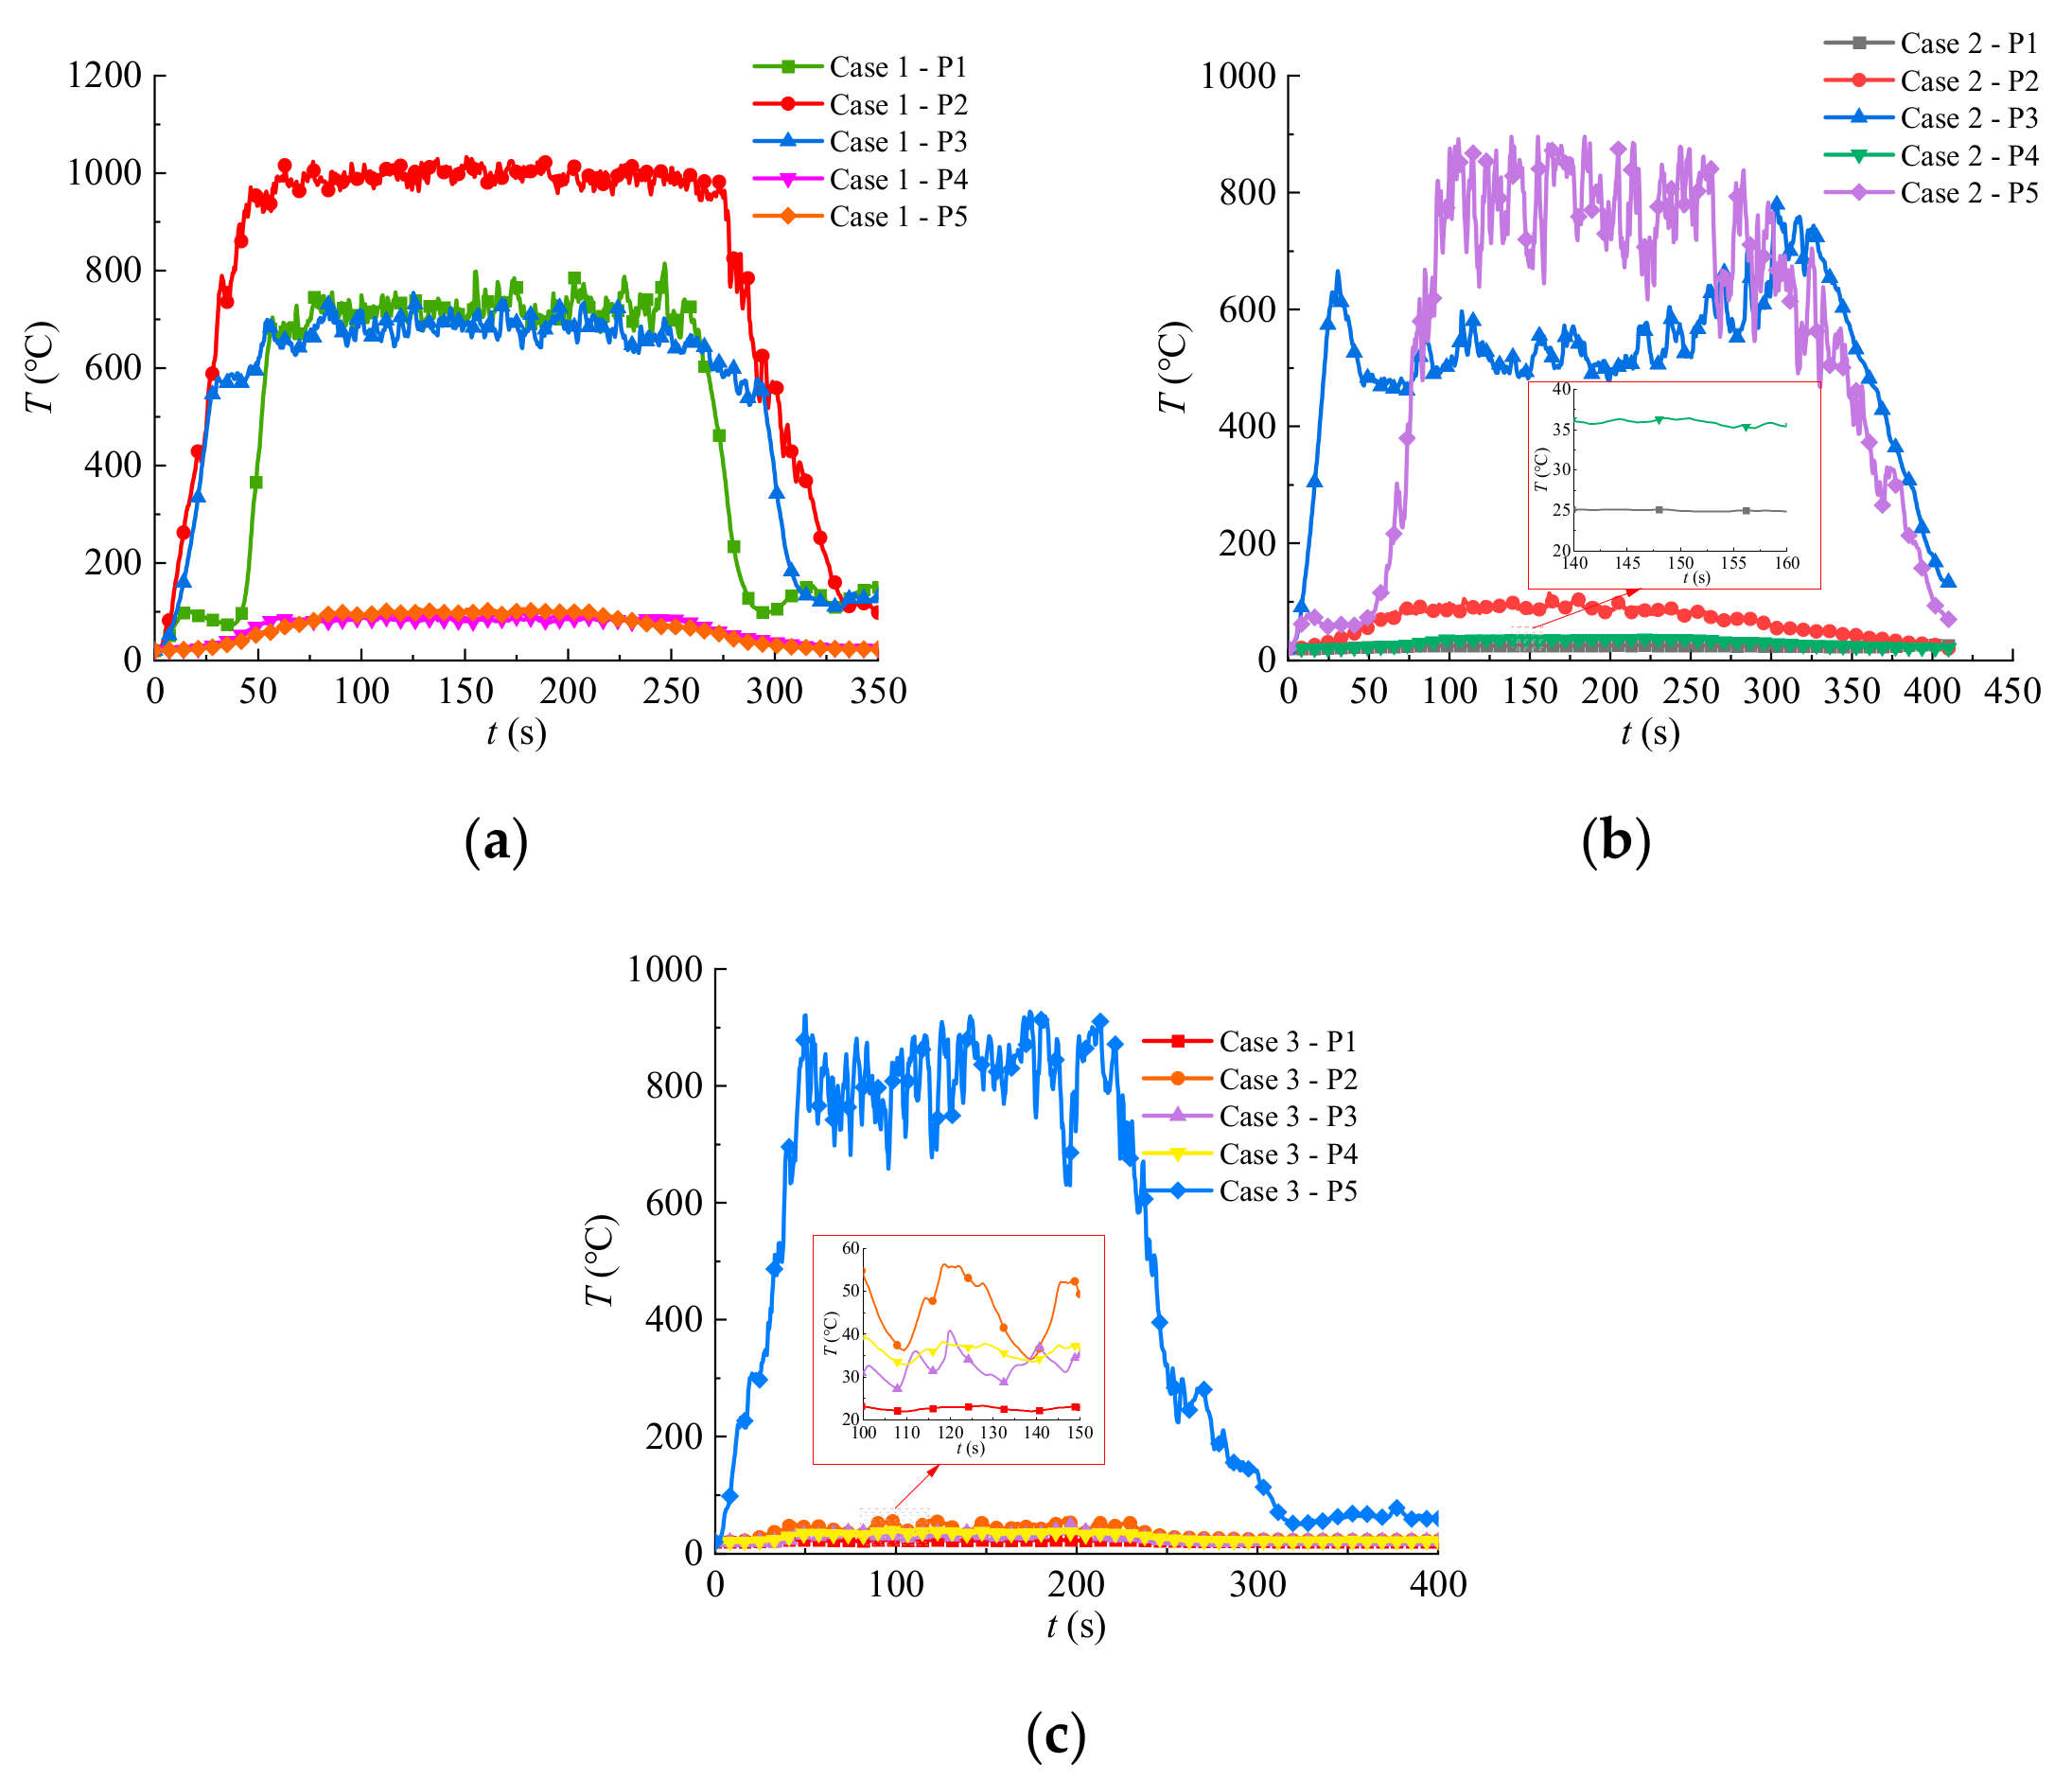
2.2.2. Temperature Distribution
3. Fire Simulation in FDS
3.1. FDS Modeling
3.2. Results Analysis of FDS
3.2.1. Flame Behavior in FDS
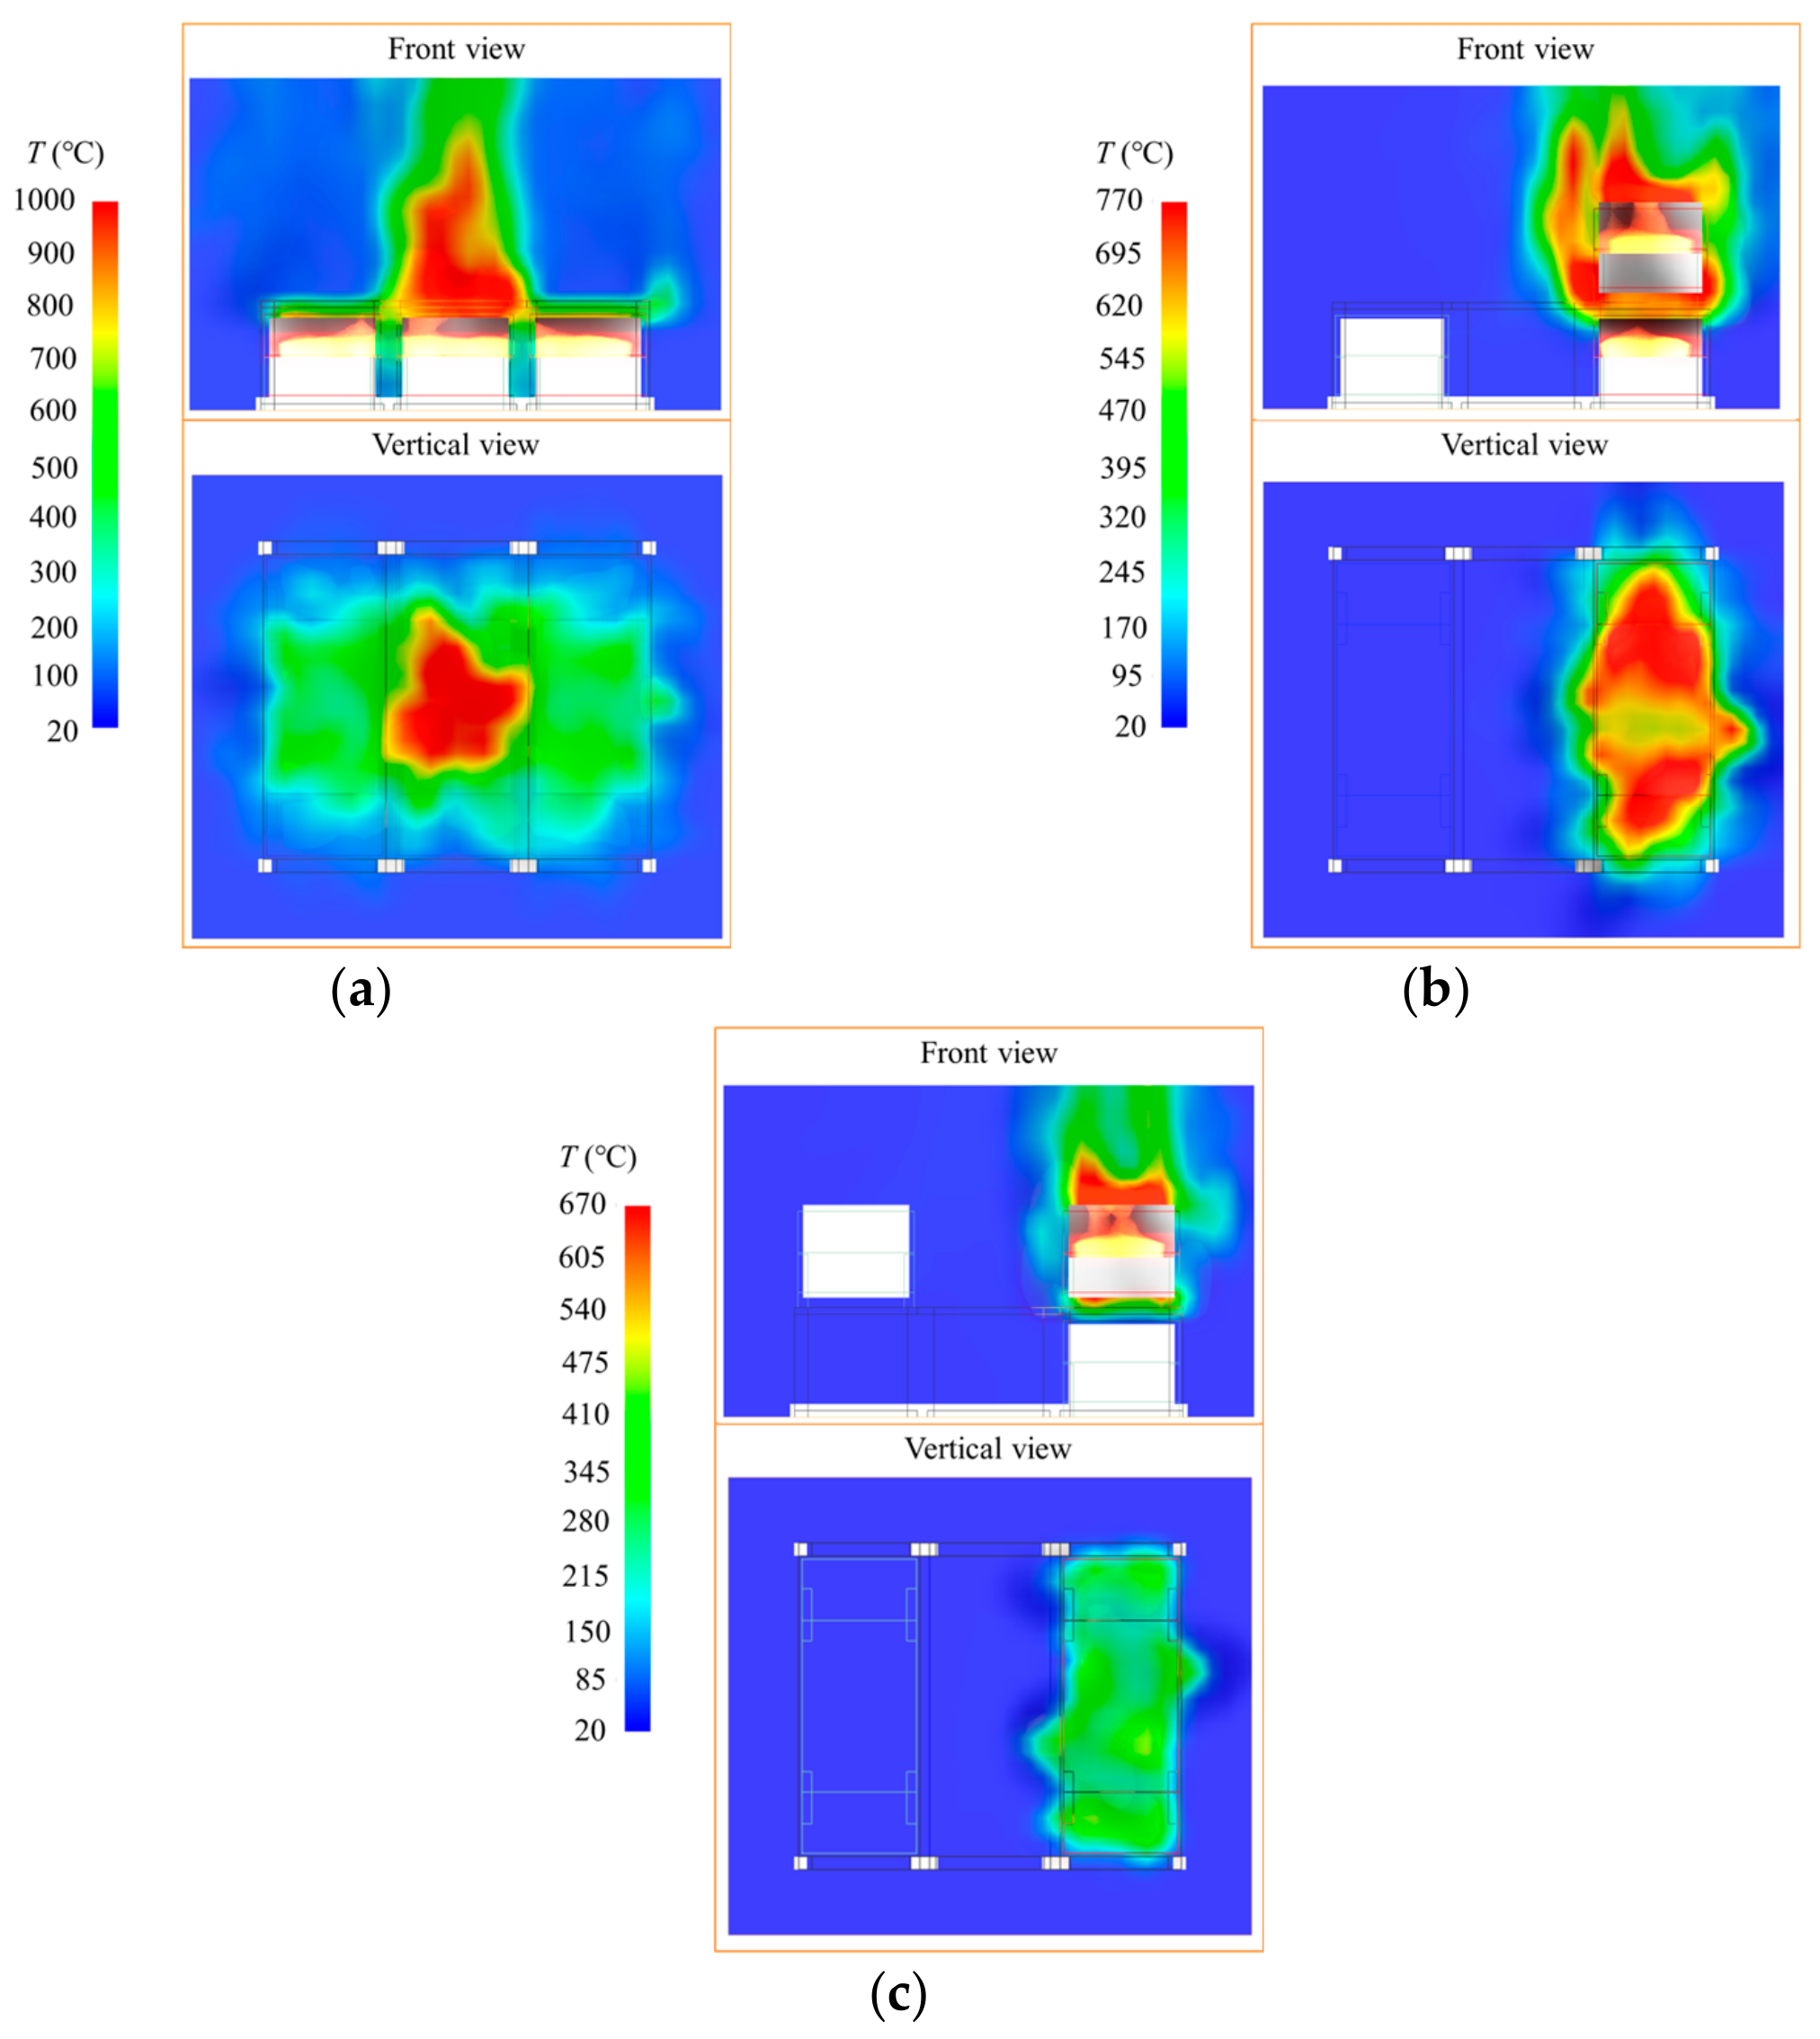
3.2.2. Temperature Results of FDS
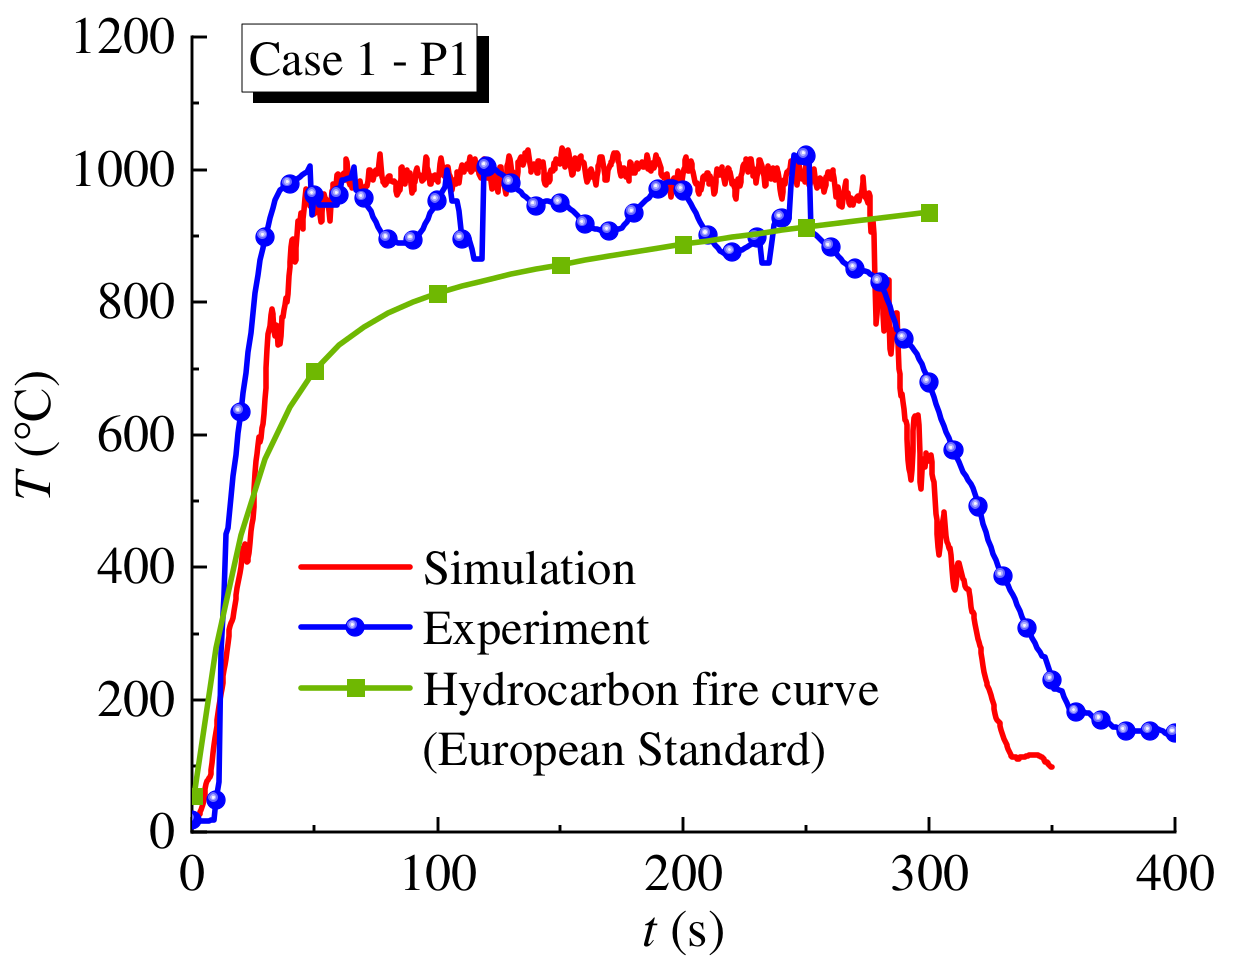
3.2.3. Comparative Analysis of Simulation and Experiment
4. Finite Element Simulation
4.1. Finite Element Modeling
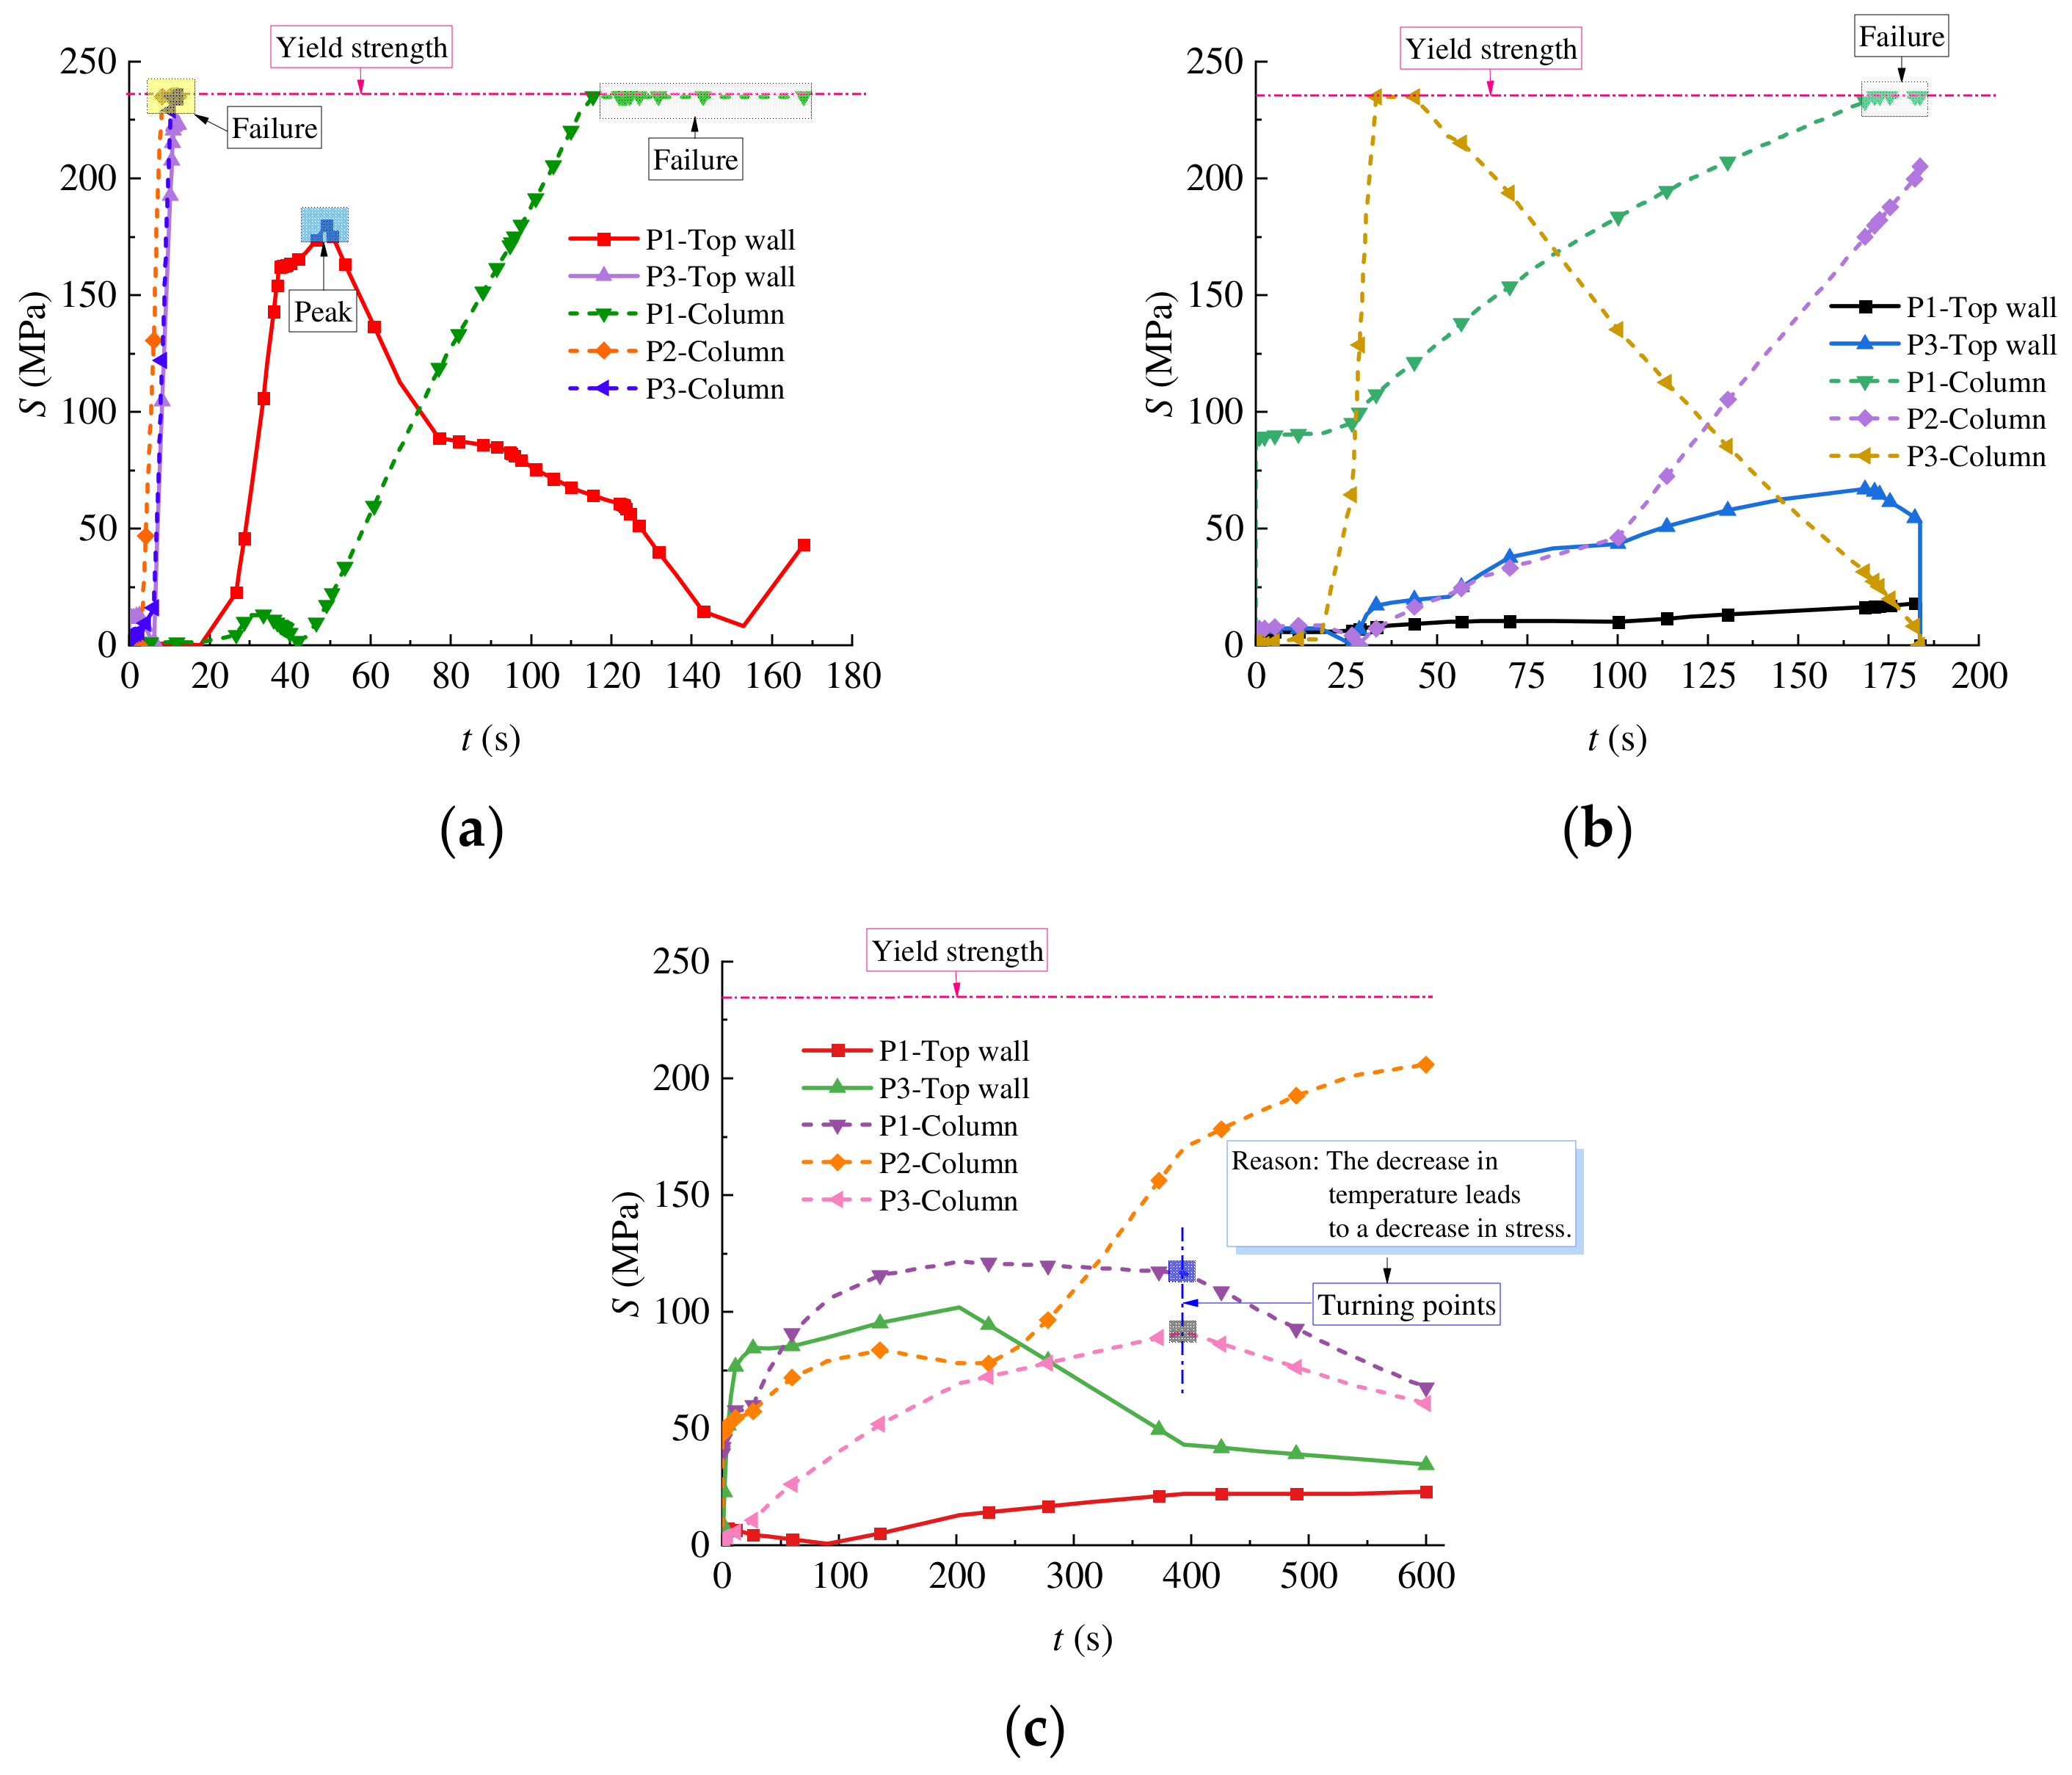
4.2. Stress Analysis
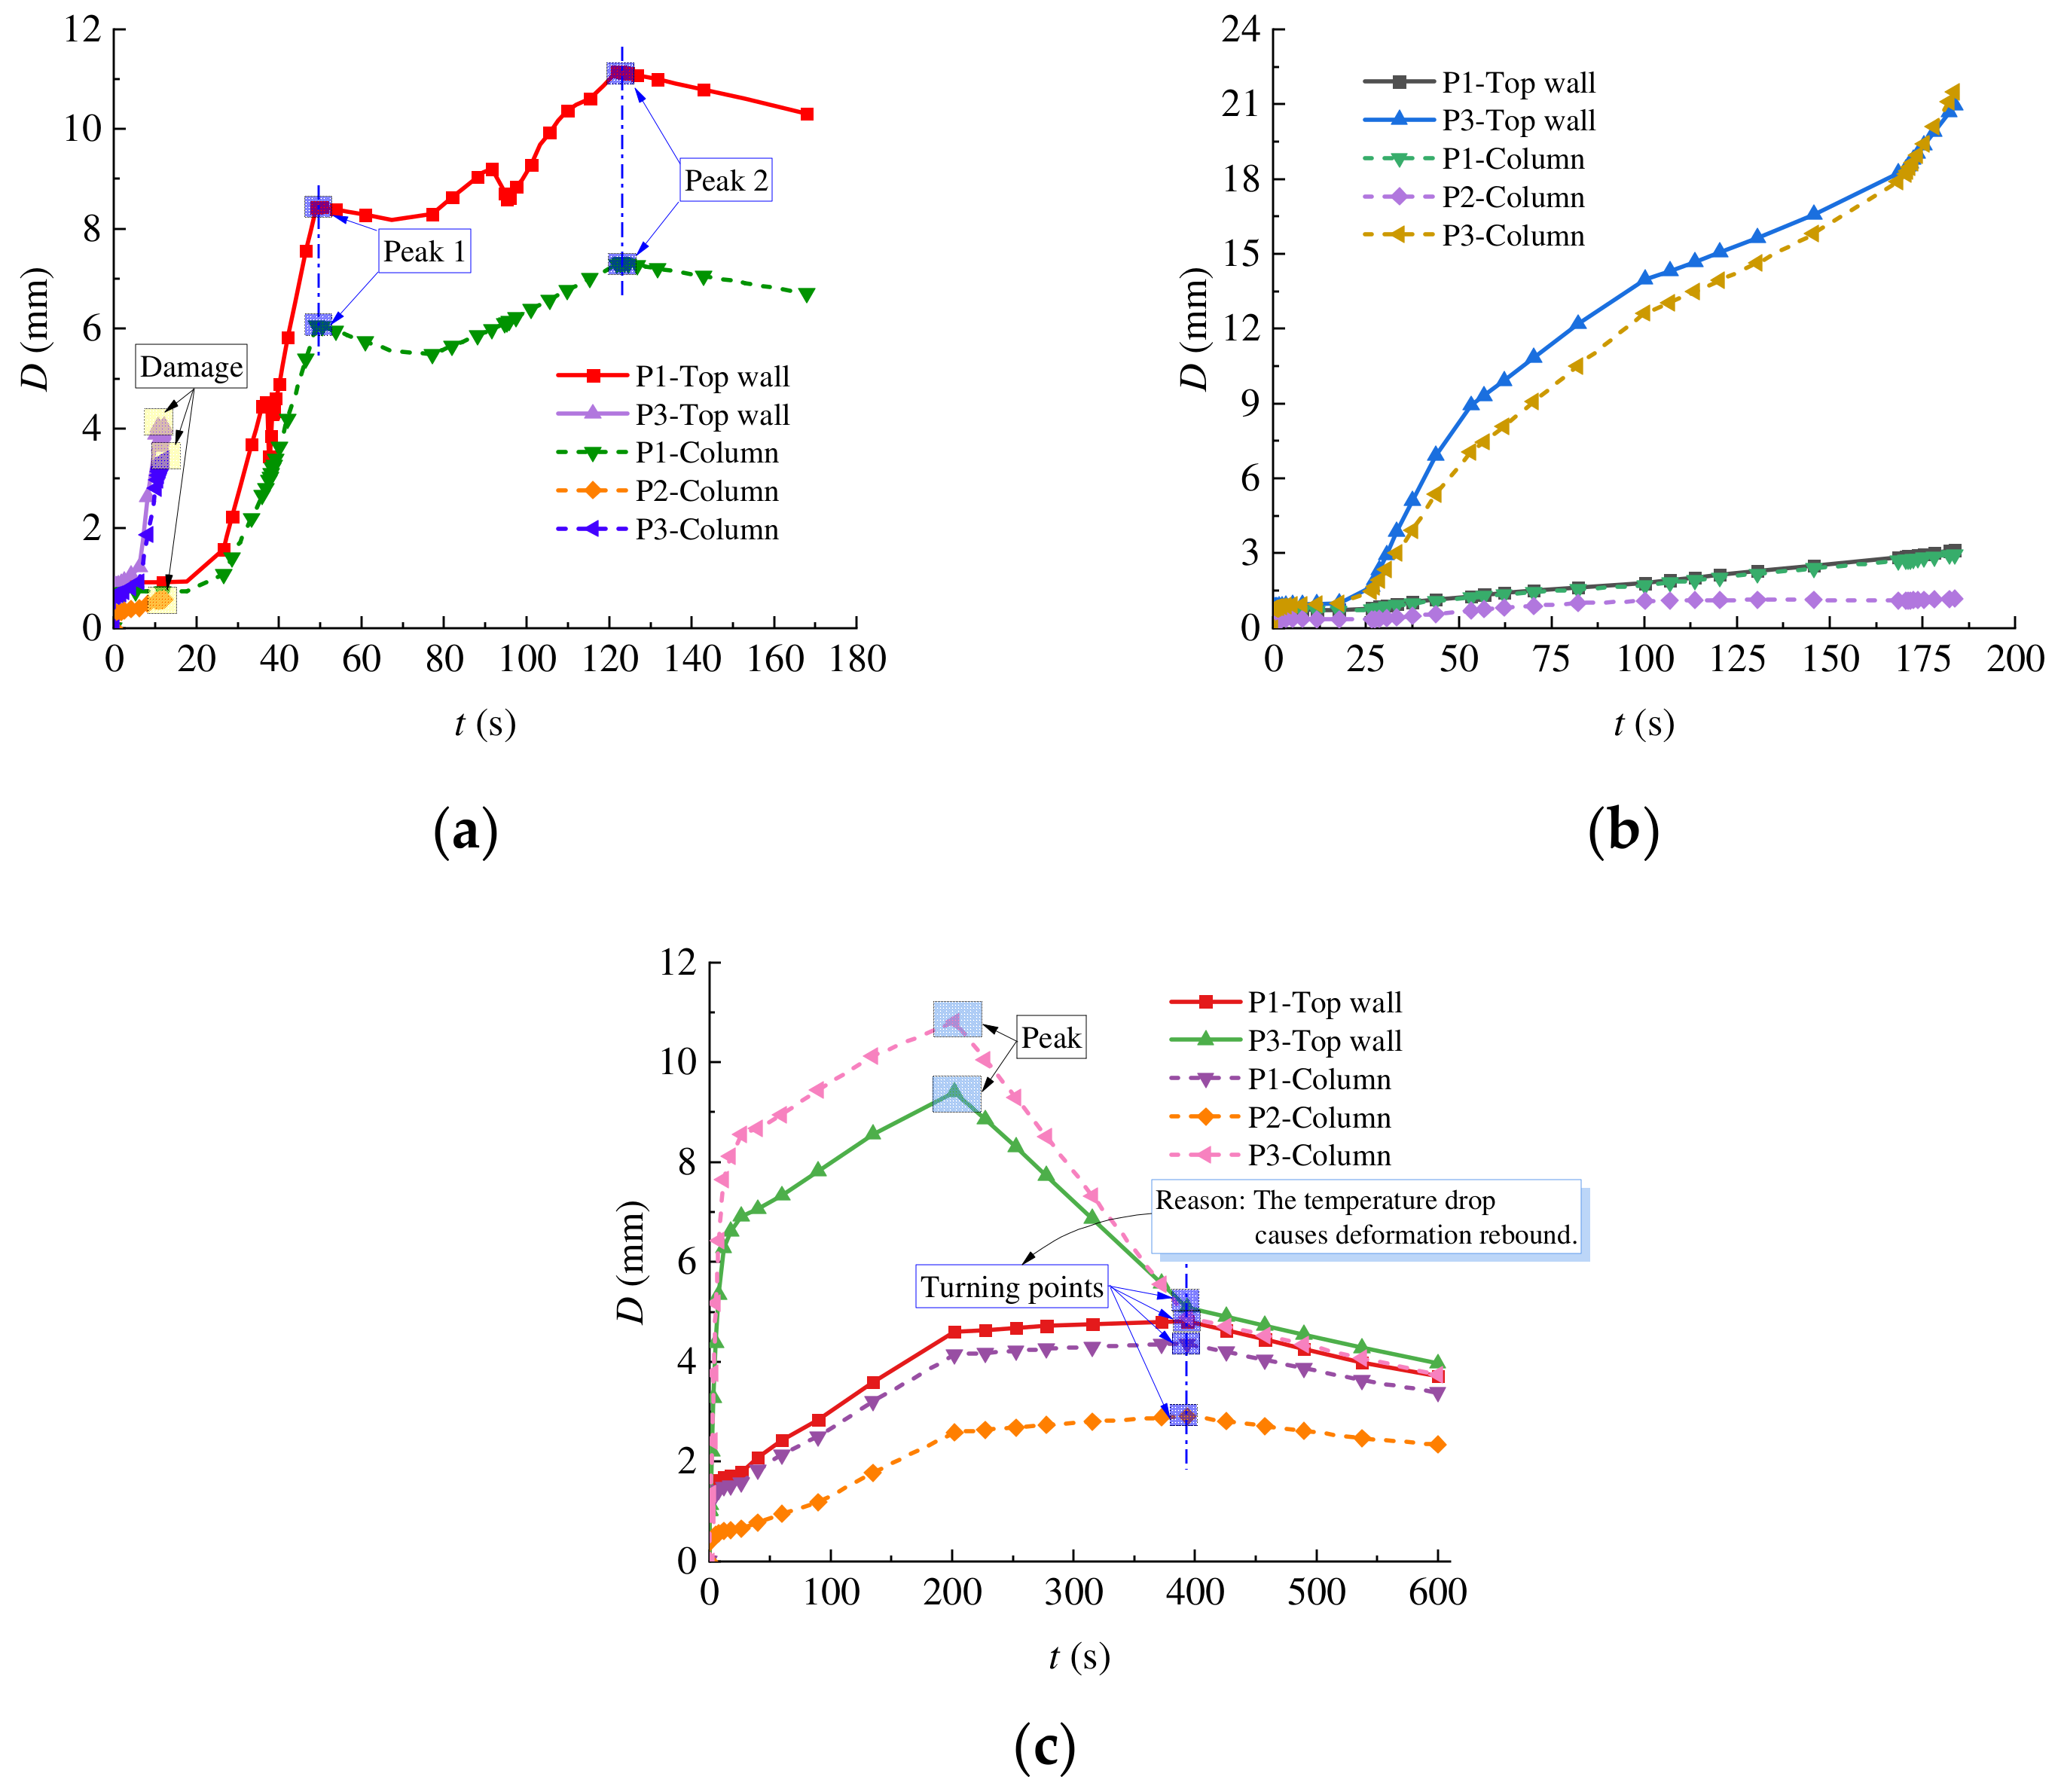
4.3. Displacement Analysis
5. Fire Protection Design
6. Conclusions and Prospects
6.1. Conclusions
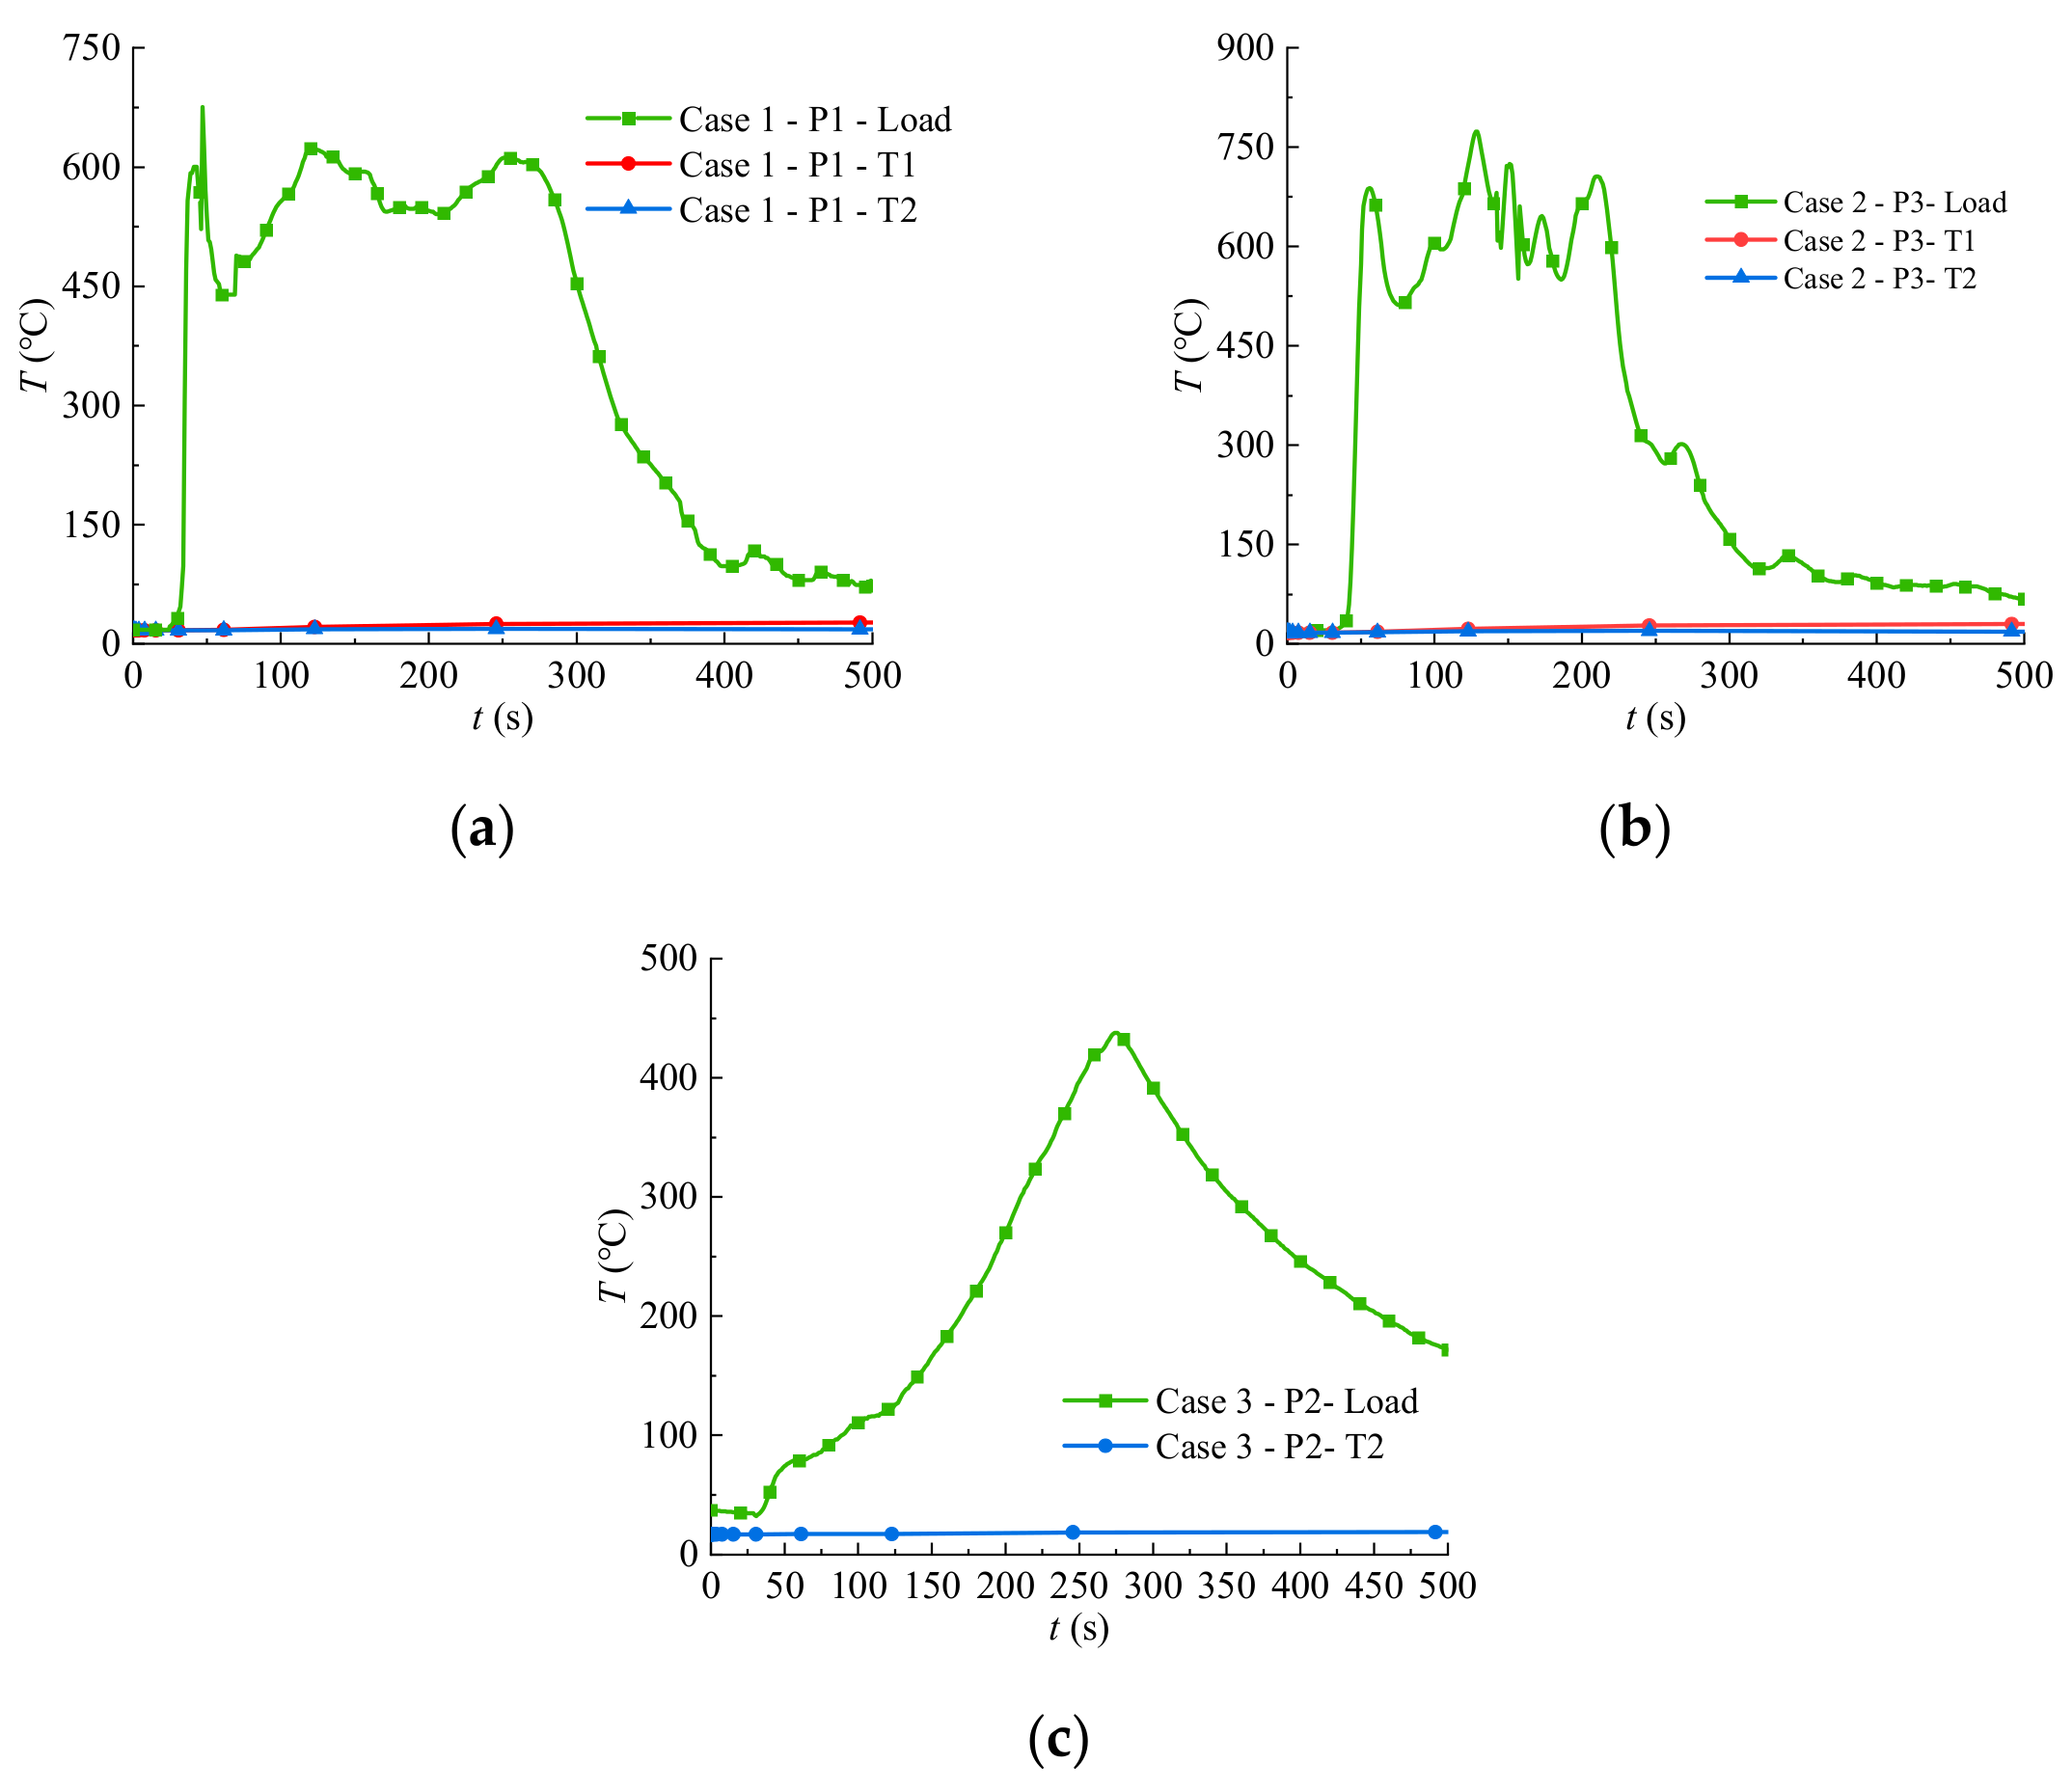
- The experiments demonstrate that fire spread can be effectively blocked through interval parking spaces, while adjacent spaces are vulnerable to fire propagation. During the fire process, temperature data exhibit a highly consistent trend with fire behavior, encompassing the initial growth, full development, and decay stages.
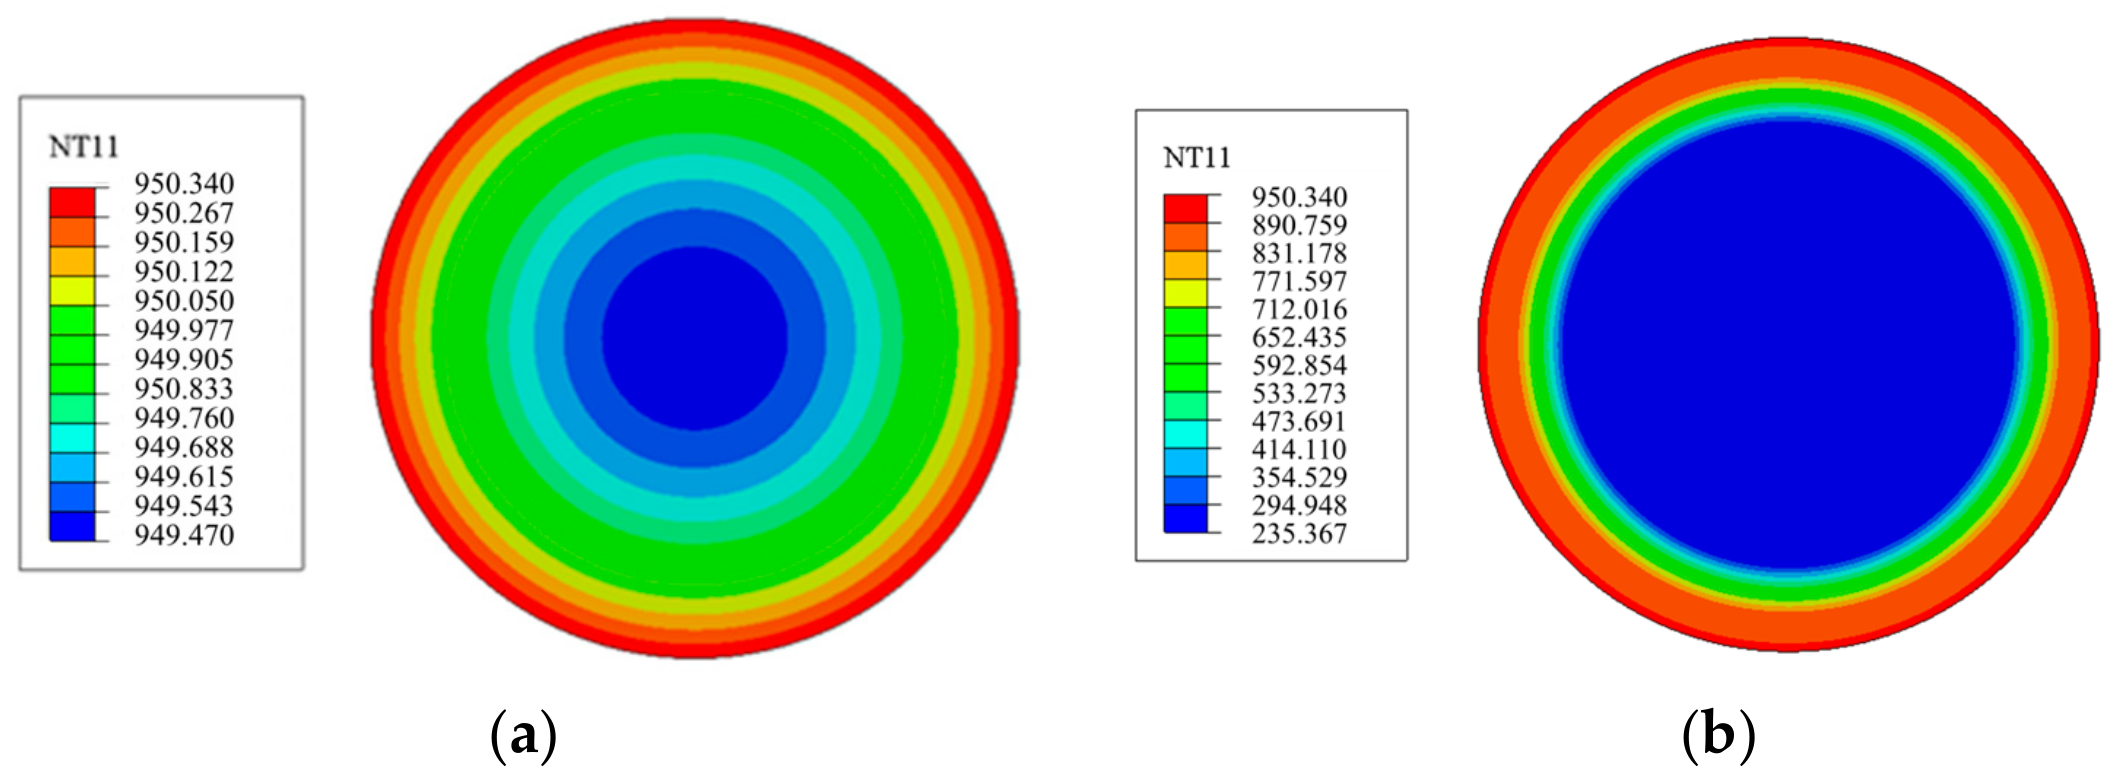
- When simulating with FDS, the reduced-scale model is restored to full size for testing. The simulation results align closely with the combustion process observed in the scale test. Through FDS temperature nephogram slices, the temperature distribution throughout the fire is observed more clearly. The diffusion of the flame upon hitting the top wall expands the high-temperature area on the wall.
- Finite element simulations reveal that in Case 1, parking spaces P1, P2, and P3 are all unsafe and fail consecutively during the fire. In Case 2, the ultimate failure of the column in parking space P1 results from the fire in P3. In Case 3, P2 is relatively more hazardous, with stress reaching 206 MPa at 600 s. Additionally, deformation analysis shows a consistent trend in the deformation of the top wall and columns, indicating their coordinated deformation behavior. Under significant high-temperature exposure from the fire, even minor deformations can trigger structural failure.
6.2. Prospects
Author Contributions
Funding
Institutional Review Board Statement
Informed Consent Statement
Data Availability Statement
Conflicts of Interest
References
- Mikusova, M.; Abdunazarov, J.; Zukowska, J.; Jagelcak, J. Designing of Parking Spaces on Parking Taking into Account the Parameters of Design Vehicles. Computation 2020, 8, 71. [Google Scholar] [CrossRef]
- Wang, Z.; Zhu, G.; Zhou, J.; Chai, G.; Wang, P. Experimental Study on Fire Propagation and Temperature Distribution of Passenger Car under Different Opening Conditions. Case Stud. Therm. Eng. 2019, 14, 100472. [Google Scholar] [CrossRef]
- Zhu, H.; Gao, Y.; Guo, H. Experimental Investigation of Burning Behavior of a Running Vehicle. Case Stud. Therm. Eng. 2020, 22, 100795. [Google Scholar] [CrossRef]
- Terziev, A.; Antonov, S. Experimental Study on the Transfer of Fire from a Burning Car to a Neighboring One. In Proceedings of the 2019 International Conference on ENERGY and ENVIRONMENT (CIEM), Timisoara, Romania, 17–18 October 2019; pp. 19–23. [Google Scholar]
- Okamoto, K.; Ichikawa, T.; Shimizu, K.; Honma, M. Thermal Effect on Surrounding Combustibles in Minivan Passenger Car Fires. Fire Mater. 2018, 42, 583–592. [Google Scholar] [CrossRef]
- Brzezinska, D.; Ollesz, R.; Bryant, P. Design Car Fire Size Based on Fire Statistics and Experimental Data. Fire Mater. 2020, 44, 1099–1107. [Google Scholar] [CrossRef]
- Truchot, B.; Fouillen, F.; Collet, S. An Experimental Evaluation of Toxic Gas Emissions from Vehicle Fires. Fire Saf. J. 2018, 97, 111–118. [Google Scholar] [CrossRef]
- Dorsz, A.; Lewandowski, M. Analysis of Fire Hazards Associated with the Operation of Electric Vehicles in Enclosed Structures. Energies 2022, 15, 11. [Google Scholar] [CrossRef]
- Li, D.; Zhu, G.; Zhu, H.; Yu, Z.; Gao, Y.; Jiang, X. Flame Spread and Smoke Temperature of Full-Scale Fire Test of Car Fire. Case Stud. Therm. Eng. 2017, 10, 315–324. [Google Scholar] [CrossRef]
- Luo, J.; Zhang, X.; Zhao, J.; Xu, Z. Fire Experiment on Temperature Distribution in an Underground Vertical Car Park. Case Stud. Therm. Eng. 2019, 15, 100513. [Google Scholar] [CrossRef]
- Barsim, M.M.; Bassily, M.A.; El-Batsh, H.M.; Rihan, Y.A.; Sherif, M.M. Performance of Impulse Ventilation System in an Underground Car Park Fire: Case Study. J. Build. Eng. 2020, 29, 101162. [Google Scholar] [CrossRef]
- Špiljar, Ž.; Schneider, D.R.; Drakulić, M. Analysis of Smoke Stratification and Smoke Layer Thickness in Underground Car Parks. Therm. Sci. 2018, 22, 1963–1972. [Google Scholar] [CrossRef]
- Hertz, K.D.; Sørensen, L.S.; Giuliani, L. Reliable Assumptions for Structural Fire Design of Steel Car Parks. J. Struct. Fire Eng. 2021, 13, 32–48. [Google Scholar] [CrossRef]
- Boehmer, H.R.; Klassen, M.S.; Olenick, S.M. Fire Hazard Analysis of Modern Vehicles in Parking Facilities. Fire Technol. 2021, 57, 2097–2127. [Google Scholar] [CrossRef]
- Yan, X.; Charlier, M.; Gernay, T. Thermal Response of Steel Framing Members in Open Car Park Fires. Front. Struct. Civ. Eng. 2022, 16, 1071–1088. [Google Scholar] [CrossRef]
- Shin, J.; Lee, H.; Min, J.-K.; Choi, I.-R.; Choi, S.-M. Predicting Temperature Loads in Open Car Parks of Piloti Structures Exposed to Real Fire Accidents. Int. J. Steel Struct. 2022, 22, 1889–1907. [Google Scholar] [CrossRef]
- Deckers, X.; Haga, S.; Tilley, N.; Merci, B. Smoke Control in Case of Fire in a Large Car Park: CFD Simulations of Full-Scale Configurations. Fire Saf. J. 2013, 57, 22–34. [Google Scholar] [CrossRef]
- Bacak, A. Numerical Investigation of Impulse Ventilation System in Underground Car Park. Int. J. Eng. Appl. Sci. 2017, 4, 257525. [Google Scholar]
- Deckers, X.; Haga, S.; Sette, B.; Merci, B. Smoke Control in Case of Fire in a Large Car Park: Full-Scale Experiments. Fire Saf. J. 2013, 57, 11–21. [Google Scholar] [CrossRef]
- Merci, B.; Shipp, M. Smoke and Heat Control for Fires in Large Car Parks: Lessons Learnt from Research? Fire Saf. J. 2013, 57, 3–10. [Google Scholar] [CrossRef]
- Selamet, S.; Ayva, B. Car Fires in Multi-Story Parking Garages. Turk. J. Civ. Eng. 2023, 34, 83–110. [Google Scholar] [CrossRef]
- Koromila, I.A.; Spyrou, K.J. Design Fire Methodology for Vehicle Spaces Onboard Ships. Fire Technol. 2023, 59, 1725–1759. [Google Scholar] [CrossRef]
- Gavryliuk, A.; Yakovchuk, R.; Ballo, Y.; Rudyk, Y. Thermal Modeling of the Electric Vehicle Fire Hazard Effects on Parking Building. SAE Int. J. Trans. Saf. 2023, 11, 421–434. [Google Scholar] [CrossRef]
- Di Matteo, S. Fire Risk of Electric Vehicles in Confined Spaces. Master’s Thesis, Politecnico di Torino, Turin, Italy, 2023. [Google Scholar]
- Ma, R.; Cui, C.; Ma, M.; Chen, A. Numerical Simulation and Simplified Model of Vehicle-Induced Bridge Deck Fire in the Full-Open Environment Considering Wind Effect. Struct. Infrastruct. Eng. 2021, 17, 1698–1709. [Google Scholar] [CrossRef]
- Ayva, B. Performance-Based Fire Safety Design for Automated Vehicle Parking Steel Structures. Master’s Thesis, Bogazici University, Istanbul, Turkey, 2020. [Google Scholar]
- Kumar, P.; Kodur, V. A Rational Approach for Fire-Resistance Evaluation of Double-Tee, Prestressed Concrete Slabs in Parking Structures. PCI J. 2020, 65, 20–41. [Google Scholar] [CrossRef]
- Meng, F.; Mago, N.; Andisheh, K.; Clifton, G.C. Numerical Validation of Structural Fire Design for Steel Framed Car Park Buildings. Fire Saf. J. 2023, 139, 103819. [Google Scholar] [CrossRef]
- Yang, Y.; Yang, W.; Zhang, Z.; Liu, F.; Frank Chen, Y. Fire-Resistant Test and Fire Protection Layer Research of U-Shaped Steel–Concrete Composite Beams. Structures 2023, 58, 105340. [Google Scholar] [CrossRef]
- Bradford, M.A.; Liu, X.; Chen, C.; Wang, J. Finite Element Modelling of Lattice Angle Steel Structures Exposed to Wildland Fires. Structures 2023, 56, 104901. [Google Scholar] [CrossRef]
- JGJ 100-2015; Code for Design of Parking Garage Building, Urban-Rural Development. Ministry of Public Security: Beijing, China, 2015.
- GB50067-97; Code for Fire Protection Design of Garage, Motor Repair Shop and Parking Area. Ministry of Public Security: Beijing, China, 2014.
- Lecocq, A.; Bertana, M.; Truchot, B.; Marlair, G. Comparison of the Fire Consequences of an Electric Vehicle and an Internal Combustion Engine Vehicle. In Proceedings of the International Conference on Fires in Vehicles—FIVE 2012, Chicago, IL, USA, 27–28 September 2012. [Google Scholar]
- Krol, M.; Krol, A. The Threats Related to Parking Electric Vehicle in Underground Car Parks. In Intelligent Solutions for Cities and Mobility of the Future, Proceedings of the 17th Scientific and Technical Conference “Transport Systems Theory and Practice 2021”, Katowice, Poland, 21–23 September 2021; Springer: Cham, Switzerland, 2022; pp. 72–81. [Google Scholar]
- Brzezinska, D.; Bryant, P. Performance-Based Analysis in Evaluation of Safety in Car Parks under Electric Vehicle Fire Conditions. Energies 2022, 15, 649. [Google Scholar] [CrossRef]
- Bai, J.; Liao, H.; Xia, Y. Study on Fire Accidents in Tunnels. IOP Conf. Ser. Mater. Sci. Eng. 2020, 741, 012095. [Google Scholar] [CrossRef]
- Zhang, Q. Spontaneous Combustion of Lithium Batteries and Its Preventive Measures. IOP Conf. Ser. Earth Environ. Sci. 2021, 677, 052030. [Google Scholar] [CrossRef]
- Fang, H.; Lo, S.M.; Zhang, Y.; Shen, Y. Development of a Machine-Learning Approach for Identifying the Stages of Fire Development in Residential Room Fires. Fire Saf. J. 2021, 126, 103469. [Google Scholar] [CrossRef]
- Li, Z.; Zhang, S.; Cao, F. Analysis of Performance and Stability Factors of Vehicle Ethanol Gasoline for Motor Vehicle. IOP Conf. Ser. Earth Environ. Sci. 2020, 514, 042025. [Google Scholar] [CrossRef]
- Santangelo, P.E.; Tarozzi, L.; Tartarini, P. Full-Scale Experiments of Fire Control and Suppression in Enclosed Car Parks: A Comparison between Sprinkler and Water-Mist Systems. Fire Technol. 2016, 52, 1369–1407. [Google Scholar] [CrossRef]
- Kim, H.-J.; Lilley, D.G. Heat Release Rates of Burning Items in Fires. J. Propuls. Power 2012, 18, 866. [Google Scholar] [CrossRef]
- Heskestad, G.; Delichatsios, M.A. The Initial Convective Flow in Fire. Symp. Int. Combust. 1979, 17, 1113–1123. [Google Scholar] [CrossRef]
- EN 1993-1-2; Eurocode 3: Design of Steel Structures—Part 1-2: General Rules - Structural Fire Design. European Union: Brussels, Belgium, 2005.
- Cui, C.; Chen, A.; Ma, R. Stability Assessment of a Suspension Bridge Considering the Tanker Fire Nearby Steel-Pylon. J. Constr. Steel Res. 2020, 172, 106186. [Google Scholar] [CrossRef]


| Case | Fuel Pool Location | Ignition Position | Illustration | Individual Fuel Pool Size (mm × mm) |
|---|---|---|---|---|
| 1 | P1, P2, P3 | P2 | 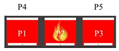 | 880 × 350 |
| 2 | P1, P3, P5 | P3 |  | |
| 3 | P3, P4, P5 | P5 |  |
| T (°C) | 20 | 100 | 200 | 300 | 400 | 450 | 500 | 550 | 600 | 650 | 700 | 750 | 800 | 900 | 1000 |
|---|---|---|---|---|---|---|---|---|---|---|---|---|---|---|---|
| χsT | 1 | 0.98 | 0.95 | 0.91 | 0.84 | 0.79 | 0.73 | 0.64 | 0.50 | 0.32 | 0.21 | 0.15 | 0.10 | 0.04 | 0 |
| ηsT | 1 | 1.00 | 1.00 | 1.00 | 0.91 | 0.82 | 0.71 | 0.58 | 0.45 | 0.33 | 0.23 | 0.15 | 0.10 | 0.05 | 0 |
Disclaimer/Publisher’s Note: The statements, opinions and data contained in all publications are solely those of the individual author(s) and contributor(s) and not of MDPI and/or the editor(s). MDPI and/or the editor(s) disclaim responsibility for any injury to people or property resulting from any ideas, methods, instructions or products referred to in the content. |
© 2024 by the authors. Licensee MDPI, Basel, Switzerland. This article is an open access article distributed under the terms and conditions of the Creative Commons Attribution (CC BY) license (https://creativecommons.org/licenses/by/4.0/).
Share and Cite
Zhang, Y.; Wang, Z.; Li, Y.; Ma, H.; Guo, Z. Structural Performance of Outdoor Mechanical Garages under Combustion Conditions. Fire 2024, 7, 116. https://doi.org/10.3390/fire7040116
Zhang Y, Wang Z, Li Y, Ma H, Guo Z. Structural Performance of Outdoor Mechanical Garages under Combustion Conditions. Fire. 2024; 7(4):116. https://doi.org/10.3390/fire7040116
Chicago/Turabian StyleZhang, Yin, Zuocai Wang, Yang Li, Hongsheng Ma, and Zhan Guo. 2024. "Structural Performance of Outdoor Mechanical Garages under Combustion Conditions" Fire 7, no. 4: 116. https://doi.org/10.3390/fire7040116
APA StyleZhang, Y., Wang, Z., Li, Y., Ma, H., & Guo, Z. (2024). Structural Performance of Outdoor Mechanical Garages under Combustion Conditions. Fire, 7(4), 116. https://doi.org/10.3390/fire7040116