Abstract
The cellular automata (CA) model has been a meaningful way to study pedestrian evacuation during emergencies, such as fires, for many years. Although the time step used in the CA model is one of the most essential elements, there is a lack of research on its impact on evacuation time. In this paper, we set different time step sizes in an extended cellular automaton model and discuss the effect of time step size on the overall evacuation time under different emergency types and levels. For a fixed step time mode, the larger the time step, the longer the evacuation time. In each time step size, the evacuation time gradually increases with the increase of emergency level, and there is a sharp increase when the time for pedestrians to move one step is exactly an integer multiple of the time step. When there is no friction between pedestrians, the evacuation time at each time step first decreases slightly with the increase of emergency level and then remains unchanged; the larger the time step, when the evacuation time remains unchanged, the lower the emergency level and the greater the evacuation time. For the variable time step model, when the friction between pedestrians approaches infinity, the total evacuation time does not change with the emergency level; when the friction between pedestrians is reduced, the total evacuation time slightly decreases with the increase of the emergency level. The less friction there is, the more significant the reduction. The results of previous actual experiments are also reflected in the simulation at a lower emergency level. The result shows that the time step size significantly impacts the evacuation simulation results of the CA model, and researchers should choose carefully to obtain more realistic simulation results.
1. Introduction
With the rapid increase in population and the occurrence of various evacuation accidents, such as the Mina crowd disaster [1], which occurred on 2 July 1990, and 24 September 2015, how to ensure the safe evacuation of people in emergencies such as fire has become a widespread concern in society. This has also attracted more and more researchers in different fields to study pedestrian evacuation dynamics [2,3]. There is no doubt that repeated evacuation experiments of various types of buildings, scenes, or cluster events are the best way to understand the dynamics of crowd evacuation and obtain the optimal evacuation strategy. However, due to safety, ethics, funding, and other issues, sometimes it is impossible to carry out actual experiments; even if some actual experiments can be conducted, they will be affected by uncontrollable variables and data quality, which seriously limits the research on crowd evacuation in emergencies.
Fortunately, with the development of computer technology, computer simulation has become the main measure to analyse the evacuation process and evaluate evacuation efficiency [4], and it is also the primary method for studying emergency evacuation [5]. In 1971, Henderson et al. [6] analogised the evacuated crowd to a continuous liquid and established a model. On this basis, the evacuation model gradually evolved into two types of models, including the discrete model and the continuity model, depending on whether the space in the model is continuous. The social force model (SFM) [7,8,9] and the cellular automaton (CA) model [10,11,12,13] are representative models of the discrete and the continuous models, respectively. In this paper, we focus on the CA model, which has the characteristics of high computational efficiency and robust scalability and plays an irreplaceable role in understanding the nature of evacuation dynamics [2]. The CA model discretises time and space into small, noncontinuous segments. The small segments of space are the cells of the CA model. According to the cell size, the CA model can be divided into a fine grid size model [14,15,16] and an ordinary grid size model [17,18,19]. Correspondingly, it is also divided into a multigrid model [20,21] and a single-grid model [22] according to the number of cells occupied by one person. The time segment is also called the time step of the CA model. Within each time step, pedestrians move between discrete cells according to neighbourhood rules, and the status of each cell is updated. Researchers have performed some research on cell size-related issues, but there is a relative lack of research on the impact of time step size on evacuation. Therefore, this paper uses the single-grid model with ordinary grid size to study the effect of different time step sizes on crowd evacuation time.
The main cause of cluster activity disasters is extreme pressure and competition when pedestrians want to escape or enter a specific area at a desired speed due to excitement or panic caused by disasters or events. Helbing et al. [23] studied crowd behaviour under high-pressure situations and found that in such cluster disaster events, the higher the expected speed, the lower the exit flow rate. The ‘fast is slow’ (FIS) effect, which has also been confirmed by many related studies [24,25,26,27], could lead to potentially fatal events as flow rates are drastically reduced, potentially leading to large gatherings of people. When a fire or other emergency occurs, pedestrians become more nervous and value resources that can make them safer or keep them away from danger. The more urgent the situation, the more important the resources are for pedestrians. During the process of evacuation or distancing, conflicts may arise when there is an overlap in pedestrian evacuation routes or evacuation spaces, and the more urgent the situation, the more serious the conflict will be. When a conflict occurs, the degree to which pedestrians attach importance to the damage to their own interests caused by others (such as encroaching on evacuation routes or evacuation spaces) or the ability to resolve conflicts at the time of conflict is defined as the friction between pedestrians in conflict. Kirchner et al. [28] introduced the friction parameter in the CA model for the first time to express the probability of successfully resolving conflicts. Then Hu et al. [24] used friction function with aggressiveness to solve conflicts, and aggressiveness was used to represent the pedestrian’s ability to compete in conflicts, affecting their speed and interaction with others. At this time, the pedestrian who finally moves smoothly is selected based on the aggressiveness of all pedestrians involved. However, only the situation in which pedestrians move according to von Neumann’s neighbourhood rule (as shown in Figure 1a, pedestrians can only move in four directions: up, down, left, and right) was considered in that paper, while Wurzer et al. [29] and Song et al. [30] argue that pedestrians are more reasonable to evacuate according to Moore’s neighbourhood rule (as shown in Figure 1b, pedestrians can move in eight directions). In addition, aggressiveness borrowed from Stephen’s law [31] only considers the emergency level of the overall environment. It does not consider the differences in the pedestrian’s specific situation and choices. However, differences in particular conditions will affect pedestrians’ reaction to the same danger. For example, if they are attacked similarly, pedestrians react differently in open spaces and spaces with no room for escape, such as elevators [32]. Their preferences also vary based on the pros and cons of their options [33,34]. Therefore, we introduce optimised aggressiveness [35], which considers the pedestrian’s specific situation and the pros and cons of each choice, into the model and stipulate that pedestrians evacuate following Moore’s neighbourhood rule. On this basis, we simulate and analyse the changes in the total evacuation time at different time step sizes under various degrees of emergency and friction.
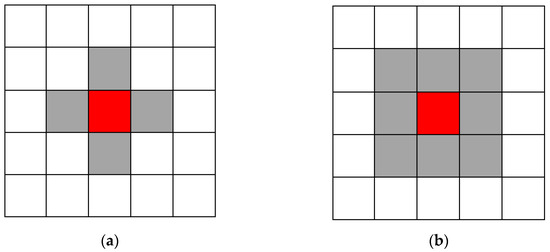
Figure 1.
The cells (grey cells) that pedestrians (red cells) can move to when following (a) von Neumann’s neighbourhood rule and (b) Moore’s neighbourhood rule.
2. Materials and Methods
We will conduct the research in the software written by our team based on the Qt compiler, which is used in other studies [35,36,37], as well. This software can accurately read and display drawing exchange format (DXF) graphic files in ASCII format output by AutoCAD, discretize the read graphic files with one click, select and set different grids (such as setting them as safety exits, etc.), add pedestrians randomly or at fixed points, and display the evacuation process in real time. Based on this software framework, we set up the cellular automaton model as follows: the space is discretised into 0.5 m × 0.5 m cells, which are either free or occupied by pedestrians or obstacles, and time is also discretised into time segments of different sizes according to experimental requirements.
2.1. The Static Floor Field and Selection of the Target Cell
The static floor field value does not change over time and reflects the distance between the cells and the exits. Here, we use a method similar to the iterative approach mentioned in a previous study [38] to obtain the static floor field and the floor field value of the cell is calculated using Equation (1).
where is the value of cell in von Neumann’s static floor field (from the exit, the value of cells will increase according to von Neumann’s neighbourhood rule as follows: up, down, left, and right). represents the value of cell in Moore’s static floor field (from the exit, the value of cells will increase according to Moore’s neighbourhood rule as follows: eight directions). Parameter controls the weight of von Neumann’s static floor field. If , then , and the static floor field is as shown in Figure 2a. If , then , and the static floor field is as shown in Figure 2b. If , then , and the static floor field is as shown in Figure 2c. The exits are represented by the green cells, obstacles are represented by the blue cells, and the static floor field value of one cell is the number in that cell.
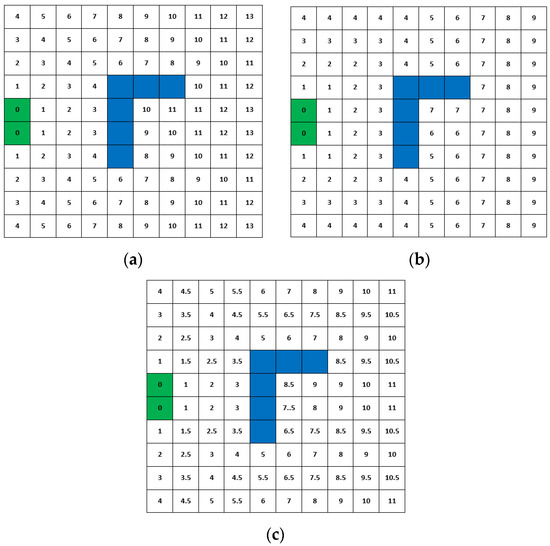
Figure 2.
Static floor fields obtained by different neighbourhood rules under (a) von Neumann’s neighbourhood rule , (b) Moore’s neighbourhood rule , and (c) weight parameter .
The probability that a pedestrian selects cell as the target cell of the next time step is obtained using the following formula:
where is a normalisation factor. indicating the sensitivity of pedestrians to the static floor field is the weight of the static floor field. indicates whether a pedestrian occupies the target cell; if the cell is occupied by another pedestrian, , otherwise, . Likewise, indicates whether the target cell is occupied by an obstacle; if it is occupied by an obstacle, , otherwise, .
2.2. Update Scheme
The update schemes are divided into four types: the parallel/synchronous scheme, the random scheme, the order-sequential scheme, and the shuffled scheme [39]. The parallel update scheme, which can better reflect the competition between pedestrians during a dense crowd evacuation, is selected in this paper. We use two modes in the model, including fixed time step size and variable time step size. In the fixed time step size mode, the time step will be set to many fixed values, which is also the most commonly used method. In the variable time step size mode, the time step of each evacuation simulation is obtained based on the speed of the pedestrian, which means that it changes with the emergency level because speed is related to the environment. In addition, in the fixed time step mode, as the emergency level increases, the pedestrian’s speed gradually increases [24], and the time required to move one step gradually decreases so that the pedestrian may move multiple steps in one time step. In this case, dealing with the conflicts caused by partial overlaps and jumps in the evacuation routes is necessary when using the parallel update method.
Figure 3 presents examples of human movement following Moore’s neighbourhood rule explaining how to handle the situation of a pedestrian’s position jumping; the red circle represents the pedestrian, the green cells and yellow cells indicate the places he can move to, and the pedestrian can maintain the original position at each step. Figure 3a shows a situation in which a pedestrian can only move one step per time step. The black arrows indicate the possible directions of his action. Figure 3b shows a situation in which a pedestrian can move two steps at one time step. The black arrows also indicate the possible directions of the first step, and the orange arrows are the possible directions of the second step. If the cell in the first step is occupied by a person or structure, the pedestrian cannot skip the occupied cell directly to the position of the second step, although the position meets the requirements in terms of distance; that is, in Figure 3b, although the person can move two steps, and the grey cells are just about two steps away from him, he cannot jump over the blue cells to reach a grey cell in one time step. In this way, the problem of position jumping when pedestrians move multiple steps at one time step is solved. If multiple pedestrians select the same cell as their target, as shown in Figure 4, conflict occurs; we use the conflict resolution method presented in Section 2.3 to solve this problem.
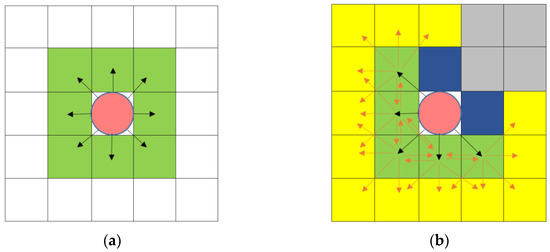
Figure 3.
Situation according to Moore’s neighbourhood rules as follows: (a) when pedestrians can only move one step and (b) when pedestrians can move up to two steps, and two adjacent cells are occupied.
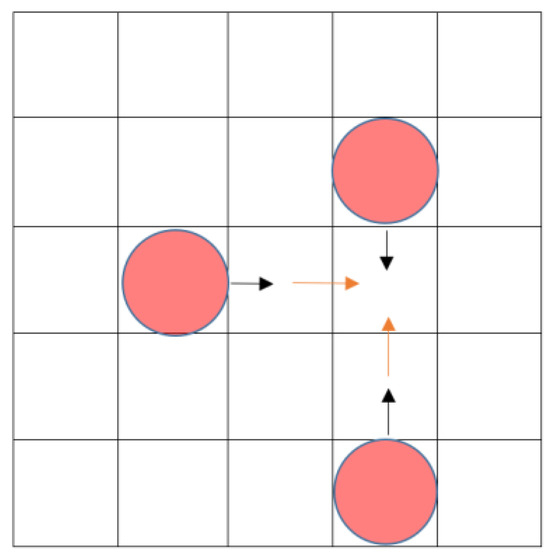
Figure 4.
Three people’s target cells conflict (two people move two steps, and one person moves one step).
However, when some pedestrians move multiple steps within a time step, their target cells may not conflict, but their movement routes may intersect or partially overlap. A handling method is needed based on the specific conflict situation. Also, use the example of pedestrians moving according to von Neumann neighbourhood rules, as shown in Figure 5; pedestrian No. 1 selects cell No. 1 as the target cell, and pedestrian No. 2 selects cell No. 2 as the target cell. In Figure 5a, pedestrian No. 1 moves two steps at one time step, and pedestrian No. 2 moves one step. Although pedestrian No. 1 needs to pass through pedestrian No. 2’s target cell in the first step, we think they can successfully avoid route conflicts and move smoothly. Similarly, in Figure 5b,c, although one pedestrian’s first step conflicts with other people’s second step, we also think they can successfully avoid walking route conflicts and move smoothly. In Figure 5d, both pedestrians move two steps at one time step and their first steps conflict. At this time, only one person can move to the target cell smoothly. In this case, we use the conflict resolution method presented in Section 2.3 to determine who ultimately moves.
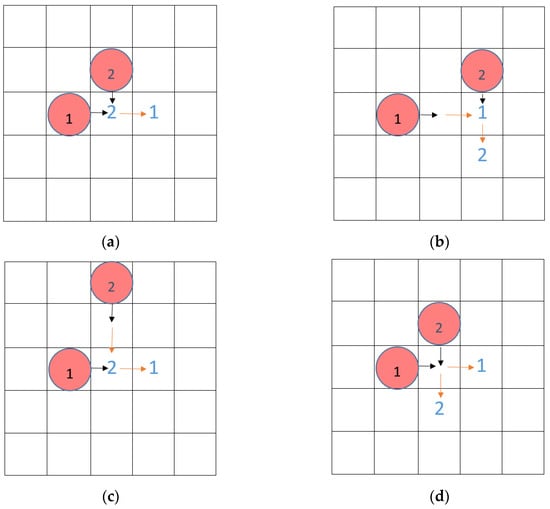
Figure 5.
Routes intersect or partially overlap: (a) person one’s first step is intersected with person two’s destination (first step), (b) person one’s destination (second step) is intersected with person two’s first step, (c) person one’s first step is intersected with person two’s destination (second step) and (d) person one’s first step is overlap with person two’s first step.
In the variable time step mode, pedestrians can only move at most one step per time step. We do not need to resolve the conflict of evacuation routes intersecting or partially overlapping, but there are things to consider. In this mode, the time step increases with the pedestrian’s speed (risk levels). It is obtained using formula , in which represents the cell size (which is 0.5 m) and represents the velocity of pedestrians at different aggressiveness. That is to say, when the pedestrian speed is 1, the time step is 500 ms, when the pedestrian speed is 1.1, the time step is about 455 ms, and so on. Make sure that the time step of the model is equal to the time it takes for a pedestrian to move one step.
2.3. Aggressiveness and Conflict Resolution
Pedestrian aggressiveness is the possessiveness of a target that is manifested by the interaction and influence of a person’s internal psychology and the external environment. In general, the more urgent the situation, the higher their aggressiveness. Hu et al. [24] use a power function borrowed from Stevens’ law [31] of psychophysics to represent pedestrian aggressiveness. However, as mentioned, people react differently in different situations. When they are attacked and there is a possibility of escape, they are most likely to run away; however, when there is no possibility of escape (such as in an elevator), they will usually fight back, and people’s decisions are also affected by the advantages and disadvantages of their options [32,33,34]. We, therefore, use optimised aggressiveness [35] as follows:
where is the pedestrian’s perception of the environment and other pedestrians. The bigger the , the higher the emergency level, and . adjusts the growth rate of aggressiveness, and . is the normalized value of the probability that pedestrian selects cell according to Equation (2). This formula optimises a pedestrian’s aggressiveness in a specific situation, and the pros and cons of the available options can more accurately express the pedestrian’s status.
Pedestrian speed is related to the emergency level, which is controlled by perception and . Borrowing from Hu et al. [24], we express the change of speed affected by perception and as Equation (4). Generally, the higher the emergency level (the bigger ), the greater the speed.
represents the speed under normal conditions, and represents the speed of pedestrians under different competitive situations. Because , ; that is, the maximum walking speed of a pedestrian is twice the initial velocity. In this study, we set the velocity m/s, so the maximum walking speed is 2 m/s.
As mentioned, the model in this article uses the parallel update method. In this update method, there may be situations in which the resources (space and time) that multiple pedestrians want to occupy overlap, and the limited resources cannot meet the needs of each person’s movement at the next time step, so their interests conflict, such as conflicts caused by multiple people choosing the same target cell and routes intersecting or partially overlapping mentioned in Section 2.2. Conflicts accurately describe crowd dynamics, especially in dense crowds near bottlenecks and intersections [13]. The friction parameter was first introduced in the CA model to determine the probability of having a winner in a conflict [28], and then a friction function was used to solve conflicts with aggressiveness [24]. We use the optimised friction function [35] as follows:
where is the allowable conflict coefficient of pedestrians, which is opposite to the friction between pedestrians during evacuation. The larger , the smaller the friction, the smoother the competition situation, and the more likely the conflict will be resolved. Parameter is the set of all pedestrians who are involved in the conflict, and is the maximum possible aggressiveness. In this study, we simulate the situation in which pedestrians move according to Moore’s neighbourhood rule, so (although there is the possibility of pedestrians moving two steps, and the maximum number of people moving to a cell is 8 and 16 respectively, the possibility of exceeding 4 and 8 respectively does not exist).
With a probability of , the conflict is successfully resolved. At this time, one of the pedestrians involved becomes the winner and can successfully move to his target cell; otherwise, no one involved can successfully reach his target cell. The probability of a pedestrian winning the conflict is determined by the optimised aggressiveness of all people involved in the conflict, according to the following equation [35].
2.4. Simulation Parameters and Measurement Methodology
We apply the optimised aggressiveness to the model, stipulate that pedestrian evacuation follows Moore’s neighbourhood rule, gradually increase the time step of the model to conduct evacuation simulations, and then analyse and compare the evacuation results under different time step sizes. To reduce factors contributing to differences in evacuation results, we stipulate that the pedestrian’s perception remains unchanged during the evacuation process, the initial velocity is 1.0 m/s, the static floor field weight parameter , and the sensitivity parameter . In addition, we set , and the emergency level is adjusted by adjusting the perception. For comparison with previously conducted actual experiments [25], we use the same scenarios in the model. In addition, in the actual experiment, volunteers wore protective vests (as shown in Figure 6) and evacuated from the experimental area through the safety exit. The rigidity of this protective vest limited the smoothness of pedestrian evacuation; that is, the friction during pedestrian evacuation was very large. In the model, we change the friction of pedestrian evacuation by changing the allowable conflict coefficient .

Figure 6.
Protective vest [25] (a) photo of a protective vest and (b) a participant in the vest.
The actual experimental room is 8 m long and 4 m wide, with one safety exit, as shown in Figure 7a. In the model, the room is discretised into square cells with a side length of 0.5 m, so the internal space of the room (excluding the cells occupied by the wall) has 16 cells on the long side and 8 cells on the short side, as shown in Figure 7b. A total of 55 pedestrians were randomly added to the model, as shown in Figure 7d, which corresponds to the 55 male college students in the actual experiment, as shown in Figure 7c. The average evacuation times in the actual experiment for low, medium, and high competitiveness were 60.3 ± 2.71 s, 68.9 ± 4.42 s, and 74.8 ± 8.11 s, respectively.
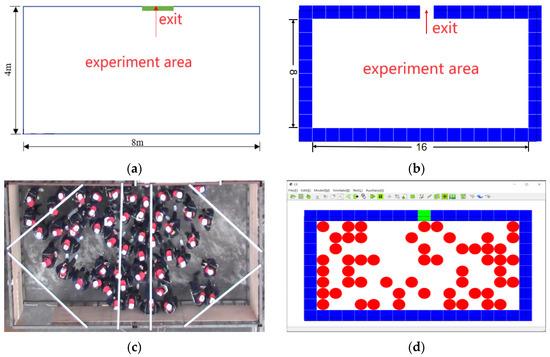
Figure 7.
Experiment area (a) actual experiment [25], (b) evacuation simulation, (c) the fifth second after starting evacuation [25], and (d) the software interface after randomly adding people.
The allowable conflict coefficient changes from close to 0 to 1 at a step of 0.2. In addition, the special situation in which the allowable conflict coefficient approaches infinity is also considered. For each , perception ranges from 0.1 to 1 at a step of 0.1 and remains unchanged during the simulation.
3. Results
3.1. Evacuation Time under Different Time Step Sizes with Friction
In this section, we first simulate crowd evacuation in fixed time step mode, in which the time step gradually increases from 250 ms to 500 ms at a step of 50 ms. Then we simulate crowd evacuation in variable time step mode, in which the time step varies according to the speed of the pedestrians in the model under different perception levels. Finally, the total evacuation times in the two modes are compared. Each simulation is repeated 50 times, and the average total evacuation time of fixed time step and varied step time is shown in Figure 8. From the result, we can see that the average evacuation time varies significantly with pedestrian perception in different time step sizes. For the fixed time step model, the total evacuation time increases with the increase of pedestrian perception, showing the ‘fast is slow’ (FIS) effect, and the smaller the allowable conflict coefficient (the greater the friction), the greater the evacuation time increases with perception, the more obvious the result of ‘FIS’ effect. Under the same allowable conflict coefficient and perception, the larger the time step, the larger the evacuation time. For the variable time step mode, the time step of the model decreases as pedestrian perception increases (speed increases), and the total evacuation time changes very little in this mode. Under a smaller allowable conflict coefficient, it first increases a little and then reduces a little, and under a larger allowable conflict coefficient, it reduces a little.
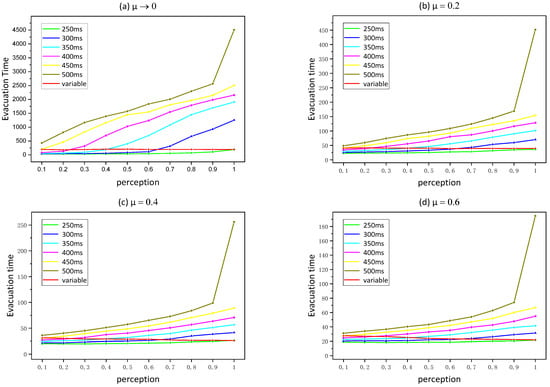
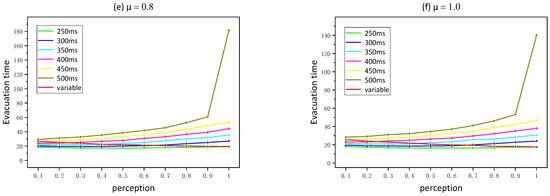
Figure 8.
Average evacuation time under different allowable conflict coefficients.
When the allowable conflict coefficient is close to 0, that is, when the friction is close to infinite, there is an interesting phenomenon. When the time step is 450 ms, the evacuation time increases sharply when the pedestrian’s perception rises to 0.1, that is the pedestrian velocity increases to 1.1 m/s (). When the time step is 400 ms, a dramatic increase appears when the pedestrian perception increases to 0.2; pedestrian velocity increases to 1.2 m/s (). When the time step is 350 ms, a dramatic increase appears when the pedestrian perception increases to 0.4; pedestrian velocity increases to 1.4 m/s (). When the time step is 300 ms, a dramatic increase appears when the pedestrian perception increases to 0.6; pedestrian velocity increases to 1.6 m/s (). It shows that total evacuation time rises dramatically when the time step is larger than the time required for a pedestrian to move one step, which means that when the model updates, all people can move one step or two steps; of course, they can also stay still if they have no cells available or they are the loser of a conflict. Furthermore, a significant increase occurs when pedestrian aggressiveness increases to one (pedestrian speed increases to 2 m/s), when the time step is 500 ms. The time step is now twice the time it takes for a pedestrian to move one step, which means that when the model updates, all people can move two steps; of course, they can also stay still if they have no cells available or they are the loser of a conflict; they can also move one step if they choose to. This is mainly due to the fact that after the point at which these perceptions increase, there is a drastic increase in the number of pedestrians competing at the same moment. For example, when everyone moves one step, there are more people participating in the competition than when the pedestrian moves one step with probability, and when everyone moves two steps, there are more people participating in the competition than when the pedestrian moves one or two steps with probability. The increase in competing pedestrians has a great impact on the evacuation time at a small allowable conflict coefficient, so the evacuation time increases dramatically at these perception points.
In addition, for different allowable conflict coefficients, the intersection points of the total evacuation time in the variable time step mode and in the fixed time step mode are also exactly the perception points corresponding to the speed of the pedestrian moving one grid in the fixed time step mode. For example, the variable time step mode and the fixed time step mode of 450 ms intersect at the perception of 0.1, and 350 ms intersects at 0.4, etc., which means that the ratio of the cell size (500 mm) to the velocity corresponding to the intersection is equal to the time step of the curve. Although the total evacuation time decreases slightly with the increase of perception in the variable time step mode, the number of total steps increases, and the larger the allowable conflict coefficient, the more the evacuation time decreases, the less the number of steps increases. The situation in which the time for a pedestrian to move one square is exactly equal to the time step sounds like the best simulation. However, it is found from the simulation results that the variable time step mode cannot reflect the ‘fast-is-slow’ effect, which is inconsistent with the actual experimental results [25]. Therefore, when pedestrian congestion is serious at the safety exit, using the variable time step mode cannot obtain realistic simulation results.
3.2. Evacuation Time under Different Time Step Sizes without Friction
When the allowable conflict coefficient tends to be infinity (when there is no friction), the average total evacuation time changes with the perception level, as shown in Figure 9a. Its corresponding average number of evacuation steps is shown in Figure 9b. In Figure 9a, although evacuation time changes very little as perception increases, the intersection points of the total evacuation time in the variable time step mode and in the fixed time step mode have the same x value (same perception) as the intersection point when there is friction in Figure 8. In Figure 9b, under different time step modes, as the perception increases, the evacuation step curve gradually converges to the same horizontal line. The pedestrian moves exactly one step at this convergence position. The time for a pedestrian to move one step at the speed corresponding to the x value of the convergence point of each curve is the same as the time step of the curve. That is to say, when there is no friction in pedestrian evacuation, as the perception increases, the number of evacuation steps first gradually decreases in each time step mode and then remains unchanged after the perception rises to a point at which the time for the pedestrian to move one step is equal to the time step of the curve. This is also consistent with the fact that the number of evacuation steps in the variable time step mode remains unchanged as the perception increases.
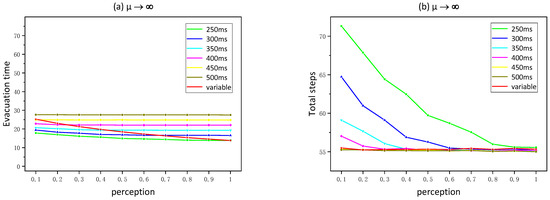
Figure 9.
Frictionless accumulation curves for (a) evacuation time and (b) total steps.
The curves of evacuation steps with different time step sizes gradually tend to have the same value as the perception increases because the exit is narrow and pedestrians are blocked at the exit, which is also what often happens when crowds of people are evacuated. When the perception is low (the speed is low), the time required for a pedestrian to move one step is greater than the time step, so the pedestrian does not meet the movement requirements at the time level, resulting in not moving. Thus, the number of evacuation steps is high. When the perception is higher (the speed is higher), the time required for the pedestrian to move one step is less than the time step, and the pedestrian meets the movement requirements at the time level. Even if a conflict occurs, since there is no friction between pedestrians, the conflict can always be resolved smoothly, and the number of evacuation steps remains unchanged as the perception continues to increase.
4. Conclusions
In this study, the aggressiveness affecting friction and selection functions during pedestrian evacuation simulations is optimised based on the pros and cons of each choice and the pedestrian’s specific circumstances. The optimised aggressiveness was applied to the model, and the changes in crowd evacuation time with perception under different allowable conflict coefficients and time step sizes were explored. Through experiments, we found the following:
- When there is friction in pedestrian evacuation for the fixed time step mode (1) no matter what the time step is, the total evacuation time always increases with the increase of the perception, showing the ‘faster is slower’ effect and the smaller allowable conflict coefficient is, the more obvious the effect is; (2) under the same conditions, the larger the time step, the larger the total evacuation time; and (3) when the friction is significantly high, the total evacuation time increases sharply when the time required for the corresponding pedestrian to move one step is an integer multiple of the time step.
- When there is no friction in pedestrian evacuation for a fixed time step mode (1) as the perception increases, the total evacuation time first decreases slightly and then remains unchanged; (2) the larger the time step, the smaller the perception when it remains unchanged and the greater the evacuation time after remaining unchanged; and (3) as the perception increases, the total number of evacuation steps gradually decreases and remains unchanged, and the larger the time step, the smaller the perception when the steps remaining unchanged.
- In the variable time step mode, when the friction between pedestrians approaches infinity (allowable conflict coefficient close to 0), the total evacuation time remains almost constant as the perception increases; when the friction between pedestrians gradually decreases (allowable conflict coefficient increases), the total evacuation time decreases slightly with the rise of perception, and the smaller the friction, the more significant the decrease.
- When pedestrian congestion is severe at the safety exit, the variable time step mode cannot obtain realistic simulation results, although it sounds like the best simulation.
In summary, under the same allowable conflict coefficient and perception, the evacuation time under different time step sizes is different; the smaller the allowable conflict coefficient, the more significant the difference in evacuation time. The simulation result also shows that when the allowable conflict coefficient and the time step are 0.4 and 450 ms, the evacuation time under high perception conditions (when perceptions are 0.7, 0.8, and 0.9) can match the evacuation time under low, medium, and high competition degrees in the actual evacuation experiment (as shown in Figure 10), which were 60.3 ± 2.71 s, 68.9 ± 4.42 s, and 74.8 ± 8.11 s, respectively [25]. This also matches the fact that in the actual experiment, the friction caused by the experimenters wearing protective vests (as shown in Figure 6) is very high (the allowable conflict coefficient is very small).
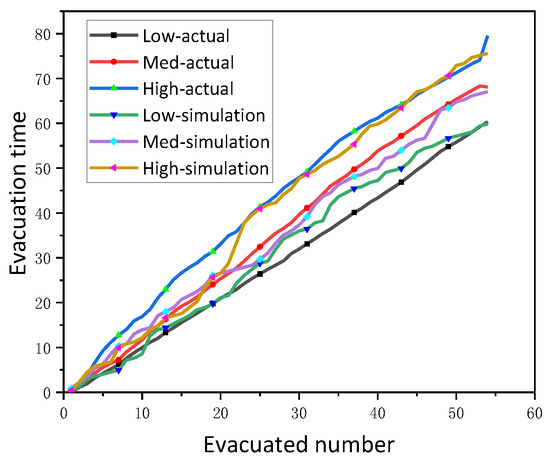
Figure 10.
Evacuation time corresponding to evacuation number of people.
Due to its advantages, the CA model has become an essential means of studying pedestrian evacuation dynamics, and the time step is one of its key elements. This paper fixed the cell size and simulated the evacuation time under different time step sizes, highlighting the strong influence of the time step size on the total evacuation time in the CA model. With a deeper understanding of the significant differences in evacuation time under different time step sizes, researchers can set the time step better when using the CA model for evacuation simulation, thereby obtaining more realistic simulation results. This will facilitate the correct assessment of building evacuation capabilities and safety, as well as personnel capacity, correctly determine evacuation routes and exit locations, help firefighters and other emergency personnel understand more realistic evacuation situations, and formulate more reasonable evacuation strategies.
Although our findings are meaningful, there are also some shortcomings. It is stipulated that pedestrian evacuation uses a specific neighbourhood rule, which may be more complex in reality, the types and attributes of pedestrians are single, only one safety exit is considered, and pedestrians will never be exhausted when evacuating. Nevertheless, we hope our work can help us understand more clearly that the time step size used in CA models strongly impacts evacuation time and should be treated carefully.
Author Contributions
Conceptualization, H.Q.; methodology, H.Q.; software, H.Q.; validation, Q.C.; formal analysis, X.L.; investigation, Q.C. and X.L.; resources, H.Q.; data curation, H.Q.; writing—original draft preparation, H.Q.; writing—review and editing, H.Q.; visualization, H.Q.; supervision, E.W.M.L.; project administration, E.W.M.L.; funding acquisition, E.W.M.L. All authors have read and agreed to the published version of the manuscript.
Funding
This research was funded by CityU of Hong Kong grant number 7005895 and the APC was funded by CityU of Hong Kong.
Institutional Review Board Statement
Not applicable.
Informed Consent Statement
Not applicable.
Data Availability Statement
The authors confirm that the data supporting the findings of this study are available within the article.
Acknowledgments
The authors are very grateful to the reviewers for their careful reading of the paper, to the editors for their help in publishing the article, and to CityU for its funding support.
Conflicts of Interest
The authors declare no conflict of interest.
References
- Benedictus, L. Hajj crush: How crowd disasters happen, and how they can be avoided. Guard. 2015, 3. [Google Scholar]
- Li, Y.; Chen, M.; Dou, Z.; Zheng, X.; Cheng, Y.; Mebarki, A. A review of cellular automata models for crowd evacuation. Phys. A Stat. Mech. Its Appl. 2019, 526, 120752. [Google Scholar] [CrossRef]
- Helbing, D.; Johansson, A.J. Pedestrian, Crowd and Evacuation Dynamics. Encycl. Complex. Syst. Sci. 2009, 7, 6476–6495. [Google Scholar]
- Tan, L.; Hu, M.; Lin, H. Agent-based simulation of building evacuation: Combining human behavior with predictable spatial accessibility in a fire emergency. Inf. Sci. 2015, 295, 53–66. [Google Scholar] [CrossRef]
- Liu, H.; Xu, B.; Lu, D.; Zhang, G. A path planning approach for crowd evacuation in buildings based on improved artificial bee colony algorithm. Appl. Soft Comput. 2018, 68, 360–376. [Google Scholar] [CrossRef]
- Henderson, L. The statistics of crowd fluids. Nature 1971, 229, 381–383. [Google Scholar] [CrossRef] [PubMed]
- Helbing, D.; Molnar, P. Social force model for pedestrian dynamics. Phys. Rev. E 1995, 51, 4282. [Google Scholar] [CrossRef]
- Liu, B.; Liu, H.; Zhang, H.; Qin, X. A social force evacuation model driven by video data. Simul. Model. Pract. Theory 2018, 84, 190–203. [Google Scholar] [CrossRef]
- Mehran, R.; Oyama, A.; Shah, M. Abnormal crowd behavior detection using social force model. In Proceedings of the 2009 IEEE Conference on Computer Vision and Pattern Recognition, Miami, FL, USA, 20–25 June 2009; pp. 935–942. [Google Scholar]
- Wolfram, S. Theory and Applications of Cellular Automata; World Scientific: Singapore, 1986. [Google Scholar]
- Nandi, S.; Kar, B.K.; Chaudhuri, P.P. Theory and Applications of Cellular Automata. IEEE Trans. Comput. 1995, 43, 1346–1357. [Google Scholar] [CrossRef]
- Schadschneider, A.; Kirchner, A.; Nishinari, K. CA approach to collective phenomena in pedestrian dynamics. In Proceedings of the International Conference on Cellular Automata, Geneva, Switzerland, 9–11 October 2002; pp. 239–248. [Google Scholar]
- Kirchner, A.; Nishinari, K.; Schadschneider, A. Friction effects and clogging in a cellular automaton model for pedestrian dynamics. Phys. Rev. E 2003, 67, 056122. [Google Scholar] [CrossRef]
- Fu, Z.; Zhan, X.; Luo, L.; Schadschneider, A.; Chen, J. Modeling fatigue of ascending stair evacuation with modified fine discrete floor field cellular automata. Phys. Lett. A 2019, 383, 1897–1906. [Google Scholar] [CrossRef]
- Huang, R.; Zhao, X.; Zhou, C.; Kong, L.; Liu, C.; Yu, Q. Static floor field construction and fine discrete cellular automaton model: Algorithms, simulations and insights. Phys. A Stat. Mech. Its Appl. 2022, 606, 128150. [Google Scholar] [CrossRef]
- Fu, Z.; Xiong, X.; Luo, L.; Yang, Y.; Feng, Y.; Chen, H. Influence of rotation on pedestrian flow considering bipedal features: Modeling using a fine discrete floor field cellular automaton. Phys. A Stat. Mech. Its Appl. 2022, 605, 128027. [Google Scholar] [CrossRef]
- Gwizdałła, T.M. Some properties of the floor field cellular automata evacuation model. Phys. A Stat. Mech. Its Appl. 2015, 419, 718–728. [Google Scholar] [CrossRef]
- Zhang, Y.; Li, W.; Rui, Y.; Wang, S.; Zhu, H.; Yan, Z. A modified cellular automaton model of pedestrian evacuation in a tunnel fire. Tunn. Undergr. Space Technol. 2022, 130, 104673. [Google Scholar] [CrossRef]
- Xie, W.; Lee, E.W.M.; Lee, Y.Y. Self-organisation phenomena in pedestrian counter flows and its modelling. Saf. Sci. 2022, 155, 105875. [Google Scholar] [CrossRef]
- Miyagawa, D.; Ichinose, G. Cellular automaton model with turning behavior in crowd evacuation. Phys. A Stat. Mech. Its Appl. 2020, 549, 124376. [Google Scholar] [CrossRef]
- Hu, M.; Cai, W.; Zhao, H. Simulation of Passenger Evacuation Process in Cruise Ships Based on A Multi-Grid Model. Symmetry 2019, 11, 1166. [Google Scholar] [CrossRef]
- Fu, Z.; Zhou, X.; Zhu, K.; Chen, Y.; Zhuang, Y.; Hu, Y.; Yang, L.; Chen, C.; Li, J. A floor field cellular automaton for crowd evacuation considering different walking abilities. Phys. A Stat. Mech. Its Appl. 2015, 420, 294–303. [Google Scholar] [CrossRef]
- Helbing, D.; Farkas, I.; Vicsek, T. Simulating dynamical features of escape panic. Nature 2000, 407, 487–490. [Google Scholar] [CrossRef]
- Hu, X.; Chen, T.; Deng, K.; Wang, G. Effects of aggressiveness on pedestrian room evacuation using extended cellular automata model. Phys. A Stat. Mech. Its Appl. 2023, 619, 128731. [Google Scholar] [CrossRef]
- Qiu, H.; Yang, X.; Chen, X.; Xiong, Y.; Ma, J.; Lin, P. How to avoid the faster-is-slower effect in competitive evacuation? J. Stat. Mech. Theory Exp. 2021, 2021, 123405. [Google Scholar] [CrossRef]
- Garcimartín, A.; Zuriguel, I.; Pastor, J.; Martín-Gómez, C.; Parisi, D. Experimental evidence of the “faster is slower” effect. Transp. Res. Procedia 2014, 2, 760–767. [Google Scholar] [CrossRef]
- Soria, S.A.; Josens, R.; Parisi, D.R. Experimental evidence of the “Faster is Slower” effect in the evacuation of ants. Saf. Sci. 2012, 50, 1584–1588. [Google Scholar] [CrossRef]
- Kirchner, A.; Klüpfel, H.; Nishinari, K.; Schadschneider, A.; Schreckenberg, M. Simulation of competitive egress behavior: Comparison with aircraft evacuation data. Phys. A Stat. Mech. Its Appl. 2003, 324, 689–697. [Google Scholar] [CrossRef]
- Wurzer, G.; Kowarik, K.; Reschreiter, H. Agent-Based Modeling and Simulation in Archaeology; Springer: Berlin/Heidelberg, Germany, 2015. [Google Scholar]
- Song, X.; Ma, L.; Ma, Y.; Yang, C.; Ji, H. Selfishness-and selflessness-based models of pedestrian room evacuation. Phys. A Stat. Mech. Its Appl. 2016, 447, 455–466. [Google Scholar] [CrossRef]
- Takahashi, T. Time-estimation error following Weber–Fechner law may explain subadditive time-discounting. Med. Hypotheses 2006, 67, 1372–1374. [Google Scholar] [CrossRef]
- Blanchard, D.C. Translating dynamic defense patterns from rodents to people. Neurosci. Biobehav. Rev. 2017, 76, 22–28. [Google Scholar] [CrossRef]
- Liu, Y.; Trueblood, J.S. The effect of preference learning on context effects in multi-alternative, multi-attribute choice. Cognition 2023, 233, 105365. [Google Scholar] [CrossRef]
- Potegal, M.; Nordman, J.C. Non-angry aggressive arousal and angriffsberietschaft: A narrative review of the phenomenology and physiology of proactive/offensive aggression motivation and escalation in people and other animals. Neurosci. Biobehav. Rev. 2023, 147, 105110. [Google Scholar] [CrossRef]
- Qiu, H.; Wang, X.; Lin, P.; Lee, E.W.M. Effects of step time and neighbourhood rules on pedestrian evacuation using an extended cellular automata model considering aggressiveness. Phys. A Stat. Mech. Its Appl. 2024, 636, 129567. [Google Scholar] [CrossRef]
- Fang, H.; Wang, Q.; Qiu, H.; Yang, C.; Lo, S. Investigation of elevator-aided evacuation strategies for older people in high-rise elderly housing. J. Build. Eng. 2023, 64, 105664. [Google Scholar] [CrossRef]
- Fang, H.; Qiu, H.; Lin, P.; Lo, S.; Lo, J. Towards a smart elevator-aided fire evacuation scheme in high-rise apartment buildings for elderly. IEEE Access 2022, 10, 90690–90705. [Google Scholar] [CrossRef]
- Huang, H.-J.; Guo, R.-Y. Static floor field and exit choice for pedestrian evacuation in rooms with internal obstacles and multiple exits. Phys. Rev. E 2008, 78, 021131. [Google Scholar] [CrossRef]
- Luo, L.; Fu, Z.; Cheng, H.; Yang, L. Update schemes of multi-velocity floor field cellular automaton for pedestrian dynamics. Phys. A Stat. Mech. Its Appl. 2018, 491, 946–963. [Google Scholar] [CrossRef]
Disclaimer/Publisher’s Note: The statements, opinions and data contained in all publications are solely those of the individual author(s) and contributor(s) and not of MDPI and/or the editor(s). MDPI and/or the editor(s) disclaim responsibility for any injury to people or property resulting from any ideas, methods, instructions or products referred to in the content. |
© 2024 by the authors. Licensee MDPI, Basel, Switzerland. This article is an open access article distributed under the terms and conditions of the Creative Commons Attribution (CC BY) license (https://creativecommons.org/licenses/by/4.0/).