Abstract
Open biomass burning has significant adverse effects on regional air quality, climate change, and human health. Extensive open biomass burning is detected in most regions of China, and capturing the characteristics of open biomass burning and understanding its influencing factors are important prerequisites for regulating open biomass burning. The characteristics of open biomass burning have been widely investigated at the national scale, with regional studies often focusing on northeast China, but few studies have examined regional discrepancies in spatiotemporal variations over a long timescale in Guangxi province. In this study, we used the Visible Infrared Imaging Radiometer Suite (VIIRS) 375 m active fire product (VNP14IMG), combined with land cover data and high-resolution remote sensing images, to extract open biomass burning (crop residue burning and forest fire) fire points in Guangxi province from 2012 to 2023. We explored the spatial density distribution and temporal variation of open biomass burning using spatial analysis methods and statistical methods, respectively. Furthermore, we analyzed the driving forces of open biomass burning in Guangxi province from natural (topography, climate, and plant schedule), policy, and social (crop production and cultural customs) perspectives. The results show that open biomass burning is concentrated in the central, eastern, and southern parts of the study area, where there are frequent agricultural activities and abundant forests. At the city level, the highest numbers of fire points were found in Baise, Yulin, Wuzhou, and Nanning. The open biomass burning fire points exhibited large annual variation, with high levels from 2013 to 2015 and a remarkable decrease from 2016 to 2020 under strict control measures; however, inconsistent enforcement led to a significant rebound in fire points from 2021 to 2023. Forest fires are the predominant type of open biomass burning in the region, with forest fires and crop residue burning accounting for 76.82% and 23.18% of the total, respectively. The peak period for crop residue burning occurs in the winter, influenced mainly by topography, planting schedules, crop production, and policies, while forest fires predominantly occur in the winter and spring, primarily influenced by topography, climate, and cultural customs. The results indicate that identifying the driving forces behind spatiotemporal variations is essential for the effective management of open biomass burning.
1. Introduction
Open biomass burning mainly refers to forest fires, grassland fires, and crop residue burning (CRB) caused by human activities or natural factors [1,2]. Open biomass burning emits large amounts of primary and secondary aerosol particulate matter, and under high humidity meteorological conditions, the pollutants emitted can easily lead to dense smog pollution in the region, reducing local visibility and affecting air quality [3,4,5,6,7]. Fine particulate matter (PM2.5) contained in the smoke from burning can trigger or exacerbate respiratory diseases such as asthma, chronic bronchitis, and lung cancer [8,9,10,11,12]. In addition, open biomass burning also emits large amounts of greenhouse gases, such as CO2 (carbon dioxide) and CH4 (methane) [13,14]. These greenhouse gases absorb long-wave radiation reflected from the Earth’s surface, leading to increased surface warming, exacerbating global warming, and negatively affecting the global hydrological cycle [15,16,17,18].
Although in recent years, relevant national authorities have increased the regulation of open biomass burning, it still remains one of the major sources of air pollution in China [19]. Conventional methods, such as manual inspection, watchtower surveillance, and aerial patrols, provide high accuracy in monitoring open biomass burning areas and the number of fire points. However, these methods are costly, slow to respond, and unable to quickly cover large areas or obtain dynamic information [20]. Since the 1980s, satellite remote sensing technology has increasingly demonstrated its advantages in global fire point monitoring due to its wide coverage, strong continuity, and high timeliness. The GOES (Geostationary Operational Environmental Satellite) series and NOAA (National Oceanic and Atmospheric Administration) series satellites are among the earliest platforms used for fire detection internationally. The VAS (Visible Atmospheric Sounder) sensor on GOES satellites has a high temporal resolution with observations every hour, which is advantageous for the dynamic monitoring of large-scale fire events. However, its spatial resolution of 14 km is less effective for monitoring smaller fires [21]. With the launch of NOAA satellites, the AVHRR (Advanced Very High Resolution Radiometer) sensor improved the spatial resolution to 1.1 km, broadening its range of applications. However, since this sensor is not specifically designed for fire detection, its lower saturation temperature makes it susceptible to misjudgments of fire points due to various influencing factors [22].
The MODIS (Moderate Resolution Imaging Spectroradiometer) sensor onboard the Terra and Aqua satellites ensures observation at least four times a day. The Terra crosses the equator at local times of 10:30 and 22:30, while the Aqua crosses the equator at local times of 1:30 and 13:30. The MODIS sensor was specifically designed for fire detection; it not only estimates burned areas but also provides real-time detection of fire locations and Fire Radiative Power (FRP). The MODIS fire products are mainly derived from the 3.9 and 11 µm channels, using a contextual algorithm based on the temperature difference between the fire site and surrounding areas. The active fires detected by MODIS have high precision and provide the longest fire records on a global scale. As a result, the fire products derived from this sensor have become mainstream data for global open biomass burning monitoring and emissions research [23,24,25]. Cui et al. analyzed the spatial and temporal variations of open straw burning based on MODIS fire spots in northeast China from 2013 to 2017 [26]. Yin et al. quantified the spatiotemporal variation and distribution characteristics of CRB in China from 2001 to 2018 using the MODIS fire product [27]. Although MODIS performs exceptionally well in monitoring large-scale thermal anomalies such as volcanoes, forest fires, and grassland fires, its relatively coarse spatial resolution (1 km) is less effective for monitoring small-scale, point-source thermal anomalies like CRB, often resulting in missed fire points [28]. The Visible Infrared Imaging Radiometer Suite (VIIRS), as the next-generation sensor replacing MODIS, retains the advantages of MODIS while addressing its shortcomings. Additionally, it improves spatial resolution to 375 m/750 m, making it more effective for detecting small-scale fire points [29]. Most existing studies have used MODIS data to analyze the spatiotemporal patterns of single types of fire points, such as CRB or forest fires, in China. Research on open biomass burning at the regional scale often focuses on provinces with dense fire points, such as northeast China. There is limited research on Guangxi province, where open biomass burning plays a significant role. Guangxi, located in south China, not only has high forest cover but also hosts many nationally protected species, making forest fire prevention very important. Additionally, Guangxi is a major agricultural production area in China, with large amounts of CRB occurring annually after the harvest of crops like rice, corn, and cane. Crop burning releases atmospheric pollutants, leading to growing concerns about air quality [30].
There are significant differences in the spatiotemporal characteristics of open biomass burning across different regions. Identifying the key factors causing these varying characteristics is crucial for the effective management of open biomass burning. Xu et al. analyzed the driving forces of open CRB in China under rural economic development, control policies, and natural conditions. [31]. Wang et al. discussed the tendency of farmers to choose meteorological conditions for biomass combustion in northeast China [32]. Most existing studies on the main factors influencing the evolution of open biomass burning characteristics are based on national-scale analyses or for a specific baseline year. However, there is limited analysis of the spatiotemporal evolution and main influencing factors of open biomass burning in Guangxi, with a lack of targeted and multi-perspective research on open biomass burning impact factors.
This study, based on VIIRS 375 m active fire products (VNP14IMG), land cover data, and high-resolution remote sensing images, extracted fire point data for Guangxi province from 2012 to 2023. It reveals the spatiotemporal evolution processes and influencing factors of two major types of open biomass burning: CRB and forest fires, providing a scientific basis for open biomass burning regulation and air quality management in Guangxi.
2. Datasets and Methodology
2.1. Study Area
We selected Guangxi province as our study area, which is located in south China. The study area is situated between latitudes 20°~27° N and longitudes 104°~113° E. Guangxi province has a total of 14 cities, with Nanning as the capital. The population density in Guangxi is higher in the central and southern regions (Figure 1). Figure 2 shows the elevation and geographical distribution of Guangxi, where the terrain is higher in the northwest and lower in the southeast, sloping from northwest to southeast. In 2023, the province had a total grain sown area of 42.52 million acres and a total output of 13.95 million tons, achieving increases in both area and yield for four consecutive years. As the largest cane planting base in China, Guangxi maintains a cane planting area of over 11 million acres, accounting for about 60% of the national total. The region not only has a high forest coverage rate of 62%, but also hosts numerous nationally protected species. Due to its abundant agricultural product yield and forest resources, Guangxi has significant potential for open biomass burning emissions. Therefore, strengthening open biomass burning monitoring in Guangxi is crucial for controlling CRB, protecting forests, and managing air pollution.
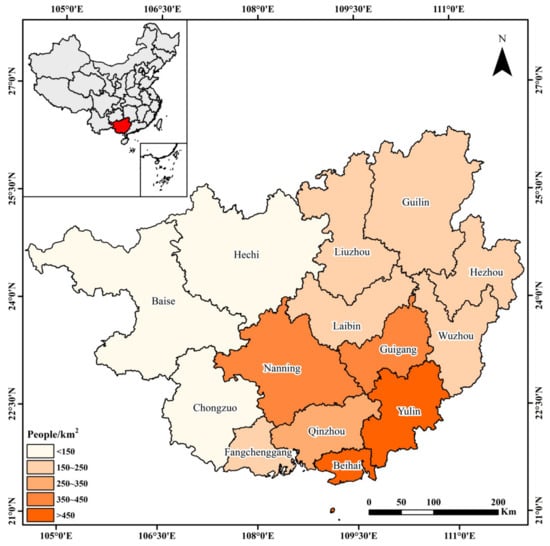
Figure 1.
Population density distribution of Guangxi Province.
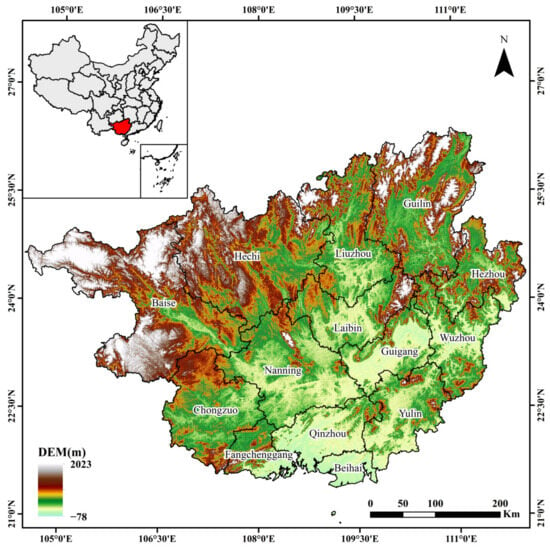
Figure 2.
Distribution of elevation and geographical location in Guangxi Province.
2.2. Fire Point
Open biomass burning fire point data for Guangxi from 2012 to 2023 is sourced from the VIIRS 375 m active fire products (VNP14IMG) (https://ladsweb.modaps.eosdis.nasa.gov/search, accessed on 14 October 2024). The VIIRS sensor was launched on the S-NPP satellite on 28 October 2011, with an orbit altitude of 829 km and a scan width of 3060 km (Figure 3). The sensor passes over twice daily (at local times 01:30 and 13:30), covering the entire globe approximately every 12 h and providing fire point information from January 2012 to the present. VIIRS has a total of 22 bands, with a spectral range from 0.412 μm to 12.01 μm. It includes 16 moderate-resolution bands (M1–M16) with a spatial resolution of 750 m, 5 multispectral bands (I1–I5) with a spatial resolution of 375 m, and 1 visible-light DNB band for low-light conditions with a spatial resolution of 750 m. The VIIRS fire detection algorithm inherits methods from MODIS, using a contextual detection algorithm to identify fire points and other thermal anomalies [33]. Due to the lower saturation temperature (367 K) and higher spatial resolution of the mid-infrared I4 channel, pixels affected by fire points are prone to saturation. Therefore, VNP14IMG combines the M13 channel, which has a higher saturation temperature (634 K) and a spatial resolution of 750 m, to jointly retrieve sub-pixel fire point parameters, including the fire point’s location, radiative power, time, and the brightness temperatures in the I4 and I5 channels. Compared with MODIS, VIIRS provides more detailed and accurate fire point information, making it highly promising for open biomass burning applications, especially in studies focused on small-scale crop fire points.
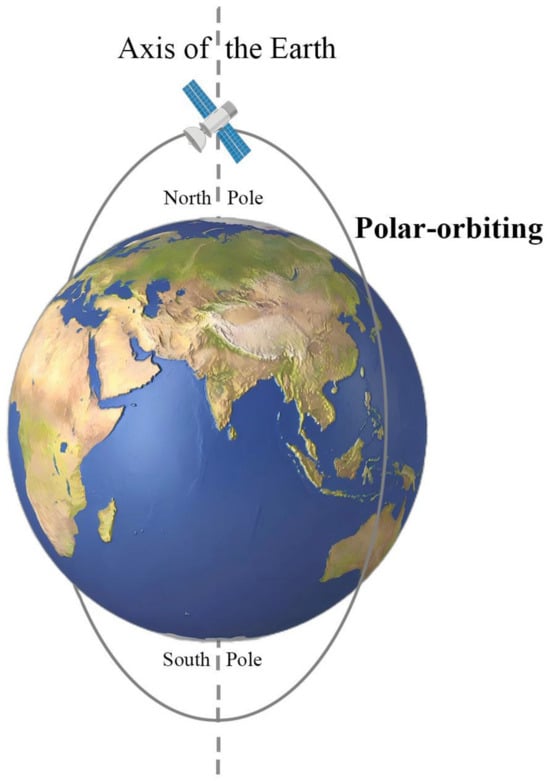
Figure 3.
S-NPP satellite orbit diagram.
2.3. Land Cover
Land cover data is sourced from GlobeLand30 (https://www.webmap.cn/commres.do?method=globeIndex, accessed on 14 October 2024), which is obtained from the U.S. Landsat and China Environmental Disaster Alleviation Satellite (HJ-1) [34]. The data has a spatial resolution of 30 m and uses the WGS-84 coordinate system. Currently, GlobeLand30 has released land cover data for the years 2000, 2010, and 2020. Among these, the accuracy of the GlobeLand30 V2010 and V2020 products reaches 83.50% and 85.72%, respectively, demonstrating the reliability of the data. This dataset provides detailed classifications of various land cover types, including cultivated land, forest, grassland, shrubland, wetland, water bodies, tundra, artificial surfaces, bareland, glaciers, and permanent snow. The corresponding codes for these categories are 10, 20, 30, 40, 50, 60, 70, 80, 90, and 100 [35]. Considering that land cover changes slowly, this study only used land cover data from 2010 and 2020 to extract fire points. Specifically, fire point data from 2012 to 2015 were overlaid onto the 2010 land cover data to extract open biomass burning fire points for that period. Similarly, fire point data from 2016 to 2023 were overlaid onto the 2020 land cover data to extract open biomass burning fire points for that period.
2.4. DEM
The Digital Elevation Model (DEM) is sourced from the Shuttle Radar Topography Mission (SRTM) and can be downloaded from the website (https://srtm.csi.cgiar.org/, accessed on 14 October 2024). These data use the WGS-84 coordinate system as the horizontal reference and the EGM-96 geoid as the vertical reference. Its absolute elevation accuracy is better than 16 m, and its relative elevation accuracy is better than 10 m. The absolute positional accuracy is better than 20 m, and the relative positional accuracy is better than 15 m. The SRTM products cover over 80% of the Earth’s surface and accurately reflect surface topography variations. In this study, fire point data is overlaid with DEM data to obtain elevation information for fire points and to understand the topographic context of their distribution.
2.5. Remote Sensing Image
This study overlays the preliminary fire point data for CRB and forest fires in Guangxi from 2012 to 2023 with high-resolution remote sensing imagery from the software LocaSpace Viewer (V4.4.6) (www.tuxingis.com/locaspace.html, accessed on 14 October 2024) and removes noise and misclassified fire points caused by errors in land cover data, resulting in more accurate fire point data. The LocaSpace Viewer remote sensing images used in this study are sourced from Tianditu, which provides high-resolution imagery that is updated in a timely manner, allowing for better identification of fire point locations, reducing misclassification, and improving research accuracy.
2.6. Meteorological
To assess the impact of meteorological conditions on forest fires in Guangxi, this study uses surface observation data provided by the China Meteorological Data Sharing Service Network (https://data.cma.cn/data/detail/dataCode/A.0012.0001.S011.html, accessed on 14 October 2024) for the years 2012–2023. This dataset has undergone rigorous quality control. The station data include daily observations of temperature, precipitation, pressure, evaporation, relative humidity, wind direction and speed, sunshine duration, and soil temperature. In this study, we focus primarily on temperature and precipitation data to analyze the impact of meteorological factors on forest fires in Guangxi. With nearly 100 meteorological stations across Guangxi, we averaged the daily mean temperature and daily total precipitation from each station for the corresponding dates to obtain the daily mean temperature and daily total precipitation for Guangxi from 2012 to 2023.
2.7. Methodology
The characteristics of open biomass burning have been widely investigated at the national scale, with regional studies often focusing on northeast China, but few studies have examined regional discrepancies in spatiotemporal variations over a long timescale in south China. Therefore, we selected Guangxi province as our study area, which is located in south China. As seen in Figure 4, this study reveals the spatiotemporal characteristics of open biomass burning in Guangxi from 2012 to 2023 by examining inter-annual variation, monthly variation, and spatial density distribution. It further explores the natural, policy, and social factors influencing open biomass burning in the region. The central and southern plains of Guangxi are predominantly covered by cropland, while the surrounding mountainous areas are mainly forested, with limited grassland (Figure 5). Therefore, this study focuses on CRB and forest fire points. The extraction process of fire points is as follows: First, we referred to the official guidance document for the fire point dataset (https://lpdaac.usgs.gov/products/vnp14v002/, accessed on 14 October 2024) and sequentially assessed the confidence value “fire mask” for each thermal anomaly point. If the “fire mask” was greater than 8, it met the confidence standard, and the fire point data was retained; if the “fire mask” was less than 8, the fire point was discarded. Then, by overlaying land cover data, land use classification codes were assigned to each fire point, with the code for cultivated land being 10 and the code for forest being 20 (https://www.webmap.cn/commres.do?method=globeDetails&type=brief, accessed on 14 October 2024). Using the land classification codes, we differentiated between the types of fire points and further filtered and statistically calculated the number of agricultural fire points and forest fire points, respectively. Finally, high-resolution remote sensing images were used to remove noise points and misclassified fire points caused by land use classification errors, including fire points located in areas such as factories, buildings, water bodies, grasslands, and bare land.
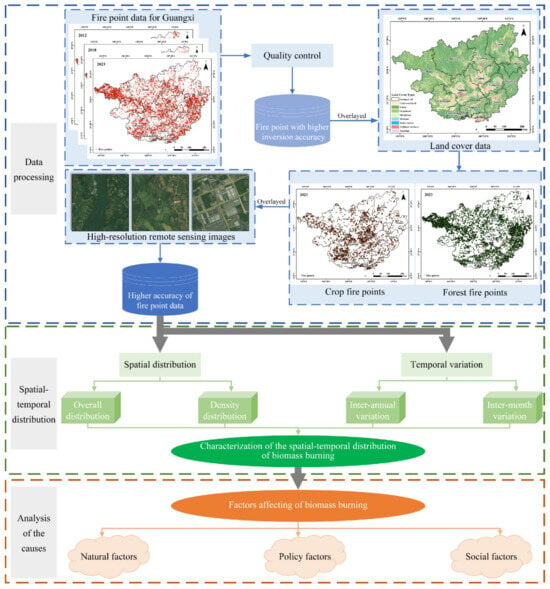
Figure 4.
Methodology of this research.
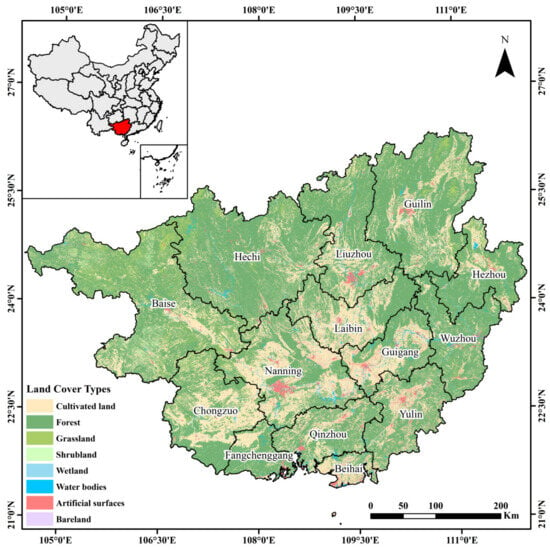
Figure 5.
Land cover in Guangxi in 2020.
3. Research Results
3.1. Spatial Distribution
3.1.1. Total Distribution
Figure 6 shows the overall distribution of CRB and forest fire points in Guangxi from 2012 to 2023. During this period, VIIRS detected approximately 125,110 open biomass burning fire points in Guangxi. The overall pattern indicates dense distribution in the central, southern, eastern, and northwestern regions of Guangxi, with fewer points in the western, northern, and northeastern regions. Fire points are mainly found in the hilly and flat areas of the central and southern regions, as well as in the mountainous areas of the eastern and northwestern regions. The central and southern regions have relatively low terrain with abundant rainfall and heat, leading to extensive cropland, where most fire points originate from CRB. In contrast, the mountainous areas in the east and northwest, characterized by high forest coverage, mainly see fire points from forest fires.
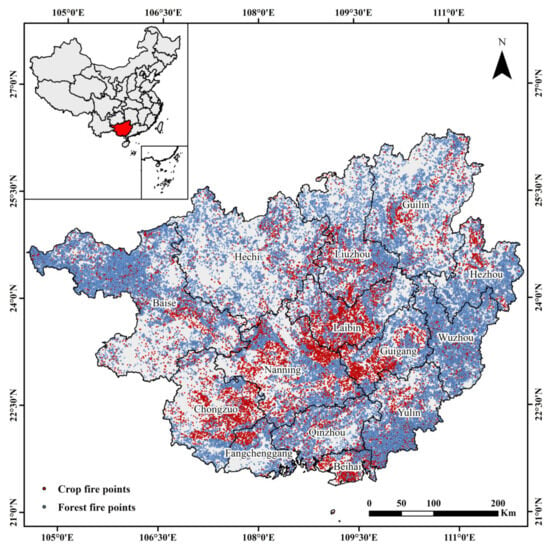
Figure 6.
Spatial distribution of open biomass burning fire points in Guangxi from 2012 to 2023.
The number of fire points in each city of Guangxi from 2012 to 2023 is summarized in Table 1, and the percentage of fire points is shown in Figure 7. The highest numbers are found in Baise, Yulin, Wuzhou, and Nanning, with 22,526, 12,531, 12,227, and 11,728 points respectively. These represent 18.00%, 10.02%, 9.77%, and 9.37% of the total fire points, all exceeding 9%. Collectively, these four regions account for over 47% of the total fire points in Guangxi, making them significant areas for open biomass burning in the region. Additionally, the proportions of open biomass burning fire points in Guilin, Hechi, Liuzhou, Laibin, Hezhou, and Guigang are 7.59%, 7.48%, 6.56%, 5.98%, 5.94%, and 5.50% respectively, each contributing between 5% and 8% to the total. Together, these six regions account for 39.05% of the region’s total fire points. In contrast, Beihai and Fangchenggang have relatively fewer fire points, with a combined total of 5598, representing 4.48% of Guangxi’s total.

Table 1.
Fire points in regions of Guangxi.
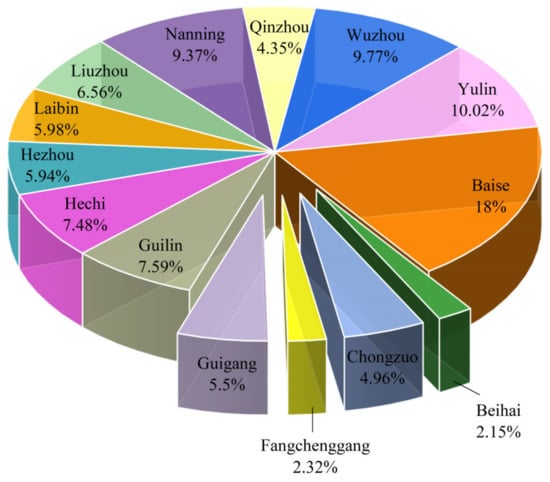
Figure 7.
Percentage of fire points in different regions of Guangxi.
3.1.2. Density Distribution
We calculated the fire point density using the point density analysis function in geographic information system (GIS) software (V3.3) (https://www.esri.com/zh-cn/arcgis/products/arcgis-pro/overview, accessed on 14 October 2024), setting the output cell size to 0.01 and the search radius to 0.1, as shown in the equation:
where E is the point density of fires; M is the number of fire points within a single grid cell; A is the area of a unit grid cell.
E = M/A
Figure 8 presents the spatial distribution of point density for crop fire points in Guangxi from 2012 to 2023. As seen in Figure 8, the hotspots of CRB are primarily located in the central and southern parts of Guangxi, such as Laibin, Guigang, Nanning, and Beihai. Compared to 2012, the number of crop fire points in the region increased by 1.74 times in 2013. In 2014, the density of crop fire points continued to rise, with the main areas of increase located in the central and southern regions of Guangxi. From 2015 to 2019, the spatial distribution range of crop fire points further contracted. Hotspot areas such as Baise and Chongzuo were better controlled, but the fire point density in Nanning, Guigang, Yulin, and Laibin showed an increasing trend compared to previous years, indicating that control measures in these areas are loose and inadequate. After 2020, the density of CRB hotspots increased, with a noticeable rise in fire points in Baise and the emergence of hotspots in Beihai. In recent years, cities such as Guigang and Yulin have not only implemented strict policies to ban CRB but have also focused on comprehensive straw utilization, achieving notable success in management. However, in some regions, limited options for comprehensive utilization and reliance solely on stringent control measures have led to a rebound in crop residue open burning.
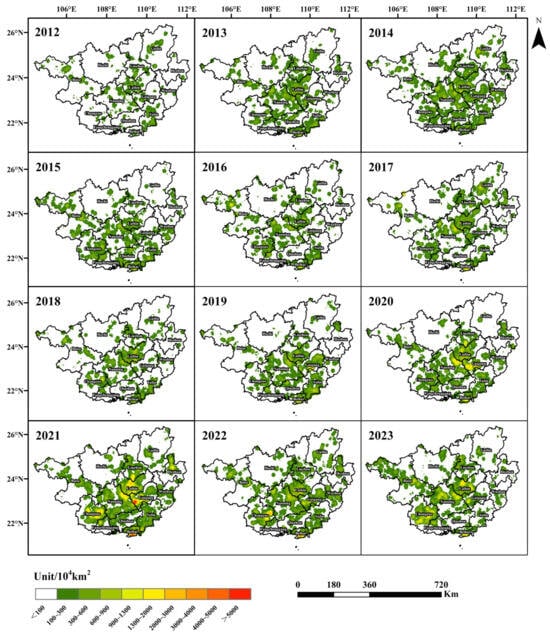
Figure 8.
Spatial distribution of crop fire point density in Guangxi from 2012 to 2023.
From 2012 to 2023, the overall density of forest fires in Guangxi was higher than that of CRB, and the hotspot areas for forest fires exhibited significant spatiotemporal differences compared to those for CRB (Figure 9). As shown in Figure 9, Guangxi has several high-intensity forest fire hotspots, mainly distributed in Baise, Wuzhou, and Yulin. In 2013, the number of forest fires in Guangxi increased significantly, up by 68.08% from the previous year. From 2015 to 2020, the density of forest fire points gradually decreased. Forest fires in Guilin, Hechi, Guigang, and Hezhou were better controlled, but Baise, Wuzhou, and Yulin remained hotspot areas. Starting in 2021, there was a significant rebound in forest fires across the region. Forest fires are influenced by both human factors and natural conditions such as temperature and precipitation. In recent years, the intensity of forest fires in Guangxi has been high. Therefore, relevant authorities need to not only strengthen patrols in forest areas but also enhance monitoring of meteorological conditions to reduce the incidence of forest fires.
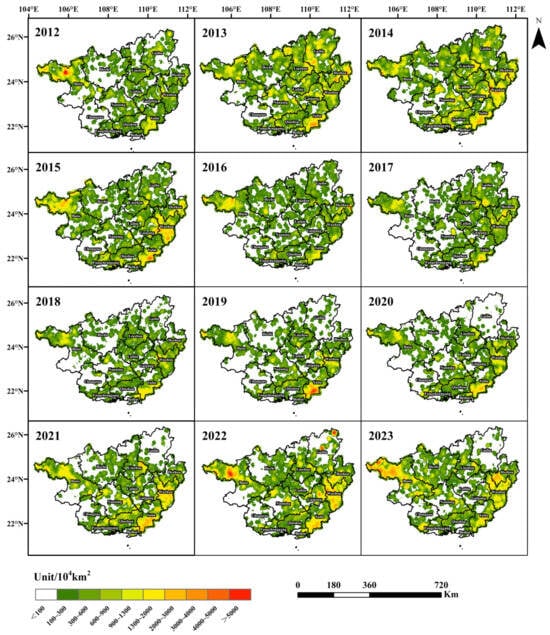
Figure 9.
Spatial distribution of forest fire point density in Guangxi from 2012 to 2023.
3.2. Temporal Variation
3.2.1. Inter-Annual Variation
The inter-annual variation of open biomass burning fire points in Guangxi from 2012 to 2023 is shown in Figure 10. From 2012 to 2023, there were a total of 125,110 fire points in Guangxi, exhibiting a trend of initially rising, then falling, and rising again. In 2012, the number of fire points was relatively low at 7734. In 2013, there was a sudden increase, with fire points rising by 68.99% compared to 2012. The number of fire points continued to rise in 2014, reaching a peak for the past 12 years at 13,793, accounting for 11.02% of the total. Since 2015, with the adoption of strict control policies, the number of fire points has gradually decreased each year. By 2018, the number of fire points had dropped to its lowest level in nearly 12 years, about 54.24% of the 2014 total. However, there was a significant rebound in 2021, indicating that fire point management is an ongoing challenge. Relevant departments need to intensify their control efforts to ensure air quality.
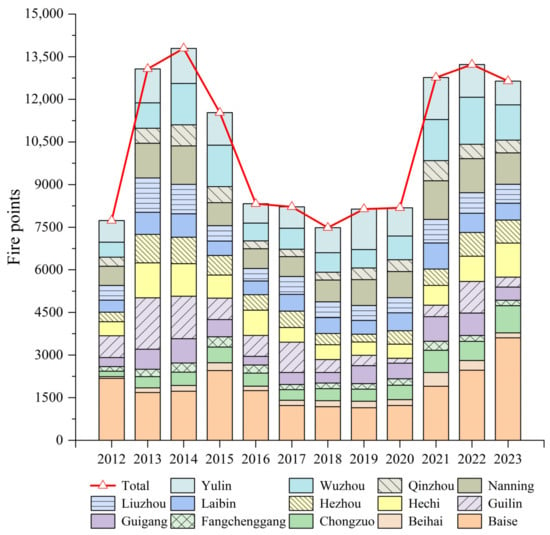
Figure 10.
Inter-annual variation of fire points in Guangxi from 2012 to 2023.
At the city level, Beihai and Fangchenggang have maintained relatively low numbers of fire points over the past 12 years, with minimal variation. The proportion of fire points in Laibin, Hezhou, Guigang, Chongzuo, and Qinzhou has consistently ranged between 4% and 6% of the total for the region. Guilin, Hechi, and Liuzhou show similar trends, peaking in 2013, starting to decline in 2014, but experiencing a rebound in the past three years. In 2013, fire points in Yulin, Wuzhou, and Nanning rose sharply, with average numbers reaching 1155, 1447, and 1222, respectively, over the past three years. This may suggest a relaxation of open biomass burning control policies or may be related to factors such as higher crop yields, high temperatures, and lower rainfall in these three cities. Baise has maintained a high level of fire points over the past 12 years, consistently ranking first among all cities each year and accounting for 18.00% of the total fire points in the region.
Figure 11 illustrates the inter-annual variations in the number of CRB and forest fire points, as well as the corresponding Fire Radiative Power (FRP). From 2012 to 2023, Guangxi had 28,999 crop fire points, which accounts for a relatively small proportion of 23.18% of the total open biomass burning. The number of crop fire points was relatively high in 2014 and 2020, while in other years it remained below 2200. In 2021, the number of fire points peaked over the past 12 years, primarily due to meteorological conditions: higher average temperatures and lower rainfall in January and February 2021 favored CRB by farmers. Additionally, policy control played a role: in 2020, as the final year for air pollution prevention efforts, strict CRB bans were implemented at the end of the year, leading farmers to burn the accumulated straw at the beginning of 2021. Although the number of fire points decreased in 2022 and 2023 compared to 2021, it still remained around 3000, indicating that further control measures are needed.
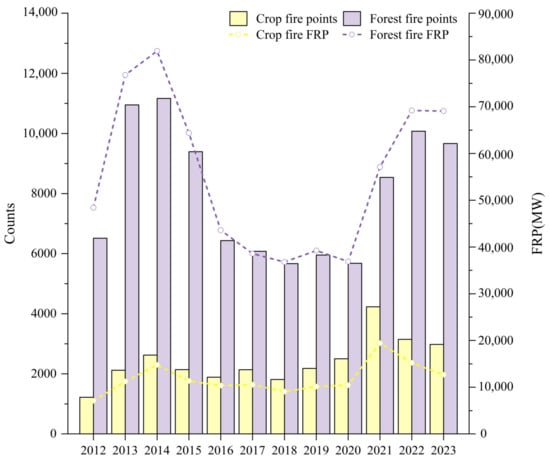
Figure 11.
The number of fire points in Guangxi from 2012 to 2023 and their corresponding FRP.
From 2012 to 2023, Guangxi recorded 96,111 forest fire points, accounting for 76.82% of the total, making forest fires the predominant type of open biomass burning in the region. The number of forest fire points peaked in 2014 and began to decline in 2015. From 2016 to 2020, the number of fire points remained relatively stable at around 6000. In 2021, there was a rebound, with the number of fire points being 1.5 times that of 2020. Over the past three years, forest fire numbers have remained high. Forest fires are significantly influenced by meteorological factors such as temperature and precipitation, and improper human use of fire can also increase the risk of forest fires.
The FRP parameter represents the intensity of fire point combustion. From 2012 to 2023, the FRP for both CRB and forest fire points showed an initial increase, followed by a decrease, and then another increase, mirroring the inter-annual trends in the number of these fire points. FRP is influenced by both the number of fire points and their combustion intensity. Generally, the more fire points there are, the higher the FRP. During this period, the number of forest fires was significantly higher than that of crop fires, and the FRP for forest fires was also notably greater than for CRB. It can be observed that although the number of crop fire points in 2020 was higher than in 2013 and 2017, the FRP for 2013 and 2017 was higher than in 2020, primarily due to the influence of combustion intensity on FRP.
3.2.2. Inter-Month Variation
As shown in Figure 12, the peak period for CRB in Guangxi is primarily concentrated in winter (December to February), with a total of 15,412 fire points, accounting for 53.15% of all fire points. February is the peak month, with 5854 fire points, making up 20.19% of the total. There are also smaller peaks in CRB during spring (March to May) and autumn (September to November). This is mainly because October and November are the harvest periods for late rice and late corn, while December to March is the cane crushing season. The harvests produce large amounts of straw, and the warm, dry conditions in Guangxi during this period are favorable for burning [36]. Additionally, to prepare for the next planting season, farmers often burn leftover straw in the fields during the following spring, leading to an increase in fire points in March and April. According to meteorological data, in the winter of 2021, Guangxi experienced higher temperatures and lower rainfall, with severe meteorological drought affecting most areas. These favorable conditions increased the likelihood of straw burning, making February of that year the peak period for CRB in the past 12 years.
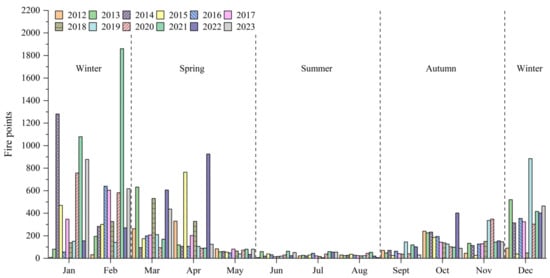
Figure 12.
Inter-month changes of crop fire points in Guangxi from 2012 to 2023.
The timing of forest fires in Guangxi is similar to that of CRB, with both exhibiting distinct seasonal patterns. However, the number of forest fires is significantly higher than that of crop fire points, being 3.31 times greater. This indicates that forest fires are the primary type of open biomass burning in Guangxi (Figure 13). Forest fires are primarily concentrated in winter and spring, with 42,128 and 28,982 fire points, respectively, accounting for 43.83% and 30.15% of the total. Autumn follows with 20,066 fire points, representing 20.88% of the total. Summer has a relatively lower number of forest fires, with 4935 fire points, making up only 5.13% of the total. This seasonal distribution pattern is primarily due to the warm and dry weather in Guangxi during autumn and winter, which makes dried branches and leaves more susceptible to ignition. Additionally, frequent strong winds facilitate the spread of forest fires. In spring, rising temperatures and increased human activities, such as outdoor excursions and Qingming Festival rituals, further heighten the risk of forest fires [37,38].
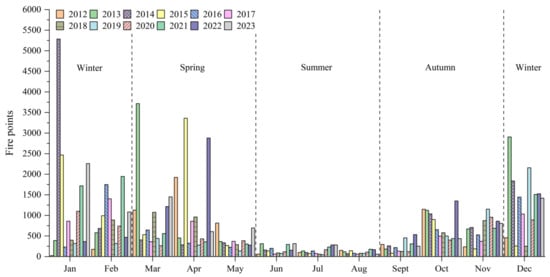
Figure 13.
Inter-month changes of forest fire points in Guangxi from 2012 to 2023.
3.3. Spatial and Temporal Variations of Driving Forces
3.3.1. Natural Factors
- (1)
- Topography
Figure 14 shows the distribution of open biomass burning fire points across different topographies in Guangxi from 2012 to 2023. As depicted in Figure 14, the types and quantities of open biomass burning fire points vary significantly under different topographical conditions. Among them, plains with an elevation of less than 200 m have the highest number of open biomass burning fire points, accounting for 41.56% of the total. In hilly areas with elevations between 200 and 500 m, the number of open biomass burning fire points is still considerable, making up 33.85% of the total. In low mountainous areas with elevations between 500 and 1000 m, the number of open biomass burning fire points decreases, accounting for 19.74% of the total. In mid-mountain areas with elevations between 1000 and 1500 m and above 1500 m, the number of open biomass burning fire points is relatively low, totaling only 4.85% of the overall fire points in the region.
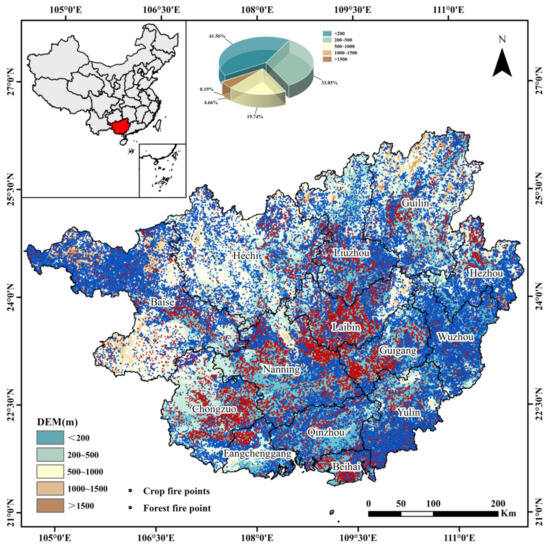
Figure 14.
Distribution of open biomass burning fire points in different topographies in Guangxi from 2012 to 2023.
Thus, open biomass burning fire points in Guangxi are primarily concentrated in low-altitude plains and hilly areas, with fewer in low mountain regions and even fewer in mid-mountain areas. High-altitude regions are less suitable for farming due to cold climates, rugged terrain, and severe soil erosion, which directly affects the distribution of CRB fire points. In contrast, plain areas have a mild climate, flat terrain, and extensive farmland, making them suitable for growing crops like rice and cane. This results in higher straw production and consequently a denser distribution of fire points. Additionally, Guangxi’s many mountains and hills, along with its rich water and heat resources, provide excellent natural conditions for the growth of fruit trees such as citrus and forests. This leads to a higher number of forest fire points in the low mountain and hilly areas.
- (2)
- Climate
This study averaged the daily mean temperatures for Guangxi from 2012 to 2023 based on the corresponding dates to obtain the daily mean temperatures over the past 12 years. Using this baseline, the daily mean temperatures for each year were compared to the 12-year average to record the average number of consecutive days exceeding this average temperature. For precipitation, the study recorded the average number of consecutive days with light rain (daily accumulated precipitation ≤10 mm). To clarify the impact of temperature and precipitation on the occurrence of forest fires in Guangxi, we calculated the correlation between forest fire points and the average number of consecutive days with temperatures above the mean, as well as the average number of consecutive days with light rain from 2012 to 2023, as shown in Figure 15.
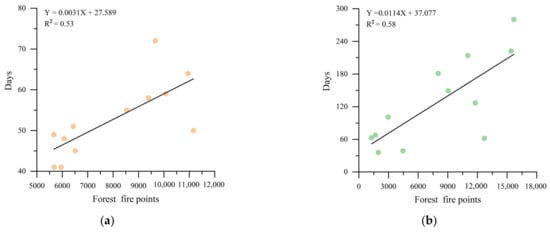
Figure 15.
(a) Correlation between annual forest fire points and the average number of consecutive days with temperatures above the mean during 2012–2023; (b) Correlation between monthly forest fire points and the average number of consecutive days with light rain during 2012–2023.
The correlation between annual forest fire points and the average number of consecutive days with temperatures above the mean is relatively strong, with a coefficient determination (R2) value of 0.53, indicating that prolonged high temperatures increase the risk of forest fires. The correlation between monthly forest fire points and the average number of consecutive days with light rain has an R2 value of 0.58, showing a high correlation. From October to March of the following year is the dry season in Guangxi, when forest vegetation is dry and highly flammable. Besides temperature and precipitation, factors such as wind direction and speed, as well as extreme weather conditions like thunderstorms and tropical cyclones, are also significant influences on forest fires [39,40]. Although there is a high correlation between forest fires and temperature and precipitation, this relationship is limited by the impact of other meteorological factors. In summary, the study underscores the substantial impact of temperature and precipitation on forest fires in Guangxi and further indicates that relevant authorities need to enhance monitoring of various weather conditions to improve forest fire prevention.
- (3)
- Planting schedule
To facilitate the planting of the next crop season, farmers typically use open burning to clear abandoned straw from fields. This practice mainly occurs before planting and after harvest. Consequently, the peak periods of crop residue open burning are generally related to the crop planting schedule and farmers’ cultivation practices. The planting and harvesting times of major crops are based on literature and online resources, as shown in Figure 16.
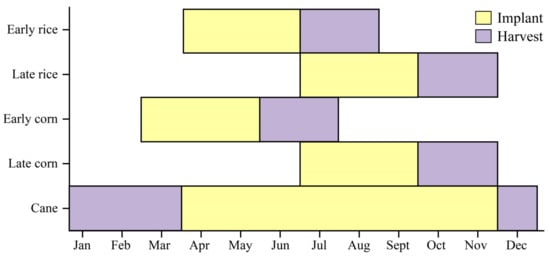
Figure 16.
Planting and harvesting time of major crops in Guangxi.
Guangxi has a relatively high annual average temperature, which is suitable for crop growth. From March to April, the primary crops are early rice, early corn, and cane, while late rice and late corn are mainly planted in June and July. CRB in this region mainly occurs in winter and spring, coinciding with the cane processing season (December to March). Additionally, to facilitate planting for the next season, farmers typically burn straw in the fields during the spring, leading to an increase in fire points from March to April [41]. Autumn also sees a small peak in straw burning, primarily because October and November are the harvest periods for late rice and late corn, resulting in a large amount of straw. From June to August, early rice and early corn are harvested, but summer in Guangxi is often rainy, making CRB difficult. Therefore, farmers typically burn accumulated straw during the dry autumn and winter seasons or before spring planting, leading to a higher number of fire points during these periods. Thus, the timing characteristics of crop residue open burning in Guangxi align with the region’s crop planting schedule and farming practices.
3.3.2. Policy Factors
Since 2013, both national and Guangxi government departments have introduced a series of policies banning straw burning [42]. Under strict control measures, the amount of crop residue open burning across the region began to decrease after 2014 and remained relatively low between 2015 and 2020, demonstrating significant effectiveness in controlling straw burning. Recognizing the challenges of achieving comprehensive straw utilization and the difficulty of completely changing farmers’ practices in the short term, Guangxi proposed a management model that combines bans with controlled burning, this model involves organizing regionally and temporally phased straw burning during brief periods when atmospheric dispersion conditions improve [43].
In addition, Guangxi has reduced crop residue open burning by actively introducing straw utilization enterprises, establishing straw collection centers, and implementing incentive policies. However, inconsistent enforcement has led to off-peak burning, resulting in a severe rebound in straw burning from 2021 to 2023. Therefore, while developing reasonable straw burning ban policies, relevant departments also need to enhance the supervision of policy implementation. Additionally, increasing environmental awareness among farmers is crucial for fundamentally addressing the issue of CRB.
3.3.3. Social Factors
- (1)
- Crop production
The production of crops reflects the amount of straw available in different regions. Therefore, areas with higher crop production are likely to have more straw burning. This study calculated the correlation between the number of crop fire points and crop production (including food crops and cane) for 14 cities in Guangxi from 2012 to 2022, as shown in Figure 17a. The results indicate that the correlation between crop fire points and crop production is low, with an R2 value of only 0.35. Chongzuo as China’s largest cane planting base, has an annual cane production of 24.7 million tons. However, due to strict straw burning bans and comprehensive utilization policies, the number of crop fire points in the city remains consistently low, with an annual average of only 224. To better understand the impact of crop production on CRB in Guangxi, this study excluded Chongzuo, which is heavily influenced by policy factors, and calculated the correlation between crop fire points and crop production in the remaining 13 cities. As shown in Figure 17b, a strong correlation is observed, with an R2 value of 0.63.
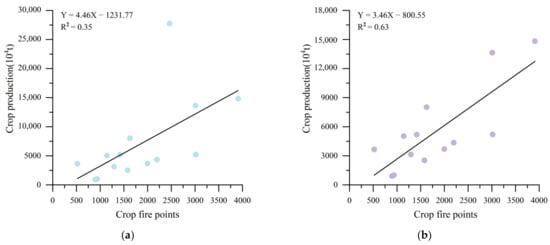
Figure 17.
Correlation between crop fire points and crop production during 2012–2023: (a) The data include Chongzuo; (b) The data exclude Chongzuo.
It is clear that regions with higher crop production also experience more severe straw burning. Therefore, while increasing crop yields in these areas, more attention should be given to the management of crop straw. Additionally, the situation in Chongzuo demonstrates the significant impact of policy factors on regional CRB. Developing appropriate straw burning bans and comprehensive utilization policies is crucial for stabilizing crop production and controlling open biomass burning.
- (2)
- Cultural customs
The cultural customs affecting open biomass burning in Guangxi mainly include human activities such as rituals and outings during festivals like the Spring Festival and Qingming. These activities increase the use of fire, thereby raising the likelihood of forest fires, which is consistent with the high incidence of forest fires in Guangxi from February to April [44]. The Spring Festival and Qingming are significant festivals in China, and it is understandable that people use traditional methods to celebrate these occasions. However, to reduce the risk of forest fires, people could consider safer and more environmentally friendly activities, such as music and flower festivals.
With the rise in temperatures during spring, people often choose to go out for outings and picnics, leading to an increased frequency of human-made fires during this time. However, in the dry spring season, activities such as using open flames for outdoor cooking, barbecuing, or discarding unextinguished cigarette butts can easily trigger fires. Moreover, flammable dry branches and leaves are common in forests during spring, and once they come into contact with a fire source, flames can spread rapidly. Therefore, effective fire prevention measures should be taken during spring outings, and outdoor cooking should be conducted as much as possible in designated areas. Additionally, during peak travel periods, relevant authorities should enhance fire management in forest and cemetery areas.
4. Conclusions
In this study, we analyzed the spatial density distribution, inter-annual, and inter-monthly variation trends of CRB and forest fires in Guangxi from 2012 to 2023 using VIIRS 375 m active fire products (VNP14IMG). To address the unclear factors influencing open biomass burning, we conducted a detailed analysis of the causes of open biomass burning from natural, policy, and social aspects.
Biomass burning is primarily concentrated in the hilly and plain areas of the central and southern parts of the study area, as well as in the mountainous regions of the east and northwest. At the city level, the highest number of fire points was found in Baise, Yulin, Wuzhou, and Nanning. From 2013 to 2015, fire points were at a high level, but under strict control policies, they stabilized at a lower level from 2016 to 2020. However, inconsistent enforcement led to off-peak burning, resulting in a significant rebound of fire points from 2021 to 2023. Forest fires are the predominant type of open biomass burning in the region, with forest fires and CRB accounting for 76.82% and 23.18% of the total, respectively. The peak period for CRB occurs in winter and is mainly influenced by topography, planting schedules, crop production, and policies. Forest fires predominantly occur in winter and spring, influenced mainly by topography, climate, and cultural customs.
In summary, this study analyzed the spatiotemporal patterns and influencing factors of open biomass burning in Guangxi based on VIIRS data, providing long-term data support for formulating pollution prevention policies for open burning activities in Guangxi. However, there are still some limitations that need to be addressed. Due to the lack of annual land cover data for Guangxi, this study used land cover data only from 2010 and 2020. The limited data available for extracting CRB and forest fire points introduces certain uncertainties into the results. Therefore, future research should obtain more accurate and comprehensive data for the study area to improve the reliability of the results. Moreover, the VIIRS 375 m active fire products (VNP14IMG) used in this study are affected by factors such as satellite retrieval accuracy, cloud cover, and overpass times, which add further uncertainty. Although the VIIRS fire detection algorithm has been highly effective in identifying open biomass burning points, it still cannot meet real-time monitoring requirements, as the VIIRS sensor only passes over twice a day. Some farmers have learned the satellite’s overpass times and choose to burn crop residues at other times to avoid detection, posing new challenges for enforcing crop residue burning bans. Therefore, in future work, multisource satellite data should be integrated to enable continuous long-term monitoring of open biomass burning and enhance control measures. Additionally, the factors influencing open biomass burning are diverse, and using quantitative methods can more clearly define the impact of each factor on open biomass burning. Accurate data on the factors influencing open biomass burning can be obtained from laboratory measurements or data analysis. Future studies should explore factors not covered in this research and attempt to quantify their various influences on open biomass burning. Based on the spatiotemporal evolution characteristics of open biomass burning analyzed in this study, we will attempt to establish a pollutant emission inventory for open biomass burning in Guangxi Province in the future, providing a foundation for the formulation of emission reduction policies and air quality simulations in the region.
Author Contributions
Conceptualization, X.H. and Q.H.; methodology, X.H. and Q.H.; software, D.Y.; validation, Y.Y., G.X., S.Y. and C.L.; formal analysis, Z.Q.; investigation, X.H.; resources, Q.H.; data curation, D.Y.; writing—original draft preparation, X.H.; writing—review and editing, Q.H.; visualization, X.H.; supervision, Q.H.; project administration, D.Y.; funding acquisition, Q.H. All authors have read and agreed to the published version of the manuscript.
Funding
This research was funded by the Guangxi Science and Technology Major Program (Grant NO. AA22036002), Fundamental Research Fund of Guangxi Academy of Agricultural Sciences (Grant NO. 2021YT81 and Grant NO. 2019M22), and Science and Technology Development Fund of Guangxi Academy of Agricultural Sciences (Grant NO. 2021JM16).
Data Availability Statement
No new data were created or analyzed in this study. Data sharing is not applicable to this article.
Conflicts of Interest
The authors declare no conflicts of interest.
References
- Streets, D.G.; Yarber, K.F.; Woo, J.H. Biomass burning in Asia: Annual and seasonal estimates and atmospheric emissions. Glob. Biogeochem. Cycles 2003, 17, 1–20. [Google Scholar] [CrossRef]
- Levine, J.S.; Cofer, W.R.; Cahoon, D.R. A driver for global change. Environ. Sci. Technol. 1995, 29, 120–125. [Google Scholar] [CrossRef]
- Van der Werf, G.R.; Randerson, J.T.; Giglio, L. Global fire emissions and the contribution of deforestation, savanna, forest, agricultural, and peat fires (1997–2009). Atmos. Chem. Phys. 2010, 10, 11707–11735. [Google Scholar] [CrossRef]
- Chen, J.; Li, C.; Ristovski, Z. A review of biomass burning: Emissions and impacts on air quality, health and climate in China. Sci. Total Environ. 2016, 579, 1000–1034. [Google Scholar] [CrossRef] [PubMed]
- Ravindra, K.; Singh, T.; Singh, V. Understanding the influence of summer biomass burning on air quality in North India: Eight cities field campaign study. Sci. Total Environ. 2023, 861, 160361. [Google Scholar] [CrossRef]
- Wang, L.; Xin, J.; Li, X. The variability of biomass burning and its influence on regional aerosol properties during the wheat harvest season in North China. Atmos. Res. 2015, 157, 153–163. [Google Scholar] [CrossRef]
- Krecl, P.; Targino, A.C.; Lara, C. Detecting local and regional air pollution from biomass burning at a suburban site. Atmos. Environ. 2023, 297, 119591. [Google Scholar] [CrossRef]
- Pope, C.A.; Dockery, D.W. Health effects of fine particulate air pollution: Lines that connect. J. Air Waste Manag. Assoc. 2006, 56, 709–742. [Google Scholar] [CrossRef]
- Amnuaylojaroen, T.; Parasin, N. Perspective on particulate matter: From biomass burning to the health crisis in mainland southeast Asia. Toxics 2023, 11, 553. [Google Scholar] [CrossRef]
- Li, C.; Hu, Y.; Zhang, F. Multi-pollutant emissions from the burning of major agricultural residues in China and the related health-economic effects. Atmos. Chem. Phys. 2017, 17, 4957–4988. [Google Scholar] [CrossRef]
- Huang, L.; Zhu, Y.; Liu, H. Assessing the contribution of open crop straw burning to ground-level ozone and associated health impacts in China and the effectiveness of straw burning bans. Environ. Int. 2023, 171, 107710. [Google Scholar] [CrossRef] [PubMed]
- Lv, Q.; Yang, Z.; Chen, Z. Crop residue burning in China (2019–2021): Spatiotemporal patterns, environmental impact, and emission dynamics. Environ. Sci. Ecotechnol. 2024, 21, 100394. [Google Scholar] [CrossRef] [PubMed]
- Zhou, Z.; Ge, Y.; Zhang, X. Total atmospheric carbon detection by LIBS with multivariate physicochemical model based on transition and collision mechanism. Spectrochim. Acta Part B At. Spectrosc. 2024, 220, 107018. [Google Scholar] [CrossRef]
- Griffin, D.; Chen, J.; Anderson, K. Biomass burning CO emissions: Exploring insights through TROPOMI-derived emissions and emission coefficients. Atmos. Chem. Phys. 2024, 24, 10159–10186. [Google Scholar] [CrossRef]
- Koppmann, R.; Von Czapiewski, K.; Reid, J.S. A review of biomass burning emissions, part I: Gaseous emissions of carbon monoxide, methane, volatile organic compounds, and nitrogen containing compounds. Atmos. Chem. Phys. 2005, 5, 10455–10516. [Google Scholar]
- Jiang, K.; Xing, R.; Luo, Z. Pollutant emissions from biomass burning: A review on emission characteristics, environmental impacts, and research perspectives. Particuology 2024, 85, 296–309. [Google Scholar] [CrossRef]
- Andreae, M.O. Biomass burning–its history, use, and distribution and its impact on environmental-quality and global climate. In Global Biomass Burning: Atmospheric, Climatic, and Biospheric Implications; MIT Press: Cambridge, MA, USA, 1991; Volume 1, pp. 3–21. [Google Scholar]
- Xiao, Y.N.; Xiao, H.W.; Sun, Q.B. Enhanced aerosols over the southeastern Tibetan Plateau induced by open biomass burning in spring 2020. Sci. Total Environ. 2023, 867, 161509. [Google Scholar] [CrossRef]
- Liu, Y.; Zhao, H.; Zhao, G. Carbonaceous gas and aerosol emissions from biomass burning in China from 2012 to 2021. J. Clean. Prod. 2022, 362, 132–199. [Google Scholar] [CrossRef]
- Li, L.; Zhao, Q.; Zhang, J. Bottom-up emission inventories of multiple air pollutants from open straw burning: A case study of Jiangsu province, Eastern China. Atmos. Pollut. Res. 2019, 10, 501–507. [Google Scholar] [CrossRef]
- Prins, E.M.; Menzel, W.P. Trends in South American biomass burning detected with the GOES visible infrared spin scan radiometer atmospheric sounder from 1983 to 1991. J. Geophys. Res. Atmos. 1994, 99, 16719–16735. [Google Scholar]
- Pu, R.; Li, Z.Q.; Gong, P. Development and analysis of a 12-year daily 1-km forest fire dataset across North America from NOAA/AVHRR data. Remote Sens. Environ. 2007, 2, 198–208. [Google Scholar] [CrossRef]
- Giglio, L.; Descloitres, J.; Justice, C.O. An Enhanced Contextual Fire Detection Algorithm for MODIS. Remote Sens. Environ. 2003, 87, 273–282. [Google Scholar] [CrossRef]
- Giglio, L. MODIS Collection 6 Active Fire Product User’s Guide, Revision A. Univ. Md. 2015, 9, 1–63. [Google Scholar]
- Molinario, G.; Davies, D.K.; Schroeder, W. Characterizing the spatio-temporal fire regime in Ethiopia using the MODIS-active fire product: A replicable methodology for country-level fire reporting. Afr. Geogr. Rev. 2014, 33, 99–123. [Google Scholar] [CrossRef]
- Cui, S.; Song, Z.; Zhang, L. Spatial and temporal variations of open straw burning based on fire spots in northeast China from 2013 to 2017. Atmos. Environ. 2021, 244, 117962. [Google Scholar] [CrossRef]
- Yin, S.; Guo, M.; Wang, X. Spatiotemporal variation and distribution characteristics of crop residue burning in China from 2001 to 2018. Environ. Pollut. 2021, 268, 115849. [Google Scholar] [CrossRef]
- Roberts, G.; Wooster, M.J.; Xu, W. LSA SAF Meteosat FRP products—Part 2: Evaluation and demonstration for use in the Copernicus Atmosphere Monitoring Service (CAMS). Atmos. Chem. Phys. 2015, 15, 15000–15976. [Google Scholar] [CrossRef]
- Zhang, T.R.; Wooster, M.J.; Xu, W. Approaches for synergistically exploiting VIIRS I-and M-Band data in regional active fire detection and FRP assessment: A demonstration with respect to agricultural residue burning in Eastern China. Remote Sens. Environ. 2017, 198, 407–424. [Google Scholar] [CrossRef]
- Pan, R.X.; Huang, Y.Y.; He, L.H. Evaluation of Emissions from Open Crop Residue Burning in Guangxi (2017-2021) Based on Fire Radiative Energy Data. Environ. Monit. China 2023, 39, 227–235. (In Chinese) [Google Scholar]
- Xu, Y.; Huang, Z.; Jia, G. Regional discrepancies in spatiotemporal variations and driving forces of open crop residue burning emissions in China. Sci. Total Environ. 2019, 671, 536–547. [Google Scholar] [CrossRef]
- Wang, Y.; Liang, L.; Xu, W. Influence of meteorological factors on open biomass burning at a background site in Northeast China. J. Environ. Sci. 2024, 138, 1–9. [Google Scholar] [CrossRef] [PubMed]
- Schroeder, W.; Oliva, P.; Giglio, L. The New VIIRS 375 m active fire detection data product: Algorithm description and initial assessment. Remote Sens. Environ. 2014, 143, 85–96. [Google Scholar] [CrossRef]
- Guo, J.L.; Chen, W.R.; Wang, Z.G. China’s Environment-1A and 1B satellites were successfully launched. Space Int. 2008, 10, 1–7. (In Chinese) [Google Scholar]
- Chen, J.; Ban, Y.F.; Li, S. Open access to Earth land-cover map. Nature 2015, 514, 434. [Google Scholar]
- Liu, H.L.; Mo, Z.Y.; Qin, W. Emission inventory and the spatio-temporal distribution of pollutant from open field straw burning in Guangxi. Environ. Pollut. Control 2022, 44, 631–638. (In Chinese) [Google Scholar]
- Wei, X.; Wang, G.; Chen, T. A spatio-temporal analysis of active fires over China during 2003–2016. Remote Sens. 2020, 12, 1787. [Google Scholar] [CrossRef]
- Tian, Y.; Wu, Z.; Bian, S. Study on spatial-distribution characteristics based on fire-spot data in northern China. Sustainability 2022, 14, 6872. [Google Scholar] [CrossRef]
- Lian, C.; Xiao, C.; Feng, Z. Spatiotemporal characteristics and regional variations of active fires in China since 2001. Remote Sens. 2022, 15, 54. [Google Scholar] [CrossRef]
- Dong, B.; Li, H.; Xu, J. Spatiotemporal Analysis of Forest Fires in China from 2012 to 2021 Based on Visible Infrared Imaging Radiometer Suite (VIIRS) Active Fires. Sustainability 2023, 15, 9532. [Google Scholar] [CrossRef]
- Luo, Y.R.; Wei, J.Y.; Guo, S.J. Emission of air pollutants from straw burning and estimation of carbon sequestration from biochar transformation in Guangxi. Environ. Pollut. Control 2022, 44, 993–1000. (In Chinese) [Google Scholar]
- Qin, C.; Bi, Y.Y.; Gao, C.Y. Management and effect of straw burning prohibition in China. J. China Agric. Univ. 2019, 24, 181–189. (In Chinese) [Google Scholar]
- Su, Y.Y.; Lan, H.Y.; Wu, Z.B. Current situation and countermeasures of comprehensive utilization of crop straw in Guangxi. Agric. Technol. Serv. 2024, 41, 98–102. (In Chinese) [Google Scholar]
- He, Y. Analysis on temporal and spatial distribution of forest fire causes in Guangxi. South China Agric. 2022, 16, 207–209. (In Chinese) [Google Scholar]
Disclaimer/Publisher’s Note: The statements, opinions and data contained in all publications are solely those of the individual author(s) and contributor(s) and not of MDPI and/or the editor(s). MDPI and/or the editor(s) disclaim responsibility for any injury to people or property resulting from any ideas, methods, instructions or products referred to in the content. |
© 2024 by the authors. Licensee MDPI, Basel, Switzerland. This article is an open access article distributed under the terms and conditions of the Creative Commons Attribution (CC BY) license (https://creativecommons.org/licenses/by/4.0/).