Article

RANS Simulation of Minimum Ignition Energy of Stoichiometric and Leaner CH4/Air Mixtures at Higher Pressures in Quiescent Conditions

by
Sooraj Paleli Vasudevan
and
Siva P. R. Muppala
*
Department of Mechanical Engineering, Faculty of Engineering, Computing, and the Environment, Kingston University London, Roehampton Vale, Friars Avenue, London SW15 3DW, UK
*
Author to whom correspondence should be addressed.
Fire 2024, 7(10), 366; https://doi.org/10.3390/fire7100366
Submission received: 6 September 2024 / Revised: 9 October 2024 / Accepted: 10 October 2024 / Published: 15 October 2024
(This article belongs to the Special Issue Turbulent Combustion and Fire Radiation Modelling)

Abstract

:
Minimum ignition energy (MIE) has been extensively studied via experiments and simulations. However, our literature review reveals little quantitative consistency, with results varying from 0.324 to 1.349 mJ for ϕ = 1.0 and from 0.22 to 0.944 mJ for ϕ = 0.9. Therefore, there is a need to resolve these discrepancies. This RANS study aims to partially address this knowledge gap. Additionally, it presents other flame evolution parameters essential for robust combustion design. Using the reactingFOAM solver, we predict the threshold energy required to ignite the fuel mixture. For this, the single step using the Arrhenius law is selected to model ignition in the flame kernel of stochiometric and lean CH4/air mixtures, allowing it to develop into a self-sustained flame. The ignition power density, an energy quantity normalised with volume, is incrementally varied, keeping the kernel critical radius rs constant at 0.5 mm in the quiescent mixture of two equivalence ratios ϕ 0.9 and 1.0, for varied operating pressures of 1, 5, and 10 bar at the constant initial temperature of 300 K. The minimum ignition energy is validated with twelve independent 1-bar datasets both numerically and experimentally. The effect of pressure on MIEs, which diminish as pressure rises, is significant. At ϕ = 1.0 (and 0.9), the flame temperature reached 481.24 K (457.803 K) at 1 bar, 443.176 K (427.356 K) at 5 bar, and 385.56 K (382.688 K) at 10 bar. The minimum ignition energy was validated using twelve independent 1-bar datasets from both numerical simulations and experiments. The results show strong agreement with many experimental findings. Finally, a mathematical formulation of MIE is devised; a function of pressure and equivalence ratio shows a slightly curved relationship.

1. Introduction

Climate changes in recent years have profoundly impacted the environment. This impact necessitates a transition towards carbon-neutral fuels. Such a transition aims to meet global energy needs while mitigating climate change. Whilst the understanding of hydrocarbons and their combustion is well established, the significant increase in global temperatures demands further validation across a wide range of temperatures and higher pressures for their safe storage and infrastructure of combustion systems [1]. Among all hydrocarbons, methane stands out as highly diffusive and flammable, yet it offers the advantage of being the least carbon-intensive fuel, as one mole of CH4 releases one mole of CO2. Methane’s structure as a single-carbon hydrocarbon underscores its potential as a significant and sustainable energy source [2]. Therefore, methane, a simple single-carbon hydrocarbon abundant on Earth, emerges as a promising fuel for a cleaner energy future when coupled with Carbon Capture, Utilization, and Storage (CCUS) technology to manage its CO2 emissions [3,4]. Hahn [5], in §A.1.3, cites World Bank data that indicate that CO2 emissions have tripled since 1990, placing immense strain on ecosystems, with CCUS emerging as a potential solution to mitigate climate change while allowing continued fossil fuel use during the transition to cleaner energy sources. Bio-methane and methanation processes remain economically challenging and have not yet achieved the scale required to substantially displace natural fossil gas utilization. Recent studies, such as those by Zhao et al. [6], have illuminated the complexities of methane ignition and combustion kinetics at elevated temperatures and pressures, highlighting the importance of considering pressure-dependent reaction pathways and accurately capturing low-temperature chemistry for reliable predictions. Bjørgen et al. [7] used advanced computational techniques to study non-conventional pathways in methane ignition and combustion, highlighting their significance at elevated temperatures and improving kinetic parameters for better modeling. These advancements in understanding methane ignition mechanisms, alongside developments in CCUS technology and sustainable bio-methane production, are crucial for a reliable and environmentally responsible transition to a carbon-neutral energy future. Studying minimum ignition energy (MIE) contributes to sustainability by enhancing our understanding of fuel combustion processes, leading to the development of more efficient and cleaner burning technologies.
The minimum ignition energy is the threshold amount of energy or heat that, when applied instantaneously to a small volume of a gas mixture, initiates combustion and triggers a self-sustaining flame capable of propagating through the rest of the mixture [8]. For the ignition of a flammable mixture of hydrocarbons and air, the minimum ignition energy serves as a crucial parameter for evaluating safety risks. When the energy level of ignition is insufficient, it causes heat dissipation from the reaction zone, resulting in flame extinction. Knowing the MIE is crucial for creating safety measures to protect people and property from the dangers of handling flammable gases. For combustion engines, ignition plays an important role in the overall engine performance. Kundu et al. [3] observe that a highly ignitable mixture of methane–air is 9.5% by volume. Additionally, Jia [9] reported ignition limits for CH4/air mixtures at ambient temperature and pressure, with a lower explosive limit (LEL) of 5.05 ± 0.3% and an upper explosive limit of 14.95 ± 0.4%. According to Zeldovich [10], in minimum ignition energy (MIE) theory, a definite ignition temperature Td exists such that the reaction rate ʘ is zero below this temperature of the premixed mixture, i.e., ʘ (Tu < Td) = 0, where Tu is the varying temperature of the unburned mixture. The reaction rate ʘ is constant inside the Td < T < Tb reaction zone, where Tb represents the burned temperature. For more comprehensive information, refer to the original article. In a combustion system, the formation of a flame kernel is a crucial onset of flame, which is affected by the equivalence ratio and pressure. These factors collectively determine the influence of energy density [11]. Improving the comprehension of flame initiation and propagation mechanisms offer the potential for expanding practical applications in this field [12,13]. For example, confined spaces such as coal mines are more prone to frequent accidents. A thorough understanding of methane-induced explosions (MIEs) is crucial for developing effective preventive measures in coal mining operations, informing the design of advanced ventilation systems and sophisticated gas monitoring technologies. This enables the development of more efficient and safe engine designs with enhanced fuel economy and reduced emissions.
This study determines the MIE and flame evolution of CH4/air mixtures at three pressures, 1, 5, and 10 bar, for equivalence ratios 0.9 and 1.0 at an initial temperature of 300 K. The precise modeling of mixture properties and ignition power density was crucial for accurately predicting early flame kernel development [14]. The progression of the flame is tracked in both space and time until the temperature reaches adiabatic levels and subsequently plateaus. In accordance with the conservation of energy, Tadia is primarily determined by the energy released during combustion, which is largely independent of pressure. Notably, this study did not account for any heat losses during the analysis process. The Arrhenius reaction step is considered appropriate, as this study primarily focuses on energy evaluation derived from temperature and pressure variations. The present numerical results’ validation confirms this simplification’s adequacy. Therefore, we choose to use the single-step reaction rate using Arrhenius law and rigorously validate it with the existing literature.
A single-step overall methane chemical reaction (Equation (1)), which includes inert gas N2, is as follows:
CH4 + 2 (O2 + 3.76N2) → CO2 + 2 H2O + 7.52 N2
The volume and mass percentages of equivalence ratios are calculated, for illustration, using (Warnatz et al. [15], pp. 4–6) xfuel, vol% = 1/(1 + 4.762n/ϕ). For CH4 oxidation, CH4 + 2O2 → CO2 + 2H2O, for ϕ = 1, where n is the number of moles of O2 for one mole of CH4, gives xfuel = 0.095, xO2 = xair/4.762 = 0.19, and xN2 = xO2 · 3.762 = 0.715, and equivalently, 0.056, 0.219, and 0.725 in mass fraction. We input six-digit accuracy values.

2. Formulation and Numerical Method

The assessment of the ignition success criterion holds significant importance in determining the MIE, an important characteristic of a developing flame. For practical reasons, it is considered an essential safety criterion for combustible gases. The ignition power density q is adjusted to three decimal places for each scenario. This adjustment initiates successful flame evolution. In all three pressure cases, the initial phase of increase in fuel/air mixture temperature is slower at lower pressure. It decreases proportionally as pressure increases.
The moment at which a flame kernel initiates at a specific location, and continues to propagate consistently, is considered the point of successful ignition. This analysis examines temperature and species profiles to understand flame progression. The results from the initial transient phase are influenced by both the properties of the lean mixtures, in the flammability limits and operating pressures, which significantly influence the rate at which the flame evolves and achieves stability, as theorised in a prediction model for the minimum ignition energy of combustible gas mixtures [16,17].
The reactingFOAM solver of open-source code OpenFOAM was used to carry out this research. The computational configuration is a frozen premixed methane/air distributed homogenously in the domain. The computational domain is a cubic shape with dimensions of 75 mm on each side. It is discretised into a grid with hexahedral mesh with 200 cells with a mesh resolution of 0.375 mm along the x, y, and z directions. The spherical flame mixture at the centre of the domain is ignited in a quiescent initial condition in a pocket of radius r of 0.5 mm, with a volumetric heat source q, for the equivalence ratio 1.0 and a leaner mixture, 0.9, at atmospheric pressure and for higher pressures of 5 and 10 bar. In this context, three simulations for ϕ 0.9 and 1.0 at initial pressures of 1, 5, and 10 bar are performed. The power density, q, is varied by keeping Ti = 300 K and r = 0.5 mm constant across all cases. The parametric variation can be achieved by either maintaining a constant ignition radius while varying the ignition power density (energy normalized by volume) or keeping the ignition energy constant while adjusting the radius. Both approaches should yield equivalent results. For our research, we opted to maintain a constant radius to avoid the complexity of altering the grid for each case.

2.1. Governing Equations

Spherical laminar flames propagating from a volumetric heat source at the centre of the domain, filled with homogeneous combustion products are characterized by the following set of balance equations:

2.2. Mass Conservation Equation

  ρ t + ·   ( ρ U ) = 0    
ρ t (partial derivative of density with respect to time): This term represents the rate of change of density with time at a fixed point in space. It accounts for the accumulation or depletion of mass due to transient effects.
·   ( ρ U ) : (divergence of the product of density and velocity): This term represents the net flow of mass into or out of an infinitesimal control volume. It describes mass transfer due to convective transport.
Equation (2) ensures that the total mass of the fluid remains constant throughout the simulation domain.

2.3. Momentum Equation

t   ( ρ U ) + · ( ρ U U ) · ( τ ) = ·   ( p ) τ = μ [ ( U + U T ) 2 3 U · I ]
t   ( ρ U ) : This term in Equation (3) represents the rate of change of momentum with respect to time.
·   ( ρ U U ) : This term is related to the convective acceleration of the fluid. It represents the rate of change of momentum due to the fluid’s motion.
·   ( p ) : Pressure gradient force.
·   ( τ ) : This term accounts for the effects of viscous forces and pressure gradients on the fluid momentum.

2.4. Species Concentration Equations

t ( ρ Y i ) + · ( ρ U Y i ) = ( μ Y i ) + ω ˙ i
t ( ρ Y i ) , the rate of change of the mass of species i per unit volume with respect to time.
· ( ρ U Y i ) , the net rate of mass flow of species i into a volume element due to convection.
( μ Y i ) , the net rate of mass flow of species i into a volume element due to diffusion.
ω ˙ i , the source term for ith species (Equation (4)).

2.5. Energy Equation

t ( ρ h ) + · ( ρ U h ) + d d t ( ρ K ) + · ( ρ U K ) + { · ( | ϕ · ρ · U | · p ρ ) . i f   h = e d P d t .   O t h e r w i s e +   · ( α · h ) + q ˙  
The terms in Equation (5) are as follows:
t ( ρ h ) represents the rate of change of enthalpy per unit volume with time.
· ( ρ U h ) accounts for the transport of enthalpy due to fluid motion.
· ( ρ U K ) accounts for the transport of kinetic energy due to fluid motion.
{ ·   ( | ϕ · ρ · U | · p ρ ) . i f   h = e d P d t .   O t h e r w i s e : This term is conditional and represents different forms of energy transfer (like pressure work, heat conduction, etc.), depending on whether the specific enthalpy h is equal to internal energy (e), or the time rate of change of pressure ( d P d t ).
· ( α · h ) : This term represents the transport of enthalpy due to heat conduction or diffusion.
q ˙ : This term represents the rate of heat addition per unit volume.
For an elementary reaction such as ϑ A   A + ϑ B   B   ϑ P P + ϑ Q Q , the reaction rate, ω , depends on the concentration as ω ˙ i = k [ A ] ϑ A [ B ] ϑ B according to the law of mass action, where [A] and [B] are the mole concentrations of species A and B, respectively (mole per unit volume), and ϑ A   ,   ϑ B are stoichiometric coefficients for species A and B, respectively. The reaction rate constant at an initial temperature of 300 K is given as k = A exp ( E a R T ) = 5.2·1016·exp [–(14,906/(8.314·300)], where A is the pre-exponential factor, 5.2·1016; Ea is the activation energy, 14,906 K, a default value in reactingFoam solver; and R is the universal gas constant, 8.314 J/mol·K [18].
The Arrhenius equation is a useful starting point in more comprehensive models for predicting MIE. It is often incorporated into more complex reaction mechanisms and computational fluid dynamics (CFD) simulations used to study ignition phenomena.
The ignition of the premixed fuel mixture under quiescent conditions leads to a gradual increase in the sheet temperature, followed by a sudden jump to the adiabatic flame temperature. This transient behavior is not well documented in the literature. The temporal evolution and the radial profiles are discussed in §3. This observation provides sufficient evidence without requiring intermediate species concentration data. The results demonstrate that the Arrhenius law adequately describes flame evolution, with the temperature ultimately reaching the adiabatic value.
The blockMeshDict utility is used to define the vertices, number of grid points, and boundaries for the cubic geometry. Five boundaries are specified: top, left, right, bottom, and frontAndBack as patches. In this case, a volumetric heat source is input at the center of the cubical domain, with the expectation that the flame will develop symmetrically towards the walls. This ignition is designed and coded in heatSource.C, and values are given in fvOptions as follows:
const scalar t = mesh().time().value();
const scalar heatSourceValue = 1e8; //1·108 W/m3;
const scalar heatSourceDuration = 0.01; //10 ms;
const scalar heatSource = (t ≤ heatSourceDuration)? heatSourceValue: 0.0;
const scalar t = mesh(). time().value(): retrieves the current simulation time from the mesh object;
const scalar heatSourceValue = 1·108: sets the desired heat source value of 1·108 W/m3;
const scalar heatSourceDuration = 0.01: sets the duration for which the heat source should be active (10 ms);
const scalar heatSource = (t ≤ heatSourceDuration)? heatSourceValue: 0.0 uses a conditional expression to set the heat source value. If the current time t is less than or equal to heatSourceDuration (10 ms), the heat source is set to heatSourceValue (1·108 W/m3). Otherwise, the heat source is set to zero.
The spherical ignition source is implemented by employing the ‘topoSetDict’ utility in conjunction with the ‘SphereToCell’ command; the coding is given below. The location and dimensions of the ignition source are specified by defining the centre and radius parameters within the utility.
actions
(
{
name hs1;
type cellSet;
action new;
source sphereToCell;
sourceInfo
{
centre (0.0375 0.0375 0.0375);
radius 0.0005; //0.5 mm
}
}
//create cellZone from cellSet
{
name heater;
type cellZoneSet;
action new;
source setToCellZone;
sourceInfo
{
set hs1; //name of cellset
}}
);
The controlDict dictionary specifies the numerical control of the whole simulation that commands the start time, end time, and the deltaT (time step) of the simulation. A constant volumetric heat source term was applied at the centre of the domain from computational time t = 0 to t = 10 ms, ( τ i = 10   ms ) , represents the ignition duration of 10 ms, for all three pressure cases. The computational start time and end time, respectively, are 0 and 10 s. The time step is 1 · 10−4 s. Considering the unit of q J/m3·s and by specifying q, we keep the ignition volume and ignition time constant. By reducing the value of q, the critical point is reached, the zone of ignition and non-ignition which fetches the minimum ignition energy, J. The change in volume or ignition time will be taken care of by the corresponding change in the value of q. We enter species-specific data for molecular weight, density, enthalpy/internal energy, and transport parameters. For the chemical properties of CH4/air mixtures, the Euler implicit solver is used, as a first-order transient solver to solve the transport equations governing the behavior of scalar quantities (e.g., temperature, species concentrations). It is an implicit time integration scheme, meaning that the solution at the next time step depends on the solution at the current time step and the solution itself at the next time step. The significance of using the Euler implicit solver in this case (stagnant mixture) lies in its stability and accuracy for solving stiff ODEs involving chemical reactions or other processes with widely varying time scales. An analysis of the simulation results to determine whether a spherical flame develops or is quenched involves visualizing the temperature, species concentrations, and other relevant variables to identify the presence and characteristics of the flame.

2.6. Model Geometry, Initial and Boundary Conditions

Initial and boundary conditions are defined for the walls, the Top, Left, Right, Bottom and patches frontAndBack, on two faces. The computational domain is filled with CH4 and air (comprising 21% O2 and 79% N2) at initial pressure (pi) and temperature (Ti). Gravitational force acts along the y-direction. There is no internal flow within the domain, and the domain size is 150 times the flame kernel radius of 0.5 mm, to ensure the flame expansion remains unaffected by the domain boundary.
The simulation commences at t = 0 s, with the initial field data stored in a sub-directory labeled “0”, with initial conditions at 1 bar and 300 K. fixedValue boundary conditions specify a constant value of pressure boundaries where the pressure is specified. The inletOutlet boundary condition in OpenFOAM is a versatile option employed in situations where the flow direction at a boundary is not predetermined. This condition allows the boundary to dynamically adapt its behaviour based on the local flow conditions, providing flexibility and robustness. In this context of a quiescent mixture, the inletOutlet boundary condition is utilized to specify the boundary conditions for various fields, such as pressure and velocity. For the pressure field, the inletOutlet boundary condition is set to a fixed value, acting as a reference value within the computational domain. Conversely, for velocity fields, the inletOutlet boundary condition is often set to a zeroGradient condition, implying that the normal derivative of the field at the boundary is set to zero (see Figure 1a,b).

2.7. Evaluation of Minimum Ignition Energy

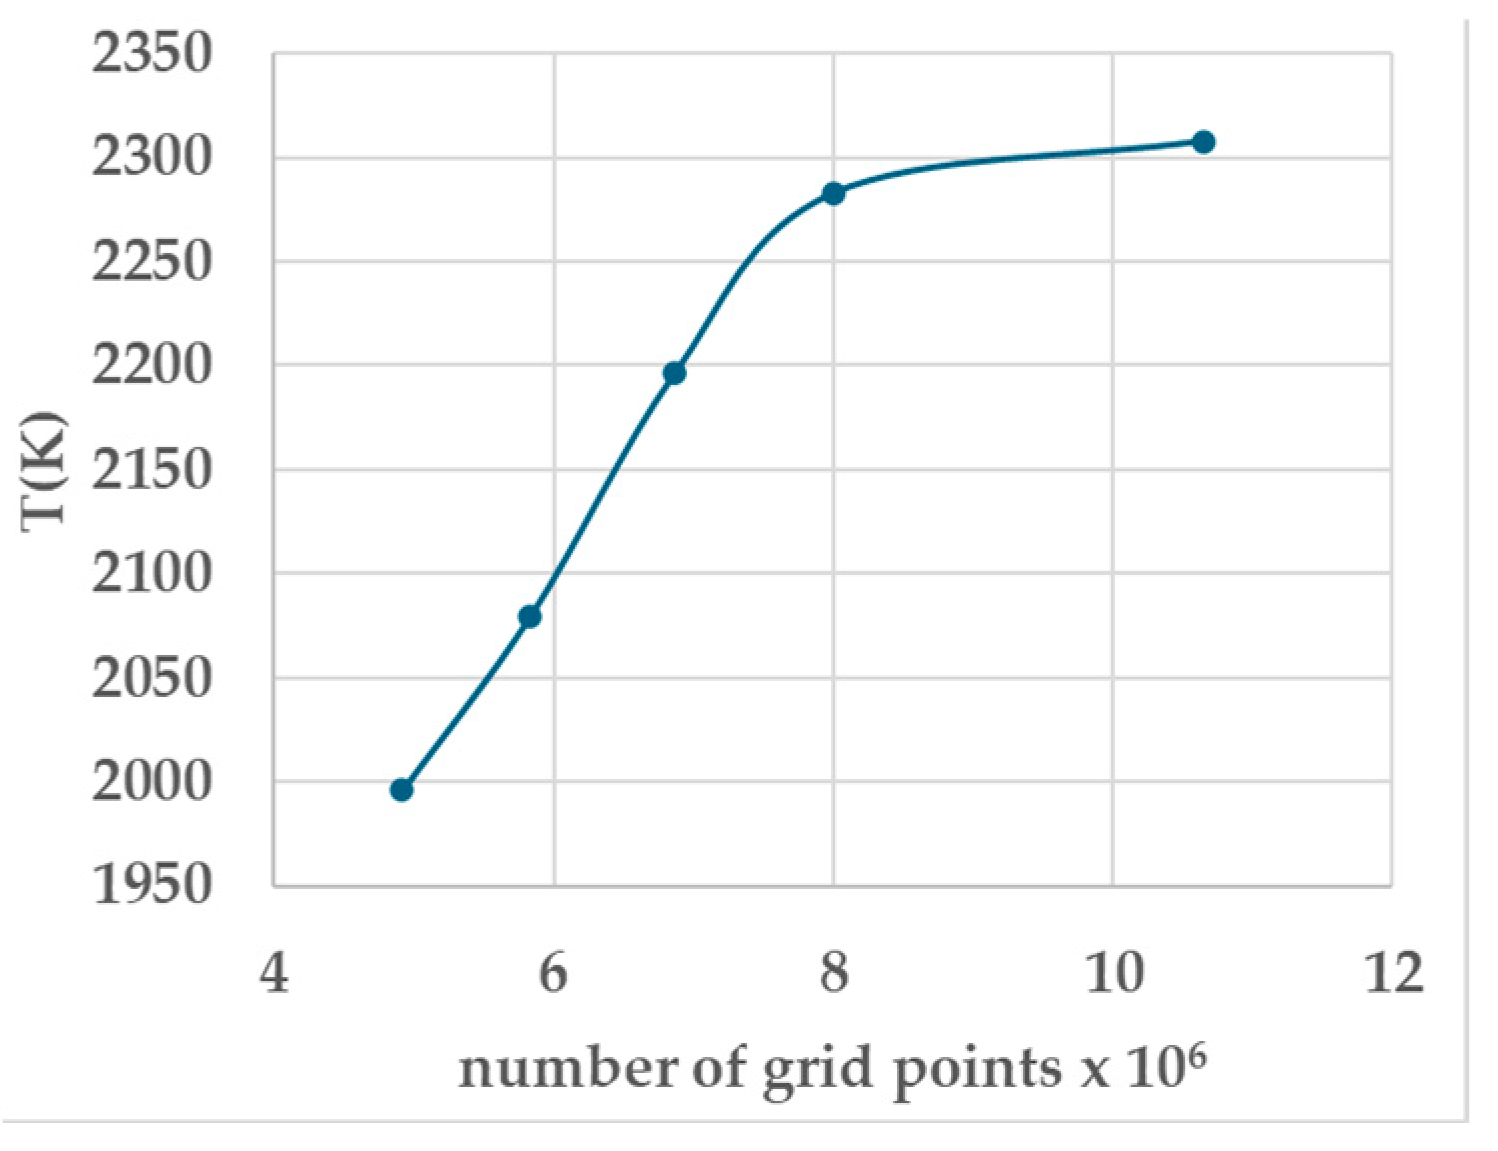
An optimal grid mesh size of 200 × 200 × 200 mm was identified, which significantly reduced computational resource requirements while maintaining accuracy. Consequently, an 8-million-element mesh was selected, resulting in a temperature difference ranging from 1.08% to 3.8% compared to other grid sizes, as depicted in Table 1 and Figure 2. The kernel diameter is 1 mm, with 32 cells, i.e., 0.03125 mm/cell. For all simulations, the kernel space point is at the centre of the computational domain. The space independency is not studied in this work.

2.8. Numerical Methodology

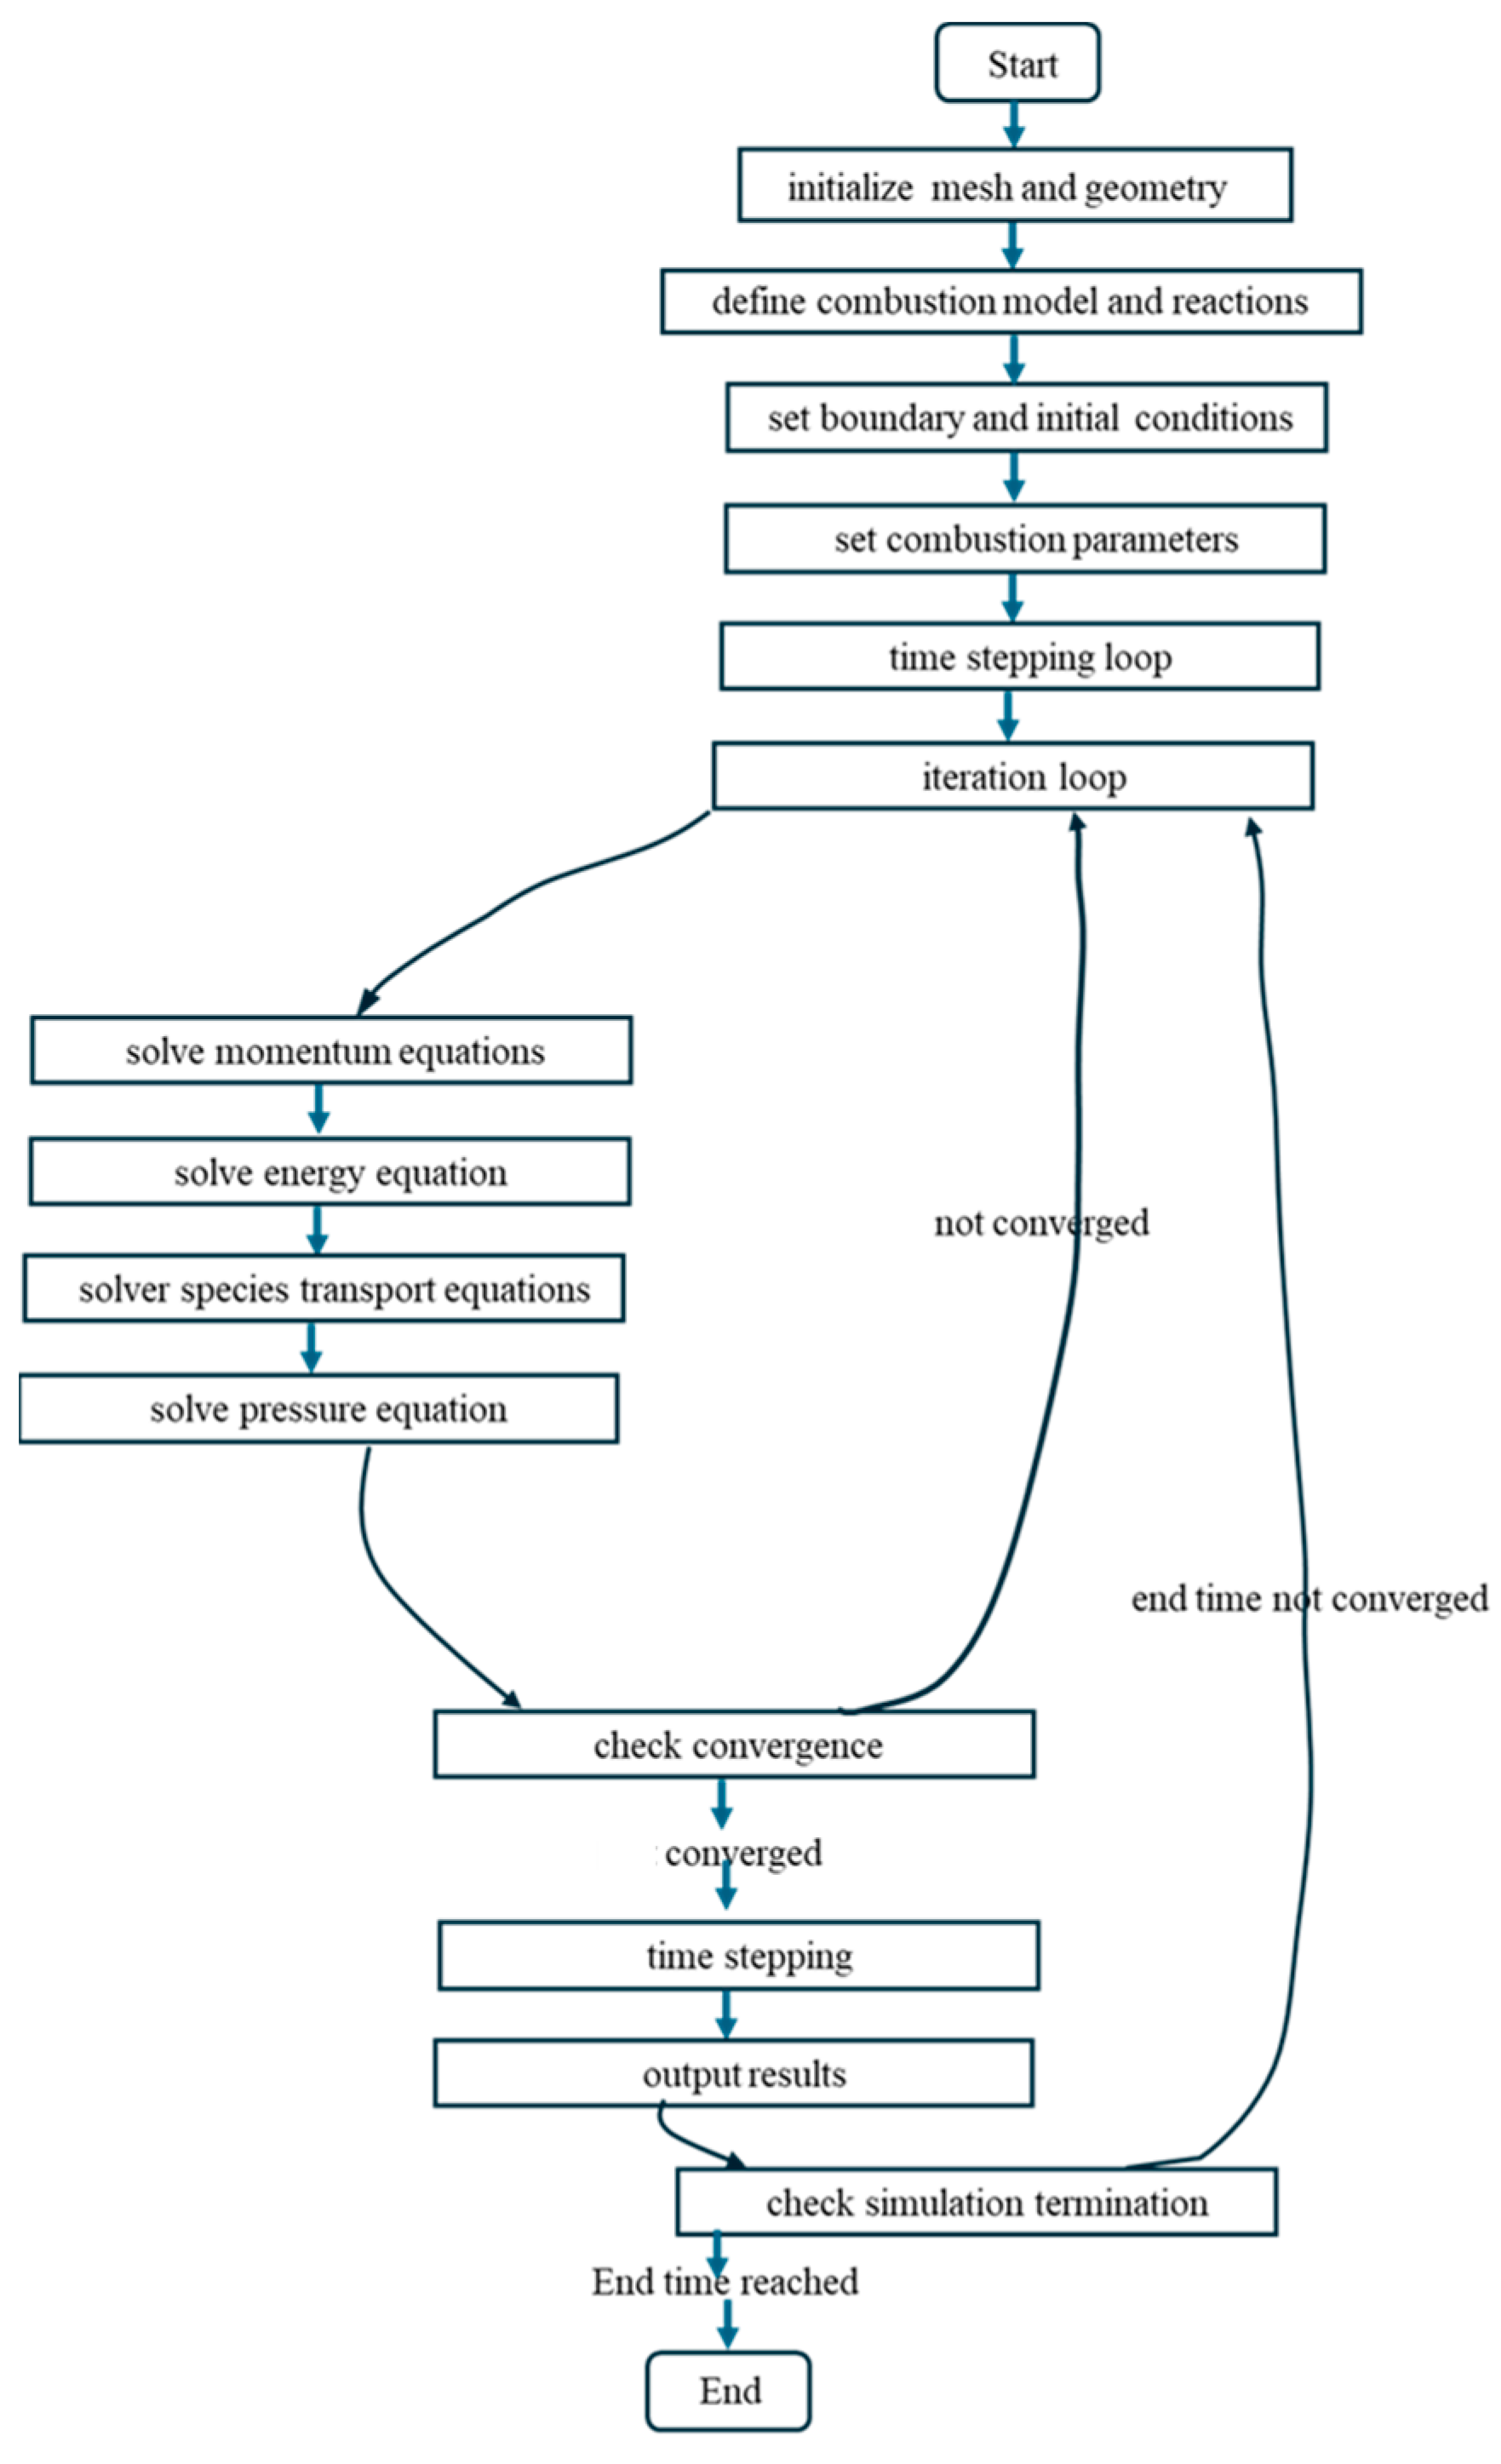
The numerical solution in a reactingFOAM solver of the open-source code OpenFOAM is outlined in a series of steps in Table 2 and in Figure 3.

3. Results and Discussion

Successful ignition occurs when a flame kernel forms at a specific point and subsequently maintains consistent propagation throughout the combustible mixture. For the spherical ignition in a cubical computational domain, temperature and species profiles are analyzed to understand the flame’s progression. In this context, three simulations were conducted at varying initial pressures of 1, 5, and 10 bar.

3.1. Evaluation of Minimum Ignition Energy

Using the input parameter, the power density, denoted ‘q’, the necessary ignition energy is calculated:
Q = q · τ i   ·   V
where Q is the ignition source in mJ, V is the ignition kernel volume in m3, and τ i is the ignition duration in seconds. q is numerically evaluated by iterative testing. For MIE, Equation (6) is rewritten as Equation (7):
Q M I E = q M I E · τ i   ·   V
The ignition is set at the centre of the gas mixture for a possible ignition power density q. The minimum ignition power density qMIE for the flame kernel is rewritten in Equation (8):
q M I E = Q M I E / ( 4 3   π · r s 3   · τ i )
A sample calculation, for phi = 1 at 1 bar, given r s = 0.5 mm and for a set value of τ i = 10   ms is as follows:
Using Equation (7), QMIE = qMIE·τi·V = (1 · 108)·0.010·[ 4 3 · 3.1416·(0.0005)3] = 0.524 mJ.
The heat source was confined to a cubic volume determined by the ignition kernel radius r s , ensuring sufficient space for uninterrupted ignition and initial flame propagation.
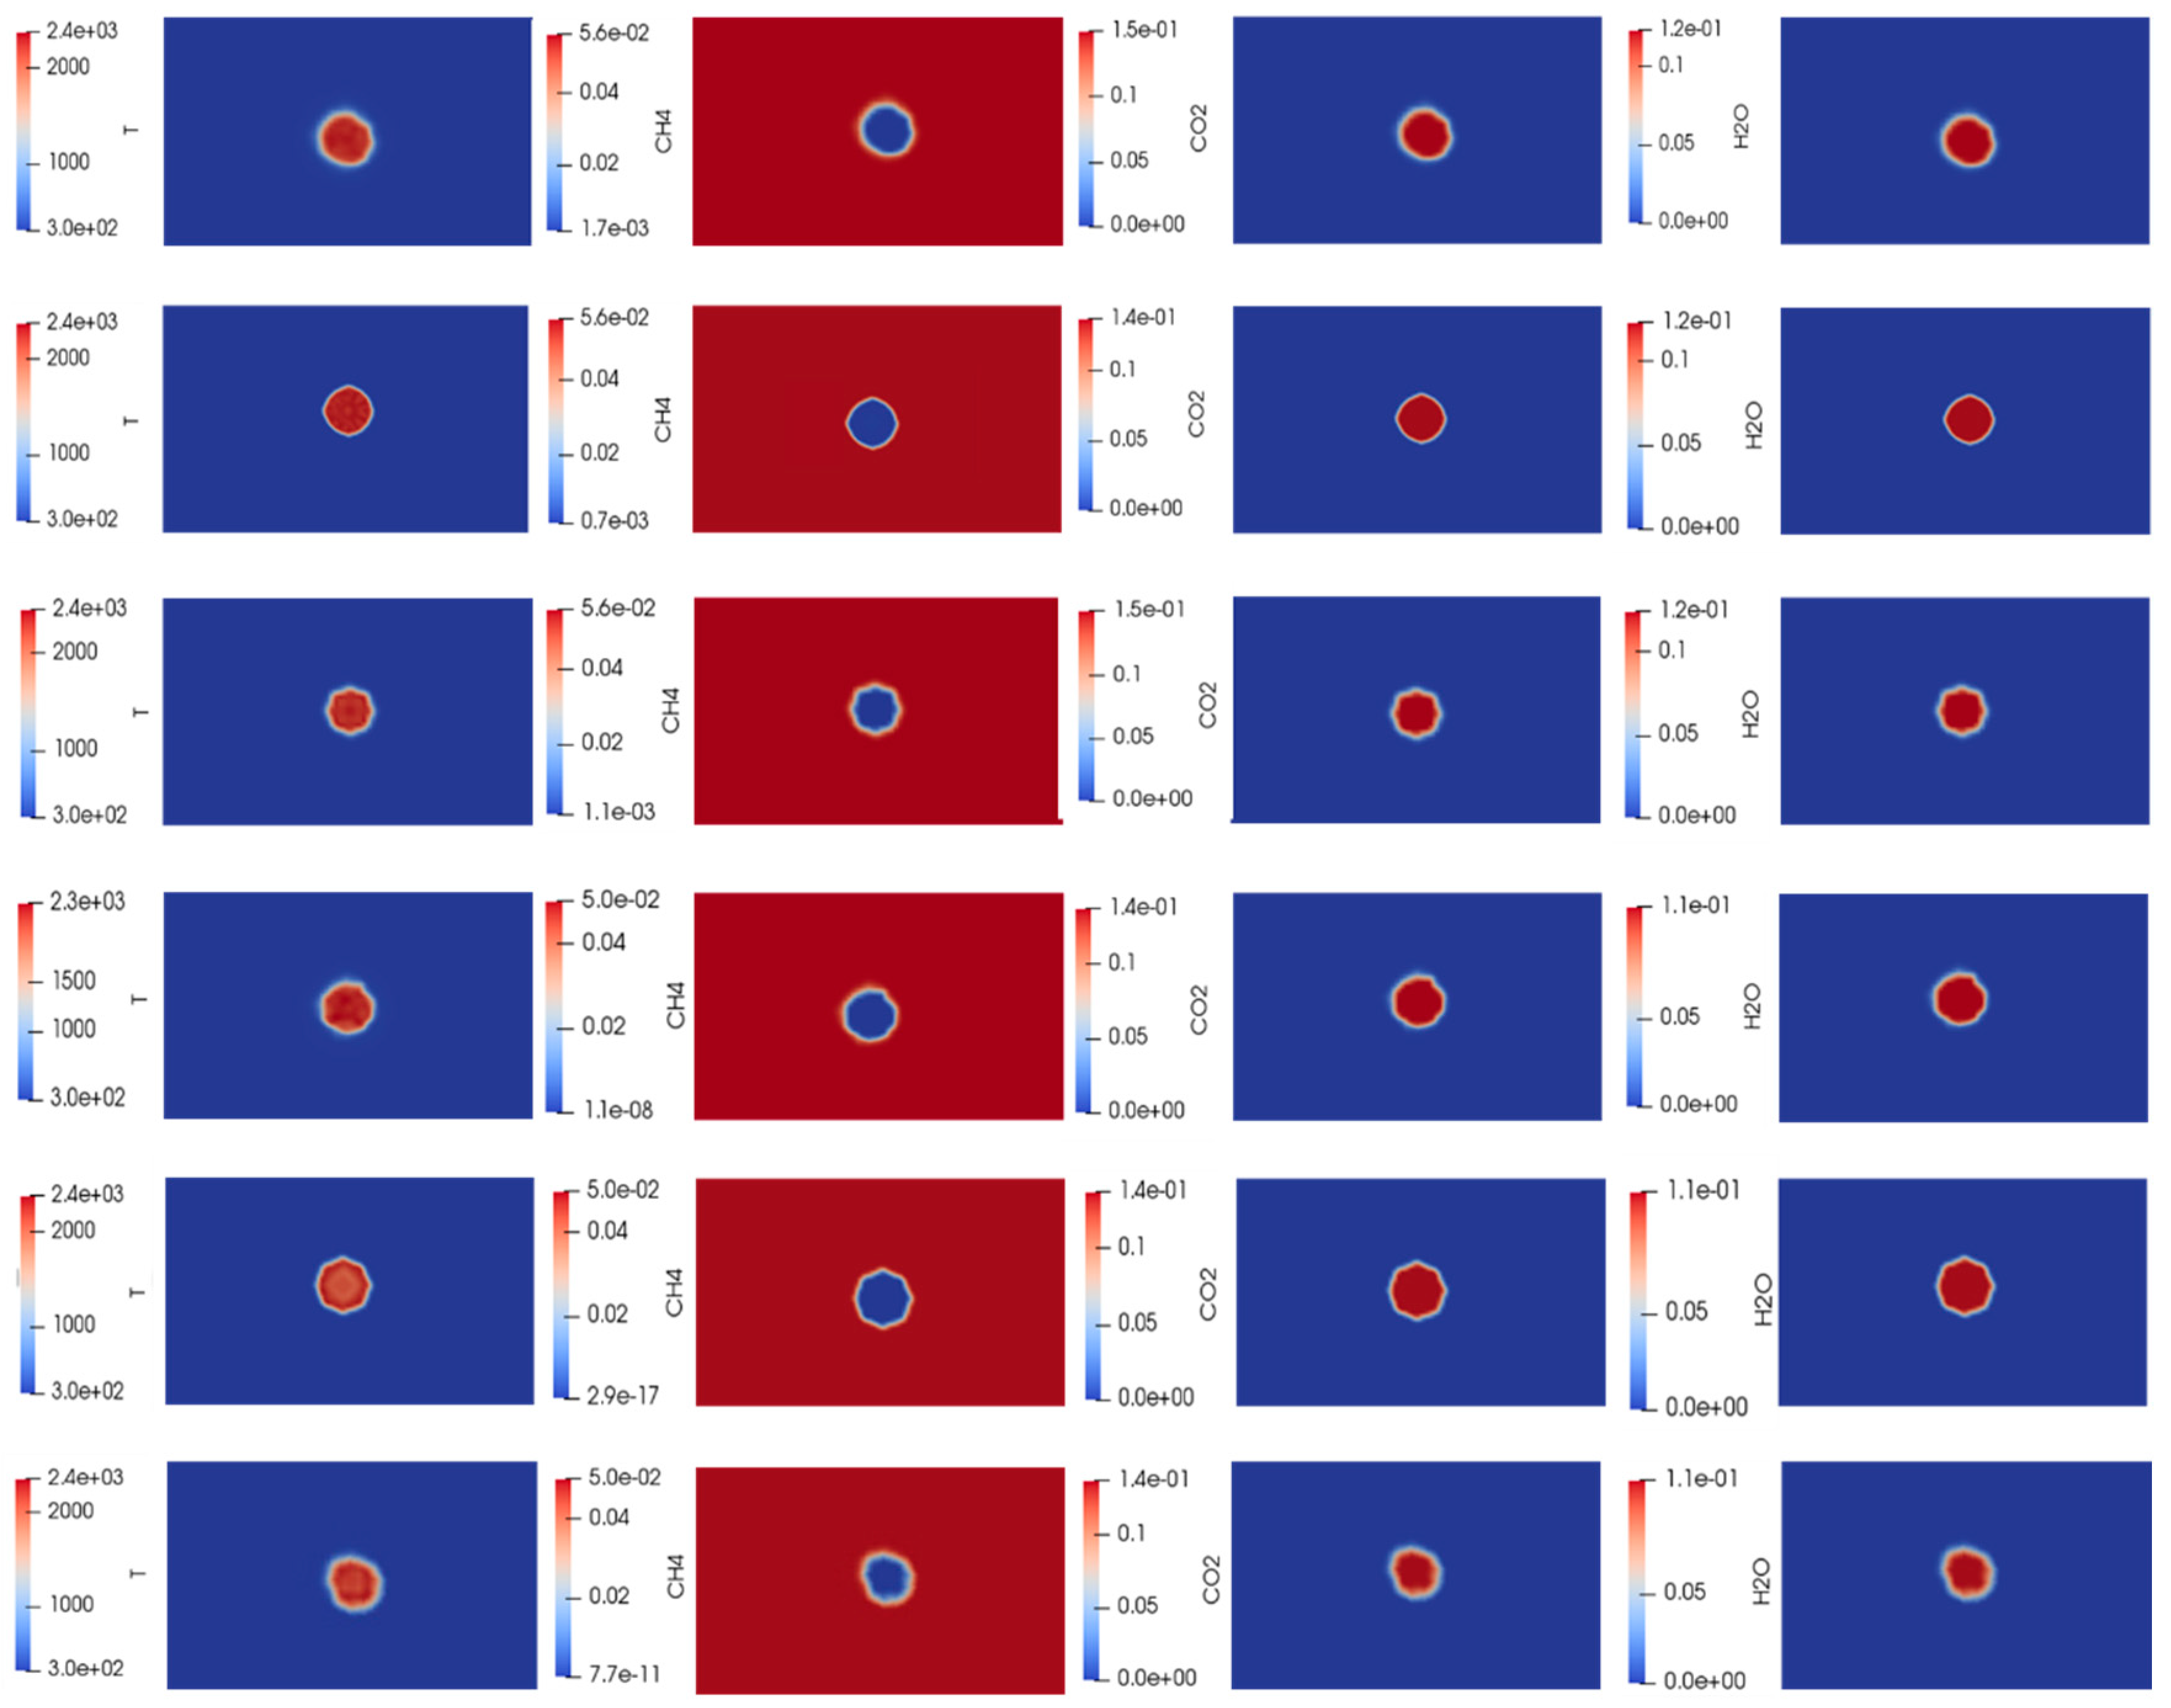
Figure 4 displays contours of temperature and species concentration evolution during combustion. It shows the process from initiation at 300 K to the adiabatic flame temperature Tadia, assuming no heat losses occur. The red contours show CH4 consumption, while the blue contours indicate CO2 and H2O formation.
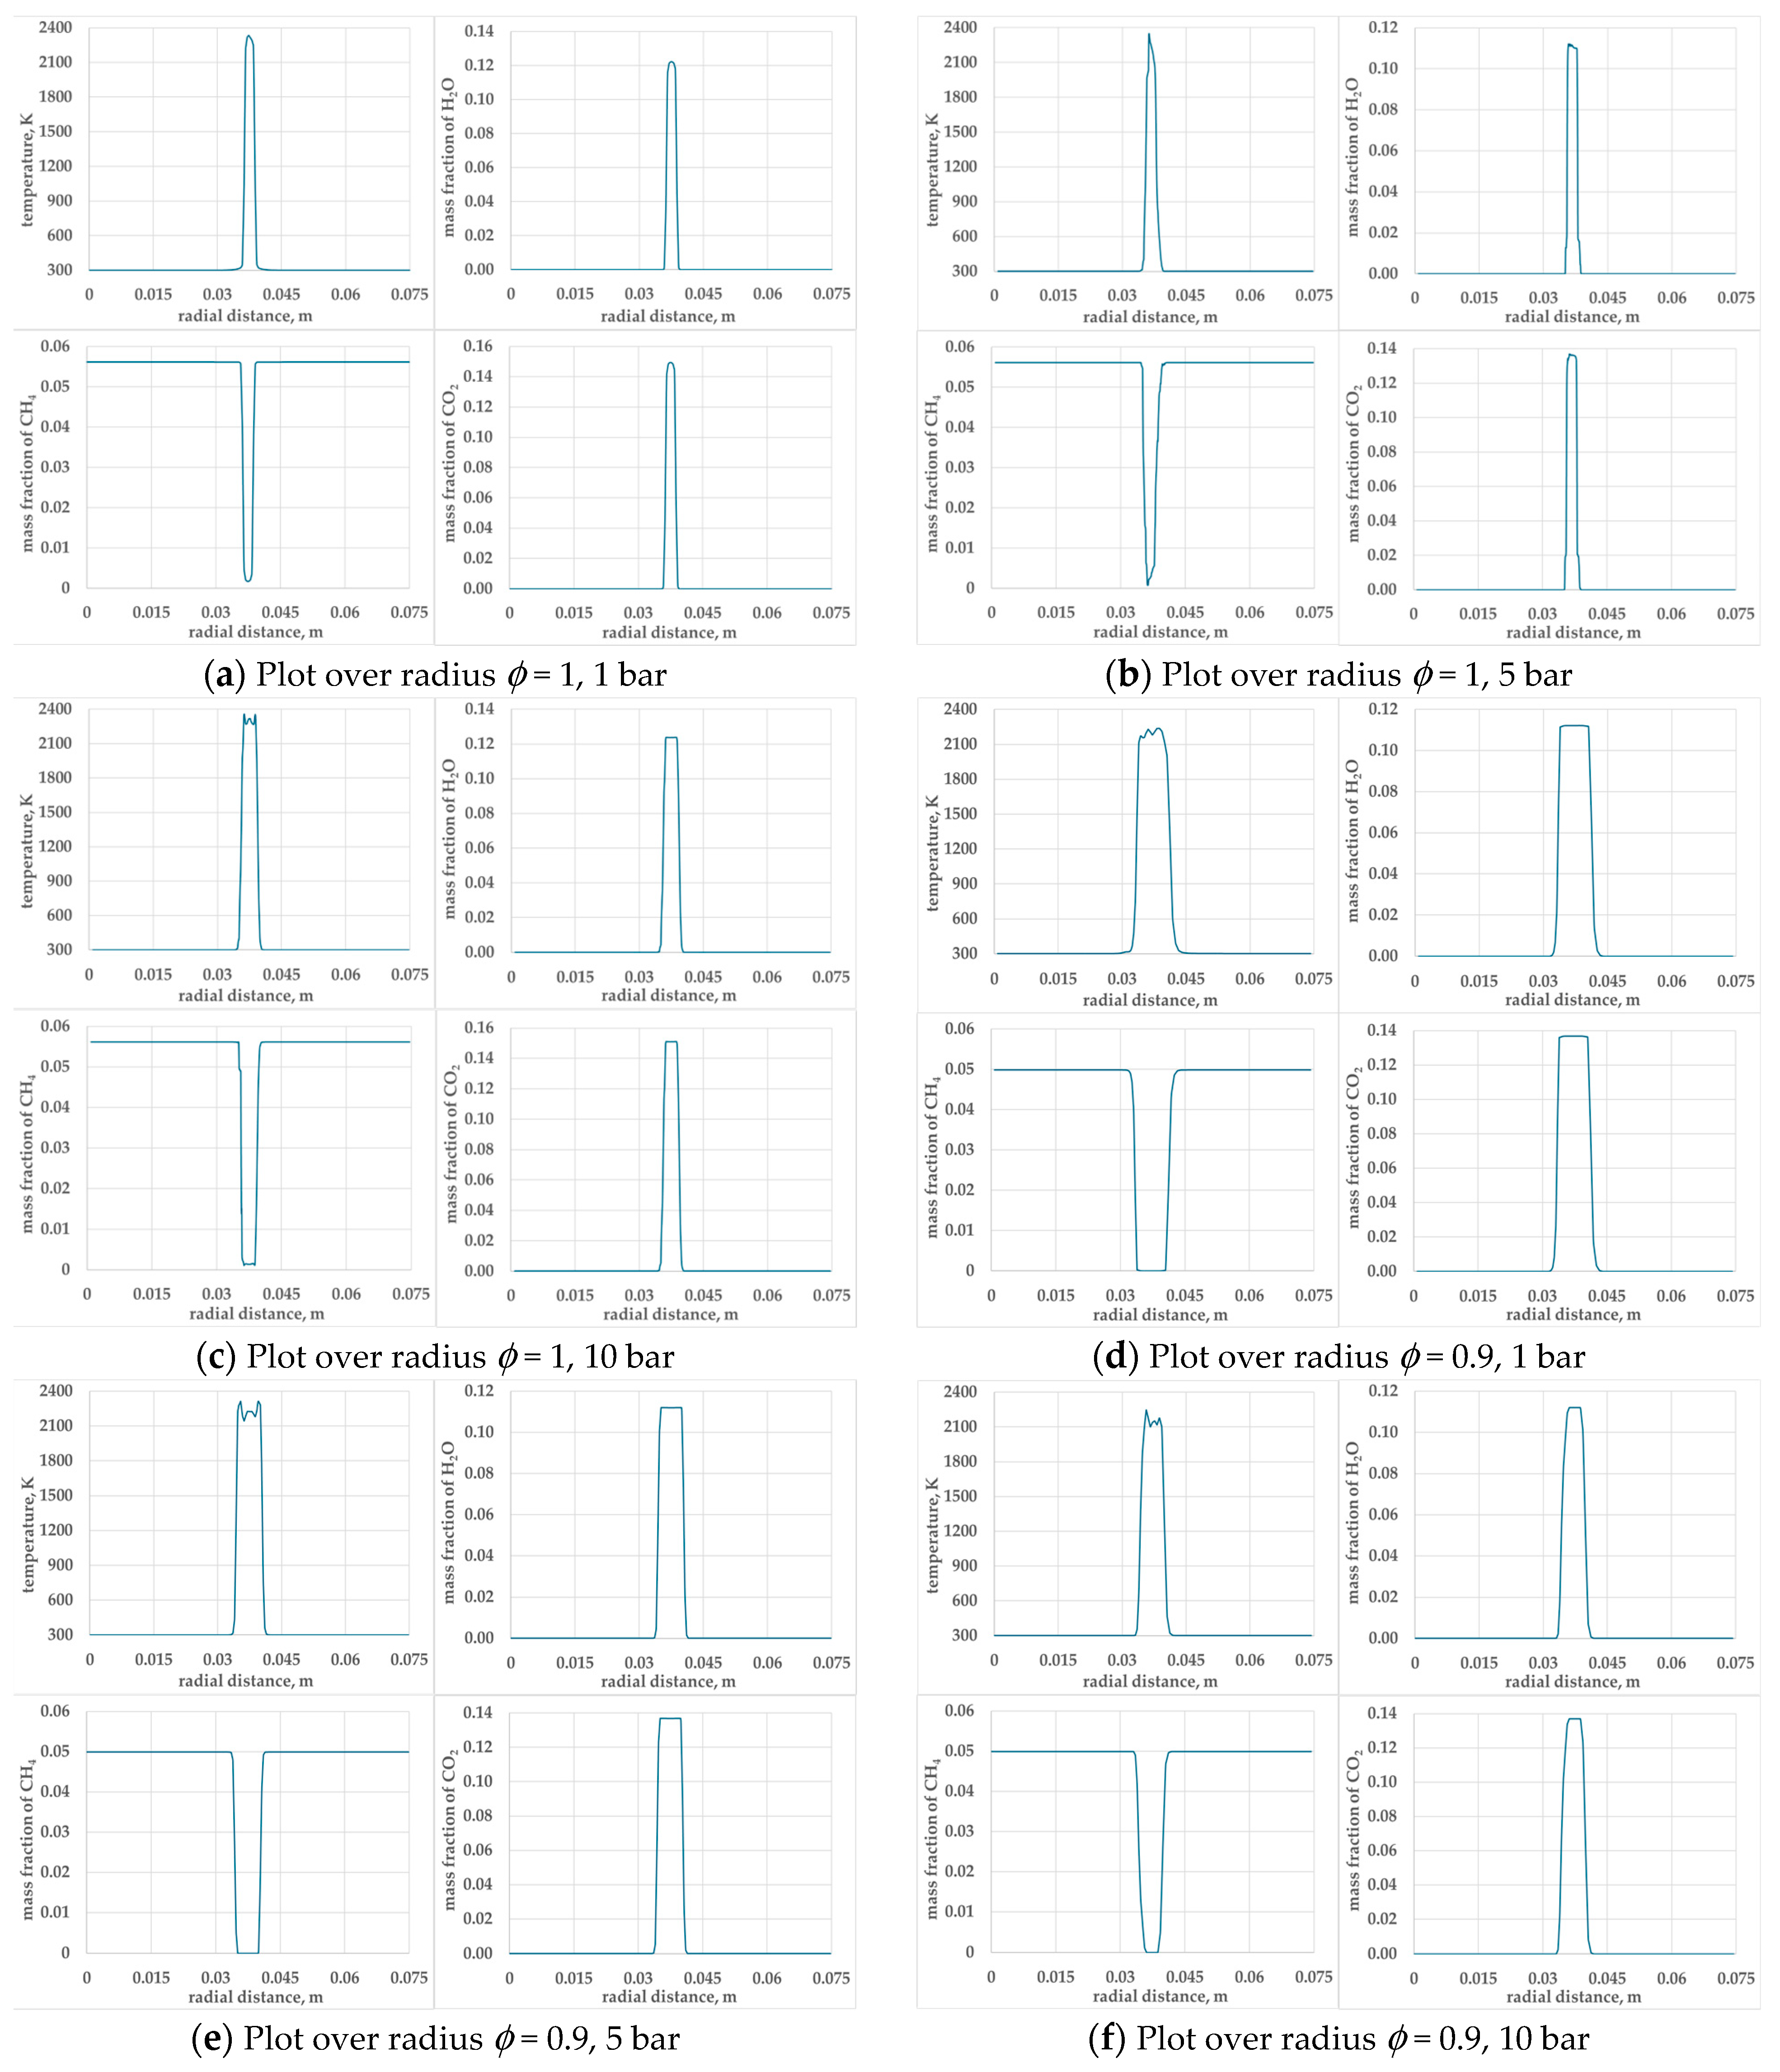
The Figure 5 (to be read from left to right and top to bottom, for each square of four figures) plots show temperature and the three species H2O, CH4, and CO2) over time (and with space in Figure 6) during a successful ignition of premixed CH4/air mixture at q = 1 × 10⁸ W/m3 for the pressure pi = 1 bar and equivalence ratio ϕ = 1 with a first-order discretisation scheme and the ODE solver. Similar plots are shown in Figure 5 for 5 bar (at q = 0.68 × 10⁸ W/m3) and 10 bar (at q = 0.58 × 10⁸ W/m3). Notably, elevated pressure reduces the time required to reach adiabatic flame temperature. The Figure 5 results are repeated over radius distance in Figure 6. A comparison between two ϕ values show the flame is broader for a leaner mixture than for ϕ = 1.0, and the influence of pressure is not as significant compared to the variation in the mixture composition. All the graphical plots, Figure 5 and Figure 6, were taken after the flame reached adiabatic flame temperature.

3.2. Comparison of MIE with Literature

Compared to stoichiometric mixtures (ϕ = 1.0), leaner mixtures (ϕ = 0.9) show a steeper negative slope. This is attributed to two factors: (1) significant dependence on molecular parameters and (2) pressure’s dominant influence in fuel-lean conditions, particularly when the fuel is lighter than the oxidant mixtures, which mitigates the fuel scarcity effect. The two studies [19,20] show that the effect of preferential diffusion of lighter fuels is more predominant in achieving a higher reaction rate. The opposite phenomenon is expected in richer mixtures, though not examined in this study.
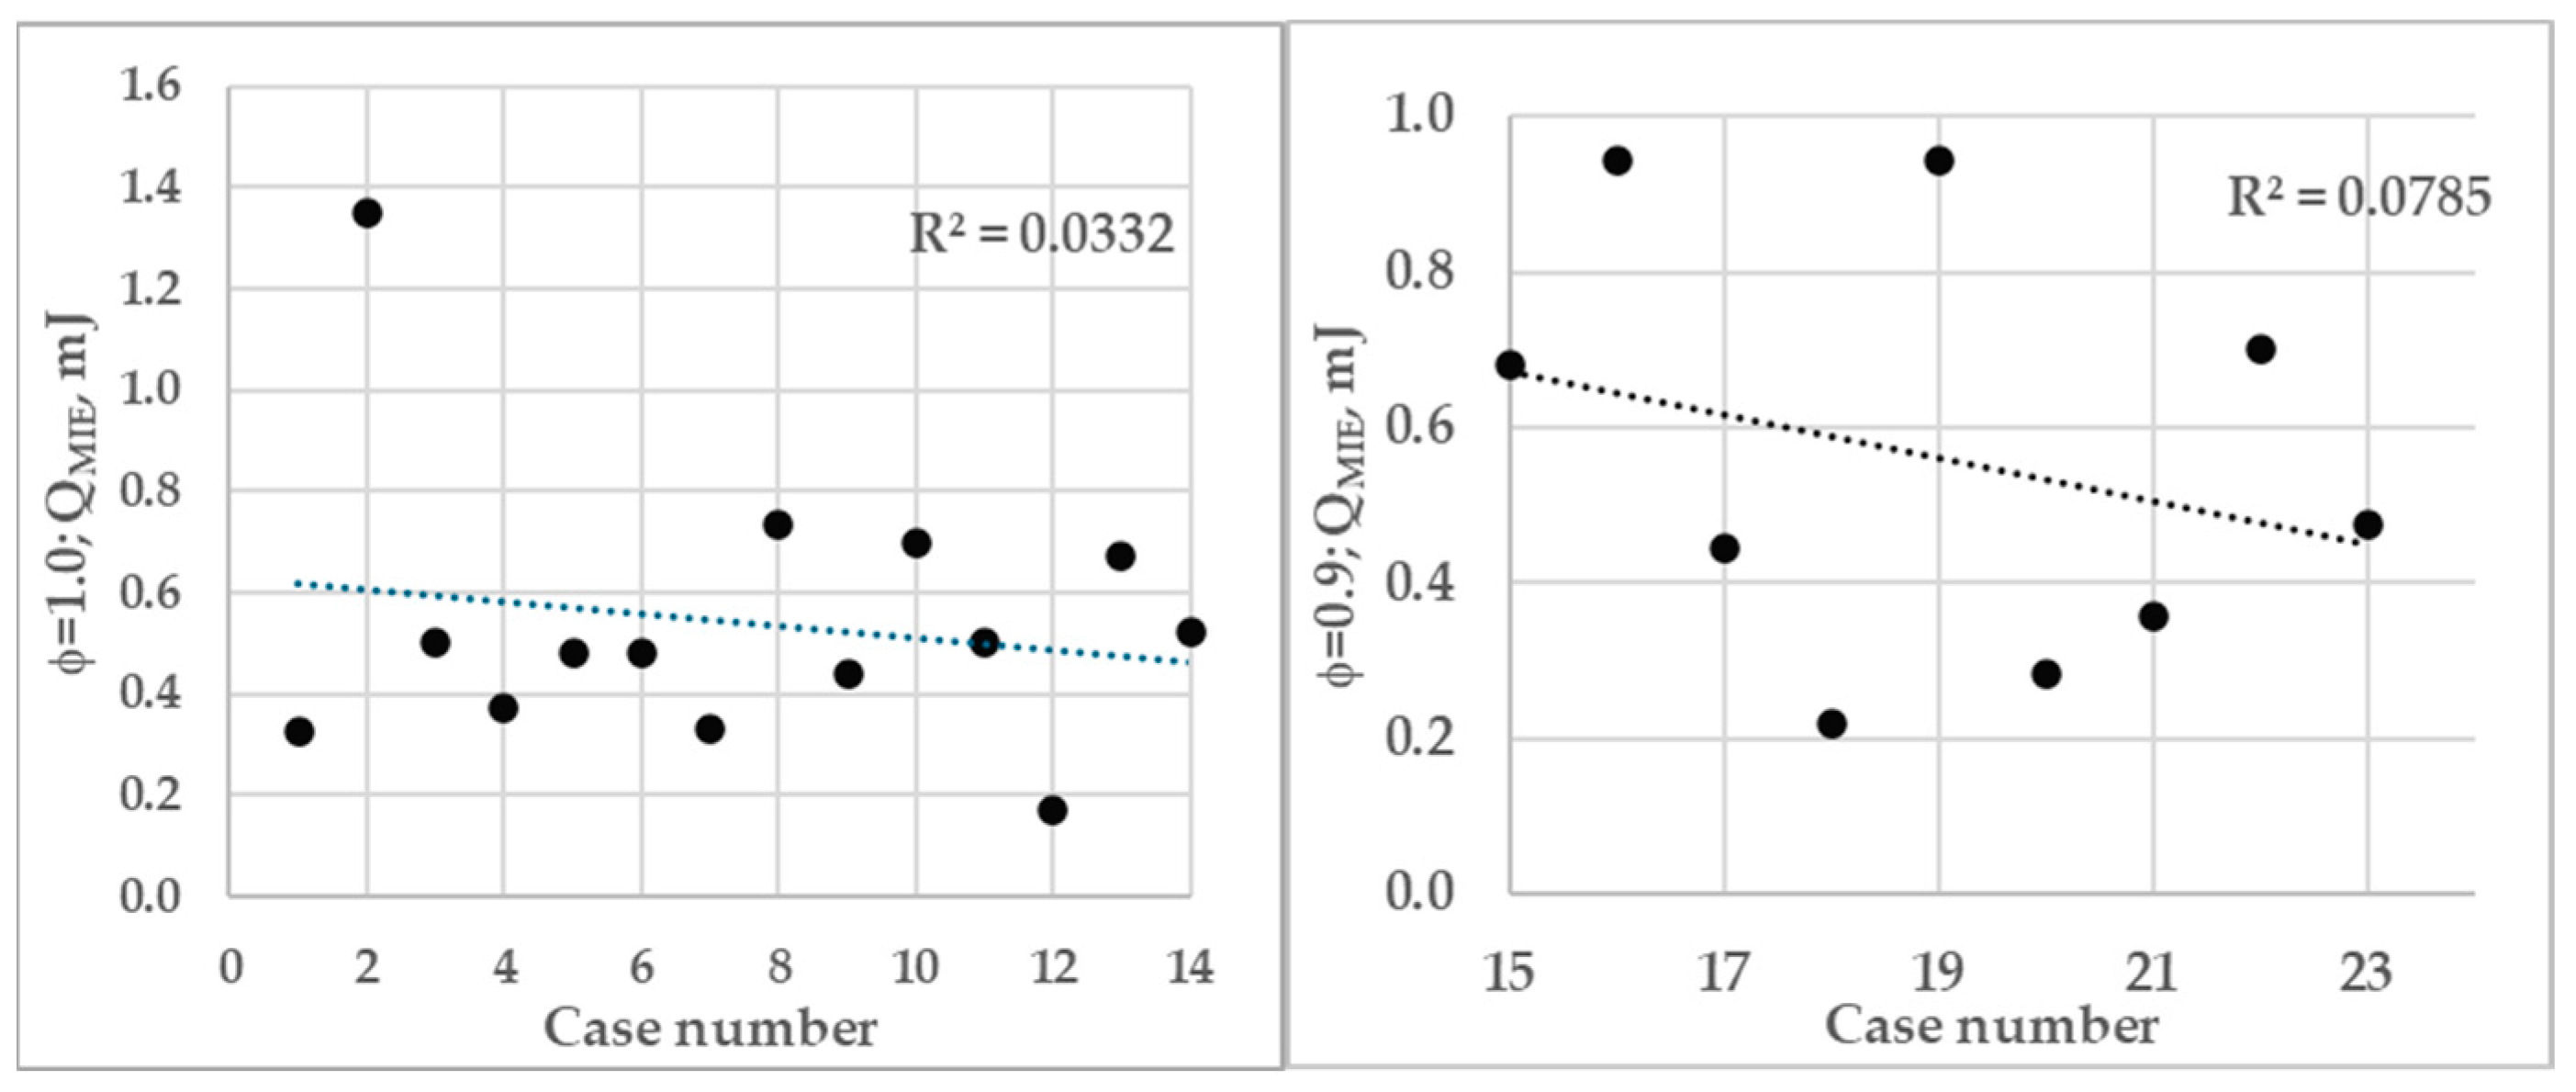
MIEs are compared with twenty-one distinct flame measurements at 1 bar, given in Table 3. The present simulation outcomes are shown in the third column from the left in both figure rows (see Figure 7). Han et al. [21] noted a significant gap between empirical data and computational models. Their simulations yielded results about four times higher than observed measurements. Disregarding a few model predictions, this investigation’s outcomes correspond well with other cited data, given in Table 3. This table (Table 3) with QMIE data is presented in correlation plots as shown in Figure 7 for ϕ 0.9 and 1.0 against case numbers and should be viewed as indicative. The very low coefficient of determination (R) suggests no significant correlation exists between experimental values, including those from simulations. However, a few data points show some correlation.
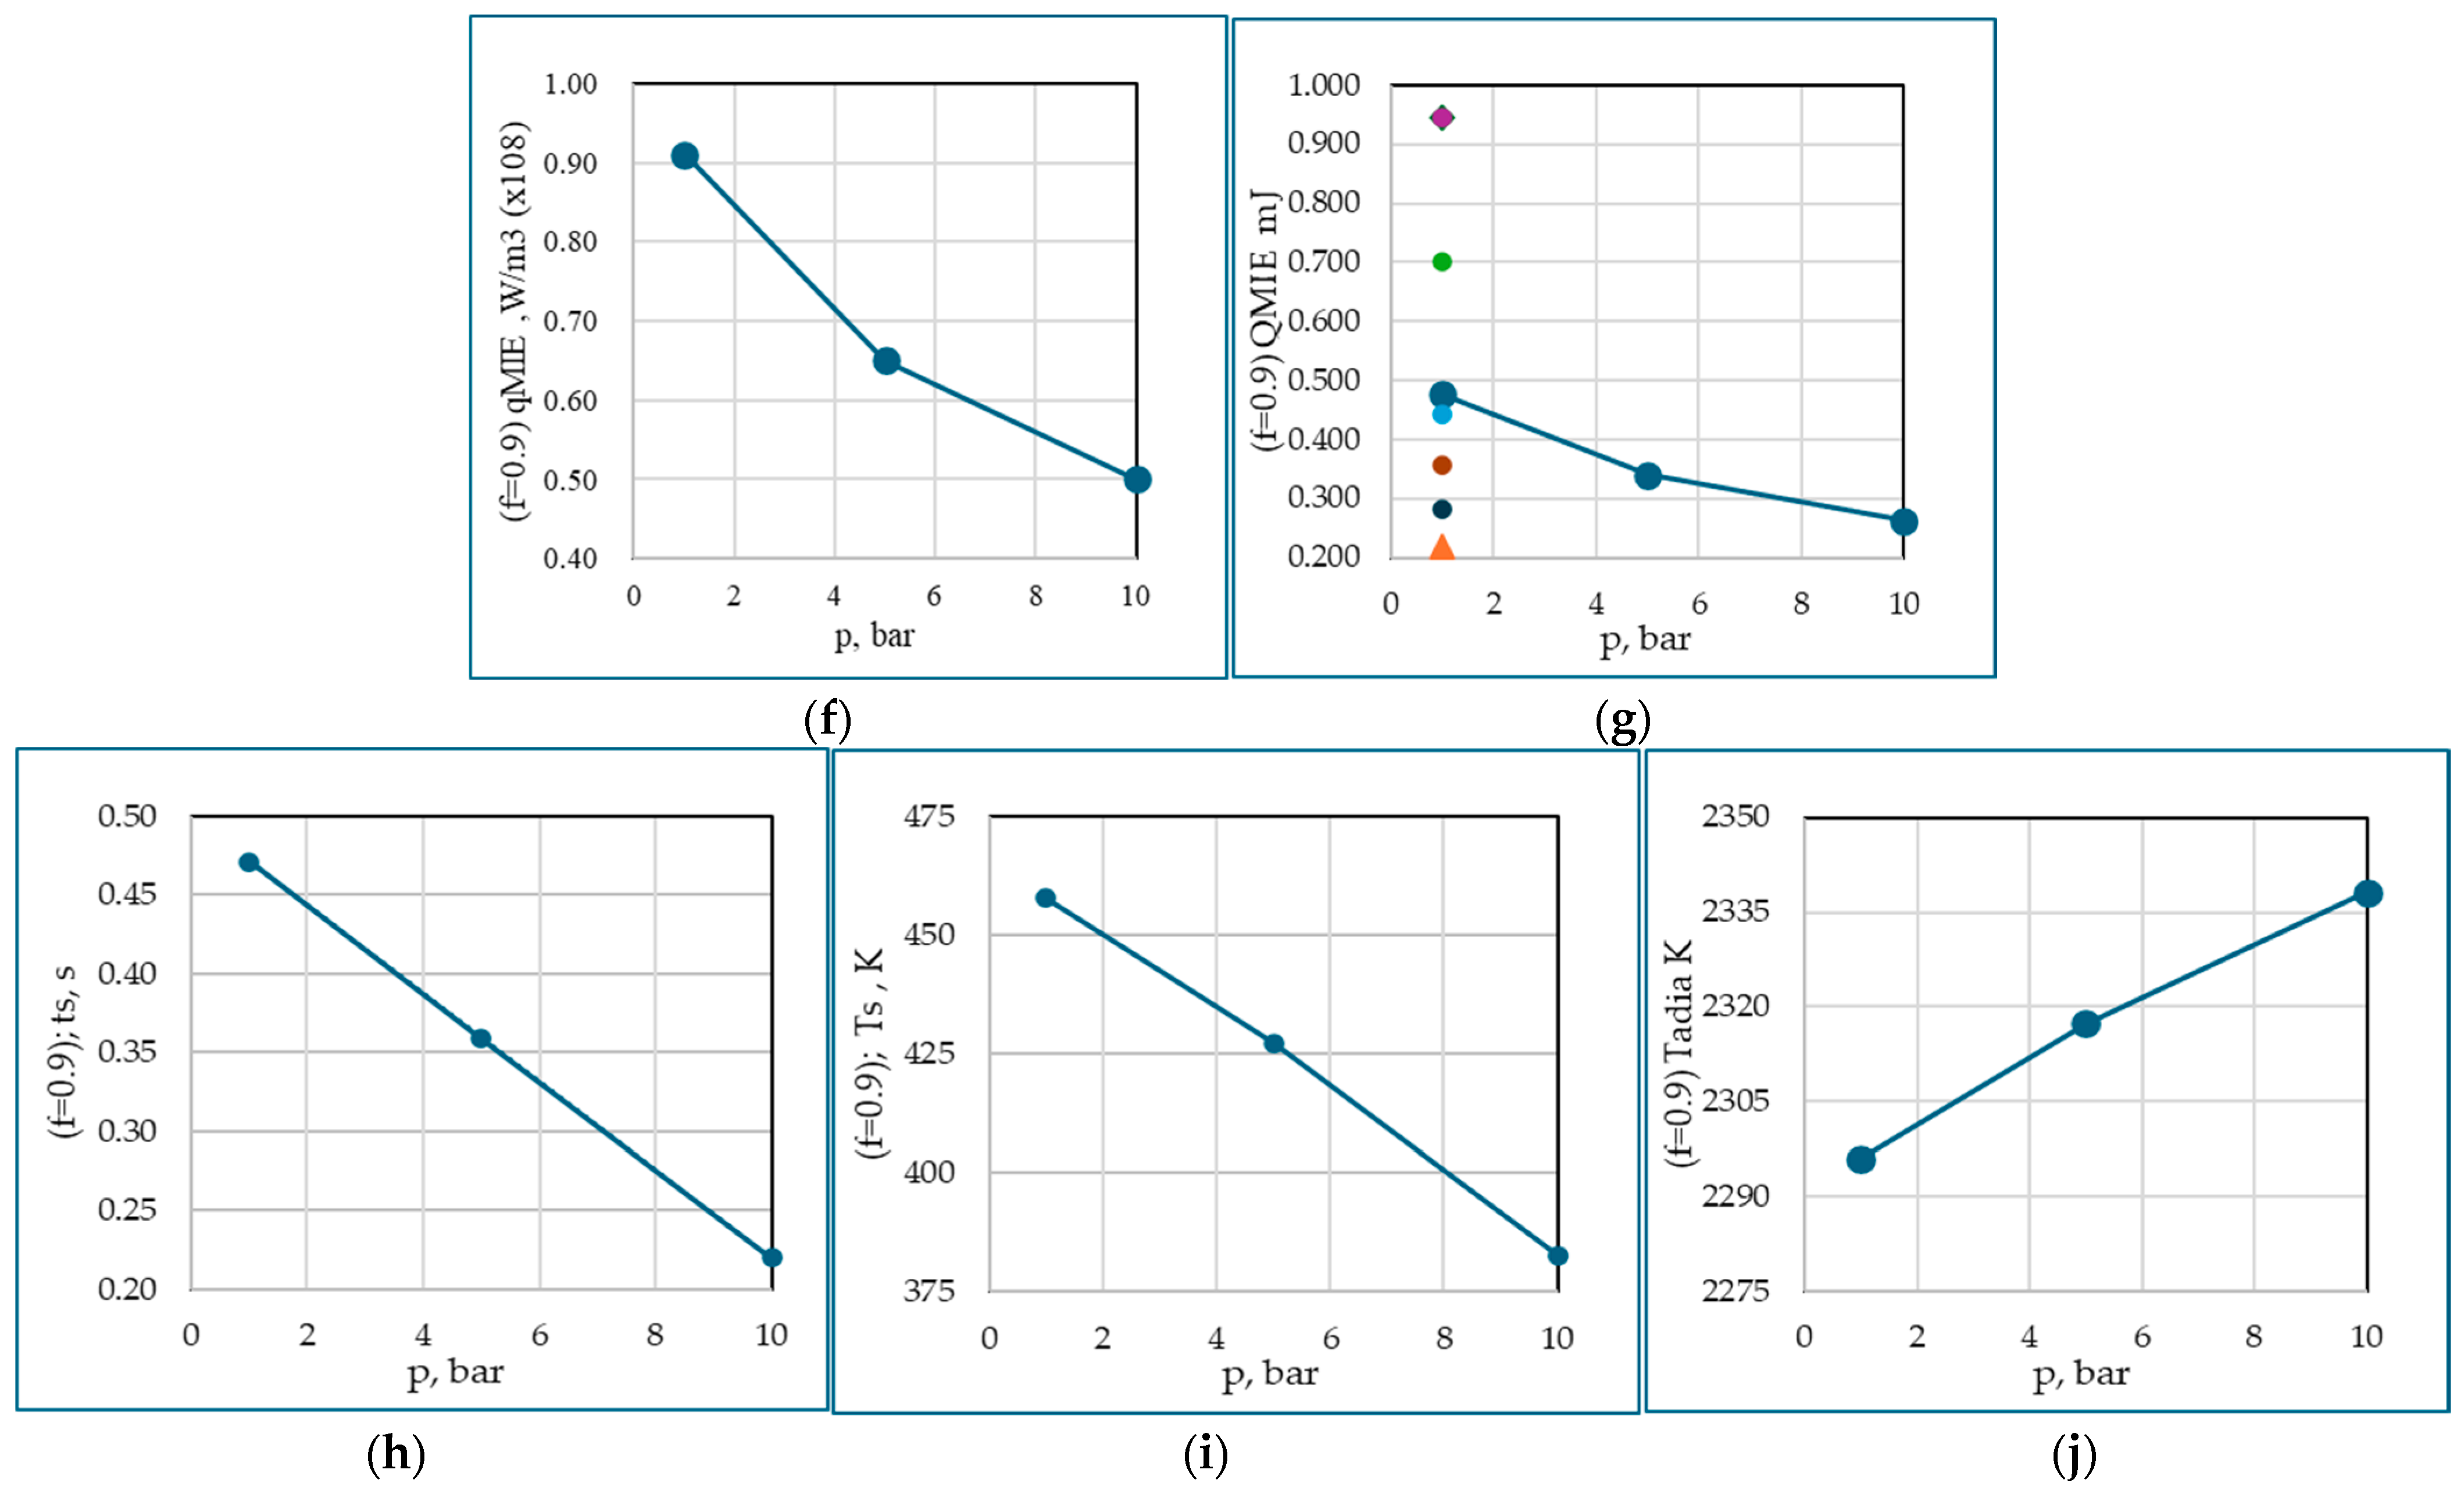
The five quantities qMIE, QMIE, ts, Ts, and Tadia are plotted versus operating pressures of 1, 5, and 10 bar. ts represents the computational time at which the temperature rises from 300 K to Ts (refer to Figure 8b). When examining QMIE plots, refer to Table 4 for additional context. All the graphical plots for ϕ = 1.0 are presented in Figure 8a–e, while those for ϕ = 0.9 are shown in Figure 8f–j. Figure 8 shows a consistent trend of variation in MIE with equivalence ratio and operating pressures. These results are validated as very close to four experiments and several other simulations. This shows that the use of a single-step reaction suffices for the estimation of MIE if the intermediary chemical species concentrations are of no interest, which is not the aim of the present study. The figure also a distant qualitative similar trend for all the five quantities.
Figure 8b,g present validation using 21 data points, comprising both experimental results and numerical data, both provided by the experimentalists. Discrepancies between our simulation data and theirs primarily stem from inconsistencies already noted in the cited literature. Han et al. [21] demonstrate a discrepancy factor exceeding 4 between experimental and simulation results. Notably, our review reveals that MIE values in the literature vary by a factor of 8, while the equivalence ratio differs by a factor of 4.3. For ϕ = 0.9, the decrease in MIE from 1 to 5 bar is more pronounced than from 5 to 10 bar, indicating a nonlinear trend. In the former, the relative change in density is greater. Therefore, flame ignition occurs much more quickly between 0.359 s and 0.220 s than between 0.471 s and 0.359 s. Similarly, for ϕ = 1.0, the range is 0.420 s and 0.280 s, and 0.508 s and 0.420 s. The faster ignition at higher pressures could be attributed to more intensive molecular activity and thus a higher reaction rate, leading to near-instantaneous combustion at the conditions of 5 to 10 bar compared to the conditions of 1 to 5 bar, showing a nonlinear relationship between pressure and flammability. The time between the initial temperature of the reactant mixture and the onset of rapid combustion, i.e., the initial stages of flame development, is analogous to auto-ignition. However, the time at which temperature shoots up shows an inverse trend because higher pressures also increase the heat capacity and thermal conductivity of the gas mixture. This means that while ignition becomes easier at higher pressures, the evolution of the flame may be slightly delayed due to enhanced heat dissipation, especially in the 5 to 10 bar range where the pressure effects on ignition sensitivity start to level off.
For the ϕ of 1 at 1 bar and 300 K, the current simulation of MIEs is compared with twelve different models, both experiments and simulations. In a numerical study, Kim et al. [22] found that the MIE of the stoichiometric CH4/air mixture is 0.500 mJ. This was observed with an ignition source radius of 2.5 mm and a supply duration of 60 μs. Ghosh et al. [17] conducted a comprehensive study of MIE for various equivalence ratios, namely 0.7, 0.8, 0.9, 1.0, and 1.2, resulting in MIEs of 0.98 mJ, 0.59 mJ, 0.42 mJ, 0.48 mJ, and 0.93 mJ, respectively, using a spark duration of 100μs. In contrast to these results, Han et al.’s [15] numerical study predicts an MIE of 1.349 mJ for ϕ = 1, and for ϕ = 0.9, the MIE of 1.100 mJ. In the present simulations, the MIE was determined to be 0.524 mJ. Lewis and von Elbe [24], P357, predict 0.944 mJ, and Lewis and von Elbe [18] gave 0.330 mJ. The current simulation result of 0.524 mL demonstrates good agreement with various experimental findings but shows significant discrepancies when compared to other computational studies.
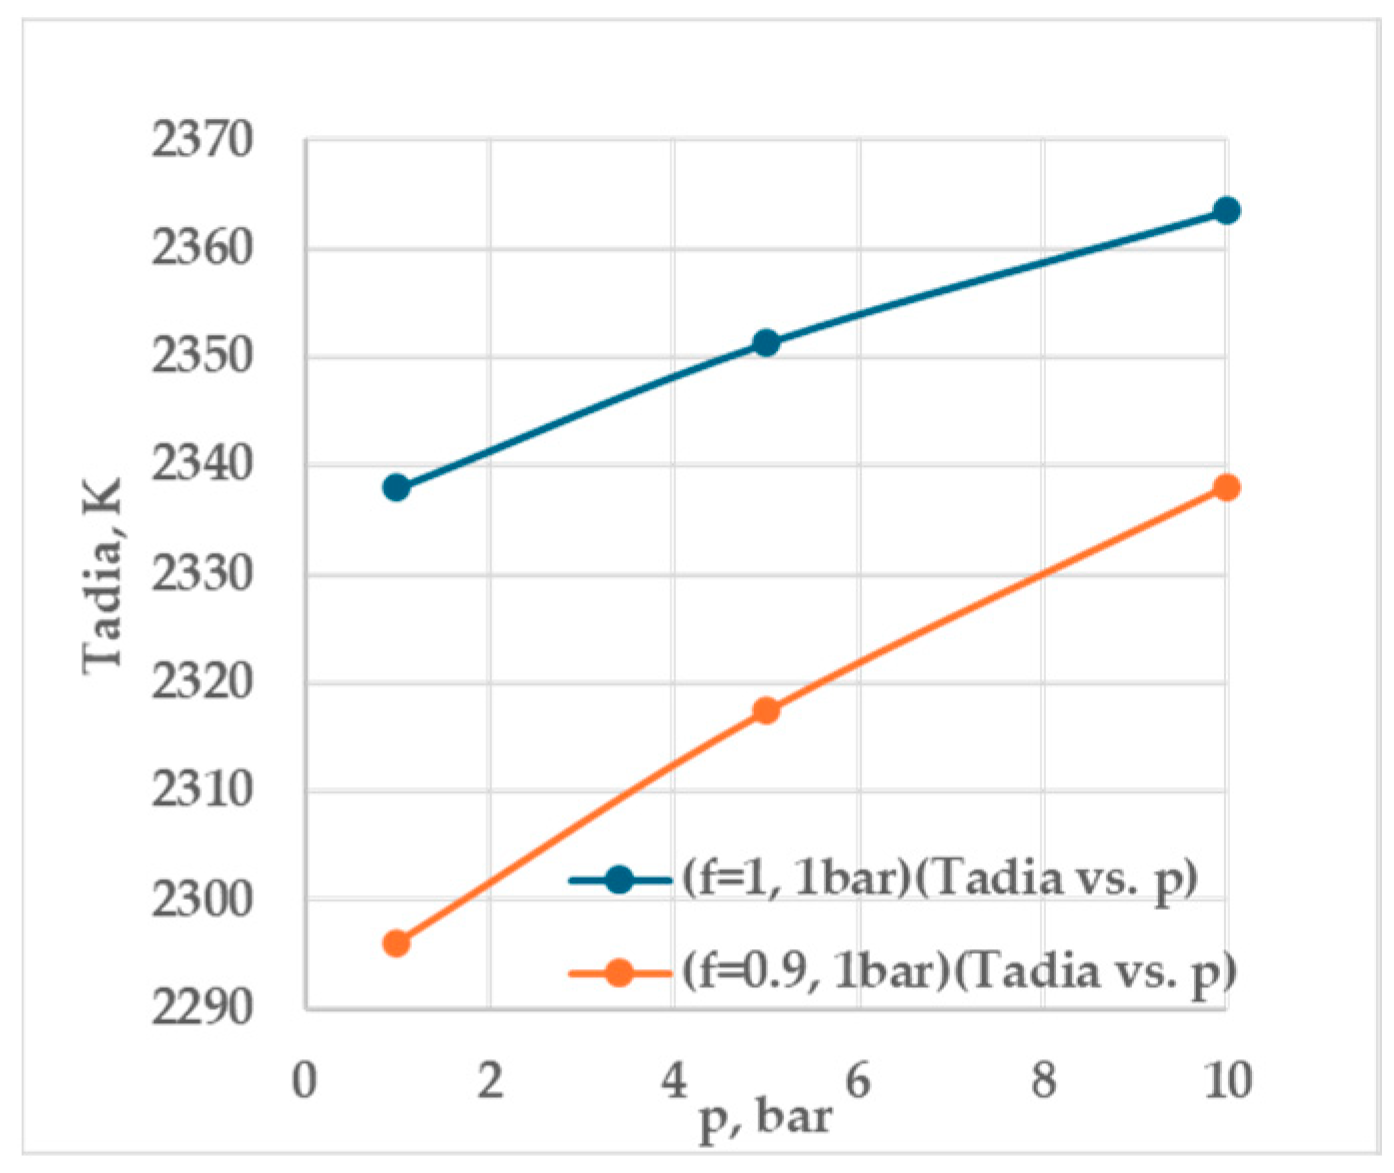
The results in Table 4 complement the numerical data by Wu et al. [32], which indicate that within the flammability range, the MIE remains nearly constant for both mixtures and increases rapidly near the limits. The leaner CH4/air mixture produces a lower Tadia compared to stoichiometric conditions (ϕ = 1.0), while Tadia increases with pressure, most notably from 1 to 5 bar and less significantly from 5 to 10 bar (Figure 9). This temperature elevation at higher pressures is due to increased molecular collisions and enhanced reaction rates. As pressure rises, the difference between Tadia values for lean and stoichiometric mixtures gradually decreases, indicating a convergence in flame temperatures under high-pressure conditions. This convergence can be attributed to the increased density and reactivity of the mixture at higher pressures, which partially compensates for the reduced fuel concentration in lean mixtures.
Following fuel mixture ignition over a 10 ms duration (e.g., for ϕ = 1.0 at 1 bar in Figure 5a), the temperature rises from 300 to 440 K (with input q = 1 × 10⁸ W/m3). Subsequently, the temperature increases steadily but slowly between the end of ignition and the shoot time ts. At this point, it reaches the shoot temperature Ts, from which it rapidly jumps to the adiabatic flame temperature. In other words, from 10 ms to 0.2 (or 0.5 s, depending on the fuel/air mixture composition and the operating pressure), the size of the ignition zone increases to the critical radius, also known as the quenching radius, which is the minimum size a flame must attain to become self-sustaining. If the flame radius is smaller than this critical value, heat losses to the surrounding environment will exceed the heat generated by the combustion reaction, and the flame will be extinguished. In this manuscript, we describe the latter case as non-ignition.
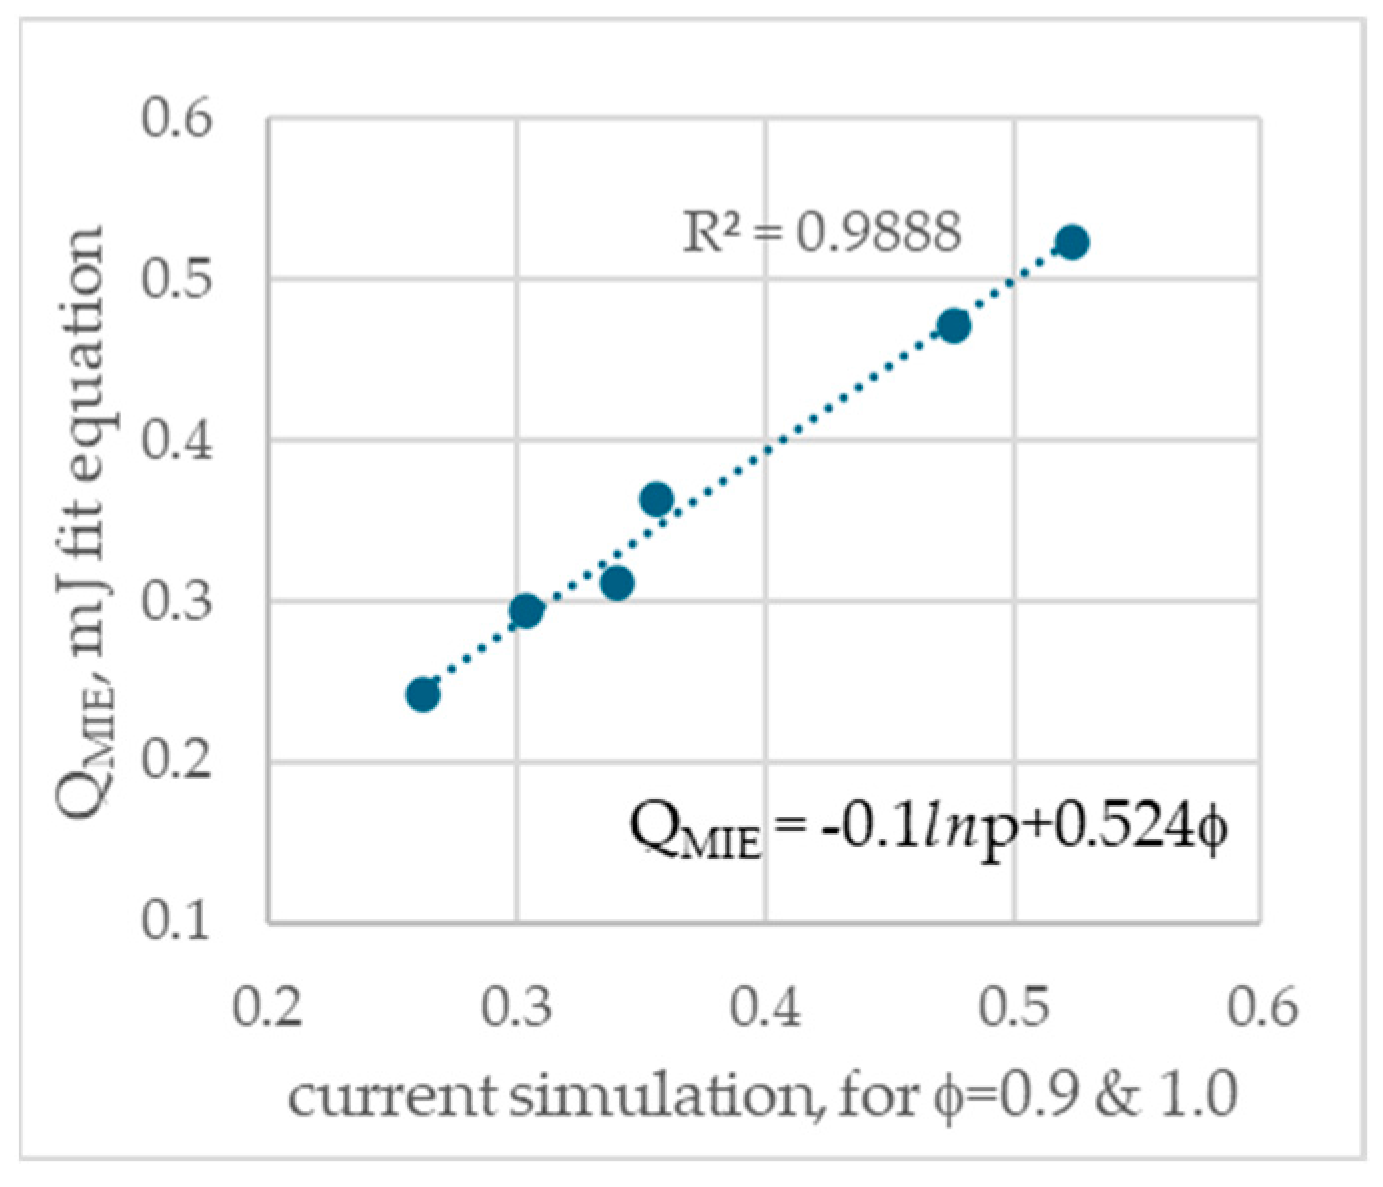
The analytical fit Equation (9) satisfies all six QMIE data values (shown in Figure 10).
QMIE = –0.1 lnp + 0.524ϕ
where –0.1 is a fit constant and 0.524 is taken as the reference value of ϕ = 1.0, 1 bar, which is the MIE for ϕ =1, at 1 bar. It yields an excellent fit, with the coefficient of determination of 0.99.

4. Conclusions

This RANS study using the reactingFOAM solver examines (1) the prediction of the minimum ignition energy (MIE) of CH4/air mixtures and (2) the estimation of the transient flame evolution until the adiabatic flame temperature is reached at higher pressures, which is crucial in understanding the safety design of combustions systems. The flame regime between non-ignition and ignition regime is identified, with an ignition power density accuracy of up to 3 d.p. The flame evolution is estimated as a function of both time and distance for two equivalence ratios, 1.0 and 0.9. The leaner mixture trough curve of MIE occurring at an equivalence ratio at ϕ = 0.9 gives the lowest minimum ignition energy found to be consistent with many experiments. We found that the difference between the MIEs of both mixtures is less predominant for pressures between 1 and 5 bar than for pressures between 5 and 10 bar. The time required for the flame–fuel mixture to reach the shoot temperature (and subsequently the adiabatic flame temperature) is longer at 1 bar, and it substantially decreases from 1 to 5, and to a lesser degree from to 10 bar. For instance, for ϕ = 1.0 at 1 bar the intermediary temperature (from initial mixture 300 K to 481 K) is observed as a crucial parameter, previously unreported in the literature, that characterizes the process of ignition: the successful evolution of a flame and transition to self-sustaining combustion. The present minimum ignition energy is validated against numerous independent datasets from both numerical simulations and experiments, showing very good consistency with most data. Mathematical formulations of MIE as a function of pressure and equivalence ratio revealed a mildly nonlinear relationship.

Author Contributions

Conceptualization, S.P.V. and S.P.R.M.; methodology, S.P.V. and S.P.R.M.; formal analysis, S.P.V. and S.P.R.M.; writing—original draft preparation, S.P.V. and S.P.R.M.; writing—review and editing, S.P.V. and S.P.R.M.; funding acquisition, S.P.V. and S.P.R.M. All authors have read and agreed to the published version of the manuscript.

Funding

This research received no external funding.

Data Availability Statement

Data will be made available on request.

Conflicts of Interest

The authors declare no conflict of interest.

Nomenclature

eInternal energy, J
hSpecific enthalpy, J/kg
KKinetic energy, J
pOperating pressure, bar
piInitial pressure, bar.
Q Ignition source [(Emin/Vs3)/(r)3], mJ
qMinimum ignition power density, W/m3
Q M I E Ignition source [(Emin/Vs3)/(r)3], mJ
q M I E Minimum ignition power density, W/m3
rsFlame kernel radius, m
tComputational time, s
TbBurnt temperature
TdDefinite ignition temperature
TuUnburned fuel mixture temperature
TTemperature
tsShoot time
TsShoot temperature
TadiaAdiabatic flame temperature, K
TiInitial temperature, K
UVelocity, m/s
V The ignition kernel volume, m3
YiMass fraction of ith species
Greek
ρ Average density of fuel/air mixture, kg/m3
τ Viscous stress tensor, Pa
τ i Ignition duration, ms
Gradient operator, 1/m
α e f f Effective thermal diffusivity, m2/s
μ Dynamic viscosity of the fluid, kg-m/s
ω ˙ i Reaction rate of the ith species, kg/(m³s)
fEquivalence ratio (or in instances used as f)
Subscripts
iInitial time
Abbreviations
MIEMinimum ignition energy
LELLower energy limit
UELUpper energy limit

References

  1. Cui, G.; Li, Z.; Yang, C.; Zhou, Z.; Li, J. Experimental Study of Minimum Ignition Energy of Methane–Air Mixtures at Low Temperatures and Elevated Pressures. Energy Fuels 2016, 30, 6738–6744. [Google Scholar] [CrossRef]
  2. Sevillano, C.A.; Pesantes, A.A.; Carpio, E.P.; Martinez, E.J.; Gomez, X. Anaerobic Digestion for Producing Renewable Energy—The Evolution of This Technology in a New Uncertain Scenario. Entropy 2021, 23, 145. [Google Scholar] [CrossRef] [PubMed]
  3. Kundu, S.K.; Zanganeh, J.; Eschebach, D.; Mahinpey, N.; Moghtaderi, B. Explosion characteristics of methane–air mixtures in a spherical vessel connected with a duct. Process Saf. Environ. Prot. 2017, 111, 85–93. [Google Scholar] [CrossRef]
  4. Kundu, S.; Zanganeh, J.; Moghtaderi, B. A review on understanding explosions from methane–air mixture. J. Loss Prev. Process Ind. 2016, 40, 507–523. [Google Scholar] [CrossRef]
  5. Hahn, R. Sustainability Management: Global Perspectives on Concepts, Instruments, and Stakeholders, Kindle ed.; BNP Paribas: Paris, France, 2022. [Google Scholar]
  6. Zhao, Y.; Wang, X.; Cheng, Y.; Mei, Z.; Chen, X.; Tang, S. Ignition and combustion mechanism of alcohol/aluminum suspension nano-fluid droplets. Fuel 2024, 358, 130047. [Google Scholar] [CrossRef]
  7. Bjørgen, K.O.P.; Emberson, D.R.; Løvås, T. Combustion of liquid ammonia and diesel in a compression ignition engine operated in high-pressure dual fuel mode. Fuel 2024, 360, 130269. [Google Scholar] [CrossRef]
  8. Calcote, H.F.; Gregory, C.A.; Barnett, C.M.; Gilmer, R.B. Spark Ignition. Effect of Molecular Structure. Ind. Eng. Chem. 1952, 44, 2656–2662. [Google Scholar] [CrossRef]
  9. Jia, J.; Zhu, J.; Niu, W.; Zhang, J. Influence of acetylene on methane–air explosion characteristics in a confined chamber. Sci. Rep. 2021, 11, 13895. [Google Scholar] [CrossRef]
  10. Zeldovich, Y. Flame propagation in a substance reacting at initial temperature. Combust. Flame 1980, 39, 219–224. [Google Scholar] [CrossRef]
  11. Bianco, Y.; Cheng, W.; Heywood, J. “The Effects of Initial Flame Kernel Conditions on Flame Development in SI Engine. SAE Tech. Pap. 1991, 100, 1852–1862. [Google Scholar]
  12. Huang, C.C.; Shy, S.; Liu, C.; Yan, Y. A transition on minimum ignition energy for lean turbulent methane combustion in flame let and distributed regimes. Proc. Combust. Inst. 2007, 31, 1401–1409. [Google Scholar] [CrossRef]
  13. Wang, Q.; Yan, Y.; Yang, S.; Shu, C.; Jiang, J.; Wang, Q.; Yu, C.; Zhu, L. Comparative study of the effects of ignition location on the flame propagation characteristics and spectral properties of a methane–air premixed gas in a vertical pipeline. J. Energy Inst. 2024, 113, 101508. [Google Scholar] [CrossRef]
  14. Kravchik, T.; Sher, E. Numerical modeling of spark ignition and flame initiation in a quiescent methane-air mixture. Combust. Flame 1994, 99, 635–643. [Google Scholar] [CrossRef]
  15. Warnatz, J.; Maas, U.; Dibble, R.W. Combustion: Physical and Chemical Fundamentals, Modeling and Simulation, Experiments, Pollutant Formation; Textbook; 4/e; Springer: Berlin/Heidelberg, Germany, 2006; pp. 4–6. [Google Scholar]
  16. Scott, F.; Van Dolah, R.; Zabetakis, M. Flammability characteristics of the system H2-NO-N2O-air. Proc. Combust. Inst. 1957, 6, 540–545. [Google Scholar] [CrossRef]
  17. Rabl, S.; Davies, T.J.; McDougall, A.P.; Cracknell, R.F. Understanding the relationship between ignition delay and burn duration in a constant volume vessel at diesel engine conditions. Proc. Combust. Ins. 2015, 35, 2967–2974. [Google Scholar]
  18. The Open Source CFD Toolbox, Standard Boundary Conditions. Version v2012. Available online: https://www.openfoam.com/documentation/user-guide/ (accessed on 22 April 2024).
  19. Muppala, S.P.R.; Papalexandris, M.V. A Modelling Approach for Hydrogen-Doped Lean Premixed Turbulent Combustion. In Proceedings of the ASME International Mechanical Engineering Congress and Exposition, Chicago, IL, USA, 5–10 November 2006; Volume 2, pp. 21–30. [Google Scholar]
  20. Muppala, S.P.R.; Nakahara, M.; Aluri, N.K.; Kido, H.; Wen, J.X.; Papalexandris, M.V. Experimental and analytical investigation of the turbulent burning velocity of two-component fuel mixtures of hydrogen, methane, and propane. Int. J. Hydrogen Energy 2009, 34, 9258–9265. [Google Scholar] [CrossRef]
  21. Han, J.; Yamashita, H.; Hayashi, N. Numerical study on the spark ignition characteristics of a methane–air mixture using detailed chemical kinetics: Effect of equivalence ratio, electrode gap distance, and electrode radius on MIE, quenching distance, and ignition delay. Combust. Flame 2010, 157, 101–113. [Google Scholar] [CrossRef]
  22. Yuasa, T.; Kadota, S.; Tsue, M.; Kono, M.; Nomura, H.; Ujiie, Y. Effects of energy deposition schedule on minimum ignition energy in spark ignition of methane/air mixtures. Proc. Combust. Inst. 2002, 29, 743–750. [Google Scholar] [CrossRef]
  23. Ghosh, A.; Munoz-Munoz, N.M.; Lactose, D.A. Minimum ignition energy of hydrogen-air and methane-air mixtures at temperatures as low as 200 K. Int. J. Hydrogen Energy 2022, 47, 53–59. [Google Scholar] [CrossRef]
  24. Lewis, B.; Von Elbe, G. Combustion, Flames, and Explosions of Gases; Elsevier: Amsterdam, The Netherlands, 2012. [Google Scholar]
  25. Hankinson, G.; Mathurkar, H.; Lowensmith, B.J. Ignition energy and ignition probability of methane-hydrogen-air mixtures. In Proceedings of the 3rd International Conference on Hydrogen Safety, Ajaccio, France, 16–18 September 2009. [Google Scholar]
  26. Wu, C.; Schibi, R.; Mass, U. Numerical studies on minimum ignition energies in CH4/air and iso-octane/air mixtures. J. Loss Prev. Process Ind. 2021, 72, 104557. [Google Scholar] [CrossRef]
  27. Lu, H.; Liu, F.; Wang, K.; Xu, G.; Curran, H.J. Numerical study on the minimum ignition energy of a methane-air mixture. Fuel 2021, 285, 119230. [Google Scholar] [CrossRef]
  28. Kim, H.J.; Chung, S.H.; Sohn, C.H. Numerical Calculation of Minimum Ignition Energy for hydrogen and Methane Fuels. KSME Int. J. 2004, 18, 838–846. [Google Scholar] [CrossRef]
  29. Wang, B.; Zhou, L.; Xu, K.; Wang, Q. Fast prediction of minimum ignition energy from molecular structure using simple QSPR model. J. Loss Prev. Process Ind. 2017, 50, 290–294. [Google Scholar] [CrossRef]
  30. Lewis, B.; von Elbe, G. Combustion, Flames, and Explosions of Gases, 3rd ed.; Academic Press: Orlando, FL, USA, 1987; p. 357. [Google Scholar]
  31. Su, Z.; Liu, L.; Li, K.; Chen, X.; Chen, T.; Huang, C. Theoretical prediction model for minimum ignition energy of combustible gas mixtures. Int. J. Hydrogen Energy 2024, 69, 103–112. [Google Scholar] [CrossRef]
  32. Wu, C.; Chen, Y.; Schießl, R.; Shy, S.S.; Maas, U. Numerical and experimental studies on minimum ignition energies in primary reference fuel/air mixtures. Proc. Combust. Inst. 2023, 39, 1987–1996. [Google Scholar] [CrossRef]
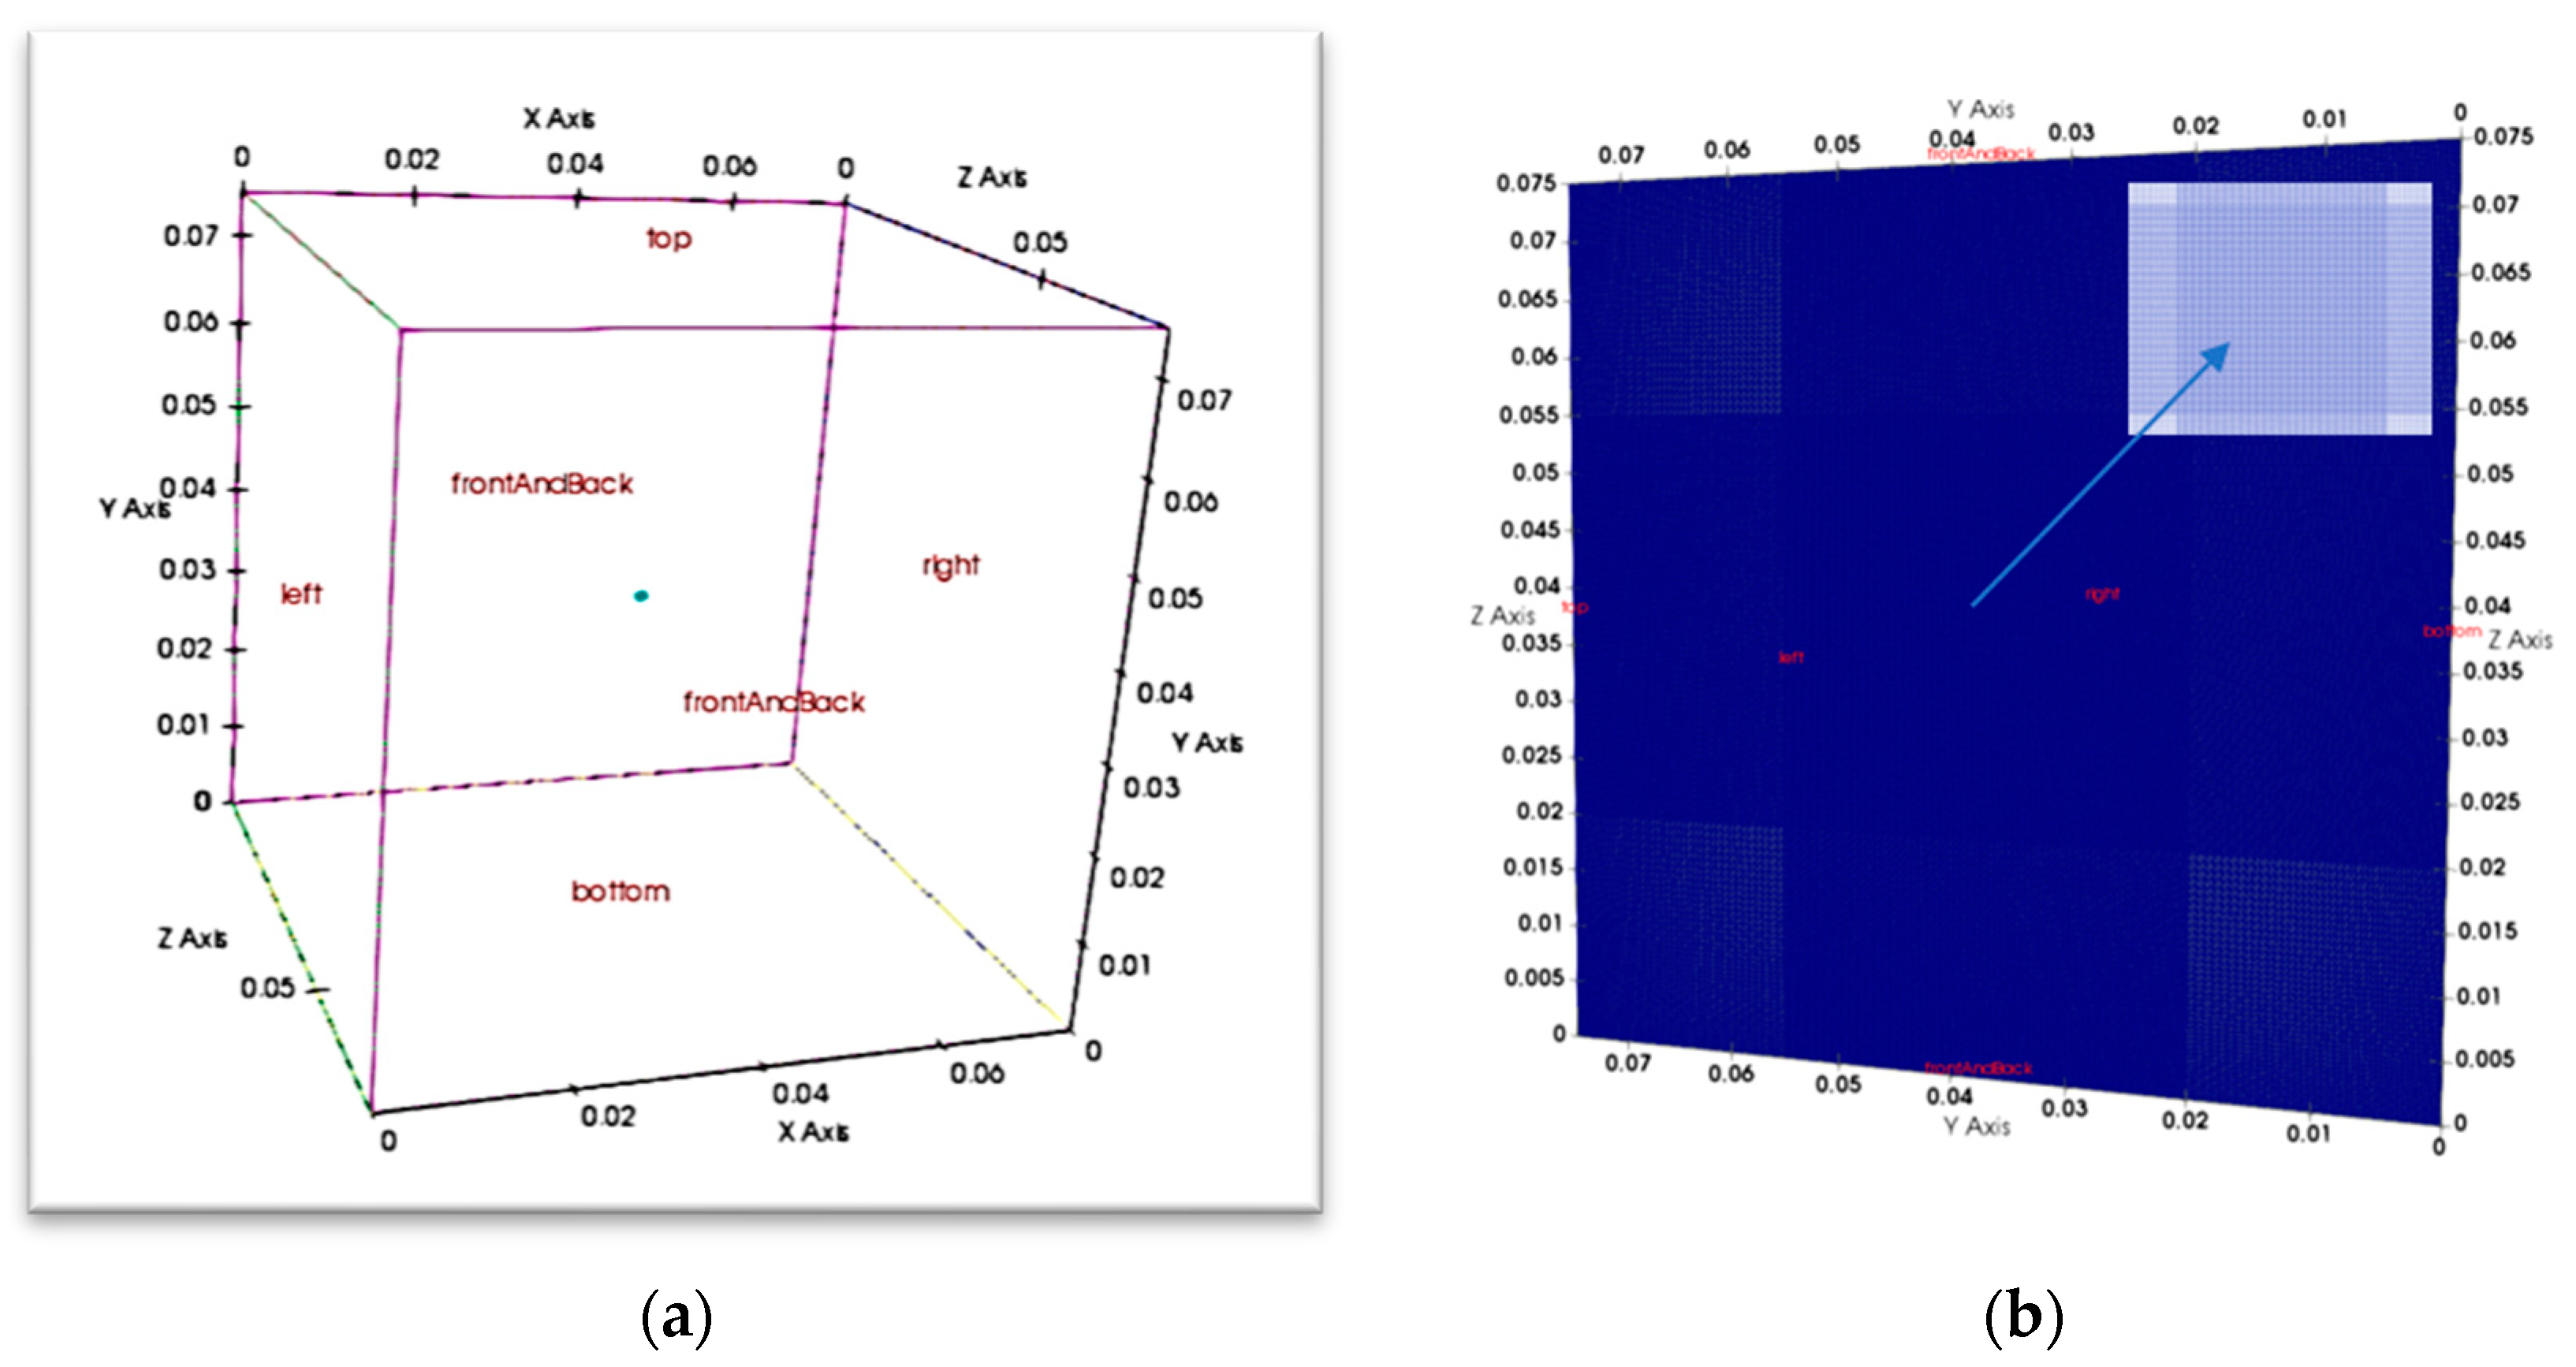
Figure 1. (a) The cubical computational domain, a 75 mm cubical domain, is a constant volume filled with frozen premixed methane/air mixtures. It shows different patch faces representing the top, left, right, bottom, and front and back boundaries (note: in the solver, a ‘patch’ is a general term for any boundary surface in the computational domain, while a ‘wall’ is a specific type of patch that represents a solid boundary where the no-slip condition is usually enforced for fluid flow simulations). (b) Mesh configuration: R) slice in the positive x-direction, with 200 grid points per side, contains a centred spherical flame kernel of 0.5 mm radius on a hexahedral mesh. The inset image displays the grid resolution within the kernel’s domain.
Fire 07 00366 g001
Figure 2. The grid sensitivity test (also see Table 1).
Fire 07 00366 g002
Figure 3. The numerical methodology of reactingFOAM solver.
Fire 07 00366 g003
Figure 4. (R1: ϕ = 1.0, 1 bar; for a successful ignition of a premixed CH4/air mixture at q = 1·108 W/m3; Tadia = 2337.95 K); R1 should be seen along with Figure 5a and Figure 6a. (R2: ϕ = 1, 5 bar; q = 0.68·108 W/m3; Tadia = 2351.33 K); see Figure 5b and Figure 6b. (R3: ϕ = 1, 10 bar; q = 0.58·108 W/m3; Tadia = 2363.52 K); see Figure 5c and Figure 6c. (R4: ϕ = 0.9, 1 bar; at q = 0.91·108 W/m3; Tadia = 2296.10 K); see Figure 5d and Figure 6d. (R5: ϕ = 0.9, 5 bar; at q = 0.65·108 W/m3; Tadia = 2317.39 K; see Figure 5e and Figure 6e. R6: ϕ = 0.9, 10 bar; at q = 0.50·108 W/m3; Tadia = 2338.11 K; see Figure 5f and Figure 6f. The contours of temperature (K), CH4, CO2, and H2O (in mass fraction) are presented. R represents row, and number 1 is the top row. Note: the computational time is 0.51 s, for example, for ϕ = 1 at 1 bar [computational time 0 to 1 s ≡ 10,000 iterations].
Fire 07 00366 g004
Figure 5. The temporal evolution of the key parameters’ temperature and mass fraction of H2O, CH4, and CO2 for ϕ = 1.0 and ϕ = 0.9 mixtures at pressures of 1, 5, and 10 bar. (a) Plot over time ϕ = 1, 1 bar; (b) Plot over time ϕ = 1, 5 bar; (c) Plot over time ϕ = 1, 10 bar. (d) Plot over time ϕ = 0.9, 1 bar; (e) Plot over time ϕ = 0.9, 5 bar; (f) Plot over time ϕ = 0.9, 10 bar.
Fire 07 00366 g005
Figure 6. Profiles of temperature and mass fraction of CO2, CH4, and H2O along the radius, passing through the center of the kernel for ϕ =1.0 and ϕ = 0.9 mixtures at pressures of 1, 5, and 10 bar. (a) Plot over radius ϕ = 1, 1 bar; (b) plot over radius ϕ = 1, 5 bar; (c) plot over radius ϕ = 1, 10 bar. (d) plot over radius ϕ = 0.9, 1 bar; (e) plot over radius ϕ = 0.9, 5 bar; (f) plot over radius ϕ = 0.9, 10 bar.
Fire 07 00366 g006
Figure 7. Correlation plots of QMIE against case numbers from Table 3; (left): ϕ = 1.0 and p = 1 bar; (right): ϕ = 0.9 and p = 1 bar. Both figures show the MIE values spanning over a period of sixty years. The MIE data are selected based on chronology from 1952, but this is in no way complete.
Fire 07 00366 g007
Figure 8. A summary of all simulation results for the CH4/air mixtures, ϕ 1.0 and 0.9. The subgraphs for ϕ 1.0 on y-axis are (a) ignition power density qMIE,; (b) minimum ignition energy QMIE; (c) time to reach shoot temperature, ts; (d) shoot temperature Ts; (e) adiabatic flame temperature Tadia as a function of pressure on x-axis. Similarly, the same quantities in the same order are given subfigures (fj) for ϕ 0.9.
Fire 07 00366 g008aFire 07 00366 g008b
Figure 9. The effect of pressure on adiabatic flame temperature, where ϕ represents the equivalence ratio (f could not be changed to the symbol ϕ), given in Table 4.
Fire 07 00366 g009
Figure 10. The correlation between the current simulations with the values obtained from a fit equation.
Fire 07 00366 g010
Table 1. Grid sensitivity test for ϕ = 1 at 1 bar conducted for stoichiometric methane/air mixture. The flame temperature converged to an optimal value as mesh resolution increased.
Number of Grid PointsNumber of
Grids over 75 mm
Grid Size RatioT (K)
Adiabatic Flame Temperature
Ignition
4,913,000170 × 170 × 1700.851996Yes
5,832,000180 × 180 × 1800.902080Yes
6,859,000190 × 190 × 1900.952196Yes
8,000,000200 × 200 × 2001.002283Yes
10,648,000220 × 220 × 2201.102308Yes
Table 2. The computational methodology of the reactingFOAM solver.
Start
1. Initialize Mesh and Geometry
  •  Define the cubical domain geometry.
  •  Generate a mesh suitable for the simulation.
2. Define Combustion Model and Reactions
  •  Choose appropriate combustion
  •  model.
  •  Specify single step using Arrhenius law for
  •  premixed combustion.
3. Set Boundary and Initial Conditions
  •  Set boundary conditions for temperature, pressure, and velocity.
  •  Initialize T, p, and U fields.
4. Set Combustion Parameters
  •  Define parameters in ‘fvOptions’.
  •  Initialize the term minimum ignition power density ’q’ with the ignition duration.
5. Time Stepping Loop
  •  Set initial time.
  •  Specify time step size and total simulation time.
6. Iteration Loop
  •  Initialize iteration counter.
7. Solve Momentum Equations (Navier–Stokes)
  •  Calculate velocity field considering combustion effects.
  •  Account for pressure–velocity coupling (e.g.,
  •  pressure correction).
  •  Update velocity field.
8. Solve Energy Equation (Temperature)
  •  Calculate temperature field considering
  •  combustion heat release.
  •  Account for energy transport (conduction,
  •  convection).
  •  Incorporate volumetric heat source term for
  •  combustion.
9. Solve Species Transport Equations
  •  Calculate transport of chemical species (e.g.,
  •  fuel, oxidizer, products).
10. Solve Pressure Equation
  •  Formulate and solve pressure equation (e.g.,
  •  SIMPLE algorithm).
  •  Update pressure field.
11. Check Convergence
  •  Evaluate convergence criteria for solution
  •  fields (e.g., T and species concentrations).
  •  If converged, exit iteration loop; otherwise, go
  •  to step 6.
12. Time Stepping
  •  Update time if the simulation reaches the desired end time.
13. Take the Output Results
  •  Write simulation results (e.g., temperature,
  •  pressure, species distributions).
  •  Visualization of results.
14. Check Simulation Termination
  •  If the end time is reached, exit the time
  •  stepping loop; otherwise, go to step 6.
End
Table 3. Ten literature sources spanning sixty years for comparison with the current computational data, validating MIE in mJ, with ϕ of 0.9 and 1.0 at 1 bar. The abbreviations are as follows: Expt (experiment) and Sim (simulation). Chemical kinetics details: Case 1: 53 species, 325 elementary reactions; Case 4: 27 species, 81 elementary reactions; Case 9: GRI 3.0 (53 species, 325 reactions); Case 10: 113 species, 710 reactions; Case 11: GRI 3.0 (53 species, 325 reactions) Case 12: PubChem database; Case 17: single-step mechanism.
Case NumberAuthor(s), Equivalence
Ratio, Pressure
MIE,
mJ
1Han et al. [21]
ϕ = 1.0, 1 bar
Expt0.324
2Sim1.349
3Yuasa, T. et al. [22]
ϕ = 1.0, 1 bar
Expt0.500
4Sim0.370
5Ghosh et al., [23]
ϕ = 1.0, 1 bar
Expt0.480
6Calcote et al. [8]
ϕ = 1.0, 1 bar
Expt0.480
7Lewis, B. and von Elbe, G. [24]
ϕ = 1.0, 1 atm.
Expt0.330
8Hankinson et al. [25]
ϕ = 1.0, 1 bar
Expt0.732
9Wu et al. [26]
ϕ = 1.0, 1 bar
Sim0.441
10Lu, H. [27]
ϕ = 1.0, 1 bar
Sim0.700
11Kim [28]
ϕ = 1.0, 1 bar
Sim0.500
12Wang, B. et al. [29]
ϕ = 1.0, 1 bar
Sim0.169
13Wang, B. et al. [29]
ϕ = 1.0, 1 bar
Expt0.672
14Current data
ϕ = 1.0, 1 bar
Sim0.524
15Hankinson et al. [25]
ϕ = 0.9, 1 bar
Expt0.679
16Lewis, B. and von Elbe, G. [30]. p. 357
ϕ = 0.9, 1 bar
Expt0.944
17Wu et al. [26]
ϕ = 0.9, 1 bar
Sim0.444
18Han et al. [21]
ϕ = 0.9, 1 bar
Expt0.220
19Sim0.944
20Su et al. et al. [31]
ϕ = 0.9, 1 bar
Expt0.282
21Sim0.356
22Lu, H. [27]
ϕ = 0.9, 1 bar
Sim0.700
23Current data
ϕ = 0.9, 1 bar
Sim0.476
Table 4. Simulation results of MIE and power density for two equivalence ratios at three different pressures. The non-ignition and ignition energy values are also shown.
fp, barq, W/m3 (×108)qMIE, W/m3 (×108)Q, mJQMIE, mJts, sTs, KTadia, K
equivalence ratioinitial pressurenon-ignitionignitionnon-ignitionIgnition(shoot time)(shoot temperature)(adiabatic temperature)
110.9951.0000.5210.5240.5082481.2362337.95
50.6750.6800.3540.3560.4203443.1762351.33
100.5750.5800.3010.3040.2797385.5612363.52
0.910.9050.9100.4740.4760.4713457.8032296.10
50.6450.6500.3380.3400.3589427.3562317.39
100.4950.5000.2590.2620.2201382.6882338.11
Disclaimer/Publisher’s Note: The statements, opinions and data contained in all publications are solely those of the individual author(s) and contributor(s) and not of MDPI and/or the editor(s). MDPI and/or the editor(s) disclaim responsibility for any injury to people or property resulting from any ideas, methods, instructions or products referred to in the content.