
Sensitivity Analysis of FDS Program Parameters for Determining the Stand-Off Distances in Fire Safety Solutions for Buildings—Slovak Case Study


Abstract
1. Introduction
2. Materials, Methods and Results
2.1. Addressing Stand-Off Distances in FDS in General
- TN: the standard gas temperature in °C;
- t: the value of the standard fire duration time, τe (min), for production buildings, or, equivalent to this value, the calculated fire load for non-production buildings, pv (kg·m−2);
- q: the area heat flux density (kW·m−2).
2.2. Sensitivity Analysis
2.2.1. Effect of Selected Parameters on the Computational Time of Simulations
2.2.2. Influence of Selected Parameters on the Size of Stand-Off Distances
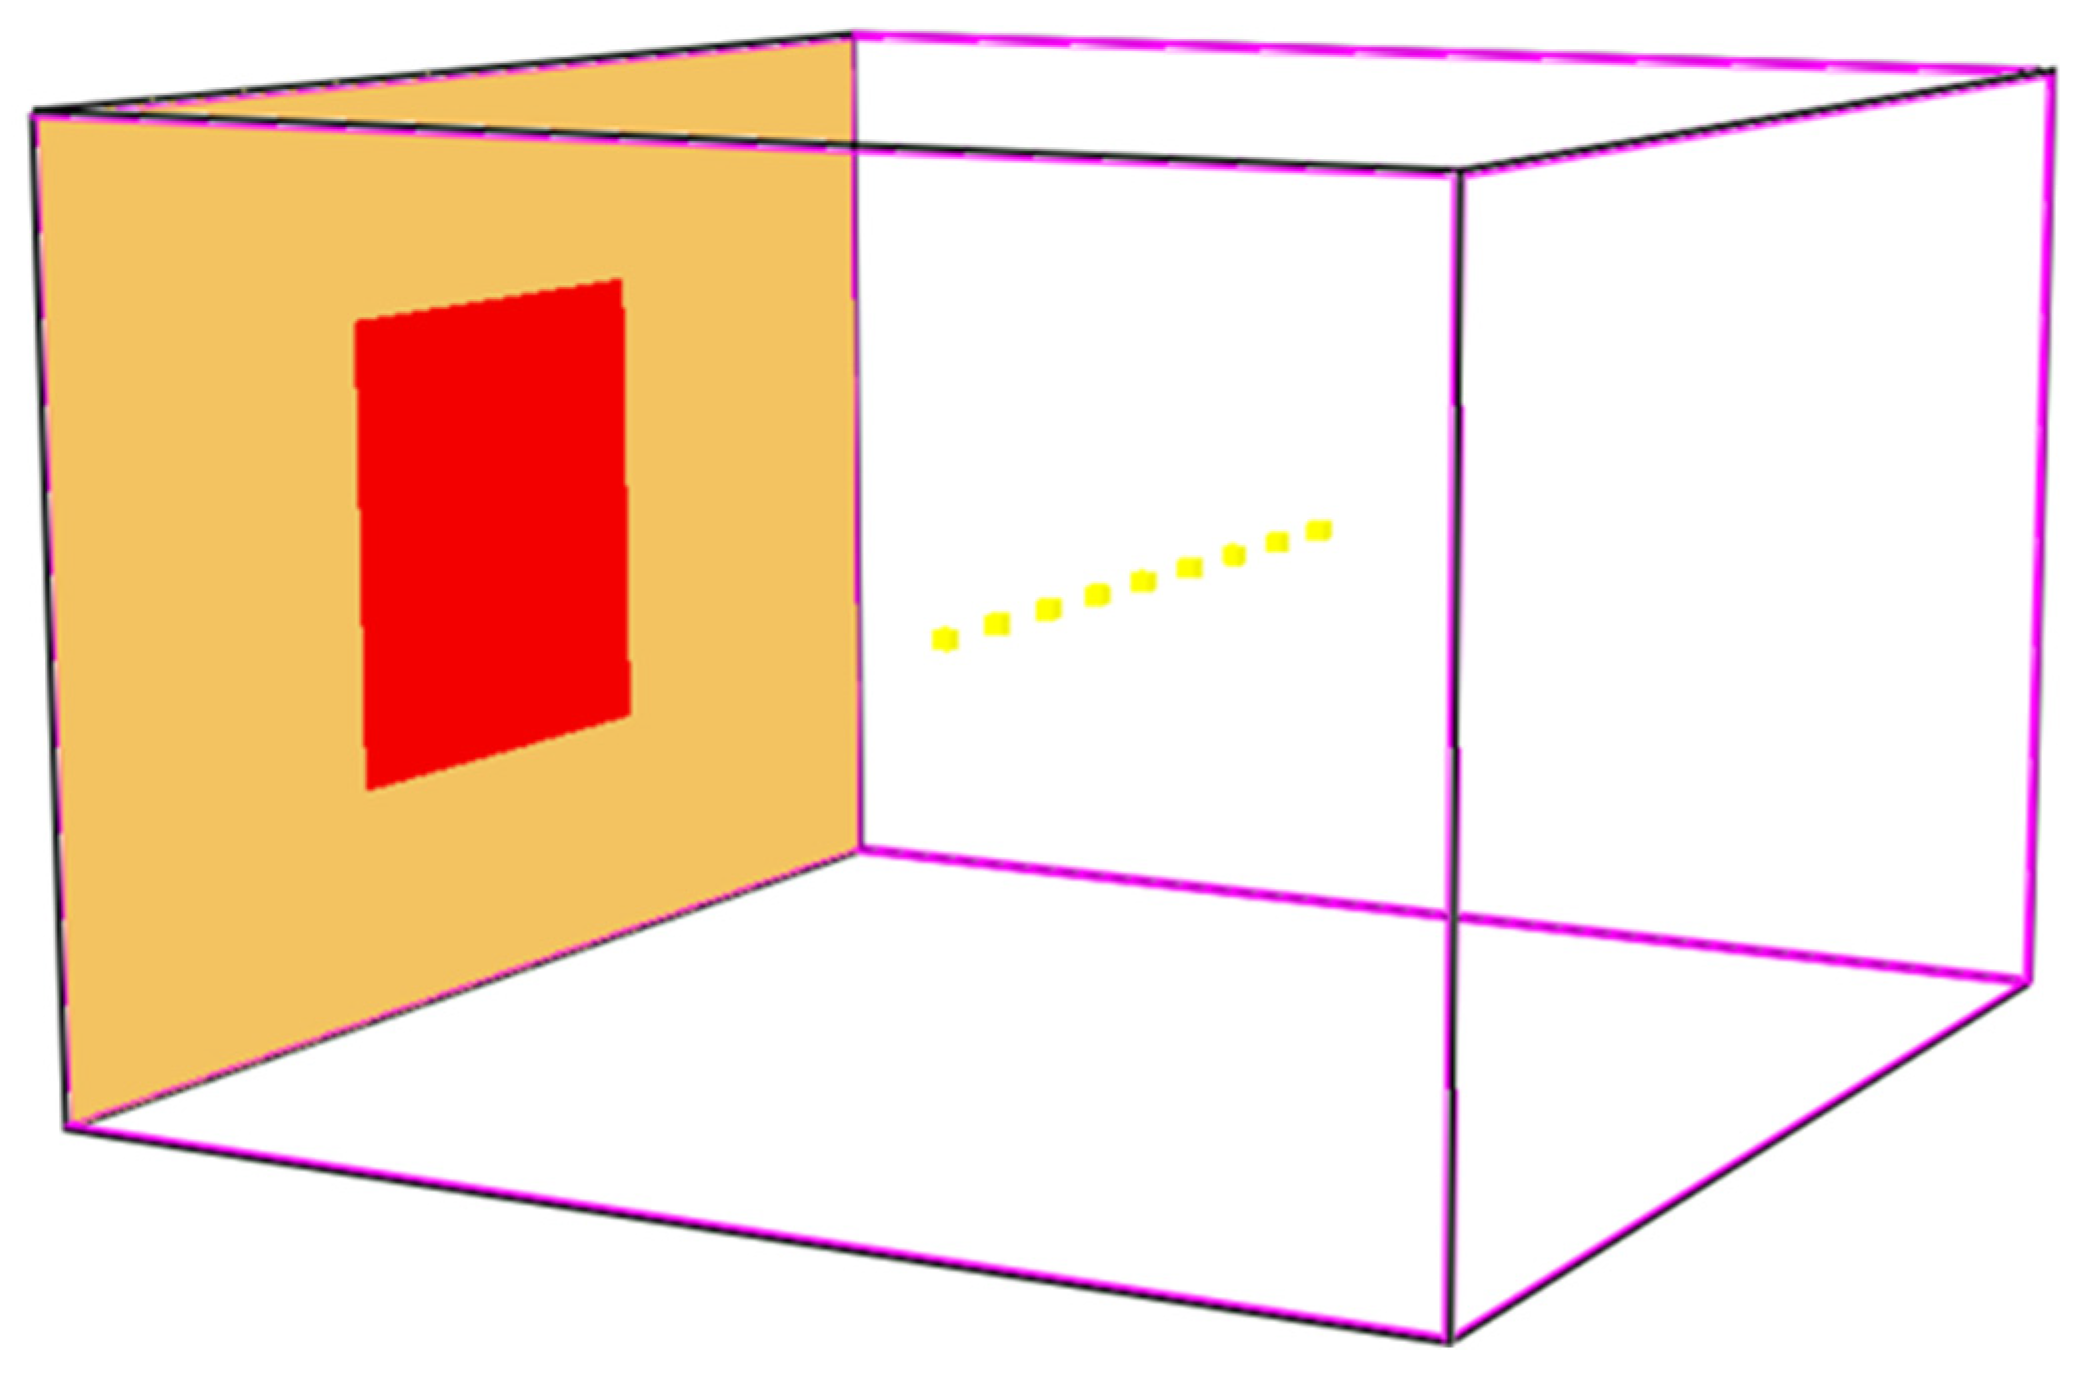
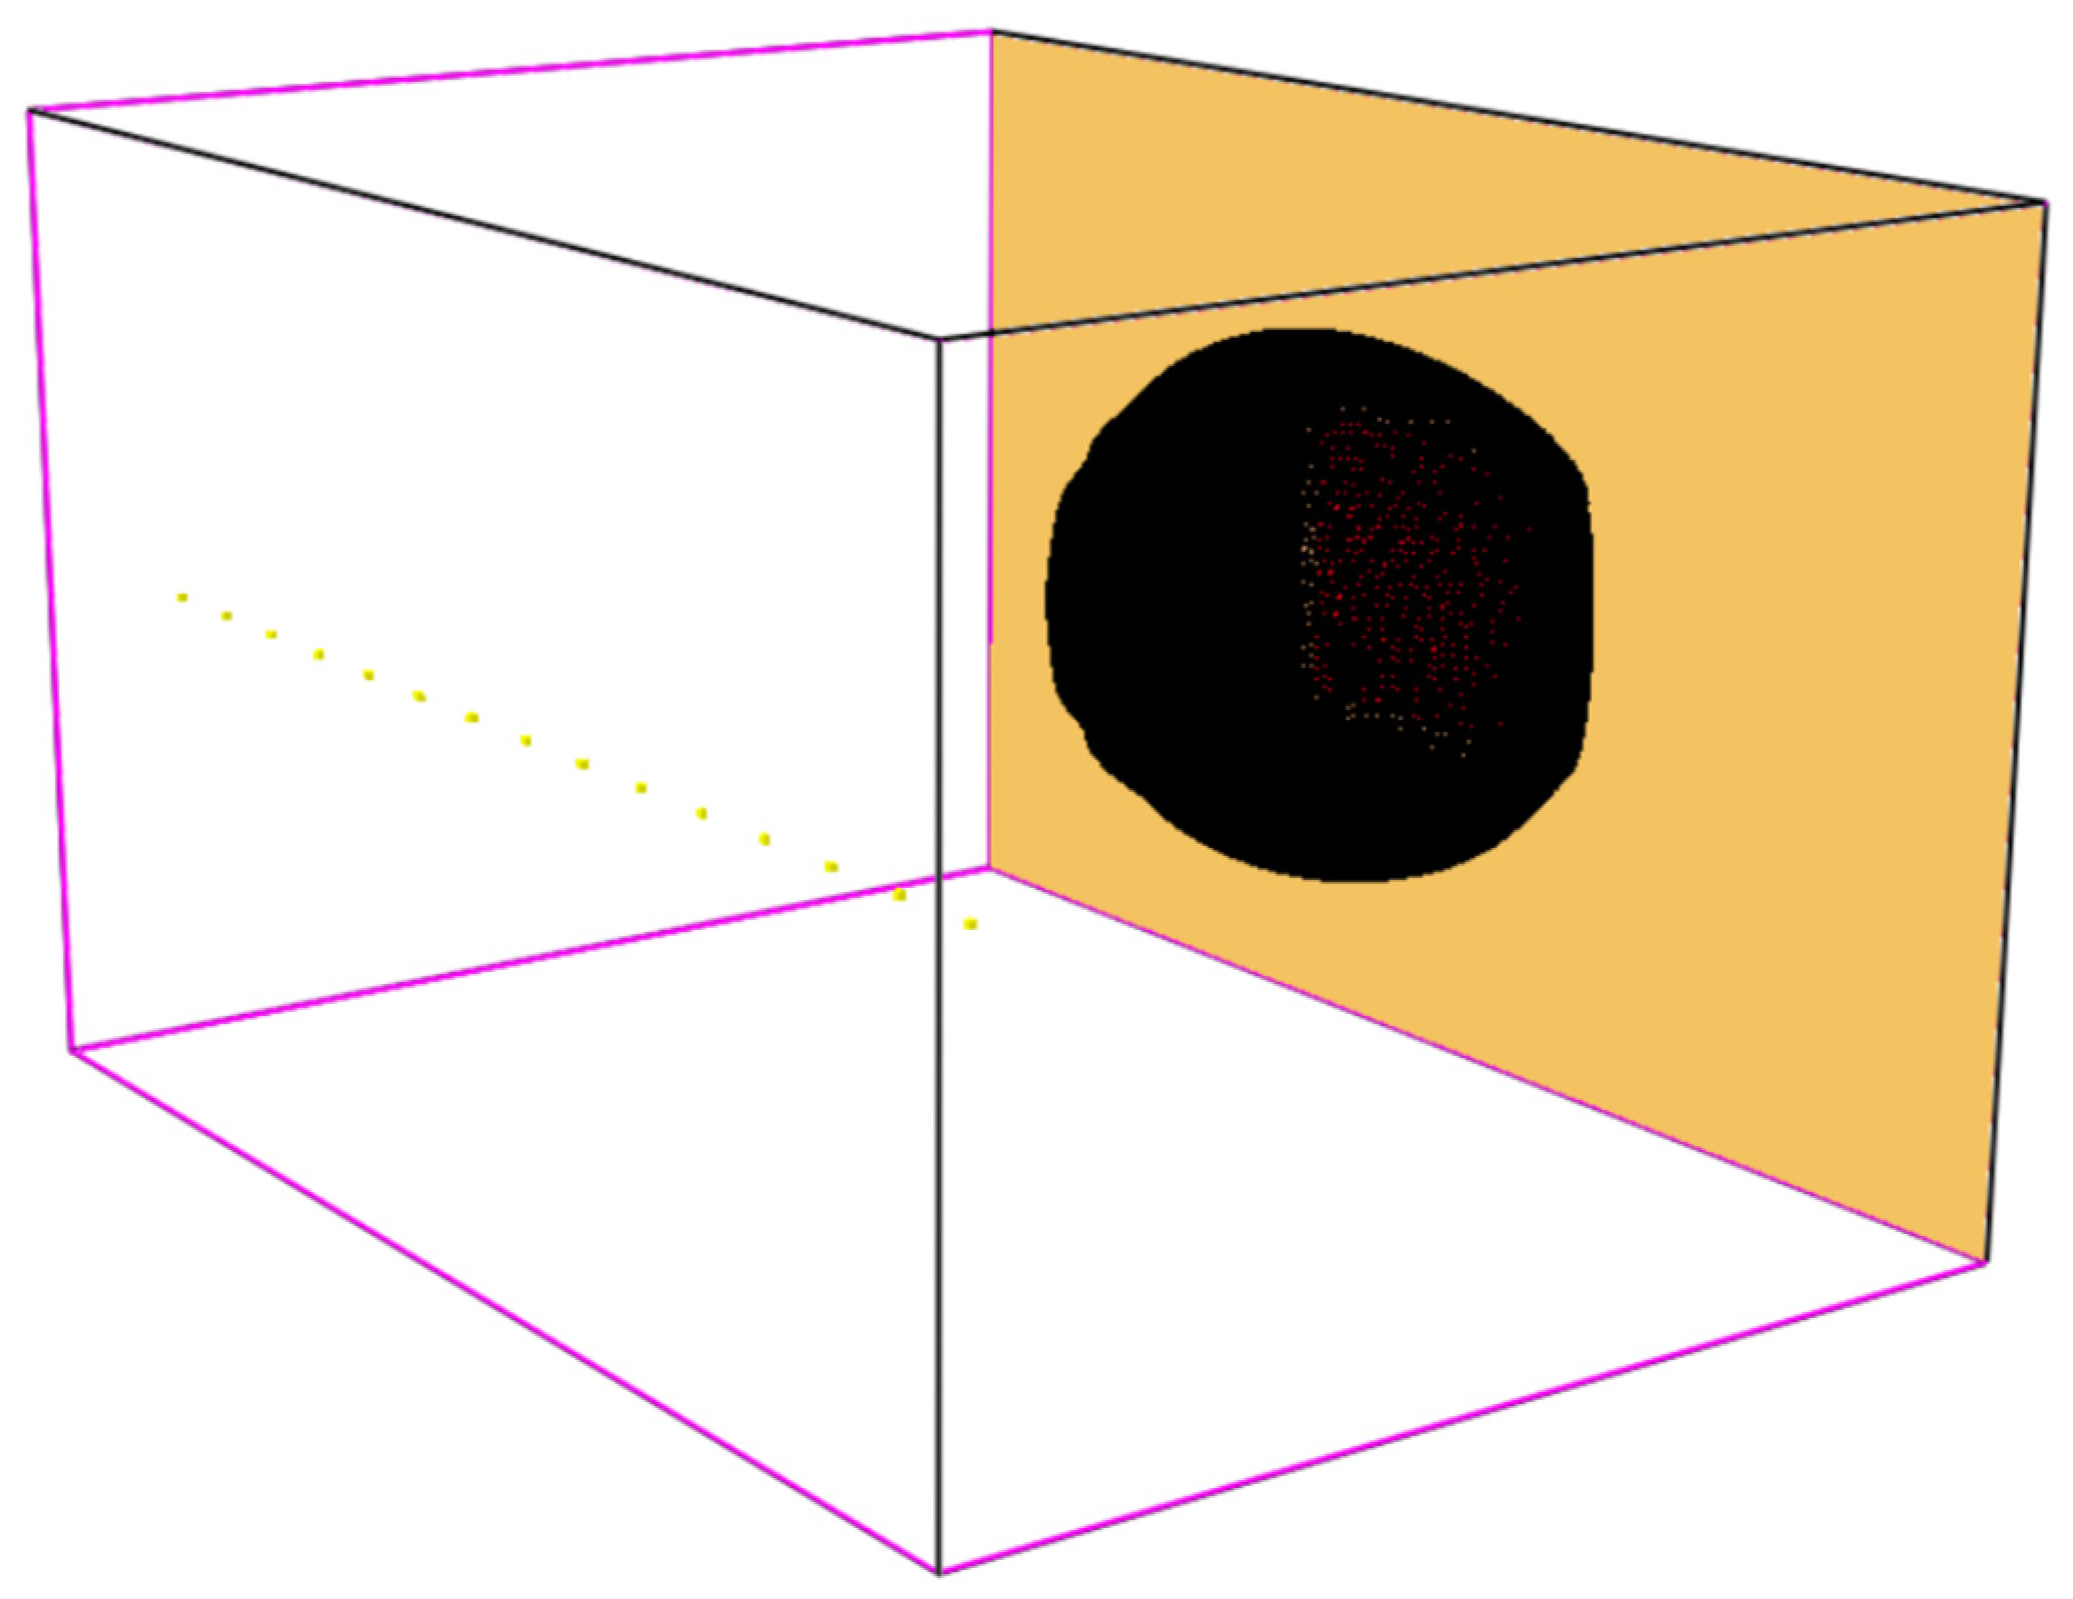
- The base model was always made up of five walls that formed an open surface and one wall that formed an inert surface. On this surface, there was always a radiating surface that represented a fully fire-open area. The size of the radiant surfaces and their quantity varied depending on the parameter under study, but the temperature of the radiant surface was always constant, with a value of 900 °C (Figure 2);
- The model always defined a Slice File Output, whose location was in the middle of the height of the computational grid, and an Isosurface File Output with a logging value of 18.5 kW·m−2;
- The measuring devices were always of the Gauge Heat Flux Gas type;
- The computational time of the simulations was set to 6 s, since the heat radiating from the source would already be steady.
- Influence of Time Step Increment and Angle Increment parameters
- Influence of the Humidity parameter
- Influence of Path Length and Number of Radiation Angles parameters
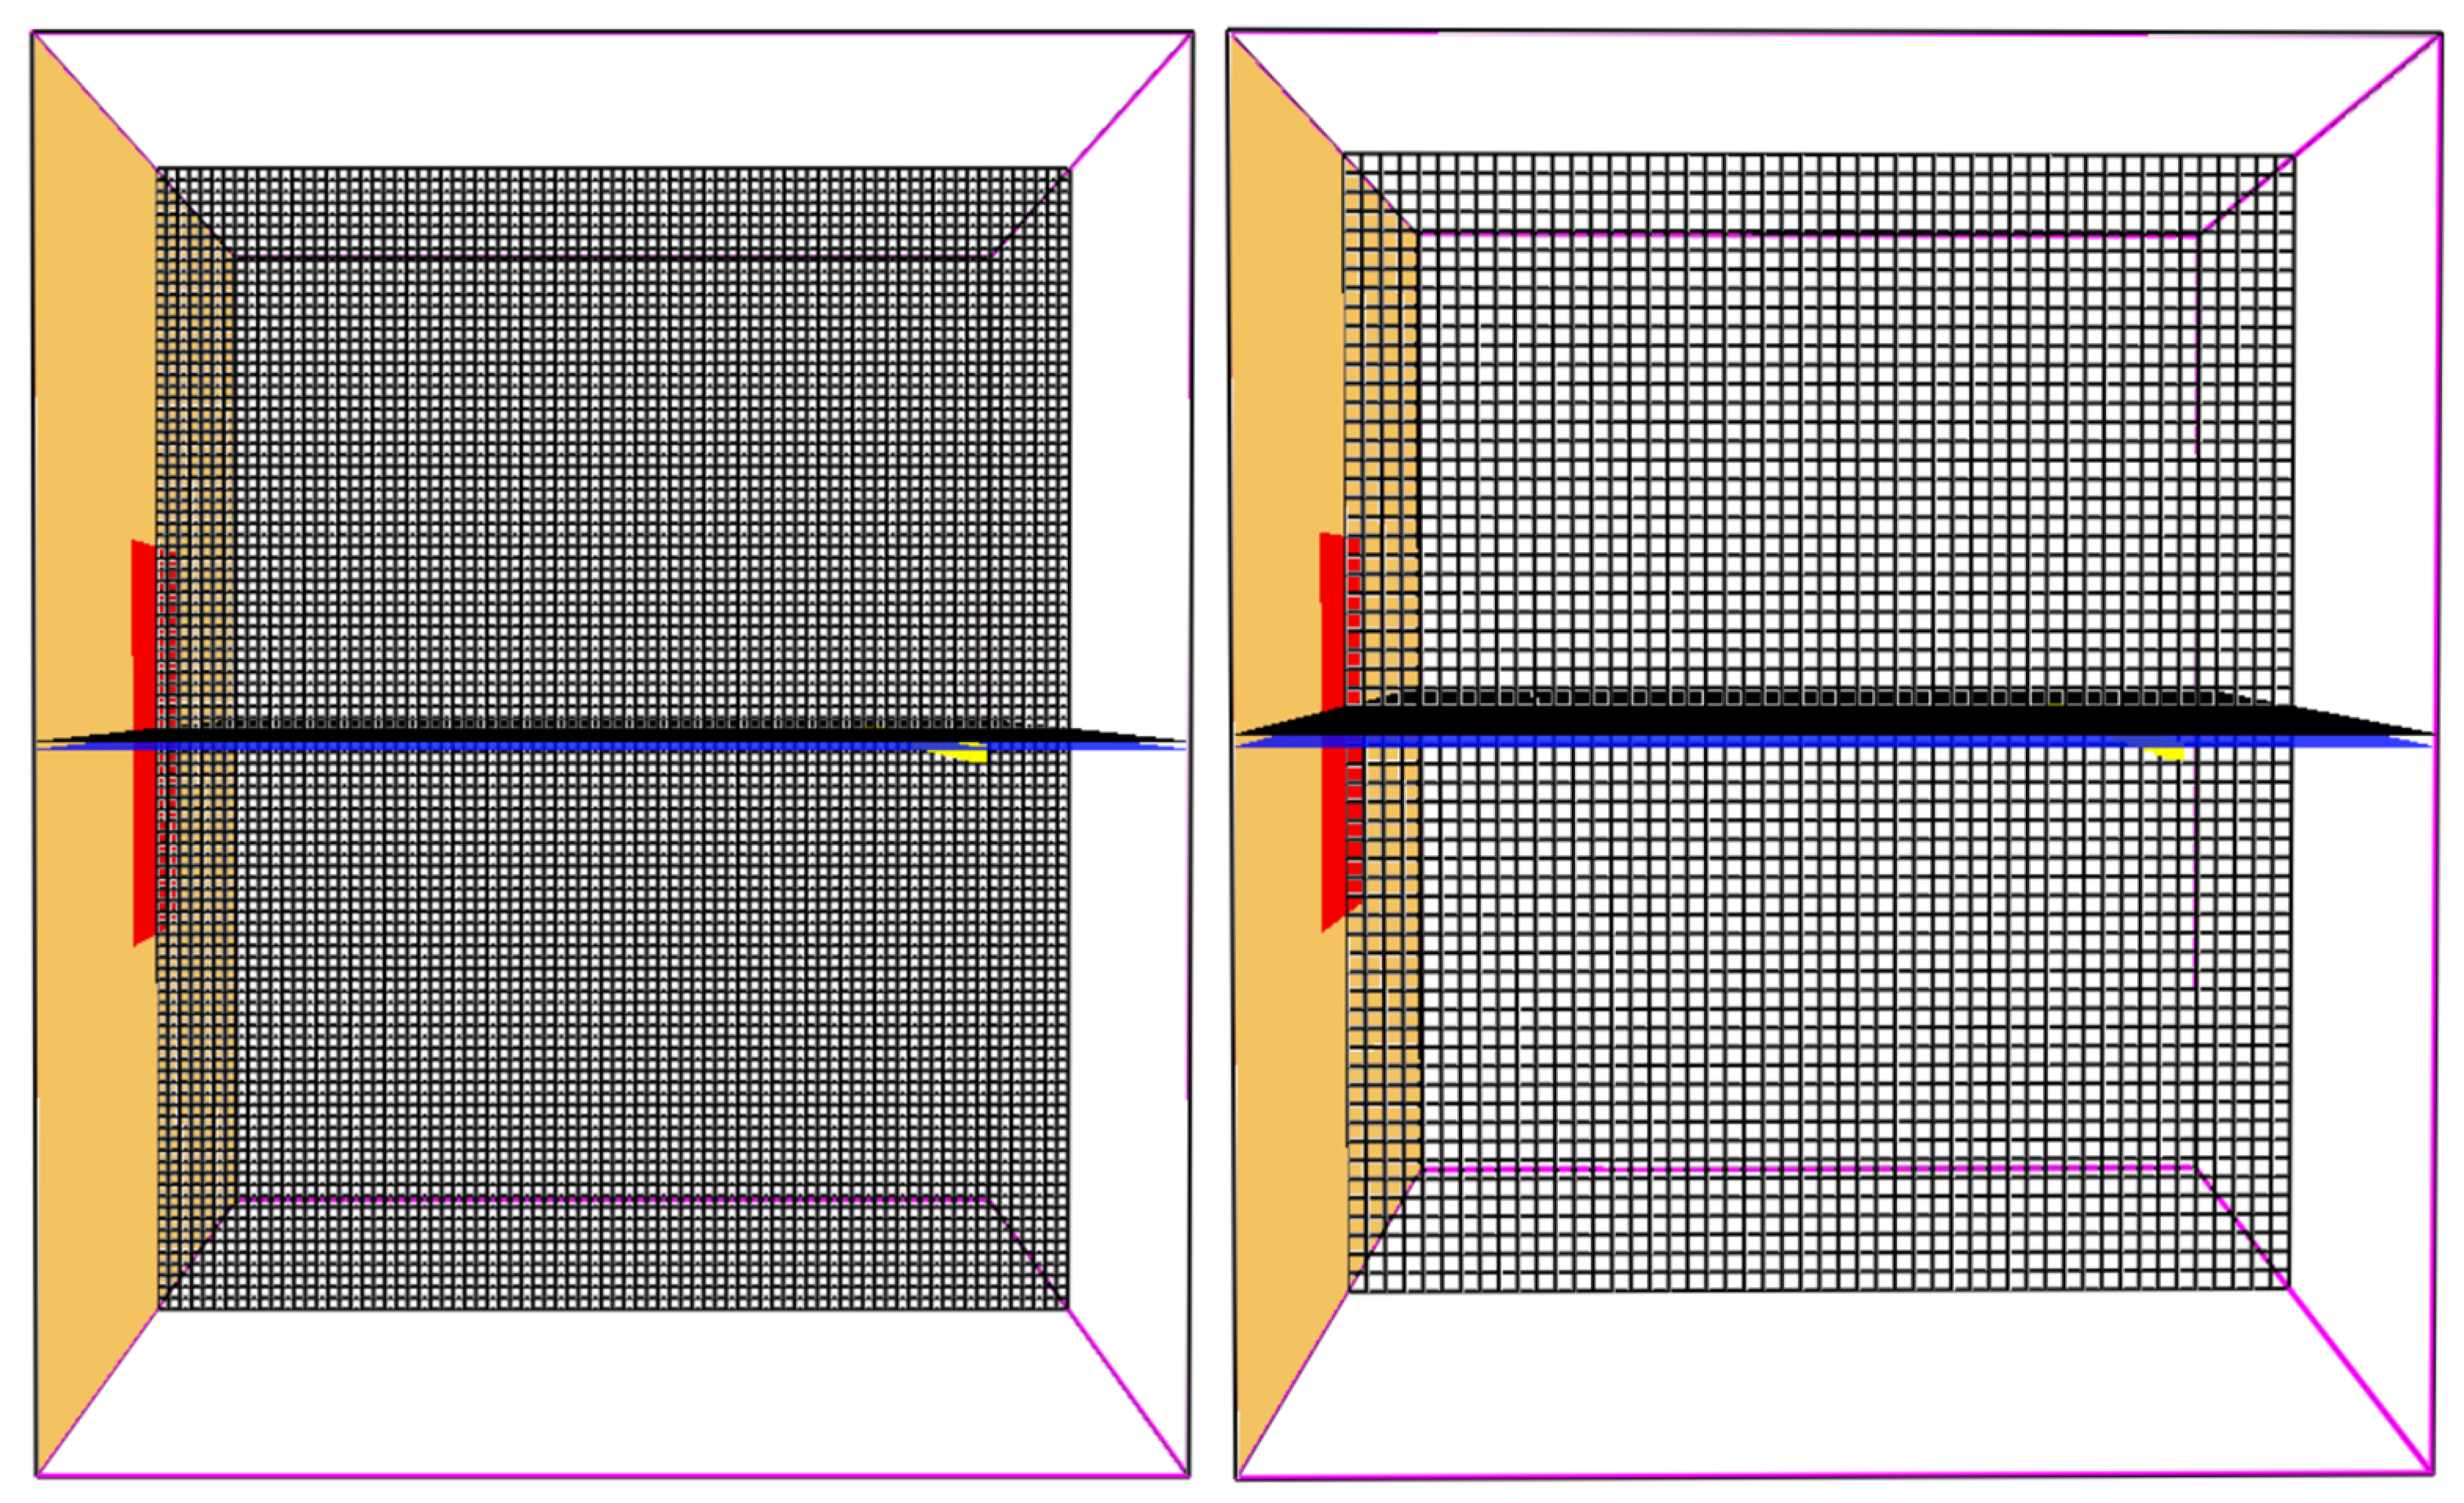
- Influence of the parameter Size of computational cells
- Influence of the parameter Number of measuring devices
3. Conclusions
- The size of the computational cells in the computational grid → 50 mm;
- Path Length → possible maximum;
- Number of spatial radiation angles (Number of Radiation Angles) → 500;
- Time Step Increment and Angle Increment → 1:1;
- Relative humidity (Humidity) → 40%.
Author Contributions
Funding
Institutional Review Board Statement
Informed Consent Statement
Data Availability Statement
Conflicts of Interest
Abbreviations
| FDS | Fire Dynamics Simulator |
| STN | Slovak Technical Standard |
Appendix A
- &HEAD CHID=‘basicmodel’/
- &TIME T_END=10.0/
- &DUMP DT_DEVC=1.0, DT_RESTART=5.0/
- &MESH ID=‘room’, IJK=30,30,20, XB=0.0,3.0,0.0,3.0,0.0,2.0/
- &SURF ID=‘FIRE’, COLOR=‘RED’, TMP_FRONT=900/
- &VENT ID=‘o1’, SURF_ID=‘OPEN’,XB=0.0,0.0,0.0,3.0,0.0,2.0/
- &VENT ID=‘o2’, SURF_ID=‘OPEN’,XB=0.0,3.0,3.0,3.0,0.0,2.0/
- &VENT ID=‘o3’, SURF_ID=‘OPEN’,XB=0.0,3.0,0.0,0.0,0.0,2.0/
- &VENT ID=‘o4’, SURF_ID=‘OPEN’,XB=0.0,3.0,0.0,3.0,2.0,2.0/
- &VENT ID=‘o5’, SURF_ID=‘OPEN’,XB=0.0,3.0,0.0,3.0,0.0,0.0/
- &VENT ID=‘fire1’, SURF_ID=‘FIRE’,XB=3.0,3.0,1.0,2.0,0.5,1.5/
- &DEVC ID=‘ghfg1’, QUANTITY=‘GAUGE HEAT FLUX GAS’,XYZ=1.4,0.7,1.0, ORIENTATION=1.0,0.0,0.0/
- &DEVC ID=‘ghfg2’, QUANTITY=‘GAUGE HEAT FLUX GAS’,XYZ=1.4,0.9,1.0, ORIENTATION=1.0,0.0,0.0/
- &DEVC ID=‘ghfg3’, QUANTITY=‘GAUGE HEAT FLUX GAS’,XYZ=1.4,1.1,1.0, ORIENTATION=1.0,0.0,0.0/
- &DEVC ID=‘ghfg4’, QUANTITY=‘GAUGE HEAT FLUX GAS’,XYZ=1.4,3.1,1.0, ORIENTATION=1.0,0.0,0.0/
- &DEVC ID=‘ghfg5’, QUANTITY=‘GAUGE HEAT FLUX GAS’,XYZ=1.4,5.1,1.0, ORIENTATION=1.0,0.0,0.0/
- &DEVC ID=‘ghfg6’, QUANTITY=‘GAUGE HEAT FLUX GAS’,XYZ=1.4,7.1,1.0, ORIENTATION=1.0,0.0,0.0/
- &DEVC ID=‘ghfg7’, QUANTITY=‘GAUGE HEAT FLUX GAS’,XYZ=1.4,9.1,1.0, ORIENTATION=1.0,0.0,0.0/
- &DEVC ID=‘ghfg8’, QUANTITY=‘GAUGE HEAT FLUX GAS’,XYZ=1.4,2.1,1.0, ORIENTATION=1.0,0.0,0.0/
- &DEVC ID=‘ghfg9’, QUANTITY=‘GAUGE HEAT FLUX GAS’,XYZ=1.4,2.3,1.0, ORIENTATION=1.0,0.0,0.0/
- &SLCF QUANTITY=‘INTEGRATED INTENSITY’, VECTOR=.TRUE., CELL_CENTERED=.TRUE., ID=‘ID’, PBZ=1.0/
- &ISOF QUANTITY=‘INTEGRATED INTENSITY’, VALUE=18.5/
- &TAIL/
References
- Lu, K.; Hu, L.; Delichatsios, M.; Tang, F.; Qiu, Z.; He, L. Merging behavior of facade flames ejected from two windows of an under-ventilated compartment fire. Proc. Combust. Inst. 2015, 35, 2615–2622. [Google Scholar] [CrossRef]
- Gannouni, S. Critical velocity for preventing thermal backlayering flow in tunnel fire using longitudinal ventilation system: Effect of floor-fire separation distance. Int. J. Ff. Therm. Sci. 2022, 171, 107192. [Google Scholar] [CrossRef]
- Eurocodes [Eurokódy]. Available online: https://www.normoff.gov.sk/stranka/661/eurokody/ (accessed on 13 January 2025). (In Slovak)
- Introduction and Use of Eurocodes in the Slovak Republic [Zavedenie a Používanie Eurokódov v Slovenskej Republike]. Available online: https://www.sksi.sk/buxus/docs/statika_2009_balaz.pdf (accessed on 9 February 2009). (In Slovak).
- Results of the EU Survey on Electromobility and Fire Safety in Buildings [Výsledky Prieskumu EÚ o Elektromobilite a Protipožiarnej Bezpečnosti Stavieb]. Available online: https://appo.sk/vysledky-prieskumu-eu-o-elektromobilite-a-protipoziarnej-bezpecnosti-stavieb/ (accessed on 6 September 2024). (In Slovak).
- Report on the EU Legislation, Building Codes, Guidelines on Fire Safety of EVs Recharging Infrastructure in Covered and Above Ground Parkings. Available online: https://appo.sk/engine/wp-content/uploads/2024/09/Report-on-fire-safety-of-EVs-recharging-infrastructure-parkings.pdf (accessed on 6 September 2024).
- Act. No. 314/2001 Coll. on Protection Against Fires [Zákon č. 314/2001 Z.z., o Ochrane Pred Požiarmi]. Bratislava. Slovakia. 2001. Available online: https://static.slov-lex.sk/pdf/SK/ZZ/2001/2001c132.pdf (accessed on 13 January 2025). (In Slovak).
- Act. No. 25/2025 Coll. Building Act [Zákon č. 25/2025 Z.z., Sstavebný Zákon]. Bratislava. Slovakia. 1976. Available online: https://www.slov-lex.sk/ezbierky/pravne-predpisy/SK/ZZ/1976/50/ (accessed on 13 January 2025). (In Slovak).
- Reg. 94/2004 Coll. Decree of the Ministry of the Interior of the Slovak Republic, Establishing Technical Requirements for Fire Safety in the Construction and Use of Buildings [Vyhláška MV SR č. 94/2004 Z.z., Ktorou sa Ustanovujú Technické Požiadavky na Protipožiarnu Bezpečnosť pri Výstavbe a pri Užívaní Stavieb]. Bratislava. Slovakia. 2004. Available online: https://www.zakonypreludi.sk/zz/2004-94 (accessed on 13 January 2025). (In Slovak).
- Reg. 121/2002 Coll. Decree of the Ministry of the Interior of the Slovak Republic on Fire Prevention [Vyhláška MV SR č. 121/2002 Z.z., o Požiarnej Prevencii]. Bratislava. Slovakia. 2002. Available online: https://www.zakonypreludi.sk/zz/2002-121 (accessed on 13 January 2025). (In Slovak).
- Reg. 699/2041 Coll. Decree of the Ministry of the Interior of the Slovak Republic on on the Provision of Water for Extinguishing Fires in Buildings [Vyhláška MV SR č. 699/2001 Z.z., o Zabezpečení Stavieb Vodou na Hasenie Požiarov]. Bratislava. Slovakia. 2001. Available online: https://www.zakonypreludi.sk/zz/2004-699 (accessed on 13 January 2025). (In Slovak).
- STN 92 0201–1; Fire safety of Buildings—Fire Risk, Size of Fire Compartment [Protipožiarna Bezpečnosť Stavieb–POŽIARNE riziko, Veľkosť Požiarneho Úseku]. Slovak Standards Institute: Bratislava, Slovania, 2000. (In Slovak)
- STN 92 0201–2; Fire Safety of Buildings—Building Structures [Protipožiarna Bezpečnosť Stavieb–Stavebné Konštrukcie]. Slovak Standards Institute: Bratislava, Slovania, 2007. (In Slovak)
- STN 92 0201–3; Fire Safety in Buildings—Escape Routes and Evacuation [Protipožiarna Bezpečnosť Stavieb–Únikové Cesty a Evakuácia]. Slovak Standards Institute: Bratislava, Slovania, 2000. (In Slovak)
- STN 92 0201–4; Fire Safety of Buildings—Spacing Distances [Protipožiarna Bezpečnosť Stavieb–Odstupové Vzdialenosti]. Slovak Standards Institute: Bratislava, Slovania, 2000. (In Slovakia)
- STN 92 0400; Water Supply for Firefighting [Zásobovanie Vodou na Hasenie Požiarov]. Slovak Standards Institute: Bratislava, Slovania, 2005. (In Slovak)
- STN 92 0202–1; Equipment of Buildings with Fire Extinguishers [Vybavenie Stavieb Hasiacimi Prístrojmi]. Slovak Standards Institute: Bratislava, Slovania, 1999. (In Slovak)
- STN 92 0241; Occupation of Buildings by Persons [Obsadenie Stavieb Osobami]. Slovak Standards Institute: Bratislava, Slovania, 2012. (In Slovak)
- STN EN 1991–1–2 (73 0035)–Eurocode 1; Loads on Structures—Part 1–2: General Loads—Loads on Structures Subjected to Fire [Eurokód 1: Zaťaženie Konštrukcií–Časť 1–2: Všeobecné Zaťaženia—Zaťaženia Konštrukcií Namáhané Požiarom]. Slovak Standards Institute: Bratislava, Slovania, 1991. (In Slovak)
- Reichel, V. Preventing Damage—Designing for Fire Safety in Manufacturing Facilities [Zabraňujeme Škodám–Navrhování Požární Bezpečnosti Výrobních Objektů–Svazek 27–Část IV]; ČESKÁ STÁTNI POJIŠŤOVNA: Prague, Czech Republic, 1989; Volume 27, Part IV. (In Slovak) [Google Scholar]
- ČSN 73 0804; Fire Safety in Buildings. Production Buildings [Požární Bezpečnost Staveb. Výrobní Objekty]. Slovak Standards Institute: Bratislava, Slovania, 1995. (In Slovak)
- ČSN 73 0802; Fire Safety in Buildings. Non-Production Buildings [Požární Bezpečnost Staveb. Nevýrobní Objekty]. Slovak Standards Institute: Bratislava, Slovania, 1995. (In Slovak)
- Fire Safety Regulatory Framework. Available online: https://fireandemergency.nz/businesses-and-landlords/building-and-designing-for-fire-safety/fire-safety-regulatory-framework/ (accessed on 13 January 2025).
- B–RISK: Design Fire Pool. Available online: https://www.branz.co.nz/fire-safety-design/b-risk/ (accessed on 10 October 2023).
- Hodúlová, D. Implementation of Fire Modelling in Determining the Stand-Off Distances from Buildings [Implementácia Požiarneho Modelovania Pri Určovaní Odstupových Vzdialeností od Stavieb]. Ph.D. Thesis, University of Zilina, Faculty of Security Engineering, Zilina, Slovakia, 2025. (In Slovak). [Google Scholar]
- Shannon, W.; Anand, C.; Shotorban, B.; Mahalingam, S. Fire behavior in multiple burning shrubs separated horizontally and vertically. Fire Saf. J. 2020, 118, 103236. [Google Scholar] [CrossRef]
- Wang, Z.; Yu, L.; Ji, J. Numerical Investigation on the Asymmetric Flow Characteristics of Two Propane Fires of Unequal Heat Release Rate in Open Space. Fire Technol. 2021, 57, 2181–2203. [Google Scholar] [CrossRef]
- Li, Y.; Kuang, Z.; Fan, Z.; Shuai, J. Evaluation of the safe separation distances of hydrogen-blended natural gas pipelines in a jet fire scenario. Int. J. Hydrogen Energy 2023, 48, 18804–18815. [Google Scholar] [CrossRef]
- Cote, A.; Hall, J.R.; Powell, P.; Grant, C.C.; Solomon, R.E. Fire Protection Handbook, 20th ed.; National Fire Protection Association: Quincy, MA, USA, 2008. [Google Scholar]
- Špilák, D. (Technical University, Zvolen, Slovakia). Personal Communication, 2025.
- Computer Fire Models. Available online: https://www.interfire.org/res_file/firemod.asp (accessed on 13 January 2025).
- Mózer, V. On the issue of probabilistic fire risk modelling [K Problematike Pravdepodobnostného Modelovania Požiarneho Rizika]. In Proceedings of the Dealing with Crisis Situations in Specific Environments [Riešenie krízových Situácií v Špecifickom Prostredí], Zilina, Slovakia, 20–21 May 2015. (In Slovak). [Google Scholar]
- McGrattan, K.B.; Hostikka, S.; McDermott, R.; Floyd, J.; Weinschenk, C. Fire Dynamics Simulator–User’s Guide; NIST–National Institute of Standards and Technology: Gaithersburg, MD, USA, 2013. [Google Scholar]
- PyroSim User Manual. Available online: https://support.thunderheadeng.com/docs/pyrosim/2024-2/user-manual/ (accessed on 13 January 2025).
- Peacock, D.; McGrattan, K.B.; Forney, G.P.; Reneke, P.A. CFAST–Consolidated Fire and Smoke Transport, 7th ed.; NIST–National Institute of Standards and Technology: Gaithersburg, MD, USA, 2015. [Google Scholar]
- Jang, H. Hwang Ch Evaluation of Available Safety Egress Time (ASET) in Performance—Based Design (PBD) using. CFAST Fire 2024, 7, 108. [Google Scholar] [CrossRef]
- Autodesk CFD: Simulation Software for Engineering Complex Luquid, Gas, and Air Systems. Available online: https://www.autodesk.com/products/cfd/overview?term=1-YEAR&tab=subscription (accessed on 13 January 2025).
- Pesic, D.J.; Anghel, I. Simulation of Fire Spread Between Residential Buildings Regarding Safe Separation Distances. Tech. Vjesn. 2017, 24, 1137–1145. [Google Scholar]
- Use of CFD in Fire Hazardous AREA Prediction [Využití CFD při Predikci Požárně Nebezpečného Prostoru]. Available online: https://www.tzb-info.cz/pozarni-bezpecnost-staveb/23115-vyuziti-cfd-pri-predikci-pozarne-nebezpecneho-prostoru (accessed on 22 November 2021). (In Slovak).
- Kadlic, M.; Mózer, V. Impact of selected fire-modelling input parameters on the safe available evacuation. Krízový Manažment 2017, 16, 5–13. [Google Scholar] [CrossRef]
- Kadlic, M.; Magdolenová, P. Evaluation of selected input parameters in tunnel fire modelling. Transp. Res. Procedia 2019, 40, 1412–1417. [Google Scholar] [CrossRef]
- Kadlic, M. The Impact of Variability and Uncertainty of Input Parameters on the Quality of Fire Model Outputs [Vplyv Variability a Neistoty Vstupných Parametrov na Kvalitu Výstupov Požiarnych Modelov]. Ph.D. Thesis, University of Zilina, Faculty of Security Engineering, Zilina, Slovakia, 2019. (In Slovak). [Google Scholar]
- Hodúlová, D. Computer Fire Simulation [Počítačová Simulácia Požiaru]. Bachelor’s Thesis, University of Zilina, Faculty of Security Engineering, Zilina, Slovakia, 2020. (In Slovak). [Google Scholar]
- Magdolenová, P. Advanced Modelling of the Impact of Fire on Building Structures [Pokročilé Modelovanie Vplyvu Požiaru na Konštrukcie Stavieb]. Ph.D. Thesis, University of Zilina, Faculty of Security Engineering, Zilina, Slovakia, 2021. (In Slovak). [Google Scholar]
- Hodúlová, D. Modelling Car Fires in Confined Spaces [Modelovanie Požiarov Automobilov v Uzatvorených Pristoroch]. Diploma Thesis, University of Zilina, Faculty of Security Engineering, Zilina, Slovakia, 2022. (In Slovak). [Google Scholar]
- Zoleík, J. Modelling of Fires on the Water Surface During the Passage of the KB-160 Floating Device [Modelovanie Požiarov na Vodnes Ploche Pri Prechádzke Plávajúceho Zariadenia KB-160]. Diploma Thesis, University of Zilina, Faculty of Security Engineering, Zilina, Slovakia, 2022. (In Slovak). [Google Scholar]
- Hodúlová, D.; Gašpercová, S. Solving spacing distances of a selected object using a prescriptive approach and modelling tools. Spektrum 2023, 23, 7–10. [Google Scholar]
- Chen, H.; Feng, Y.; Zhang, C.H.; Yu, L.; Shu, Y.; Zhang, Y.; Meng, T.; Jiang, C.H.; Xu, F. Numerical simulation of passenger evacuation and heat Fluxes in the waiting hall of an ultralarge railway station hub. Fire 2024, 7, 174. [Google Scholar] [CrossRef]
- ISO 834-11; 2014: Fire Resistance Tests—Elements of Building Construction. International Organization for Standardization: Geneva, Switzerland, 2014.


| Country | Method of Determining Stand-Off Distances | |
|---|---|---|
| Standards | Use of Fire Models | |
| European Union | Eurocodes [3,4] deal with the design of structures and their resistance under specific conditions, not the stand-off distances between structures | It is allowed |
| Slovak Republic | Reg. 94/2004 Coll. Decree of the Ministry of the Interior of the Slovak Republic [9] STN 92 0201- 4: Fire safety of buildings—Stand-off distances [15] | No |
| New Zealand | Verification method C/VM2 [23] | Yes: B-RISK [24] |
| Group of Fire Models | Fire Model | Characteristics |
|---|---|---|
| Mathematical | FDS | Software designed for modeling the transfer of fire and combustion products in a confined space, which is demanding to use [33]. |
| Mathematical | PyroSim | Graphical user interface of the FDS, which is quite easy to use [34]. |
| Mathematical | CFAST | Two-zone fire model, which divides the fire section into two zones with the assumption of a different temperature and density of combustion products in each zone [35,36]. |
| Mathematical | Autodesk CFD Simulation | Used for the simulation of fire, smoke and human safety evaluation and monitoring of selected fire parameters [37]. |
| Mathematical | B-RISK | Designed to model the spread of fires in buildings and monitor the activation and operation of fire equipment. The program allows visualization of geometry and simulation outputs. B-RISK operates following New Zealand building regulations [23,24]. |
| Parameter | Characteristics |
|---|---|
| Size of Computational Cells | The size of computational cells in the computational grid. |
| Path Length [m] | This parameter is necessary when determining and recording the values of the radiation transfer in the fire area. When calculating the heat flux, this parameter indicates the distance between the fire and the measuring device (target). |
| Number of Radiation Angles | This parameter improves the spatial and temporal accuracy of the discrete radiation transfer equation, thus influencing the visualization of critical values in determining stand-off distances. The lower the number of radiation angles, the more the visualization resembles a star (a more pronounced star shape), and vice versa—the higher the number, the smoother the visualization of the critical value (resembling an oval). |
| Time Step Increment and Angle Increment | These parameters influence the frequency of the recorded radiation outputs. The default value of the time step increment is 3, and the angle increment is 5. Following this scenario, the radiation transfer equation is updated every 15 time steps, and the values are thus recorded. |
| Humidity | This parameter reaches values ranging between 0 and 100, the default value being 40%. |
| Basic Simulation Space | Values |
|---|---|
| Computational grid—dimensions | 3 (w) × 3 (d) × 2 (h) m |
| Computational cell size | 50 × 50 × 50 mm |
| Number of computational cells | 60 (w) × 60 (d) × 40 (h) |
| Heat source | 1 × 1 m |
| Position | In the center of the inert area |
| Fire risk (residential building) | pv = 45 kg·m−2 |
| Heat source—radiant surface with a constant temperature | 900 °C |
| Slice File Output | At a height of 1 m, representing the height in the middle of the computational grid (also radiant surface) |
| Isosurface File Output | 18.5 kW·m−2 |
| Gauge Heat Flux Gas Devices | 9 pieces at a distance of 1.4 m from the heat source and with a spacing of 0.2 m between each other |
| Simulation time | 10 s (at 6 secs, the heat emanating from the source settles) + increased to 10 s |
| Number of simulations | 41 |
| Tested Parameter | Range | Simulation Time | Change in Simulation Length | |
|---|---|---|---|---|
| Minimum | Maximum | |||
| Cell Size | 10, 25, 50, 75 mm | Seconds | Days | Simulation time from seconds to days |
| Path Length | 0.1–3 m | 4:10 min | 4:10 min | 0% |
| Number Radiation Angles | 100–2500 | 4:10 min | 28 min | +600% |
| Time Step Increment and Angle Increment | 1:1–3:5 | 4:10 min | 17 min | +400% |
| Humidity | 0–100% | 4:10 min | 5:45 min | +27% |
| Simulation Parameters Investigated | |||||||||||
|---|---|---|---|---|---|---|---|---|---|---|---|
| Basic Simulation Space and Simulation Parameter Values | Time Step Increment and Angle Increment | Humidity | Path Length and Number of Radiation Angles | Computational Cell Size | Number of Measuring Devices | ||||||
| Time Step Increment (Table 1) | 1, 2, 3 | 1 | 1 | 1 | 1 | ||||||
| Angle Increment (Table 1) | 1, 2, 3, 4, 5 | 1 | 1 | 1 | 1 | ||||||
| Path Length | 1.2 | 1.2 | Range from 0.4 to 4.0, depending on the size of the radiant area (Table 9) | Maximum value adjusted to the largest dimensions of the computational grid ** | 4 | ||||||
| Number of Radiation Angles (Table 1) | 400 | 400 | 500, 1000, 1500, 2000 | 500 | 500 | ||||||
| Computational Grid—Dimensions (m) | 3 (w) × 3 (d) × 2 (h) | 3 (w) × 3 (d) × 2 (h) | 4 (w) × 4 (d) × 3 (h) | Depending on the sizes of the computational cells ** | 4 (w) × 4 (d) × 3 (h) | ||||||
| Computational Cell Size (mm) | 50 × 50 × 50 | 50 × 50 × 50 | 25 × 25 × 25 * | 25, 30, 35, 40, 45, 50 ** | 50 × 50 × 50 | ||||||
| Number of Computational Cells | 60 (w) × 60 (d) × 40 (h) | 60 (w) × 60 (d) × 40 (h) | 160 (w) × 160 (d) × 120 (h) | Depending on the sizes of the computational cells | 80 (w) × 80 (d) × 60 (h) | ||||||
| Heat Source | |||||||||||
| Constant-temperature radiant surface (°C) | 900 | 900 | 900 | 900 | 900 | ||||||
| Fire risk—design fire load (residential buildings), pv (kg.m−2) | 45 | 45 | 45 | 45 | 45 | ||||||
| Radiant area size (m) | 1 × 1 | 1 × 1 | 1 × 1 | 1.5 × 1.5 | 2 × 2 | 1 × 1 | 1.5 × 1.5 | 2 × 2 | 1 × 1 | 1.5 × 1.5 | 2 × 2 |
| Position of the radiant area | In the center of the inert area | ||||||||||
| Recording of Stand-Off Distances | |||||||||||
| Slice File Output | At a height of 1 m (in the middle of the computational grid = radiant surface) | ||||||||||
| Isosurface File Output (kW·m−2) | 18.5 | ||||||||||
| Number of devices (Gauge Heat Flux Gas) | 9 | 9 | 17 devices at different distances from the radiant surface | 17 | 17/0.2 Δ 9/0.4 14/0.25 8/0.45 12/0.3 7/0.5 10/0.35 | ||||||
| Distance between Gauge Heat Flux Gas devices (m) | 0.2 | ||||||||||
| Specified device clearance from the radiant surface (m) | 1.6 | 1.6 | 7 position changes | 7 position changes | 7 position changes | Maximum value adjusted to the largest dimensions of the computational grid ** | 4 | ||||
| Basic calculation stand-off distance (m) | 1.2 | 1.0 | 1.25± | 1.85± | 2.5± | 1.25± | 1.85± | 2.5± | 1.25± | 1.85± | 2.5± |
| Simulation time (s) | 6 | 6 | 6 | 6 | 6 | ||||||
| Number of simulations | 15 | 11 (from 0% to 100% in 10% intervals) | 84 | 6 *** | 6 | 6 | 7 ΔΔ | 7 | 7 | ||
| Combination of Parameters of Time Step Increment and Angle Increment | Stand-Off Distance [m] | Difference | |
|---|---|---|---|
| Prescriptive Approach | FDS | ||
| 1-1, 1-2, 1-3, 1-4, 1-5 | 1.2 | 1.2 | 0% |
| 2-1, 2-2, 2-3, 2-4, 2-5 | 1.2 | 0% | |
| 3-1, 3-2, 3-3, 3-4, 3-5 | 1.2 | 0% | |
| Humidity [%] | Stand-Off Distance [m] | Difference | |
|---|---|---|---|
| Prescriptive Approach | FDS | ||
| 0 | 1.20 | 1.35 | 11% |
| 10 | 1.30 | 8% | |
| 20 | 1.25 | 4% | |
| 30, 40, 50 | 1.20 | 0% | |
| 60, 70, 80, 90 | 1.15 | −4% | |
| 100 | 1.10 | −9% | |
| Radiation Angles | ||||||||||
|---|---|---|---|---|---|---|---|---|---|---|
| 500 | 1000 | 1500 | 2000 | |||||||
| Radiant Area | Path Length [m] | Stand-Off Distance [m] | Difference | Stand-Off Distance [m] | Difference | Stand-Off Distance [m] | Difference | Stand-Off Distance [m] | Difference | |
| Prescriptive Approach | FDS | FDS | FDS | FDS | ||||||
| 1 × 1 | 0.50 | 1.25 | 1.20 | −4% | 1.20 | −4% | 1.20 | −4% | 1.20 | −4% |
| 0.75 | 1.23 | −2% | 1.23 | −2% | 1.23 | −2% | 1.23 | −2% | ||
| 1.00 | 1.23 | −2% | 1.23 | −2% | 1.23 | −2% | 1.23 | −2% | ||
| 1.25 | 1.23 | −2% | 1.23 | −2% | 1.23 | −2% | 1.23 | −2% | ||
| 1.50 | 1.23 | −2% | 1.23 | −2% | 1.23 | −2% | 1.23 | −2% | ||
| 1.75 | 1.23 | −2% | 1.23 | −2% | 1.23 | −2% | 1.23 | −2% | ||
| 2.00 | 1.23 | −2% | 1.23 | −2% | 1.23 | −2% | 1.23 | −2% | ||
| 1.5 × 1.5 | 0.40 | 1.85 | 1.75 | −6% | 1.75 | −6% | 1.75 | −6% | 1.75 | −6% |
| 0.90 | 1.80 | −3% | 1.80 | −3% | 1.80 | −3% | 1.80 | −3% | ||
| 1.40 | 1.80 | −3% | 1.80 | −3% | 1.80 | −3% | 1.80 | −3% | ||
| 1.90 | 1.83 | −1% | 1.83 | −1% | 1.83 | −1% | 1.83 | −1% | ||
| 2.40 | 1.83 | −1% | 1.83 | −1% | 1.83 | −1% | 1.83 | −1% | ||
| 2.90 | 1.83 | −1% | 1.83 | −1% | 1.83 | −1% | 1.83 | −1% | ||
| 3.40 | 1.85 | 0% | 1.85 | 0% | 1.85 | 0% | 1.85 | 0% | ||
| 2 × 2 | 1.00 | 2.50 | 2.35 | −6% | 2.35 | −6% | 2.35 | −6% | 2.35 | −6% |
| 1.50 | 1.50 | −5% | 2.38 | −5% | 2.38 | −5% | 2.38 | −5% | ||
| 2.00 | 2.00 | −4% | 2.40 | −4% | 2.40 | −4% | 2.40 | −4% | ||
| 2.55 | 2.55 | −3% | 2.43 | −3% | 2.43 | −3% | 2.43 | −3% | ||
| 3.00 | 3.00 | −3% | 2.43 | −3% | 2.43 | −3% | 2.43 | −3% | ||
| 3.50 | 3.50 | −3% | 2.43 | −3% | 2.43 | −3% | 2.43 | −3% | ||
| 4.00 | 4.00 | −3% | 2.43 | −3% | 2.43 | −3% | 2.43 | −3% | ||
| Computational Cell Edge Size [mm] | Computational Grid Dimensions | ||
|---|---|---|---|
| Width [m] | Length [m] | Height [m] | |
| 25 | 4.0 | 4.0 | 3.0 |
| 30 | 3.99 | 3.99 | 3.0 |
| 35 | 3.99 | 3.99 | 2.94 |
| 40 | 4.0 | 4.0 | 3.0 |
| 45 | 3.96 | 3.96 | 2.97 |
| 50 | 4.0 | 4.0 | 3.0 |
| Radiant Area [m] | Computational Cell Edge Size [mm] | Stand-Off Distance [m] | Difference | Simulation Time [s] | |
|---|---|---|---|---|---|
| Prescriptive Approach | FDS | ||||
| 1 × 1 | 25 | 1.25 | 1.20 | −4% | 23.5 |
| 30 | 1.23 | −2% | 11.6 | ||
| 35 | 1.23 | −2% | 6.0 | ||
| 40 | 1.24 | −1% | 3.1 | ||
| 45 | 1.26 | 1% | 2.2 | ||
| 50 | 1.25 | 0% | 1.3 | ||
| 1.5 × 1.5 | 25 | 1.85 | 1.85 | 0% | 27.0 |
| 30 | 1.86 | 1% | 12.0 | ||
| 35 | 1.89 | 2% | 6.3 | ||
| 40 | 1.84 | −1% | 3.6 | ||
| 45 | 1.85 | 0% | 2.3 | ||
| 50 | 1.85 | 0% | 1.5 | ||
| 2 × 2 | 25 | 2.50 | 2.43 | −3% | 30.0 |
| 30 | 2.43 | −3% | 12.3 | ||
| 35 | 2.42 | −4% | 6.6 | ||
| 40 | 2.44 | −2% | 4.0 | ||
| 45 | 2.48 | −1% | 2.3 | ||
| 50 | 2.45 | −2% | 1.6 | ||
| Radiant Area [m] | Number of Measuring Devices | Distance Between Devices [m] | Stand-Off Distance [m] | |
|---|---|---|---|---|
| Prescriptive Approach | FDS | |||
| 1 × 1 | 17 | 0.20 | 1.25 | 1.25 |
| 14 | 0.25 | 1.25 | ||
| 12 | 0.30 | 1.25 | ||
| 10 | 0.35 | 1.25 | ||
| 9 | 0.40 | 1.25 | ||
| 8 | 0.45 | 1.25 | ||
| 7 | 0.50 | 1.25 | ||
| 1.5 × 1.5 | 17 | 0.20 | 1.85 | 1.85 |
| 14 | 0.25 | 1.85 | ||
| 12 | 0.30 | 1.85 | ||
| 10 | 0.35 | 1.85 | ||
| 9 | 0.40 | 1.85 | ||
| 8 | 0.45 | 1.85 | ||
| 7 | 0.50 | 1.85 | ||
| 2 × 2 | 17 | 0.20 | 2.5 | 2.45 |
| 14 | 0.25 | 2.45 | ||
| 12 | 0.30 | 2.45 | ||
| 10 | 0.35 | 2.45 | ||
| 9 | 0.40 | 2.45 | ||
| 8 | 0.45 | 2.45 | ||
| 7 | 0.50 | 2.45 | ||
Disclaimer/Publisher’s Note: The statements, opinions and data contained in all publications are solely those of the individual author(s) and contributor(s) and not of MDPI and/or the editor(s). MDPI and/or the editor(s) disclaim responsibility for any injury to people or property resulting from any ideas, methods, instructions or products referred to in the content. |
© 2025 by the authors. Licensee MDPI, Basel, Switzerland. This article is an open access article distributed under the terms and conditions of the Creative Commons Attribution (CC BY) license (https://creativecommons.org/licenses/by/4.0/).
Share and Cite
Hodúlová, D.; Mitrenga, P.; Gašpercová, S.; Marková, I. Sensitivity Analysis of FDS Program Parameters for Determining the Stand-Off Distances in Fire Safety Solutions for Buildings—Slovak Case Study. Fire 2025, 8, 248. https://doi.org/10.3390/fire8070248
Hodúlová D, Mitrenga P, Gašpercová S, Marková I. Sensitivity Analysis of FDS Program Parameters for Determining the Stand-Off Distances in Fire Safety Solutions for Buildings—Slovak Case Study. Fire. 2025; 8(7):248. https://doi.org/10.3390/fire8070248
Chicago/Turabian StyleHodúlová, Dorota, Patrik Mitrenga, Stanislava Gašpercová, and Iveta Marková. 2025. "Sensitivity Analysis of FDS Program Parameters for Determining the Stand-Off Distances in Fire Safety Solutions for Buildings—Slovak Case Study" Fire 8, no. 7: 248. https://doi.org/10.3390/fire8070248
APA StyleHodúlová, D., Mitrenga, P., Gašpercová, S., & Marková, I. (2025). Sensitivity Analysis of FDS Program Parameters for Determining the Stand-Off Distances in Fire Safety Solutions for Buildings—Slovak Case Study. Fire, 8(7), 248. https://doi.org/10.3390/fire8070248