Abstract
Polyurethane (PU) foam has a high flammability and is widely used in aircraft interiors, presenting a significant danger to occupants. This study analysed three composite intumescent flame-retardant (IFR) coatings for flexible PU foam; expandable graphite (EG), ammonium polyphosphate (APP) and alginate (AG). The coatings were prepared in concentrations of 5 wt%, 10 wt%, and 50 wt% with an acrylic binder. The coated samples were characterised using cone calorimetry, SEM, and mechanical testing. The findings showed peak heat release rate, total heat release, and carbon dioxide production from the 10 wt% triple-layer coating (EG:APP:AG) was 52%, 32%, and 58% less than the PU control. The char of the 10 wt% triple-layer sample effectively suppressed smoke release and inhibited the transfer of fuel and gas volatiles. Mechanical testing demonstrated a 3.4 times increase in tensile strength and a 15.4 times increase in compressive strength (50% compression) compared to the control PU with the 10 wt% triple-layer coating. A fire dynamics simulator model was developed that demonstrated large-scale flammability modelling for commercial aircraft. Future work can explore the integration of IFR coatings into computational analysis. These new bio-based coatings produced promising results for aircraft fire safety and flammability performance for PU polymers.
1. Introduction
Fire is a detrimental risk to aircraft passenger safety and is a major consideration throughout the design and implementation processes. In particular, the commercial aircraft industry has strict standards for fire safety in relation to interior and exterior materials and fire suppression systems []. Onboard fires are often catastrophic with the heat and associated smoke inhalation, and fire is the fourth-leading cause of death in aircraft accidents []. Reducing the time taken to escape the aircraft is crucial to survivability. During a fire, the spread of smoke through the aircraft cabin reduces visibility and is toxic to the passengers, slowing their egress; therefore, it is critical that the cabin materials be fire-resistant. In particular, the soft furnishings and upholstery can easily be a fuel source for an intense fire. The seat cushions are predominantly filled with a polymer foam, such as polyurethane (PU). This study aims to investigate the modification of cabin upholstery materials and their effect on fire intensity and smoke production.
Flexible PU foam has an open-cell structure, making it flexible and soft. It is widely used in seating and furnishing fillings; however, the open-cell structure makes it very flammable and quick to combust []. This is generally combated with intumescent fire retardants (IFRs) that can be combined into the composition of the foam or added as a coating. These form a protective charring layer at high temperatures, shielding the material and stopping the transfer of pyrolysis fuels to the surface, suffocating the fire [].
Two common IFRs are expandable graphite (EG) and ammonium polyphosphate (APP), both of which have been demonstrated to reduce the heat release rate (HRR) and smoke production during the pyrolysis of polymer foams [,]. EG is a widely used IFR, which is composed of graphite layers intercalated with sulfuric acid (H2SO4). When heated, carbon dioxide (CO2) and sulphur dioxide (SO2) gases are released, rapidly expanding the material into a thick and fluffy char layer that inhibits smoke and burning. This was demonstrated by Thirumal et al. with EG combined with low-density PU, showing an increase in the limiting oxygen index (LOI) that indicates reduced flammability []. It also showed a loss of compressive strength with an increase in EG. A loss of mechanical strength with EG was also observed in a study combining the additive with a wood flour polypropylene (WFP) polymer by Guo et al. []. This hinders its applications, especially in aircraft seating which is under compression regularly. It still demonstrated a significant decrease in HRR and Total Smoke Production (TSP).
Combining EG with other IFRs has proved effective in counteracting the negative mechanical effects of EG. Guo et al. combined EG with ammonium polyphosphate (APP) in a 1:1 ratio, showing a reduction in HRR and TSP while not reducing flexural and tensile strength as significantly as the EG-only sample []. APP is another common IFR, with a char layer forming above 200 °C. Additionally, an endothermic reaction releasing phosphoric acid and water occurs, further cooling the surface of the material []. APP does reduce HRR; however, it has been shown to reduce extinguishing time; therefore, it is recommended to be combined with more endothermic additives. APP also releases toxic ammonia (NH3) smoke when burnt, which is dangerous in the confined space of an aircraft cabin. When combined with EG, the TSP was reduced, highlighting the advantages of using the synergistic effects of IFRs.
As the environmental impact of air travel becomes more scrutinised, there is a growing need for ecologically friendly alternatives to replace older materials. Traditional fire retardants are halogenated materials, causing the release of toxic gases that, when burnt, can deteriorate the ozone layer []. In recent years, leading aircraft manufacturers Airbus and Boeing have been searching for bio-based alternatives for aircraft interiors []. Foams that are bio-based are a growing area of research and promise a biodegradable and recyclable alternative to traditional seating material.
Alginates have been shown to be effective bio-based IFR additives without significant loss of structural rigidity and can provide a more sustainable alternative in an otherwise non-renewable-dominated industry []. Alginates are carbohydrate compounds that are developed from brown algae and seaweed []. They are commonly used in textile coatings, food additives and paper sizing. Their fire retardancy gives them potential for use in furnishings, interior thermal insulation, and fire-resistant uniforms. However, due to a lack of research and literature, this has not been realised. Research on alginates combined with PU demonstrated a reduction in HRR and TSR, and alginates have been applied as a gel layer on PU foam in a study by Chen et al. [,]. The pyrolysis reaction produces a char layer and is endothermic, with water loss producing an extinguishing effect. Importantly, in both studies, no mechanical loss was found. However, these have yet to be tested and used in aircraft seating.
Additionally, IFRs combined with acrylic were shown to improve their adhesion to PU foam by Dasari et al., which would further increase the mechanical properties of the composite []. Acrylic is also easily obtainable and workable. IFR coatings are in use in construction and building cladding; however, these are not yet widely used on soft foams.
While the experimental tests reveal the material properties, conducting computational fluid dynamics can uncover more about the impact of these materials in a large-scale scenario. Using the experimental data, the pyrolysis of PU foam will be simulated in an aircraft using a fire dynamics simulator (FDS) in this study. Similar studies on train and aircraft fire show that CFD can effectively model smoke and heat spread []. This can validate the experimental results. Future iterations of this work can embed the IFR coatings into the computational situations. In this study, a composite IFR coating of alginate, APP, and EG is fabricated and characterised using PU foam samples. No literature was found on combinations of IFRs with alginates. This is a novel and an initial step to producing cost-effective, low-toxicity, and environmentally benign IFR coating for aircraft seating materials to impart flame resistance performance. It also allows for an investigation into how IFRs interact with alginates that has not been conducted in other works. The coating method provides an easily manufacturable alternative to IFRs embedded in PU foam, without the negative mechanical weakening effects seen with composite foams []. The CFD aircraft model is unique in modelling the cabin upholstery and allows for future work in simulating different scenarios and materials. With air travel under increased environmental scrutiny, this provides a new ecologically sustainable opportunity in fire protection.
2. Materials and Methods
2.1. Materials and Sample Preparation
The three IFR coatings were prepared in three different concentrations of 5 wt%, 10 wt%, and 50 wt% with acrylic binder. Open-cell flexible foam at 35 kg/m2 was used. This concentration range has been used in similar studies [,]. The APP and EG solutions were mixed with acrylic at 50 RPM for 20 min in accordance with similar coating methods []. The AG solution was stirred at 600 RPM for 12 h. Coatings were applied to the PU foam samples with a nylon brush, and each layer was left for 24 h at room temperature to cure. The acrylic binder is viscous and sits atop the foam. The first layer may slightly penetrate the porous foam; however, it was not embedded into the foam. Single-layer coatings were used to validate published results, while double and triple coatings were used to investigate the synergistic effects. Multiple-layered coatings were added in a 1:1 ratio to directly investigate the effect of each additive. The coatings were added in the same order. The working principle of multiple coatings is seen in Figure 1, and sample configurations are seen in Table 1. Five samples of each coating configuration were tested for repeatability.

Figure 1.
Visual representation of the effect of combined IFR layers.

Table 1.
Sample configurations for cone calorimetry testing.
For the mechanical testing, a smaller range of samples was selected. The 5 wt% samples were not tested due to their unfavourable results in the flammability testing. The configurations are seen in Table 2.

Table 2.
Sample configurations for mechanical testing.
2.2. Sample Characterisation
2.2.1. Mechanical Testing
The Instron 3369 Universal Testing Machine was used for both tensile and compressive testing. Tensile testing was conducted in accordance with ASTM D3574 Test E for flexible polymers []. Samples were cut into a “bone” shape with a cutting die. A 1 kN load cell was used at a crosshead speed of 500 mm/min []. This can be seen in Figure 2a. The sample was tested until breakage. For compression testing, the samples were cut to 50 × 50 × 25 mm according to ASTM D3574 Test C []. The compressive testing was conducted using a load cell of 5 kN and a crosshead speed of 50 mm/min, in accordance with studies using similar PU foam densities []. This is seen in Figure 2b. ASTM D3574 recommends compression to be halted at 50% compression (12.5 mm); however, soft foams are often compressed to 80% (20 mm) as this better reflects their performance [].
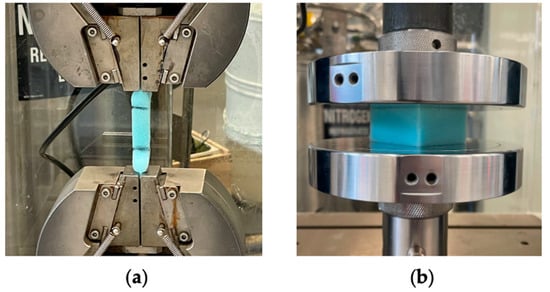
Figure 2.
Instron 3369 Universal Testing Machine with control PU sample loaded: (a) tensile configuration; (b) compression configuration.
2.2.2. Cone Testing
Cone calorimetry measurements were taken using an FTT iCone Classic operating at a heat flux of 35 kW/m2 according to ASTM E 1354, as used in other cone testing studies []. The apparatus is seen in Figure 3. All samples were exposed to the same heat flux. The PU foam samples were cut to 100 × 100 × 25 mm. Testing was conducted for a duration of 600 s or until flameout, whichever occurred first.
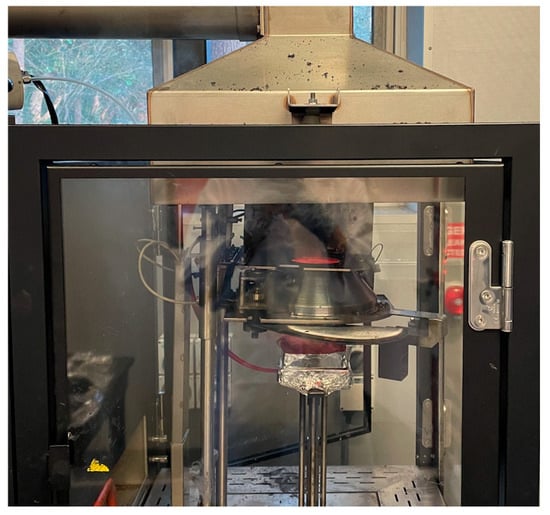
Figure 3.
FTT iCone Classic, with the sample loaded and heating coil on.
2.2.3. SEM Imaging
Scanning electron microscopy (SEM) imaging was used with an accelerating voltage of 15 kV at a magnification of 500×, using a model FEI Nova Nano 230 SEM. This was used on the burnt char samples to investigate their surface morphology [].
2.3. Numerical Modelling
To supplement the experimental work, the fire dynamics simulator (FDS) was used—a computational fluid dynamics (CFD) software used widely in research on fires in enclosed spaces such as vehicles and buildings []. This modelled the material in an aircraft cabin.
Ideally, the IFR coatings tested could be loaded into FDS to validate the experimental work. A methodology used by Yuen et al. involved mathematically calculating the pyrolysis kinetics from thermogravimetric analysis (TGA) of polymer materials []. This would then be inputted into the materials of FDS. This is a future scope of work. The cutaway of the aircraft was created using a model of an Airbus A320 aircraft, deemed most suitable as a common airliner []. The model was made in SolidWorks before being transferred to PyroSim. The seats were based on the Recaro CL3710, a common medium-haul aircraft seat []. A single row was used as a scaled model of the full aircraft, as seen in Figure 4.

Figure 4.
PyroSim mode: (a) no meshing; (b) rough meshing; (c) fine meshing with ‘block’ walls.
The assembly was imported into PyroSim (FDS interface), with the walls and armrests identified as ‘adiabatic’, and the seats specified as ‘Foam’ with a polyurethane combustion reaction. This is in accordance with the PyroSim recommendations for walls in an enclosed space []. The mesh was split for efficient computing, with the thin walls filled in to stop gaps in the meshing as seen in Figure 4c. The foam had a density of 35 kg/m2 at a thickness of 25 mm to match the experimental samples. FDS evaluates the Navier–Stokes equations for the conservation of the mass, momentum, and energy of a fluid []. It has an additional pyrolysis calculator to evaluate the flow properties of fire from the reaction of materials. FDS evaluates the pyrolysis of polyurethane as a solid fuel. The one-dimensional heat conduction equation is used to determine the temperature (Ts) of the material [].
One-dimensional heat conduction equation:
Here, , and are the density, specific heat capacity, and thermal conductivity of the fuel. and are source terms that are the heat gained during pyrolysis and radiation absorption, respectively. The source term is evaluated in the pyrolysis source term equation.
Pyrolysis source term equation:
NR is the number of reactions and is the heat of the reaction. The rate of pyrolysis is calculated using the Arrhenius equation which relates the reaction rate to the temperature of the sample []. FDS uses the large eddy simulation (LES) as the primary turbulence model, suitable for evaluating slow-moving flows in open spaces [,]. LES filters large eddies and calculates them directly, in which smaller turbulent flows are averaged. This uses significantly less computing power than the direct numerical simulation (DNS) method while retaining most of the accuracy []. Due to the complex curved shapes of an aircraft interior, fine meshing is needed to accurately represent the models. In previous studies, larger mesh sizes (up to 30 cm) were used as the whole cabin was simulated []. In this studied section of an aircraft cabin, smaller meshes were used and tested for mesh sensitivity (10 cm, 5 cm, and 3.7 cm).
The boundaries on either side of the aircraft were set to be “OPEN” in FDS, meaning they are at static air pressure (1 atm) and temperature (293 K) []. This was in alignment with other vehicle models []. Enclosing the vehicle in a periodic vent would be unrealistic in a fire when the aircraft may have openings in the fuselage from an accident. Aircraft ventilation was also implemented, using the industry requirement of 20 cfm per passenger []. Two outlets in the floor removed air at 6 L/s. These were in the appropriate positions for a commercial aircraft. These are seen in Figure 5. The ignition source used a cylindrical object with a surface temperature of 1000 °C, which is the standard ignition particle used by FDS []. Five of these were placed on a seat of the aircraft as seen in Figure 5. As the ignition source in an accident may vary, such as an explosion or burning fuel, it is difficult to accurately replicate. Several thermocouples were set up to measure both visibility and temperature at different points of the cabin. A thermocouple was placed on the backrest of each seat to determine survivability if a passenger was trapped there. Additionally, thermocouples and visibility sensors were placed in the aisle at heights of 0.6 m, 1.8 m, and 2.2 m to show temperature and smoke density at crawling, standing, and ceiling heights, respectively.
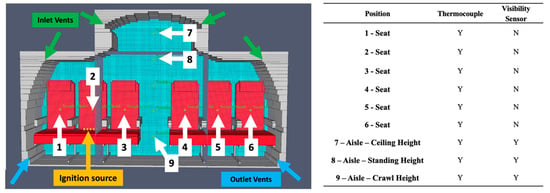
Figure 5.
Pyrosim setup with sensors and ignition source.
In accordance with FAA/EASA FAR 25.803, certified aircraft need to prove that all passengers can escape within 90 s, with 50% of the exits blocked [,]. The experimental simulations were, therefore, performed for 90 s. The temperatures and maximum visibility at the different sensors mentioned above were recorded and compared to the experimental results for raw PU foam. Validating this model provides an avenue for future numerical analysis incorporating the IFR chemicals.
3. Results and Discussion
3.1. Mechanical Testing
To investigate the usability of the coated foam in practical applications, tensile and compressive testing was conducted. This is to determine the effect of the IFR coatings on the mechanical properties of PU foam. Tensile testing was completed in accordance with ASTM D3574 Test E []. The raw PU, 10 wt% samples and triple-layer samples were compared. The tensile testing results are seen in Table 3 and displayed in Figure 6. Tensile and compressive strength and strain were recorded using the apparatus, with the strain being the nondimensionalised vertical distance travelled [].

Table 3.
Tensile testing results.
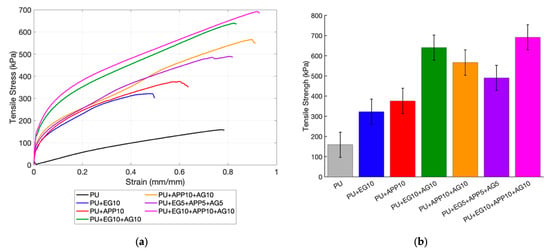
Figure 6.
Tensile testing results: (a) stress vs. strain curve; (b) tensile strength.
All samples outperformed the control with the maximum tensile strength. The raw PU did outperform the manufacturer’s minimum tensile strength of 86 kPa at 158.8 kPa, showing that it met this minimum threshold. The coated samples had a higher tensile strength due to the layer of acrylic binder mixed with the fire retardants. It is noted that the double-layer coatings had a tensile strength, seen in Figure 6b, due to the extra thickness of the added layer. This shows how the coating method is advantageous, as tests with EG and APP combined into the substrate showed reduced mechanical properties with EG and increased results with APP []. These were the samples including alginate, indicative of the alginate improving the tensile strength, which has been demonstrated in other studies using alginate coating []. However, this is more likely to be due to the added acrylic. Acrylic-based coatings have been shown to increase mechanical properties due to their adhesion strength, in this case to the PU foam []. The EG + AG 10 wt% and EG + APP + AG 5 wt% had a similar elongation limit at an 8% and 5.3% increase from the control, respectively, as seen in Table 3. The APP + AG 10 wt% and EG + APP + AG 10 wt% had more significant increases at 17.6% and 19.7% from the control. This highlights that APP performs slightly better with mechanical testing. The EG + APP + AG 10 wt% had the highest maximum tensile stress at 335.4% of the control sample. Note that this was not just due to the volume of the binder, as it was not the heaviest sample, as discussed in the mass loss analysis section. These differences are likely due to the consistency of the coating, such as cracks forming, which can negatively affect fire performance. This is an issue in practical applications, such as an aircraft seat, which will be stretched multiple times daily.
The compressive testing was completed following ASTM D3574 Test C []. The compression force required to compress the samples to 50% of their thickness was recorded, as well as the thickness after 1 min to measure any permanent deformation. Due to the low density of the foam at 35 kg/m3, the compressive strength at 80% compression was also recorded. This is presented in Table 4 and Figure 7. This is especially applicable to aircraft applications, where seats will be compressed with passengers sitting on them. Retaining the structural integrity of the coating is integral to maintaining the flame-retardant properties.

Table 4.
Compressive testing results.
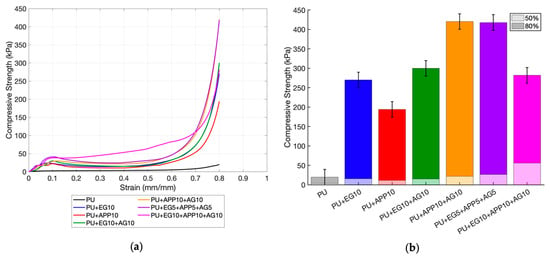
Figure 7.
Compression testing results: (a) stress vs. strain curve (b) compressive strength.
The tensile results showed that coatings significantly increased the compressive strength of the samples when compared to the raw PU. Another similarity was that the double and triple-layer coatings had a higher compressive strength than the single-layer samples, as seen in Figure 7b. This demonstrates that the acrylic coating increases the mechanical properties of the PU foam. At 50% compression, the EG + APP + AG 10 wt% outperforms the other samples significantly at a 1537% increase from the control. This is clearly seen in the stress–strain curve in Figure 7a, where the EG + APP + AG 10 wt% curve requires a higher compressive force from about 20% to 70% compression. At 80% compression, this performance falls, with the APP + AG 10% and EG + APP + EG 5 wt% samples performing the best at a 2024% and 2011% increase in the control, respectively.
The triple-layer 10 wt% coating may have buckled, causing this fall in force at 80%. No cracks were observed, showing that the coating would still retain flame-retardant properties after being compressed. No relationship was identified between the IFR chemicals and compressive strength. Additionally, its strong adherence to the foam prevented it from tearing away from the substrate when compressed []. As IFRs usually decrease the compressive strength of foams, the coating method avoids this. This allows for favourable fire-retardant properties without sacrificing the structural integrity of the material. The rebound post-compression can also be examined; a study on the impact resistance of flexible open-celled PU foams for railway seating found an elastic collapse loss of around 5% []. Although the integrity of the coating will have a stronger impact on fire retardance, its return to its original shape may affect the practicality of its usage as seating. Further testing on environmental conditions, such as higher temperatures or resistance to abrasion and impact, could be considered.
3.2. Combustion Testing
3.2.1. Heat Release Rate
To examine the flame-retardant properties of the IFR coatings, cone calorimetry testing was conducted [,]. The peak heat release rate (pHRR) of each sample was measured and compared to the control PU foam sample. The average HRR and peak HRR (pHRR) of each sample can be seen below in Table 5. The results of the single-layer coatings are shown in Figure 8.

Table 5.
HRR results for all samples.
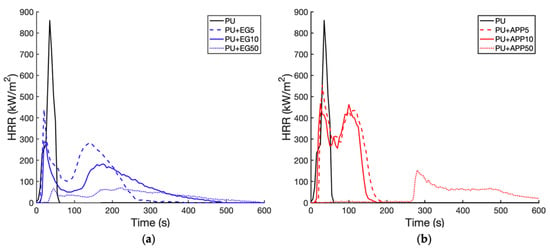
Figure 8.
HRR time profile for single-layer coatings: EG (a); APP (b).
It can be observed in Figure 8 that both additives at all weightings significantly reduced the pHRR. This reduction increases with the weighting of each additive. This shows an increase in the IFR concentration, allowing the formation of a more effective char layer [,]. The raw PU curve peak of 859.9 kW/m2 at 35 s is due to a sudden decomposition with no residue remaining, which was the largest pHRR of the samples.
EG was more effective at lowering the pHRR compared to the APP samples as seen in Figure 8a. The 5 wt% EG layer peaked at 438.9 kW/m2 at 20 s and the 5 wt% APP at 553.8 kW/m2 at 30 s. This was a reduction of 49% and 35.6% from the control, respectively. The EG 5 wt% also had a lower average HRR than the APP 5 wt% sample with only a 9.4% increase from the control compared to 46.7% for the APP. The EG forms a thicker carbonaceous char layer compared to APP, which can more effectively block heat [,]. The charring of APP is also less endothermic, meaning it is less effective at absorbing the heat of the combustion [,]. The coated samples at 5 wt% and 10 wt% exhibit secondary peaks, which are from the unburnt foam combusting underneath the char layer [,]. The EG is also shown to be superior to APP, with the EG samples displaying lower secondary peaks and average HRR values. A lower secondary peak shows that the IFR has more effectively blocked the exchange of fuel and oxygen to the foam []. In the EG 10 wt% sample, the secondary peak showed a 36% reduction from the first peak, and the APP 10 wt% sample only had a 1% decrease between peaks. The APP char layer likely collapsed or was too thin, which allowed for the faster combustion of the foam. The APP 5 wt% sample had a greater reduction between peaks (22%) than the APP 10% sample. Increases in concentration of APP at low concentrations (<10%) can sometimes decrease thermal conductivity due to increased phonon scattering []. The EG reduced the average HRR more significantly than APP at 5% and 10% weightings. The EG 10 wt% pHRR was 23.3% lower than the raw PU pHRR, and the APP 10 wt% was 46.7% higher than the raw PU.
Both the APP and EG 50 wt% samples exhibited extended combustion at low HRR values (<100 kW/m2); this was likely the slow combustion of the residue formed by the IFR and binder []. They also did not have secondary peaks as the char layers allowed minimal combustion through them. The APP 50 wt% had the lowest average HRR of the samples; 76% lower than the control. It had a pHRR of 152.6 kW/m2 at 280 s. This was also the latest ignition time. The EG 50 wt% had a pHRR of 69.6 kW/m2 at 220 s, the lowest pHRR of the samples. The EG 50 wt% had an average HRR that was 68.5% lower than the control. The earlier ignition time and slightly higher average HRR of the EG may have been due to the popcorn effect, where the EG char expands too much at high temperatures []. The char is too light and breaks off in the air and flame movement, exposing the foam underneath. The results of the combined layers can be seen in Figure 9.
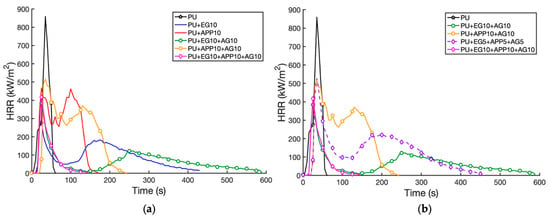
Figure 9.
HRR time profile for multiple coatings: (a) 10 wt% layers; (b) combined layers.
The addition of the alginate (AG) at 10 wt% was compared to the EG and APP 10 wt% samples. The EG + AG 10 wt% sample reduced the control pHRR by 55.3%, a higher pHRR than the EG 10 wt% sample by 11.2%. However, the secondary peak and average HRR were lower, as seen in Figure 9a. The coating of the AG on the outside restricts the initial formation of char, causing the HRR to increase; however, once the char is formed, the two additives form a stronger char layer together. The EG + AG 10 wt% sample burnt for an extended duration of over 600 s, likely due to the extra residue from the second coating of binder []. The AG + APP 10 wt% sample increased the pHRR and the burn duration time when compared to the APP 10 wt% sample. The average HRR was 51.9% higher than the control, compared to APP 10 wt% (42.4%) and EG + AG 10 wt% (−40.1%). This showed the positive synergistic effects of EG + AG in a 1:1 ratio as well as the negative effects of APP + AG. Instead, the AG and binder provided more fuel resulting in an increased HRR. The increase in pHRR from the single layer (APP 10 wt% and EG 10 wt%) to both double layer samples with the addition of alginate contrasts work by Vincent et al., where alginate significantly reduced the pHRR when compared to PU foam []. The combination of alginate with the EG and APP must, therefore, reduce the flame-retardant properties of the AG. This may be related to alginate beginning to thermally degrade at a lower temperature at around 100 °C, compared to EG, which begins to combust around 200 °C, and APP at around 280 °C [,]. Therefore, by the time the APP or EG is ignited, the AG is already in a later stage of decomposition and is generating more heat; therefore, the pHRR is amplified. As alginate’s main flame-retardant mechanism is the release of water; this could dilute gases formed by EG and APP, which start their charring reaction, leading to a lower effectiveness initially. However, in the case of the EG + AG 10 wt% sample, this cooling may lead to a strengthened char layer and more protection for the PU. Alginate is also observed to smoulder in the latter stages of its degradation due to the polymer chains unlinking at higher temperatures []. This explains the extension in burning times in both AG two-layer samples.
The triple-layer EG + APP + AG 5 wt% sample performed poorly with a 38.8% reduction in pHRR from the control, compared to a 55.3% and 40.0% reduction in the pHRR from the EG + AG 10 wt% and APP + AG 10 wt% samples, respectively. It also displayed an extended burning time of 456 s. This was likely due to the low dispersion of the IFR particles at 5% and increased binder mass with the three layers. This formed an ineffective char layer that allowed the fuel to slowly pass up to the surface. This caused an extended secondary combustion as seen in Figure 9b. The triple-layer EG + APP + AG 10% formed an effective char layer by the combination of IFRs, with a reduction in the average HRR of 56.4%. This was higher than the other 5 wt% and 10 wt% samples, including the double and triple coatings. It also had the lowest combustion time of all the coated samples at 124 s, showing it effectively extinguished the combustion. As the char layer prevented combustion from continuing, there was no secondary combustion as observed in Figure 9b. This was the only sample to leave unburnt foam. This highlighted that 10% of EG + APP + AG in a 1:1:1 ratio formed a strong char, outperforming the double-layer samples.
3.2.2. Total Heat Release
The total heat release (THR) of the samples is illustrated in Figure 10, which shows the intensity of the flame, with the gradient of the curve being representative of flame spread []. The results are presented in Table 6. The curves end at their respective flameout times. The EG performs significantly better than APP at weightings of 5 wt% and 10 wt%. At 5 wt%, the EG and APP samples exhibited a THR increase of 131.4% and 154.5% from the control, respectively. At 10 wt%, this was 103.6% and 123.8%, respectively. This is due to the endothermic charring reaction of EG, which absorbs the heat and protects the PU layer below from combusting []. At 50 wt%., the EG sample only had a 0.8% increase from the control, compared to 40.6% for the APP samples. Both 50 wt% samples had very slow combustion making them suitable for aircraft cabin applications, with commercial aircraft certified to have an escape time of 90 s []. The APP 50 wt% did not ignite until 276 s, and the EG 50 wt% ignited in 39 s but was still generating significantly less heat than other samples under 90 s, as seen in Figure 10. The AG decreased the THR for the EG sample at 10 wt%, with a 91.4% increase from the control compared to a 103.6% increase with the single-layer EG sample. For the APP + AG sample, a 184.2% increase from the control was measured compared to 123.8% for the APP 10 wt% sample. This is thought to be due to the water release from the alginate diluting the gases released from the APP, which is necessary to form an effective char layer [,]. The excess coating mass would then leave more fuel to be burnt, generating more heat energy. The EG + AG 10 wt% also burnt for significantly longer (+600 s) due to the foam slowly smouldering under the char. This secondary combustion is shown by a second steep gradient after a plateau in the curve in Figure 10. The triple-layer 5 wt% layer was observed to have the poorest THR performance, with 208.8% of the control, due to excess fuel provided by three layers of acrylic and insufficient concentration of IFRs. The triple-layer 10 wt% sample was the only sample to achieve lower THR than the control (−31.6%), due to the combined IFRs succeeding in stopping combustion in 147 s, the fastest of all samples. This stopped the secondary combustion and smouldering that would generate more heat.
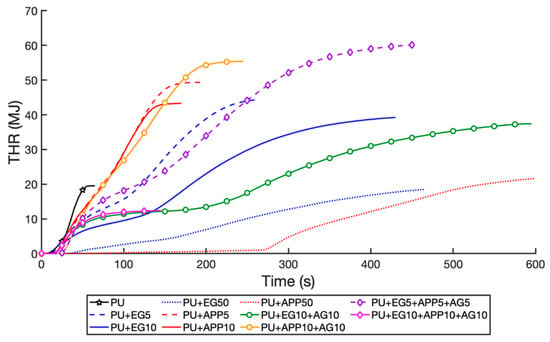
Figure 10.
Total heat release (THR) time profile of samples.

Table 6.
THR results for all samples.
3.2.3. Smoke Production
As smoke is a leading cause of lethality in aircraft fires, the smoke production rate (SPR) and total smoke production (TSP) are excellent indicators of material suitability for aircraft cabins []. The results are listed in Table 7 and presented in Figure 11 and Figure 12. The single-layer EG samples had a lower SPR than APP samples at equal weightings, and similarly with the double-layer EG + AG and APP + AG 10 wt% samples. This is mainly due to the mechanism of intumescence of APP, which releases ammonia (NH3) as a blowing agent to expand the char [,]. EG is often used as a smoke suppressor with other additives as its charring reaction does not release excessive gas []. Most smoke in polymers is formed by the partially decomposed material smouldering, which is the residue. By forming a thick enough char to prevent smouldering, EG samples generate less smoke [].

Table 7.
SPR and TSP, all samples.
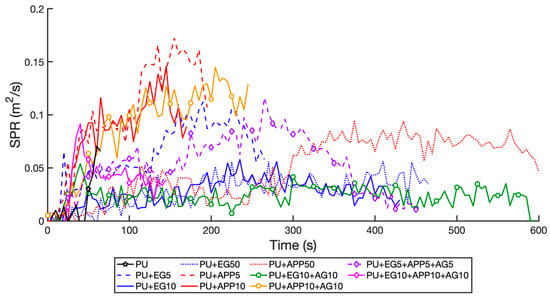
Figure 11.
SPR time profile for all samples.
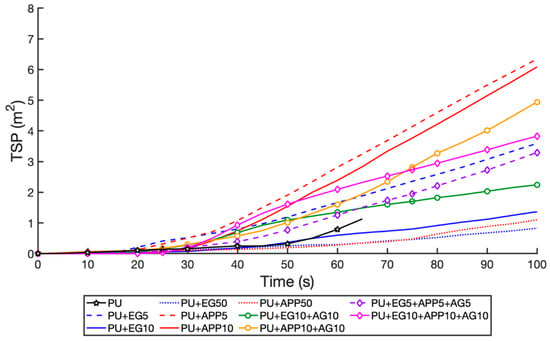
Figure 12.
TSP time profile for all samples, t < 100 s.
The addition of AG at 10 wt% was not shown to alter either the EG or APP samples, with the EG 10 wt% and EG + AG 10 wt%, producing an SPR of −23.1% and.−28.4% from the control, respectively. The APP 10 wt% and APP + AG 10 wt% produced an SPR of 94% and 92.7% increase from the control, respectively. These results were similar for TSP, with the addition of AG increasing the TSP slightly due to the extra fuel from the second layer. The triple-layer 10 wt% had an SPR of 21.4% increase from the control, showing the APP negating the effects of the EG. However, it had the lowest TSP of all samples at a 59.1% increase from the control. This is due to it burning for the shortest time of the layered samples, stopping further smouldering. The TSP for the first 100 s is graphed in Figure 12, as this initial time is critical for the egress of passengers (all passengers must be able to escape within 90 s as per international regulations []). The EG 10%, 50%, and APP 50 wt% samples perform the best due to the thick char formed. However, their TSP is undesirable with a 124.2%, 198.5%, and 747.9% increase from the control, respectively. This is due to cracks in the EG char causing slow the smouldering of the PU, and the concentrated release of gas from the APP degradation. As such, the EG + AG 10 wt% and EG + APP + AG 10 wt% are most suitable for aircraft applications due to low SPR and TSP.
3.2.4. Carbon Monoxide and Carbon Dioxide Production
Carbon monoxide (CO) and carbon dioxide (CO2) are both common products of combustion and are the most dangerous to human life. They are a good indicator of the lethality of the smoke produced []. The peak CO and CO2 production (pCOP and pCO2P) results are seen in Table 8 and graphed in Figure 13.

Table 8.
Carbon monoxide (CO) and carbon dioxide (CO2) production for all samples.
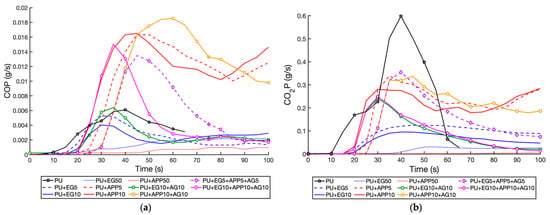
Figure 13.
Production of toxic gas emissions as a function of time, t < 100 s: (a) CO; (b) CO2.
As reflected in the HRR and SPR results, EG samples performed significantly better than APP samples for peak CO and CO2 production. The addition of AG did increase the peak production with both EG and APP due to the extra fuel mass of the binder. The EG + AG 10 wt% and the 10 wt% triple-layer sample had a pCOP of 5.1% and 146.9% from the control, respectively, highlighting the negative impact of the APP. The 5 wt% triple-layer sample had a slightly improved pCOP at 121.1% of the control—this is due to the lower volume of APP, reducing the peak seen in Figure 13a. In Figure 13b, the CO2 production of the EG + AG 10 wt% and triple-layer 10 wt% samples can be seen to be almost identical, highlighting EG as the dominant IFR, with it falling below the EG 10 wt% sample after 60 s, showing that AG has also improved performance.
3.2.5. Mass Loss Profile
The mass loss of the samples was measured in the cone, as a measure of the proportion of the sample burnt. These are seen in Table 9. Samples that degraded to between 14 and 17% were almost completely burnt to residue at the conclusion of testing. The EG 10 wt%, EG 50 wt%, EG + AG 10 wt%, and APP 50 wt% had significant char remaining. The triple-layer 10 wt% sample retained the most mass (73.0% of its initial mass) and was the only sample to have unburnt foam underneath, highlighting the effectiveness of this combination. The initial mass also reflected that the first layer had the most significant increase in mass due to it filling into the porous foam.

Table 9.
Mass loss profile of all samples.
3.2.6. Char Residue Analysis
Figure 14a–g and Figure 15a–d display the char residue of select samples after cone testing from a top view, and Figure 16a–e from a side profile. From Figure 14a, the raw PU has completely burnt away. The EG samples formed a thicker, fluffier, and “worm-like” char than the APP []. The EG 10 wt% is ideal and sturdy, whereas the 5 wt% is too thin and cracks are formed. This is due to the EG particles not being as homogenously distributed in the coating in the lower concentration. These variations in surface morphology allow combustion fuel and heat to penetrate the layer and burn the PU below. The 50 wt% is overexpanded and breaks, highlighting the blow-off “popcorn” effect []. Its lack of rigidity can be seen in Figure 16b, as it collapsed on touch. The APP char is rubbery, thin, and ineffective, corroborating research that APP is only effective with other IFRs [,].
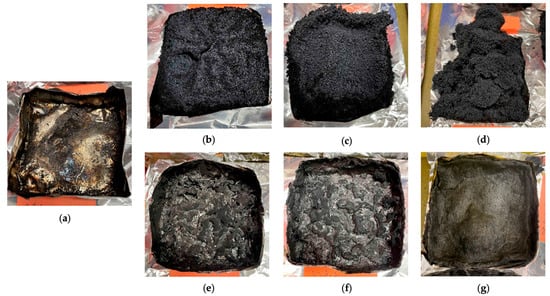
Figure 14.
Char residue of single-layer samples after cone testing: (a) PU; (b) PU + EG5; (c) PU + EG10; (d) PU + EG50; (e) PU + APP5; (f) PU + APP10; (g) PU + APP50.

Figure 15.
Char residue of combined layer samples after cone testing: (a) PU + EG10 + AG10; (b) PU + APP10 + AG10; (c) PU + EG5 + APP5 + AG5; (d) PU + EG10 + APP10 + AG10.
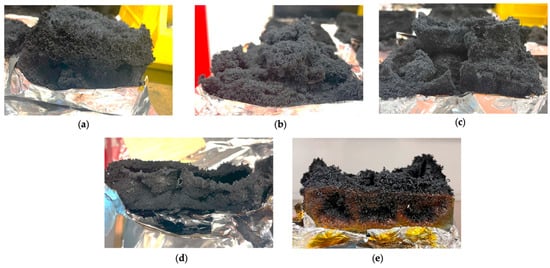
Figure 16.
Side profile of char residue, select samples: (a) PU + EG10 + AG10; (b) PU + EG50; (c) PU + EG10 + AG10; (d) PU + EG5 + APP5 + AG5; (e) PU + EG10 + APP10 + AG10.
When combined with AG, the char morphology was similar. However, the EG + AG 10 wt% sample showed cracks, likely due to the AG layer blocking some of the char production of the EG. The APP + AG 10 wt% appeared similar to the APP 10 wt%, albeit thicker. The hybrid triple-layer chars at 5% wt and 10 wt% look similar on top (Figure 15c,d); however, the side view in Figure 16e shows the superior structure of the triple-layer 10 wt% sample. It has retained structural integrity, likely from the rubbery, thick APP char reinforcing it. This was the only sample to retain some untouched foam and the prism shape of the raw PU, highlighting the superiority of the combination of additives at 10 wt%.
This superior char performance was seen in the SEM images of the char morphology (Figure 17a–c). The raw PU and triple-layer char samples were compared at 500 magnification. The lack of charring in the raw PU residue is clearly seen in Figure 17a, with no charring structure as the polymer has completely thermally degraded. Comparing the triple-layer chars, 5 wt% triple-layer char appears crumbly and inhomogeneous. The 10 wt% has a larger, more structured char as seen in Figure 17c. The homogeneity and compactness of the char are good indicators of effective intumescence in SEM imagery []. The relationship between these larger sections of char and effective flame-retardant behaviour is also seen in other SEM investigations using EG and APP []. This reflects the dominant IFR performance of the triple-layer 10 wt% sample. Further work can incorporate TGA and DSC testing to more completely characterise the decomposition and glass transition temperature of the IFR coatings [,].

Figure 17.
SEM images of char residue: (a) PU; (b) PU + EG5 + APP5 + AG5; (c) PU + EG10 + APP10 + AG10.
3.3. Numerical Modelling
Four levels of meshing were tested for a 60 s simulation to run a sensitivity analysis. The HRR was used as the measured variable of combustion. The meshes and the CPU processing time are seen below in Table 10. The results are seen in Figure 18.

Table 10.
Mesh size comparison for FDS numerical model.
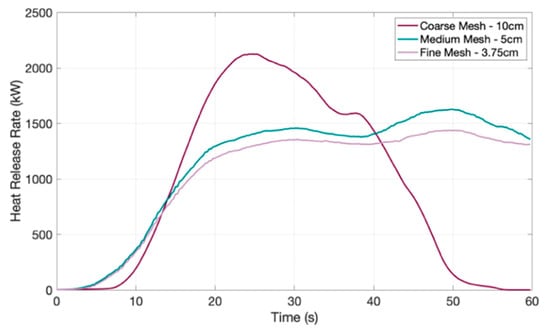
Figure 18.
Mesh independence analysis for FDS numerical model.
As seen in Figure 18, there is a variation in HRR between the coarse mesh and the two finer meshes due to the geometry of the model being highly simplified with the coarse mesh, changing the size of combustible seat surfaces. The peak, followed by the fall to 0 kW, is indicative of the fuel source (foam seats) completely burning. The heat generated is resolved to a rougher estimation leading to inaccuracies. Interestingly, it reflects the two-stage polymer degradation seen in the experimental HRR results (See Figure 8 and Figure 9). The medium and fine mesh are closely correlated, differing by 12% at maximum, which is within the recommended limit of 15% for convergence criteria []. With the fine mesh taking nearly four times longer to compute (From Table 10), the 5 cm mesh was selected as the preferred mesh for efficiency.
The computational results demonstrated the large-scale effect of burning seat foams and its effect on the cabin. This (with ventilation off) is presented below at time intervals from 0 to 90 s, the certified time to escape a commercial aircraft [], as seen in Figure 19. The peak temperatures at each thermocouple and the minimum visibility at the smoke sensors are seen in Table 11. The location of these sensors is in Figure 5.

Figure 19.
FDS results; wall temperature at combustion at various time intervals from ignition: (a) t = 0 s; (b) t = 10 s; (c) t = 30 s; (d) t = 60 s; (e) t = 90 s; (f) t = 90 s (flame and smoke set to invisible).

Table 11.
FDS temperature and visibility results from sensors. Comparison with ventilation toggled.
The severity of the fire on a large scale can be clearly seen in Figure 19f, with the left row of seats completely burnt. An insignificant difference was seen with the ventilation activated, likely due to the open boundary condition, except for the peak temperature at ceiling height (a 96 °C decrease with ventilation on) and at crawl height (a 20 °C increase with ventilation on). This may be due to the hot gases being pushed down through the cabin, heating up the crawl area []. The standing height temperature remaining the same shows that the gases followed the ventilation flow outwards to the cabin walls and downwards. The peak temperature of 1126 °C at the leftmost seat and over 1000 °C for the left three seats shows low survivability if passengers were trapped. This reiterates why raw PU is unsuitable for a seat material. As seen in similar vehicle simulations, the smoke is concentrated at the ceiling of the aircraft due to rising heat []. Visibility is then significantly lowered (by a factor of 15 in both ventilation cases) at crawl height than at ceiling height. While the FDS model presents differing data from the experimental work, it provides the potential for refinement and incorporation of experimental variables such as IFR chemical coatings and seating fabrics to be tested in the industry. With the expandable nature of the model, a model with multiple rows of seats could be analysed and provide a benchmark for safety in commercial aerospace. Apart from presenting the experimental work on a large scale, it also reflects the human impact, with the fatal consequences of uncontrolled aircraft fire being demonstrated by the visualisation.
4. Conclusions
This study demonstrated the synergistic effects of expandable graphite, ammonium polyphosphate, and alginate as a coating on PU foam to increase flame retardant performance. Cone calorimetry was used to compare the fire performance of the IFR coatings of EG, APP, and AG. EG was found to reduce the pHRR, THR, SPR, TSP, and CO2P more effectively than APP at equal weightings. When combined with AG and APP, the over-expansion of char that was observed with EG was stabilised, forming a rigid barrier to prevent the transfer of pyrolysis fuels. The combined coating of EG, APP, and AG at 10 wt% in a 1:1:1 ratio produced the lowest total heat of the coated samples at a 31.6% decrease from the raw PU control. Inspection of the sample showed that it was the only sample to retain its structure and leave unburnt foam. SEM imaging of the char morphology revealed a dense, structured char which the combined IFRs formed. The 5 wt% EG:APP:AG sample underperformed due to the high dispersion between the IFR particles in the acrylic binder, leading to extended smouldering and smoke generation. The 10 wt% concentration was, therefore, preferable. Mechanical testing showed that all coated samples outperformed the control in both tensile and mechanical strength. The IFR type was not shown to affect performance; the number of layers and thickness of the coating were the dominant variables. This highlights the practicality of IFR coatings as IFRs embedded into the foam substrate can weaken mechanical properties. The PyroSim simulation demonstrated a future capability for modelling IFR performance in large-scale aerospace applications. This study demonstrated the potential of biobased IFRs in the future of fire research and commercial applications.
Author Contributions
Supervision, I.I.K.; Resources, G.H.Y.; Methodology, C.W., P.D.; Writing—original draft, O.L.; Writing—review and editing I.I.K. All authors have read and agreed to the published version of the manuscript.
Funding
Not applicable. It was not a Funded Project.
Institutional Review Board Statement
Not applicable.
Informed Consent Statement
Not applicable.
Data Availability Statement
The original contributions presented in the study are included in the article, further inquiries can be directed to the corresponding author.
Acknowledgments
I hereby acknowledge Timothy Bo Yuan Chen from UNSW Sydney for his assistance with the use of a fire dynamics simulator (FDS) for the numerical modelling component of this work and the support by the fire testing laboratory at the School of Mechanical and Manufacturing Engineering, UNSW Sydney, Australia.
Conflicts of Interest
The authors declare no conflicts of interest.
Nomenclature
| AG | Alginate |
| APP | Ammonium polyphosphate |
| CFD | Computational fluid dynamics |
| CO2P | Carbon dioxide production |
| COP | Carbon monoxide production |
| DSC | Differential scanning calorimetry |
| EG | Expandable graphite |
| FDS | Fire dynamics simulator |
| HRR | Heat release rate |
| IFR | Intumescent flame retardant |
| LOI | Limiting oxygen index |
| pHRR | Peak heat release rate |
| PU | Polyurethane |
| SEM | Scanning electron microscope |
| SPR | Smoke production rate |
| TGA | Thermogravimetric analysis |
| THR | Total heat release |
| TSP | Total smoke production |
References
- Lyon, R.E. Development of a Fire Test for Aircraft Seat Cusions. In Proceedings of the Consumer Product Safety Commission Meeting, Rockville, MD, USA, 25 April 2013. [Google Scholar]
- Cox, J.; Markey, A.; Kohn, R.; Butcher, N.J.; Moxon, M. Smoke, Fire and Fumes in Transport Aircraft; Past history, current risk and recommended mitigations. R. Aeronaut. Soc. 2013, 2, 4–70. [Google Scholar]
- Kausar, A. Polyurethane composite foams in high-performance applications. Polym.-Plast. Technol. Eng. 2017, 57, 346–369. [Google Scholar] [CrossRef]
- Vincent, T.; Vincent, C.; Dumazert, L.; Otazaghine, B.; Sonnier, R.; Guibal, E. Fire behavior of innovative alginate foams. Carbohydr. Polym. 2020, 250, 116910. [Google Scholar] [CrossRef]
- Cheong, J.Y.; Ahn, J.; Seo, M.; Nam, Y.S. Flame-retardant, flexible vermiculite-polymer hybrid film. RSC Adv. 2015, 5, 61768–61774. [Google Scholar] [CrossRef]
- Thirumal, M.; Kastgir, D.; Singha, N.K.; Manjunath, B.N.; Naik, Y.P. Effect of Expandable Graphite on the Properties of Intumescent Flame-Retardant Polyurethane Foam. J. Appl. Polym. Sci. 2008, 110, 2586–2594. [Google Scholar] [CrossRef]
- Guo, C.; Zhou, L.; Lv, J. Effects of Expandable Graphite and Modified Ammonium Polyphosphate on the Flame-Retardant and Mechanical Properties of Wood Flour-Polypropylene Composites. Polym. Polym. Compos. 2013, 21, 449–456. [Google Scholar] [CrossRef]
- Basnayake, A.P.; Hidalgo, J.P.; Heitzmann, M.T. A flammability study of aluminium hydroxide (ATH) and ammonium polyphosphate (APP) used with hemp/epoxy composites. Constr. Build. Mater. 2021, 304, 124540. [Google Scholar] [CrossRef]
- Arockiam, N.J.; Jawaid, M.; Saba, N. Sustainable Bio Composites for Aircraft Components. In Sustainable Composites for Aerospace Applications; Woodhead Publishing: Sawston, UK, 2018. [Google Scholar]
- Kabir, I.I.; Sorrell, C.C.; Mofarah, S.S.; Yang, W.; Yuen, A.C.Y.; Nazir, M.T.; Yeoh, G.H. Alginate/Polymer-Based Materials for Fire Retardancy: Synthesis, Structure, Properties, and Applications. Polym. Rev. 2021, 61, 357–414. [Google Scholar] [CrossRef]
- Chen, H.-B.; Shen, P.; Chen, M.-J.; Zhao, H.-B.S.D.A. Highly-efficient Flame Retardant Polyurethane Foam with Alginate/Clay Aerogel Coating. ACS Appl. Mater. Interfaces 2016, 8, 32557–32564. [Google Scholar] [CrossRef]
- Yew, M.C.; Sulong, N.H.; Yew, M.K.; Amalina, M.A.; Johan, M.R. Influences of flame-retardant fillers on fire protection and mechanical properties of intumescent coatings. Prog. Org. Coat. 2015, 78, 59–66. [Google Scholar] [CrossRef]
- Craig, M.; Asim, T. Numerical Investigations on the Propagation of Fire in a Railway Carriage. Energies 2020, 13, 4999. [Google Scholar] [CrossRef]
- Ng, Y.H.; Dasari, A.; Tan, K.H.; Qian, L. Intumescent fire-retardant acrylic coatings: Effects of additive loading ratio and scale of testing. Prog. Org. Coat. 2021, 150, 105985. [Google Scholar] [CrossRef]
- ATSM International. Standard Test Method for Heat and Visible Smoke Release Rates for Materials and Products Using an Oxygen Consumption Calorimeter; ASTM International: West Conshohocken, PA, USA, 8 August 2017; Available online: https://www.astm.org/e1354-17.html (accessed on 3 April 2022).
- Ugarte, L.; Saralegi, A.; Fernández, R.; Martín, L.; Corcuera, M.A.; Eceiza, A. Flexible polyurethane foams based on 100% renewably sourced polyols. Ind. Crops Prod. 2014, 62, 545–551. [Google Scholar] [CrossRef]
- ASTM D638-14; Standard Test Method for Tensile Properties of Plastics. ASTM International: West Conshohocken, PA, USA, 2017.
- Witkiewicz, W.; Zieliński, A. Properties of the Polyurethane(PU) Light Foams. Adv. Mater. Sci. 2006, 6, 35–51. [Google Scholar]
- Leng, Y.; Xu, M.-J.; Sun, Y.; Han, R.-X.; Li, B. Simultaneous enhancement of thermal conductivity and flame retardancy for epoxy resin thermosets through self-assemble of ammonium polyphosphate surface with graphitic carbon nitride. Polym. Adv. Technol. 2019, 30, 2468–2479. [Google Scholar] [CrossRef]
- Yuen, A.C.Y.; Chen, T.; Yuan, B.; Yeoh, G.H.; Yang, W.; Cheung, S.C.-P.; Cook, M.; Yu, B.; Chan, Q.N.; Yip, H.L. Establishing pyrolysis kinetics for the modelling of the flammability and burning characteristics of solid combustible materials. J. Fire Sci. 2018, 36, 494–517. [Google Scholar] [CrossRef]
- Fehrm, B. Redefining the 757 replacement: Requirement for the 225/5000 Sector. Leeham News and Analysis, 25 February 2015; p. 1. [Google Scholar]
- Bich, C. Application of RAMSIS in Passenger Aircraft Seat Development at Recaro Aircraft Seating. In Proceedings of the RAMSIS User Conference 2018, Schwabisch Hall, Germany, 20 June 2018. [Google Scholar]
- McGrattan, K.; McDermott, R.; Weinschenk, C.; Forney, G. Fire Dynamics Simulator Users Guide, 6th ed.; National Institute of Standards and Technology (NIST): Gaithersburg, MD, USA, 2013. [Google Scholar]
- Wang, X. Fire Dynamics Simulator (FDS) Pyrolysis Model Analysis of Heavy Goods Vehicle Fires in Road Tunnels; University of Canterbury: Christchurch, New Zealand, 2017. [Google Scholar]
- National Research Council (US) Committee on Air Quality in Passenger Cabins of Commercial Aircraft. The Airliner Cabin Environment and the Health of Passengers and Crew; National Library of Medicine: Washington, DC, USA, 2002.
- ASTM D3574-17; Standard Test Methods for Flexible Cellular Materials—Slab, Bonded, and Molded Urethane Foams. ASTM International: West Conshohocken, PA, USA, 2017.
- Špirk, S.; Křížek, M.; Jeníček, Š. Polyurethane Foam Behaviour during Impact. In Proceedings of the MATEC Web of Conferences; EDP Sciences: Les Ulis, France,, 2018. [Google Scholar]
- Zeng, L.; Yang, L.; Ai, L.; Ye, Z.; Liu, P. Synergistic Flame Retardant Effect of Ammonium Polyphosphate and Aluminum Hydroxide on Polyurethane. J. Wuhan Univ. Technol. Mater. Sci. Ed. 2022, 37, 533–539. [Google Scholar] [CrossRef]
- Wang, Z.; Han, E.; Ke, W. Influence of expandable graphite on fire resistance and water resistance of flame retardant coatins. Corros. Sci. 2007, 49, 2237–2253. [Google Scholar] [CrossRef]
- Wang, Y.; Zhao, J.; Meng, X. Effect of expandable graphite on polyester resin-based intumescent flame retardant coating. Prog. Org. Coat. 2019, 132, 178–183. [Google Scholar] [CrossRef]
- Morgan, A.; Wilkie, C. Non-Halogenated Flame Retardant Handbook; Scrivener Publishing LLC.: Beverly, MA, USA, 2014. [Google Scholar]
- Kabir, I.I.; Fu, Y.; De Souza, N.; Baena, J.C.; Yuen, A.C.Y.; Yang, W.; Mata, J.; Peng, Z.; Yeoh, G.H. PDMS/MWCNT nanocomposite films for underwater sound absorption applications. J. Mater. Sci. 2020, 55, 5048–5063. [Google Scholar] [CrossRef]
- Butcher, N.; Barnett, D.J.; Buckland, T. Emergency Evacuation of Commercial Passenger Aeroplanes. R. Aeronaut. Soc. 2022, 2, 33–34. [Google Scholar]
- Lohert, A.; Monreal, N.; Knaust, C.; Hofmann, A.; Krause, U. CFD Modelling approach of smoke toxiticy and opacity for flaming and non-flaming combustion processes. Fire Mater. 2015, 40, 759–772. [Google Scholar] [CrossRef]
- Amaral, C.; Vicente, R.; Eisenblätter, J.; Marques, P.A.A.P. Thermal characterization of polyurethane foams with phase change material. Ciência Tecnol. Dos Mater. 2017, 29, 1–7. [Google Scholar] [CrossRef]
Disclaimer/Publisher’s Note: The statements, opinions and data contained in all publications are solely those of the individual author(s) and contributor(s) and not of MDPI and/or the editor(s). MDPI and/or the editor(s) disclaim responsibility for any injury to people or property resulting from any ideas, methods, instructions or products referred to in the content. |
© 2024 by the authors. Licensee MDPI, Basel, Switzerland. This article is an open access article distributed under the terms and conditions of the Creative Commons Attribution (CC BY) license (https://creativecommons.org/licenses/by/4.0/).