Article

Flashover Features in Aircraft Cargo Compartment at Low Pressure

1
Department of the Civil Aviation Safety Engineering, Civil Aviation Flight University of China, Guanghan 618307, China
2
Civil Aircraft Fire Science and Safety Engineering Key Laboratory of Sichuan Province, Guanghan 618307, China
*
Authors to whom correspondence should be addressed.
Fire 2024, 7(10), 350; https://doi.org/10.3390/fire7100350
Submission received: 30 August 2024 / Revised: 15 September 2024 / Accepted: 18 September 2024 / Published: 30 September 2024
(This article belongs to the Special Issue Advances in Industrial Fire and Urban Fire Research)

Abstract

:
The flashover mechanism in an aircraft cargo compartment under low pressure was investigated in this study. A series of fire experiments were conducted in a scale model of a one-quarter volume FAA standard aircraft cargo compartment at 96 kPa and 60 kPa. The ignition of single-walled corrugated cardboard was chosen as the criterion of the flashover. The influence of different fire sizes and fuel types on the flashover was studied by comparing the average temperature of the smoke layer, the radiation heat flux at the floor level, and the heat release rate of the fire source. The critical condition and behavior of the flashover were analyzed. The results show that under low pressure, the flashover occurs at a higher temperature and radiation heat flux. Increasing the fire source size brings the flashover forward. At 60 kPa and 96 kPa, the cardboard ignites under a flashover when the average temperature of the smoke layer reaches 551 °C and 450 °C, and the average radiant heat flux at the floor level reaches 19.6 kW/m2 and 14 kW/m2, respectively. In addition, the minimum fire size for a flashover is directly proportional to the heat of evaporation and inversely proportional to the heat of combustion.

1. Introduction

The aircraft cargo compartment is a typical confined space with various combustibles and a large fire load and poor ventilation, providing the conditions for the most dangerous of fires, the flashover [1]. Once a fire occurs, combustible smoke will quickly accumulate on the ceiling. If a flashover occurs, this will seriously threaten human lives and cargo [2,3,4,5]. Aviation accident statistics indicate that aircraft cargo fire accidents occur frequently and are extremely harmful. In 2007, China Airlines Flight No. 120 suddenly caught fire, and this burned the No. 2 engine on the right wing of the aircraft. The cabin exploded in 198 s, and the aircraft began to burn in full. In 2013, when Asiana Airlines Flight 214 landed at San Francisco International Airport, the tail of the aircraft hit the airport breakwater. The plane caught fire instantly and an explosion occurred about 3 min later, killing a total of 307 passengers and crew members. Oxygen is thin in places with low pressure, and the fire development process is different from that in places at atmospheric pressure; the time and scale of deflagration will also be different. Airports with altitudes of over 2438 m present a typical low-pressure environment. High-altitude airports around the world are mainly distributed in China, Nepal, Peru, and other countries. Studying the development of a flashover in an aircraft cargo compartment will help reduce the input of rescue personnel and equipment to a great extent, improving the safety of the adjacent airspaces.
The phenomenon of a flashover in a confined space under atmospheric pressure has been studied around the world. Chow [6] applied a zone model to investigate flashovers in confined spaces with different ventilation areas and analyzed the mass flow rates for intake air and outgoing smoke, the average temperatures of the upper and lower layers, the height of the interface between the smoke layers, and other important parameters. Xing et al. [7] used Fire Dynamics Simulator (FDS) software (version 6.9.1) to study a flashover in the carriage of electric multiple units (EMUs). A power function relationship was found between the heat release rate (HRR) of the ignition source and the occurrence time of the flashover. Kumar et al. [8] conducted a full-scale compartment flashover study using plywood board as the wall lining. The peak heat-release rate, flashover circumstances, and transient gas concentrations were examined in relation to the fire safety capacity limitations.
Fire under low pressure was studied in 1997 in a test room of 6 m × 2.8 m × 2.1 m [9]. The pressure was set at 97 kPa or 71 kPa, and parameters such as the combustion mass loss, gas concentration, and smoke density were measured. The results showed that as the pressure decreased, the fire developed, and the smoke density decreased more slowly. However, the ceiling temperature of the smoke layer and CO concentration were slightly affected by the compartment pressure. Thereafter, Liu et al. [10] investigated the effects of low pressure on the combustion characteristics of early fires and analyzed the changes in the HRR and smoke concentration of the fire source. It was found that the HRR of the fire source was reduced under low pressure, which provides some guidance for the design and application of fire detection systems in highland areas. Li et al. [11] conducted n-heptane tank and wood crib fire experiments in two laboratories under different pressures. Significant differences in the combustion characteristics, such as the flame temperature, thermal radiation flux, and fuel mass loss, were found. For the same burning surface area, the burning rate, radiation heat flux, and flame temperature were lower under low pressure than under atmospheric pressure, but the combustion time was longer. Xin [12] investigated the combustion characteristics of gasoline and n-heptane pool fires at various pressures within a low-pressure simulated cargo compartment. Measurements were taken of the combustion characteristics, such as the flame temperature and mass loss rate of the fuel source.
Flashover fire reports are attracting increasing attention at present. However, there have been more flashover studies on aircraft cabins than on cargo compartments. Fire research in places under low pressure has started late, with few cases investigated, such as those in large-sized spaces. In 1985, Sarkos et al. [13] of the Federal Aviation Administration (FAA) conducted research on a C-133 full-sized aircraft cabin. The results showed that the location of the fire source has a crucial impact on the occurrence of a flashover. The closer the fire source to the cabin door, the lower the possibility of a flashover. Wang et al. [14] simulated a flashover in a C-133, with its dimensions provided by the FAA, using a computational fluid dynamics fire-field model to predict the occurrence time of the flashover. In 2016, Zhang et al. [15] analyzed the factors of flashover initiation based on the BFD curve parameter model, and they found that the opening factor, fuel load, and fire development coefficient can directly affect the occurrence of a flashover. However, due to large differences in structures, fuel types, and ventilation conditions between the aircraft cabin and the cargo compartment, data on aircraft cabin flashover cannot be directly applied to the cargo compartment. Therefore, this study used a one-quarter volume FAA standard cargo aircraft as a flashover experimental platform. The experimental platform was based on the Autonomous Project of the Sichuan Key Laboratory of Civil Aircraft Fire Science and Safety Engineering, with preliminary results reported in [16]. The effects of different sizes and types of fire sources on the flashover were studied to reveal the inherent mechanism of a flashover in an aircraft cargo compartment, optimize the aircraft cargo compartment design, improve the firefighting capability, and reduce the casualties and property losses caused by a flashover.

2. Experimental Setup

2.1. Experimental Platform

The experimental aircraft cargo compartment was a one-quarter volume FAA standard aircraft cargo compartment [17] with inner dimensions of 4.16 m × 2.03 m × 1.67 m and a front-opening vent A (1.2 m × 0.8 m), as shown in Figure 1. Several types of fuel were added to a square steel pan of variable size that was positioned in the middle of the cargo compartment floor. Beneath the steel pan, a high-precision electronic balance (KM-11) was used to quantify the mass loss of the fuel. A 3 cm-thick isolation blanket was placed between the steel pan and the balance in order to safeguard the instrument. The electronic balance had a range of 60 kg and an accuracy of 1 g. Considering that single-wall corrugated cardboard boxes are ideal for packing lightweight, fragile, or standard-sized items in air transportation, two single-wall corrugated cardboard boxes of 45.7 cm × 45.7 cm × 45.7 cm with a separation of 40 cm were positioned 50 cm from the left edge of the steel pan, complying with FAA guidelines for solid fire experiments in aircraft cargo compartments. To measure the radiant heat flux that the floor received, two radiation heat flux meters, designated as R1 and R2, were positioned on opposite sides of the boxes, with an accuracy of ±3% and a range of 0–200 kW/m2. The existing flashover theory is generally based on two-region models, that is, assuming that the confined space can be divided into the upper smoke layer area and the lower smoke layer area; the thermal property parameters of the smoke layer are the focus of this investigation. Therefore, eight sets of thermocouple trees (T1~T8) were arranged to measure the temperature of the smoke layer. The three corners of the cargo compartment were used to position the thermocouple trees T1, T3, and T8. The thermocouple trees T2, T4, T6, and T7 were positioned at the center of each wall. The center of the steel pan was directly beneath the thermocouple tree T5. Each thermocouple tree was separated by 10 cm from the wall. Six thermocouples were mounted from the cargo compartment ceiling downward on each tree. The temperature of the 50 cm-thick layer of smoke in the ceiling of the cargo compartment was measured using thermocouples spaced 10 cm apart. All of the K-type thermocouples used in the experiment had a diameter of 1 mm, a measurement range of −100 °C to 1300 °C, and an accuracy of 1 °C.

2.2. Experimental Conditions and Procedure

This study focused on the effects of steel pan size and fire source type on a flashover in a confined space under atmospheric pressure and low pressure. The effects of fuel type and fire size were investigated at two different pressures, 96 kPa at the Civil Aviation Flight University of China, Guanghan, and 60 kPa at Ganzi Kangding Airport. This study concerns low-pressure environments such as high-altitude airport applications. Aviation kerosene is the most commonly used jet fuel in commercial aviation due to its high energy density and good thermal stability. At high-altitude airports, n-heptane may be used to simulate and test engine performance under extreme conditions. Anhydrous ethanol is a renewable energy source that can be used as a clean fuel source. In addition, n-heptane is the standard fuel used to study liquid fires; aviation kerosene is the fuel used in airplanes, and there is a risk of leakage; anhydrous ethanol is a common liquid used in the transportation of airplane cargo, and there is similarly a risk of leakage. In summary, these fuels are selected at high-altitude airports to ensure flight safety, optimize engine performance, and support environmental and sustainability goals. n-heptane, aviation kerosene, and anhydrous ethanol were selected for the fuel source; the steel pan selected was a square pan that complies with the Federal Aviation Administration (FAA) minimum performance standard (MPS) liquid fire standard, and the size of the fire source ranged from 20 to 60 cm, with a thickness of 1 cm. The experimental conditions are shown in Table 1.
In general, the accepted criteria [17] for a flashover are as follows: (1) the temperature of the ceiling smoke layer in a confined space reaches 600 °C; (2) the radiation heat flux at the floor level in the confined space reaches 20 kW/m2; and (3) all combustibles in the confined space are ignited. It should be noted that although the first two criteria have high accuracy for studying indoor wood decoration materials and furniture components in building fires, these may not be appropriate for an aircraft cargo compartment with cardboard, fabric, and other materials. As a result, this study used the third criterion for determining a flashover in the aircraft cargo compartment. The time in the experiment began when the fuel in the steel pan was ignited, followed by the ignition of a single piece of single-wall corrugated cardboard, which was considered to represent the occurrence of a flashover, and the experiment was complete when the flame was entirely extinguished. To maintain the consistency of the experiment, the cargo compartment was cooled and ventilated so that the temperature fell sufficiently to create an ambient environment. Each set of tests was performed at least three times in order to increase the dependability of the data from the experiments.

3. Results and Discussion

3.1. Flashover Process

The temperature variation in the smoke layer for a 60 kPa, 50 cm aviation kerosene pool fire is shown in Figure 2. The average temperature of the smoke layer and the radiation heat flux at the floor level steadily rose after the aviation kerosene in the steel pan was ignited. The two single-wall corrugated cardboard boxes started to pyrolyze with black smoke, while thermal smoke continued to build up on top of the cargo compartment. The flashover took place at 295 s as the cardboard began to burn beneath the thermal radiation of the smoke layer. The average temperature of the smoke layer was 545 °C, and the radiation heat flux at the floor level was 19.5 kW/m2. After that, both the average temperature and the radiation heat flux rose significantly, reaching 643 °C and 29.4 kW/m2, respectively. Due to the limited amount of combustible material in the cargo compartment, full combustion following flashover occurred only for a short time. As the combustible material burned out, the fire proceeded to the decayed stage. The average temperature of the smoke layer and the radiation heat flux at the floor level in the compartment gradually decreased.
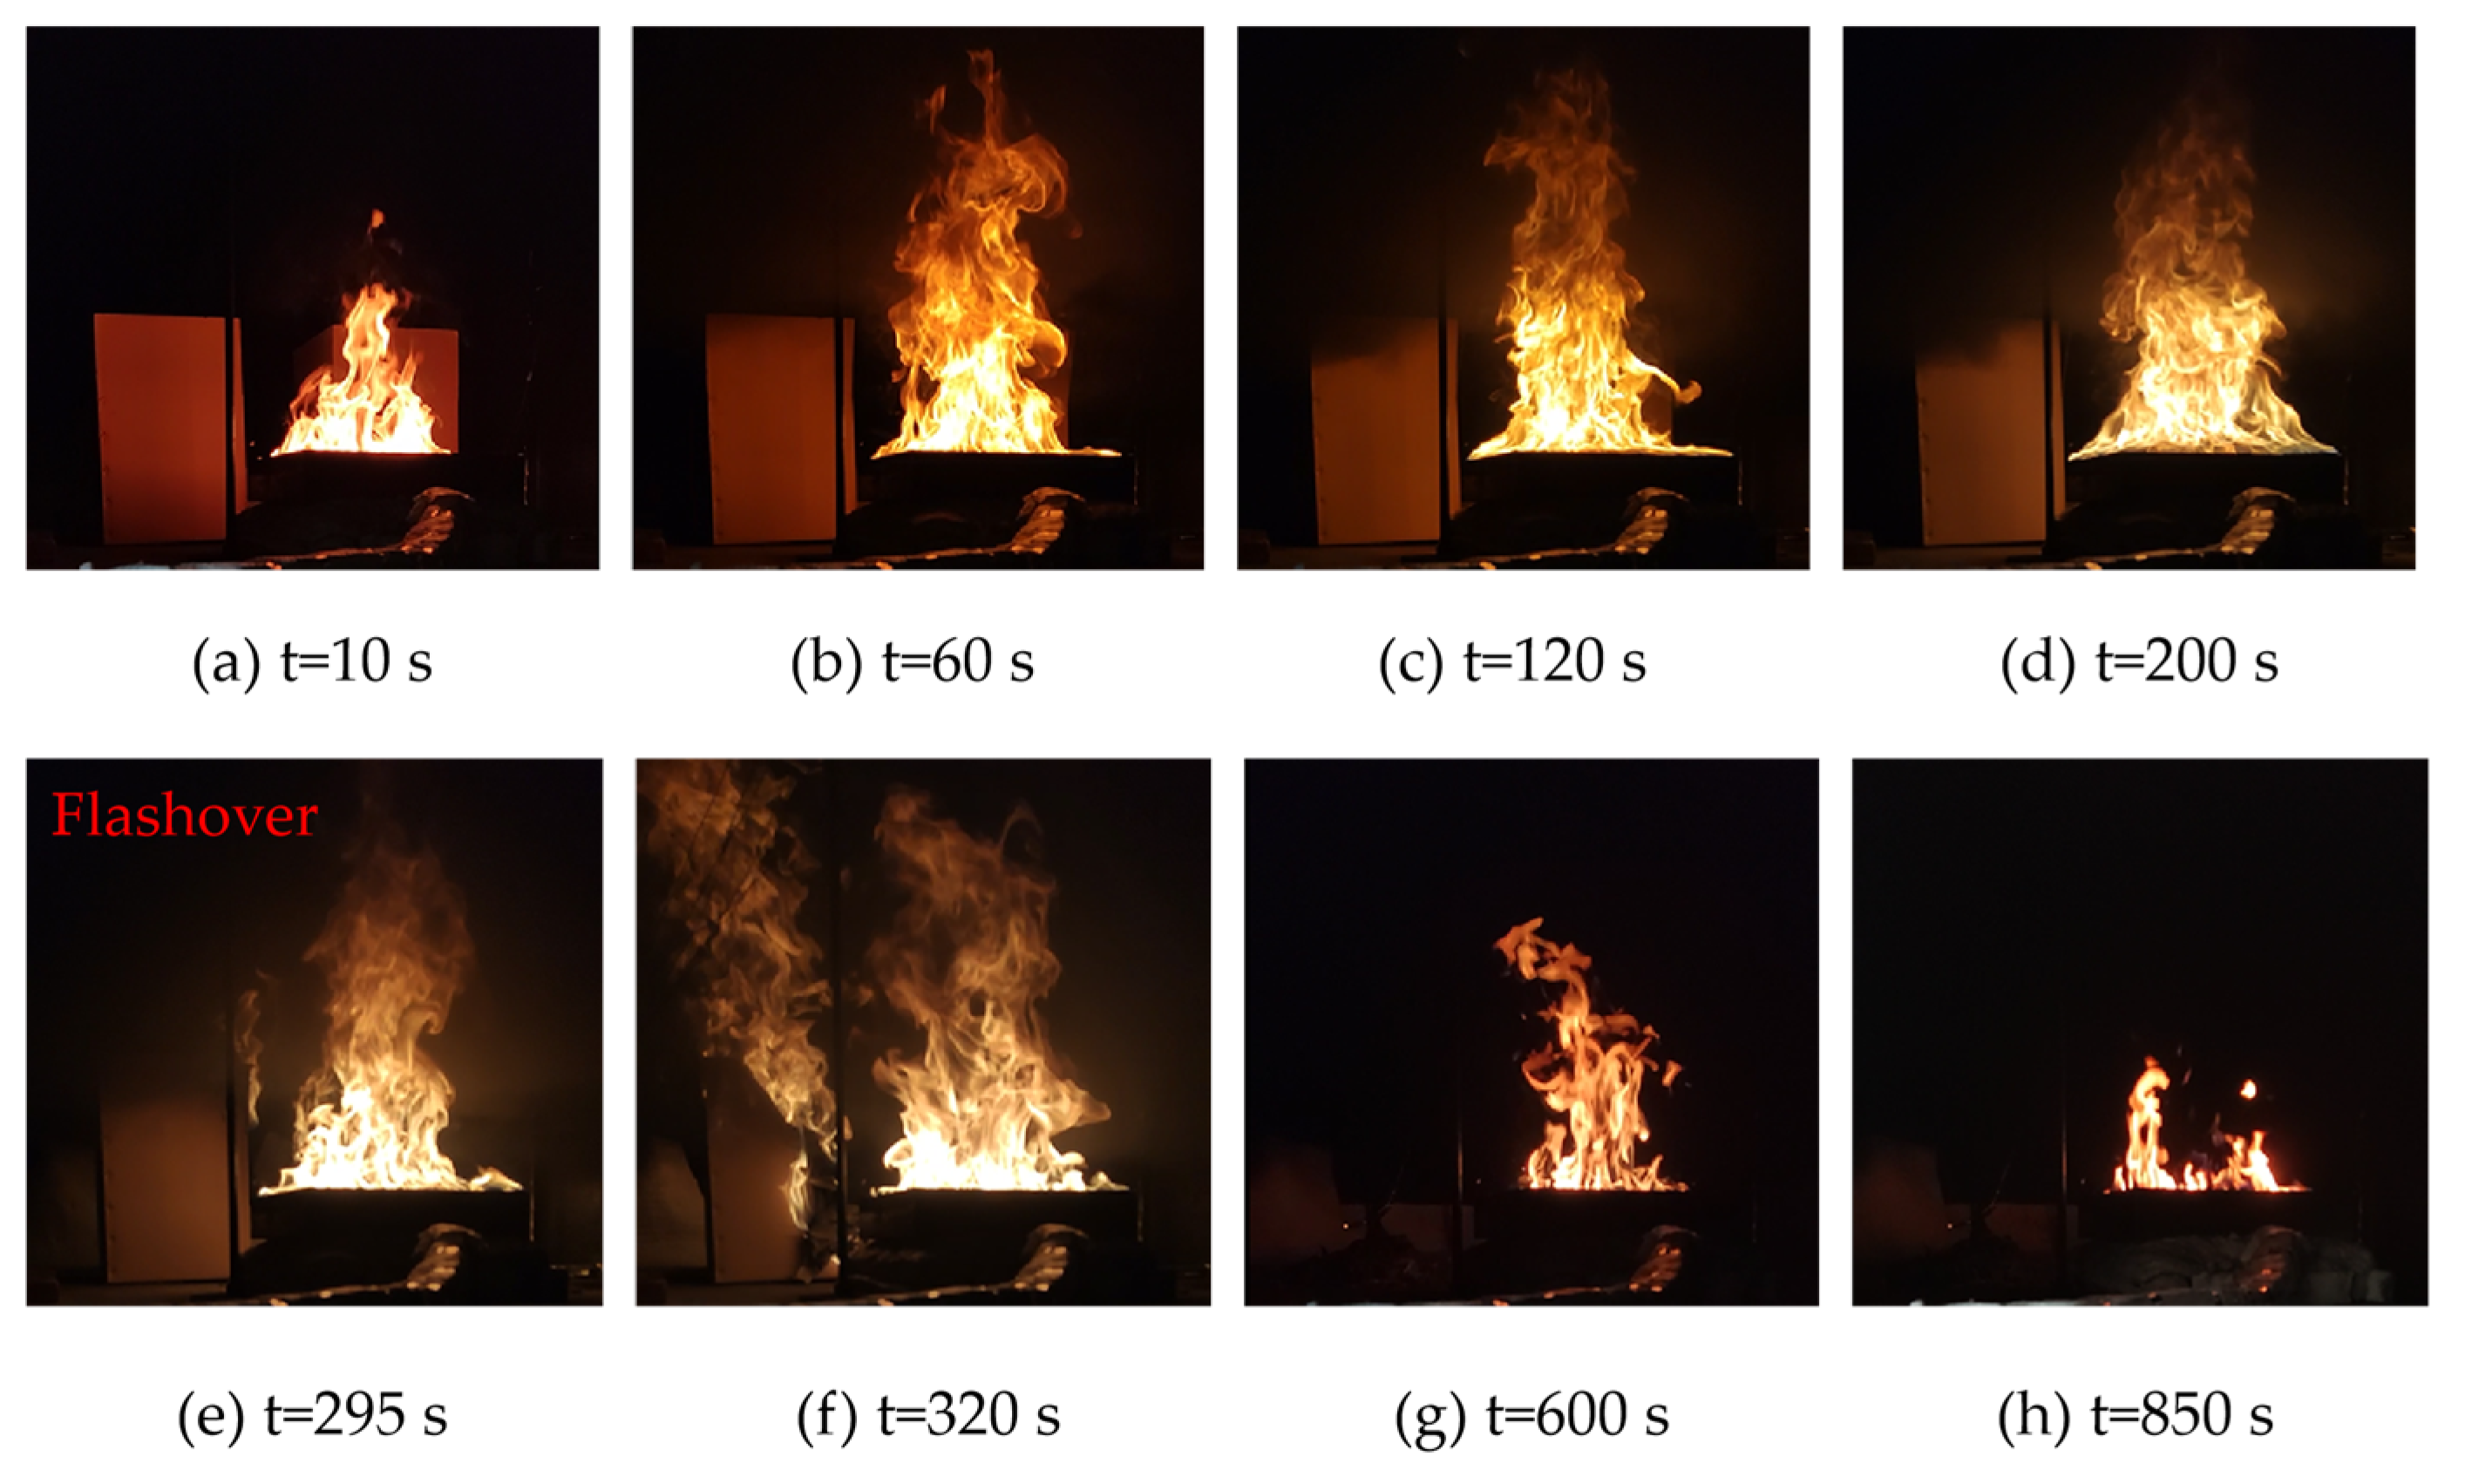
As shown in Figure 3, the four stages of a flashover fire in a confined space can be identified easily, namely, incipient, growth, fully developed, and decayed. The flashover was in the incipient stage for the first 295 s, during which the flame scale slowly enlarged, combustible smoke built up at the top of the cargo compartment, and the temperature of the smoke layer rose. The cardboard started to pyrolyze and emitted black smoke under thermal radiation from the smoke layer, as shown in Figure 3a–d. Figure 3e illustrates what happened when the flashover occurred at 295 s. Immediately following the flashover, the temperature of the smoke layer rose sharply. The flashover then entered the fully developed stage with a further expansion of the flame scale, during which the temperature of the smoke layer and the radiation heat flux at the floor level reached their peak, as shown in Figure 3f. As the combustibles in the compartment burn out, the flashover enters the decayed stage, which causes the temperature in the cargo compartment to decrease, as seen in Figure 3g,h.
The mass loss rate of the fuel is calculated using the frame mass data collected with the electronic scale. The heat release rate of the fuel in the combustion process is calculated using (1):
Q = m h c
where Q represents the heat release rate of the fire source, m represents the mass loss rate of the fuel, and hc represents the heat of combustion of the fuel, which is taken as 4.797 × 10⁴ kJ/kg for aviation kerosene [18]. The combustion efficiency in the confined space used in this study is 100%. Firstly, the reason for this is that, although the one-quarter volume FAA standard cargo compartment used in the experiment is a confined space, the volume of the space is large enough, at about 14 m3. A vent with an area of 1 m2 is set near the fuel source, which to a certain extent ensures that the oxygen is sufficiently consumed during the experiment. Secondly, when ventilation is not taken into account, it is assumed that the experiment is carried out in a completely confined space. The calculated oxygen consumption during fuel combustion at 60 kPa and 100 °C is only 2.5%. Therefore, it is reasonable to assume that the fuel can be burned in this confined space.
The changing oxygen concentration inside the experimental aircraft cargo compartment is deduced through the fuel mass loss. According to the volume distribution and the average temperature of the smoke layer, the estimated temperature of the whole aircraft cargo compartment during the experiment is about 100 °C. Therefore, the gas molar volume under 60 kPa conditions is calculated using the ideal gas equation. The oxygen content inside the experimental aircraft cargo compartment is different from that in the air. The oxygen concentration can be estimated using the ratio of oxygen content to total gas content in the experimental aircraft cargo compartment, as demonstrated in (2):
C t + 1 = V w c V e m 0.21 V e m V w c k m i + 1 M A k
where Vwc represents the gas molar volume, Vem represents the experimental aircraft cargo compartment volume (14 m3), k represents the molar ratio of fuel to oxygen during complete combustion (12.5 in this case), and MAk represents the molar mass of aviation kerosene. As mass was measured at short time intervals, the oxygen concentration (Ct+1) inside the experimental compartment was approximated as the oxygen concentration at time (ti+1). The variation in oxygen concentration during the experiment is shown in Figure 4.
As shown in Figure 4, under the conditions of 60 kPa and 100 °C, when the fuel combustion reached the maximum heat release rate, the oxygen concentration was at its minimum: 18.5% of the air. In this case, the oxygen consumed by fuel combustion was 2.5%, while the experimental aircraft cargo compartment actually had a vent to facilitate the flow of oxygen, indicating that the oxygen consumed by fuel combustion was less than 2.5%. Therefore, this study considered that the fuel combusted completely.
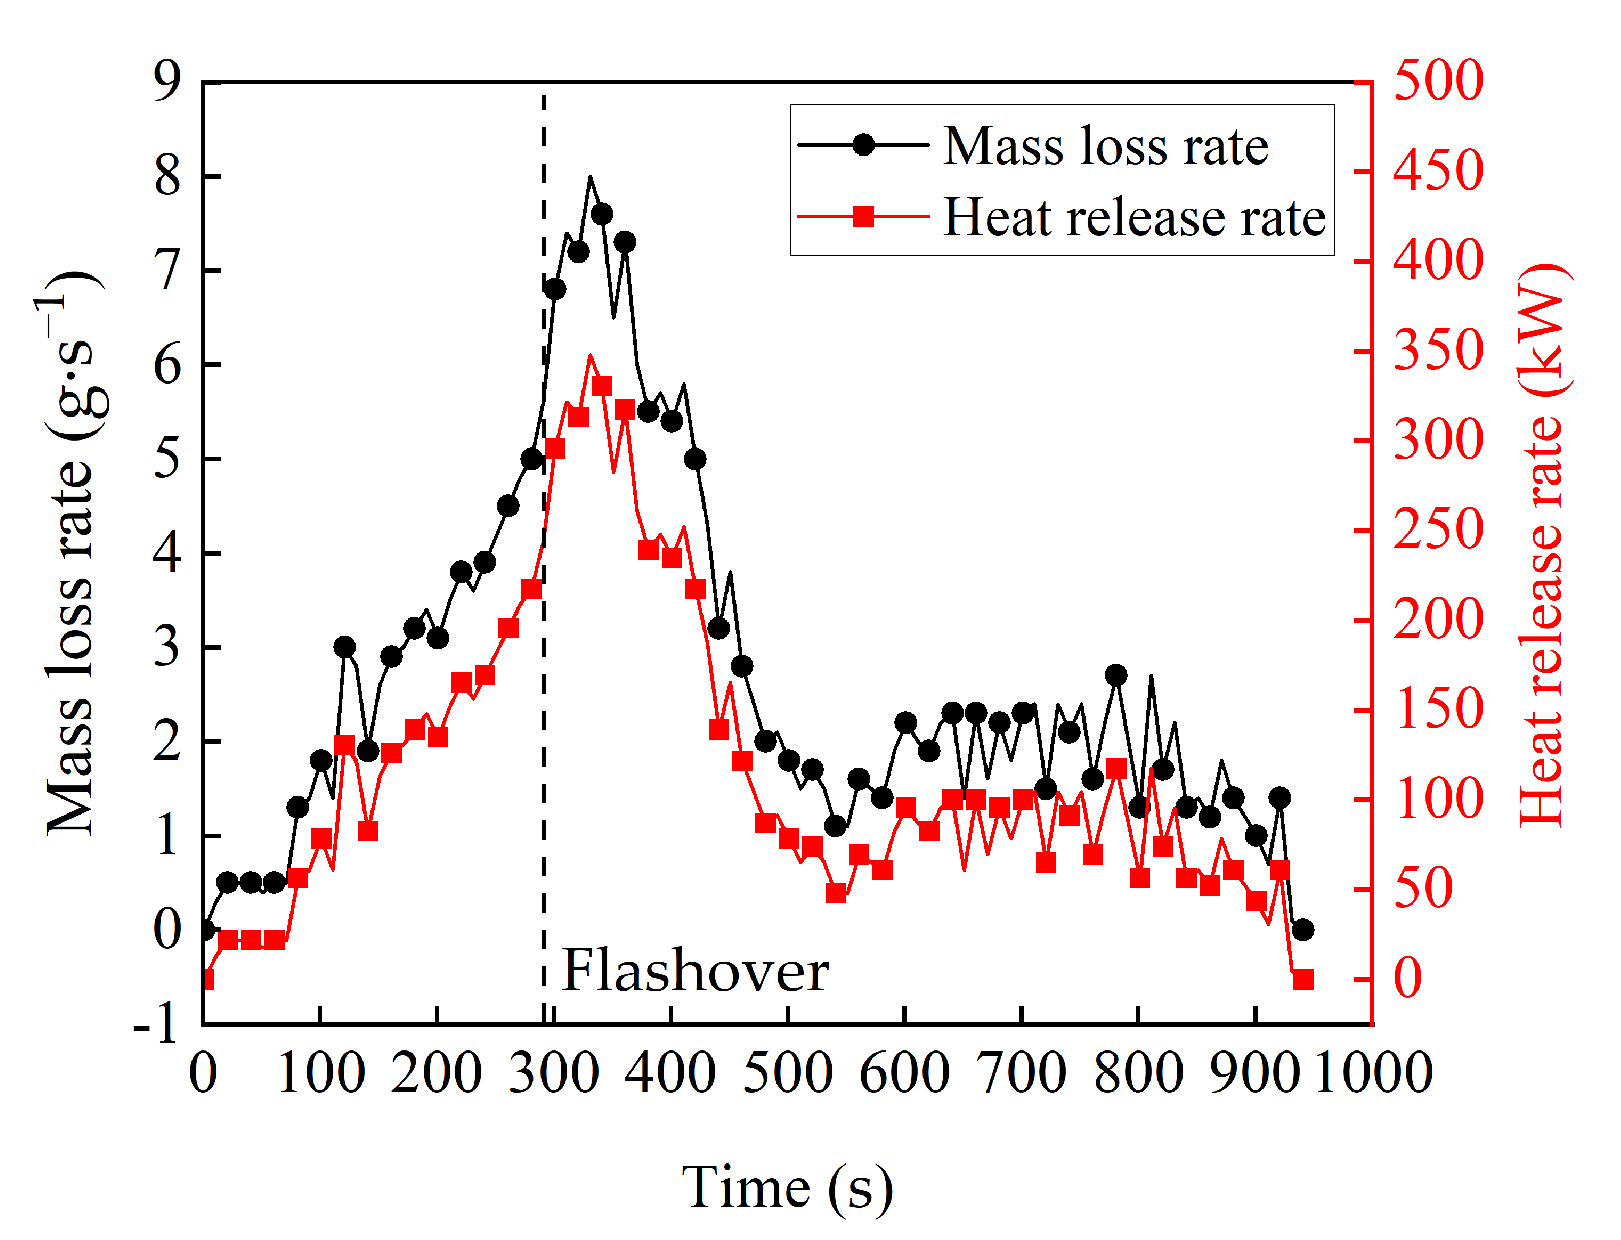
The variation in the mass loss rate and heat release rate of the fuel for a 50 cm aviation kerosene pool fire is shown in Figure 5. The combustible gas continued to evaporate after the fuel was ignited. While the combustion process continued, the temperature of the smoke layer rose gradually. The flame height continually increased, and the heat radiation at the fuel level also gradually rose. As a result, both the mass loss rate of fuel and the heat release rate rose steadily. The cardboard ignited and radiated heat outward, causing an abrupt increase in the heat feedback received by the fuel. This caused the mass loss rate and heat release rate of the fuel to increase quickly. At this point, the mass loss rate and heat release rate of the fuel had reached the critical point that can initiate a fail-safe. The mass loss rate of fuel and the heat release rate reached their maximums at 8 g/s and 348 kW, respectively, as the combustion intensified further. Subsequently, as the effective combustion area shrank, the remaining fuel was gradually consumed and the combustion entered the extinction stage, while the mass loss rate of fuel and the heat release rate also gradually decreased.
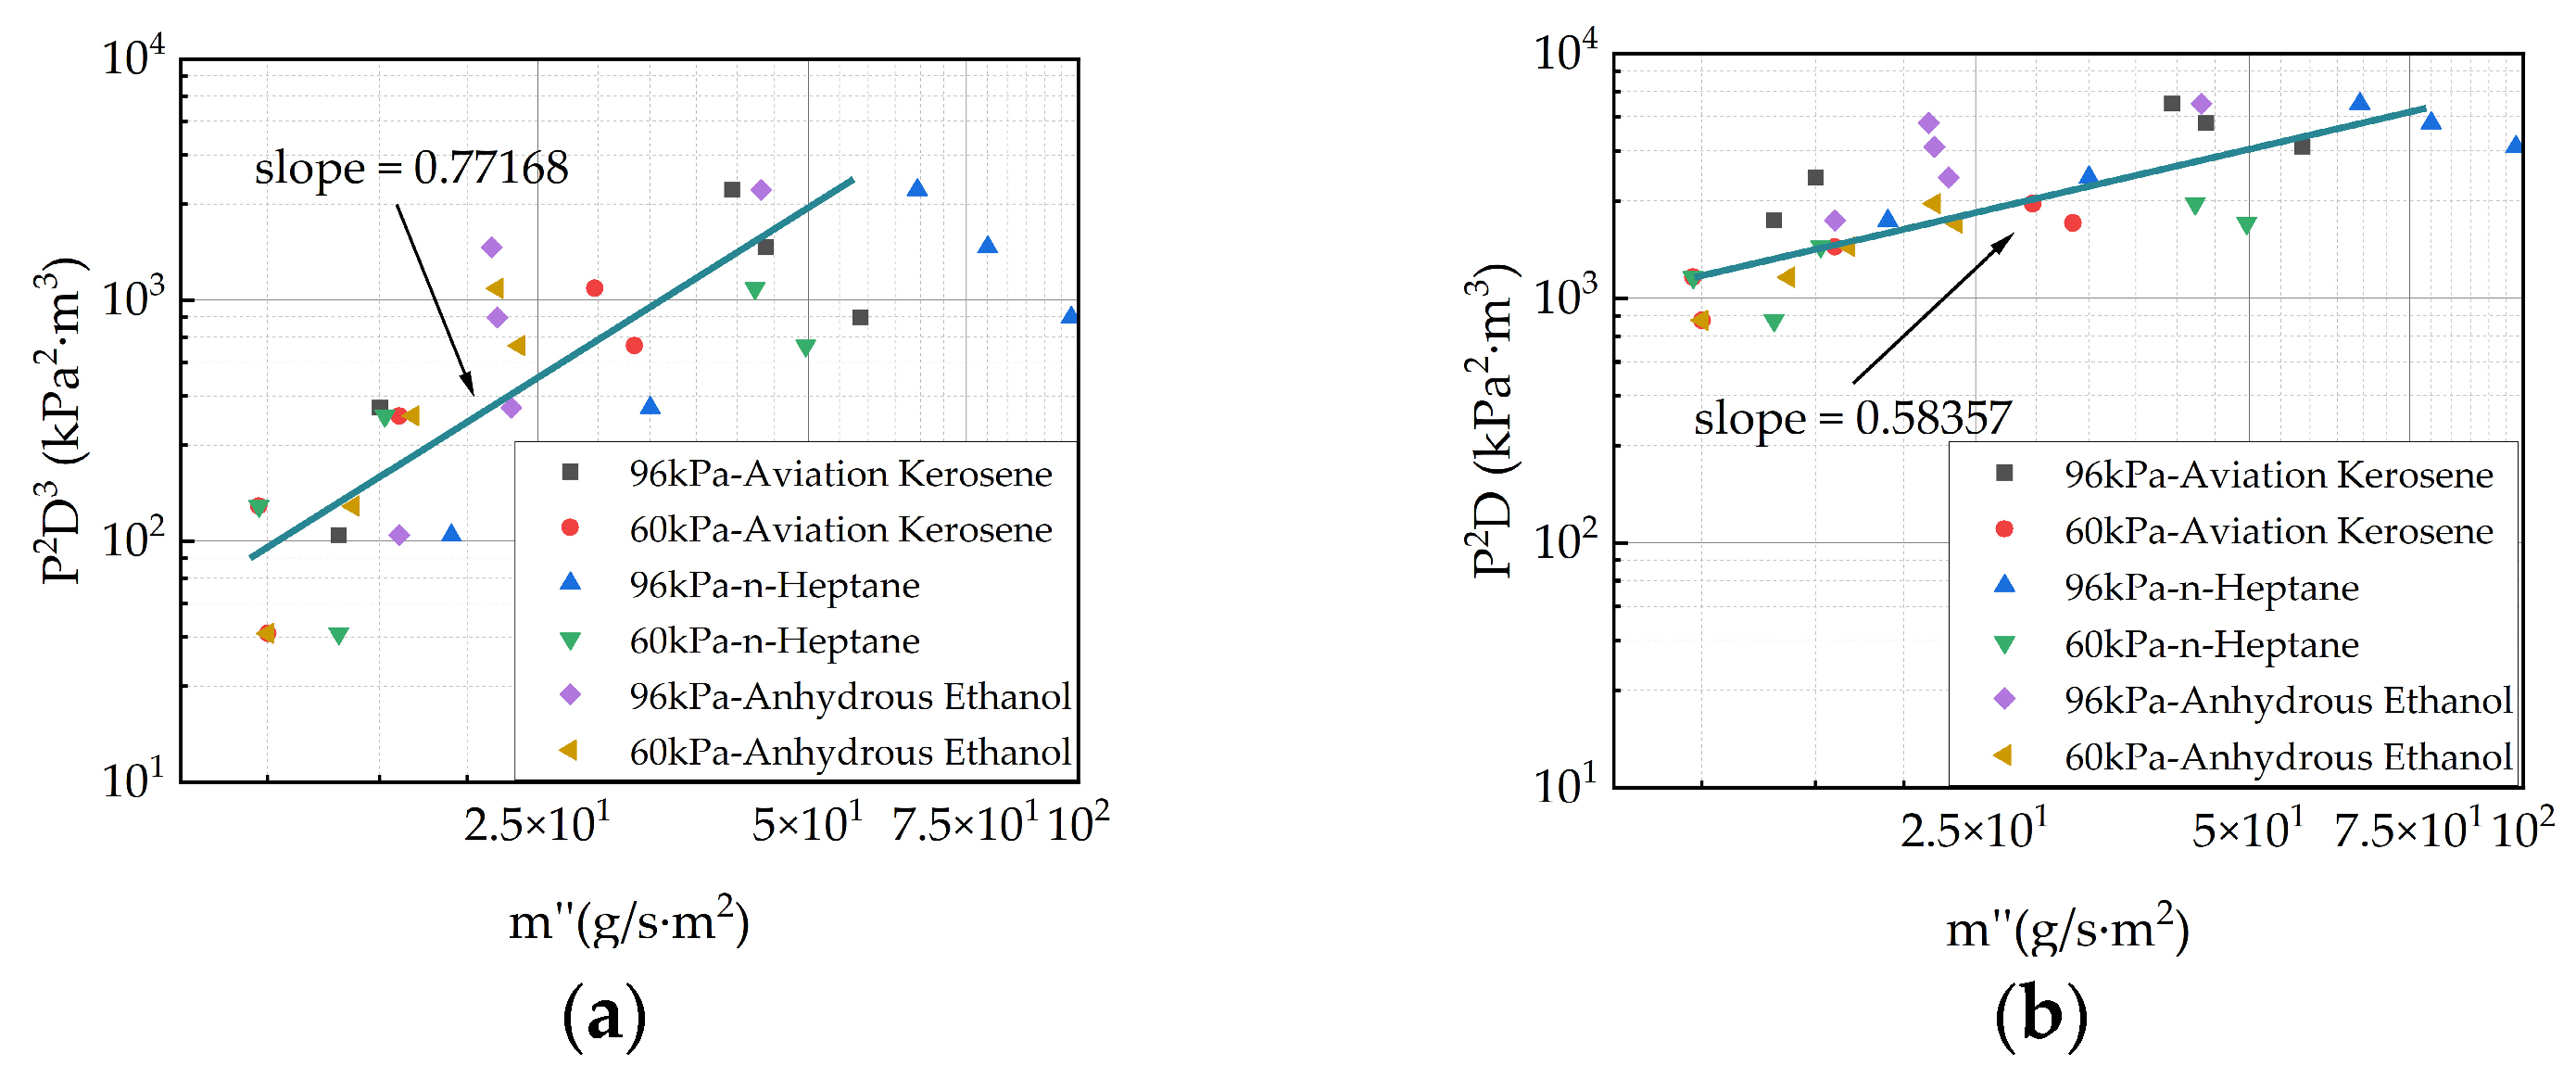
To establish the mass loss rate per unit area, previous studies [19,20,21] have proposed a pressure model m″~fcn(p2D3) and radiation model m″~fcn(p2D) based on the ambient pressure p and the diameter of the fire source D. The equivalent diameter of the oil pool was calculated with Deq = 2L/√π, and a square oil pool with a side length of L was used in this experiment. To confirm the relationship between thermal convection and thermal radiation during the pool fire combustion process of this experiment, the experimental data were plotted using the two models, as shown in Figure 6.
The horizontal axis in the figure represents the mass loss per unit area of pool fires, denoted m″ = m′/L2, while the vertical axis represents pressure model p2D3ep and radiation model p2Dep for two different types of pool fires at different ambient pressures. Figure 6 shows the 96 kPa and 60 kPa data in the pressure model and the radiation model. In summary, the radiation model of the mass loss rate per unit area can be given as m″ ∝ (p2Deq)1/0.58357, and the pressure model of the mass loss rate per unit area can be given as m″ ∝ (p2D3eq)1/0.77168. Therefore, under the experimental conditions, the radiation model has been confirmed to be better than the pressure model at correlating the unit area mass loss rate of the pool fire.

3.2. Effect of Fire Size on Flashover

Time of flashover for various fuel source sizes at 96 kPa and 60 kPa is shown in Table 2. The crucial steel pan size needed to induce flashover at 96 kPa is 40 cm for n-heptane and aviation kerosene pool fires and 60 cm for anhydrous ethanol pool fires. For n-heptane and aviation kerosene pool fires, the critical steel pan size needed for the initiation of flashover at 60 kPa is 50 cm, while anhydrous ethanol pool fires require no flashover ignition. Due to the thin oxygen content in a low-pressure environment, which prevents pool fires from burning completely, the critical steel pan size needed to initiate flashover is larger. It is crucial to raise the size of the steel pan in order to increase the area where the fire source and oxygen come into contact, and then to increase the size of the fire scale to cause the confined space fire to develop into a flashover.
The upper smoke layer temperature is one of the most significant features determining a flashover, according to experimental and theoretical investigations of the thermal balance and stability of fire. The temperature, density, and smoke concentration of the same height of thermal layer is assumed to be uniform. The average temperature can be found by referring to reference [22]:
T a v = H r H i H i H r 1 T d y
Formula (4) is created by discretizing the denominator in Formula (3):
H i H r 1 T d y = j = 1 L h j + 1 h j T j + 1 T j l n 1 + T j + 1 T j T j
where Hr and Hi are the thermocouple height of the top and bottom, respectively, as shown in Figure 7, and Tj is the mean temperature measured using the thermocouple at height hj.
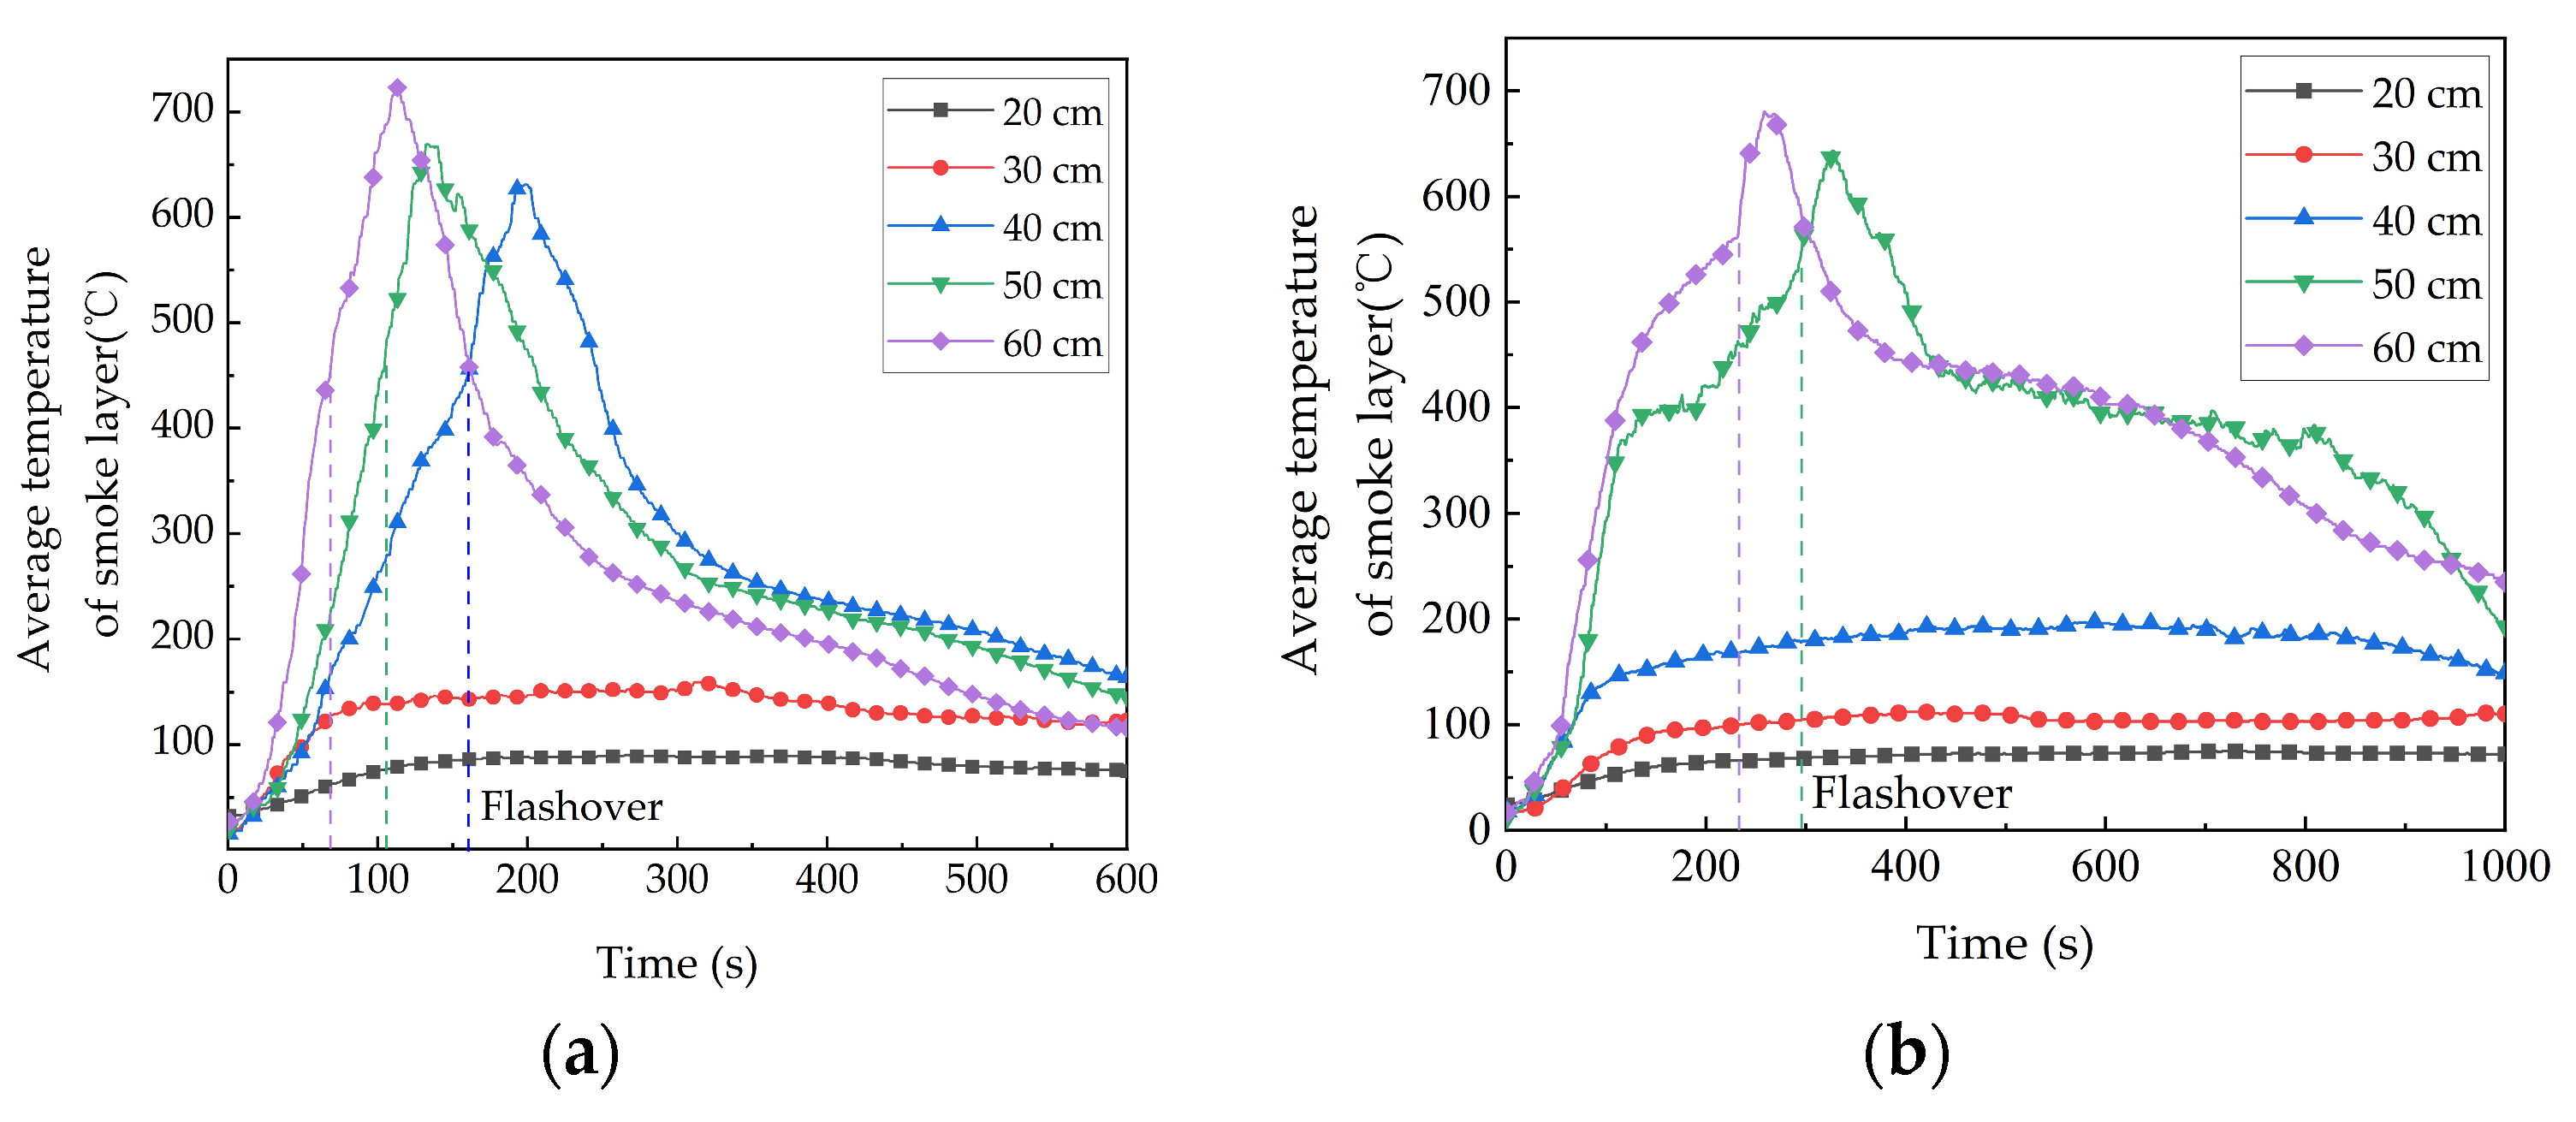
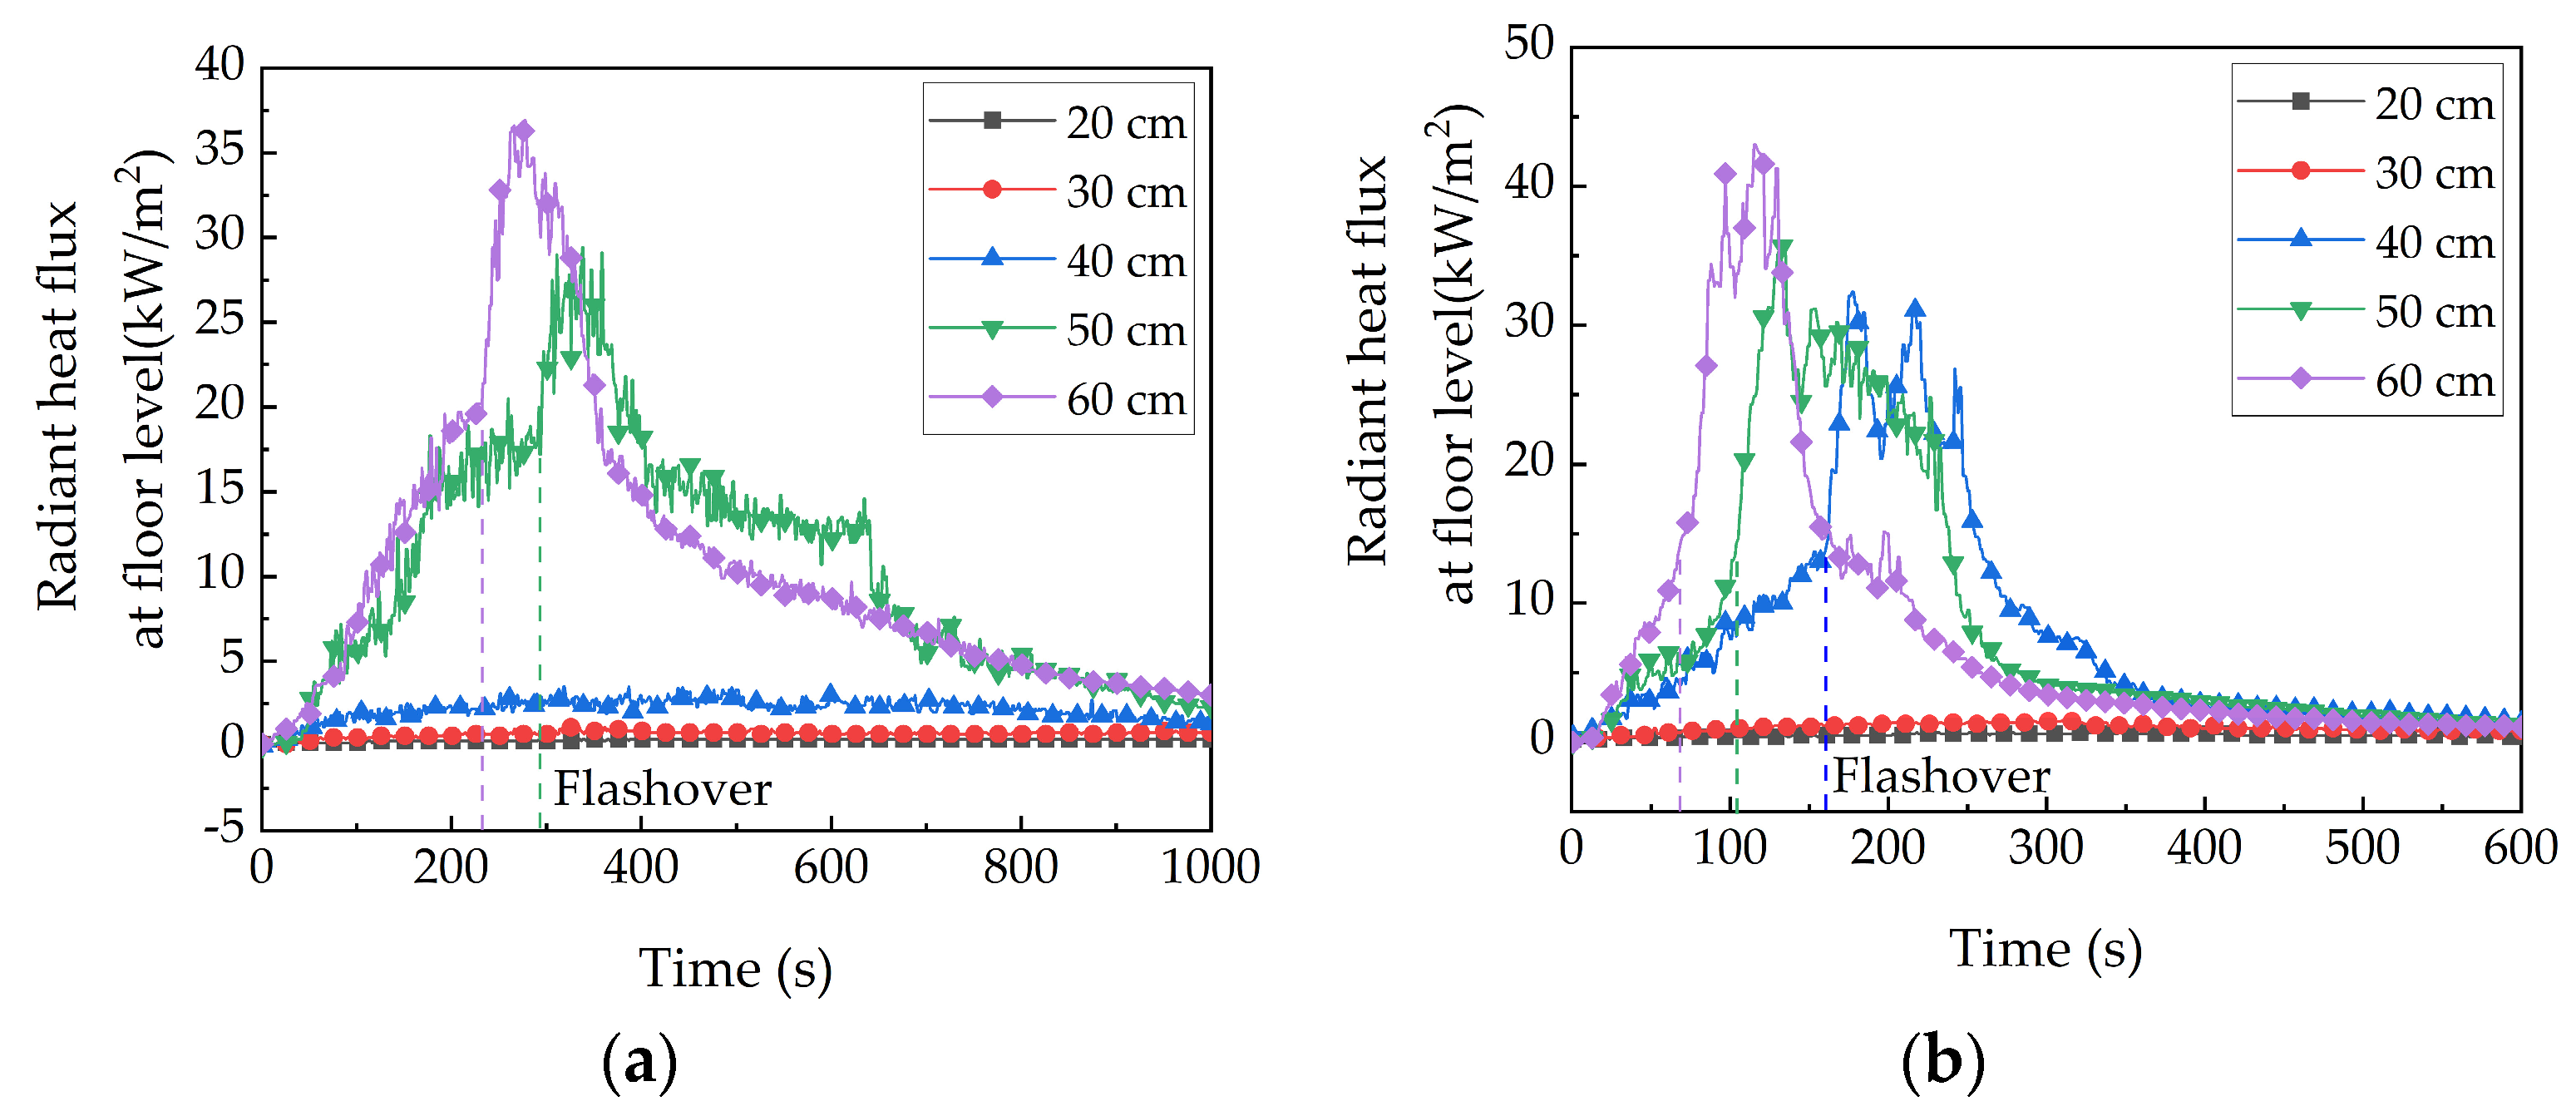
The average temperatures of the smoke layer in the upper zone of the cargo compartment varies for fire source sizes at 96 kPa and 60 kPa for an aviation kerosene pool fire are shown in Figure 8. The average temperature of the smoke layer in the confined space rose with the size of the steel pan at 96 kPa with the steel pan d of 40 cm, while it never rose above 200 °C. When d was increased to 40 cm, the flashover occurred 161 s after ignition. The average temperature of the smoke layer rose quickly, rising from 456 °C to a peak of 631 °C in just 37 s. After 68 s of ignition, the flashover occurred when d reached 60 cm, and during the 44 s that followed, the average temperature rose from 449 °C to 723 °C. The flashover occurred earlier and the peak of the average temperature of the smoke layer also rose as the size of the steel pan increased. The average temperature of the smoke layer in the confined space steadily rose at 60 kPa when the steel pan size was 50 cm, but it never rose above 200 °C. When d reached 50 cm, the flashover occurred 295 s after ignition. The flashover occurred after 232 s when d reached 60 cm. When the compartment pressure dropped, the flashover occurred later, and the peak average temperature of the smoke layer also dropped.
The variation in radiation heat flux at the floor level in an aviation kerosene pool fire of different sizes at 96 kPa and 60 kPa compartment pressure, respectively, is shown in Figure 9. At 96 kPa, when the steel pan size d was less than 40 cm, the radiation heat flux at the floor level in the confined space increased with the increase in steel pan size, but never exceeded 3.5 kW/m2. When d increased to 40 cm, the radiation heat flux at the floor level increased rapidly from 14.3 kW/m2 before the flashover to a peak of 32.4 kW/m2 within 16 s. When d reached 60 cm, the radiation heat flux at the floor level increased rapidly from 14.0 kW/m2 to a peak of 43.0 kW/m2 in 47 s. By continuing to increase the steel pan size, the moment of ignition was advanced and the peak of the radiation heat flux at the floor level was increased. At 60 kPa, when the steel pan size d was less than 50 cm, the radiation heat flux at the floor level in the confined space increased gradually with the increase in steel pan size, but never exceeded 5 kW/m2. When d increased to 50 cm, the flashover occurred in 295 s. When d reached 60 cm, the flashover occurred in 232 s. With the decrease in compartment pressure, the peak of the radiation heat flux at the floor level decreased.
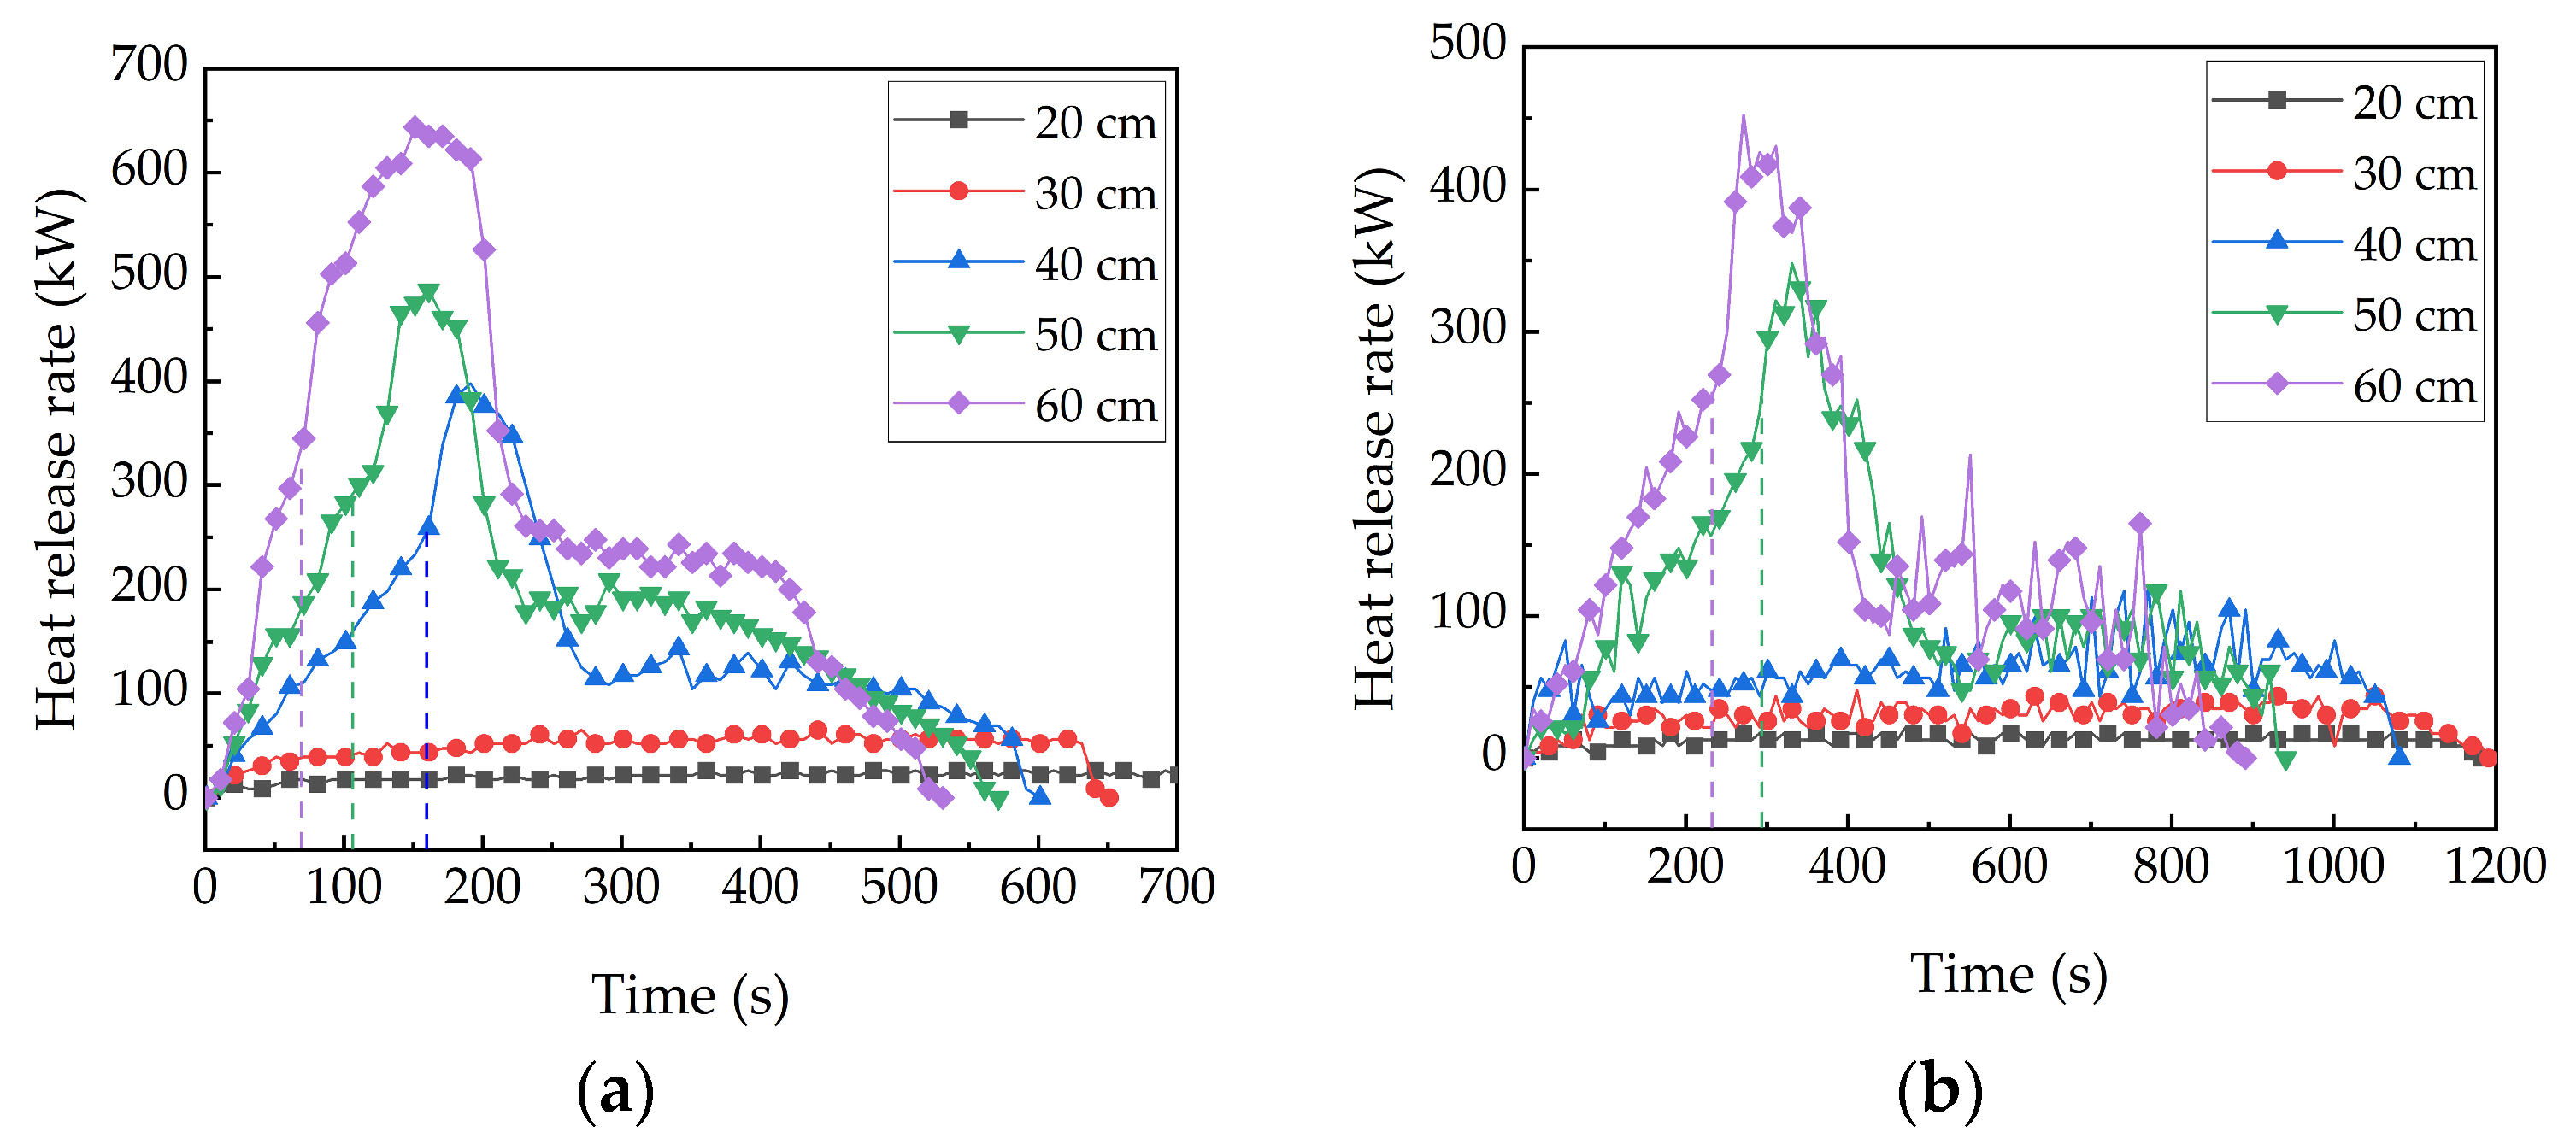
The heat release rates of aviation kerosene pool fires of various sizes at 96 kPa and 60 kPa are shown in Figure 10, respectively. The change trends of the average temperature of the smoke layer and the radiation heat flux at the floor level are essentially similar to these heat release rate figures. As the fire source size increased from 20 cm to 60 cm at 96 kPa, the peak heat release rate increased from 26.1 kW to 643.8 kW. At 60 kPa, the peak heat release rate increased from 17.4 kW to 387.15 kW. The sudden increase in the heat release rate was the result of a combination of the flame, smoke layer, thermal steel pan, and thermal radiation from the wall of the fuel.
The average temperature of the smoke layer, the radiation heat flux at floor level, and the rate at which the various sizes of fire source released heat during the combustion process of the n-heptane and anhydrous ethanol pool fires are also in accordance with the aforementioned trends and are not shown here. The average temperature of the smoke layer, the radiation heat flux at floor level, and the heat release rate of the fire source all rise as the fire source size increases, improving the likelihood and severity of a flashover.

3.3. Effect of Type of Fuel on Flashover

The thermal property factors he (evaporation heat) and hc (combustion heat), which are determined by the types of fuel, significantly affect how a fire develops in a confined space. The thermal property parameters of the various fuel types are shown in Table 3 with the minimum size needed to onset flashover at compartment pressure [23]. The relationship between the minimum size of fire source Dfmin needed for a flashover and the thermal property parameters of the fuel is shown by conducting a comparative research of the evaporation heat and combustion heat of the three types of liquid fuels in Formula (5):
D f   m i n h v a p h c
That is, the minimum size of fire source required for a flashover is directly proportional to the evaporation heat of the fuel and inversely proportional to the combustion heat.
While studying the impact of fuel type on flashover under atmospheric pressure and low pressure, 60 cm was chosen as the minimum fire size due to the requirement of 60 cm for anhydrous ethanol pool fire flashover at atmospheric pressure.
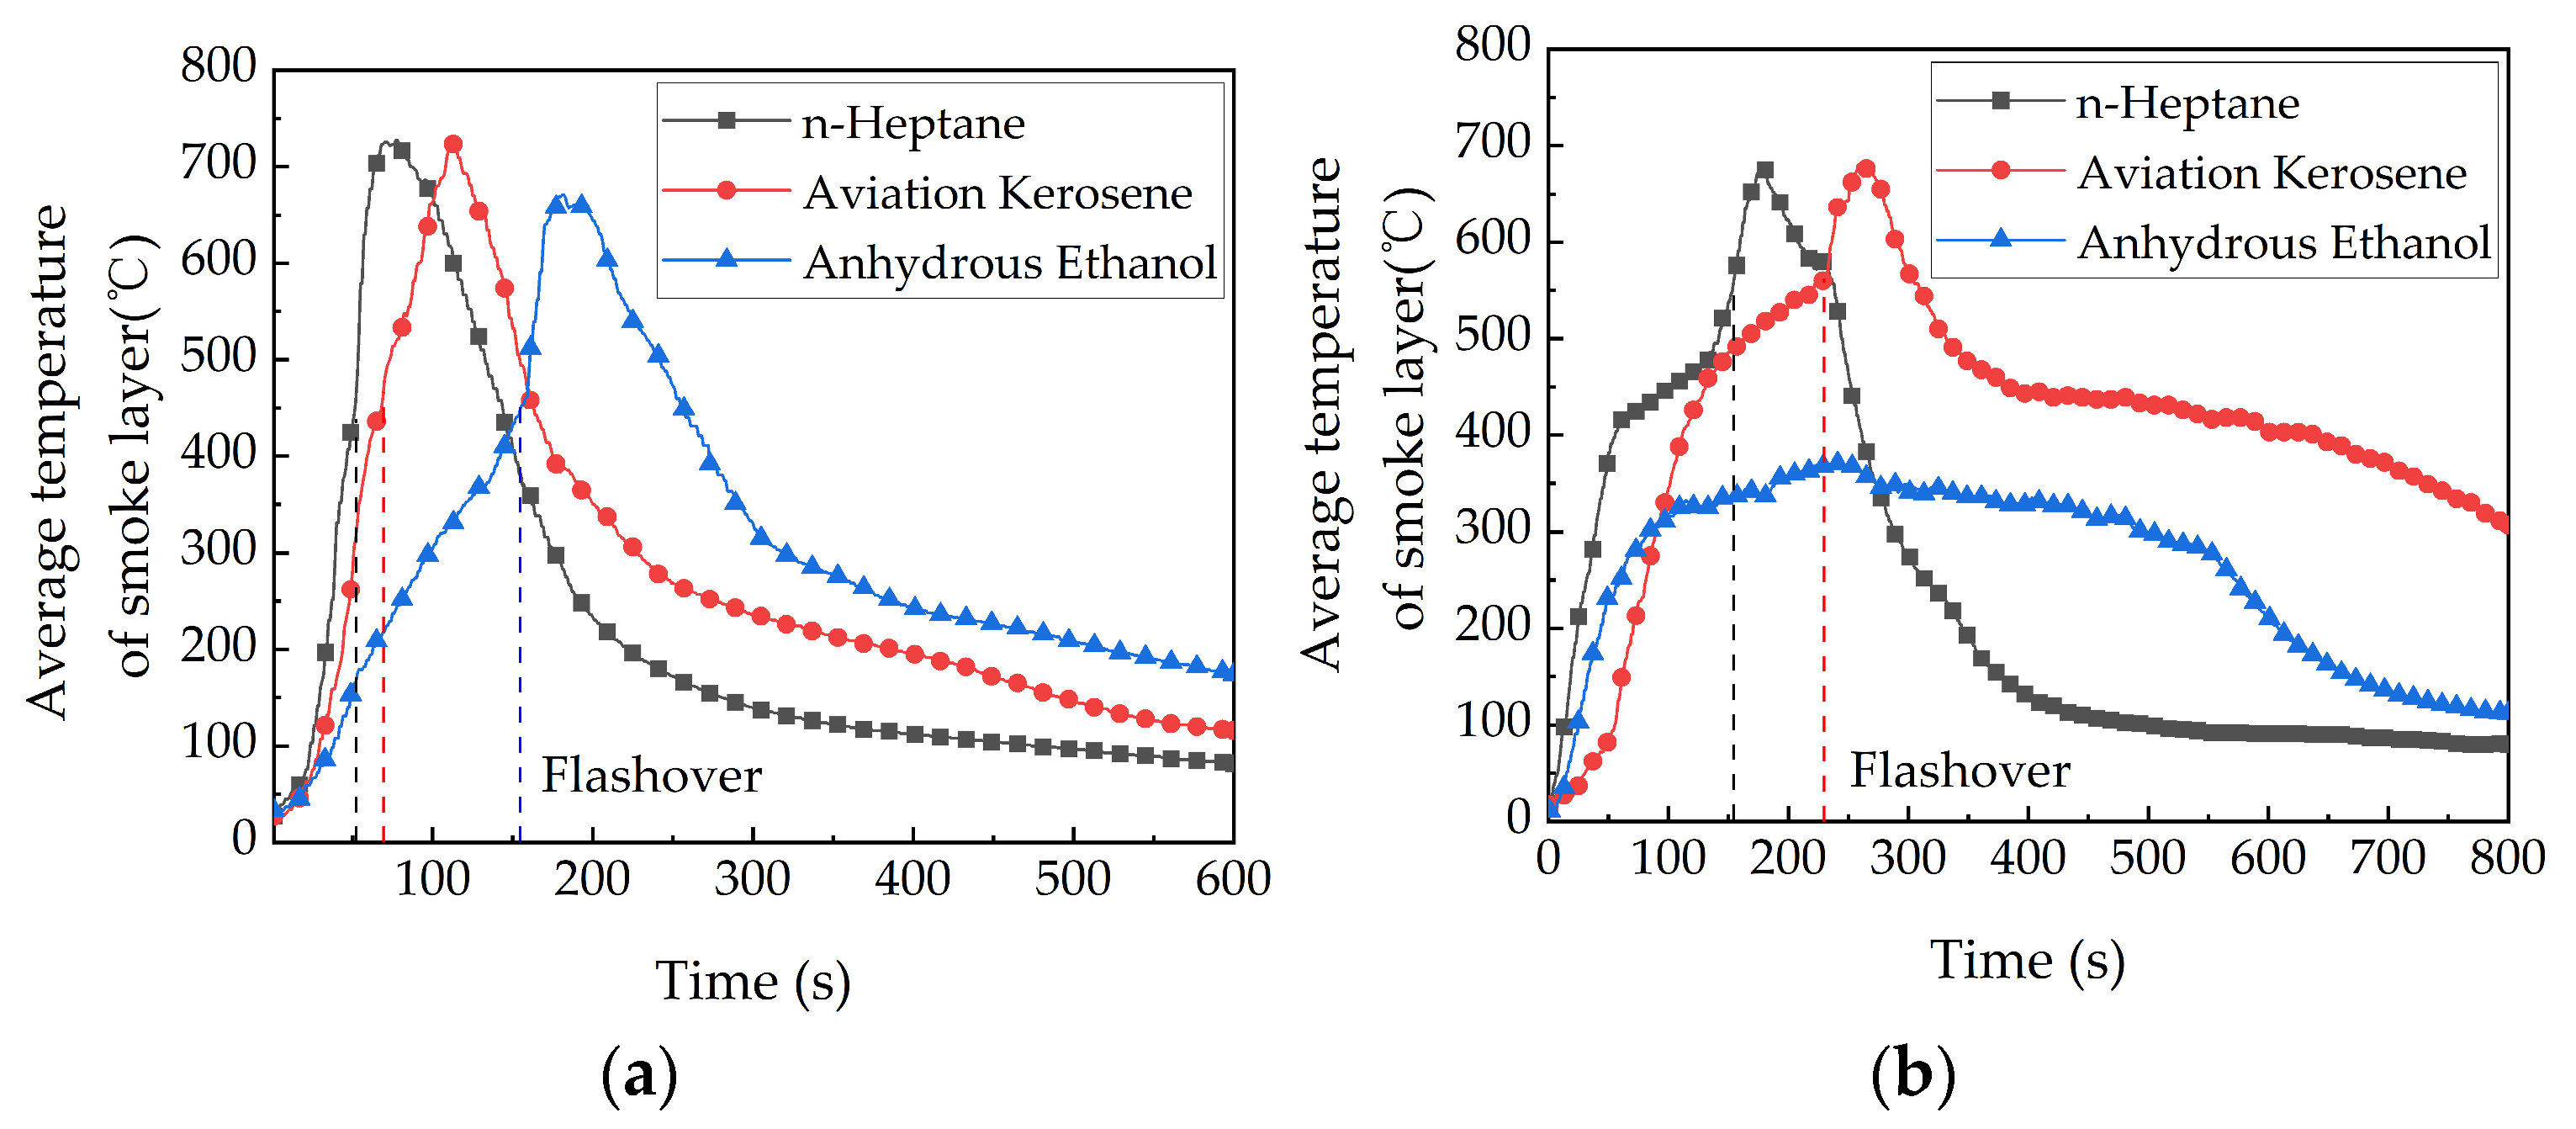
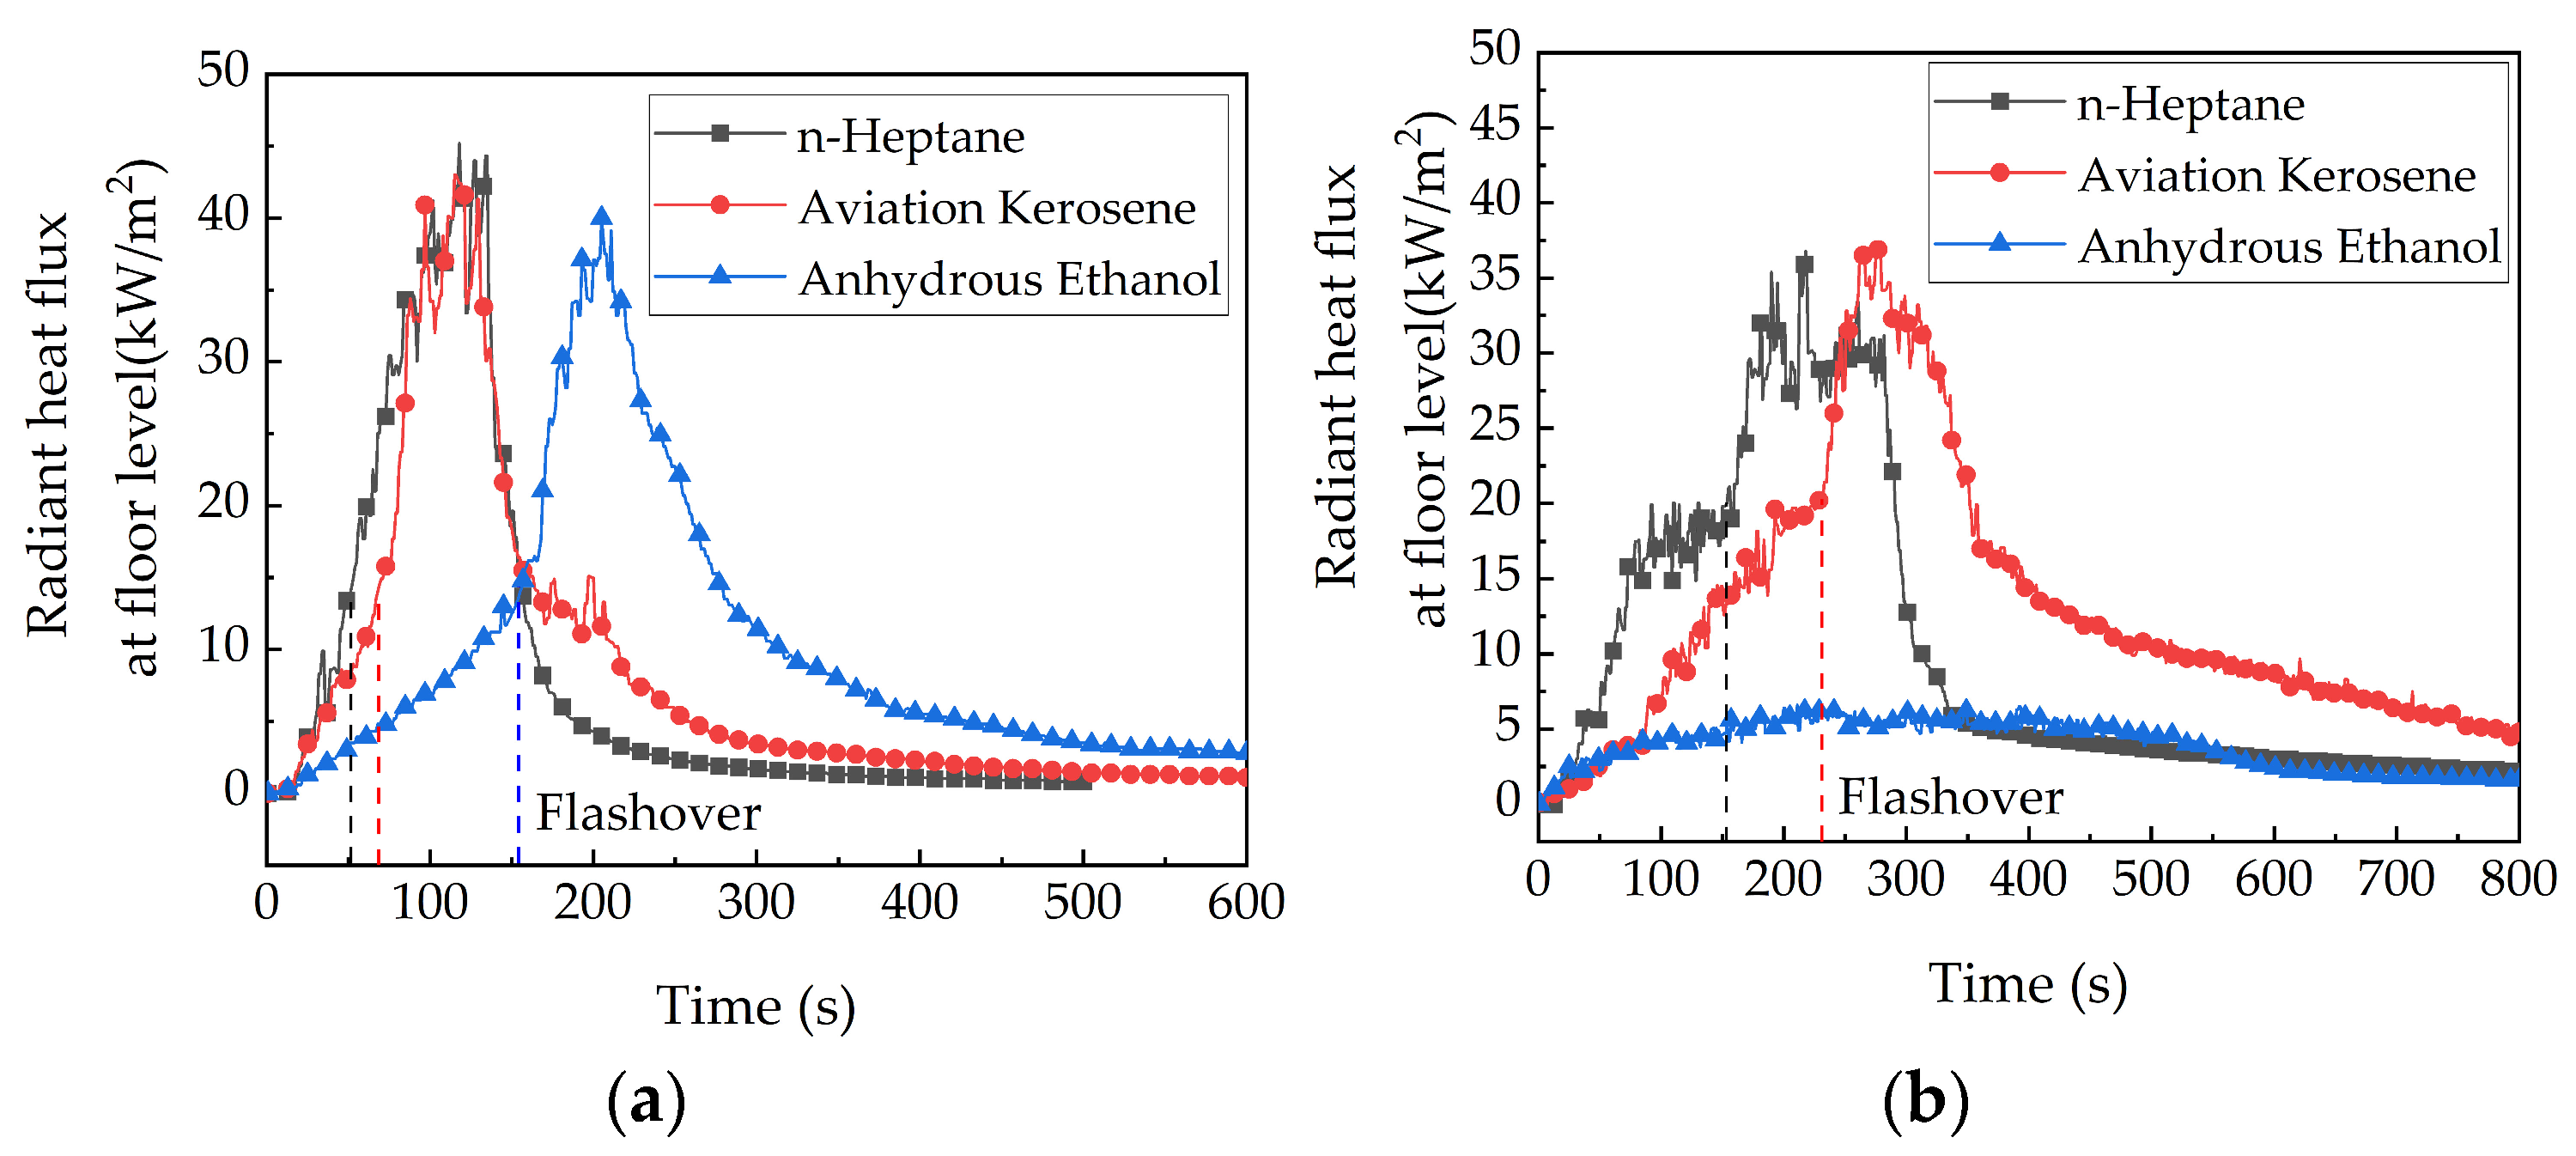
The average temperatures of the smoke layer for the three liquid fuels with the d of 60 cm at 96 kPa and 60 kPa are shown in Figure 11. It shows that the n-heptane pool fire was the first to start a flashover at 52 s with an identical steel pan size. The radiation heat flux at the floor level was 14.3 kW/m2, with a peak of 45.2 kW/m2, and the average temperature of the smoke layer was 457 °C, with a peak average temperature of 727 °C. The second aviation kerosene pool fire started a flashover at 68 s. The floor received a radiation heat flux of 14.0 kW/m2 on average from the smoke layer, with a peak flux of 43.0 kW/m2 and an average temperature of 723 °C for the smoke layer. At 156 s, the anhydrous ethanol pool fire was the longest to start a flashover. At this time, the average temperature of the smoke layer was 454 °C, its highest average temperature was 671 °C, and the radiation heat flux at the floor level was 14.2 kW/m2 with a peak of 40.0 kW/m2.
The radiation heat flux at the floor level of different fuels with the d of 60 cm at 96 kPa and 60 kPa are shown in Figure 12. The n-heptane pool fire was the first to become a flashover at 60 kPa at 153 s. At this time, the average temperature of the smoke layer was 547 °C, which was 90 °C higher than the temperature at 96 kPa; the peak average temperature was 52 °C lower than that at 96 kPa and the peak was 36.8 kW/m2, which was 8.4 kW/m2 lower than that at 96 kPa; and the radiation heat flux at the floor level was 19.9 kW/m2, which was 5.6 kW/m2 higher than that at 96 kPa. The second was an aviation kerosene pool fire. The radiation heat flux at the floor level was 20.2 kW/m2, which was 6.2 kW/m2 more than at 96 kPa, and the highest reach was 36.9 kW/m2, which was 6.1 kW/m2 less than at 96 kPa. The average temperature of the smoke layer was 562 °C, which was 113 °C higher than at 96 kPa; the peak average temperature was 43 °C lower than at 96 kPa. The fire in the anhydrous ethanol pool fire at 60 kPa did not result in a flashover, and the greatest average temperature of the smoke layer was only 371 °C. Moreover, the highest radiation heat flux at the floor level was only 6.6 kW/m2.
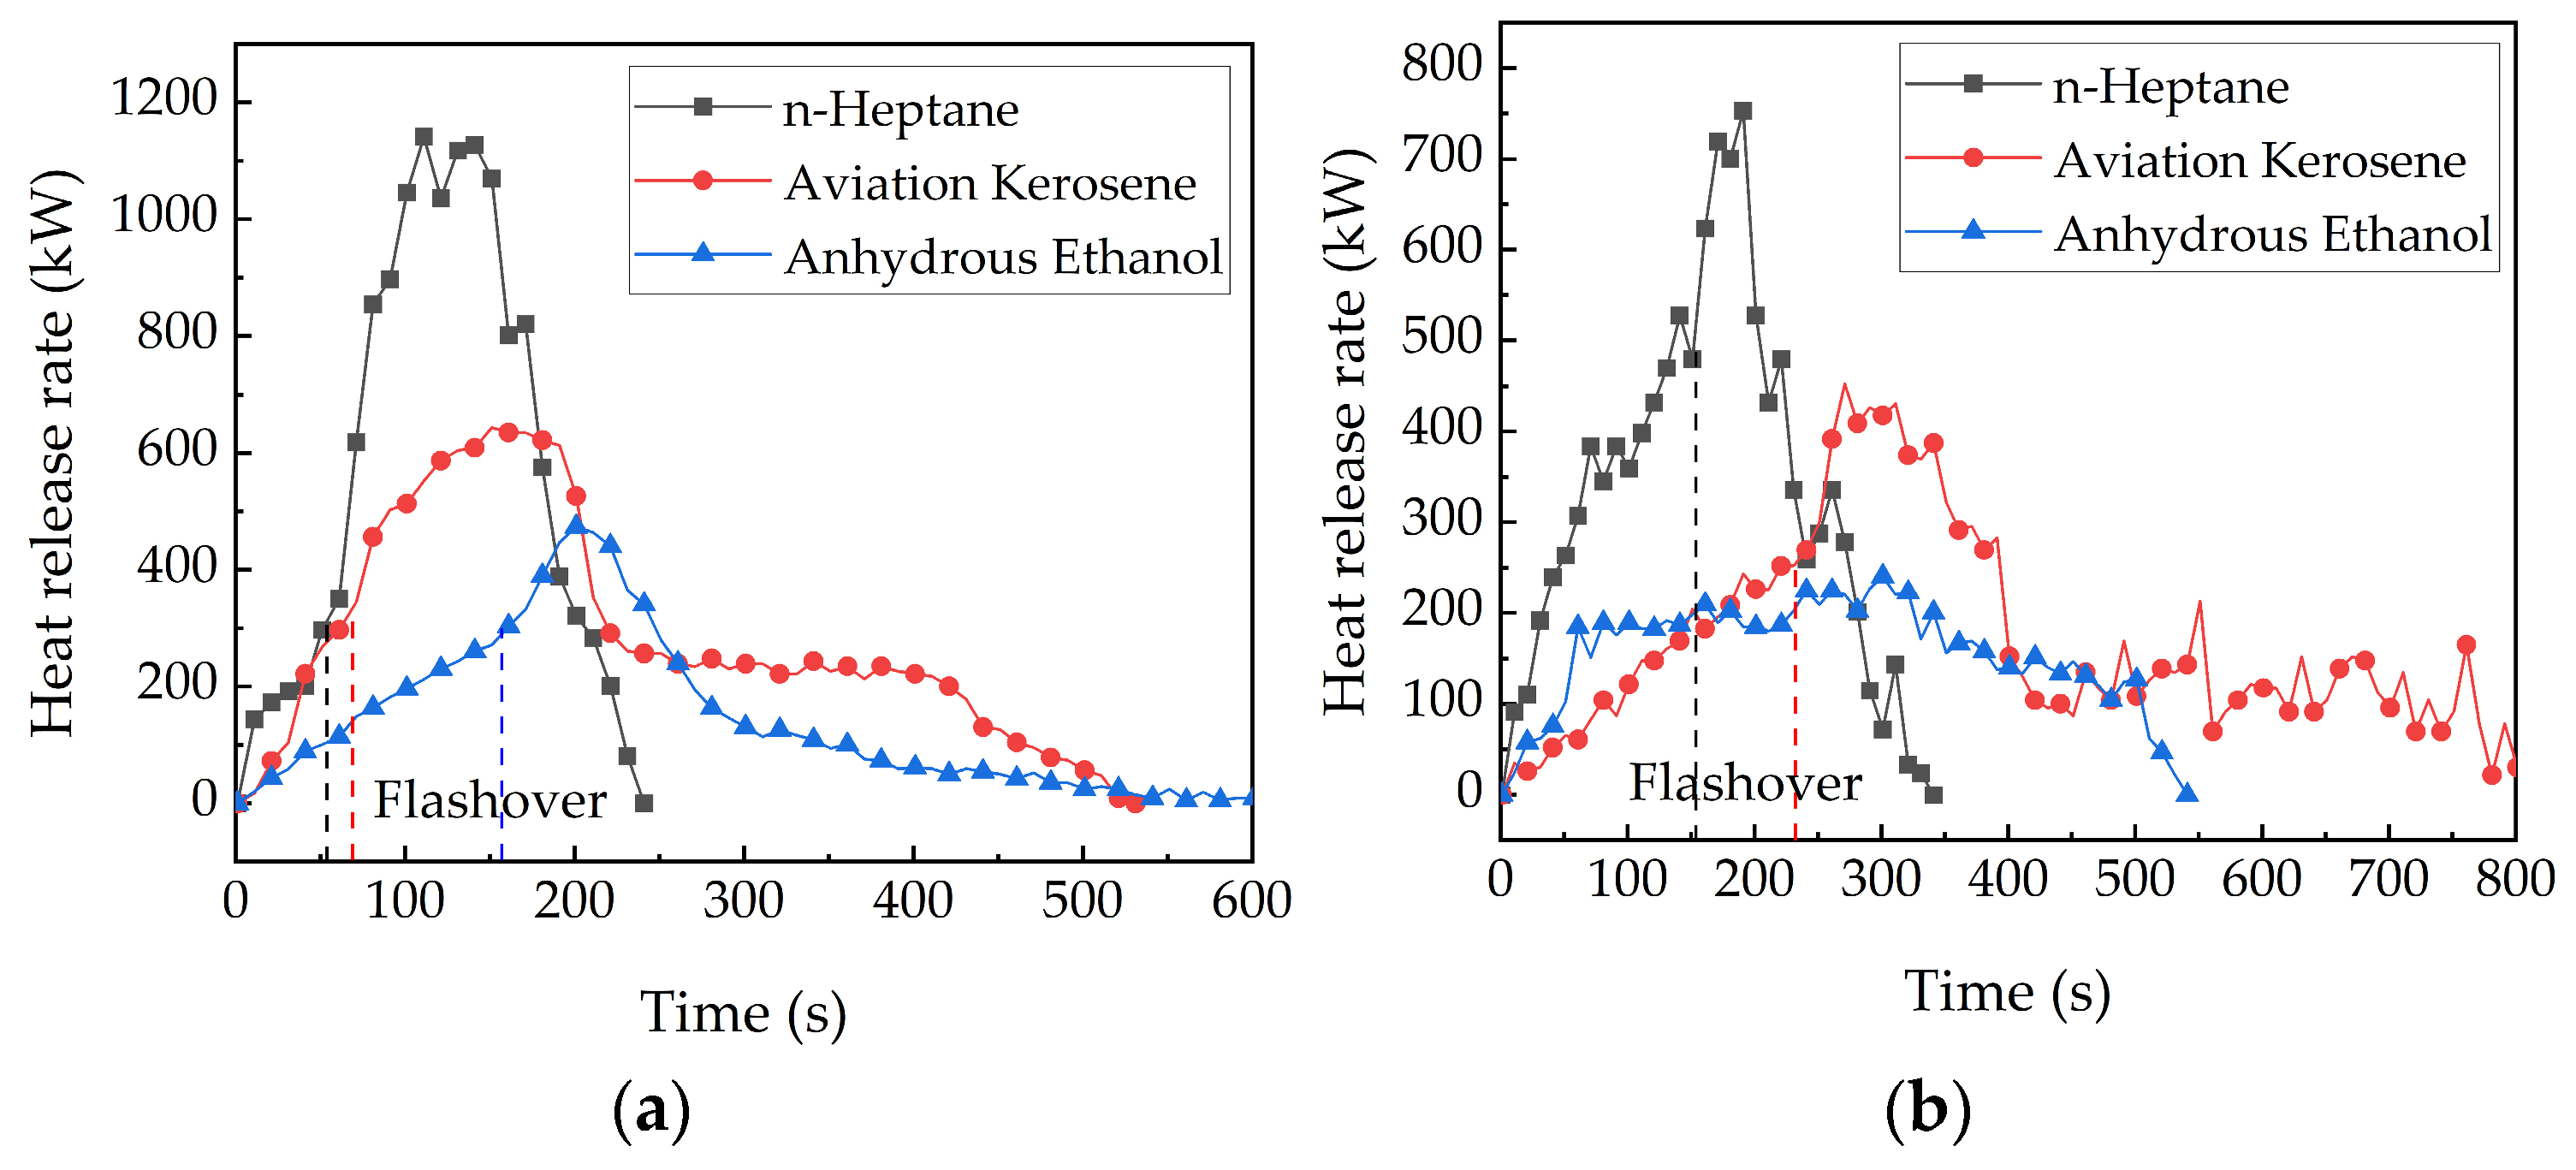
The heat release rates for the three liquid fuels during combustion for the two different air pressures are shown in Figure 13. The heat release rates were calculated using Equation (1) from Section 3.1. The trend was generally consistent with that of the average temperature of the smoke layer and the radiation heat flux at the floor level, but the heat release rate of the anhydrous ethanol and the total heat release were significantly lower than those of n-heptane and aviation kerosene.

4. Conclusions

In this study, we analyzed flashover features in two different pressure environments in a confined space: a special one-quarter volume FAA aircraft cargo compartment. The influence of different fire sizes and fuel types on flashover was studied by comparing the average temperature of the smoke layer, the radiation heat flux at the floor level, and the heat release rate of the fire source. The main conclusions are as follows:
  • The inherent flashover mechanism in a confined space is characterized by an increase in the temperature of the upper smoke layer as thermal smoke from combustion accumulates in the upper region of the space. At the same time, the radiation heat flux at the floor level also rises, causing the cardboard to pyrolyze. At 60 kPa and 96 kPa, the cardboard ignites in a flashover when the average temperature of the smoke layer reaches 551 °C and 450 °C, and the average radiant heat flux at the floor level reaches 19.6 kW/m2 and 14 kW/m2, respectively.
  • The average temperature of the smoke layer and the radiation heat flux at the floor level rise more slowly at 60 kPa than at 96 kPa, a result of a reduced burning rate, which consequently delays the onset of a flashover. As the size of the fire source grows, the average temperature of the smoke layer, the radiation heat flux at the floor level, the heat release rate of the fire source rise, and the likelihood and severity of a flashover increase.
  • Among the liquid fire sources of equal size, the n-heptane pool fire was the first to trigger a flashover, followed by the aviation kerosene pool fire, and the anhydrous ethanol pool fire was the least likely to do so. The n-heptane pool fire had greater average smoke layer temperatures, radiation heat flux at the floor level, and heat release rates than the aviation kerosene and anhydrous ethanol pool fires.
Due to the limited experimental conditions, a one-quarter volume FAA standard aircraft cargo compartment was used in this study, but the size of the confined space could be increased in future to, for example, conduct full-size flashover experiments. Three liquid fire sources were used in this study, and other types of liquid or solid fire sources and larger oil pan sizes could be considered in future.

Author Contributions

Conceptualization, Z.L.; Methodology, Z.L. and J.H.; Formal analysis, Z.L.; Resources, Y.H.; Data curation, J.W.; Writing—original draft, Z.L.; Writing—review & editing, J.H.; Funding acquisition, Y.H. All authors have read and agreed to the published version of the manuscript.

Funding

The authors are profoundly grateful to the financial support of the National Natural Science Foundation of China (Grant No. U2333210). This research belongs to the National Innovation and Entrepreneurship Training Program for College Students (Project No. 202310624001). This research also belongs to the Funding Program of Basic Research Operating Expenses of Central Universities (Project No. 24CAFUC10161) and was funded by the Autonomous Project of Sichuan Key Laboratory of Civil Aircraft Fire Science and Safety Engineering (No. MZ2022JB03).

Institutional Review Board Statement

Not applicable.

Informed Consent Statement

Not applicable.

Data Availability Statement

The data presented in this study may be made available on request.

Conflicts of Interest

The authors declare no conflicts of interest.

References

  1. Willey, A.E. NFPA 921 Guide for Fire and Explosion Investigations, 2004th ed.; National Fire Protection Association: Quincy, MA, USA, 2021. [Google Scholar]
  2. Li, C.; Yao, Y.N.; Tao, Z.X. Influence of depressurized environment on the fire behaviour in a dynamic pressure cabin. Appl. Therm. Eng. 2017, 125, 972–977. [Google Scholar] [CrossRef]
  3. Li, C.; Yang, R.; Yao, Y.N. Factors affecting the burning rate of pool fire in a depressurization aircraft cargo compartment. Appl. Therm. Eng. 2018, 135, 350–355. [Google Scholar] [CrossRef]
  4. Tao, Z.X.; Yang, R.; Li, C. An experimental study on fire behavior of an inclined ceiling jet in a low-pressure environment. Int. J. Therm. Sci. 2019, 138, 487–495. [Google Scholar] [CrossRef]
  5. Liu, Q.Y.; Sun, Z.Z.; Lv, Z.H. Experimental study of the burning characteristics of typical aircraft cabin materials at various pressures. J. Tsinghua Univ. (Sci. Technol.) 2019, 59, 432–437. [Google Scholar]
  6. Chow, W.K. Study on the flashover criteria for compartmental fires. J. Fire Sci. 1997, 15, 95–107. [Google Scholar] [CrossRef]
  7. Xing, W.D.; Wang, M.N.; Li, Q. Study on influence of combustion characteristics of initial ignition source on flashover in EMU carriage. J. Saf. Sci. Technol. 2018, 14, 36–42. [Google Scholar]
  8. Aravind, K.A.; Kumar, R.; Ansari, A.A. Room Corner Fire Growth Studies of Plywood Lining Material under Fully Ventilated Condition. J. Inst. Eng. 2021, 102, 545–551. [Google Scholar] [CrossRef]
  9. Wieser, D.; Jauch, P.; Willi, U. The influence of high altitude on fire detector test fires. Fire Saf. J. 1997, 29, 195–204. [Google Scholar] [CrossRef]
  10. Liu, Y. Research on the Influence of Highland Environment on Early Combustion Characteristics of Fire and Fire Detection. Master’s Thesis, University of Science and Technology of China, Hefei, China, 2006. [Google Scholar]
  11. Li, Z.H.; He, Y.P.; Zhang, H. Combustion characteristics of n-heptane and wood crib fires at different altitudes. Proc. Combust. Inst. 2009, 32, 2481–2488. [Google Scholar] [CrossRef]
  12. Cai, X. Experimental Study on the Effect of High Altitude and Low Pressure Conditions on the Performance of Fine Water Mist Fire Extinguishing. Ph.D. Thesis, University of Science and Technology of China, Hefei, China, 2009. [Google Scholar]
  13. Sarkos, C.; Hill, R. Evaluation of Aircraft Interior Panels under Full-Scale Cabin Fire Test Conditions, 23rd ed.; ASM: Washington, DC, USA, 1985; p. 393. [Google Scholar]
  14. Wang, Z.Z.; Jia, F.C.; Edwin, R. Computational fluid dynamics simulation of a post-crash aircraft fire test. J. Aircr. 2013, 50, 164–175. [Google Scholar] [CrossRef]
  15. Zhang, Q.S.; Song, G.T.; Qi, H.P. Simulation study on the effect of the aircraft cabin structure on the flashover. J. Saf. E 2016, 16, 126–128. [Google Scholar]
  16. Li, M.L.; Chen, Y.L.; Zhao, Y.D. Flashover in aircraft cargo compartment at different pressures: Experimental and modeling study. Fire 2023, 6, 415. [Google Scholar] [CrossRef]
  17. Reinhardt, J.W.; Federal Aviation Administration, Washington, D.C., USA. Minimum Performance Standard for Aircraft Cargo Compartment Halon Replacement Fire Suppression Systems. Personal communication, 2012. [Google Scholar]
  18. Lv, Z.H. Study on the Characteristics of Fine Water Mist Field and Fire Suppression Effectiveness in Cargo Hold of Civil Aircraft. Master’s Thesis, Civil Aviation Flight University of China, Guanghan, China, 2020. [Google Scholar]
  19. DeRis, J.L.; Wu, P.K.; Heskestad, G. Radiation fire modeling. Proc. Combust. Inst. 2000, 28, 2751–2759. [Google Scholar] [CrossRef]
  20. DeRis, J.L.; Kanury, A.M.; Yuen, M.C. Pressure modeling of fires. In Symposium (International) on Combustion; Elsevier: Amsterdam, The Netherlands, 1973; Volume 14, pp. 1033–1044. [Google Scholar]
  21. Yao, W.; Hu, X.K.; Rong, J.Z. Experimental study of large-scale fire behavior under low pressure at high altitude. J. Fire Sci. 2013, 31, 481–494. [Google Scholar] [CrossRef]
  22. He, Y. On experimental data reduction for zone model validation. J. Fire Sci. 1997, 15, 144–161. [Google Scholar] [CrossRef]
  23. Zhang, P.H.; Tang, X.; Tian, X.L. Experimental study on the interaction between fire and water mist in long and narrow spaces. Appl. Therm. Eng. 2016, 94, 706–714. [Google Scholar] [CrossRef]
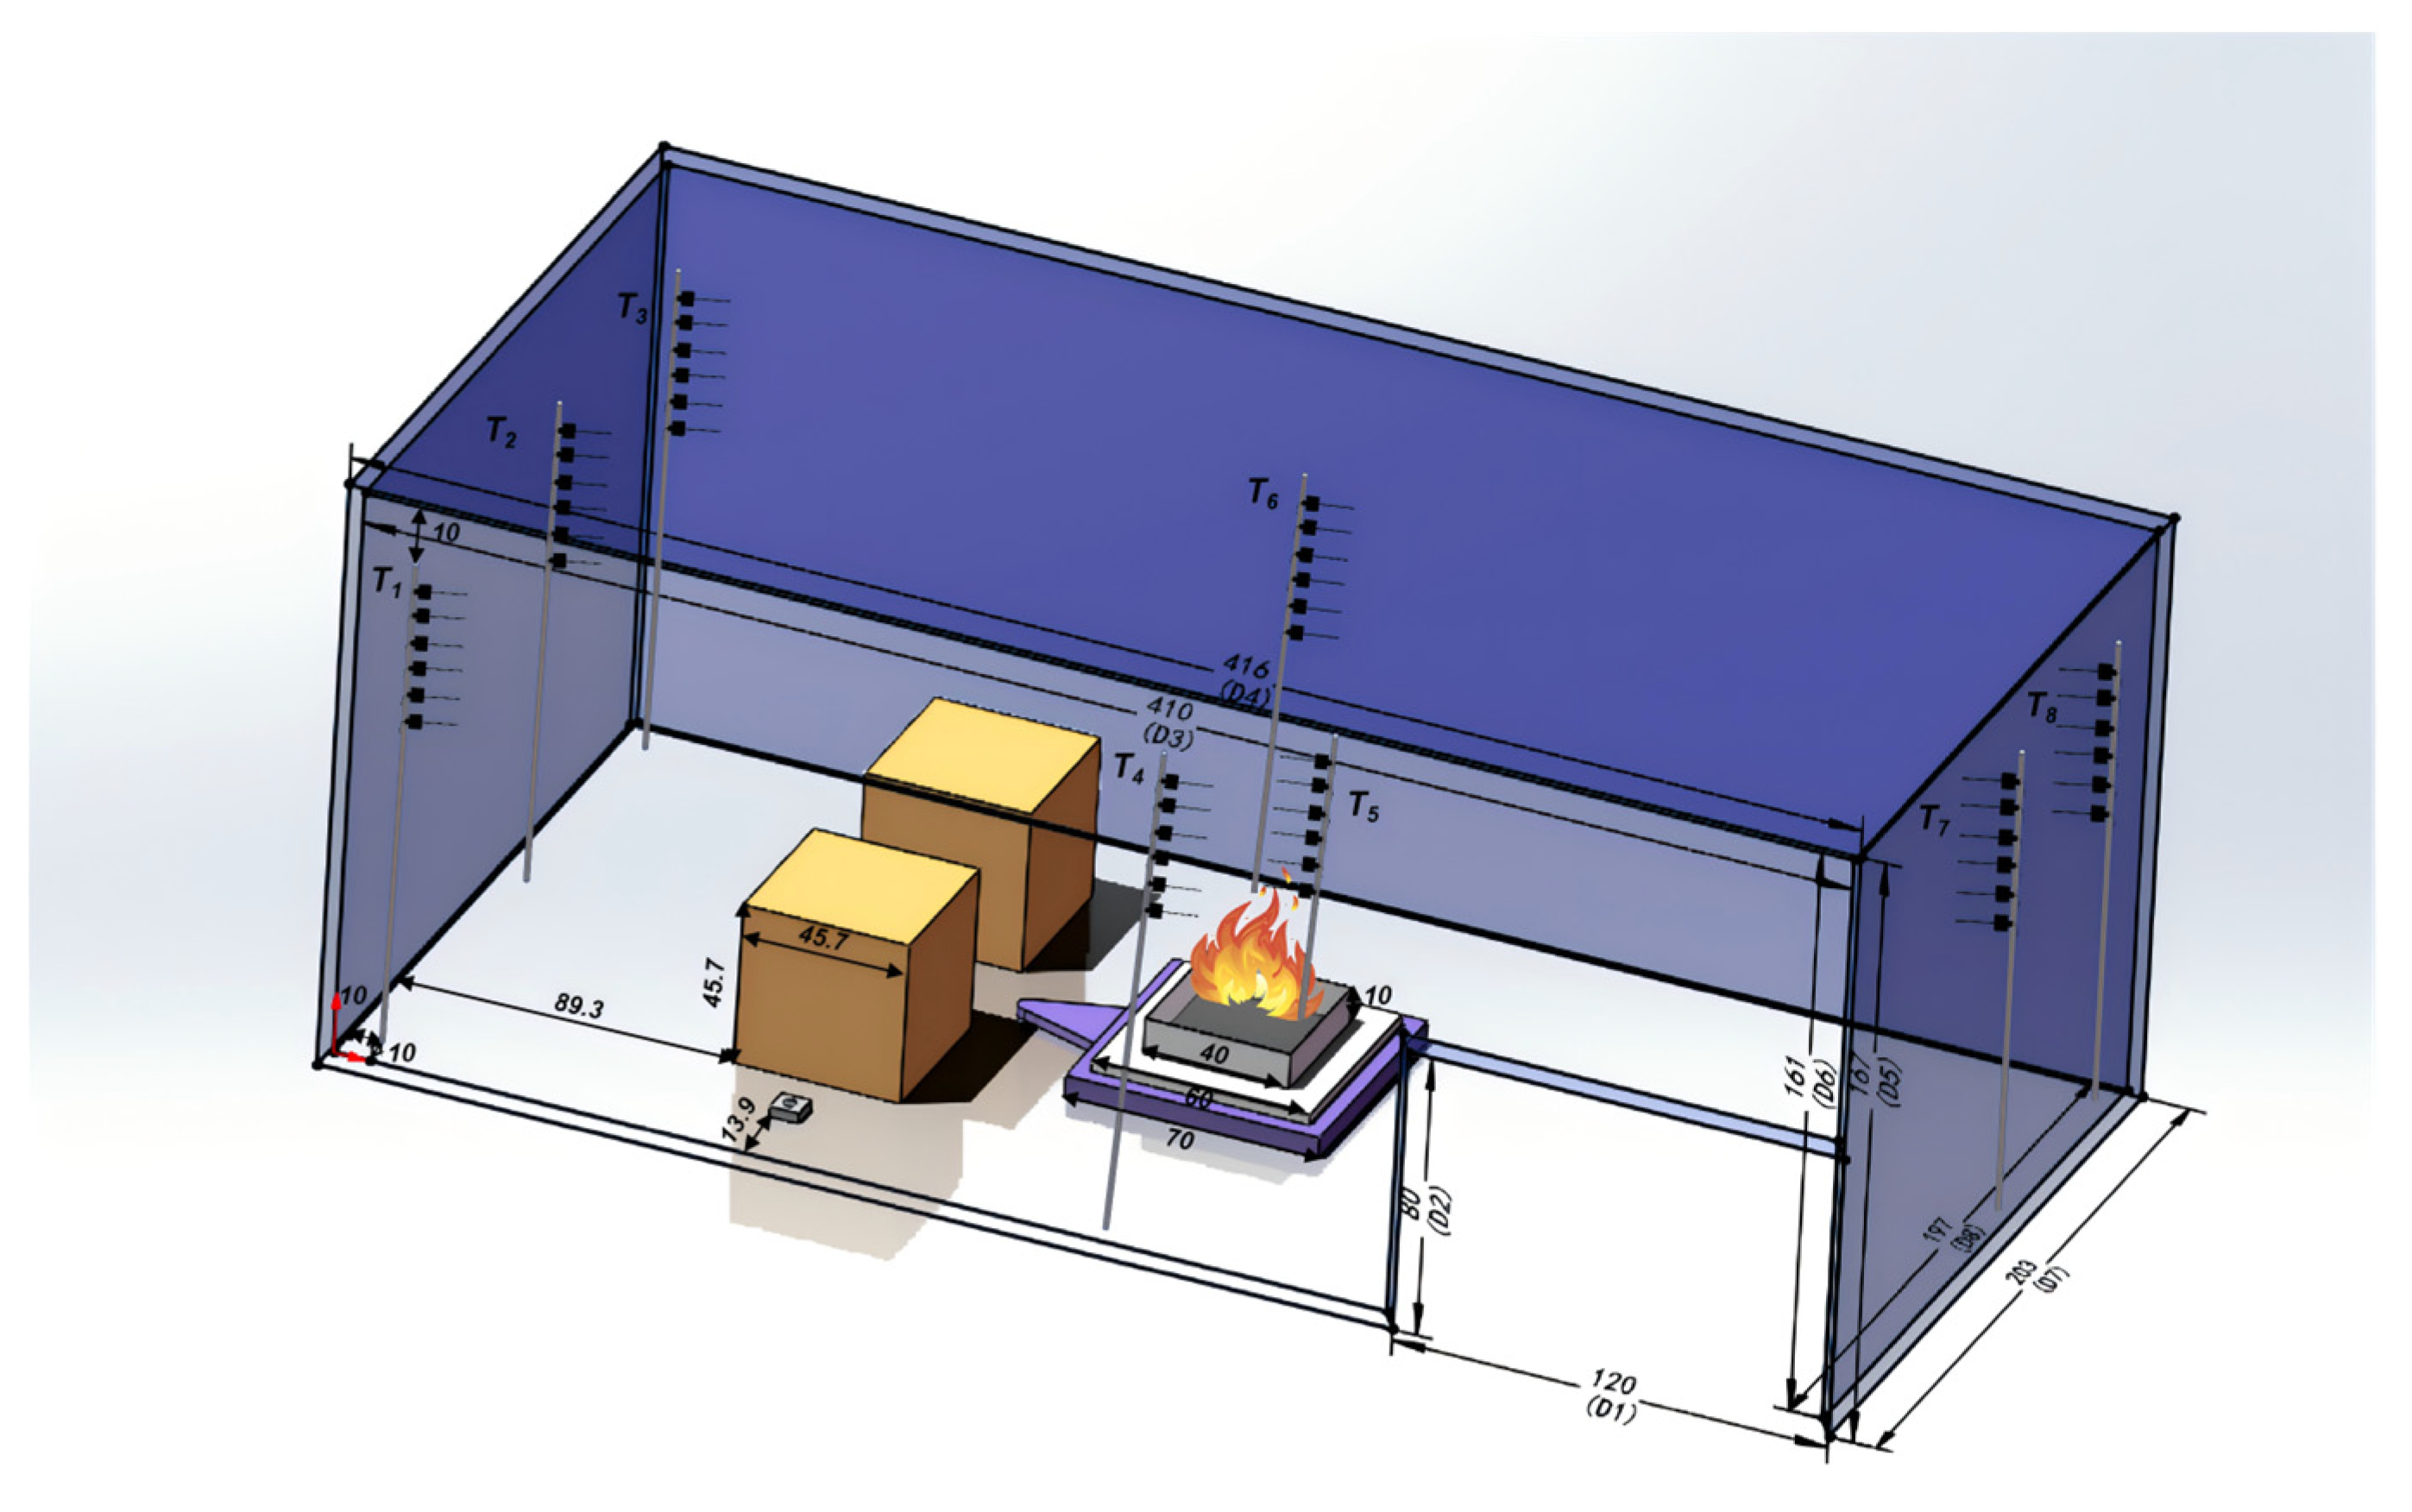
Figure 1. Platform layout for the flashover experiment and measurement.
Fire 07 00350 g001
Figure 2. Variation in average temperature of smoke layer and radiation heat flux at floor level in a typical flashover process (50 cm aviation kerosene).
Fire 07 00350 g002
Figure 3. Thermal screens of a typical flashover process (50 cm aviation kerosene).
Fire 07 00350 g003
Figure 4. Oxygen concentration at a temperature of 100 °C.
Fire 07 00350 g004
Figure 5. Mass loss rate and heat release rate of fuel in typical flashover process (50 cm aviation kerosene).
Fire 07 00350 g005
Figure 6. Mass loss rate per unit area from the pressure model and radiation model: (a) pressure model; (b) radiation model.
Fire 07 00350 g006
Figure 7. Details of average temperature of the smoke layer based on thermocoupling.
Fire 07 00350 g007
Figure 8. Average temperature of smoke layer of aviation kerosene with different sizes: (a) 96 kPa; (b) 60 kPa.
Fire 07 00350 g008
Figure 9. Radiation heat flux at floor level of aviation kerosene fires with different sizes: (a) 96 kPa; (b) 60 kPa.
Fire 07 00350 g009
Figure 10. Heat release rate of aviation kerosene fires with different sizes: (a) 96 kPa; (b) 60 kPa.
Fire 07 00350 g010
Figure 11. Average temperature of smoke layer with different fuels: (a) 60 cm, 96 kPa; (b) 60 cm, 60 kPa.
Fire 07 00350 g011
Figure 12. Radiation heat flux at floor level of different fuels: (a) 60 cm, 96 kPa; (b) 60 cm, 60 kPa.
Fire 07 00350 g012
Figure 13. Heat release rate of different fuels: (a) 60 cm, 96 kPa; (b) 60 cm, 60 kPa.
Fire 07 00350 g013
Table 1. Experimental conditions.
Experimental Condition NumberFuel TypeCompartment Pressure
(kPa)
Size of Fire Source (cm)
1–10n-heptane96/6020/30/40/50/60
11–20Aviation kerosene96/6020/30/40/50/60
21–30Anhydrous ethanol96/6020/30/40/50/60
Each set of tests was performed at least three times.
Table 2. Time for flashover for different sizes of fire sources.
Sizes of Fire Source
(cm)
Compartment Pressure (kPa)Time for Flashover (s)
No.n-HeptaneNo.Aviation KeroseneNo.Anhydrous Ethanol
20961None 111None21None
30962None12None22None
40963118, 127, 13213161, 154, 16623None
5096476, 86, 831497, 108, 10524None
6096555, 52, 501568, 66, 7425148, 162, 156
20606None16None26None
30607None17None27None
40608None18None28None
50609221, 232, 22719295, 281, 27729None
606010153, 171, 16520232, 213, 21430None
1 indicates that there is no flashover in the combustion phase.
Table 3. Thermophysical parameters of fuel and minimum size for flashover (96 kPa).
Fuel TypesEvaporation Heat (kJ/kg)Combustion Heat
(kJ/kg)
Minimum Size of Fire Source (cm)Time for Flashover (s)
n-heptane3184,797,04040127
Aviation kerosene3424,350,04040161
Anhydrous ethanol9262,970,06060156
Disclaimer/Publisher’s Note: The statements, opinions and data contained in all publications are solely those of the individual author(s) and contributor(s) and not of MDPI and/or the editor(s). MDPI and/or the editor(s) disclaim responsibility for any injury to people or property resulting from any ideas, methods, instructions or products referred to in the content.