Article

Species-Abundance Models for the Early Postfire Succession of Subalpine Shrub Grassland

1
Forest Ecology Division, Taiwan Forestry Research Institute, Taipei City 10066, Taiwan
2
Department of Forestry, National Chung Hsing University, Taichung City 40227, Taiwan
*
Author to whom correspondence should be addressed.
Submission received: 7 November 2023 / Revised: 19 December 2023 / Accepted: 4 January 2024 / Published: 5 January 2024
(This article belongs to the Special Issue Post-fire Effects on Environment)

Abstract

:
Fire is one of the principal factors influencing subalpine ecosystem succession. Species numbers and plant compositions are used to determine postfire disturbance, vegetation, structural change, and succession. Ecologists also integrate species diversity and mathematical models to enable researchers to obtain increasingly detailed insights into habitats during post-disturbance restoration processes. This study employed five species-abundance models, namely the niche preemption model, the broken-stick model, the log-normal model, the Zipf model, and the Zipf–Mandelbrot model, to perform fitting analysis on the abundance data of postfire species coverage in shrub grasslands near 369 Hut at Xue Mountain in Shei-Pa National Park, Taiwan. We performed the logarithmic transformation on plant-coverage areas for each period of postfire shrub-grassland succession, and then, based on histograms drawn for species–coverage distribution modes, the test results consistently showed normal distributions (p < 0.05). Species-coverage histograms measuring various periods showed that there were comparatively higher numbers of common species during postfire succession and that the numbers of rare species progressively increased. The fitting results of the five species-abundance models showed that although the most suitable abundance models for each period of postfire succession varied, the majority of these periods demonstrated decent fitting with respect to the Zipf–Mandelbrot model. These findings showed that fuel consumption provided nutrients in a manner that facilitated postfire regeneration. Moreover, dominant species, such as Yushania niitakayamensis, and Miscanthus transmorrisonensis, did not fully occupy growing spaces and resource availabilities; consequently, seeded species were able to grow.

1. Introduction

Fire is one of the major factors influencing subalpine ecosystem succession and is an extremely crucial ecological process for plant communities located in regions of high altitudes and latitudes [1,2,3]. The exact level of disturbance inflicted on the plant community is determined by the strength and frequency of the fire; severe fires damage habitats and deteriorate succession to initial patterns, whereas mild fires accelerate the return of aboveground nutrients to the soil, presenting various benefits for regeneration planting, pest control, and sources of wild animal feed [4,5,6,7,8].
The spectrum of life forms in the Xue Mountain subalpine ecosystem is reflected by differentiated composition, structure, and the physiognomy of vegetation [9]. The abies zone, at an elevation of 3000–3600 m, is primarily composed of two types of physiognomically distinct plant communities: Abies kawakamii (Taiwan fir) is the dominant forest community, and Yushania niitakayamensis (Yushan cane) and Miscanthus transmorrisonensis (alpine silver grass) comprises herbaceous shrubs communities distributed along the ridges or embedded among the Taiwan fir forests [5,10,11]. Pronounced ecotones are often formed between shrub grasslands and forests due to fire disturbances because the two plant communities engage in competitive dynamic transitions [6,12]. These high-altitude shrub grasslands in Taiwan constitute subclimax plant communities formed to adapt to fire disturbances [5,6].
Long-term observations and regional sample surveillance in periods of varying structural composition can provide information on the influence of disturbances on vegetation and allow researchers to determine the differences between various florae [13]. Species numbers and plant composition are used to determine post-disturbance vegetation structural change. Ecologists also integrate species diversity and mathematical models to provide researchers with increasingly direct insight into habitats during post-disturbance restoration processes [14,15]. Progress in the development of analytic technologies has enabled the integration of the species-abundance model and the calculation of the species diversity indices of florae; this provides researchers with in-depth information on florae within the study regions [13,16,17,18,19]. These models can be generally divided into five major types, namely purely statistical, branching process, population dynamic, niche partitioning, and spatial distribution models [15]. These models include the niche preemption model and the broken-stick model [20,21].
These models are based on varying basic assumptions and differ in data simulation properties [18,22]. For example, the ratio of dominant species influences the overall prediction of the niche preemption model [23]. Purely statistical log-normal distribution allows improved simulation for common species [17] and is commonly suited for the vegetation of steadily developed and evenly distributed species [24]. Therefore, fitting models must achieve a balance between validity and reasonableness in order to provide complete interpretations of the structural properties of the data.
In this study, we investigated the regeneration of vegetation cover, the compositional variation of the dominant species, and the subsequent restoration of postfire grasslands during each period. The niche preemption model, broken-stick model, log-normal model, Zipf model, and Zipf–Mandelbrot model were used to simulate the species-coverage relationship for each period in the study area. From this, we determined the structural properties of the abundance of the plant florae in different periods. In addition, all preferences in this study area associated with the five species-abundance models were investigated. We assumed the log-normal model to be an exceptional fit during the postfire initial succession process in shrub grassland because the study area contained vegetation from postfire restoration, freeing space and resource availabilities.

2. Materials and Methods
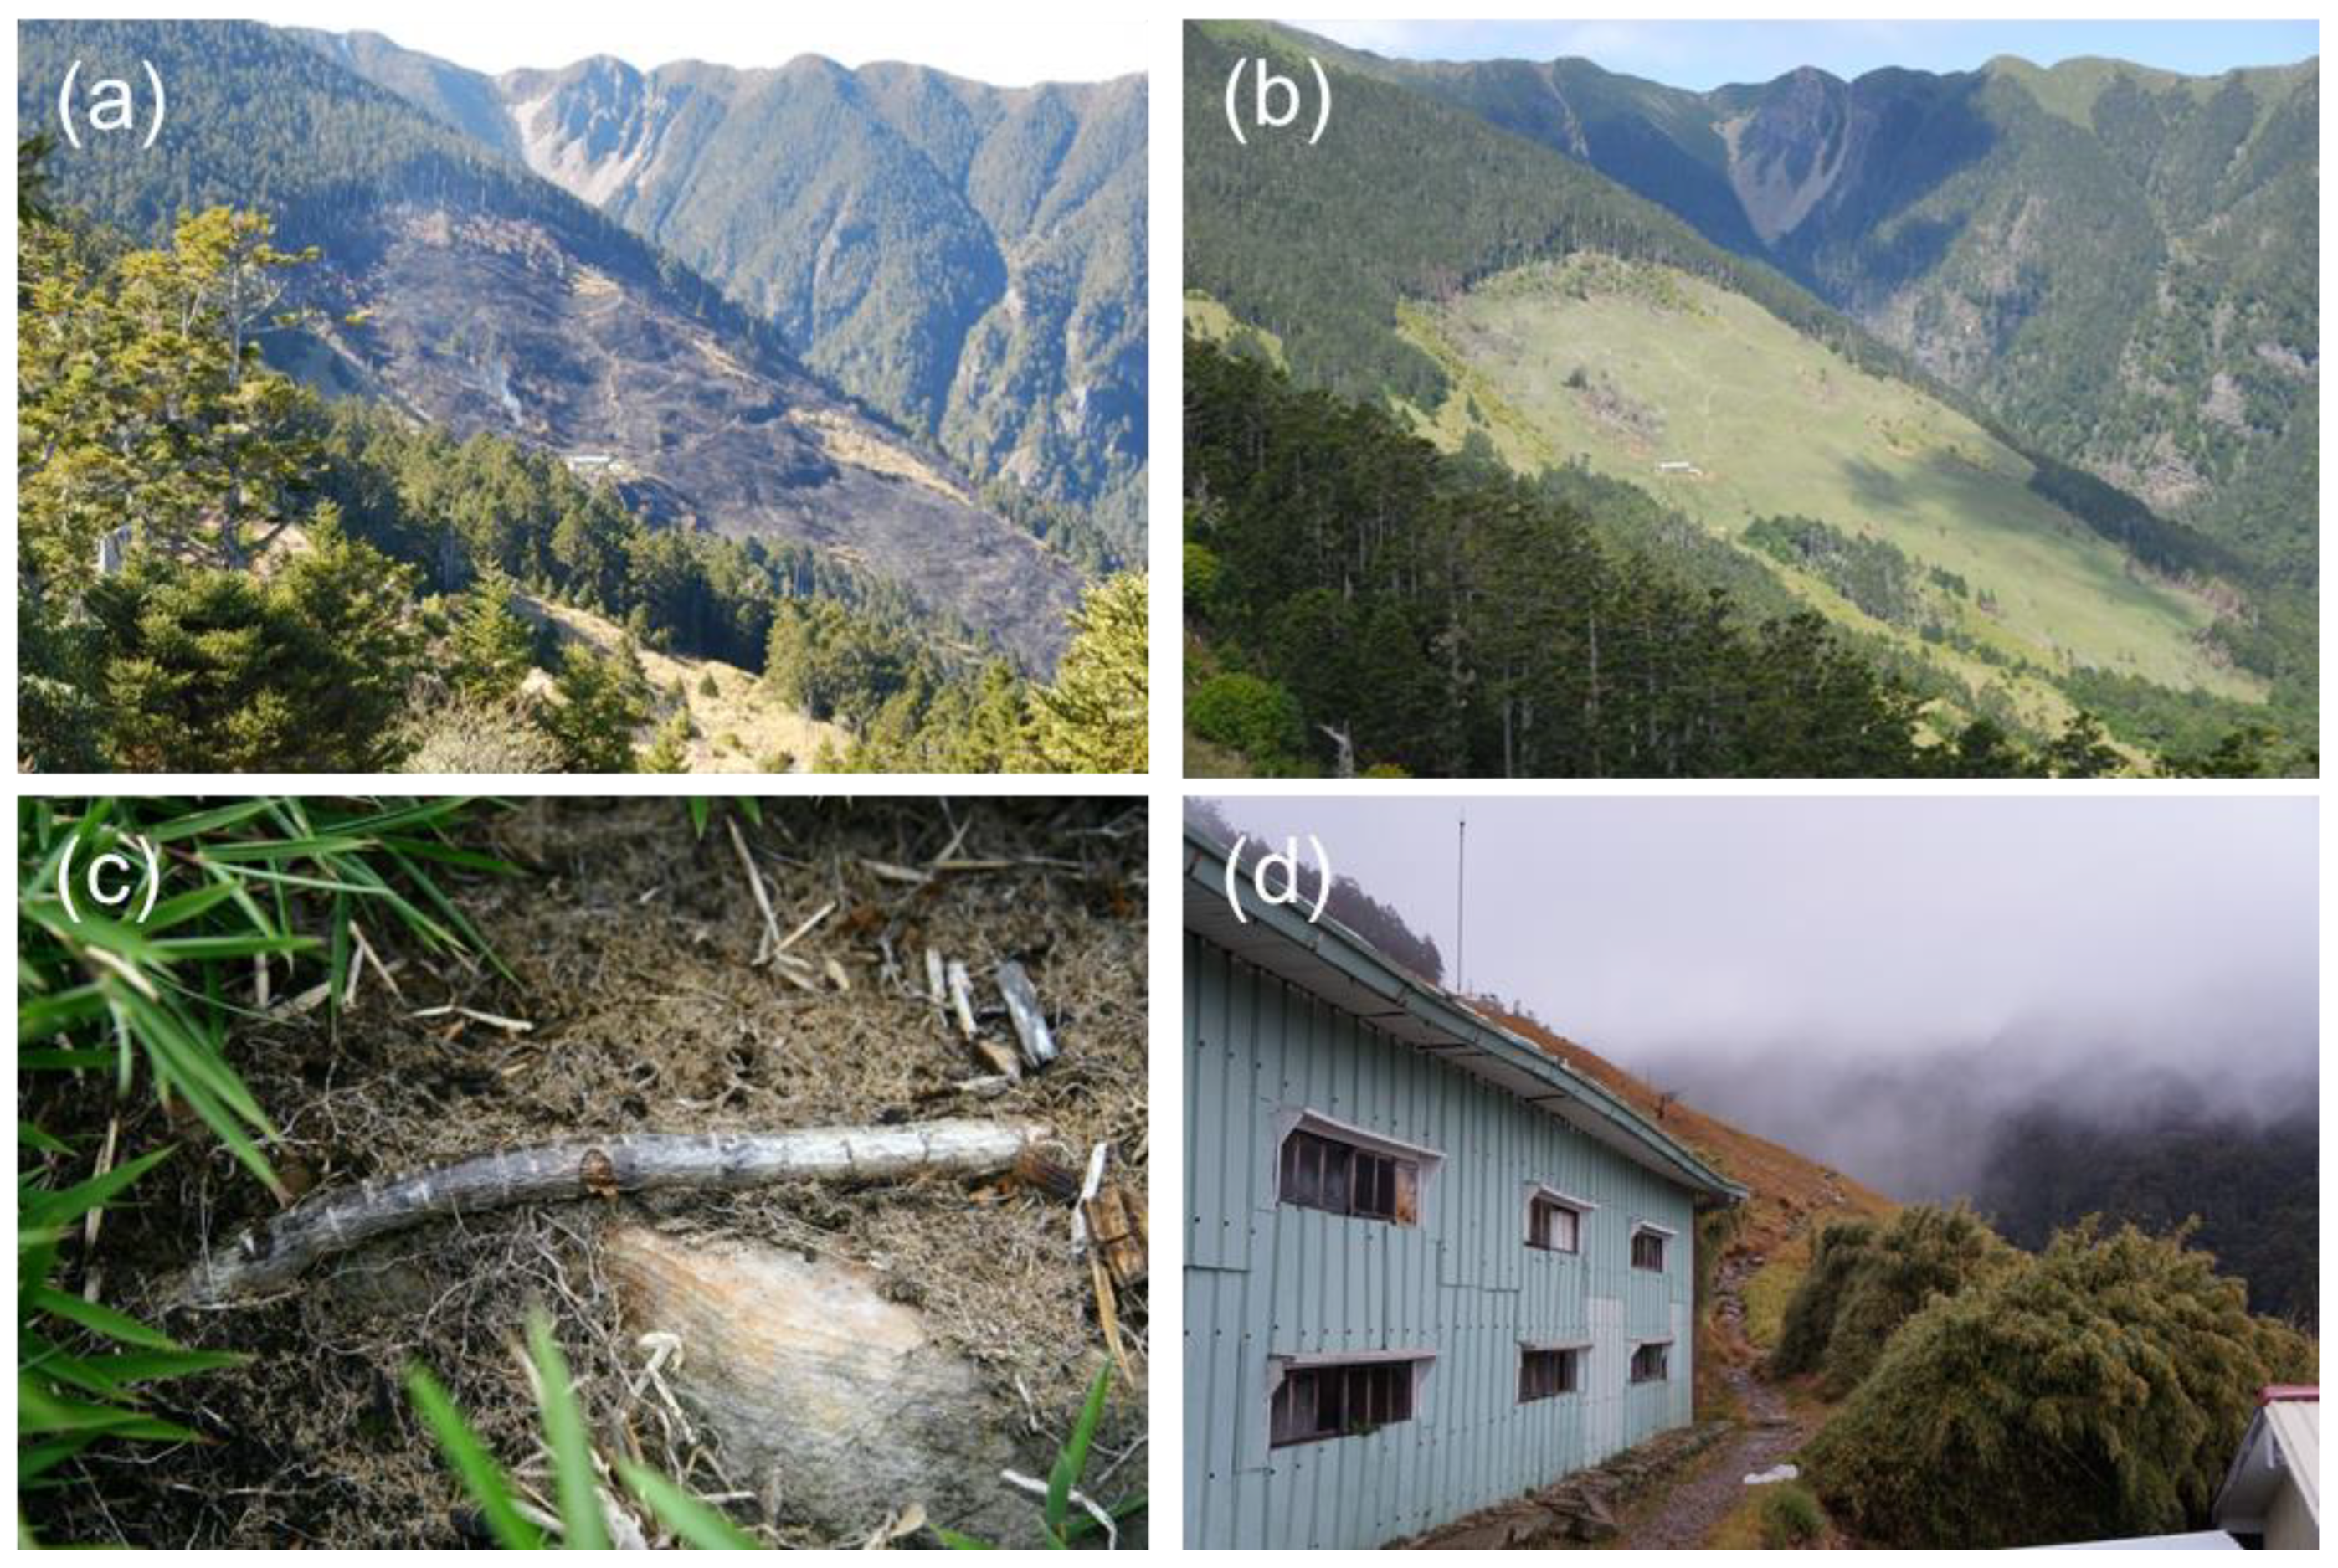
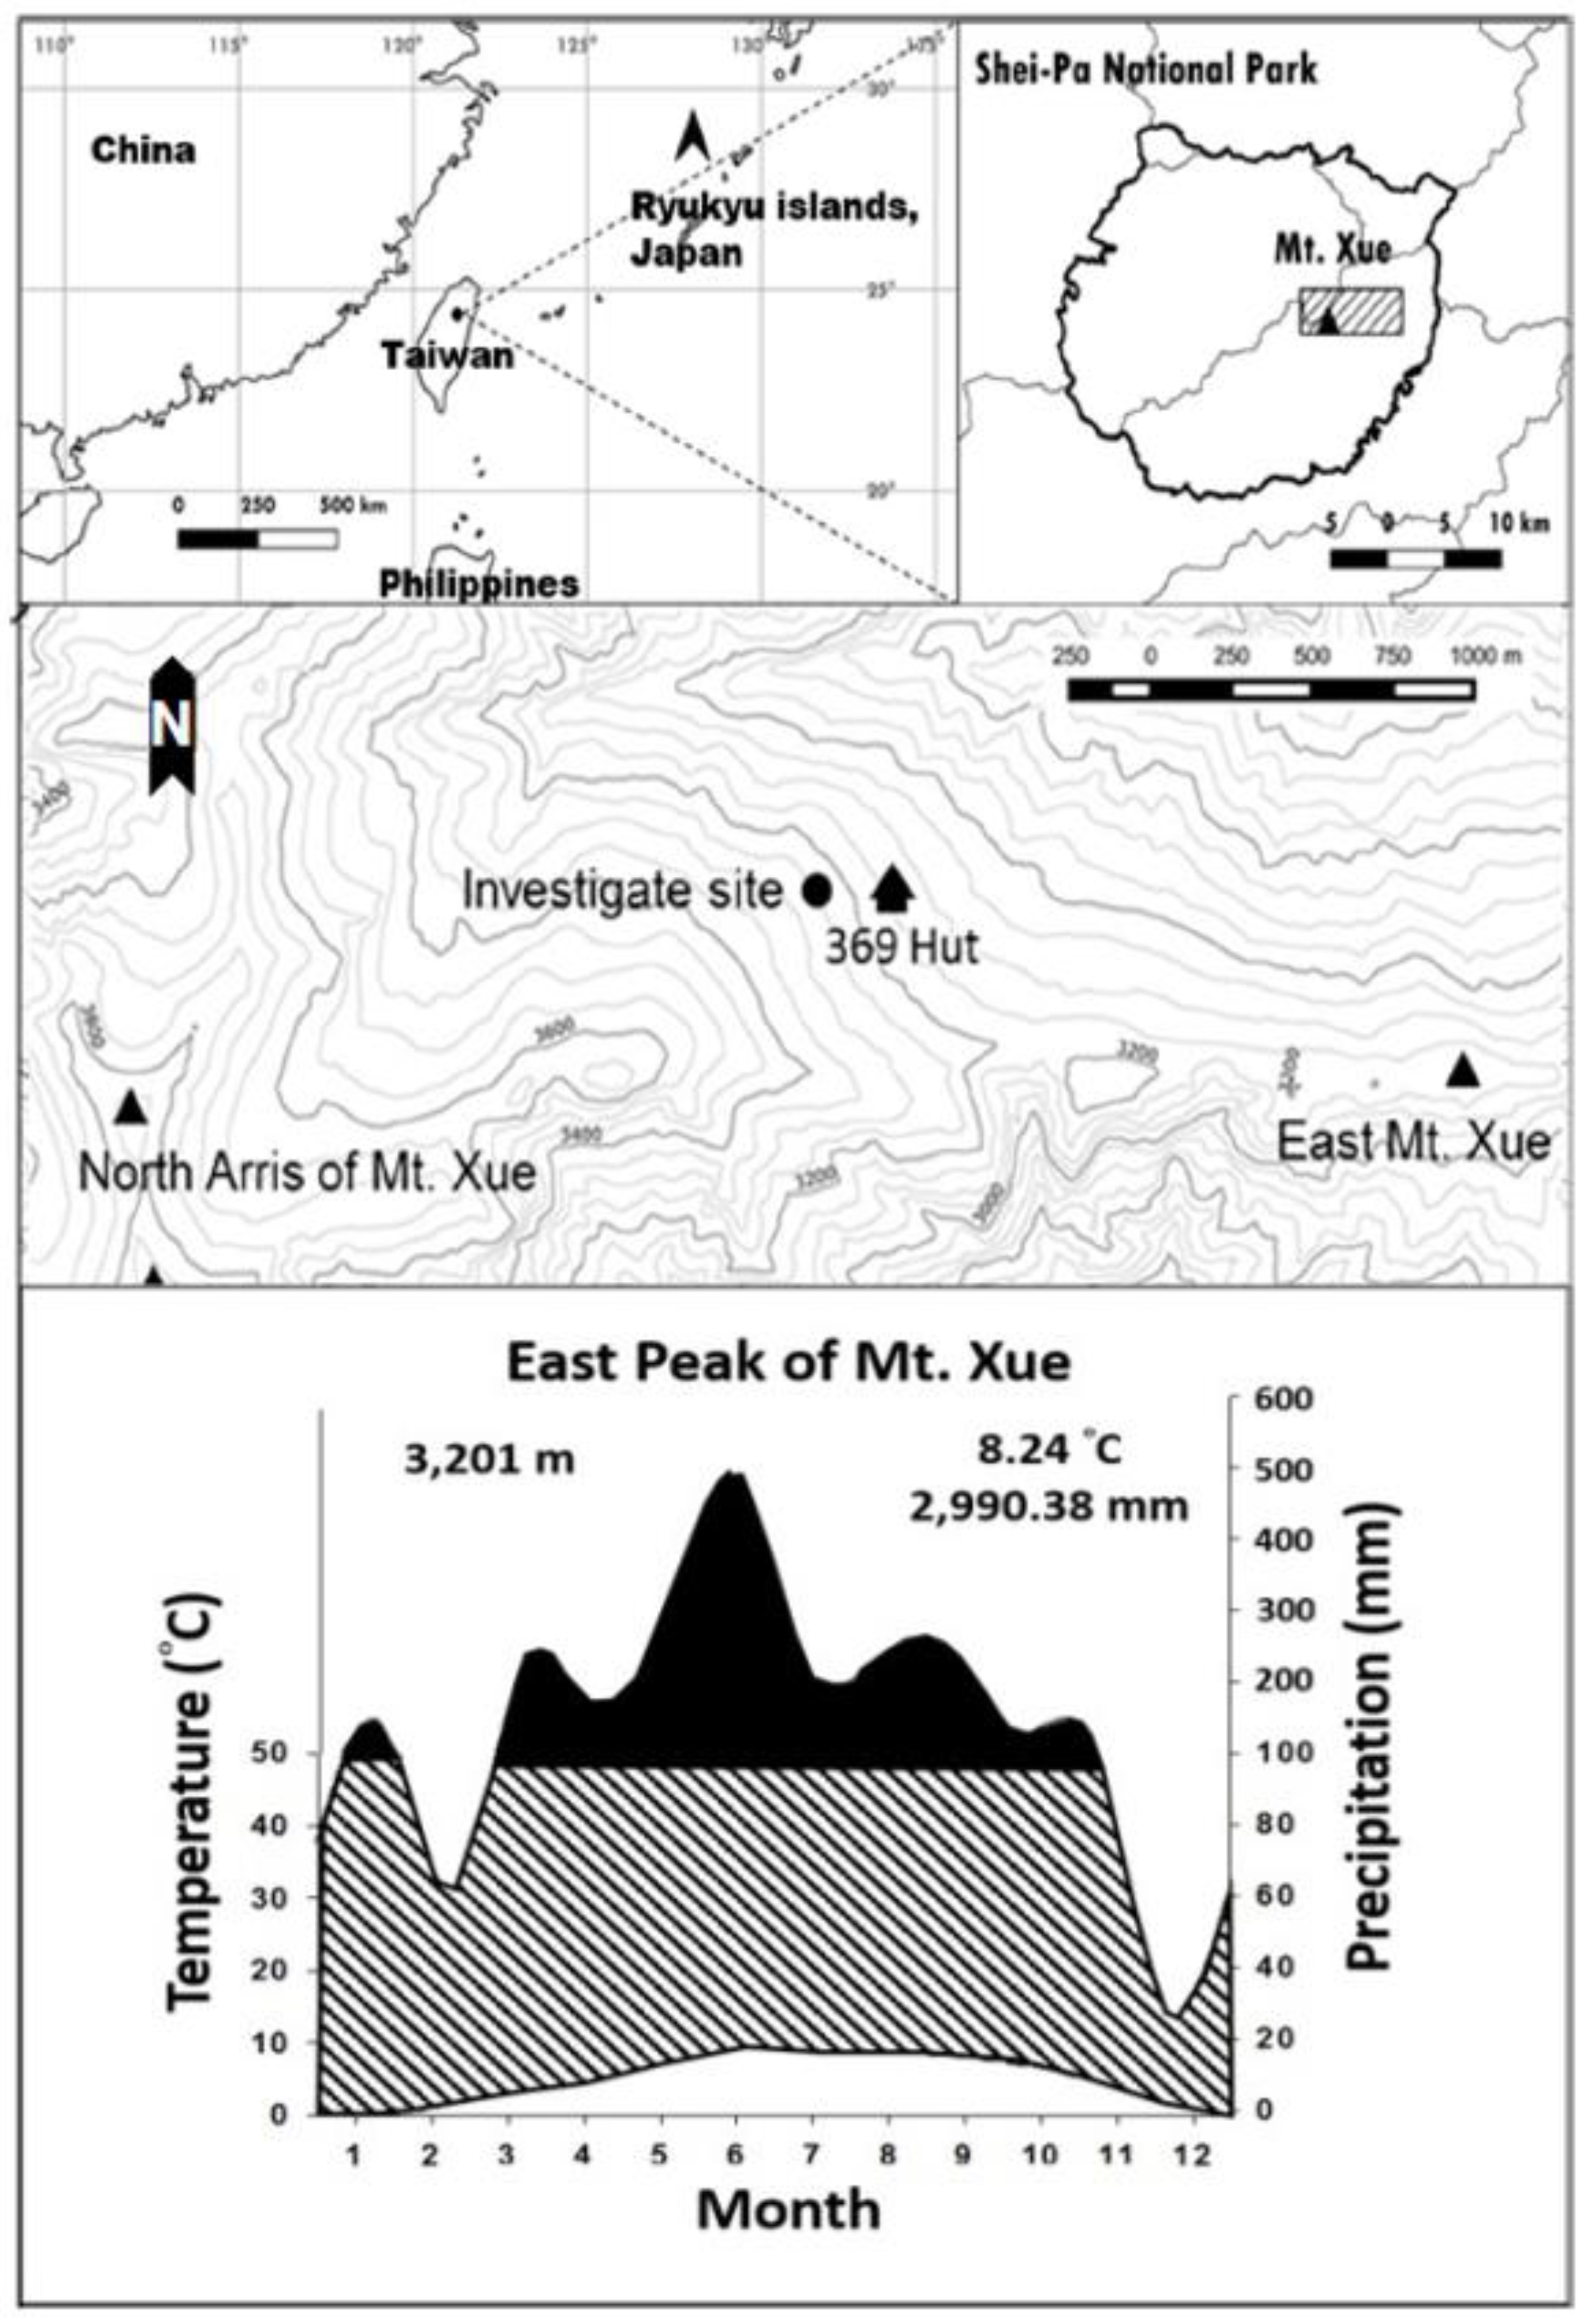
2.1. Study Area

Between October 2009 and October 2019, the monthly average temperatures near the study area were 7.52–8.63 °C (Figure 1); the minimum and maximum temperatures were recorded in January and July, respectively; additionally, the annual rainfall was approximately 2700–3200 mm [25]. The geology of the study area belongs to the Xue Mountain Range of the western subregion in the geologic province of the Central Range. The composition of the Neogene submetamorphic rock in the geological belt primarily consists of dark gray argillite and slate, whereas the soil in the forest or grassland regions of the Xue Mountain primarily comprises loam and humus. However, the terrains are steep, and the topsoil is thin [26]. The pH of the soil along the East Xue Trail is extremely acidic and is deficient in nutrients. Soil cation exchange capacities (CECs) are extremely high, whereas exchangeable sodium, calcium, and magnesium are low. Moreover, the soil rock content is 16.01% [27].
The shrub grasslands near the 369 Hut primarily comprise the dominant species of Y. niitakayamensis and M. transmorrisonensis. Plant species compositions are defined by the dominant families, namely Asteraceae, Poaceae, and Rosaceae; plant florae primarily belong to the temperate zone. In the plant community, Y. niitakayamensis and M. transmorri-sonensis are dominant [11,28]; the saplings of A. kawakamii, Juniperus morrisonicola, and Pinus taiwanensis, as well as bushes of Rhododendron pseudochrysanthum and R. rubropilosum, are scattered among the shrub grasslands. Hemicryptophytes are the predominant plant in the shrub grasslands [9].
The east peak of Xue Mountain is a common tourism area, as well as one of the most remarkable hiking trails among the alpines of Taiwan. Thus, numerous hikers camped on the mountain, which also increase the occurrence of fires. Moreover, most plants that wither in the winter in the study site become natural fuel (Figure A1). A fire occurred on the night of 18 December 2008 because of negligence in the park and was extinguished only at 4 pm on December 19. The fire spread to an area of about 20 ha and destroyed an ecotone of approximately 19 ha of dominant shrub grassland consisting of Y. niitakayamensis and M. transmorrisonensis, as well as 1 ha of predominantly woody plants of A. kawakamii, Sorbus randaiensis, and R. pseudochrysanthum. In summary, there were five fire disturbances from 1900 to 2022 (Table A1). Because of the forest line and soil humidity, most types of fires are low-intensity surface fires.

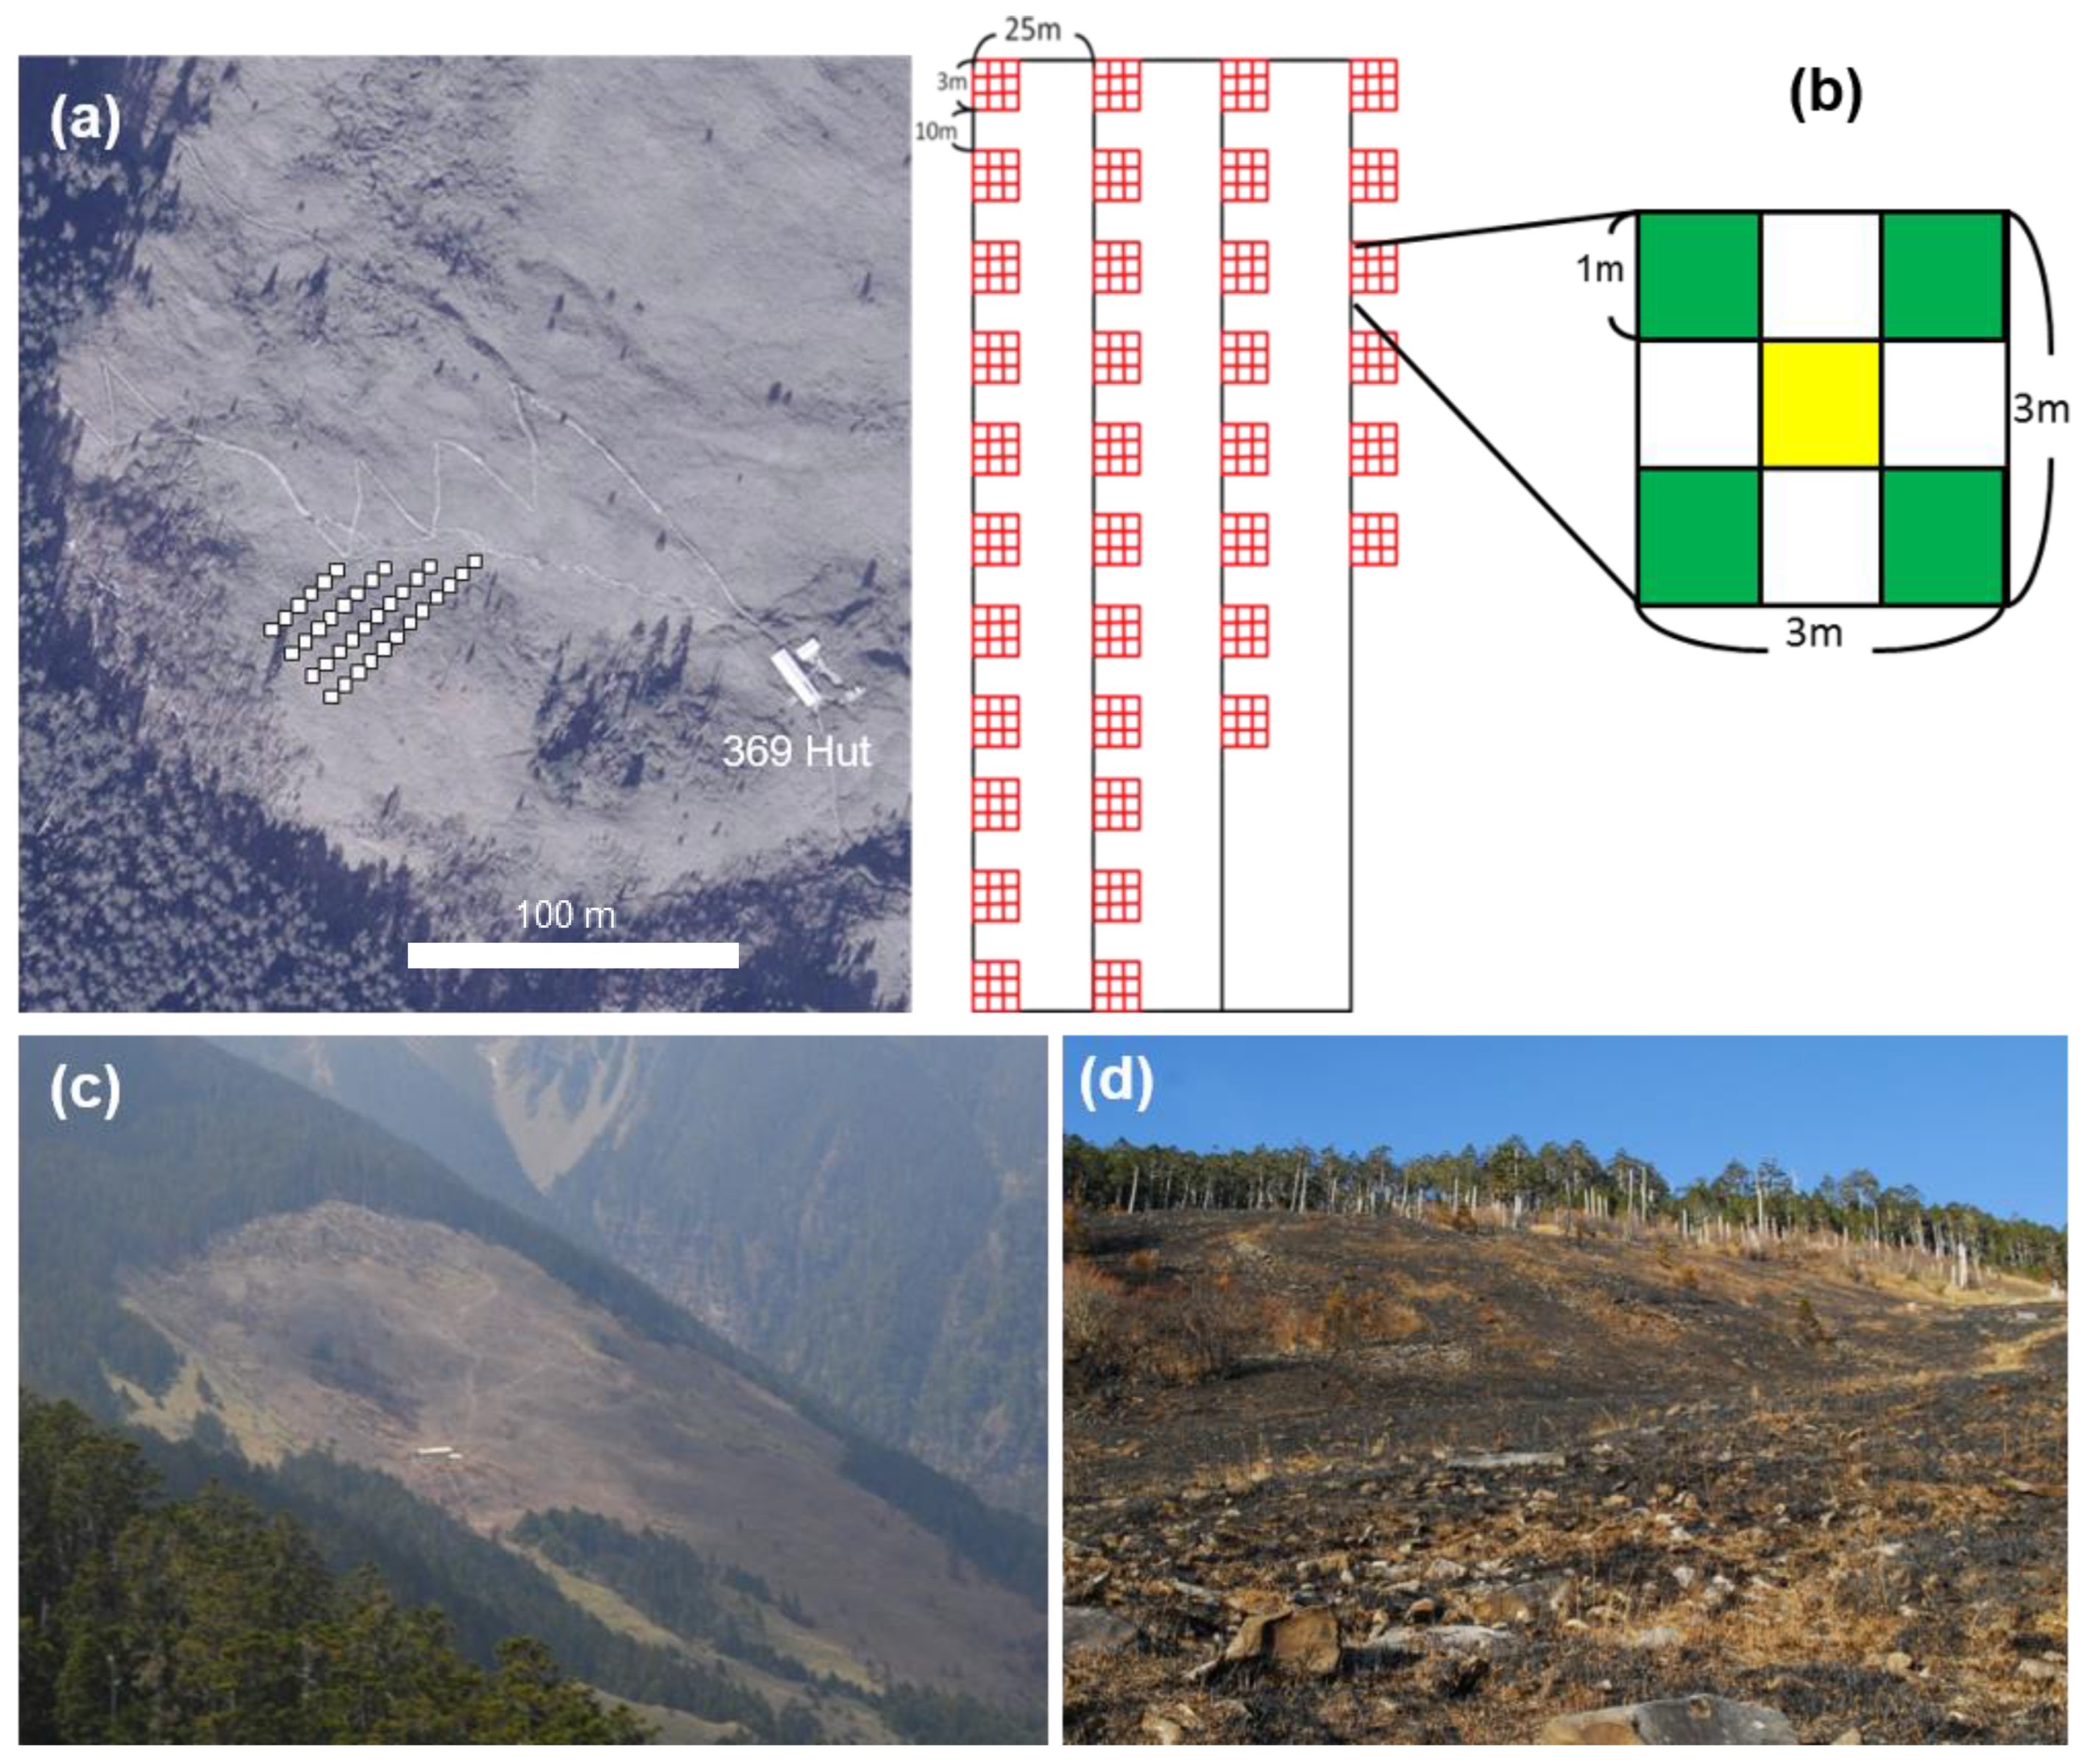
2.2. Sampling and Monitoring

Systematic sampling was conducted on the postfire shrub grassland site near the 369 Hut (Figure 2). In addition, the seasonal variations in coverage area for each species in the postfire grasslands were investigated; we established sample poles every 25 m along a sample contour on the grassland behind 369 Hut and below the Abies kawakamii forest edge. The sample points on the top of the sample poles were dragged downwards 70–100 m, and a 3 × 3 m2 sample area was established at each 10 m interval. Every sample area was subsequently divided into nine 1 × 1 m2 plots. Among these, the four corners of each 1 × 1 m2 plot were investigated. These totaled 36 sample areas for the purpose of recording, shooting photos, and documenting plant species and species coverage in each plot. Furthermore, we also set 10 samples in an unburnt area randomly as the control group.

2.3. Data Analysis

2.3.1. Species Diversity during Postfire Succession

The plant phenology in Xue Mountain exhibits defined seasonal variations [29]. Therefore, the investigative sequence was distinguished according to spring and summer–fall seasons. The Gleason index (dGL), Shannon index (Hsw), and evenness index (Esw) of diversity were calculated during each investigation in order to determine the change in species diversity [30,31]. In addition, Raunkiaer’s life form was adopted to classify the investigated species and calculate the proportion of existent phanerophytes, chamaephytes, hemicryptophytes, geophytes, and therophytes [32]. These results were used to determine the chronological succession of the proportions of functional groups in the study area during postfire restoration. In addition, the plants in the postfire area were divided into resprouter and reseeder types according to postfire regeneration strategies [33].
Gleason index (dGL) = S/lnA
Shannon s   index   ( H sw ) = i = 1 N ( n i / N ) × l o g ( n i / N )
Evenness index (Esw) = Hsw/lnS
Here, S is the species number, A is the sample area (m2), ni is the number of individuals contained in the ith species, and N is the total number of individuals.

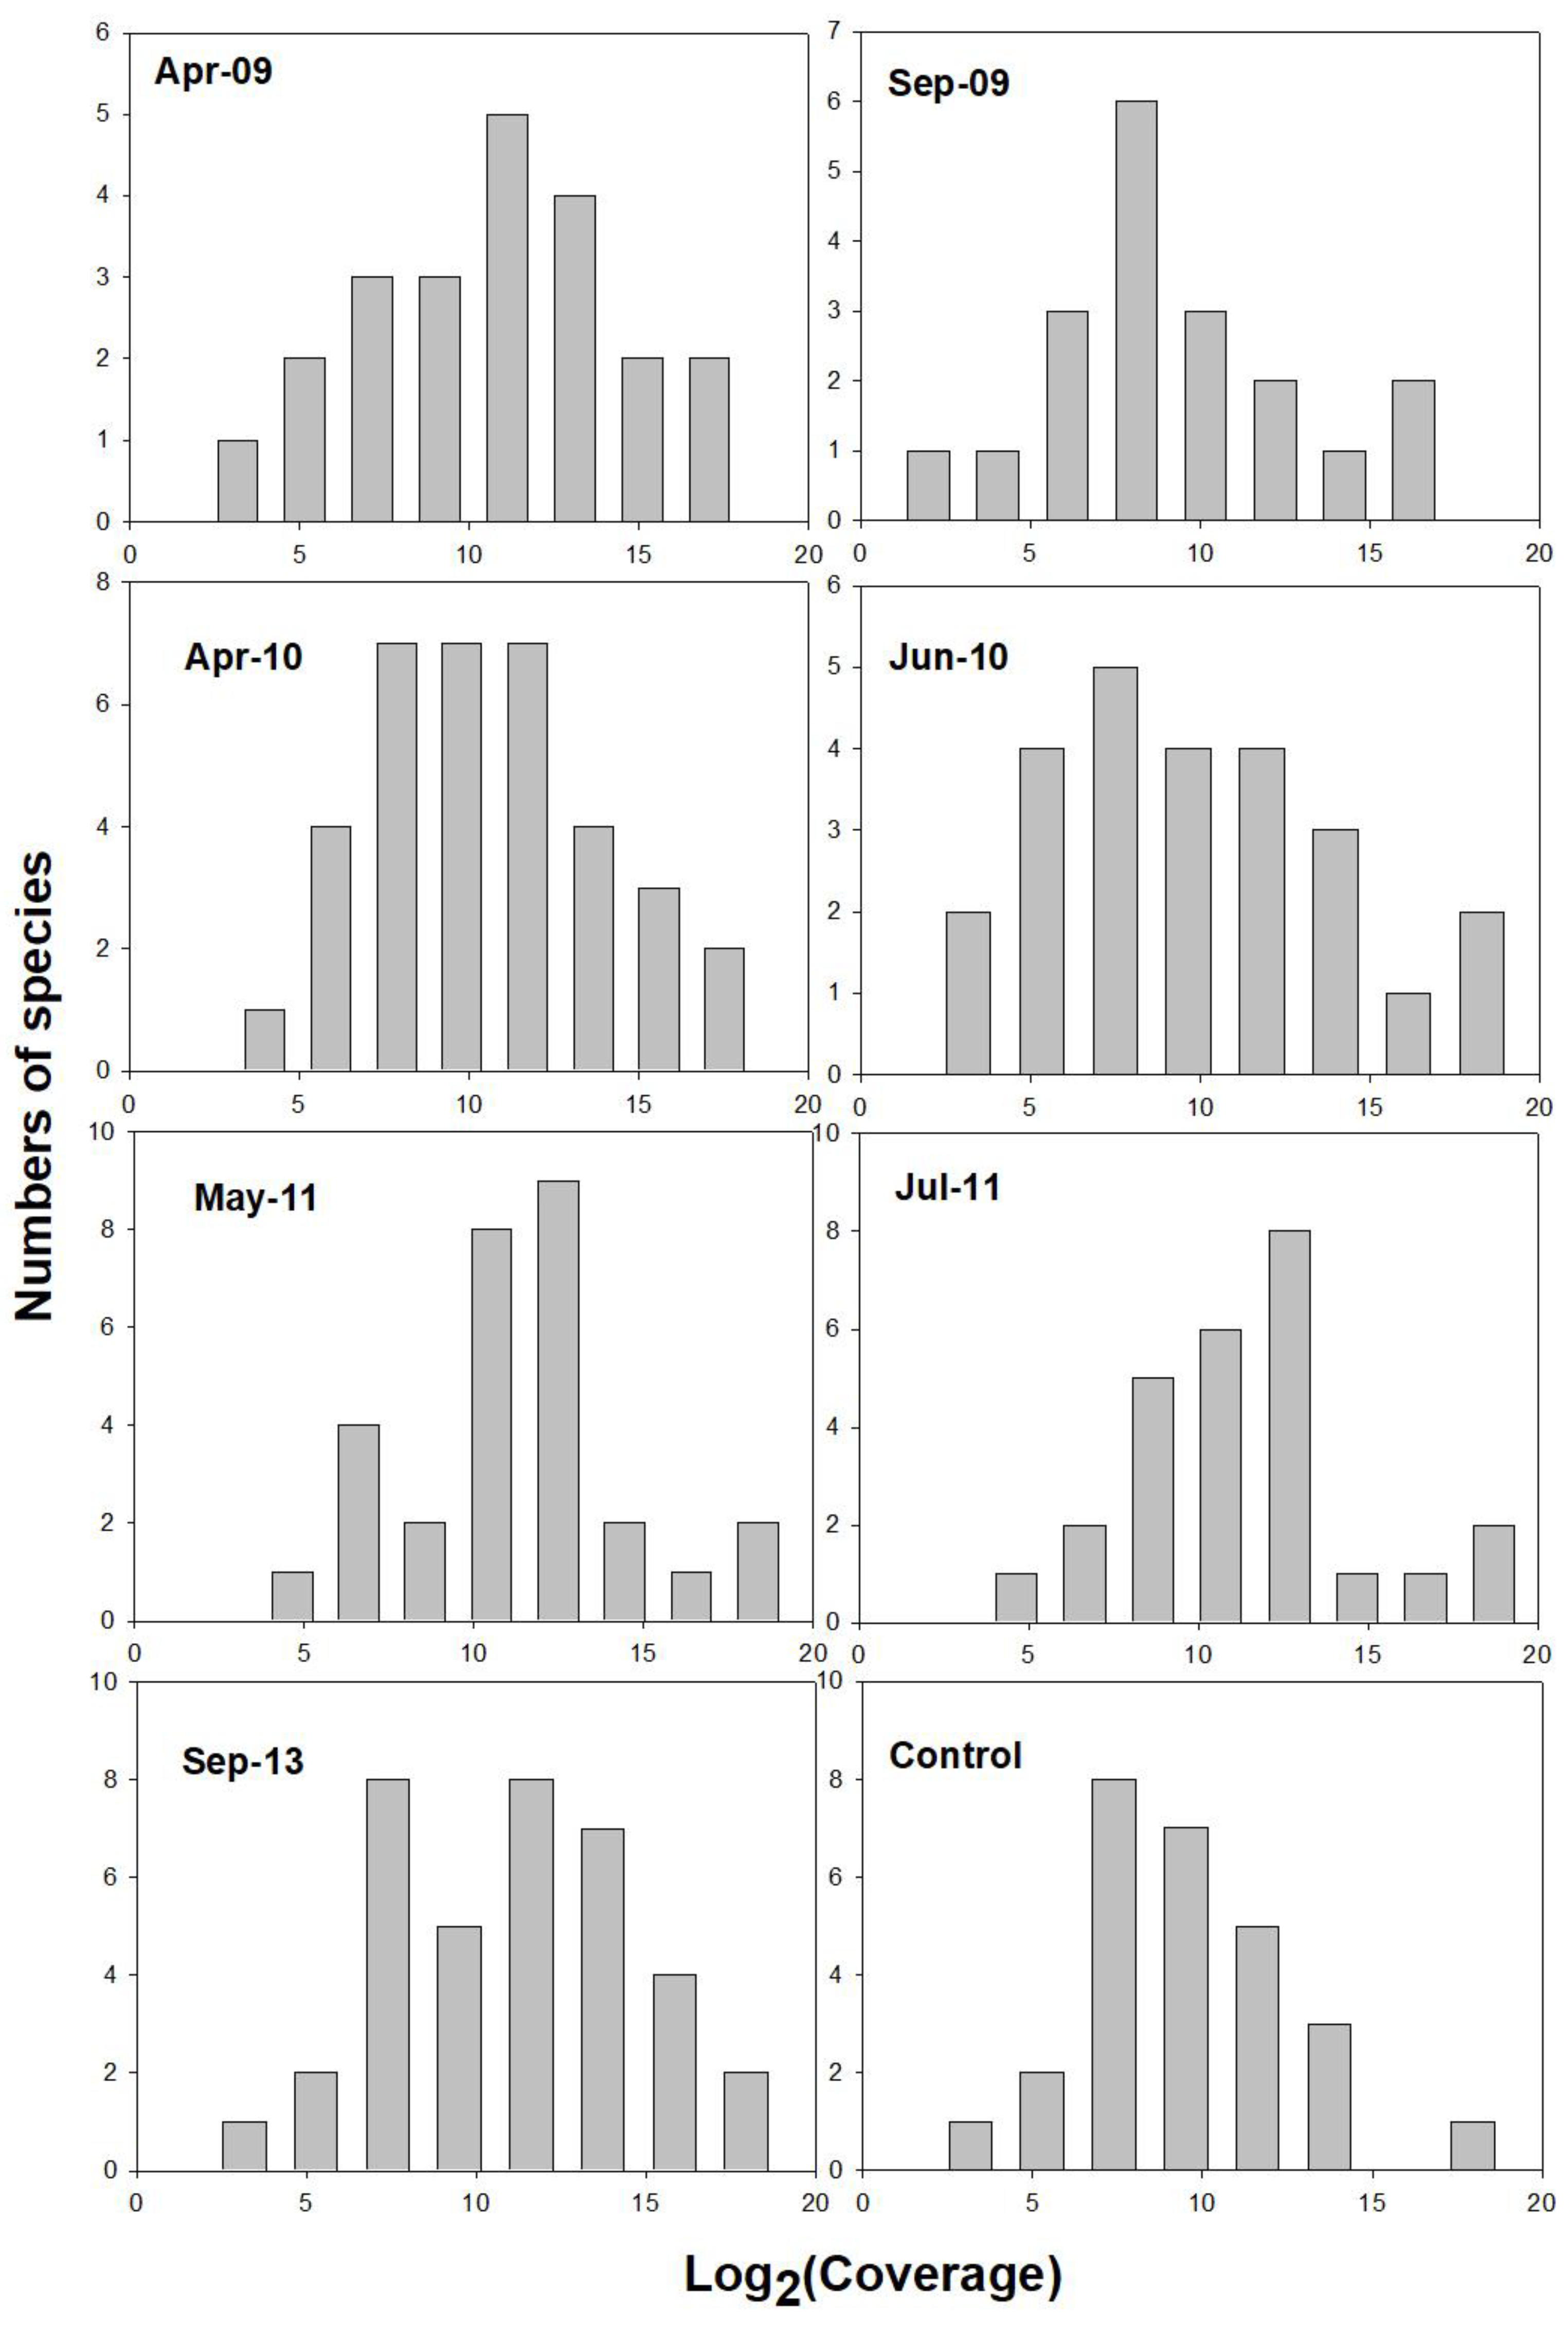
2.3.2. Log-Normal Distribution of Species-Coverage Relationships

We plotted species coverage in different periods of shrub grassland after postfire succession into species-coverage histograms to determine the plant coverage using the distribution of the corresponding species. The plant coverages for each period were transformed logarithmically to determine the species concentration patterns. When the peaks of the species-coverage histograms are concentrated on the left side, the condition indicates a large presence of rare species. Alternatively, a concentration of high peaks on the right side indicates higher populations of dominant species. Species-coverage histograms exhibiting log-normal distributions that show substantial amounts of common species. Logarithmically transformed histograms determined whether data validity and sample population were sufficient for describing sample area compositions [34]. Sigmaplot Version 14.0 was used in this study to plot the histograms; additionally, Kolmogorov–Smirnov tests were conducted using SPSS Version 22.0 to verify whether the distributions were log-normal conditions.

2.3.3. Species-Abundance Model Simulation for Postfire Subalpine Shrub Grasslands

Postfire plant coverages varied substantially. The variations between dominant and rare species dramatically changed the overall structure of the vegetation. Therefore, plant coverages of different periods were converted into square meters prior to species-abundance simulations. Different periods of postfire data were simulated using the five species-abundance models, namely, preemption and broken-stick models (niche models), the log-normal model, and the Zipf and Zipf–Mandelbrot models [16,18]. R software Version 4.3.1 was used for data simulation and analysis. The details are as follows.
(1)
Preemption Model
The preemption model [35], which is also known as the geometric series model and assumes a limited resource of 1, enables the first species (the most dominant) to occupy k numbers of the total niche of florae. The second species occupies the remaining k resources, which is k × (1 − k); similarly, the third species occupies k × (1 − k)2. When each species enters resourceful environments at equal time intervals and quickly occupies the niche partitions, a distributed preemption model is formed. In addition, florae under the control of one or more factors tend to produce these distributions. When A1 represents the abundance of the most dominant species, the abundance of the ith species can be represented by Ai through the following relation:
Ai = A1ki−1
(2)
Broken-stick model
The broken-stick model [15] assumes a total florae resource of 1, represented using a long stick that is separated into S sections by randomly setting S-1 points on the stick. This represents that the florae are shared by S species. It is necessary to assume that these S species share similar ecological status and competitiveness and appear in florae within the same time period. The broken-stick model is suitable for florae of small varieties, close relations, and even individual distributions; however, this model indicates the extreme evenness of the community and rarely applies in reality. The niche model, which primarily focuses on the influence of species on the environmental resource usage and occupation of florae, provides ample explanations of ecological aspects. However, this is highly theoretical; certain specific conditions occasionally cannot be fully explained. In contrast, statistical models often provide satisfactory simulation results but cannot provide fitting ecological implications [16]. The ith abundance (Ai) of this model can be expressed as follows:
A i = ( J / S ) x = 1 S ( 1 / x )
where J is the total number of individuals of florae, and x is the number of individuals of the xth species.
(3)
Log-normal model
The log-normal model [36] assumes that the logarithmic form for the number of species matches standard normal distributions; setting the number of species individuals to N yields Z = ln (N). When the majority of factors simultaneously influence a variable, the random variables of factors cause the formation of normal distributions, which is the result of the central limit theorem [37]. In interpreting the distributions in terms of species abundance, the variables (N) can be regarded as the individuals of each species, whereas the factors can be regarded as the processes influencing florae compositions. Log-normal distribution provides decent fitting for diverse habitats and abundant species compositions. The structure of the log-normal model resembles that of the broken-stick model but consists of an increased number of parameter estimations. Therefore, the configuration values are comparatively flexible and provide useful fitting data [24]. The reasoning behind the assumption that there are log-normal distributions for individuals of species cannot be explained, which is often criticized by researchers [38]. The variables μ and δ represent a normal distribution’s mean and standard deviation, respectively. The equation for the ith abundance Ai can be expressed as follows:
A i = e log μ + log δ N   ( i = 1 , 2 , 3 , k )
(4)
Zipf model
The Zipf model [39] assumes that the probability of a species entering a habitat is determined by the existing species and the environment. Therefore, species exhibit high probabilities in early instances but must fulfill high requirements for energy, time, and environmental conditions in order to enter the habitat later. Consequently, the number of species entering into the habitat progressively decreases during the developing succession process. The equation is shown as follows:
Ai = Jp1i−γ
where p1 denotes the proportion of abundance for the first dominant species and γ is a constant, which is a parameter value obtained from the simulation.
(5)
Zipf–Mandelbrot Model
The Zipf–Mandelbrot model [39] converts the abundance ratio for the most dominant species into the parameter c and an additional parameter β. The results from numerous studies indicate that β can reflect the potential diversity of a habitat. In addition, the parameter γ can also be used to estimate species diversity [38]. This model enables estimations for various sample and environmental conditions. Specifically, habitats with a comparatively high potential are fitted using the Zipf–Mandelbrot model. The variable Ai can be expressed using the following equation:
Ai = Jc(I − β)−γ
where Jc and β are parameters for this model.
Through model simulation, the chi-square goodness-of-fit (GOF) test was used to evaluate the model’s fitting results. The method was used to determine the square of the deviation and the optimal fitting model by performing logarithmic operations on the data and expected values of the model [24]. The chi-square GOF was performed using the predicted values from model data simulation and observations by using the following equation:
χ 2 = i = 1 s ( O i E i ) / E i
where Oi is an observational value and Ei represents the model’s predicted value.
When χ2 < χ2 (α, df) (where α denotes a significant standard, which is typically set to 0.05, and df is the degree of freedom, which is set to one less than the number of study samples), the model produced satisfactory fitting results. Specifically, no significant differences were found between the model-predicted values and actual observations when p > 0.05. The chi-square GOF in this study was performed using Microsoft Excel version 16.

3. Results

3.1. Short-Term Change of Postfire Species Diversity

Following the fire incident on 18 December 2008, the number of species and species diversity indices increased during the restoration of vegetation cover (Table 1) and demonstrated seasonal variations. The number of species peaked in the 18th month after the fire (June 2010), when the Gleason and Shannon indices also peaked. The evenness index peaked (0.35) in September 2009 and subsequently declined to a steady reading (approximately 0.30). Control groups reached a relatively high value for species diversity.
The coverage of vegetation reached 43.95% by June 2010 (Table 1) and 64.80% by 2013. The restoration of the overall species coverage generally increased. However, the coverage often showed reductions during spring periods from the previous years’ (April 2010 and May 2011) growth seasons (summer–fall seasons).
By classifying the plants that appeared in various periods in the postfire grassland near 369 Hut on Xue Mountain according to Raunkiaer’s life form, the postfire life-form spectra of plant species were revealed. In July 2013, phanerophytes, chamaephytes, hemicryptophytes, and geophytes accounted for 8.33%, 8.33%, 66.67%, and 16.67% of all plants, respectively. Compare with the fire area, where the control group had a higher proportion of phanerophytes plants (14.29%). During the initial postfire research period (February 2009), the species compositions within the study area primarily consisted of resprouters. After 2010, an increasing amount of reseeders were found (approximately 30%). The ratio of the two types of plants stabilized after July 2011. The pteridoplyte quotient, which appeared in grasslands near the 369 Hut after the surface fire, peaked on February 2009. From a seasonal perspective, the pteridoplyte quotient began to decline in spring seasons starting in February 2009 until reaching a minimum in April 2010. The quotient then increased again in May 2011 and fluctuated thereafter. Regarding summer seasons, the quotient reached a minimum on September 2009 and continued increasing to 4.17 in September 2013.

3.2. Species–Abundance Analysis of Postfire Plant Coverage

By February 2009, the restoration period had lasted for less than three months, and only five species were discovered, including Y. niitakayamensis, Lycopodium pseudoclavatum, Gentiana arisanensis, Aletris formosana, and M. transmorrisonensis; therefore, we preferred not to perform it with such low numbers of species in histograms.
The results from species-abundance series analysis showed normal distributions in the seven periods (all seven periods produced p < 0.05 in the Kolmogorov–Smirnov tests; Figure 3). The log-normal distributions showed that the longer the postfire vegetation cover restoration was, the greater the increase in proportional coverage became. These distributions reached relative stability by 2011. However, the peak numbers of species in the species-abundance frequency distribution histograms throughout the postfire restoration periods exhibited varying distribution patterns. The number of rare species noticeably increased in 2010 (species in low-coverage areas increased especially). In June 2010, the dominant species declined compared to previous seasons, and common species increased, concentrated, and presented symmetric log-normal distributions.

3.3. Species-Abundance Model Simulation for Postfire Subalpine Shrub Grasslands

Five species-abundance models for the initial succession in the postfire subalpine shrub grasslands were analyzed. The results of the chi-square GOF test showed that the fitting for the majority of the species-abundance models in different postfire periods was not significant (p > 0.05), indicating that data from different survey periods could be effectively simulated. In addition, the preemption model failed to match the data from a number of time periods; the broken-stick model also exhibited unsatisfactory fitting when applied to data from several time periods (Table 2; Figure 4). Regarding the model fitting conditions for various periods, decent results were obtained in all five models for the species coverage in postfire succession for February and April 2009 (p > 0.05). The optimal fitting models were yielded from the Zipf model and the log-normal model. Only the preemption model failed to effectively fit data from September 2009 and April 2010. In the case of rare species, the residuals between each part of the model and data were greater than those for the dominant species. For data on June 2010 and May 2011, only the preemption model and the broken-stick model failed to pass the chi-square GOF. In addition, the succession coverage in July 2011 was consistently nonsignificant (p > 0.05) for all models when tested using the chi-square GOF. The Zipf–Mandelbrot model presented optimal fitting for the postfire vegetation-restoration statuses between 2010 and 2013, and the Zipf model presented optimal fitting for the control group.

4. Discussion

4.1. Short-Term Change of Postfire Species Diversity

The timing of fire occurrences affects vegetation-restoration times [5,40]. Due to the occurrence of fire during the winter season when plants enter dormancy, the species in this region primarily comprise aboveground deciduous plants. The fire incident was a low-intensity surface fire; therefore, the harm caused to the majority of the plant compositions was minimal. These types of fires can free up resources, such as space and nutrients [4,8]. In terms of their impact on species diversity, fires function to temporarily suppress certain dominant species, such as Y. niitakayamensis, M. transmorrisonensis, Sp. hayatana, and R. rubropilosum (mostly belonging to resprouters), providing increased resources for dwarf resprouters, and to add new habitats for other exogenous species [33,41,42]. High species abundance is caused by invasive species, pioneer species (distributed randomly), therophytes, and perennials of varying lifecycles entering the habitat after fire disturbances [43]. Some studies have argued that disturbances eliminate dominant species (or decrease their level of dominance), functioning as a mechanism for increasing species abundance [3,44,45]. Our study demonstrated the rapid colonization of species in the postfire habitat. In numerous grassland systems, fires typically increase species abundance and peak in the first year or within several years [6,8,46,47].
The life-form spectra from various postfire periods showed that the shrub grasslands near 369 Hut approached the prefire status approximately 1–2 years postfire [11,28]. Our results showed that the subalpine shrub grasslands in Taiwan comprised fire-dependent vegetation; the fire disturbance not only increased in biodiversity but also increased the diversity of functional traits [1,2,3,4,5,6]. The life form in the study area was composed primarily of hemicryptophytes, followed by geophytes. Because of the harsh climates in the subalpine region of Xue Mountain, the sapling survival of hemicryptophytes and geophytes is under the prolonged protection of the snow and plant litter [28]. In addition to hemicryptophytes (M. transmorrisonensis, Solidago virgaurea var. leiocarpa, Morrisonensis picris) and geophytes (Y. niitakayamensis, Al. formosana, and Lilium formosanum), chamaephytes (Sp. hayatana and Hypericum nagasawae) also recovered immediately following the fire disturbance. These rapid postfire occupying species can be regarded as plant compositions in the Taiwan subalpine shrub grassland plant community that are well adapted to the occurrence of fire [5,6].

4.2. Species-Abundance Series Analysis of Postfire Plant Coverage

Although the dominant species in the study area, such as Yushan cane and alpine silver grass, rapidly resprouted after the fire activity, the majority of space and access to nutrients were freed after the fire disturbance. These environmental resources supported the establishment of other resprouter species and colonizations, as well as the opportunities for subsequent developments. This substantially influenced the appearance of nurse species and rare species. The sample area was established, and the first investigation was completed in February 2009; however, this was conducted during the late winter and early spring seasons, and only some species were found. In addition, the plant coverages were limited, and species-abundance analysis could not be performed. Comparing the two dominant compositions prior to fire activity, Y. niitakayamensis sprouted earlier than M. transmorrisonensis. An investigation in April 2009 showed that, during 5 months of postfire restoration and temperature rebound in spring, suitable temperatures and adequate moisture enabled the postfire growth of Sp. hayatana, So. virgaurea var. leiocarpa, and several species of Liliaceae, such as L. formosanum and A. formosana, in the study area. These rapidly restoring plants are also reflected in the chronological phenology as early spring sprouters [29]. Common species were abundant during the period, and the most frequently occurring among these were fire-dependent species.
The dominant ground-cover species was primarily Y. niitakayamensis until September 2009; however, other types of species increasingly resprouted within the sample area. The common species present during early restoration gradually became the dominant species in September 2009; these included M. transmorrisonensis and Sp. hayatana. Among these, the coverage of M. transmorrisonensis during this period was close to that of Y. niitakayamensis. Minority species, such as Gaultheria itoana and Viola adenothrix, continued to resprout during this period, albeit with limited species coverage.
The composition and structure of vegetation coverage gradually stabilized after a year and a half of fire activity (June 2010) in the Xue Mountain subalpine shrub grasslands. Common species were concentrated in the coverage area, and several species colonized the sample area, forming several rare species. This postfire regeneration process was generally consistent with the results of several studies that showed numerous grassland ecosystems to be restored one year after the occurrence of fire activity [5,46]. A survey in May 2011 showed that the number of species and vegetation species coverage within the sample area substantially declined compared to that in the previous year. This may have been because of the spring snowfall in April 2011 [25]. The plants in the 3000–3600 m subalpine grassland ecosystem typically germinate, leaf, or flower during the spring season between March and April [29,48]. Plants are relatively fragile during this period, being prone to the effects of abnormal climates such as snowfall in the coverage area. After more than four years (September 2013) of restoration in the coverage area in the grassland near 369 Hut at Xue Mountain, the composition and structure remained similar to those seen prior to the fire incident [9]. The variety of species during this period was concentrated among common species because rare species with limited coverage in the previous period gradually emerged as common species (thus increasing coverage area) because of relatively stronger growth potentials.

4.3. Species-Abundance Model Simulation for Postfire Subalpine Shrub Grasslands

The species-abundance model for postfire shrub grasslands near 369 Hut at Xue Mountain showed that each restored period during postfire succession consisted of individual optimal fitting models. The Zipf–Mandelbrot model and log-normal distribution demonstrated the optimal fitting results for the majority of the restoration periods (Table 2 and Figure 4). The results were generally consistent with the assumption that the log-normal distribution provided improved fitting for the initial postfire succession process in the subalpine shrub grasslands. However, we also found that the Zipf–Mandelbrot model provided optimal fitting results for stable postfire restoration in the subalpine shrub grasslands two years postfire (Table 2). It was caused by small-scale sample areas, which also means the number of species is relatively low, environmental conditions are similar, and plant individuals are relatively proximal [22,23,49]. However, the Zipf–Mandelbrot model demonstrated the most suitable fitting among the same five models for the coverage data of each period in this study.
The simulated plots (Figure 3) showed that the log-normal model provided decent fitting to the data; however, the simulated deviations showed that the result of the Zipf–Mandelbrot model was superior to that of the log-normal model (Table 2). This is because the Zipf–Mandelbrot model is an extension of the Zipf model, which uses a parameter for estimations instead of using the proportion of dominant species (discarded), thus increasing the influential power of the model as the species become common in subsequent processes [38]. During the many postfire restoration periods in the shrub grasslands of Xue Mountain, the Zipf–Mandelbrot model provided superior fitting to that of the log-normal model. Moreover, the Zipf–Mandelbrot model comprises comparatively more estimation parameters; the simulation and estimation of expected values are also increasingly flexible [50]. Increasingly complex environmental conditions yield increasingly heterogeneous overall habitats, weakening competition between individuals [23,49]. Therefore, species-abundance relationships within habitats were primarily determined by the dominant species, while the Zipf–Mandelbrot model provided decent simulation effects for dominant species and common species.
The log-normal model is partly modified in the simulation of rare species, and data were primarily fitted based on the abundance of the common species. When species composition was abundant and evenly distributed (i.e., when the proportion of common species was higher than that of the rare and dominant species and the distribution of the number of species approached standard normal distributions), the log-normal model provided improved fitting results [22]. Therefore, during the majority of the postfire recovery periods, the log-normal model provided superior fitting results. The geometric series model (i.e., the preemption model) primarily appears in environments of depleted species or in the early stages of vegetation succession [18]. As succession develops or environmental conditions change and increasing amounts of species colonies enter an area, the distribution of species-abundance conditions may be converted from that of the preemption model into that of the log-normal model.
Through a year and a half of postfire regeneration (April 2010), species reentered or colonized the habitat and added to the numbers of rare species, and then the composition of the vegetation gradually stabilized. Plants that exhibited low species coverage during initial periods emerged as common species through growth expansion. Although similar structures were observed in other periods, the number of common species in other periods remained greater than that of the rare and dominant species. This was because the formerly rare species developed into common species during the vegetation-restoration period.
When overall vegetation exhibits a large coverage area and low species number, the broken-stick model often overestimates the predicted values. However, when the overall vegetation is defined by a small coverage area and a high species number, the model underestimates the predicted values. In the study period, the subalpine shrub-grassland postfire restoration of vegetation cover on Xue Mountain primarily exhibits the former conditions; this was because the dominant species of Y. niitakayamensis and M. transmorrisonensis during each postfire period remained the dominant species. Resprouters recovered and reoccupied the habitat faster than reseeders during postfire succession [33,41]; the species that appeared in the first year after the shrub-grassland fire on Xue Mountain primarily included the dominant species of Y. niitakayamensis and M. transmorrisonensis, as well as the common So. virgaurea var. leiocarpa and A. formosana. Although relatively stable conditions emerged during the second year following the fire incident (2010), the species coverage of Y. niitakayamensis and M. transmorrisonensis during the succession process were overestimated; this resulted in high residuals of rare species in the broken-stick model.
Because species composition structures gradually stabilized on July 2011, the numbers of major rare species reached equilibrium several seasons subsequent to entry into the sample area. In contrast, the data for May 2011 showed that the numbers and ratios of rare species accounted for approximately one-third of the total species numbers. Therefore, the potentially rare species during this period primarily advanced to the status of common species; only several remained in the sample area as incidental species, such as Smilacina formosana. Although the broken-stick model predicted structures that resembled the log-normal model, this model provided superior fitting to the broken-stick model when environments and species compositions were complex [24]. The broken-stick model assumes a single dimension, violating the non-overlapping assumption on the random partitioning of each species in the habitat when extrapolated to multiple dimensions [17]. Therefore, the broken-stick model provided relatively weak fitting statuses when applied to complex habitats [20,49].
The fitting results of the five species-abundance models (Table 2 and Figure 4) showed that the variation in plant coverages from the postfire succession of the shrub grasslands near 369 Hut were primarily caused by rare species. Hence, when dominant species were used to estimate the species-abundance model that exhibit low species coverage, this often resulted in overestimations; the preemption model and the Zipf model are two examples of these [24]. These two models are constructed based on dominant species (i.e., those that consume the majority of the overall resources). When the overall species distributions comprise the strict linear pattern of the dominant species, these two models tend to estimate matching onsite data distributions. The Zipf model provided optimal fitting during the initial postfire period (February 2009) and control group. However, during the growth booming season of the same year (September 2009), the number of rare species increased, and the fitting results of the Zipf model and the preemption model became inferior to those of the other models.

5. Conclusions

Five years after the fire incident, the status of shrub grassland near 369 Hut at Xue Mountain gradually approached stability. The time periods of species reentrance and methods of species regeneration are related to the mechanisms of survival. Various species compositions were also affected by the properties of the species that entered the area during the seasons after the fire, with the optimal fitting models varying accordingly. The fitting results for each species-abundance model showed that the Zipf–Mandelbrot model and the log-normal model provided optimal results for the majority of the restoration process for the postfire periods in the shrub grasslands. This was related to the increase in freed space and resources in the postfire study area and the adaptive responses of the subalpine shrub grasslands of Taiwan toward fire activities. The Zipf model provided optimal fitting results three months after the fire and control group, whereas the results of the log-normal model closely resembled the data between five months postfire and September 2013. These results generally matched the assumption of a high correlation between the initial postfire subalpine shrub-grassland succession and the log-normal model. Species-abundance models provided objective and intuitive interpretations for data and inferences on the ecological processes and current statuses of the habitat.

Author Contributions

Conceptualization, W.W. and H.-Y.T.; methodology, W.W. and M.-C.L.; software, W.W.; validation, W.W., M.-C.L. and H.-Y.T.; formal analysis, W.W.; investigation, W.W., M.-C.L. and H.-Y.T.; resources, M.-C.L. and H.-Y.T.; data curation, W.W. and H.-Y.T.; writing—original draft preparation, W.W.; writing—review and editing, M.-C.L. and H.-Y.T.; visualization, W.W. and M.-C.L.; supervision, H.-Y.T.; project administration, H.-Y.T.; funding acquisition, H.-Y.T. All authors have read and agreed to the published version of the manuscript.

Funding

We would like to thank the Shei-Pa National Park Headquarters for financially supporting this study under contract No. 10202 (PG10201-0504).

Institutional Review Board Statement

Not applicable.

Informed Consent Statement

Not applicable.

Data Availability Statement

Data recorded in the current study are available in all Tables and Figures of the manuscript.

Acknowledgments

We also acknowledge all members of Syue LTER and Lin CY for GIS technology help.

Conflicts of Interest

The authors declare that they have no known competing financial interests or personal relationships that could have influenced the work reported in this paper.

Appendix A

Figure A1. Photo of the study area at Mt. Xue. (a) Because of careless use, fire occurred on the night of 18 December 2008. (b) Until September 2009, most populations were in recovery. (c) The main fire type that occurred in the study site was low-intensity surface fire. Thus, most species kept a healthy root structure under the fire disturbance. (d) Numerous hikers camped on the mountain, which also increased the fire occurrence.
Fire 07 00021 g0a1
Table A1. The records of fire at shrub grassland near Hut 369 of Mt. Xue in Taiwan.
Fire PeriodsReferenceCause
1903~1957[51]unknown
1957~1958
2008http://news.ltn.com.tw/news/life/paper/267022 (accessed on 16 December 2023) artificial
2014https://news.ltn.com.tw/news/society/paper/748572 (accessed on 16 December 2023)artificial
2019https://news.ltn.com.tw/news/life/breakingnews/2692421 (accessed on 16 December 2023)artificial

References

  1. Coop, J.D.; Massatti, R.T.; Schoettle, A.W. Subalpine vegetation pattern three decades after stand-replacing fire: Effects of landscape context and topography on plant community composition, tree regeneration, and diversity. J. Veg. Sci. 2010, 21, 472–487. [Google Scholar] [CrossRef]
  2. Turner, M.G.; Braziunas, K.H.; Hansen, W.D.; Harvey, B.J. Short-interval severe fire erodes the resilience of subalpine lodgepole pine forests. Proc. Natl. Acad. Sci. USA 2019, 116, 11319–11328. [Google Scholar] [CrossRef] [PubMed]
  3. Bashirzadeh, M.; Abedi, M.; Shefferson, R.P.; Farzam, M. Post-Fire Recovery of Plant Biodiversity Changes Depending on Time Intervals since Last Fire in Semiarid Shrublands. Fire 2023, 6, 103. [Google Scholar] [CrossRef]
  4. Tilman, D. Resource Competition and Community Structure. In Monographs in Population Biology; Princeton University Press: Princeton, NJ, USA, 1982; Volume 17, pp. 1–296. [Google Scholar]
  5. Lu, K.C. Effects of Wildfires on the Main Forest Ecosystems in Taiwan. Ph.D. Thesis, National Chung-Hsing University, Taichung, Taiwan, 1989. [Google Scholar]
  6. Lai, G.S. Dynamic Structures of Ecotones between Subalpine Coniferous forests and Grasslands in Taiwan. Ph.D. Thesis, National Chung-Hsing University, Taichung, Taiwan, 1992. [Google Scholar]
  7. Lai, G.S. The fire ecology of subalpine in Taiwan. In Seminar of Fire Ecology and Management; Forestry Bureau: Taipei, Taiwan, 2003; pp. 49–52. [Google Scholar]
  8. Overbeck, G.E.; Müller, S.C.; Pillar, V.D.; Pfadenhauer, J. Small-scale dynamics after fire in South Brazilian humid subtropical grassland. J. Veg. Sci. 2005, 16, 655–664. [Google Scholar] [CrossRef]
  9. Wang, W.; Tsai, S.T.; Chiu, C.A.; Hsu, C.K.; Tzeng, H.Y.; Lu, K.C. Species and life-form diversity along the altitudinal gradient on the Mt. Shei Eastern Trail. Q. J. For. Res. 2013, 5, 139–152. [Google Scholar]
  10. Su, H.J. Studies on the climate and vegetation types of the natural forests in Taiwan. (II). Altitudinal vegetation zones in relation to temperature gradient. Q. J. Chin. For. 1984, 17, 57–73. [Google Scholar]
  11. Wang, W.; Chiu, C.A.; Tsai, S.T.; Hsu, C.K.; Tzeng, H.Y.; Lu, K.C. Vegetation research along the East Trail of Mt. Shei. Q. J. For. Res. 2011, 32, 15–34. [Google Scholar] [CrossRef]
  12. Liu, Y.Y.; Lu, F.Y.; Ou, C.H.; Lai, G.S. Plant succession and competition mechanism of Yushania niitakayamensis at alpine in Taiwan. Q. J. Chin. For. 1984, 17, 1–32. [Google Scholar]
  13. McGill, B.J.; Etienne, R.S.; Gray, J.S.; Alonso, D.; Anderson, M.J.; Benecha, H.K.; Dornelas, M.; Enquist, B.J.; Green, J.L.; He, F.; et al. Species abundance distributions: Moving beyond single prediction theories to integration within an ecological framework. Eco. Lett. 2007, 10, 995–1015. [Google Scholar] [CrossRef]
  14. Fisher, R.A.; Corbet, A.S.; Williams, C.B. The relation between the number of species and the number of individuals in a random sample of an animal population. J. Anim. Ecol. 1943, 12, 42–58. [Google Scholar] [CrossRef]
  15. MacArthur, R.H. On the relative abundance of bird species. Proc. Natl. Acad. Sci. USA 1957, 43, 293–295. [Google Scholar] [CrossRef]
  16. Zhang, J.T. Quantitative Ecology; Science Press: Beijing, China, 2004; pp. 1–370. [Google Scholar]
  17. Yin, Z.Y.; Ren, H.; Peng, S.L.; Guo, Q.F.; Zeng, L.H.; He, X. Dynamics and modeling of species abundance distribution during natural restoration of degraded hilly grassland in south China. Ecol. Environ. Sci. 2009, 1, 222–228. [Google Scholar] [CrossRef]
  18. Li, Q.; Tu, J.; Xiong, Z.P.; Lu, Z.X.; Liu, C.J. Survey of research on species abundance pattern. J. Yunnan Agric. Univ. 2011, 26, 117–123. [Google Scholar]
  19. Tsai, S.T.; Lu, K.C.; Tzeng, H.Y. Analyzing vegetation dynamics of the broad-leaved secondary forest by species abundance models at Mt. Showchu in the Hue-Sun Forest Station. Q. J. For. Res. 2011, 33, 9–22. [Google Scholar] [CrossRef]
  20. Huang, L.; Yang, H.; An, X.; Yu, Y.; Yu, L.; Huang, G.; Liu, X.; Chen, M.; Xue, Y. Species Abundance Distributions Patterns between Tiankeng Forests and Nearby Non-Tiankeng Forests in Southwest China. Diversity 2022, 14, 64. [Google Scholar] [CrossRef]
  21. Zang, Z.; Zeng, Y.; Wang, D.; Shi, F.; Dong, Y.; Liu, N.; Liang, Y. Species-Abundance Distribution Patterns of Plant Communities in the Gurbantünggüt Desert, China. Sustainability 2022, 14, 12957. [Google Scholar] [CrossRef]
  22. Antão, L.H.; Magurran, A.E.; Dornelas, M. The Shape of Species Abundance Distributions Across Spatial Scales. Front. Ecol. Evol. 2021, 9, 626730. [Google Scholar] [CrossRef]
  23. Cheng, J.J.; Mi, X.C.; Ma, K.P.; Zhang, J.T. Responses of species-abundance distribution to varying sampling scales in a subtropical broad-leaved forest. Biodivers. Sci. 2011, 19, 168–177. [Google Scholar] [CrossRef]
  24. Wilson, J.B.; Wells, T.C.E.; Trueman, C.; Jones, G.; Atkinson, M.D.; Crawley, M.J.; Dodd, M.E.; Silvertown, J. Are there assembly rules for plant species abundance: An investigation in relation to soil resources and successional trends. J. Eco. 1996, 84, 527–538. [Google Scholar] [CrossRef]
  25. Central Weather Bureau. 2022. Available online: https://www.cwb.gov.tw/V8/C/ (accessed on 31 December 2022).
  26. Ho, C.S. Geological Introduction of Taiwan; Central Geological Survey (MOEA): Taipei, Taiwan, 2003; pp. 1–163. [Google Scholar]
  27. Yen, C.H. Soil properties of alpine in Xue Mountain. In Alpine Ecosystem Integrative Survey in Xue Mountain; Lu, K.C., Ou, C.H., Eds.; Shei-Pa National Park Headquarters: Miaoli, Taiwan, 2009; Chapter 3; pp. 1–30. [Google Scholar]
  28. Cheng, T.W.; Tzeng, H.Y.; Chiu, C.A.; Liu, S.Q.; Wang, C.M.; Tseng, Y.H. Studies on the life form of vascular plants along the East Trail of Xue Mountain. J. Nat. Park 2012, 22, 41–51. [Google Scholar]
  29. Wu, C.Y.; Tzeng, H.Y.; Qiu, Q.A.; Wang, C.M.; Liu, S.C.; Tseng, Y.H. Flowering phenology of East Xue Trail of Xue Mountain. Q. J. For. Res. 2013, 35, 223–240. [Google Scholar]
  30. Wilson, J.B. Methods for fitting dominance/diversity curves. J. Veg. Sci. 1991, 2, 35–46. [Google Scholar] [CrossRef]
  31. Tang, Z.Y.; Fang, J.Y. A review on the elevational patterns of plant species diversity. Sheng Wu Duo Yang Xing 2004, 12, 20–28. [Google Scholar] [CrossRef]
  32. Liu, T.S.; Su, H.J. Forest Ecology; The Commercial Press: Taipei, Taiwan, 1983; pp. 1–462. [Google Scholar]
  33. Midgley, J.J. Why the world’s vegetation is not totally dominated by resprouting plants; because resprouters are shorter than reseeders. Ecography 1996, 19, 92–95. Available online: https://www.jstor.org/stable/3683094 (accessed on 10 October 2023). [CrossRef]
  34. Hughes, R.G. Theories and models of species abundance. Am. Nat. 1986, 128, 879–899. Available online: https://www.jstor.org/stable/2461769 (accessed on 10 October 2023). [CrossRef]
  35. Motomura, I. A statistical treatment of associations. Jpn. J. Zool. 1932, 44, 379–383. Available online: https://cir.nii.ac.jp/crid/1570009750645470336 (accessed on 10 October 2023).
  36. Preston, F.W. The commonness and rarity of species. Ecology 1948, 29, 254–283. [Google Scholar] [CrossRef]
  37. May, R.M. Patterns of species abundance and diversity. In Ecology and Evolution of Communities; Lody, M.L., Diamond, J.M., Eds.; Harvard University Press: Cambridge, MA, USA, 1975; pp. 81–120. [Google Scholar]
  38. Barange, M.; Campos, B. Models of species abundance: A critique of and an alternative to the dynamics model. Mar. Ecol. Prog. Ser. 1991, 69, 293–298. Available online: https://digital.csic.es/bitstream/10261/281973/1/Barange_et_al_1991.pdf (accessed on 10 October 2023). [CrossRef]
  39. Frontier, S. Diversity and structure in aquatic ecosystems. Oceanogr. Mar. Biol. 1985, 23, 253–312. [Google Scholar]
  40. Moradizadeh, H.; Heydari, M.; Omidipour, R.; Mezbani, A.; Prévosto, B. Ecological effects of fire severity and time since fire on the diversity partitioning, composition and niche apportionment models of post-fire understory vegetation in semi-arid oak forests of Western Iran. Ecol. Eng. 2020, 143, 105694. [Google Scholar] [CrossRef]
  41. Bell, D.T. Ecological response syndromes in the flora of southwestern Western Australia: Fire resprouters versus reseeders. Bot. Rev. 2001, 67, 417–440. [Google Scholar] [CrossRef]
  42. Sritharan, M.S.; Scheele, B.C.; Blanchard, W.; Foster, C.N.; Werner, P.A.; Lindenmayer, D.B. Plant rarity in fire-prone dry sclerophyll communities. Sci. Rep. 2022, 12, 12055. [Google Scholar] [CrossRef] [PubMed]
  43. Vogl, R.J. Effects of fire on grasslands. In Fire and Ecosystems; Kozlowski, T.T., Ahlgren, C.E., Eds.; Academic: New York, NY, USA, 1974; pp. 139–194. [Google Scholar]
  44. Connell, J.H. Diversity in tropical rain forest and coral reefs. Science 1978, 199, 1302–1310. [Google Scholar] [CrossRef] [PubMed]
  45. Huston, M.A. A general hypothesis of species diversity. Am. Nat. 1979, 113, 81–101. Available online: https://www.jstor.org/stable/2459944 (accessed on 10 October 2023). [CrossRef]
  46. Denslow, J.S. Gap partitioning among tropical rainforest trees. Biotropica 1980, 12, 47–55. [Google Scholar] [CrossRef]
  47. Lin, C.C.; Chiou, C.R.; Chou, C.Y. Identifying and evaluating fire severity: A case study of the Wulin fire. Taiwan J. For. Sci. 2014, 20, 203–213. [Google Scholar] [CrossRef]
  48. Pan, C.C.; Tseng, Y.H.; Chiu, C.A.; Tzeng, H.Y. Phenology of Rhododendron pseudochrysanthum in Mt. Xue. Q. J. For. Res. 2013, 35, 71–86. [Google Scholar]
  49. Deng, N.; Song, Q.; Ma, F.; Tian, Y. Patterns and Driving Factors of Diversity in the Shrub Community in Central and Southern China. Forests 2022, 13, 1090. [Google Scholar] [CrossRef]
  50. Chiarucci, A.; Wilson, J.B.; Anderson, B.J.; De Dominicis, V. Cover versus biomass as an estimate of species abundance: Does it make a difference to the conclusions? J. Veg. Sci. 1999, 10, 35–42. [Google Scholar] [CrossRef]
  51. Chen, M.Y.; Shih, Y.Y. Studies on the effects of wildfires on the vegetation at Fansan and Shesan areas. Nat. Park J. 1999, 8, 155–165. [Google Scholar]
Figure 1. Location and climate diagram of the postfire study area in the shrub grasslands near 369 Hut on Xue Mountain in Taiwan.
Fire 07 00021 g001
Figure 2. Postfire sample areas set up in the shrub grasslands near 369 Hut on Xue Mountain. (a) System samples were presented as a square; (b) every subplot set as a 3 × 3 m2, survey area were located on corners (green square); (c) postfire region near the 369 Hut on Xue Mountain; (d) most fire regions below the Taiwan fir forest.
Fire 07 00021 g002
Figure 3. Postfire periods of vegetation coverage-number of species distributions in the sample area. The x-axis represents the logarithmically transformed species coverage, and the y-axis represents the corresponding number of species accumulated in each group of species coverage.
Fire 07 00021 g003
Figure 4. Fitting parameters of the five species-abundance models for the various periods of postfire vegetation coverage in the sample area.
Fire 07 00021 g004
Table 1. Postfire chronological data on the sample shrub grassland near 369 Hut on Xue Mountain.
ParametersSurvey Period
Feb-09Apr-09Sep-09Apr-10Jun-10May-11Jul-11Sep-13Control
Season 1112121222
Number of species51324243627332927
Coverage (%)0.210.9325.9113.1443.9542.4748.4564.80100.00
Phanerophytes (%)0.000.000.005.263.234.176.908.3314.29
Chamaephytes (%)0.0018.1822.7326.3216.1320.8317.248.339.52
Hemicryptophytes (%)75.0054.5554.5552.6361.2954.1758.6266.6757.14
Geophytes (%)25.0027.2722.7315.7919.3520.8317.2416.6719.05
Survival strategy 2100/092/879/2181/1962/3870/3063/3761/3941/59
Ferns quotient6.254.552.272.632.423.132.594.175.71
Gleason index1.012.624.834.837.245.436.645.847.32
Shannon index0.440.571.100.961.110.871.081.031.08
Evenness index0.270.220.350.300.310.260.310.310.33
1 Season represents the spring (1) and summer–autumn (2) seasons. 2 Survival strategies A and B refer to, for A, resprouters and, for B, reseeders.
Table 2. Postfire periods of vegetation coverage of species distributions in the sample area.
Survey PeriodS 1Species-Abundance Models
Broken StickPreemptionLog-NormalZipfZipf–Mandelbrot
Dev.χ2Dev.χ2Dev.χ2Dev.χ2Dev.χ2
Feb-0910.29 0.250.82 2.040.010.010.00 * 0.000.000.01
Apr-0911.15 1.272.42 4.480.03 * 0.030.030.020.040.04
Apr-10125.33 26.3936.14 48.65 26.117.587.048.684.82 * 5.72
May-111111.30 124.90135.84 186.2412.6015.0313.9916.508.59 * 9.68
Sep-09230.67 30.3644.70 54.264.224.507.126.873.84 * 3.64
Jun-10266.53 67.1564.37 69.4611.2211.6417.0116.949.47 * 9.29
Jul-112104.47 25.62115.11 24.236.700.257.980.934.49 * 0.49
Sep-132157.85 68.51184.94 71.8625.431.9427.326.4018.12 * 3.15
Control290.03143.08107.12217.774.0715.383.29 *3.615.8310.19
1 S represents the season(s) of spring (1) and summer–autumn (2). 2 Bold fonts represent significance (p < 0.05). * The best model examined by deviance with the period.
Disclaimer/Publisher’s Note: The statements, opinions and data contained in all publications are solely those of the individual author(s) and contributor(s) and not of MDPI and/or the editor(s). MDPI and/or the editor(s) disclaim responsibility for any injury to people or property resulting from any ideas, methods, instructions or products referred to in the content.

