
Employing Copernicus Land Service and Sentinel-2 Satellite Mission Data to Assess the Spatial Dynamics and Distribution of the Extreme Forest Fires of 2023 in Greece

 , ,
, ,  and
and 
Abstract
1. Introduction
2. Materials and Methods
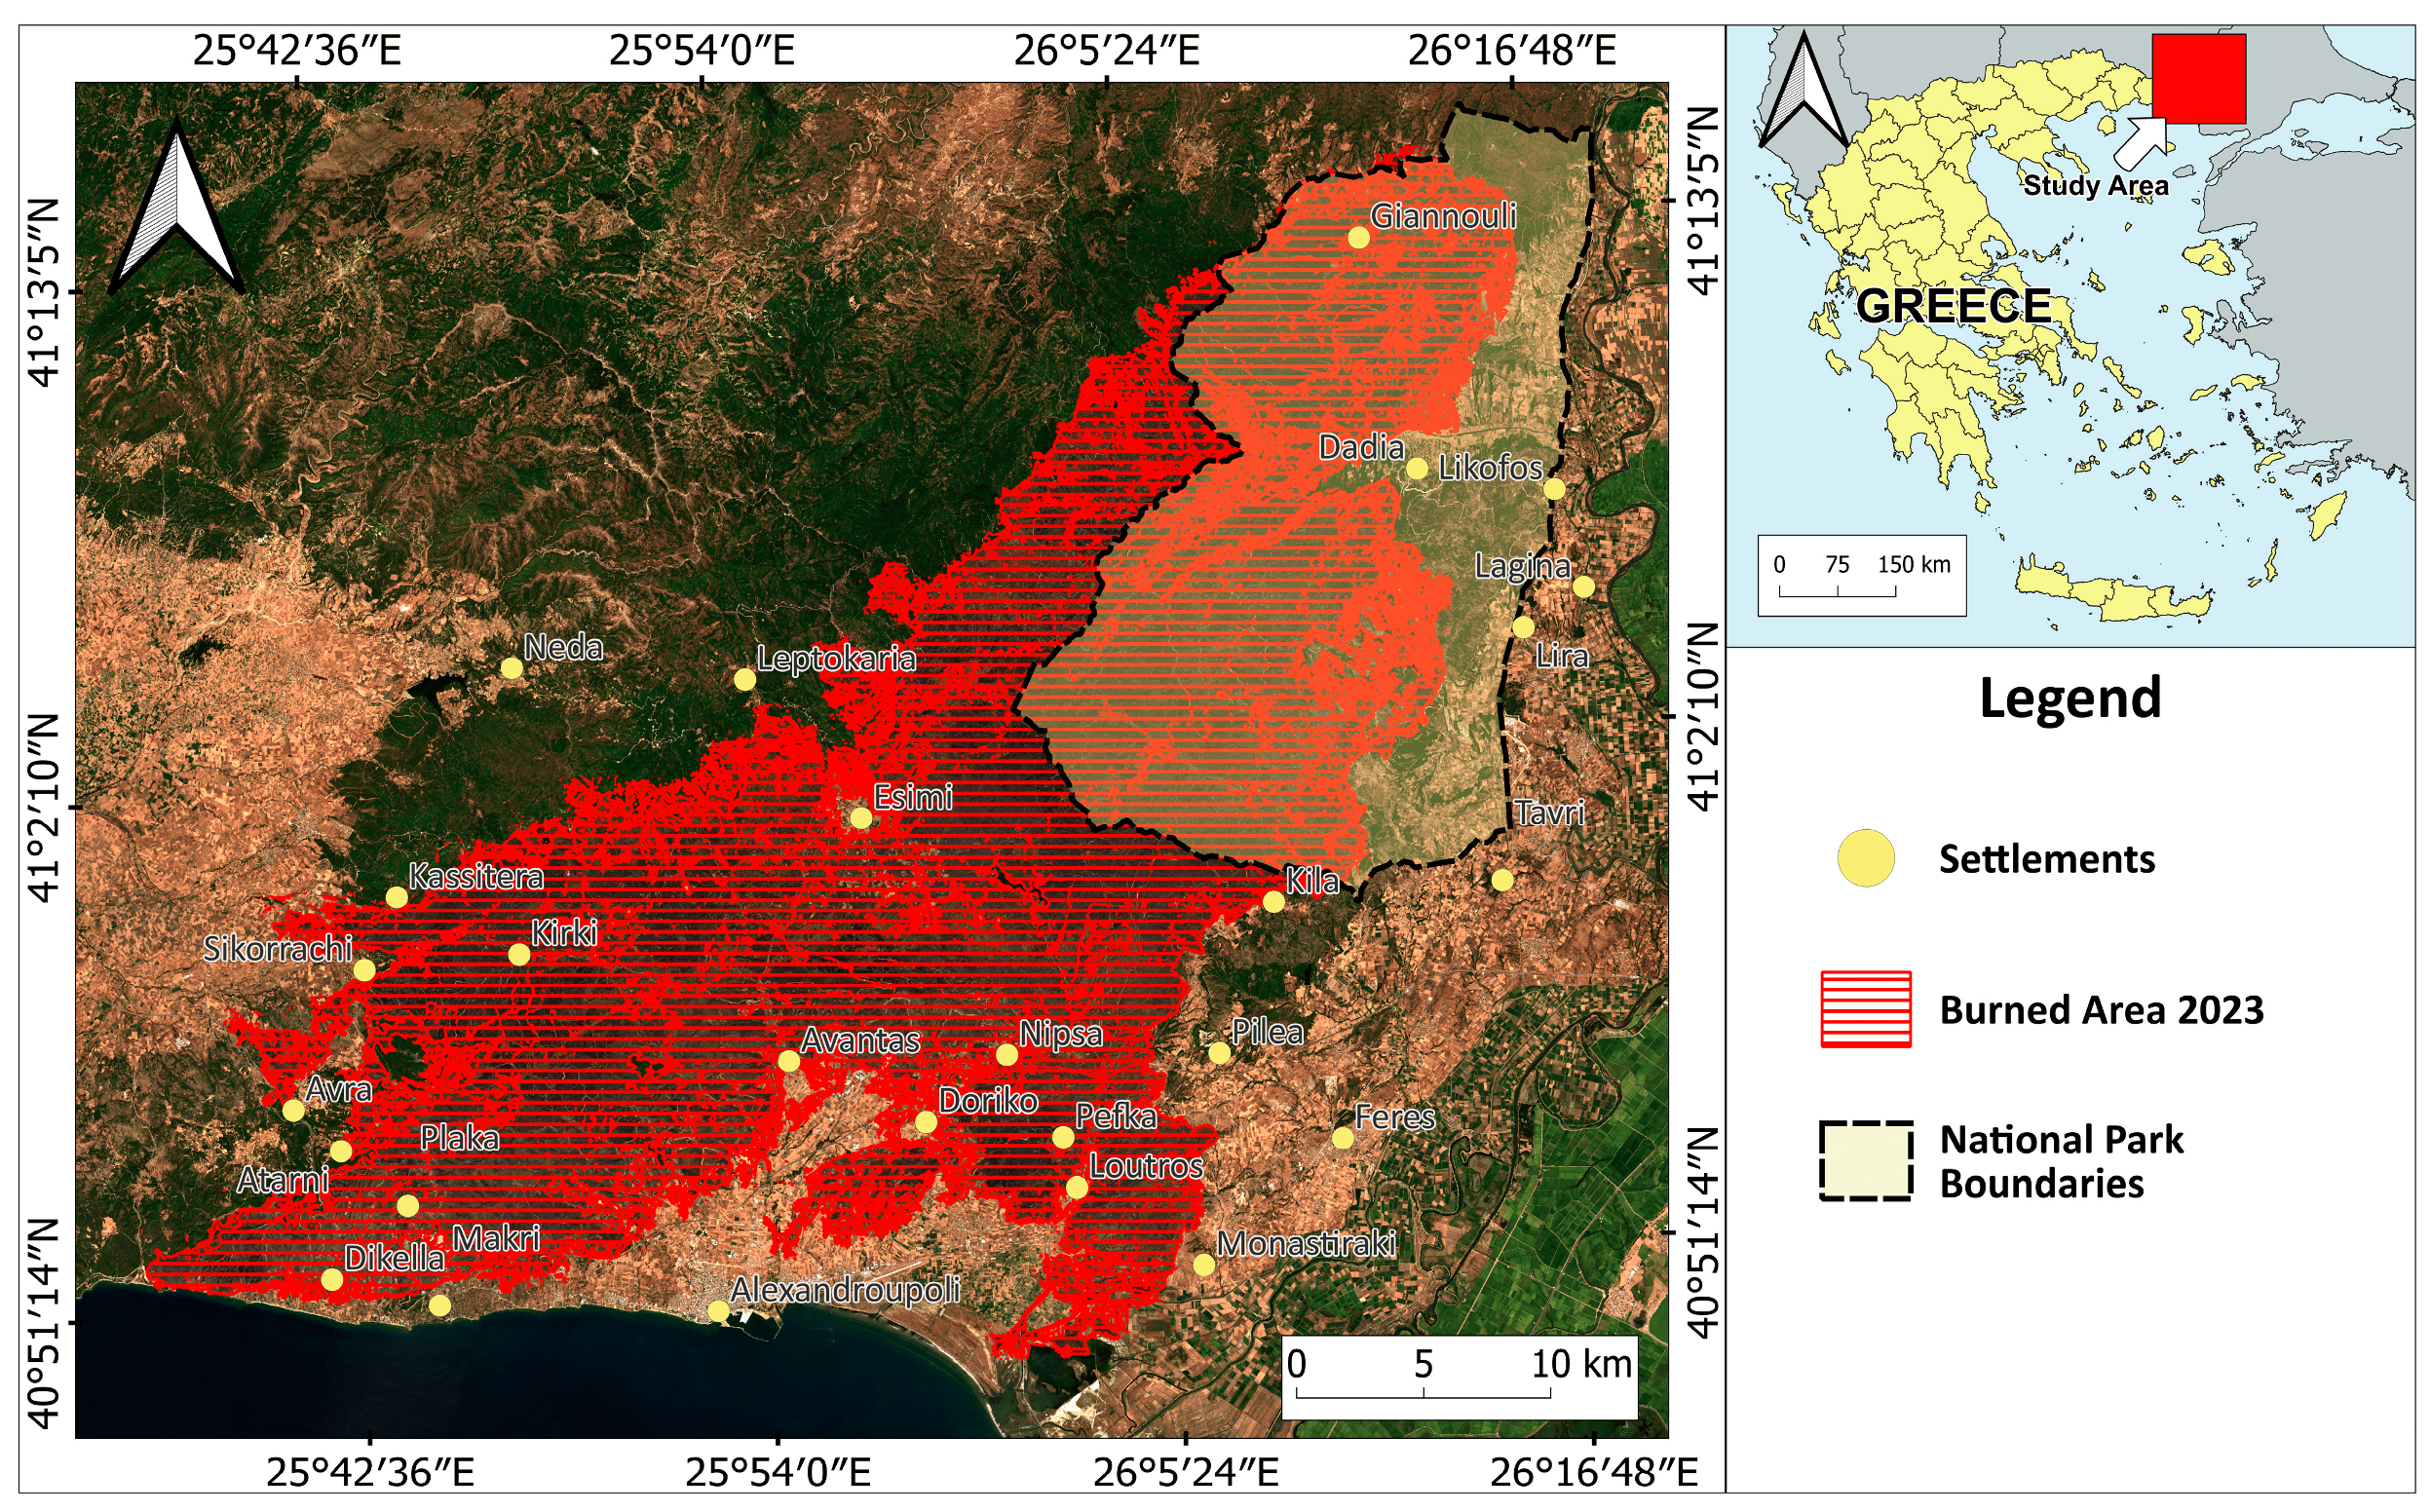
2.1. Study Area
2.2. Data Used
2.3. Methodology

| dNBR Value | Burn Severity |
|---|---|
| 0.099 | Unburned Areas |
| 0.100–0.269 | Low Severity |
| 0.27–0.439 | Moderate–Low Severity |
| 0.440–0.659 | Moderate–High Severity |
| 0.660–1.300 | High Severity |
3. Results
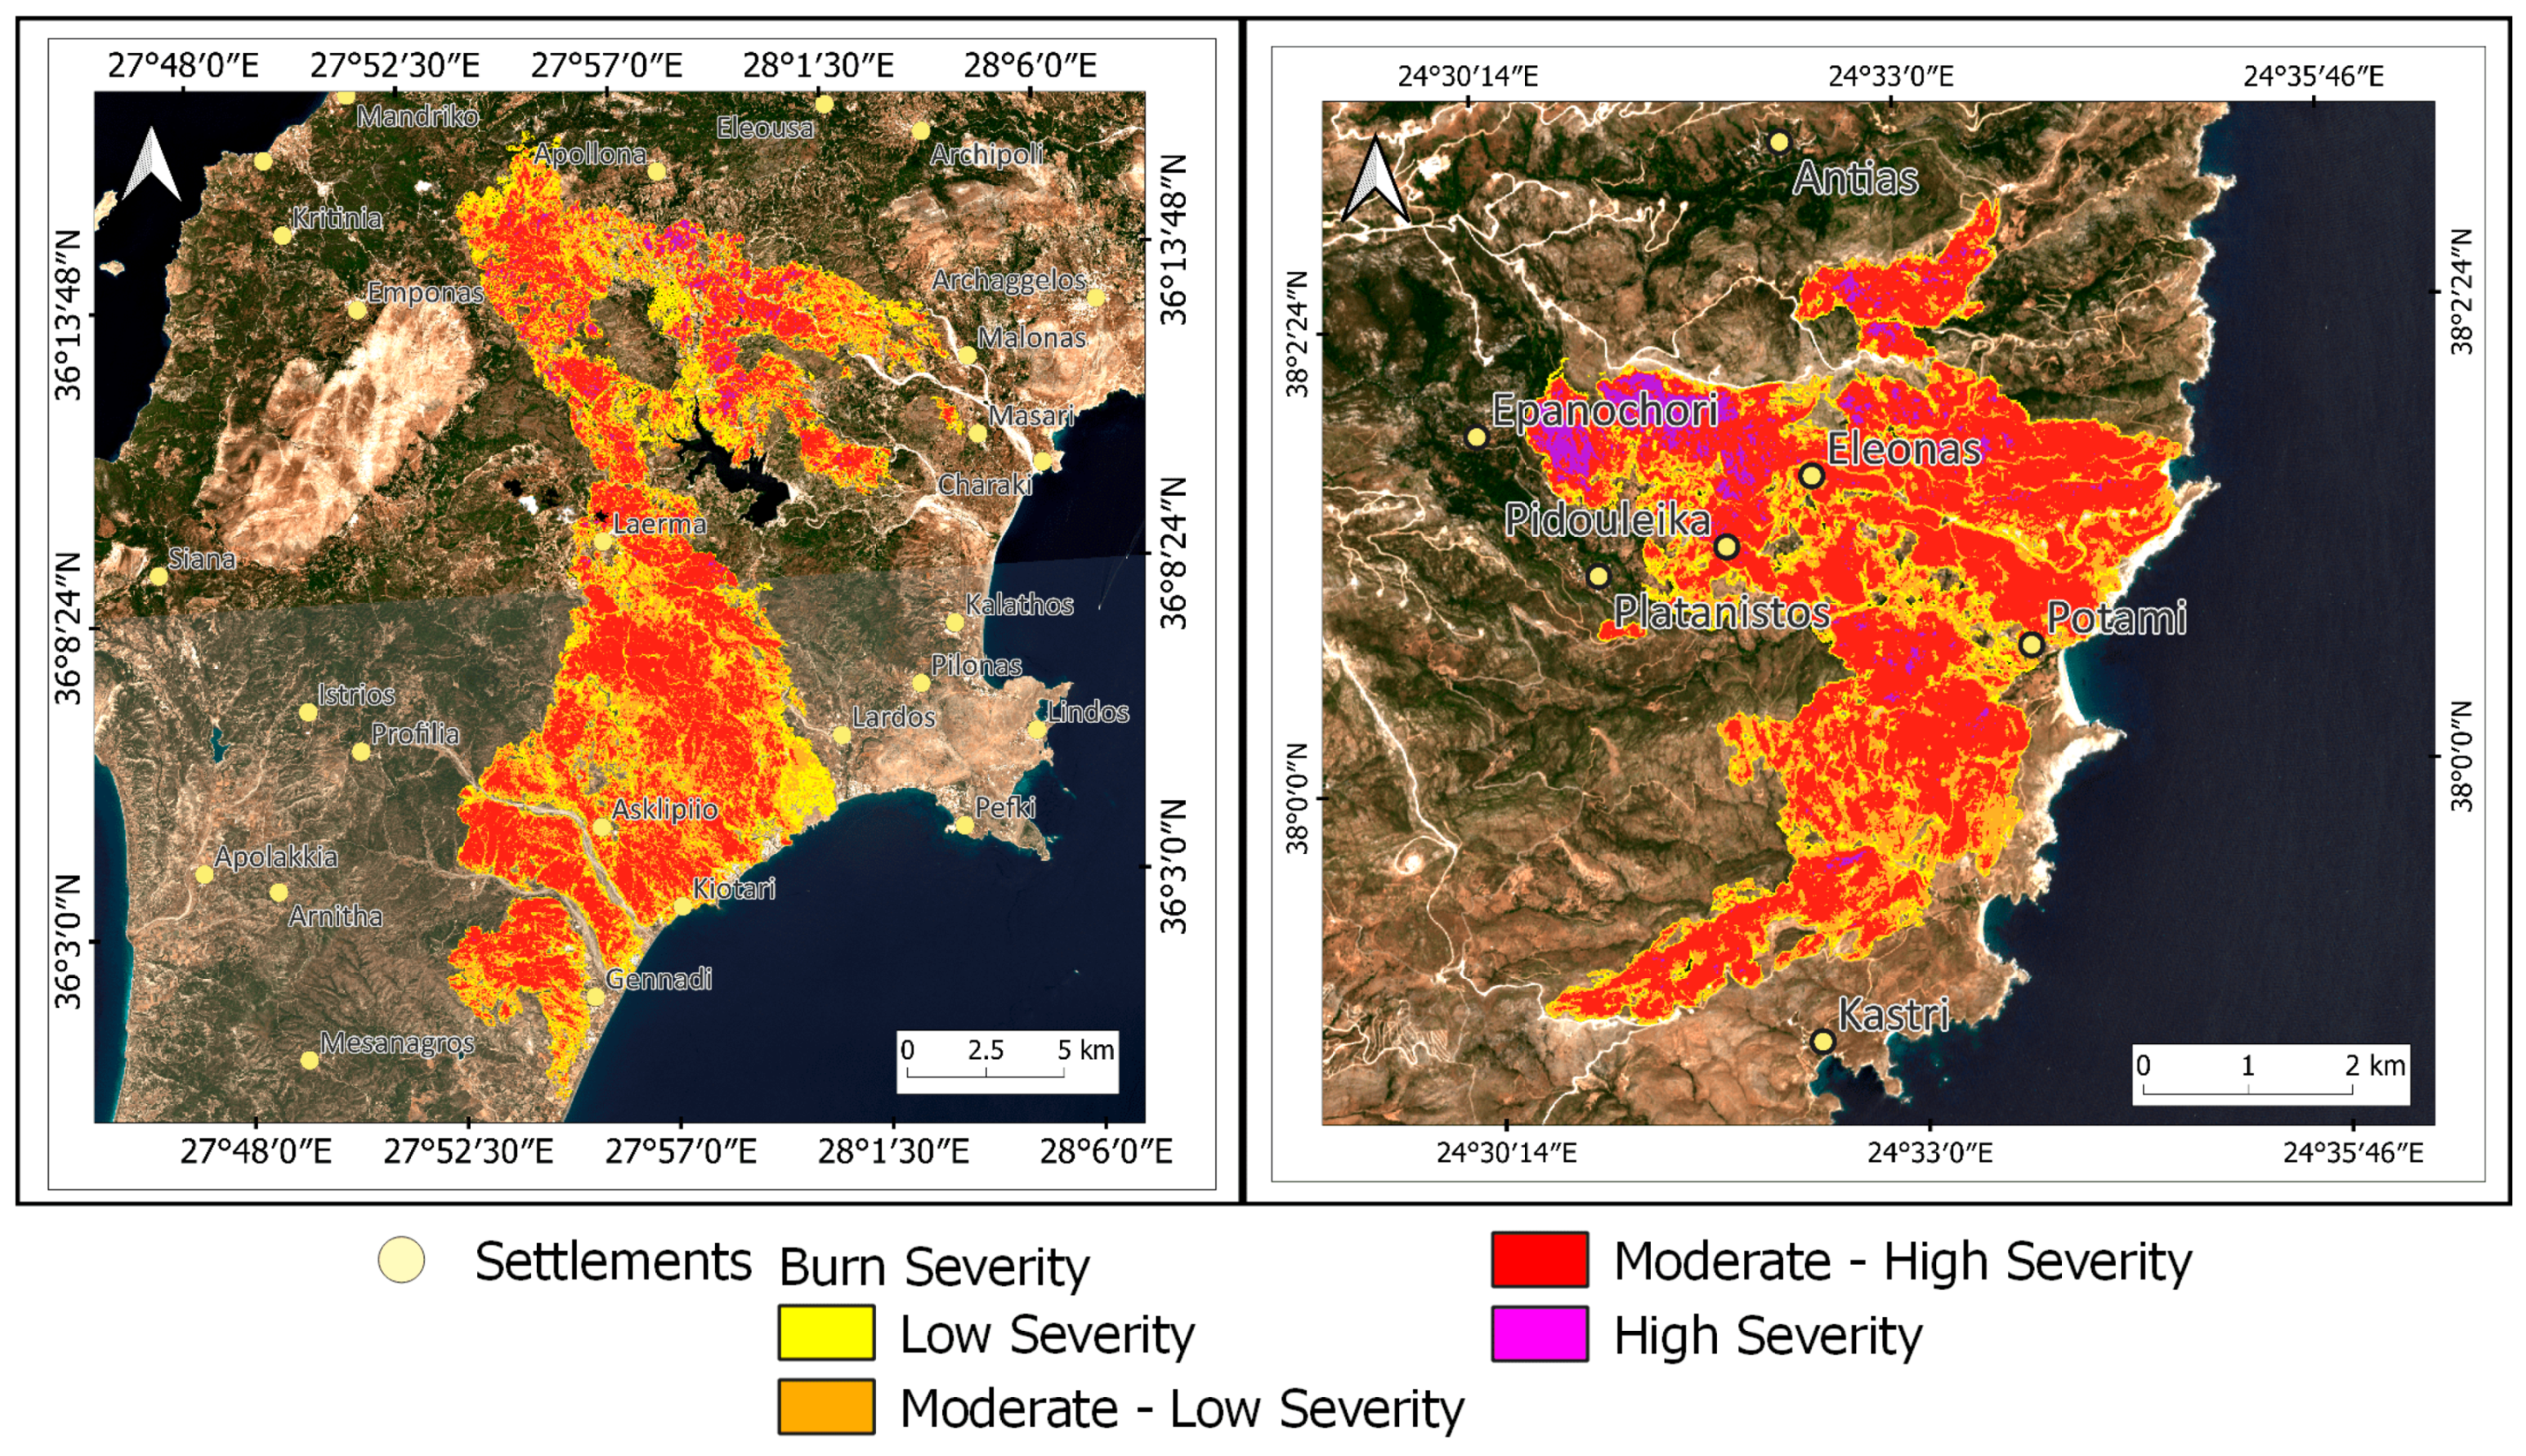
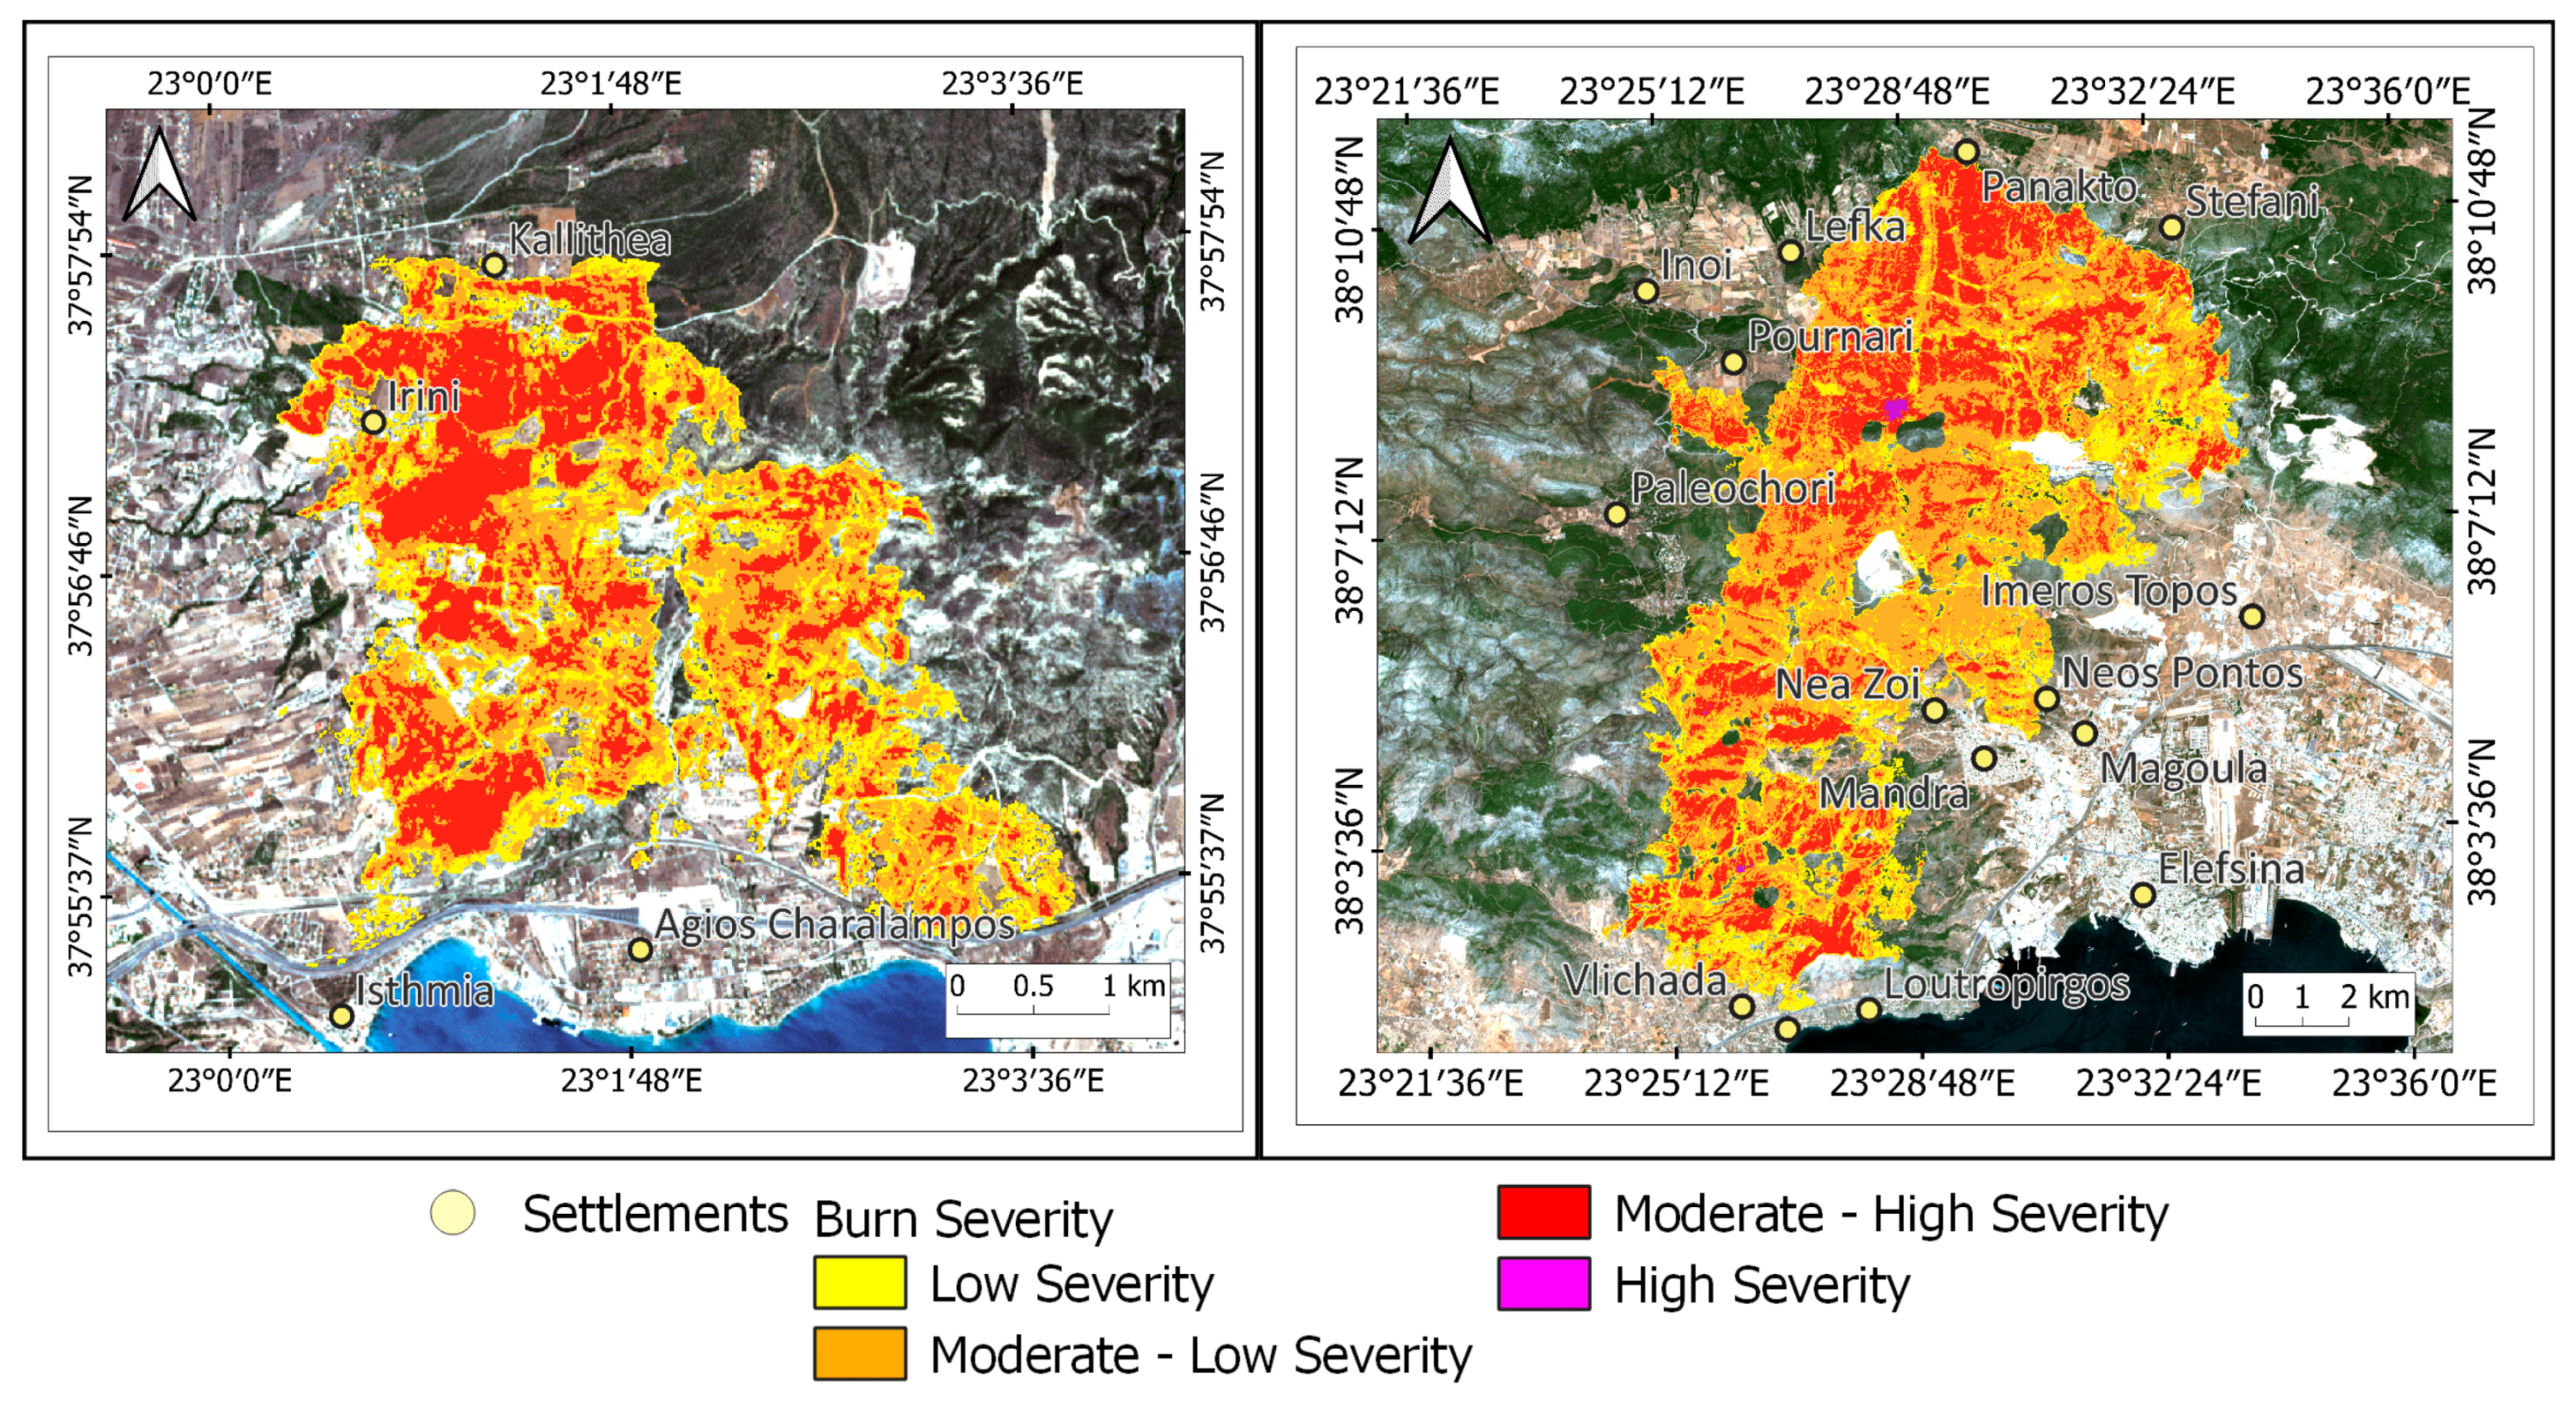
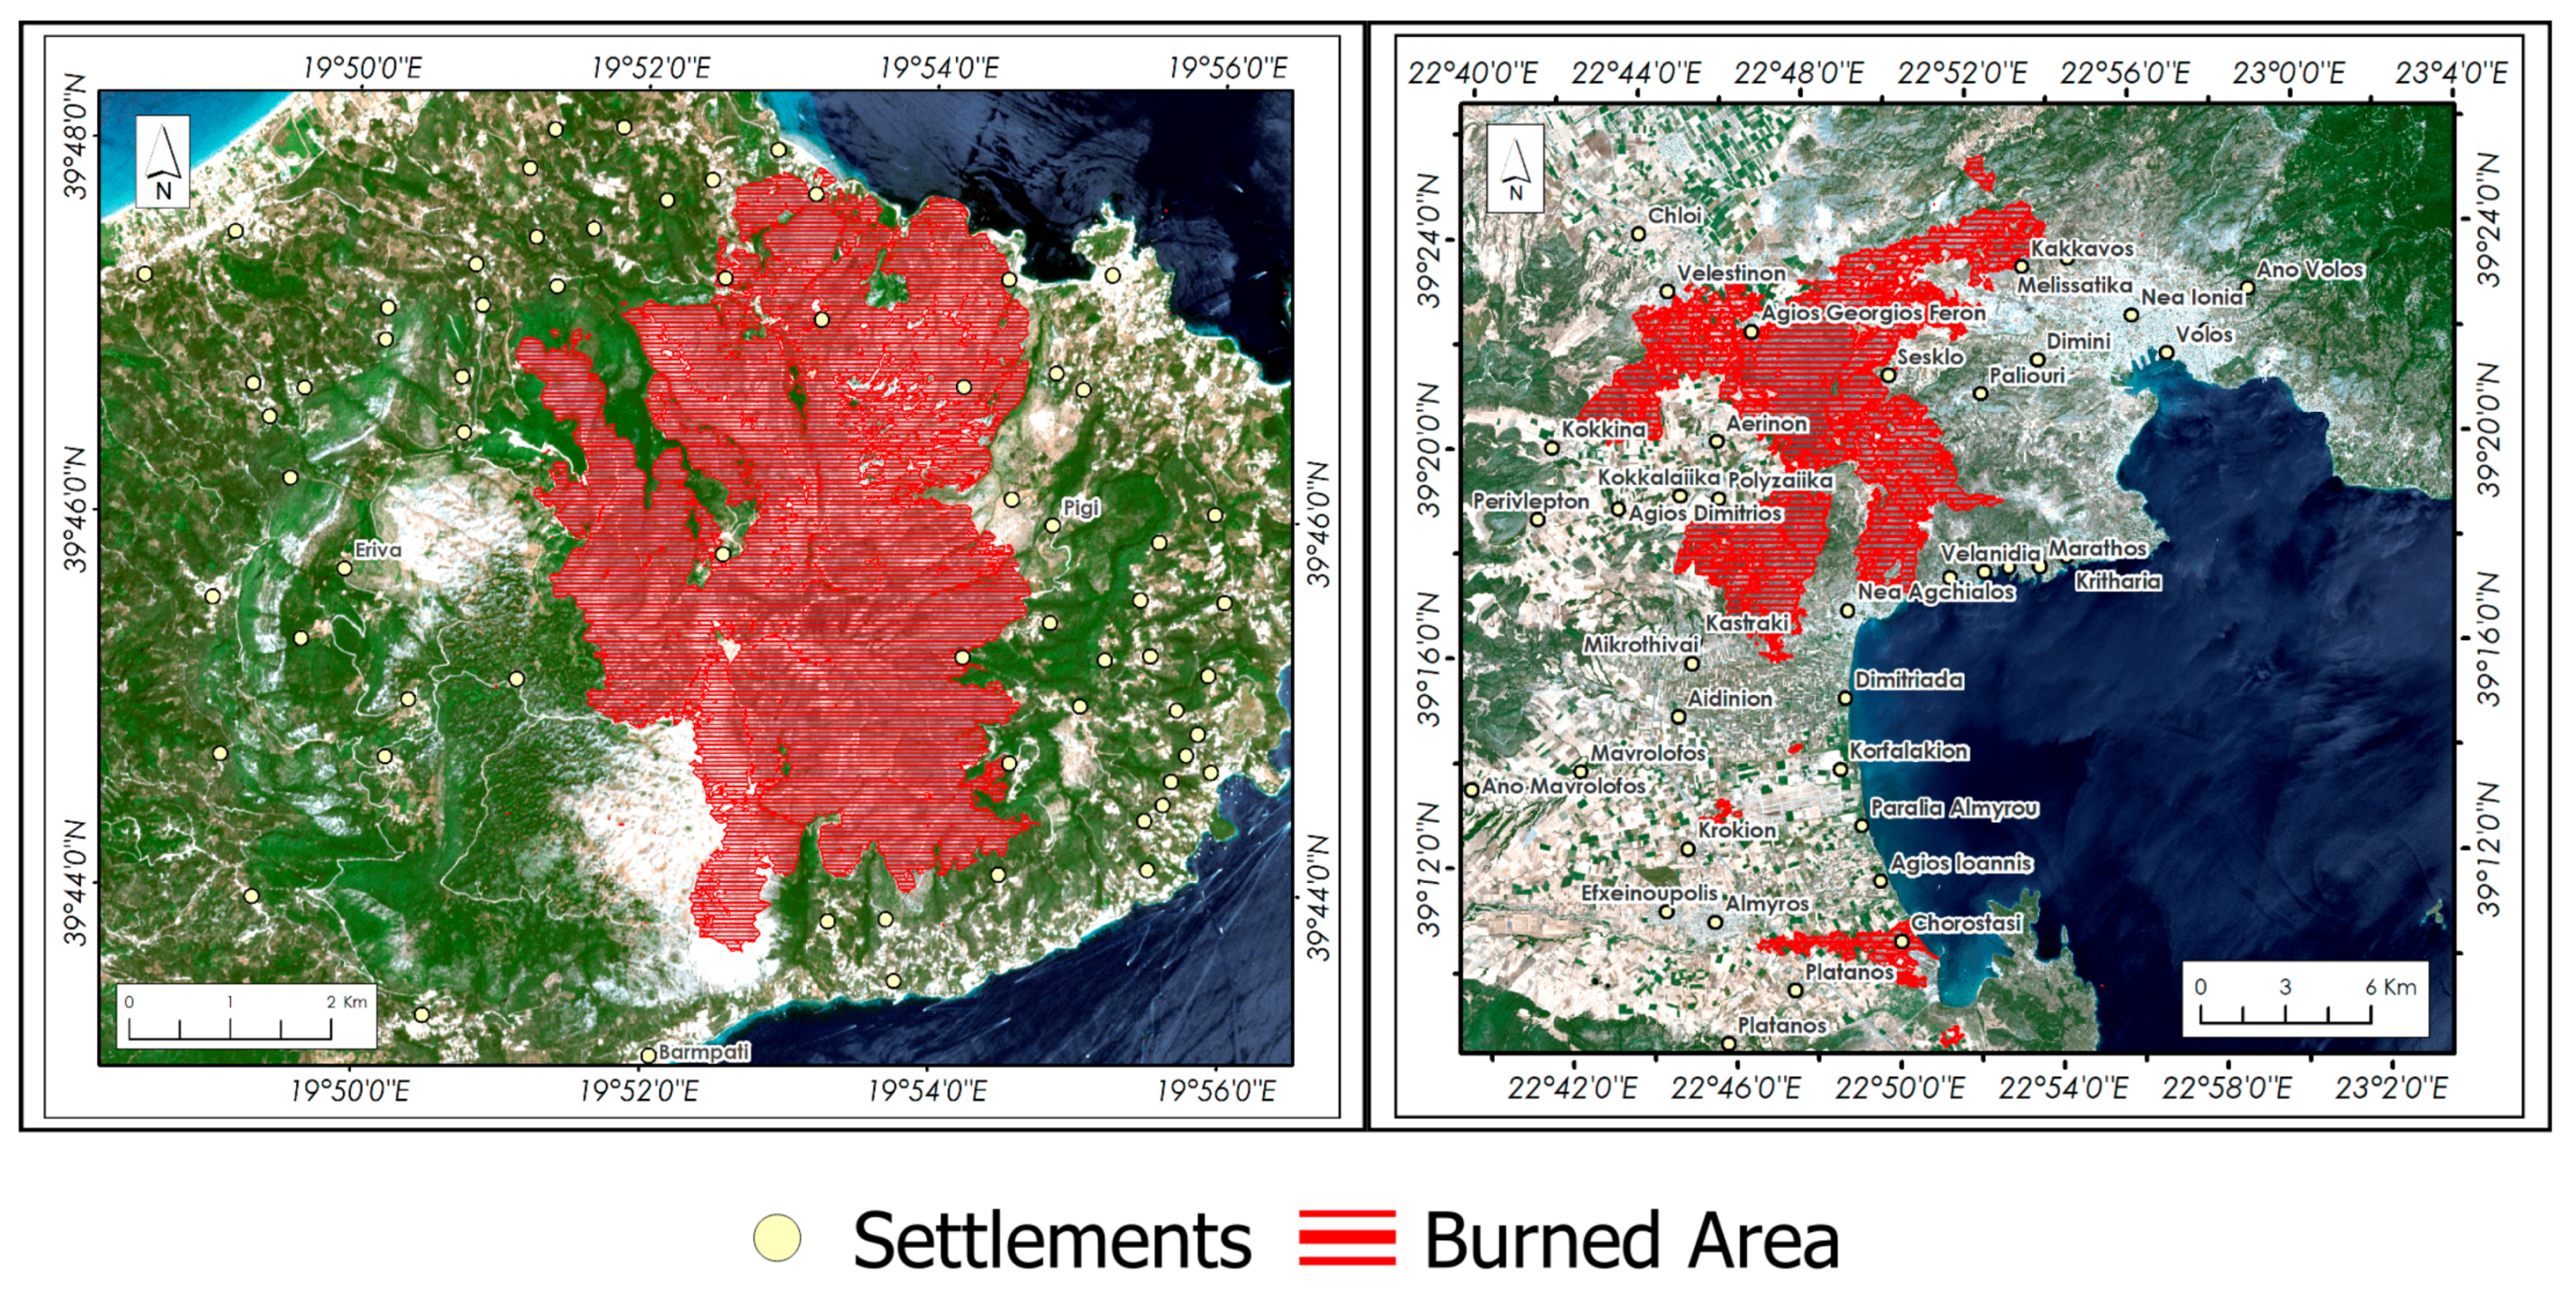
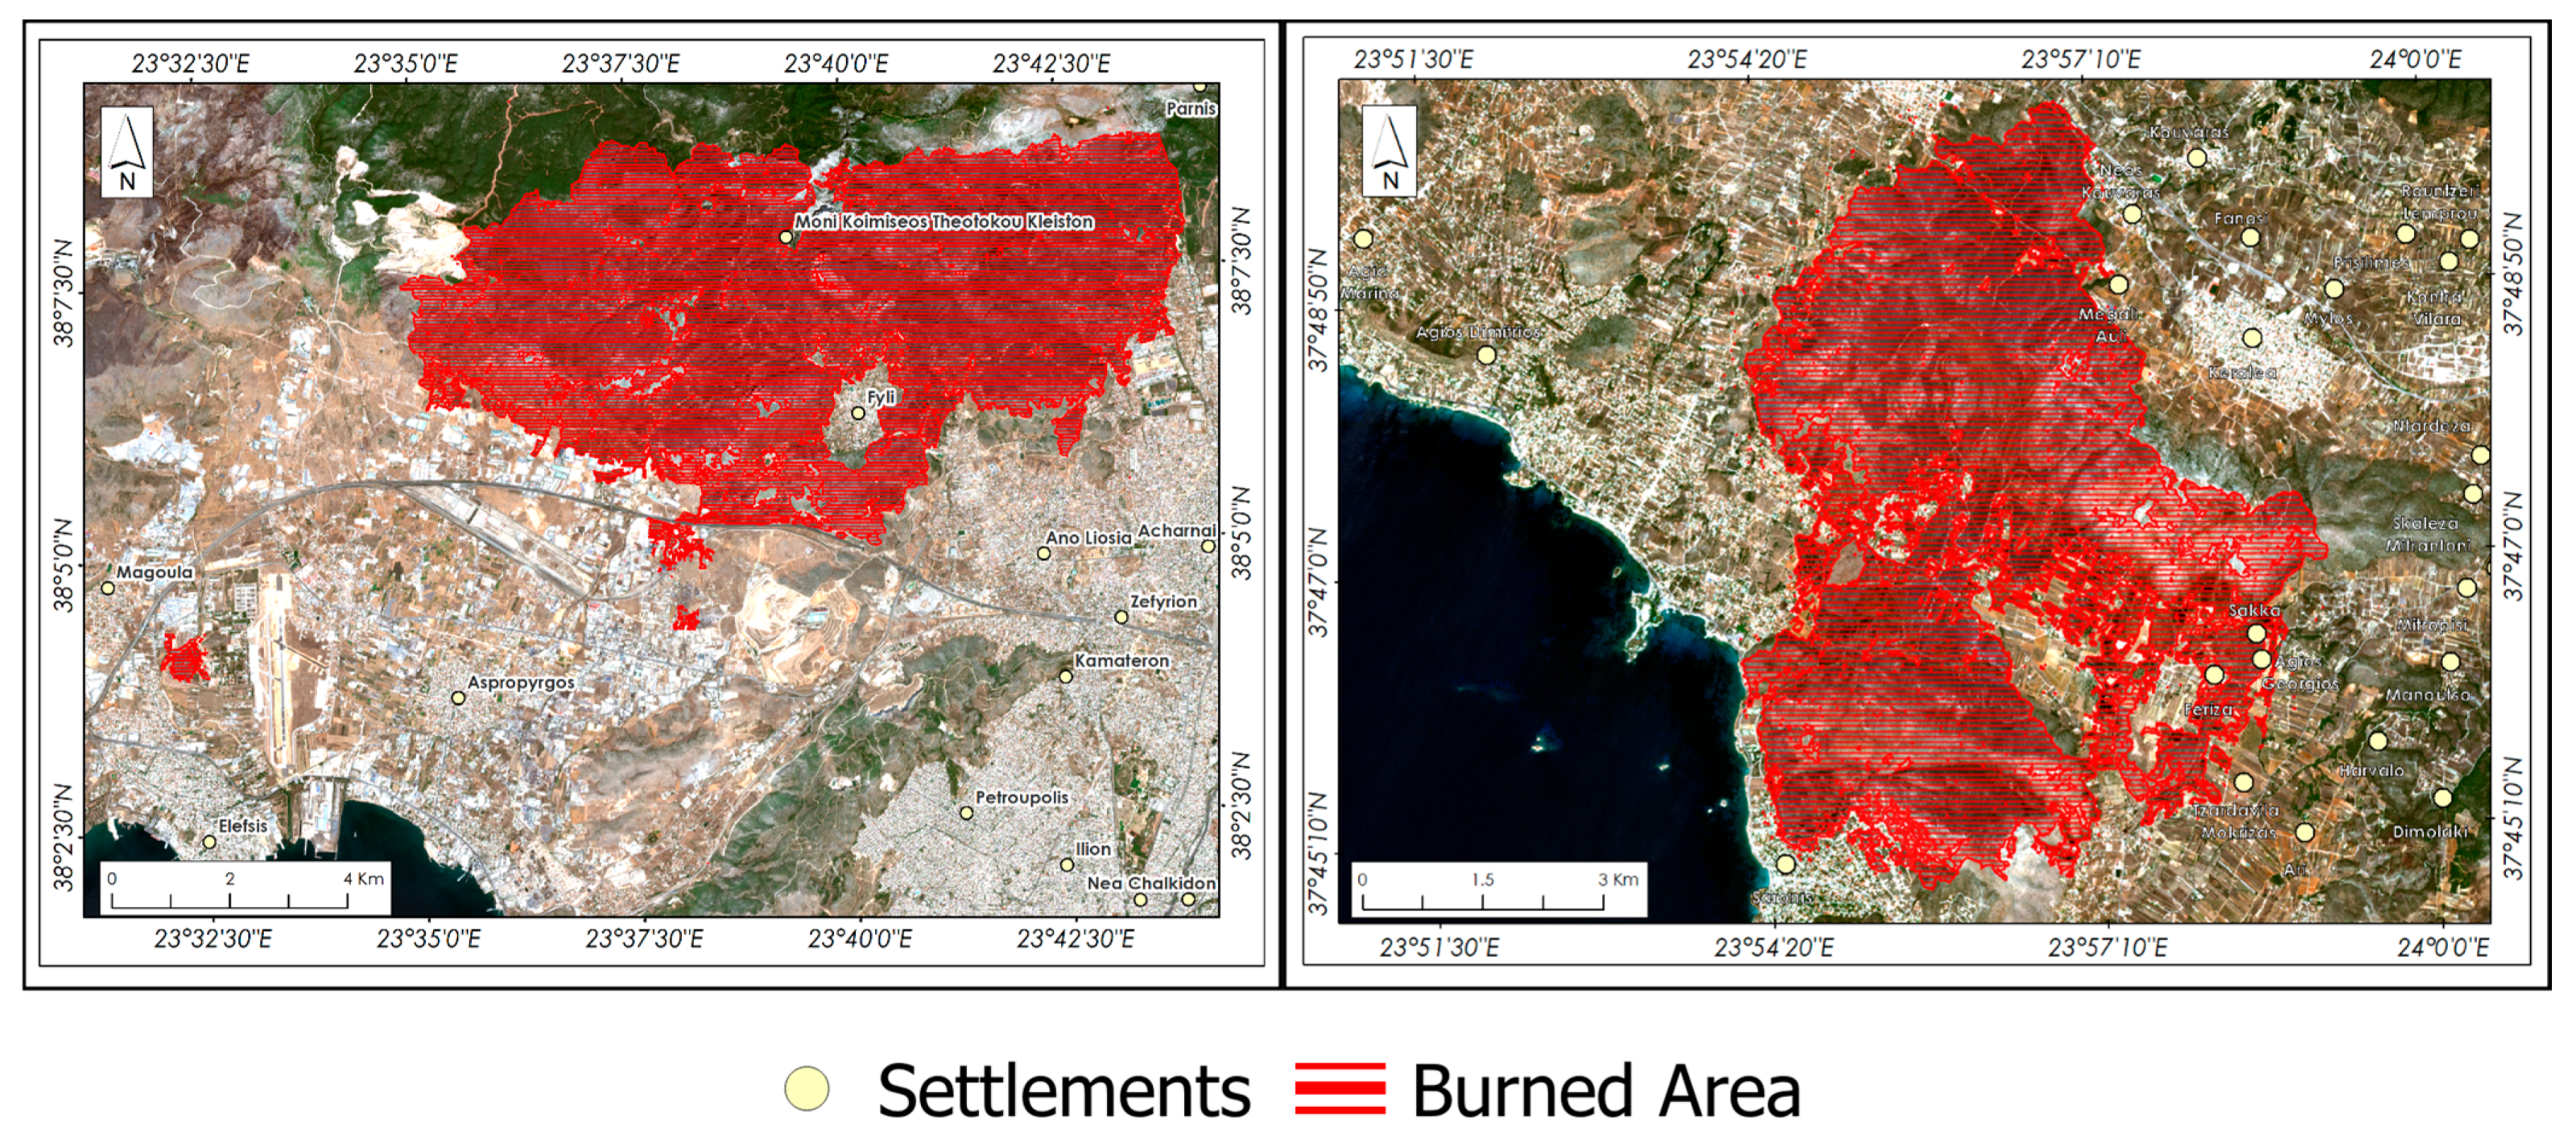
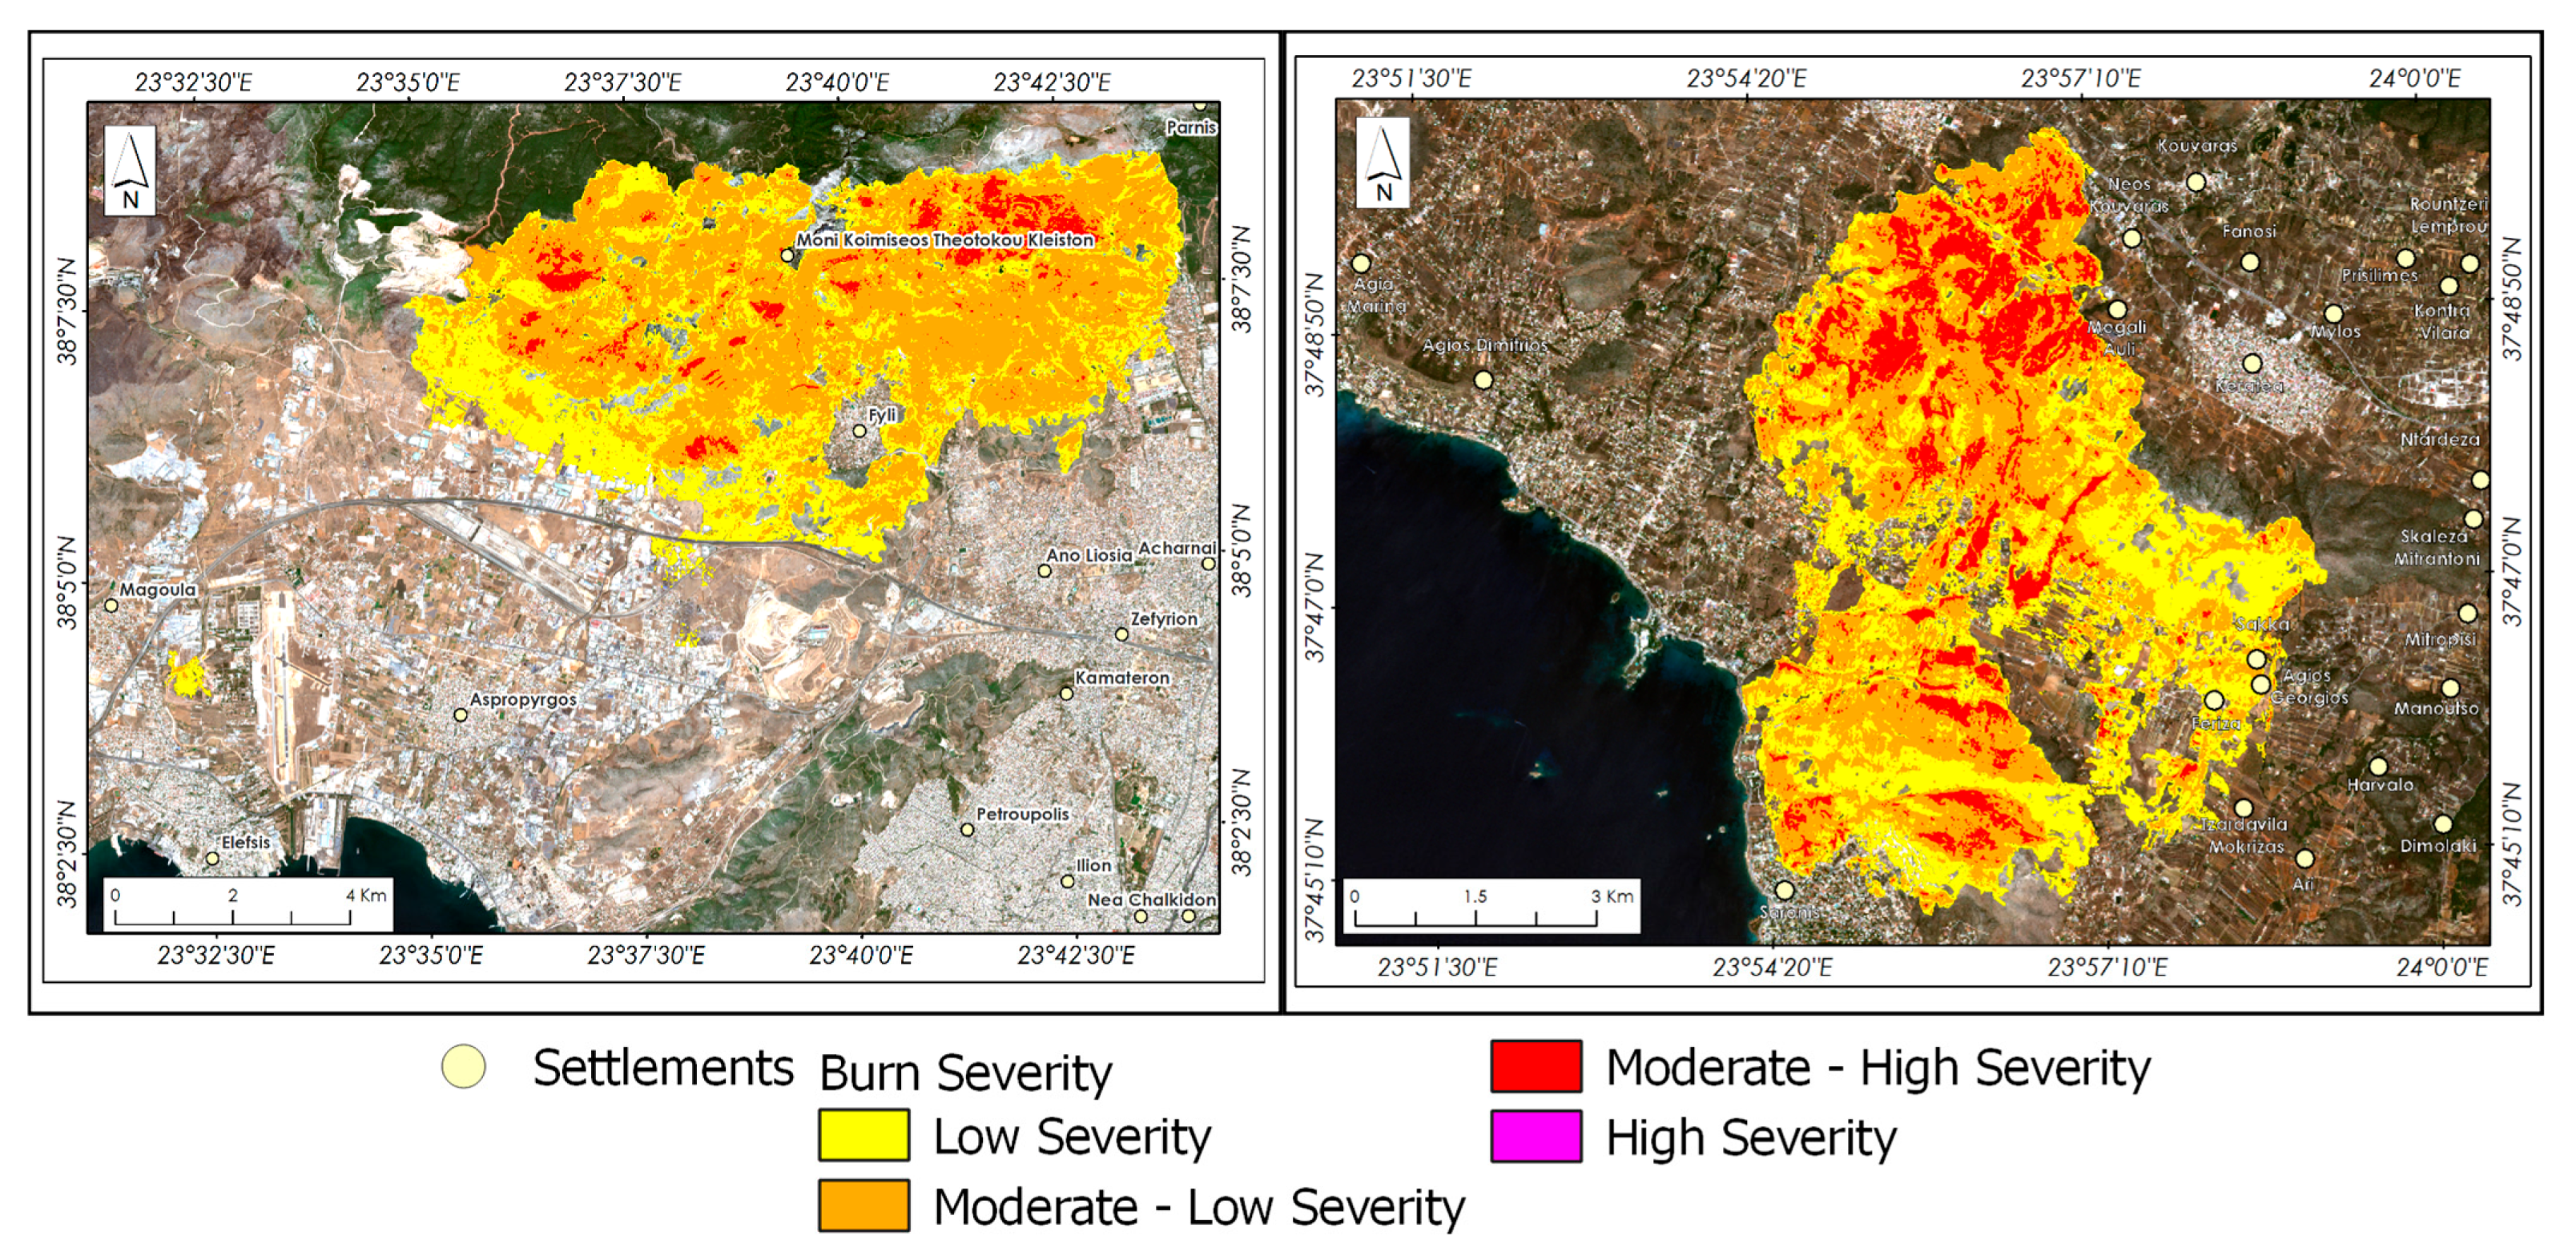
3.1. Burned Areas and Burn Severity
3.2. Land Cover of the Burned Area
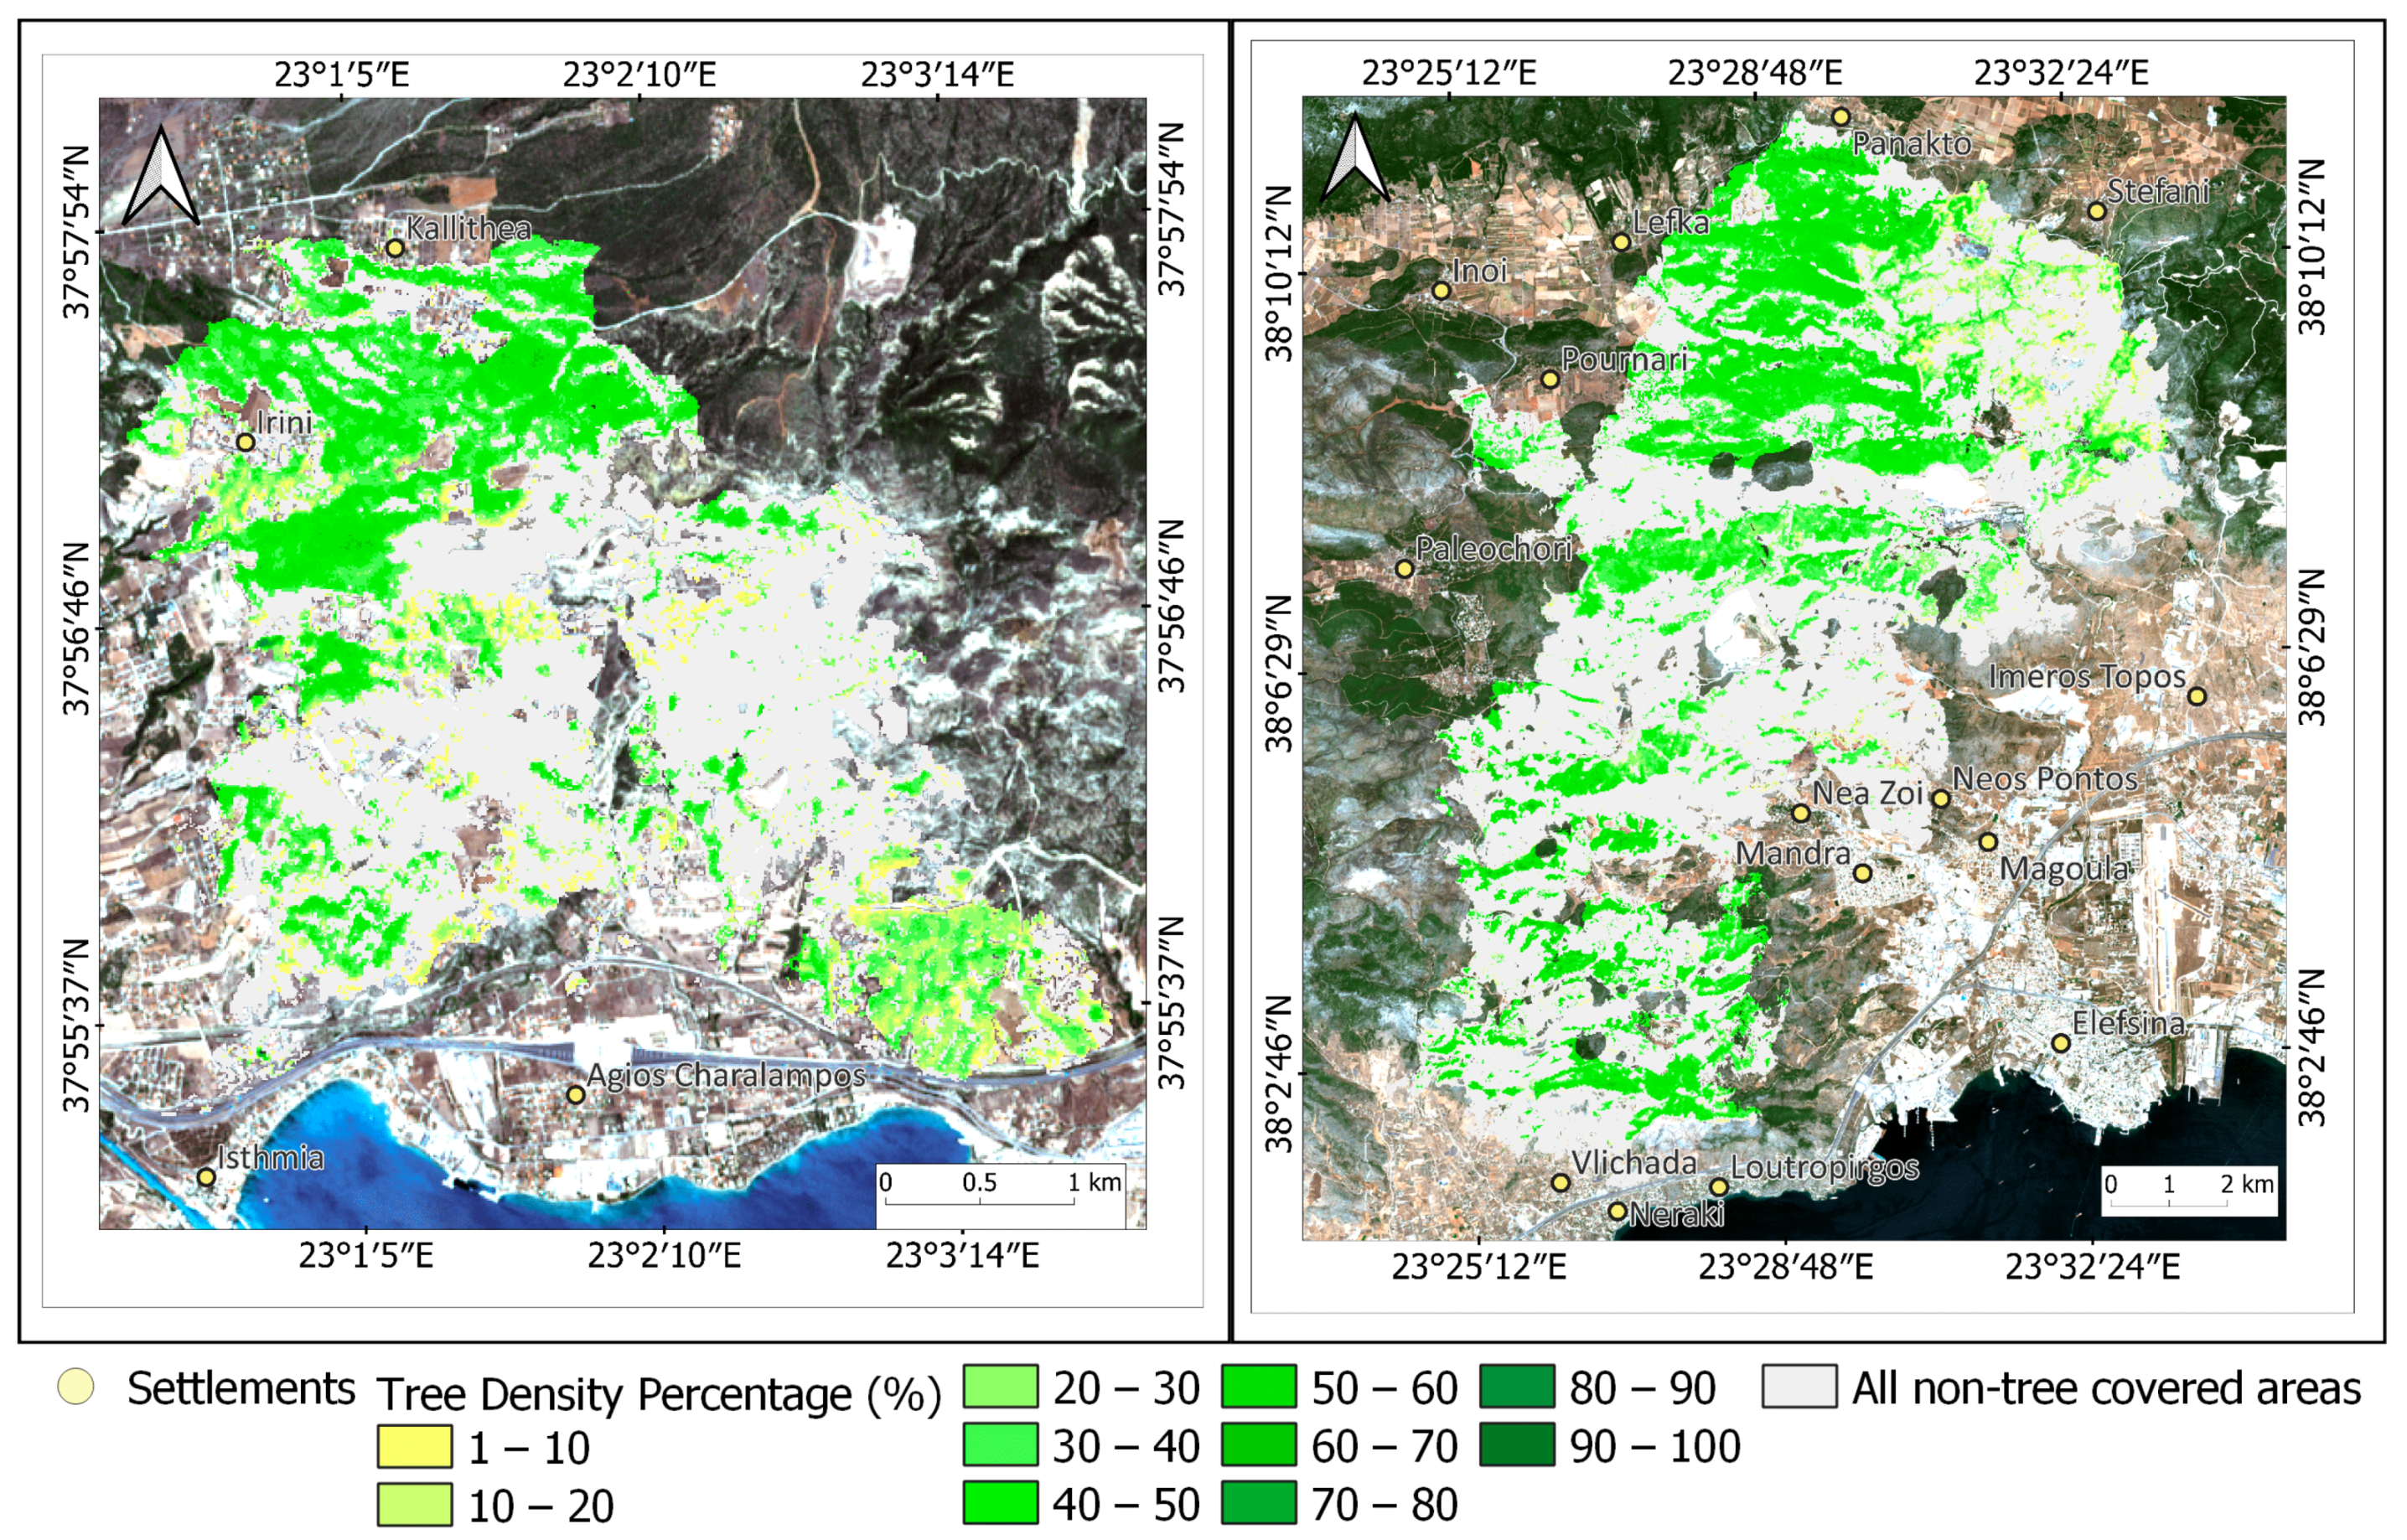
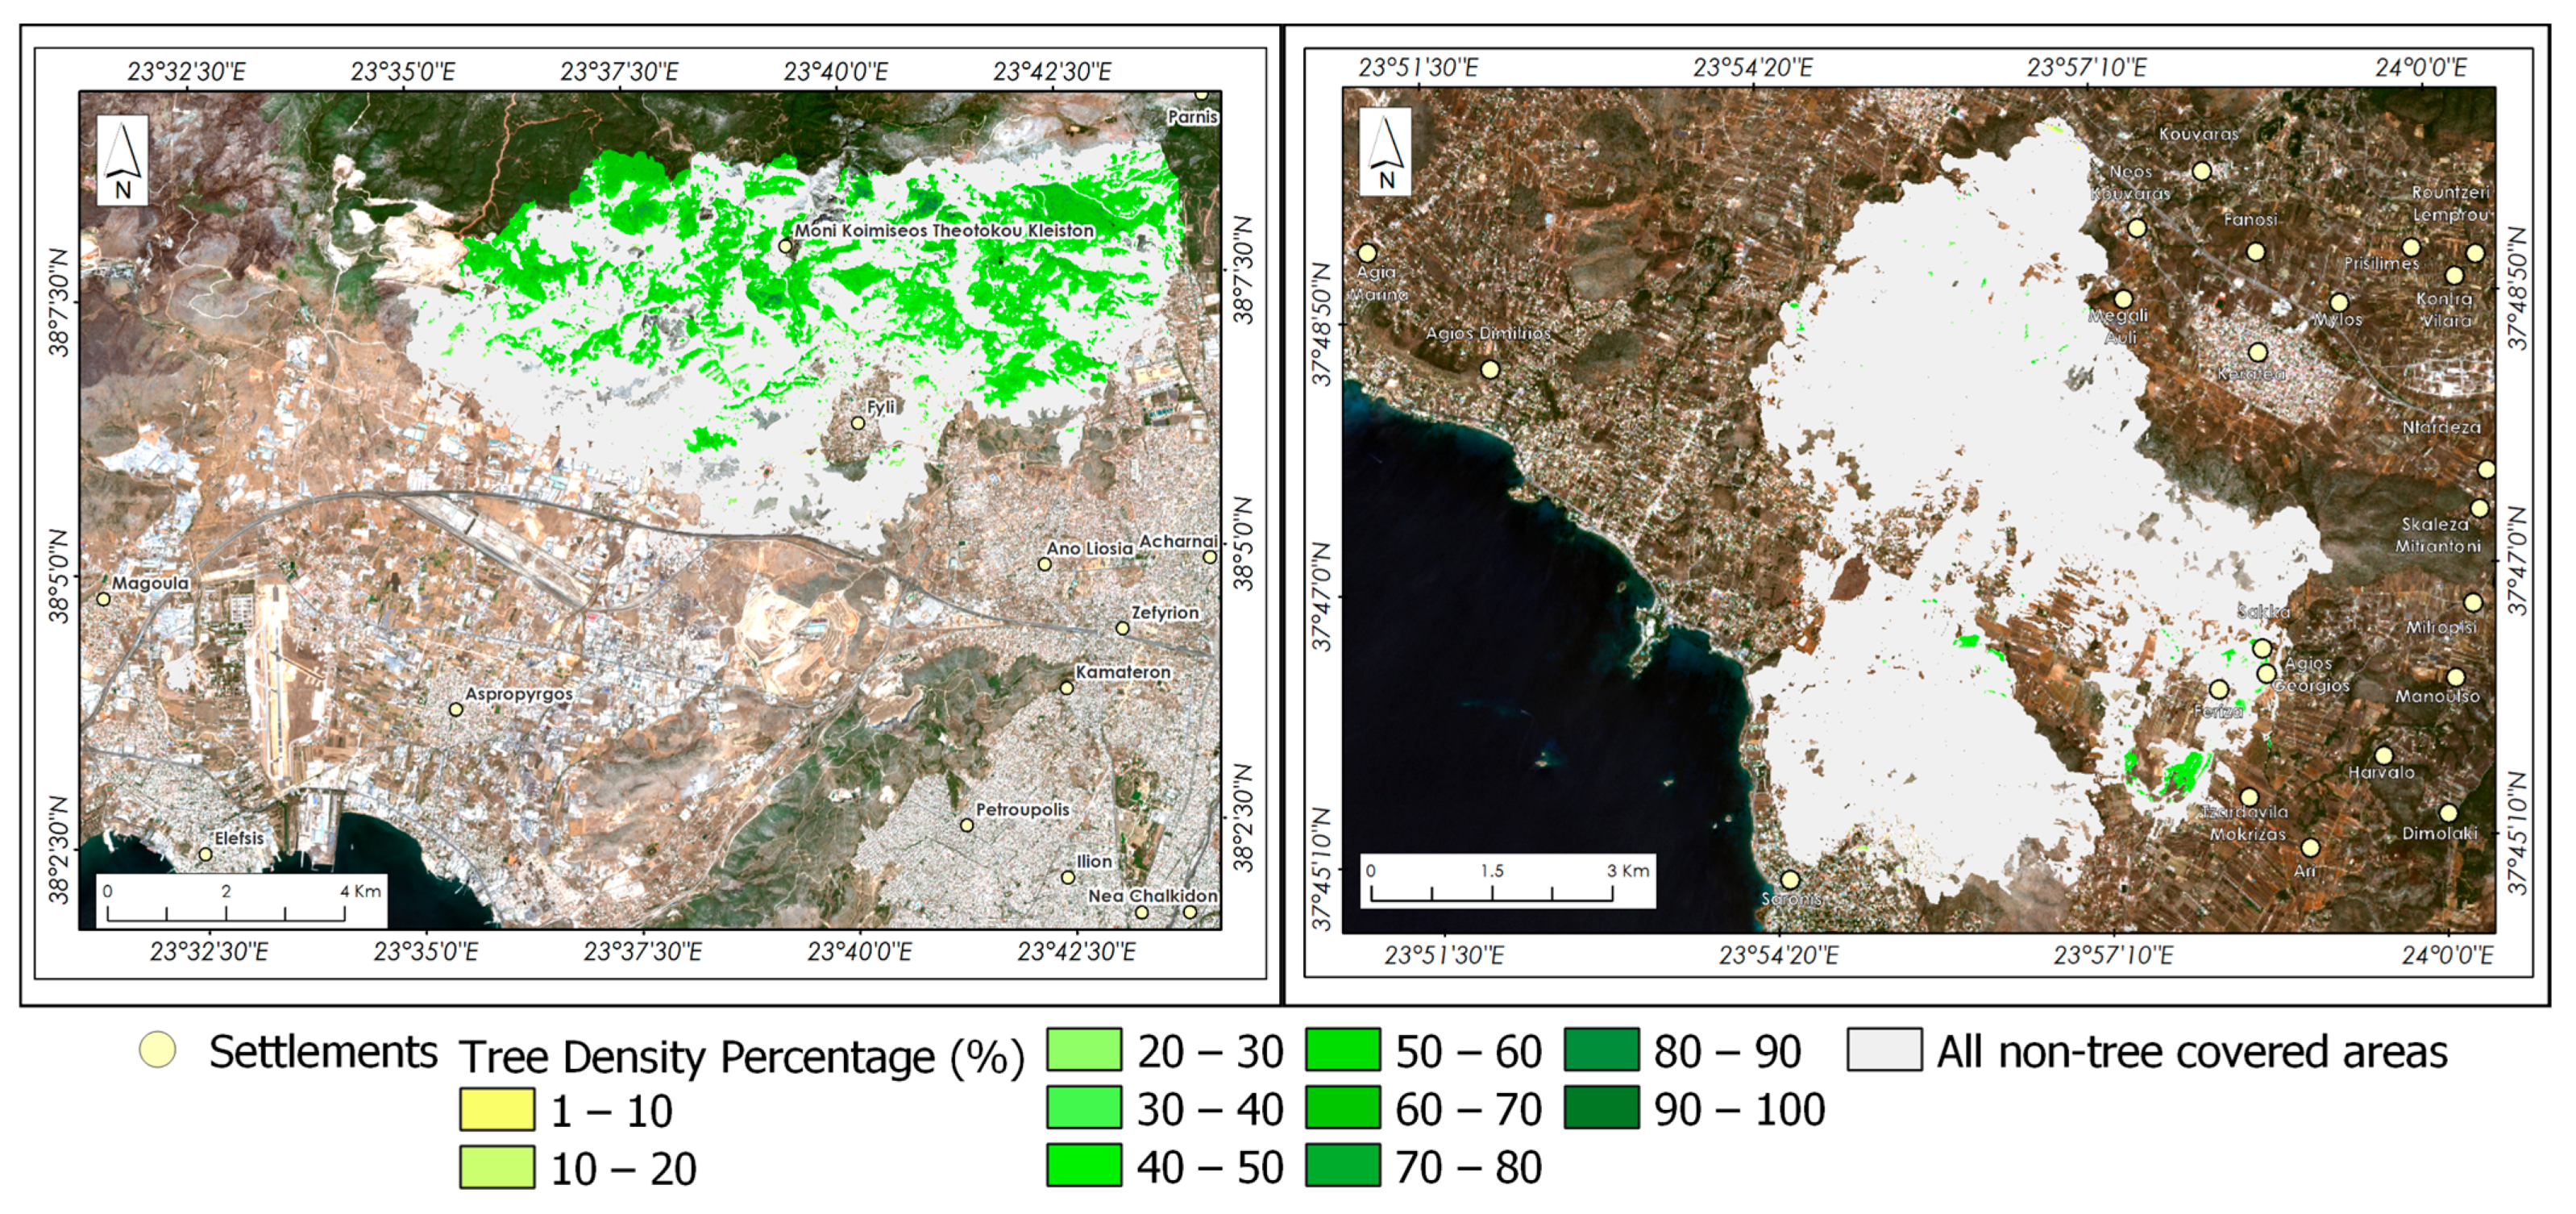
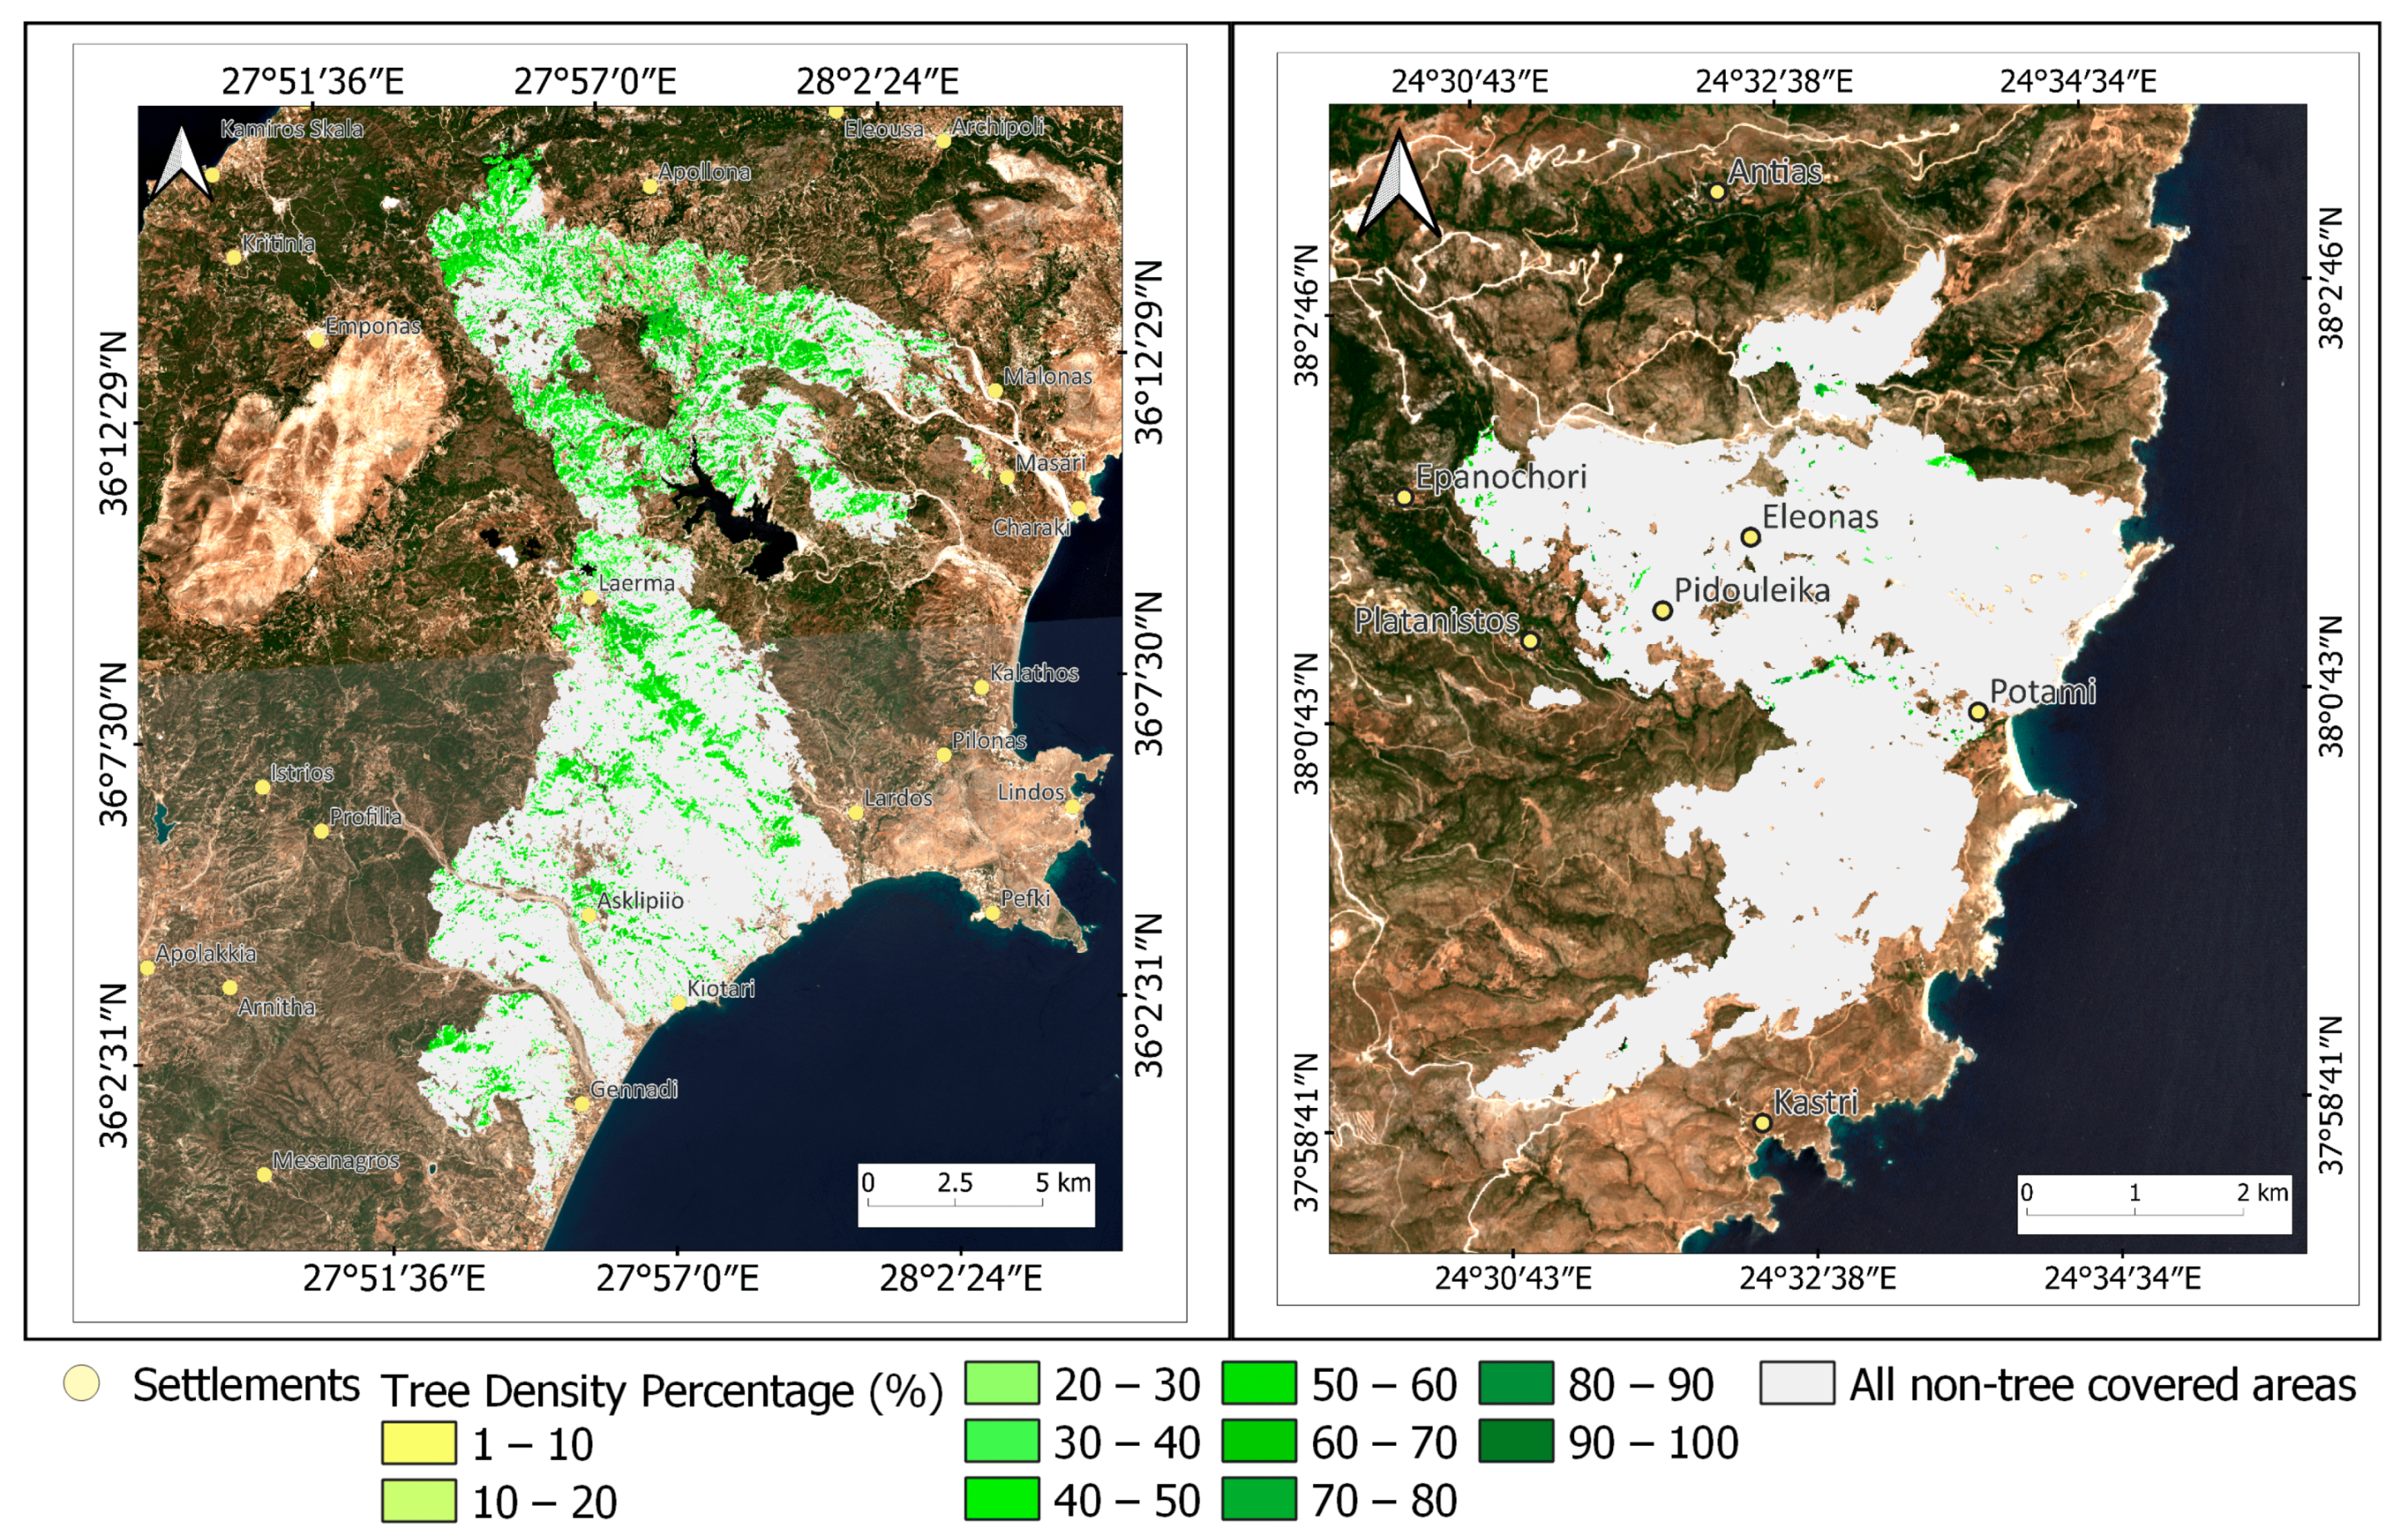
3.3. Tree Cover Density of the Burned Area
3.4. Validation of the Burned Area
4. Discussion
5. Conclusions
Author Contributions
Funding
Institutional Review Board Statement
Informed Consent Statement
Data Availability Statement
Acknowledgments
Conflicts of Interest
References
- Stougiannidou, D.; Zafeiriou, E.; Raftoyannis, Y. Forest fires in Greece and their economic impacts on agriculture. KnE Soc. Sci. 2020, 4, 54–70. [Google Scholar] [CrossRef]
- Bilgiç, E.; Tuygun, G.T.; Gündüz, O. Development of an emission estimation method with satellite observations for sig-nificant forest fires and comparison with global fire emission inventories: Application to catastrophic fires of summer 2021 over the Eastern Mediterranean. Atmos. Environ. 2023, 308, 119871. [Google Scholar] [CrossRef]
- Atun, R.; Kalkan, K.; Gürsoy, Ö. Determining The Forest Fire Risk with Sentinel 2 Images. Turk. J. Geosci. 2020, 1, 22–26. [Google Scholar]
- Huang, Y.; Jin, Y.; Schwartz, M.W.; Thorne, J.H. Intensified burn severity in California’s northern coastal mountains by drier climatic condition. Environ. Res. Lett. 2020, 15, 104033. [Google Scholar] [CrossRef]
- Falaras, T.; Tselka, I.; Papadopoulos, I.; Nikolidaki, M.; Karavias, A.; Bafi, D.; Petani, A.; Krassakis, P.; Parcharidis, I. Opera-tional Mapping and Post-Disaster Hazard Assessment by the Development of a Multiparametric Web App Using Geospatial Technologies and Data: Attica Region 2021 Wildfires (Greece). Appl. Sci. 2022, 12, 7256. [Google Scholar] [CrossRef]
- Angra, D.; Sapountzaki, K. Climate Change Affecting Forest Fire and Flood Risk—Facts, Predictions, and Perceptions in Central and South Greece. Sustainability 2022, 14, 13395. [Google Scholar] [CrossRef]
- Kalogiannidis, S.; Chatzitheodoridis, F.; Kalfas, D.; Patitsa, C.; Papagrigoriou, A. Socio-Psychological, Economic and Environmental Effects of Forest Fires. Fire 2023, 6, 280. [Google Scholar] [CrossRef]
- Malandra, F.; Vitali, A.; Morresi, D.; Garbarino, M.; Foster, D.E.; Stephens, S.L.; Urbinati, C. Burn Severity Drivers in Italian Large Wildfires. Fire 2022, 5, 180. [Google Scholar] [CrossRef]
- Rozario, P.F.; Madurapperuma, B.D.; Wang, Y. Remote sensing approach to detect burn severity risk zones in Palo Verde National Park, Costa Rica. Remote Sens. 2018, 10, 1427. [Google Scholar] [CrossRef]
- Cardil, A.; Mola-Yudego, B.; Blázquez-Casado, Á.; González-Olabarria, J.R. Fire and burn severity assessment: Calibration of Relative Differenced Normalized Burn Ratio (RdNBR) with field data. J. Environ. Manag. 2019, 235, 342–349. [Google Scholar] [CrossRef]
- Delcourt, C.J.F.; Combee, A.; Izbicki, B.; Mack, M.C.; Maximov, T.; Petrov, R.; Rogers, B.M.; Scholten, R.C.; Shestakova, T.A.; van Wees, D.; et al. Evaluating the Differenced Normalized Burn Ratio for Assessing Fire Severity Using Sentinel-2 Imagery in Northeast Siberian Larch Forests. Remote Sens. 2021, 13, 2311. [Google Scholar] [CrossRef]
- Cocke, A.E.; Fulé, P.Z.; Crouse, J.E. Comparison of burn severity assessments using Differenced Normalized Burn Ratio and ground data. Int. J. Wildland Fire 2005, 14, 189–198. [Google Scholar] [CrossRef]
- Mallinis, G.; Mitsopoulos, I.; Chrysafi, I. Evaluating and comparing Sentinel 2A and Landsat-8 Operational Land Imager (OLI) spectral indices for estimating fire severity in a Mediterranean pine ecosystem of Greece. GIScience Remote Sens. 2018, 55, 1–18. [Google Scholar] [CrossRef]
- Nasery, S.; Kalkan, K. Burn Area Detection and Burn Severity Assessment Using Sentinel 2 MSI Data: The Case of Karabağlar District, İzmir/Turkey. Turk. J. Geosci. 2020, 1, 72–77. [Google Scholar]
- Evelpidou, N.; Tzouxanioti, M.; Gavalas, T.; Spyrou, E.; Saitis, G.; Petropoulos, A.; Karkani, A. Assessment of Fire Effects on Surface Runoff Erosion Susceptibility: The Case of the Summer 2021 Forest Fires in Greece. Land 2022, 11, 21. [Google Scholar] [CrossRef]
- Tselka, I.; Krassakis, P.; Rentzelos, A.; Koukouzas, N.; Parcharidis, I. Assessing Post-Fire Effects on Soil Loss Combining Burn Severity and Advanced Erosion Modeling in Malesina, Central Greece. Remote Sens. 2021, 13, 5160. [Google Scholar] [CrossRef]
- Roy, D.P.; Boschetti, L.; Trigg, S.N. Remote sensing of fire severity: Assessing the performance of the normalized burn ratio. IEEE Geosci. Remote Sens. Lett. 2006, 3, 112–116. [Google Scholar] [CrossRef]
- Hysa, A.; Teqja, Z.; Bani, A.; Libohova, Z.; Cerda, A. Assessing wildfire vulnerability of vegetated serpentine soils in the Balkan peninsula. J. Nat. Conserv. 2022, 68, 126217. [Google Scholar] [CrossRef]
- Whitman, E.; Parisien, M.A.; Thompson, D.K.; Hall, R.J.; Skakun, R.S.; Flannigan, M.D. Variability and drivers of burn severity in the northwestern Canadian boreal forest. Ecosphere 2018, 9, e02128. [Google Scholar] [CrossRef]
- Miller, J.D.; Thode, A.E. Quantifying burn severity in a heterogeneous landscape with a relative version of the delta Normalized Burn Ratio (dNBR). Remote Sens. Environ. 2007, 109, 66–80. [Google Scholar] [CrossRef]
- Chawala, P.; Sandhu, H.A.S. Stubble burn area estimation and its impact on ambient air quality of Patiala & Ludhiana district, Punjab, India. Heliyon 2020, 6, e03095. [Google Scholar] [CrossRef]
- Krassakis, P.; Karavias, A.; Nomikou, P.; Karantzalos, K.; Koukouzas, N.; Athinelis, I.; Kazana, S.; Parcharidis, I. Multi-Hazard Susceptibility Assessment Using the Analytical Hierarchy Process in Coastal Regions of South Aegean Volcanic Arc Islands. GeoHazards 2023, 4, 77–106. [Google Scholar] [CrossRef]
- Amos, C.; Petropoulos, G.P.; Ferentinos, K.P. Determining the use of Sentinel-2A MSI for wildfire burning & severity detection. Int. J. Remote Sens. 2019, 40, 905–930. [Google Scholar] [CrossRef]
- Suresh Babu, K.V.; Roy, A.; Aggarwal, R. Mapping of forest fire burned severity using the sentinel datasets. Int. Arch. Photogramm. Remote Sens. Spat. Inf. Sci. 2018, 42, 469–474. [Google Scholar] [CrossRef]
- Quintano, C.; Fernández-Manso, A.; Fernández-Manso, O. Combination of Landsat and Sentinel-2 MSI data for initial assessing of burn severity. Int. J. Appl. Earth Obs. Geoinf. 2018, 64, 221–225. [Google Scholar] [CrossRef]
- Alcaras, E.; Costantino, D.; Guastaferro, F.; Parente, C.; Pepe, M. Normalized Burn Ratio Plus (NBR+): A New Index for Sen-tinel-2 Imagery. Remote Sens. 2022, 14, 1727. [Google Scholar] [CrossRef]
- Tariq, A.; Shu, H.; Gagnon, A.S.; Li, Q.; Mumtaz, F.; Hysa, A.; Siddique, M.A.; Munir, I. Assessing burned areas in wildfires and prescribed fires with spectral indices and SAR images in the Margalla Hills of Pakistan. Forests 2021, 12, 1371. [Google Scholar] [CrossRef]
- Key, C.H.; Benson, N.C. Landscape Assessment (LA). FIREMON: Fire Effects Monitoring and Inventory System. 2006, 164, LA-1. Available online: http://gsp.humboldt.edu/OLM/Courses/GSP_216/labs/rmrs_gtr164_13_land_assess.pdf (accessed on 11 November 2023).
- Hysa, A.; Spalevic, V.; Dudic, B.; Roșca, S.; Kuriqi, A.; Bilașco, Ș.; Sestras, P. Utilizing the available open-source remotely sensed data in assessing the wildfire ignition and spread capacities of vegetated surfaces in Romania. Remote Sens. 2021, 13, 2737. [Google Scholar] [CrossRef]
- Northern Hemisphere Wildfires: A Summer of Extremes|Copernicus. 13 September 2023. Available online: https://atmosphere.copernicus.eu/northern-hemisphere-wildfires-summer-extremes (accessed on 5 November 2023).
- Wildfires in the Mediterranean: Monitoring the Impact, Helping the Response. 11 October 2023. Available online: https://joint-research-centre.ec.europa.eu/jrc-news-and-updates/wildfires-mediterranean-monitoring-impact-helping-response-2023-07-28_en (accessed on 5 November 2023).
- Massive Northeastern Greece Wildfire Persists for 11th day. Le Monde.Fr. 29 August 2023. Available online: https://www.lemonde.fr/en/environment/article/2023/08/29/massive-northeastern-greece-wildfire-persists-for-11th-day_6114291_114.html (accessed on 5 November 2023).
- August Wildfires Ravage Northern & Central Greece|Copernicus. 23 August 2023. Available online: https://atmosphere.copernicus.eu/august-wildfires-ravage-northern-central-greece (accessed on 5 November 2023).
- Avramidis, A. Greece Rescues 25 Migrants from Deadly Evros Wildfire. Reuters, 1 September 2023. Available online: https://www.reuters.com/world/europe/greece-rescues-25-migrants-deadly-evros-wildfire-2023-09-01/ (accessed on 5 November 2023).
- Dadia–Lefkimi–Soufli Forest National Park Management Body. Available online: http://dadia-np.gr/?lang=en (accessed on 16 November 2023).
- Drosos, V.C.; Tasionas, G.; Koukoulos, I.; Kasapidis, I.; Stavridis, V.; Sismanidis, I. Forest Ecosystem Services for Sustainable Development in A Protected Area. In Proceedings of the 9th International Symposium “FOREST AND SUSTAINABLE DEVELOPMENT”, Braşov, Romania, 16 October 2021; p. 1. [Google Scholar]
- Svoronou, E.; Holden, A. Ecotourism as a tool for nature conservation: The role of WWF Greece in the Dadia-Lefkimi-Soufli Forest Reserve in Greece. J. Sustain. Tour. 2005, 13, 456–467. [Google Scholar] [CrossRef]
- Hovardas, T.; Korfiatis, K.J. Framing environmental policy by the local press: Case study from the Dadia Forest Reserve, Greece. For. Policy Econ. 2008, 10, 316–325. [Google Scholar] [CrossRef]
- Hovardas, T.; Poirazidis, K. Evaluation of the environmentalist dimension of ecotourism at the Dadia Forest Reserve (Greece). Environ. Manag. 2006, 38, 810–822. [Google Scholar] [CrossRef]
- Kati, V.I.; Sekercioglu, C.H. Diversity, ecological structure, and conservation of the landbird community of Dadia reserve, Greece. Divers. Distrib. 2006, 12, 620–629. [Google Scholar] [CrossRef]
- Newsroom. 50,000 Olive Trees and 2500 Animals Lost in Rhodes Fires|eKathimerini.com. 28 July 2023. Available online: https://www.ekathimerini.com/news/1216588/50000-olive-trees-and-2500-animals-lost-in-rhodes-fires/ (accessed on 15 December 2023).
- Mandrou, I. Animal Deaths at Shelter for Strays during Wildfire Being Probed|eKathimerini.com. 22 July 2023. Available online: https://www.ekathimerini.com/news/1216000/animal-deaths-at-shelter-for-strays-during-wildfire-being-probed/ (accessed on 15 December 2023).
- Maniatis, Y.; Doganis, A.; Chatzigeorgiadis, M. Fire Risk Probability Mapping Using Machine Learning Tools and Multi-Criteria Decision Analysis in the GIS Environment: A Case Study in the National Park Forest Dadia-Lefkimi-Soufli, Greece. Appl. Sci. 2022, 12, 2938. [Google Scholar] [CrossRef]
- Rhodes Wildfire Forces Thousands to Flee. 24 July 2023. Available online: https://www.esa.int/ESA_Multimedia/Images/2023/07/Rhodes_wildfire_forces_thousands_to_flee (accessed on 5 November 2023).
- Duarte, M.; Liakos, C.; Labropoulou, E.; Cassidy, A. Tourists Flee RHODES Wildfires in Greece’s Largest-Ever Evacuation. CNN, 22 July 2023. Available online: https://www.cnn.com/2023/07/22/europe/greece-record-breaking-heat-wave-climate-intl/index.html (accessed on 5 November 2023).
- Athens Bureau. Fire in Magnesia: 80% of Livestock Was Killed|Greek City Times. 28 July 2023. Available online: https://greekcitytimes.com/2023/07/28/fire-in-magnesia-livestock-killed/ (accessed on 15 December 2023).
- Greece Wildfires: Eighteen Bodies Found in Greek Forest. BBC News. 22 August 2023. Available online: https://www.bbc.com/news/world-europe-66579193 (accessed on 5 November 2023).
- Estimation of the Burnt Land Use of the Fire of 23/08/2023—Parnitha, Attica. 23 August 2023. Available online: http://beyond-eocenter.eu/index.php/news-events/615-20230823-pyrkagia-parnitha (accessed on 5 November 2023).
- Georgiopoulou, T. (5 September 2023). Wildfires Claim 60% of Evros’ Olive Trees|eKathimerini.com. Available online: https://www.ekathimerini.com/news/1219205/wildfires-claim-60-of-evros-olive-trees/ (accessed on 15 December 2023).
- ‘Unprecedented Ecological Destruction’: What Next after Devastating GREECE Wildfires? (n.d.). Available online: https://www.aa.com.tr/en/environment/-unprecedented-ecological-destruction-what-next-after-devastating-greece-wildfires/2983711 (accessed on 12 December 2023).
- Rhodes Fires: Thousands Forced to Flee “Disaster Film” Wildfires. BBC News. 24 July 2023. Available online: https://www.bbc.com/news/uk-66286741 (accessed on 5 November 2023).
- Climate & Weather Averages in Corfu, Greece. Available online: https://www.timeanddate.com/weather/@2463678/climate (accessed on 15 December 2023).
- Weather in July 2023 in Dimos Corfu, Greece. Available online: https://www.timeanddate.com/weather/@8133855/historic?month=7&year=2023 (accessed on 15 December 2023).
- Weather Magnesia—Monthly Weather History|Freemeteo. Gr. Available online: https://freemeteo.gr/weather/magnisia/history/monthly-history/?gid=258014&station=5287&month=7&year=2023&language=english&country=greece (accessed on 15 December 2023).
- Copernicus Open Access Hub. Available online: https://scihub.copernicus.eu/maintenance.html (accessed on 6 November 2023).
- Dataspace Copernicus EU. Available online: https://dataspace.copernicus.eu/ (accessed on 6 November 2023).
- Sentinel-2 User Handbook; European Space Agency: Paris, France. 2015. Available online: https://sentinel.esa.int/documents/247904/685211/Sentinel-2_User_Handbook (accessed on 6 November 2023).
- Corine Land Cover (CLC 2018). Copernicus Land Monitoring Service. Available online: https://land.copernicus.eu/en/products/corine-land-cover/clc2018 (accessed on 6 November 2023).
- Tree Cover Density 2018 (TCD). Copernicus Land Monitoring Service. Available online: https://land.copernicus.eu/en/products/high-resolution-layer-tree-cover-density/tree-cover-density-2018 (accessed on 6 November 2023).
- Parks, S.A.; Dillon, G.K.; Miller, C. A new metric for quantifying burn severity: The relativized burn ratio. Remote Sens. 2014, 6, 1827–1844. [Google Scholar] [CrossRef]
- Krassakis, P.; Karavias, A.; Nomikou, P.; Karantzalos, K.; Koukouzas, N.; Kazana, S.; Parcharidis, I. Geospatial Intelligence and Machine Learning Technique for Urban Mapping in Coastal Regions of South Aegean Volcanic Arc Islands. Geomatics 2022, 2, 297–322. [Google Scholar] [CrossRef]
- van Westen, C.J. Remote sensing for natural disaster management. In Proceedings of the ISPRS 2000 Congress: Geoinformation for All, Amsterdam, The Netherlands, 16–23 July 2000; pp. 1700–1707. [Google Scholar]
- Kovacs, K.D. Evaluation of Burned Areas with Sentinel-2 Using SNAP: The Case of Kineta and Mati, Greece, July 2018. Geogr. Tech. 2019, 14, 20–38. [Google Scholar] [CrossRef]
- Heidari, F.B.; Arfania, R. Wildfire Susceptibility Mapping using NBR Index and Frequency Ratio Model. Geoconservation Res. 2022, 5, 240–260. [Google Scholar] [CrossRef]
- Key, C.; Benson, N. The Normalized Burned Ratio, a Landsat TM Radiometric Index of Burn Severity Incorporating Multi-Temporal Differencing; Geological Surney: Reston, VA, USA, 1999. [Google Scholar]
- Eidenshink, J.; Schwind, B.; Brewer, K.; Zhu, Z.-L.; Quayle, B.; Howard, S. A project for Monitoring Trends in Burn Severity. Fire Ecol. 2007, 3, 3–21. [Google Scholar] [CrossRef]
- Veraverbeke, S.; Lhermitte, S.; Verstraeten, W.W.; Goossens, R. The temporal dimension of differenced Normalized Burn Ratio (dNBR) fire/burn severity studies: The case of a large 2007 Peloponnese wildfires in Greece. Remote Sens. Environ. 2010, 114, 2548–2563. [Google Scholar] [CrossRef]
- Ponomarev, E.; Zabrodin, A.; Ponomareva, T. Classification of fire Damage to Boreal Forests of Siberia in 2021 Based on the dNBR Index. Fire 2022, 5, 19. [Google Scholar] [CrossRef]
- Saulino, L.; Rita, A.; Migliozzi, A.; Maffei, C.; Allevato, E.; Garonna, A.P.; Saracino, A. Detecting Burn Severity across Mediterranean Forest Types by Coupling Medium-Spatial Resolution Satellite Imagery and Field Data. Remote Sens. 2020, 12, 741. [Google Scholar] [CrossRef]
- Arisanty, D.; Ramadhan, M.F.; Angriani, P.; Muhaimin, M.; Saputra, A.N.; Hastuti, K.P.; Rodadi, D. Utilizing Sentinel-2 Data for Mapping Burned Area in Banjarbaru Wetlands, South Kalimantan Province. Int. J. For. Res. 2022, 2022, 7936392. [Google Scholar] [CrossRef]
- Normalized Burn Ratio (Nbr)|Un-Spider Knowledge Portal. Available online: https://un-spider.org/advisory-support/recommended-practices/recommended-practice-burn-severity/in-detail/normalized-burn-ratio (accessed on 19 November 2023).
- The Emergency Management Service—Mapping. Copernicus EMS—Mapping. Available online: http://emergency.copernicus.eu/mapping/ems/emergency-management-service-mapping (accessed on 13 November 2023).


| Data | Format | Resolution | Source |
|---|---|---|---|
| Sentinel-2 Imagery | Optical Level-2A | 10 m | Copernicus Open Access Hub |
| CORINE Land Cover (CLC 2018) | Vector (Polygon) | - | Copernicus Land Monitoring Service |
| Tree Density | Raster | 10 m | Copernicus Land Monitoring Service |
| Area | Wildfire Start Date | Sentinel-2 Acquisition Date |
|---|---|---|
| Corfu | 23 July 2023 | 20 July 2023 30 July 2023 |
| Dervenochoria | 17 July 2023 | 14 July 2023 24 July 2023 |
| Evros | 19 August 2023 | 29 July 2023 (T35TLF, T35TMF) 12 September 2023 (T35TLF, T35TMF) |
| Lagonisi | 17 July 2023 | 4 July 2023 19 July 2023 |
| Loutraki | 17 July 2023 | 2 July 2023 27 July 2023 |
| Magnesia | 26 July 2023 | 22 July 2023 21 August 2023 |
| Parnitha | 22 August 2023 | 18 August 2023 28 August 2023 |
| Platanistos (Evia) | 23 July 2023 | 19 July 2023 29 July 2023 |
| Rhodes | 18 July 2023 | 8 July 2023 (T35SNA, T35SNV) 2 August 2023 (T35SNA, T35SNV) |
| Start Date | Location | Burned Area (km2) | Most Burned Land Type | Validation–Burned Area (km2) |
|---|---|---|---|---|
| 17 July | Dervenochoria, West Attica | 111.53 | Sclerophyllous Vegetation | 117.09 |
| 17 July | Lagonisi–Kalivia, East Attica | 36.47 | Herbaceous Vegetation Associations | 38.69 |
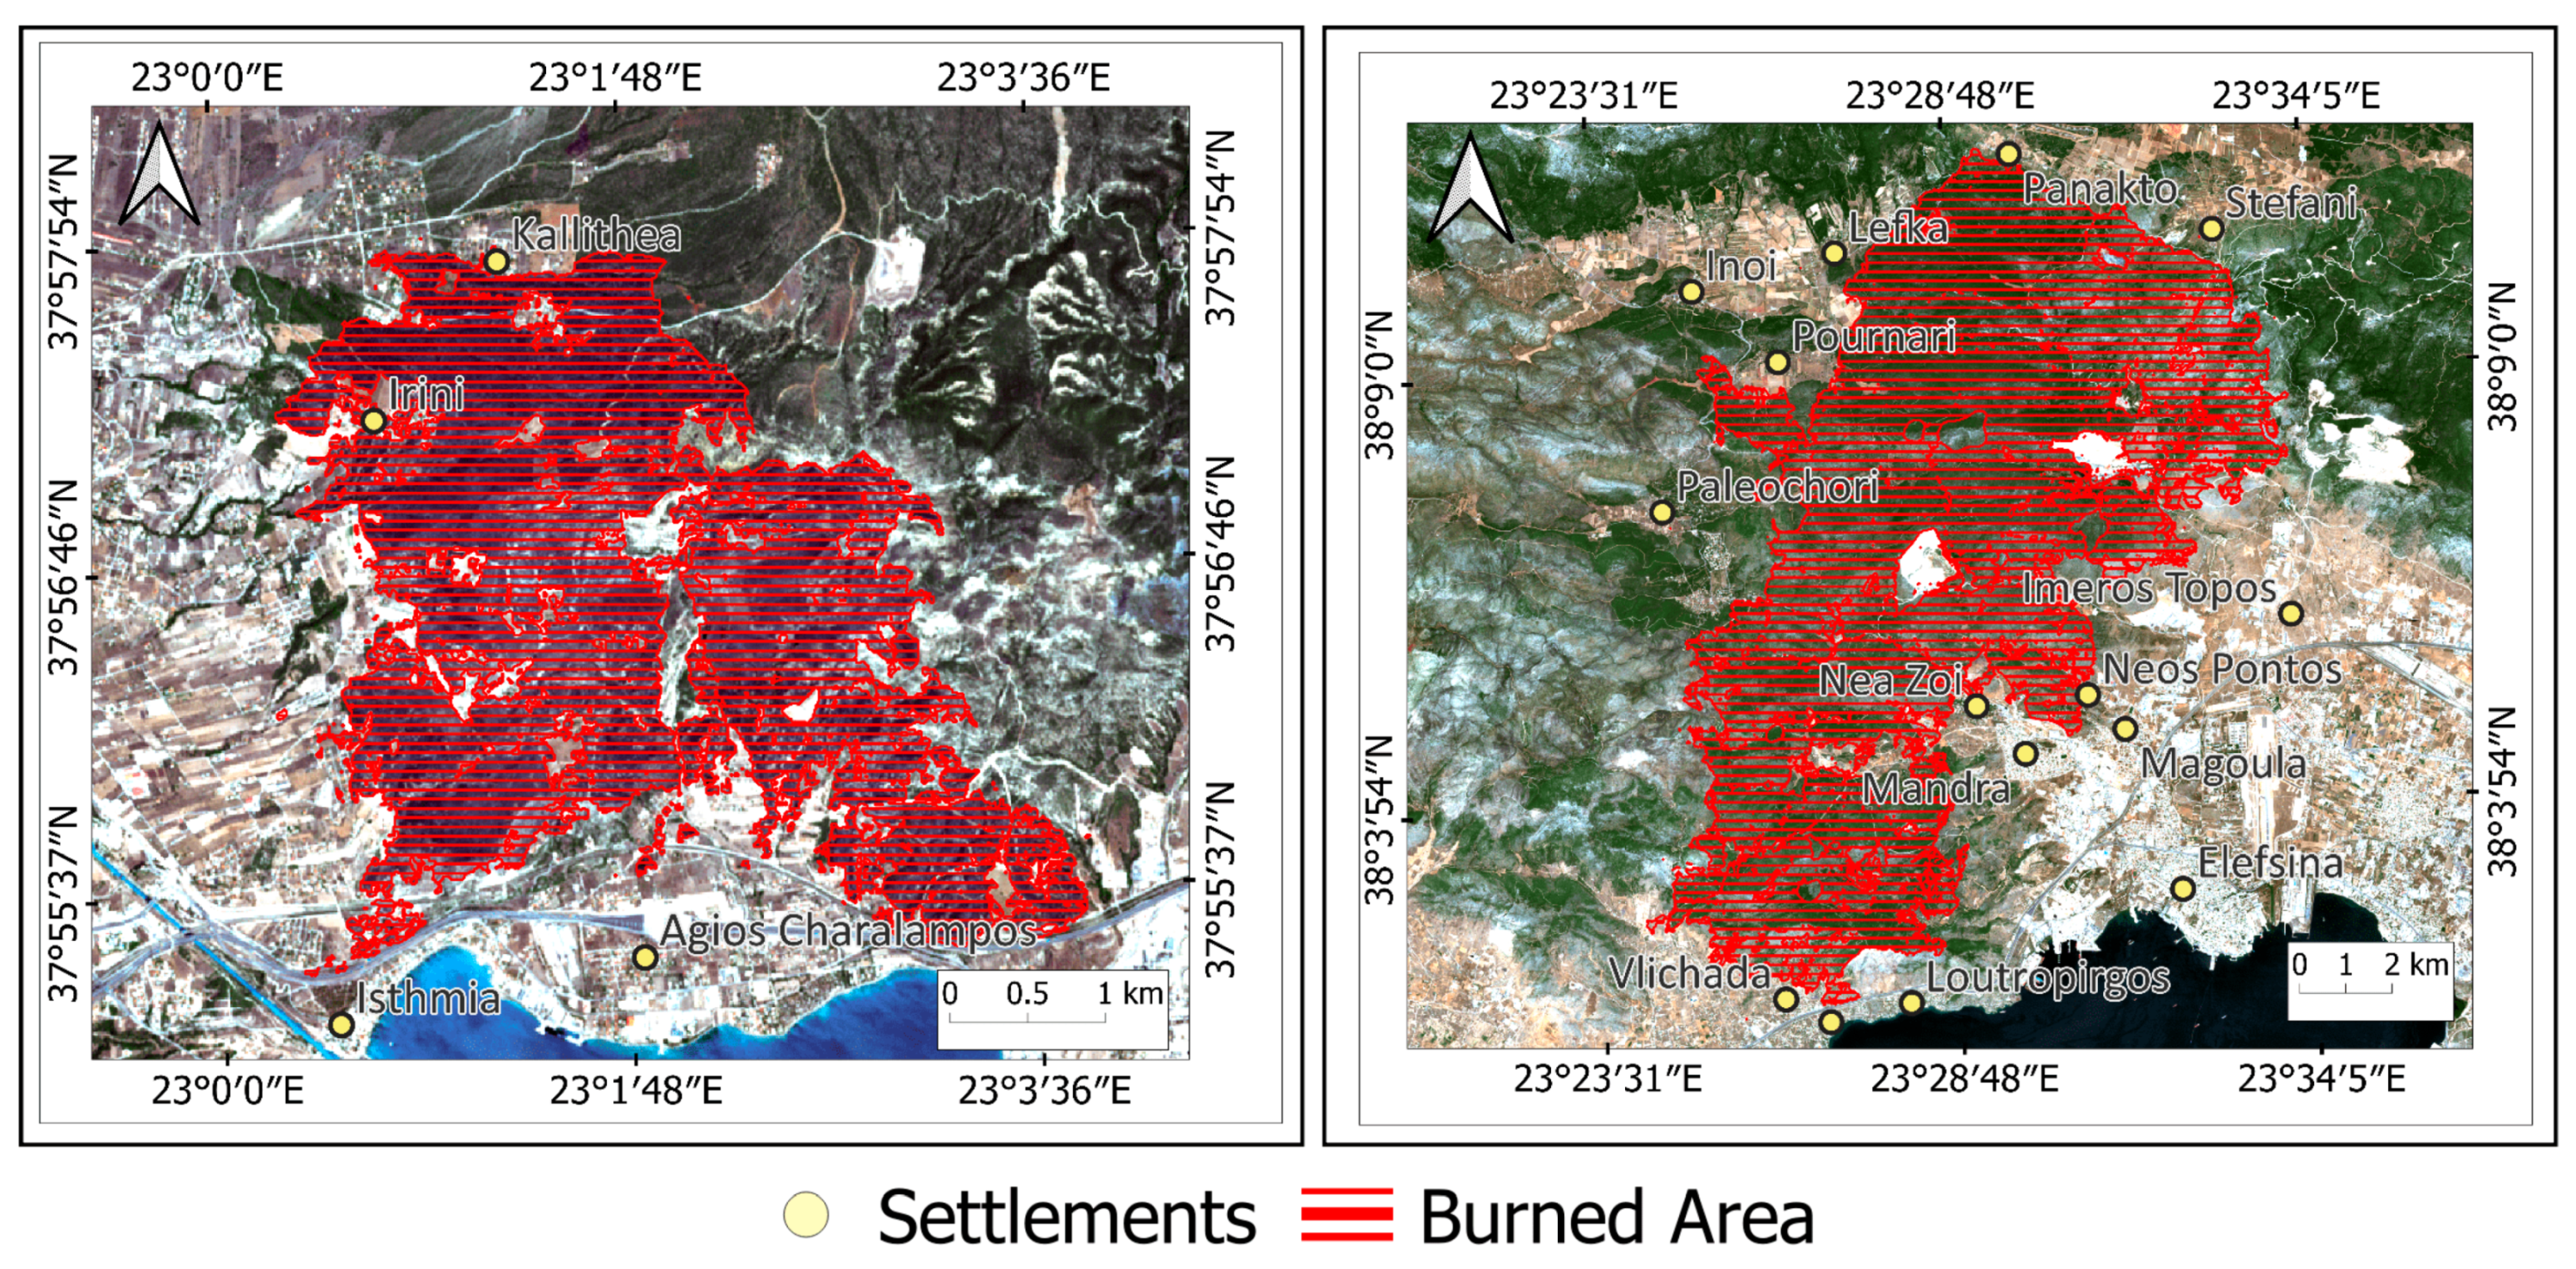
| 17 July | Loutraki, Gulf of Corinth | 10.94 | Transitional Woodland–Shrub | 11.96 |
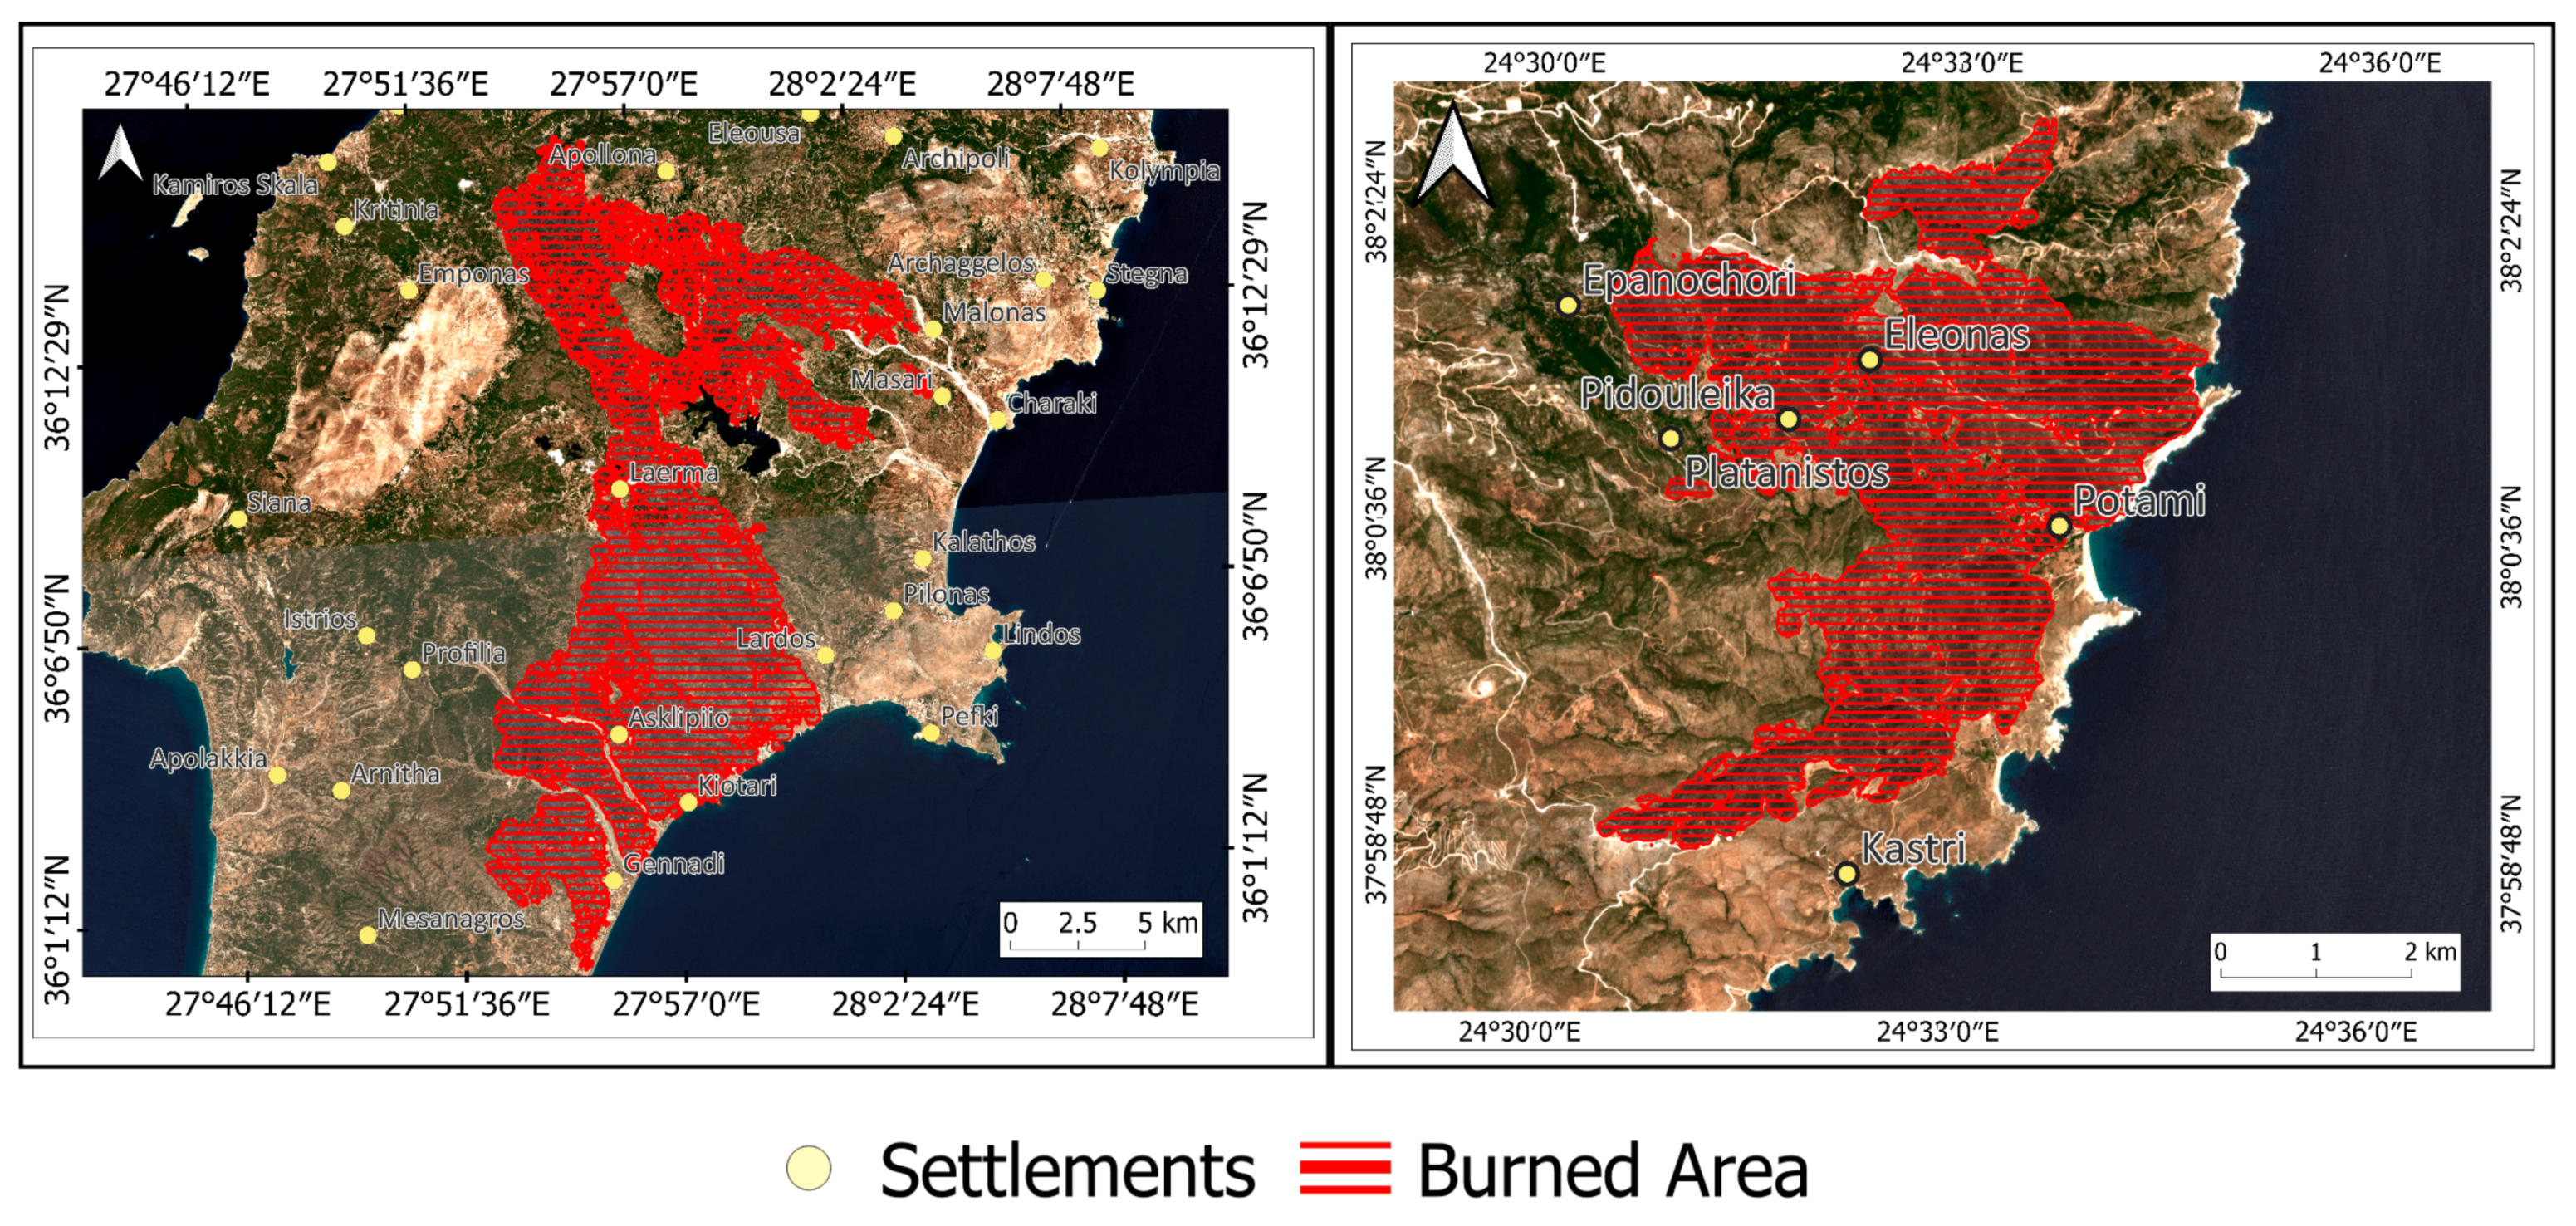
| 18 July | Rhodes, Dodecanese | 172.77 | Transitional Woodland–Shrub | 177.74 |
| 23 July | Northeast Corfu | 21.71 | Sparsely Vegetated Areas | 21.77 |
| 23 July | Platanistos, Evia | 19.79 | Sclerophyllous Vegetation | 19.68 |
| 26 July | Magnesia, Thessaly | 82.41 | Sclerophyllous Vegetation | 82.64 |
| 19 August | Dadia, Evros | 903.04 | Mixed Forest | 938.81 |
| 22 August | Parnitha–Aspropyrgos, Central Attica | 56.98 | Transitional Woodland–Shrub | 61.93 |
| Total Burned Area: | 1415.63 | 1470.31 |
| Evros | ||
|---|---|---|
| Burn Severity | Area (km2) | Percentage (%) |
| Low | 234.32 | 25.95 |
| Moderate–Low | 206.61 | 22.88 |
| Moderate–High | 337.40 | 37.36 |
| High | 124.71 | 13.81 |
| Loutraki | Dervenochoria | ||||
|---|---|---|---|---|---|
| Burn Severity | Area (km2) | Percentage (%) | Burn Severity | Area (km2) | Percentage (%) |
| Low | 3.04 | 27.77 | Low | 23.58 | 21.14 |
| Moderate–Low | 3.5 | 32.02 | Moderate–Low | 55.72 | 49.96 |
| Moderate–High | 4.4 | 40.22 | Moderate–High | 32.04 | 28.73 |
| High | 0 | 0 | High | 0.193 | 0.17 |
| Parnitha | Lagonisi | ||||
|---|---|---|---|---|---|
| Burn Severity | Area (km2) | Percentage (%) | Burn Severity | Area (km2) | Percentage (%) |
| Low | 20.46 | 35.90 | Low | 13.78 | 33.78 |
| Moderate–Low | 33.60 | 58.96 | Moderate–Low | 16.87 | 46.25 |
| Moderate–High | 2.92 | 5.13 | Moderate–High | 5.83 | 15.98 |
| High | 0.00 | 0.00 | High | 0.00 | 0.00 |
| Rhodes | Evia | ||||
|---|---|---|---|---|---|
| Burn Severity | Area (km2) | Percentage (%) | Burn Severity | Area (km2) | Percentage (%) |
| Low | 34.15 | 19.77 | Low | 2.11 | 10.66 |
| Moderate–Low | 54.13 | 31.33 | Moderate–Low | 4.77 | 24.13 |
| Moderate–High | 82.08 | 47.51 | Moderate–High | 11.91 | 60.19 |
| High | 2.41 | 1.39 | High | 1 | 5.03 |
| Corfu | Magnesia | ||||
|---|---|---|---|---|---|
| Burn Severity | Area (km2) | Percentage (%) | Burn Severity | Area (km2) | Percentage (%) |
| Low | 11.63 | 53.55 | Low | 48.73 | 59.14 |
| Moderate–Low | 8.40 | 38.69 | Moderate–Low | 32.45 | 39.38 |
| Moderate–High | 1.68 | 7.76 | Moderate–High | 1.22 | 1.48 |
| High | 0.00 | 0.00 | High | 0.00 | 0.00 |
| Evros | ||
|---|---|---|
| CLC Code | Area (km2) | Percentage (%) |
| 112 | 0.22 | 0.02 |
| 121 | 2.64 | 0.29 |
| 122 | 2.22 | 0.25 |
| 131 | 0.55 | 0.06 |
| 211 | 62.53 | 6.92 |
| 212 | 1.05 | 0.12 |
| 223 | 7.19 | 0.80 |
| 231 | 2.71 | 0.30 |
| 242 | 8.91 | 0.99 |
| 243 | 68.79 | 7.62 |
| 311 | 168.49 | 18.66 |
| 312 | 14.92 | 1.65 |
| 313 | 244.96 | 27.12 |
| 321 | 32.89 | 0.68 |
| 322 | 6.14 | 16.61 |
| 323 | 150.01 | 16.61 |
| 324 | 125.37 | 13.88 |
| 331 | 0.18 | 0.02 |
| 421 | 0.62 | 0.07 |
| 511 | 0.46 | 0.05 |
| 512 | 0.26 | 0.03 |
| 522 | 2.00 | 0.22 |
| Loutraki | Dervenochoria | ||||
|---|---|---|---|---|---|
| CLC Code | Area (km2) | Percentage (%) | CLC Code | Area (km2) | Percentage (%) |
| 122 | 0.04 | 0.37 | 112 | 0.07 | 0.06 |
| 142 | 0.13 | 1.20 | 121 | 0.01 | 0.01 |
| 223 | 0.03 | 0.27 | 122 | 0.04 | 0.37 |
| 242 | 0.58 | 4.57 | 131 | 0.72 | 0.65 |
| 243 | 1.90 | 17.41 | 211 | 0.06 | 0.05 |
| 312 | 1.27 | 11.59 | 223 | 0.82 | 0.74 |
| 323 | 1.36 | 12.46 | 231 | 1.25 | 1.12 |
| 324 | 5.71 | 52.16 | 242 | 2.20 | 1.98 |
| 243 | 2.27 | 2.04 | |||
| 312 | 24.59 | 22.06 | |||
| 313 | 4.96 | 4.45 | |||
| 321 | 4.28 | 3.84 | |||
| 323 | 36.80 | 33.01 | |||
| 324 | 31.84 | 28.56 | |||
| 333 | 1.61 | 1.45 | |||
| 512 | 0.00 | 0.00 | |||
| Parnitha | Lagonisi | ||||
|---|---|---|---|---|---|
| CLC Code | Area (km2) | Percentage (%) | UA Code | Area (km2) | Percentage (%) |
| 112 | 0.58 | 1.01 | 11100 | 0.01 | 0.02 |
| 121 | 0.57 | 1.01 | 11210 | 0.16 | 0.44 |
| 122 | 0.07 | 0.13 | 11220 | 0.37 | 1.00 |
| 124 | 0.00 | 0.01 | 11230 | 0.16 | 0.44 |
| 131 | 0.01 | 0.01 | 11240 | 0.04 | 0.11 |
| 223 | 1.85 | 3.24 | 11300 | 0.27 | 0.74 |
| 231 | 1.92 | 3.37 | 12100 | 0.30 | 0.83 |
| 242 | 0.01 | 0.01 | 12220 | 0.56 | 1.54 |
| 243 | 0.31 | 0.54 | 13100 | 0.01 | 0.04 |
| 312 | 7.49 | 13.14 | 13400 | 0.03 | 0.07 |
| 313 | 11.88 | 20.85 | 14100 | 0.00 | 0.00 |
| 323 | 11.27 | 19.78 | 14200 | 0.01 | 0.02 |
| 324 | 19.55 | 34.30 | 21000 | 0.38 | 1.03 |
| 333 | 0.99 | 1.73 | 22000 | 0.32 | 0.88 |
| 334 | 0.49 | 0.86 | 23000 | 1.46 | 4.01 |
| 24000 | 1.87 | 5.13 | |||
| 31000 | 1.46 | 4.00 | |||
| 32000 | 29.07 | 79.70 | |||
| Rhodes | Evia | ||||
|---|---|---|---|---|---|
| CLC Code | Area (km2) | Percentage (%) | CLC Code | Area (km2) | Percentage (%) |
| 112 | 0.06 | 0.03 | 121 | 0.19 | 0.96 |
| 142 | 0.26 | 0.15 | 231 | 0.23 | 1.16 |
| 211 | 1.29 | 0.75 | 243 | 4.46 | 22.54 |
| 222 | 0.01 | 0.01 | 321 | 2.25 | 11.37 |
| 223 | 6.77 | 3.92 | 323 | 10.95 | 55.33 |
| 242 | 2.10 | 1.22 | 324 | 0.99 | 5.00 |
| 243 | 20.63 | 11.94 | 333 | 0.72 | 3.64 |
| 312 | 14.04 | 8.13 | |||
| 321 | 12.33 | 7.14 | |||
| 323 | 38.50 | 22.29 | |||
| 324 | 76.52 | 44.29 | |||
| 331 | 0.24 | 0.14 | |||
| Corfu | Magnesia | ||||
|---|---|---|---|---|---|
| CLC Code | Area (km2) | Percentage (%) | CLC Code | Area (km2) | Percentage (%) |
| 142 | 0.00 | 0.00 | 112 | 0.05 | 0.07 |
| 223 | 0.02 | 0.08 | 121 | 0.39 | 0.48 |
| 242 | 1.08 | 4.95 | 122 | 0.41 | 0.50 |
| 243 | 0.39 | 1.78 | 131 | 0.26 | 0.31 |
| 313 | 0.00 | 0.00 | 132 | 0.05 | 0.06 |
| 321 | 2.51 | 11.55 | 133 | 0.26 | 0.31 |
| 323 | 4.60 | 21.20 | 211 | 20.00 | 24.27 |
| 333 | 13.11 | 60.39 | 212 | 4.94 | 6.00 |
| 523 | 0.01 | 0.04 | 222 | 3.00 | 3.64 |
| 223 | 0.89 | 1.08 | |||
| 231 | 3.16 | 3.84 | |||
| 242 | 5.95 | 7.22 | |||
| 243 | 4.26 | 5.17 | |||
| 312 | 0.07 | 0.09 | |||
| 321 | 9.02 | 10.94 | |||
| 323 | 29.15 | 35.37 | |||
| 411 | 0.01 | 0.01 | |||
| 523 | 0.00 | 0.00 | |||
| Loutraki | Dervenochoria | ||||
|---|---|---|---|---|---|
| Tree Cover Density % | Area (km2) | Area Percentage (%) | Tree Cover Density % | Area (km2) | Area Percentage (%) |
| All non-tree-covered areas | 6.35 | 58.05 | All non-tree-covered areas | 70.07 | 58.05 |
| 1–10% | 0.13 | 1.20 | 1–10% | 0.89 | 1.20 |
| 10–20% | 0.03 | 0.27 | 10–20% | 1.65 | 0.27 |
| 20–30% | 0.58 | 4.57 | 20–30% | 3.87 | 4.57 |
| 30–40% | 1.90 | 17.41 | 30–40% | 10.14 | 17.41 |
| 40–50% | 1.27 | 11.59 | 40–50% | 15.44 | 11.59 |
| 50–60% | 1.36 | 12.46 | 50–60% | 8.79 | 12.46 |
| 60–70% | 5.71 | 52.16 | 60–70% | 0.69 | 52.16 |
| 70–80% | 0.00 | 0.02 | 70–80% | 0.01 | 0.02 |
| 80–90% | 0.00 | 0.01 | 80–90% | 0.00 | 0.00 |
| 90–100% | 0.00 | 0.00 | 90–100% | 0.00 | 0.00 |
| Parnitha | Lagonisi | ||||
|---|---|---|---|---|---|
| Tree Cover Density % | Area (km2) | Area Percentage (%) | Tree Cover Density % | Area (km2) | Area Percentage (%) |
| All non-tree-covered areas | 38.67 | 67.82 | All non-tree-covered areas | 36.05 | 98.84 |
| 1–10% | 0.02 | 0.04 | 1–10% | 0.01 | 0.03 |
| 10–20% | 0.08 | 0.15 | 10–20% | 0.01 | 0.03 |
| 20–30% | 0.54 | 0.94 | 20–30% | 0.03 | 0.07 |
| 30–40% | 2.40 | 4.21 | 30–40% | 0.12 | 0.34 |
| 40–50% | 5.59 | 9.81 | 40–50% | 0.22 | 0.61 |
| 50–60% | 6.21 | 10.90 | 50–60% | 0.03 | 0.07 |
| 60–70% | 2.90 | 5.08 | 60–70% | 0.00 | 0.01 |
| 70–80% | 0.46 | 0.81 | 70–80% | 0.00 | 0.00 |
| 80–90% | 0.11 | 0.19 | 80–90% | 0.00 | 0.00 |
| 90–100% | 0.03 | 0.05 | 90–100% | 0.00 | 0.00 |
| Rhodes | Evia | ||||
|---|---|---|---|---|---|
| Tree Cover Density % | Area (km2) | Area Percentage (%) | Tree Cover Density % | Area (km2) | Area Percentage (%) |
| All non-tree-covered areas | 131.33 | 76.00 | All non-tree-covered areas | 19.64 | 99.20 |
| 1–10% | 0.15 | 0.09 | 1–10% | 0.00 | 0.00 |
| 10–20% | 0.42 | 0.24 | 10–20% | 0.00 | 0.00 |
| 20–30% | 1.40 | 0.81 | 20–30% | 0.00 | 0.00 |
| 30–40% | 5.06 | 2.93 | 30–40% | 0.01 | 0.06 |
| 40–50% | 10.51 | 6.09 | 40–50% | 0.03 | 0.15 |
| 50–60% | 14.90 | 8.62 | 50–60% | 0.04 | 0.18 |
| 60–70% | 7.67 | 4.44 | 60–70% | 0.03 | 0.17 |
| 70–80% | 1.29 | 0.75 | 70–80% | 0.03 | 0.15 |
| 80–90% | 0.06 | 0.04 | 80–90% | 0.01 | 0.07 |
| 90–100% | 0.01 | 0.00 | 90–100% | 0.01 | 0.03 |
| Corfu | Magnesia | ||||
|---|---|---|---|---|---|
| Tree Cover Density % | Area (km2) | Area Percentage (%) | Tree Cover Density % | Area (km2) | Area Percentage (%) |
| All non-tree-covered areas | 16.75 | 77.03 | All non-tree-covered areas | 78.35 | 94.95 |
| 1–10% | 0.00 | 0.00 | 1–10% | 0.01 | 0.01 |
| 10–20% | 0.03 | 0.12 | 10–20% | 0.03 | 0.04 |
| 20–30% | 0.17 | 0.77 | 20–30% | 0.09 | 0.11 |
| 30–40% | 0.51 | 2.35 | 30–40% | 0.51 | 0.61 |
| 40–50% | 0.91 | 4.20 | 40–50% | 1.47 | 1.79 |
| 50–60% | 1.07 | 4.92 | 50–60% | 1.50 | 1.82 |
| 60–70% | 0.96 | 4.43 | 60–70% | 0.51 | 0.62 |
| 70–80% | 0.70 | 3.23 | 70–80% | 0.04 | 0.05 |
| 80–90% | 0.37 | 1.71 | 80–90% | 0.00 | 0.00 |
| 90–100% | 0.27 | 1.24 | 90–100% | 0.00 | 0.00 |
| Evros | ||
|---|---|---|
| Tree Cover Density % | Area (km2) | Area Percentage (%) |
| All non-tree-covered areas | 216.51 | 23.97 |
| 1–10% | 0.26 | 0.03 |
| 10–20% | 2.78 | 0.31 |
| 20–30% | 17.67 | 1.96 |
| 30–40% | 54.89 | 6.08 |
| 40–50% | 88.50 | 9.80 |
| 50–60% | 116.18 | 12.87 |
| 60–70% | 152.27 | 16.86 |
| 70–80% | 147.35 | 16.32 |
| 80–90% | 81.32 | 9.01 |
| 90–100% | 25.32 | 2.80 |
Disclaimer/Publisher’s Note: The statements, opinions and data contained in all publications are solely those of the individual author(s) and contributor(s) and not of MDPI and/or the editor(s). MDPI and/or the editor(s) disclaim responsibility for any injury to people or property resulting from any ideas, methods, instructions or products referred to in the content. |
© 2024 by the authors. Licensee MDPI, Basel, Switzerland. This article is an open access article distributed under the terms and conditions of the Creative Commons Attribution (CC BY) license (https://creativecommons.org/licenses/by/4.0/).
Share and Cite
Dosiou, A.; Athinelis, I.; Katris, E.; Vassalou, M.; Kyrkos, A.; Krassakis, P.; Parcharidis, I. Employing Copernicus Land Service and Sentinel-2 Satellite Mission Data to Assess the Spatial Dynamics and Distribution of the Extreme Forest Fires of 2023 in Greece. Fire 2024, 7, 20. https://doi.org/10.3390/fire7010020
Dosiou A, Athinelis I, Katris E, Vassalou M, Kyrkos A, Krassakis P, Parcharidis I. Employing Copernicus Land Service and Sentinel-2 Satellite Mission Data to Assess the Spatial Dynamics and Distribution of the Extreme Forest Fires of 2023 in Greece. Fire. 2024; 7(1):20. https://doi.org/10.3390/fire7010020
Chicago/Turabian StyleDosiou, Anna, Ioannis Athinelis, Efstratios Katris, Maria Vassalou, Alexandros Kyrkos, Pavlos Krassakis, and Issaak Parcharidis. 2024. "Employing Copernicus Land Service and Sentinel-2 Satellite Mission Data to Assess the Spatial Dynamics and Distribution of the Extreme Forest Fires of 2023 in Greece" Fire 7, no. 1: 20. https://doi.org/10.3390/fire7010020
APA StyleDosiou, A., Athinelis, I., Katris, E., Vassalou, M., Kyrkos, A., Krassakis, P., & Parcharidis, I. (2024). Employing Copernicus Land Service and Sentinel-2 Satellite Mission Data to Assess the Spatial Dynamics and Distribution of the Extreme Forest Fires of 2023 in Greece. Fire, 7(1), 20. https://doi.org/10.3390/fire7010020