Article

A Preliminary Case Study on the Compounding Effects of Local Emissions and Upstream Wildfires on Urban Air Pollution

by
Daniel L. Mendoza
1,2,3,*,
Erik T. Crosman
4,
Tabitha M. Benney
5,
Corbin Anderson
6 and
Shawn A. Gonzales
6
1
Department of Atmospheric Sciences, University of Utah, 135 S 1460 E, Room 819, Salt Lake City, UT 84112, USA
2
Pulmonary Division, School of Medicine, University of Utah, 26 N 1900 E, Salt Lake City, UT 84132, USA
3
Department of City & Metropolitan Planning, University of Utah, 375 S 1530 E, Suite 220, Salt Lake City, UT 84112, USA
4
Department of Life, Earth and Environmental Sciences, West Texas A&M University, Natural Sciences Building 343, Canyon, TX 79016, USA
5
Department of Political Science, University of Utah, 260 S Central Campus Drive, Salt Lake City, UT 84112, USA
6
Salt Lake County Health Department, Air Quality Bureau, Environmental Health Division, 788 E Woodoak Lane, Murray, UT 84107, USA
*
Author to whom correspondence should be addressed.
Fire 2024, 7(6), 184; https://doi.org/10.3390/fire7060184
Submission received: 7 April 2024 / Revised: 18 May 2024 / Accepted: 27 May 2024 / Published: 29 May 2024
(This article belongs to the Special Issue Post-fire Effects on Environment)

Abstract

:
Interactions between urban and wildfire pollution emissions are active areas of research, with numerous aircraft field campaigns and satellite analyses of wildfire pollution being conducted in recent years. Several studies have found that elevated ozone and particulate pollution levels are both generally associated with wildfire smoke in urban areas. We measured pollutant concentrations at two Utah Division of Air Quality regulatory air quality observation sites and a local hot spot (a COVID-19 testing site) within a 48 h period of increasing wildfire smoke impacts that occurred in Salt Lake City, UT (USA) between 20 and 22 August 2020. The wildfire plume, which passed through the study area during an elevated ozone period during the summer, resulted in increased criteria pollutant and greenhouse gas concentrations. Methane (CH4) and fine particulate matter (PM2.5) increased at comparable rates, and increased NOx led to more ozone. The nitrogen oxide/ozone (NOx/O3) cycle was clearly demonstrated throughout the study period, with NOx titration reducing nighttime ozone. These findings help to illustrate how the compounding effects of urban emissions and exceptional pollution events, such as wildfires, may pose substantial health risks. This preliminary case study supports conducting an expanded, longer-term study on the interactions of variable intensity wildfire smoke plumes on urban air pollution exposure, in addition to the subsequent need to inform health and risk policy in these complex systems.

1. Introduction

As we move into an era where humans are increasingly disrupting the natural biological, chemical, and geological cycles at a planetary scale [1], improved scientific understanding is needed to unravel the complexity of these human-influenced systems and how they interact with other natural systems [2]. Despite recent scientific advances, there remains a large gap between scientific reality and our understanding of how complex, dynamic systems (i.e., climate change, production processes, and pollution) work together [3]. One area of growing interest in adaptive capacity is the wildland–urban interface (WUI). With the rise of human-induced wildfire events, there is a growing need to improve our understanding of wildfire/urban interactions [4] as it pertains to human health [5], ecological impacts [6], as well as characterizing the complex chemical processes that occur [7]. To improve our adaptive capacity in dynamic systems within the context of the WUI, our team mapped the onset and interaction effects of air quality and climate change-related phenomena using direct measurement [8].
Interactions between urban and wildfire pollution emissions are active areas of research, and numerous aircraft field campaigns and satellite analyses of wildfire pollution have been conducted in recent years [9,10,11]. A number of studies have found that elevated ozone and particulate pollution levels are both generally associated with wildfire smoke in urban areas [12,13], as well as elevated black carbon [14]. In addition to particulate pollution, a wide range of hazardous air pollutants (HAPS) have been measured during wildfire smoke episodes over urban regions, including acetaldehyde, formaldehyde, and tetrachloroethylene [15]. As discussed by Wang et al. 2024 [14], the quantities of volatile organic compounds (VOCs) such as benzene and toluene are also found to be very elevated in urban air that is influenced by wildfire smoke. McClure and Jaffe [16] found enhancements of 32% in maximum 8 h tropospheric ozone levels during wildfire smoke events at a study site in Idaho. Another study noted that the greatest wildfire-produced ozone concentrations are noted during the nighttime from the advection of ozone that was photochemically produced upwind of urban areas [17]. Childs et al. [18] found that in the last ten years, daily fine particulate matter (PM2.5) concentrations from smoke have risen by up to 5 μg m−3 in the Western US. Abatzoglou et al. [19] also found that interannual variations in area burned in the Western US are strongly positively correlated with climactic warming and drying, with large increases in acres burned by wildland fires since 1980, and these trends are expected to continue [20]. Local ozone photochemistry (titration) during smoky conditions in urban environments primarily depends on the amount of available nitrogen oxides (NOx), as large concentrations of VOCs are typically transported with the smoke plume [21]. In addition to the notable increases in ozone and particulate pollution associated with wildfires, other pollutants transported with wildfire smoke into urban areas include carbon monoxide (CO), methane (CH4), ammonia (NH3), and VOCs [22].
Another active area of research is how to best improve warning systems for wildfire smoke pollution for vulnerable populations to give adequate warnings for vulnerable populations to prepare for the impact of pollution. For example, the Vegetation Fire and Smoke Pollution Warning Advisory and Assessment System (VFSP-WAS) through the World Health Organization (WHO) was initiated in 2018 in response to the need to address the many impacts of fires and smoke pollution worldwide [23]. Fire early warning systems have been developed and are in place in several parts of the world, such as the Global Wildland Fire Early Warning System, which has been demonstrated in many areas, including Africa and South America [24].
Previous research has studied urban pollution “hot spots” (e.g., elevated traffic emissions due to major highways and other local emissions maxima within an urban region) [25,26]. However, limited studies have investigated or collected observations on urban–wildfire interactions (i.e., the superposition with wildfire smoke plumes that are transported into the urban environment superimposed on the pre-existing urban pollution). To add to the research in this area, we measured pollutant concentrations at two regulatory air quality observation sites and a local hot spot (a COVID-19 testing site) during a day with elevated pollution from wildfires and a non-wildfire day in Salt Lake City, UT (USA) in August 2020. The goal was to understand the air quality impacts associated with the interaction of pollution events, especially as it pertains to elevated PM2.5 and ozone levels. Two research hypotheses that motivated this preliminary study were as follows: how do the compounding effects of urban emissions and significant wildfire pollution events evolve, and what is the spatiotemporal variability of key criteria pollutants during such episodes. In this study, we provide some preliminary observations that support a future, more detailed study to be conducted in the Salt Lake Valley, Utah, at an ideal location for observing interactions between regional wildfire smoke transport into an urban region.

2. Materials and Methods

2.1. Study Site

The Salt Lake Valley (SLV) is well-known for experiencing major episodes of poor air quality because of the surrounding mountains that trap pollutants within the basin [27,28]. The SLV is currently in nonattainment status under National Ambient Air Quality Standards (NAAQS) as regulated by the Environmental Protection Agency (EPA) for PM2.5 and ozone. These poor air quality episodes in the SLV affect approximately 1.34 million inhabitants [29]. During the winter, the primary air pollutant of concern is PM2.5 [30,31], which originates from a variety of sources, including vehicles, trains, aircraft, residential heating, wood-burning stoves, and industrial facilities [32,33]. During atmospheric inversion (high stability) events, relative humidity increases can lead to elevated levels of particulate matter [34]. During the summer, both PM2.5 and ozone are major pollutants, and they are exacerbated by both near and distant wildfire emissions. Figure 1 provides an overview of SLV’s population density, air quality monitoring sites, and major highways. The COVID-19 testing site was located at the Utah State Fairgrounds (“Testing Site”) (40.77237° N, −111.92126° W [35], elevation 1288 MASL [36]) and the mobile van was 5 m west of the testing site. Two Utah Division of Air Quality (UDAQ) were used as reference sites—Rose Park (40.79408° N, −111.93081° W, elevation 1286 MASL—1.5 km northwest of the testing site) and Hawthorne (40.73437° N, −111.87217° W, elevation 1306 MASL—4.5 km southeast of the testing site).

2.2. Study Period

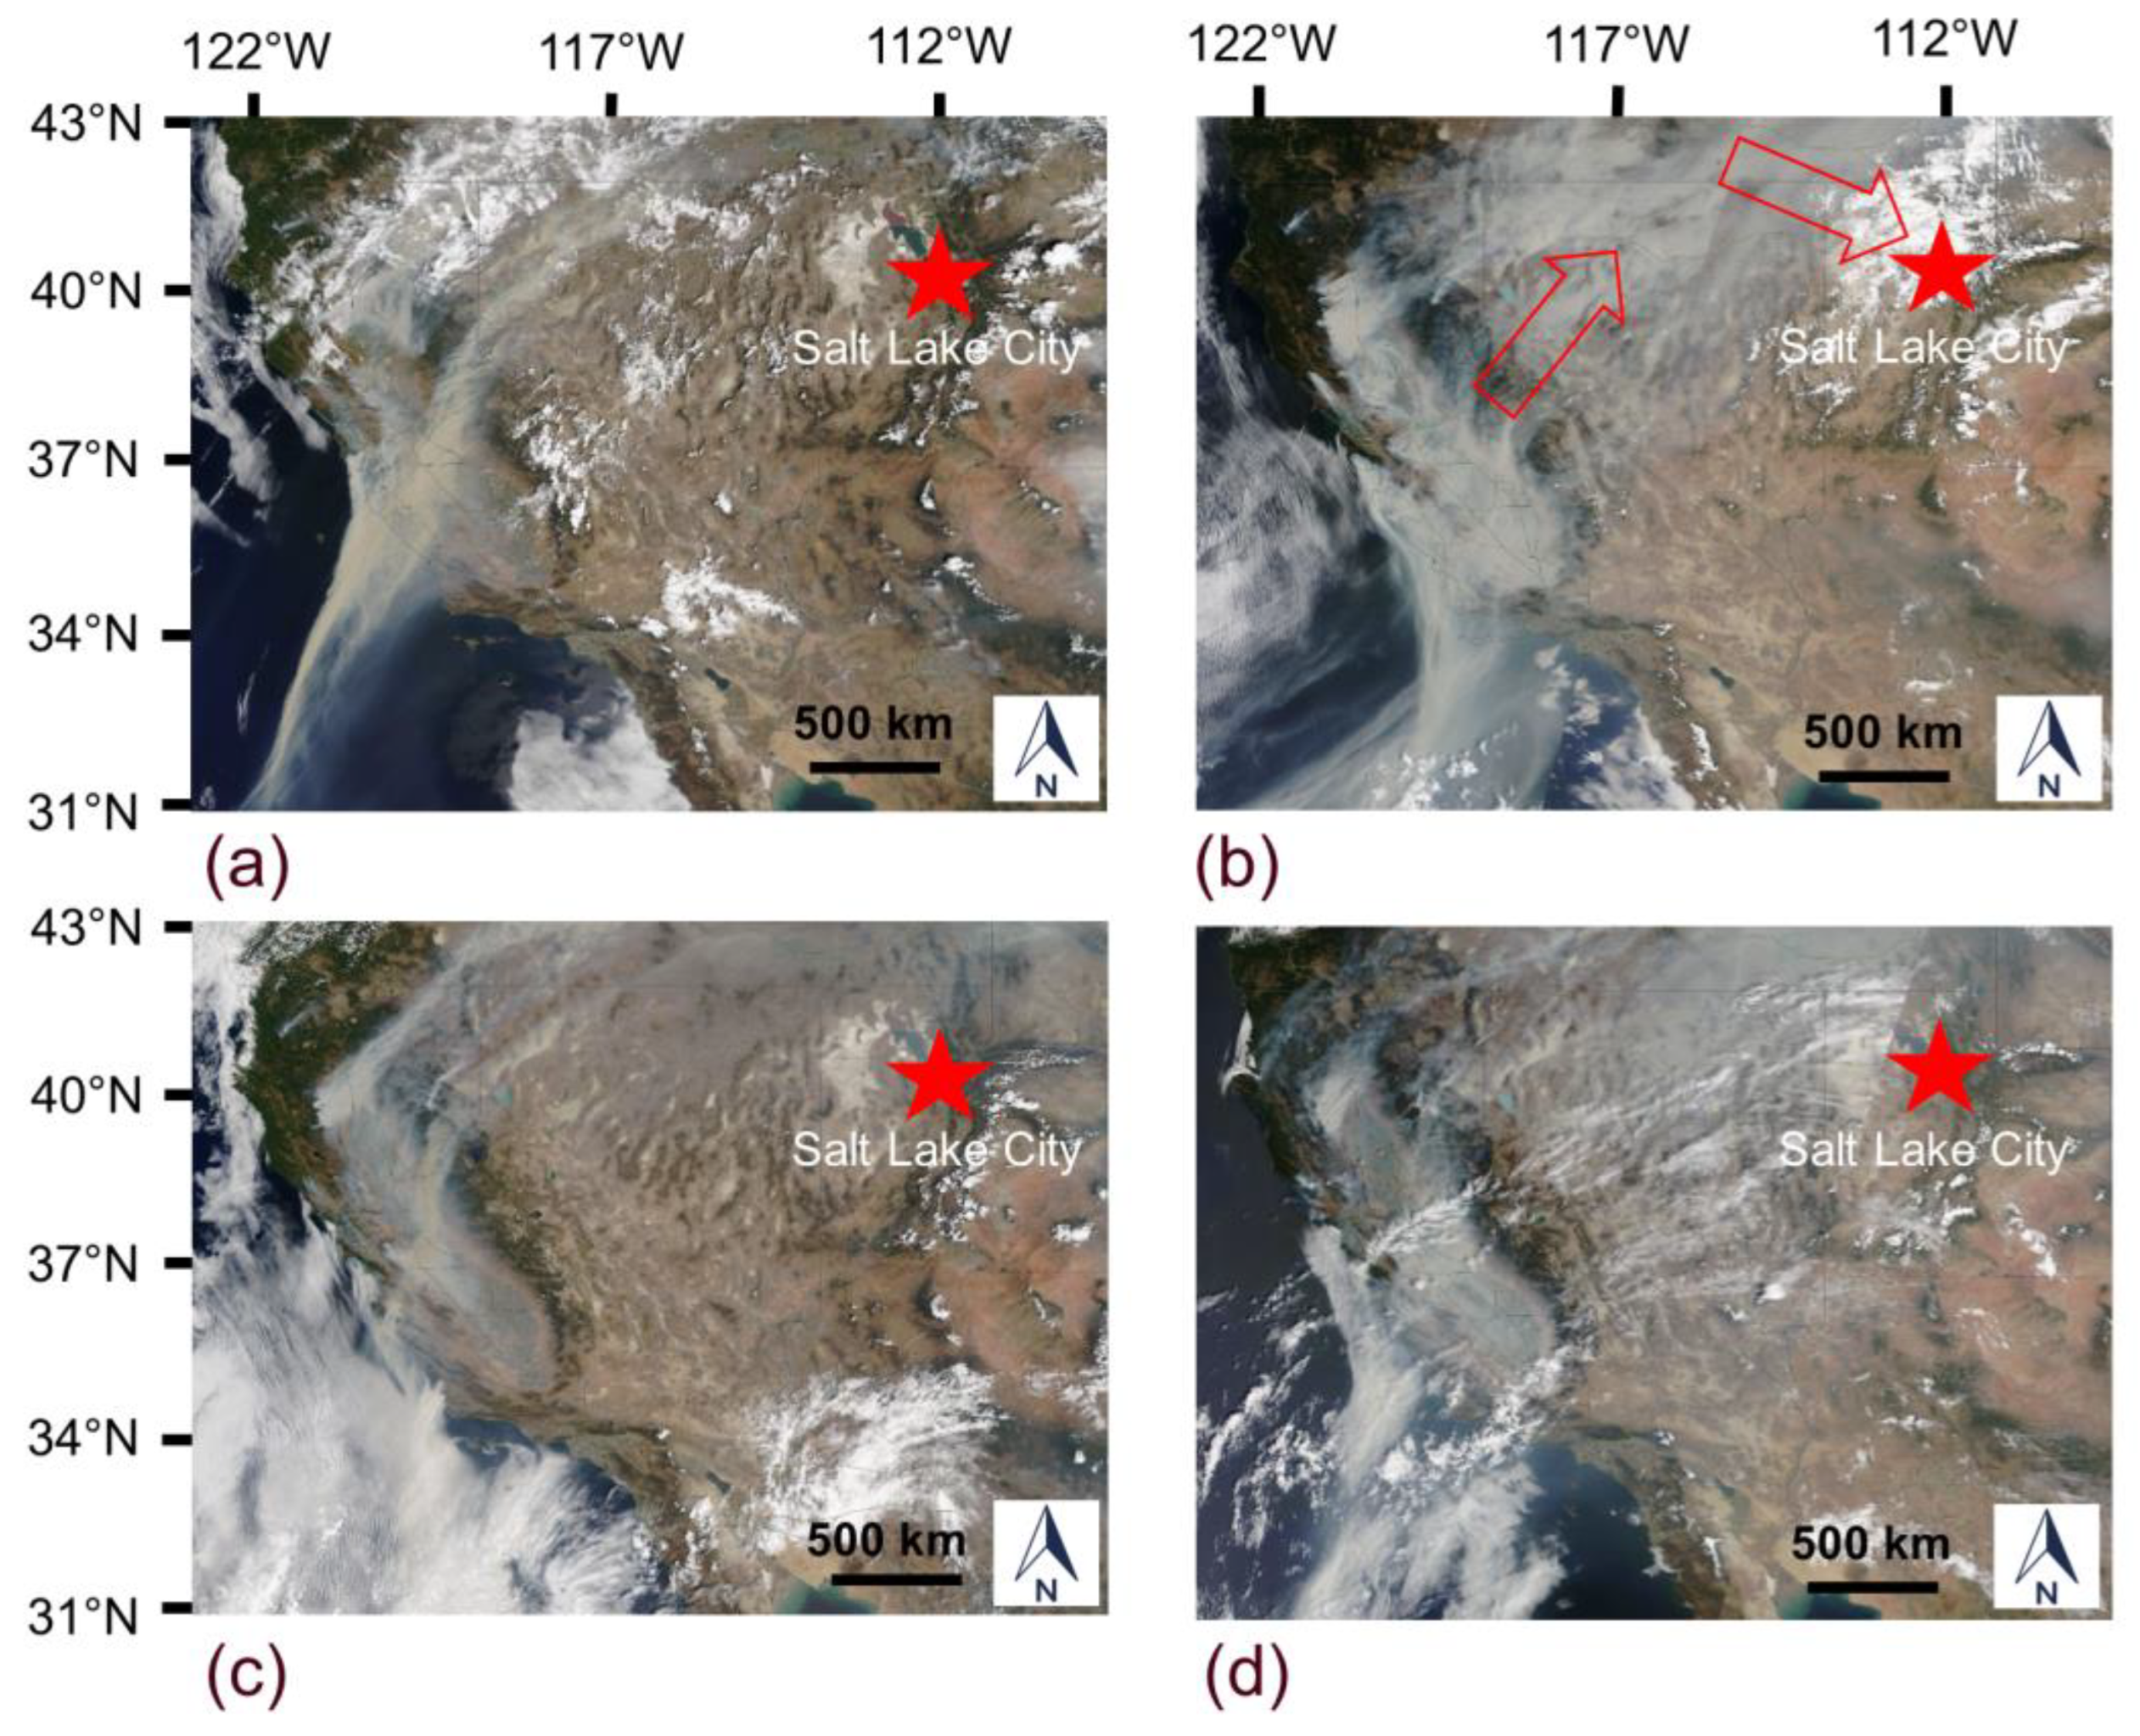
This study took place on 20–21 August 2020. The COVID-19 testing site had recently been opened, and there was substantial interest in understanding the potential air quality impacts of a drive-through facility. Because of the concern for elevated ozone during the summer, the study period was selected to evaluate its air quality effects. Furthermore, since 2020 resulted in a relatively active wildfire season, we wanted to capture the signal of a large wildfire and quantify its impact on the overall observed pollutants in an urban region downstream of the wildfire. MODIS satellite images for the two study days (Figure 2) demonstrate the transport of wildfire smoke from California to Utah. On 19 August, the air over Utah was relatively clear (Figure 2a), but wildfire smoke began to arrive on 20 August (Figure 2b). By 21 August, a thick wildfire plume was observed on satellite just to the west of SLC, arriving in SLC that day (upper right corner of Figure 2b). The plume had largely dissipated by 22 August 2020 (Figure 2d).
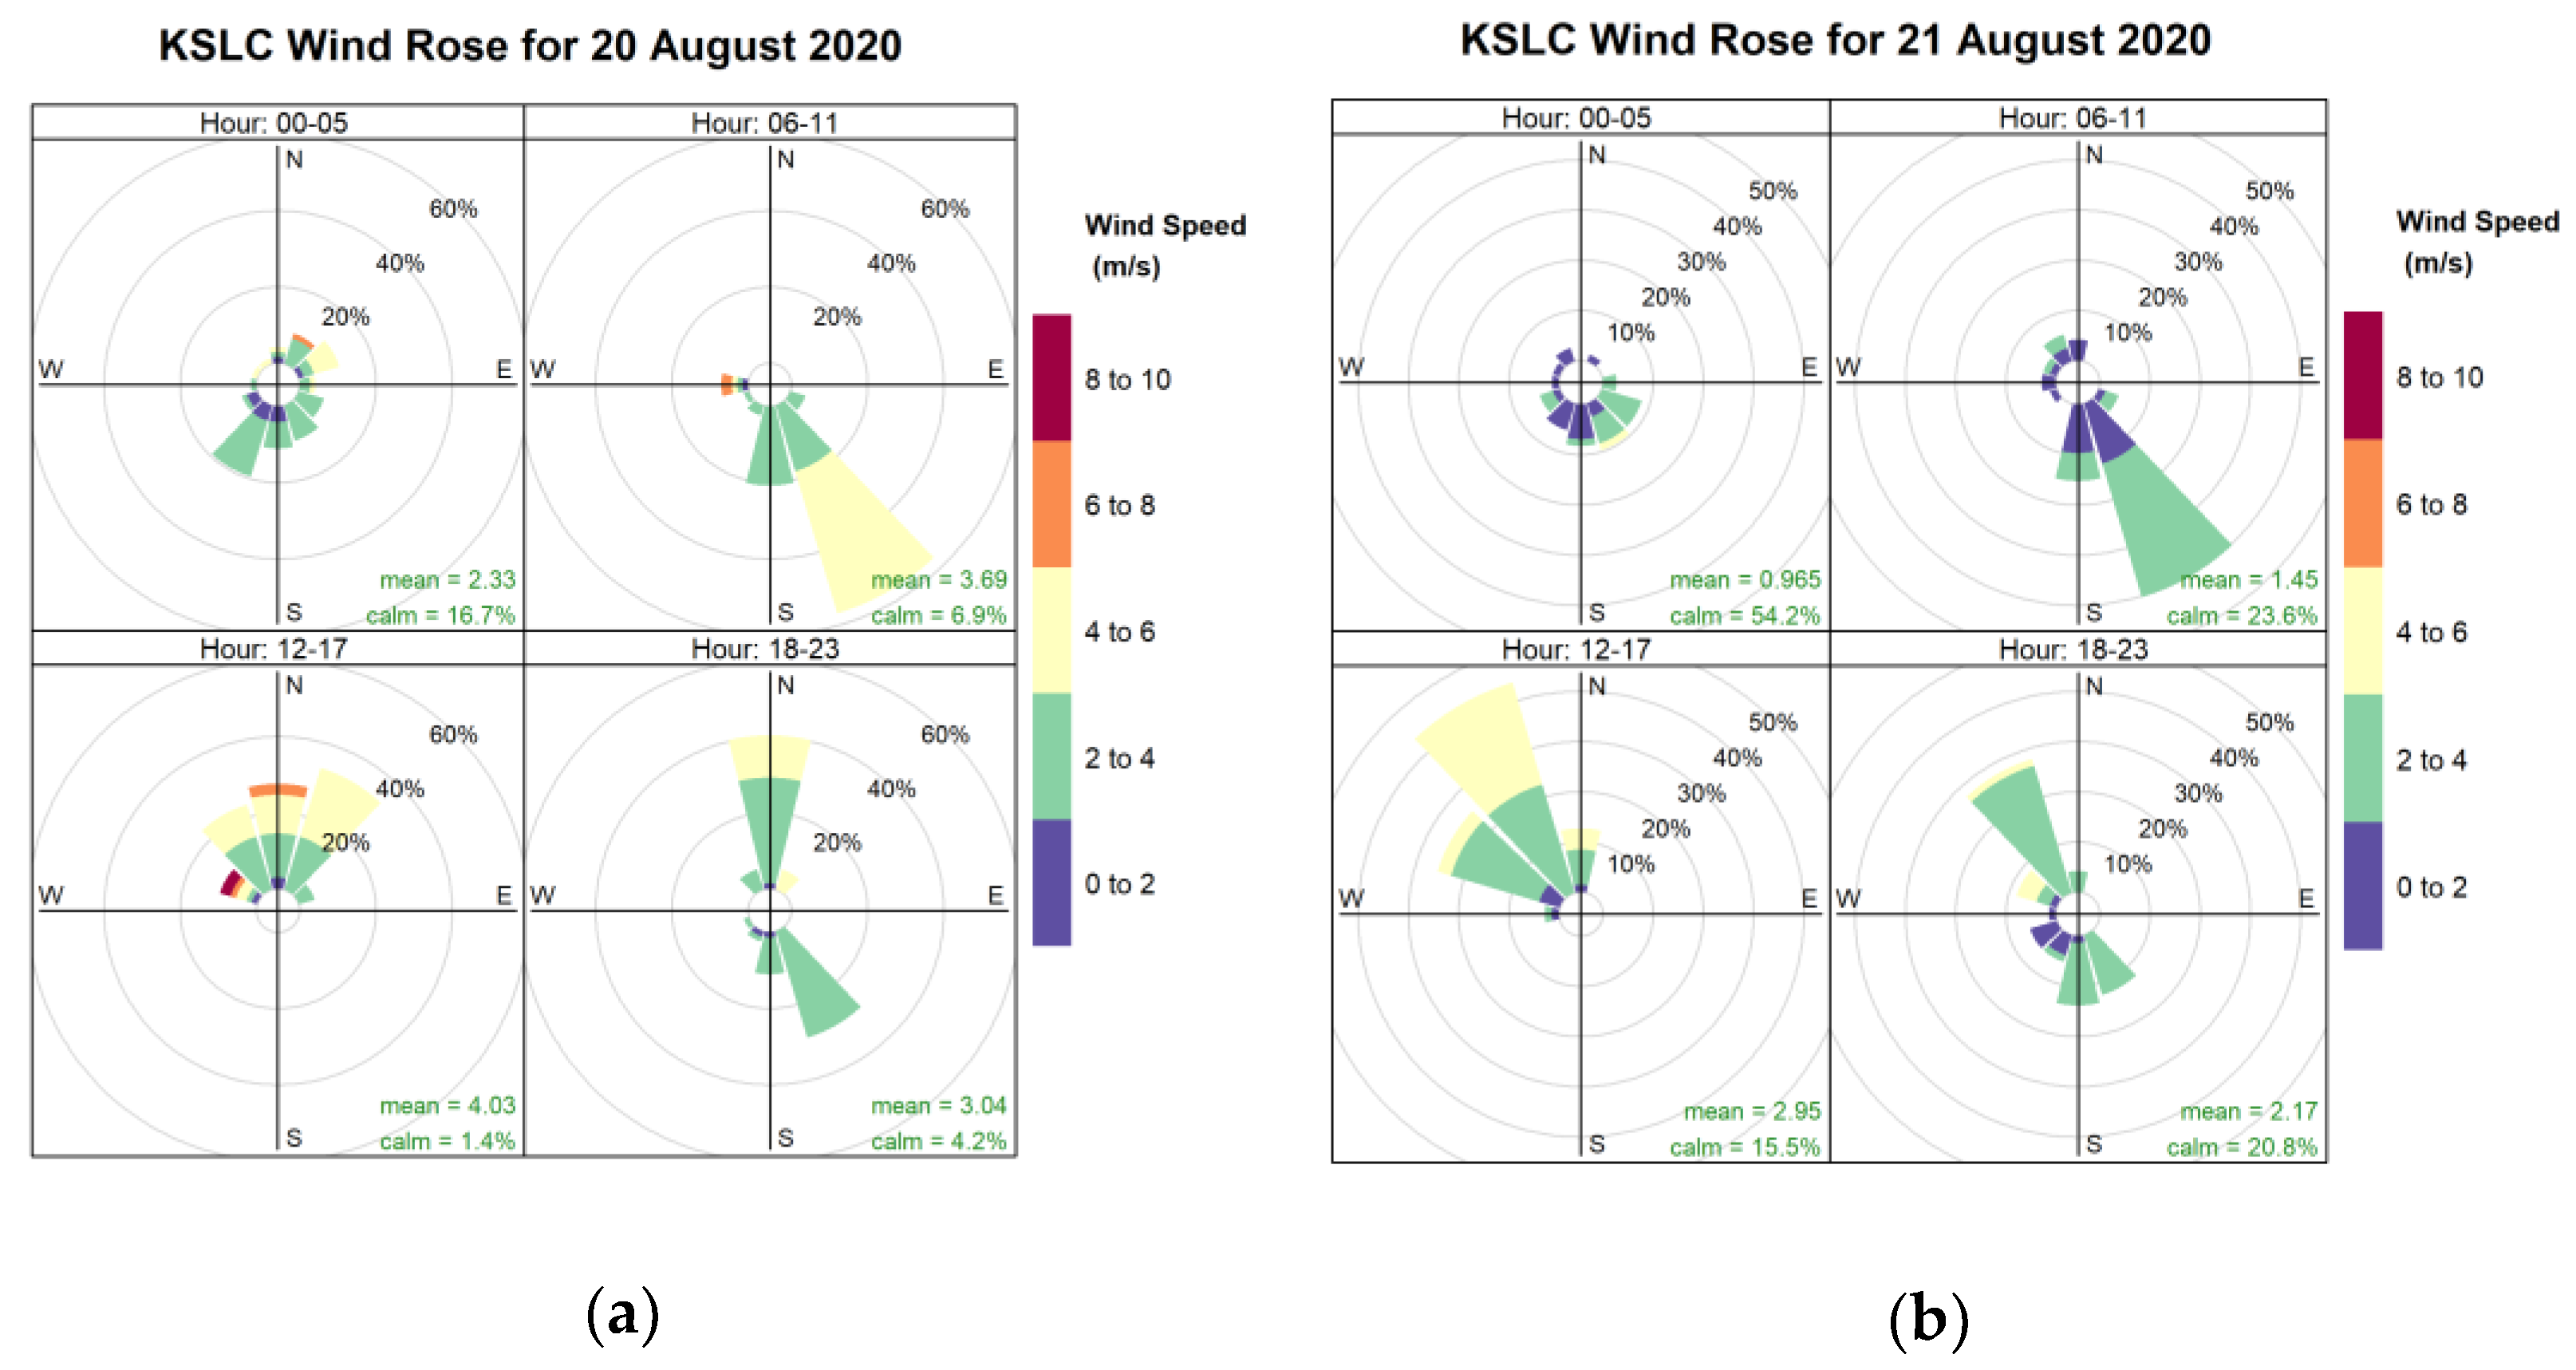
The Salt Lake City International Airport (KSLC) operates a National Weather Service (NWS) station that is approximately 4 km west of the COVID-19 testing site. Due to lake breeze effects, the morning winds are predominantly southeast, while the afternoon winds are predominantly north and northwest. This consistent pattern was observed during the study period (Figure 3), with a clear SE/NW gradient during the day that was impacted by wildfire smoke—21 August 2020 (Figure 3b).

2.3. Instrumentation

The instruments at each of the three measurement sites are listed in Table 1. The UDAQ monitoring stations manage regulatory sensors while the mobile van, located at the COVID-19 testing site, utilizes research-grade units, several of which meet the standard of the federal equivalent method (FEM).
The sensors in the van are described in detail in Bush et al. [37], Hopkins et al. [38], and Mendoza et al. [39]. Carbon dioxide (CO2) and methane (CH4) were measured using a Los Gatos Research Ultra-portable Greenhouse Gas Analyzer [40]. These greenhouse gas measurements were calibrated using reference tank gas tanks [41]. Carbon monoxide (CO) was measured using a Picarro model G1302 sensor [42]. Ozone was measured using a 2B Technologies Model 205 monitor, which is approved as a US EPA FEM with a tolerance of 2% [43]. Nitrogen oxides were measured using a 2B Technologies Model 405 unit which is approved as a US EPA FEM with a tolerance of 2% [44]. PM2.5 was measured using a MetOne Instruments ES-642 Remote Dust Monitor, which is a research-grade instrument with a tolerance of 1 µg m−3 [45]. The UDAQ stations measured CO, NOx, PM2.5, and ozone, were all approved as US EPA FEM, and the sensor network is described in UDAQ’s 2020 Annual Report [46].

3. Results

3.1. Pollutant Timeseries

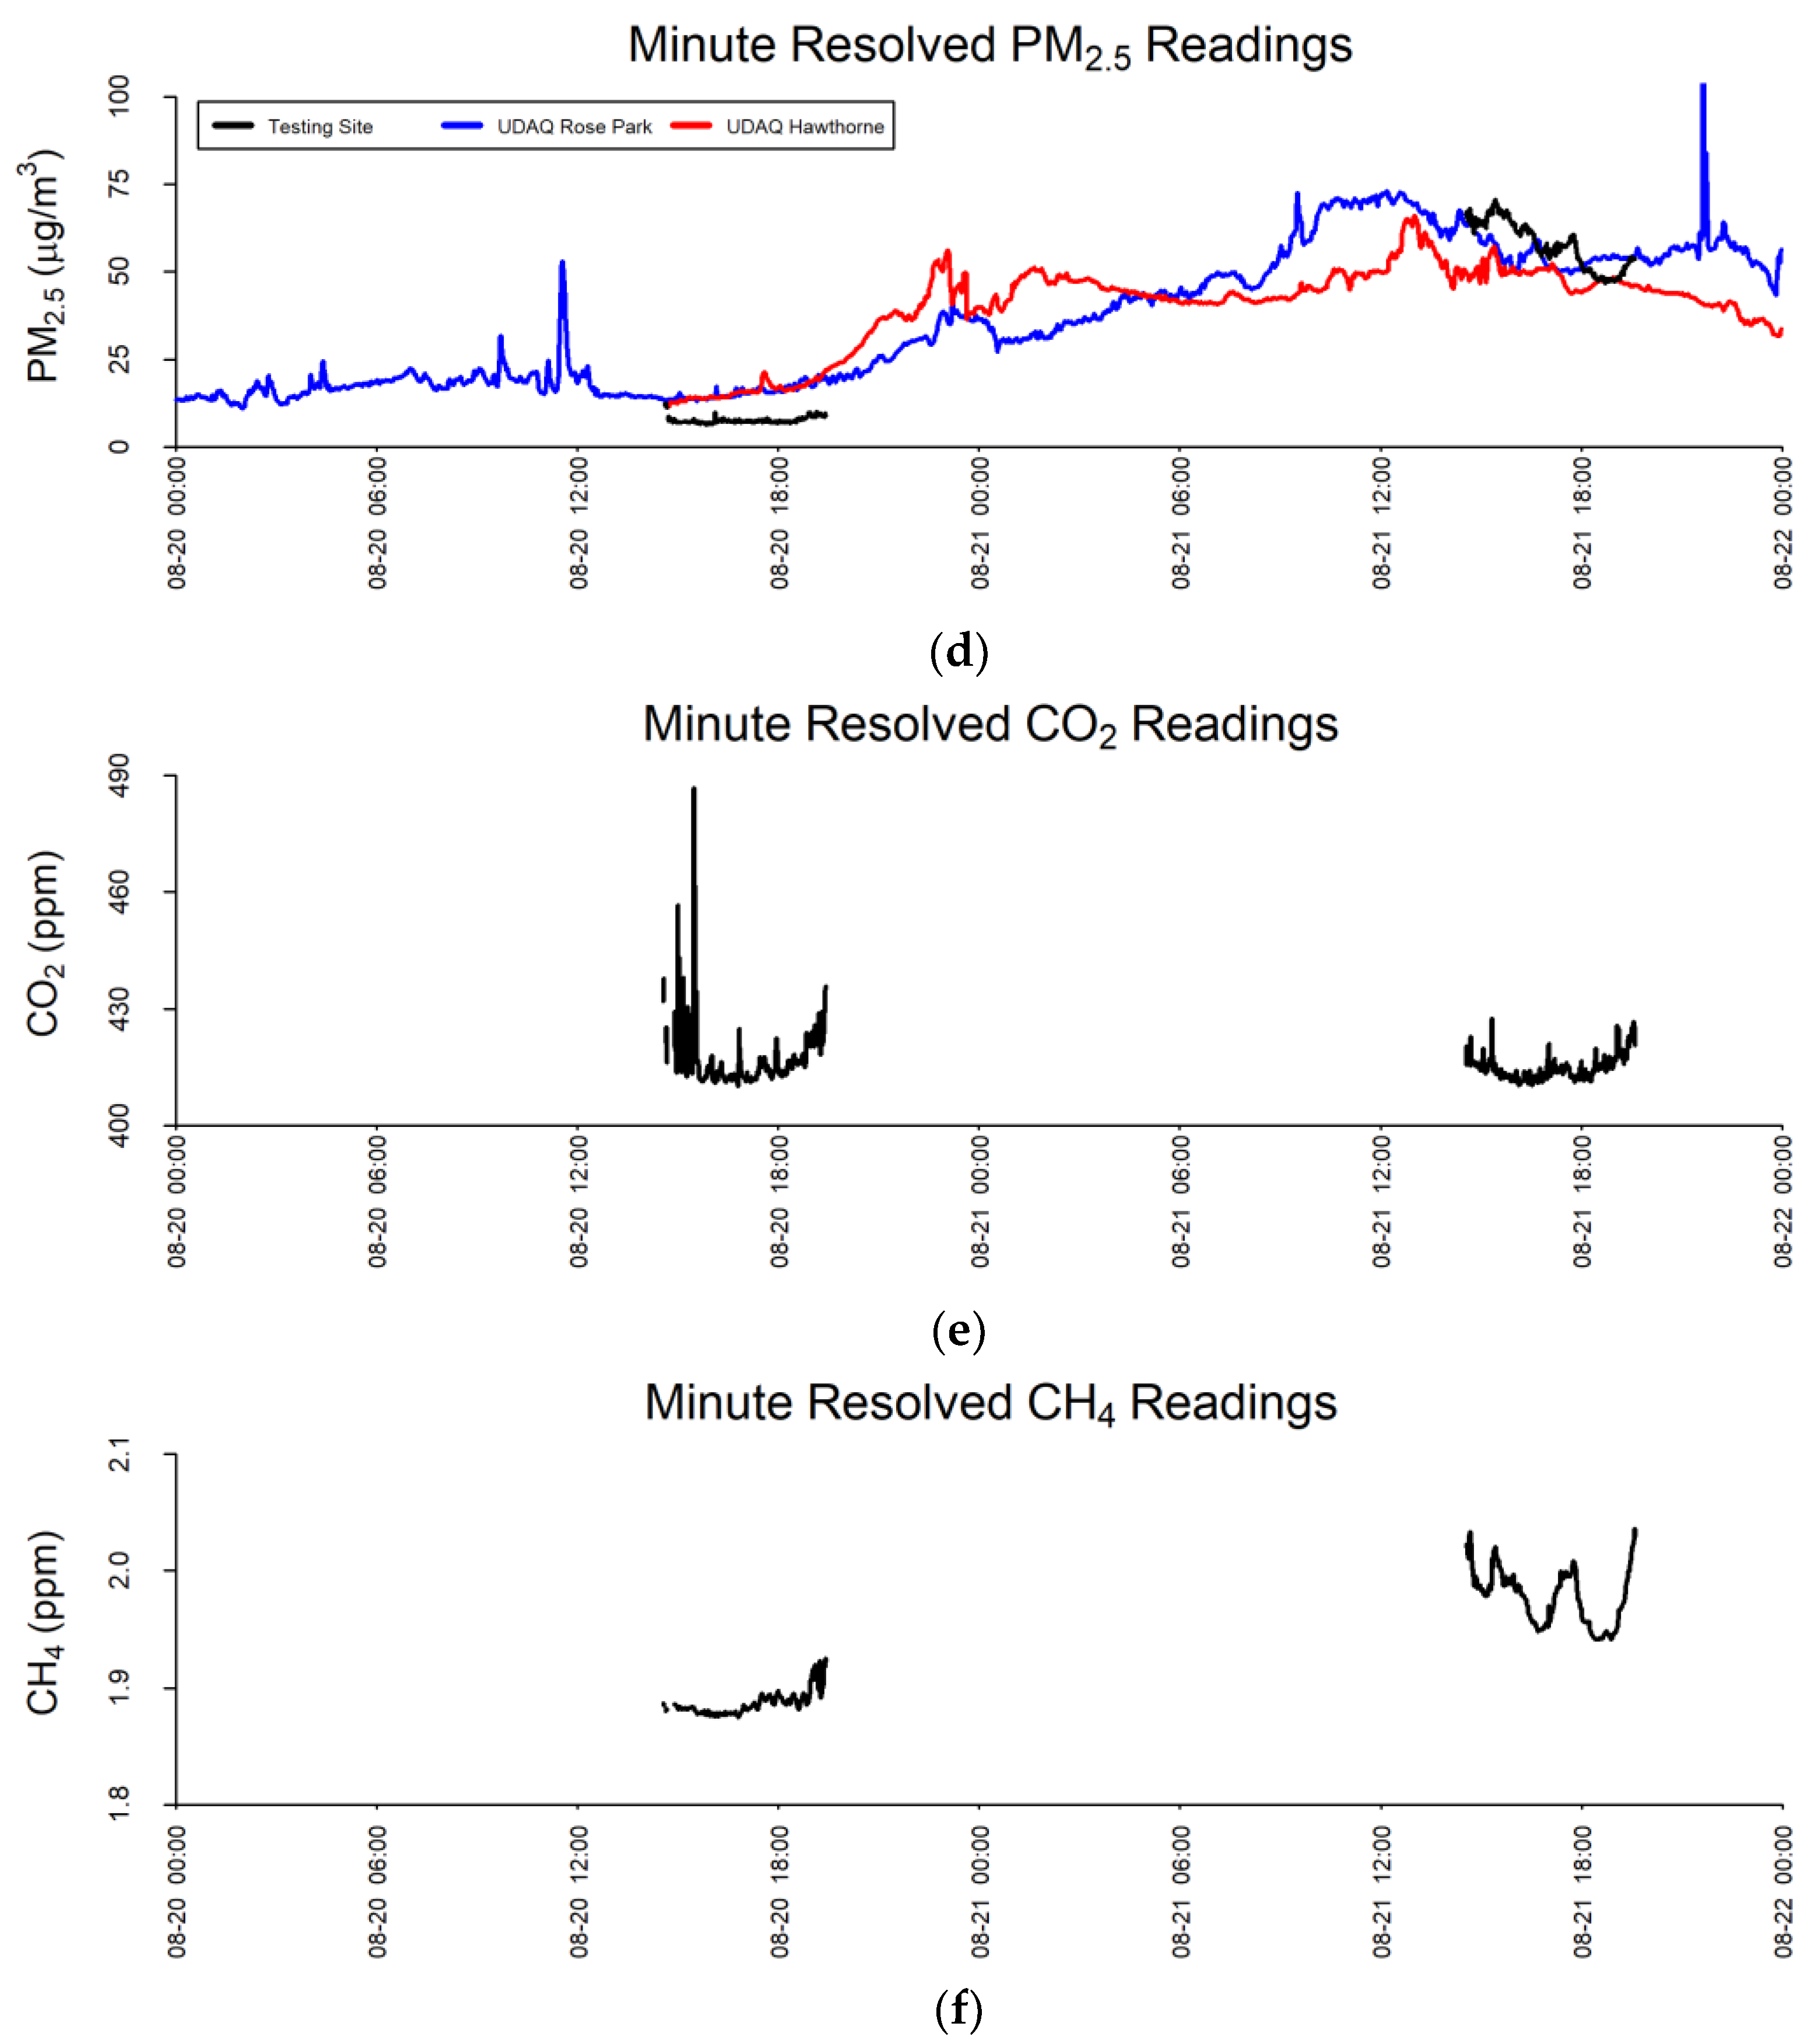
The pollutant time series for the study period are shown in Figure 4. The mobile van monitoring was turned on from approximately 15:00 to 20:00 h local time. The diurnal emission patterns associated with rush hour traffic, most notably in the morning, are observed in both CO and NOx readings (Figure 4a,b). Superimposed on the diurnal urban emission patterns are the impacts of the wildfire plume on the urban air quality. The addition of emissions of volatile organic compounds (VOCs) and nitrogen oxides from wildfires modulate as expected during the observed time series due to the primary emissions associated with the wildfire smoke as well as a key secondary pollutant, ozone. CO readings are elevated on the second day, likely due to CO contributions to the urban air from the wildfire plume (Figure 4a).
Wildfire smoke was increasingly impacting the SLV during the period, as evidenced by the steady increase in PM2.5 after approximately 18:00 h on the first day, as illustrated in Figure 4d. Increases in observed CO are also noted on day two compared to day one, likely due to the increasing introduction of CO from the wildfire plume impacting the SLV. Spatially across the region, the COVID-19 testing site shows lower CO, NOx, and PM2.5 compared to the UDAQ sites (Figure 4a,b,d). This is likely attributable to its location inside the fairgrounds compared to the UDAQ sites, which are near major roads and, therefore, reflect greater roadway emissions.

3.2. Pollutant Comparison

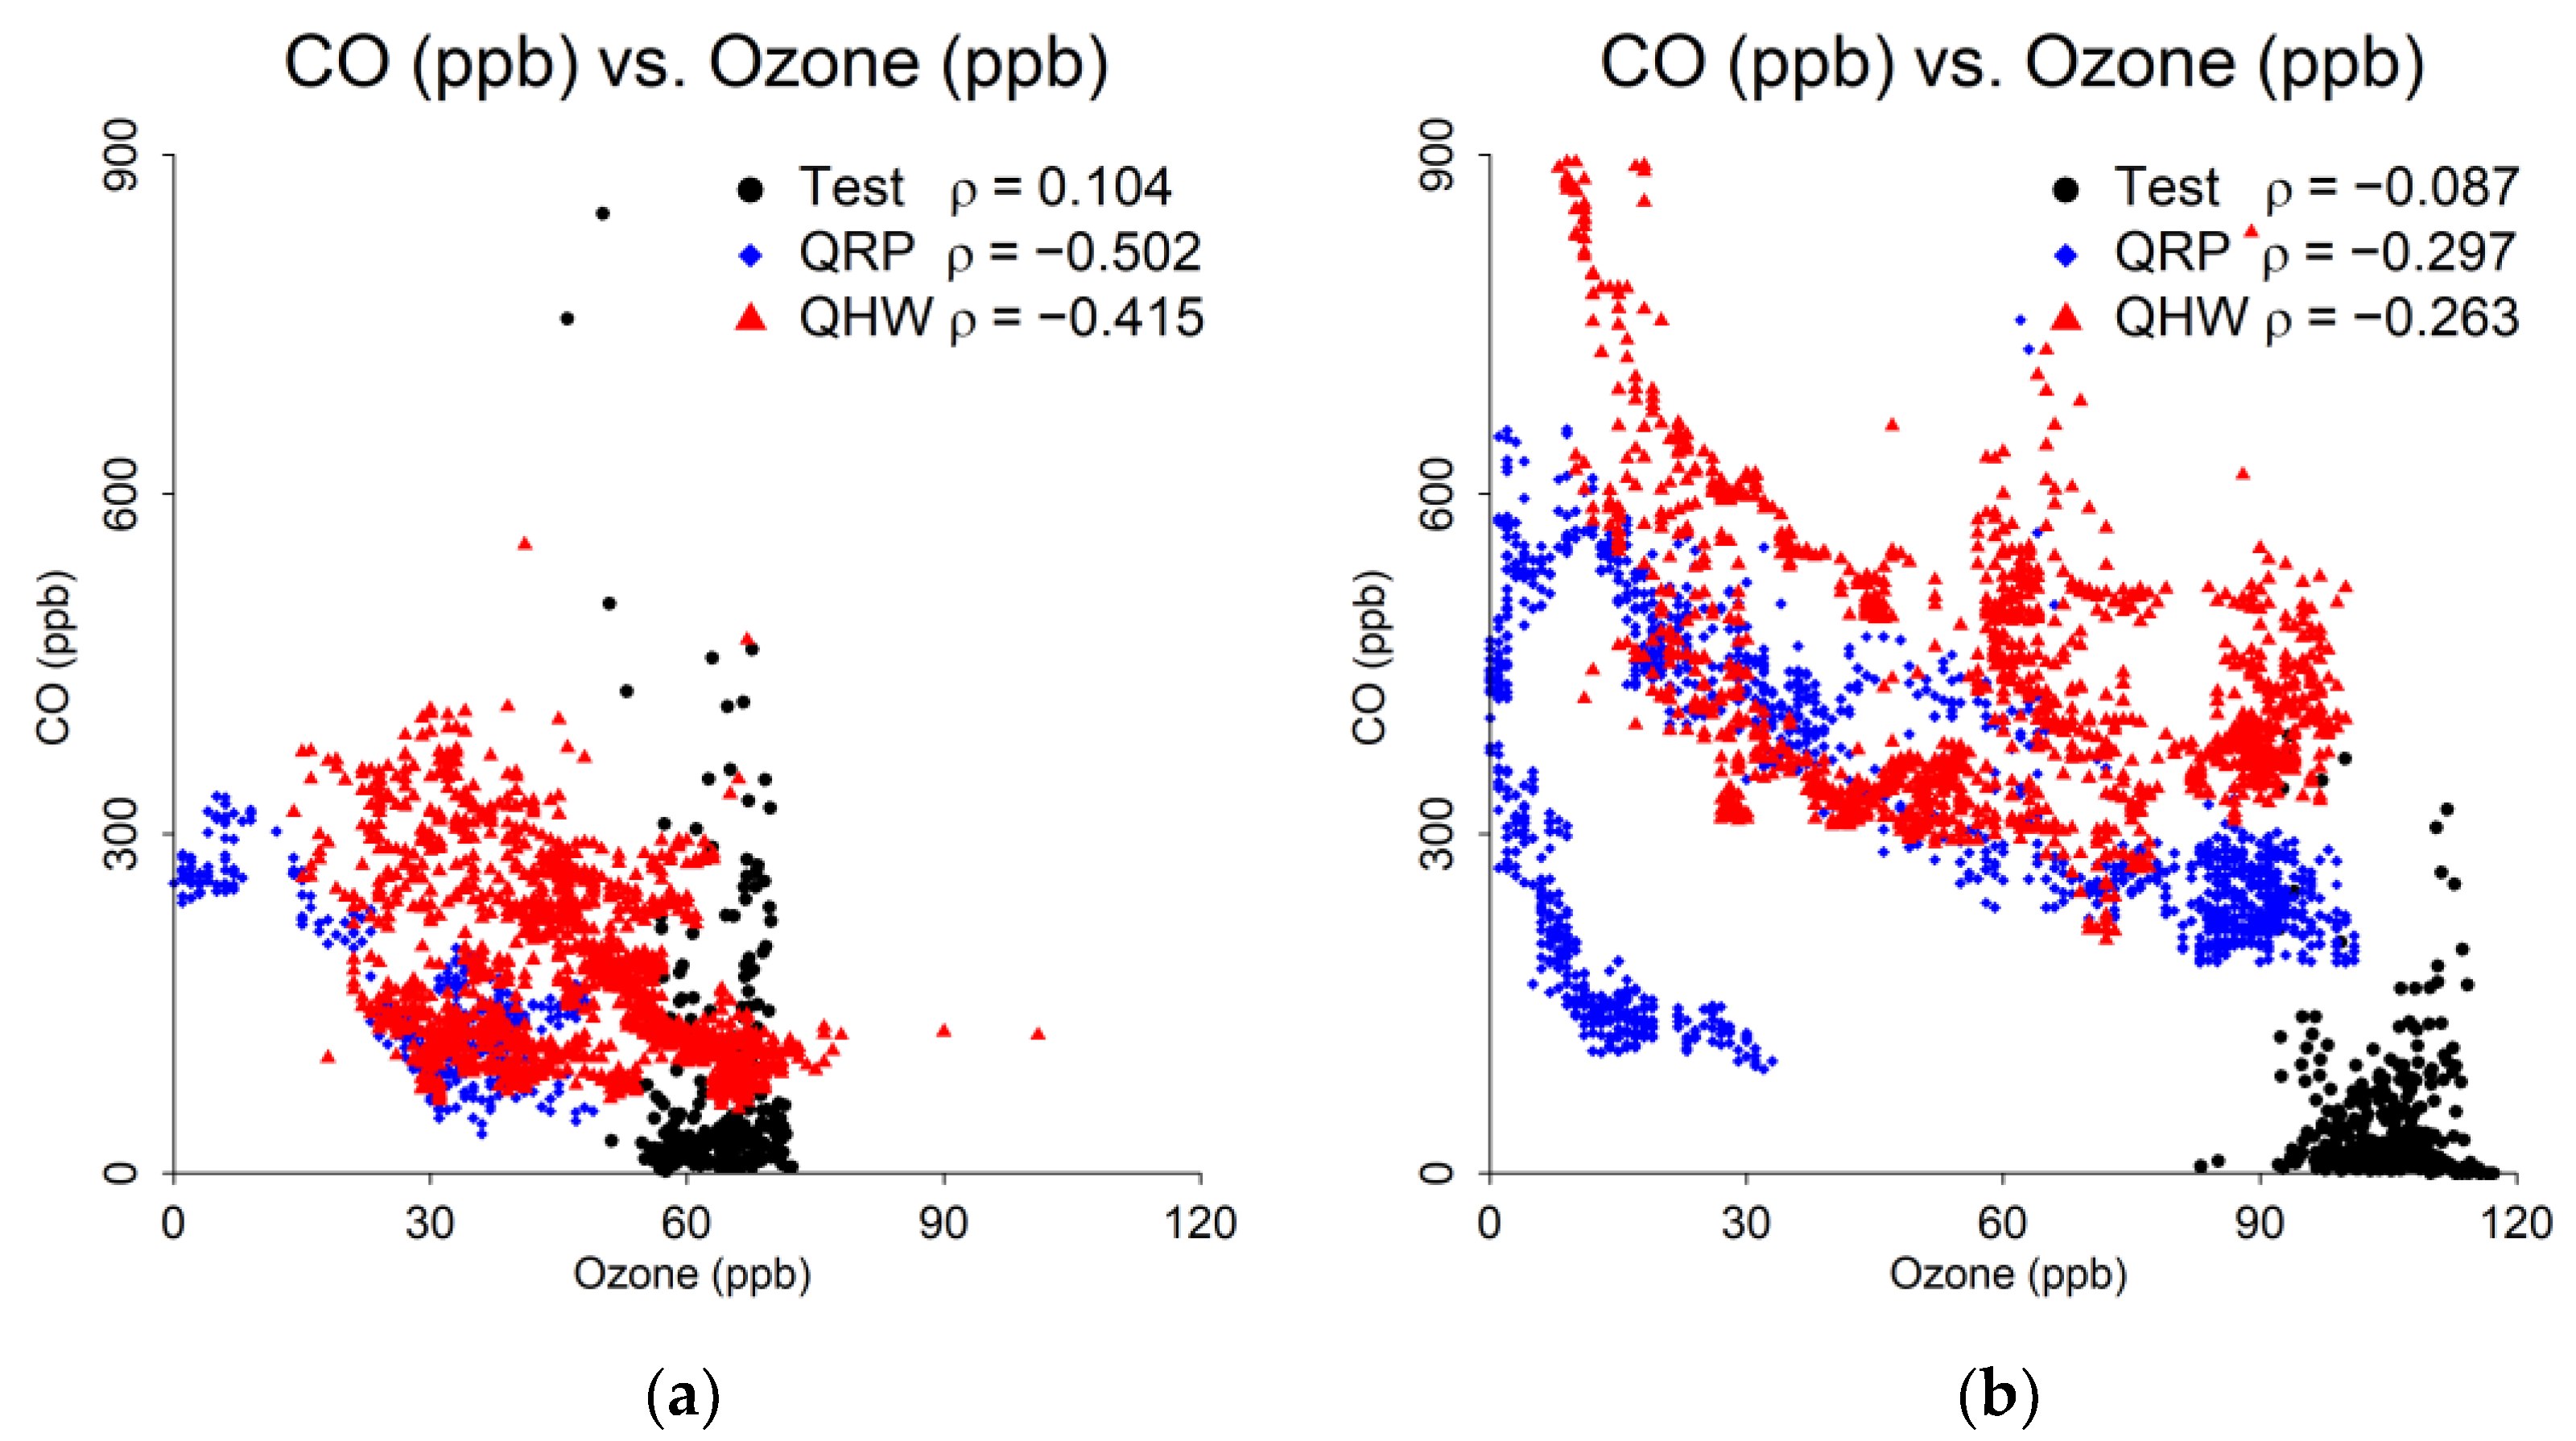
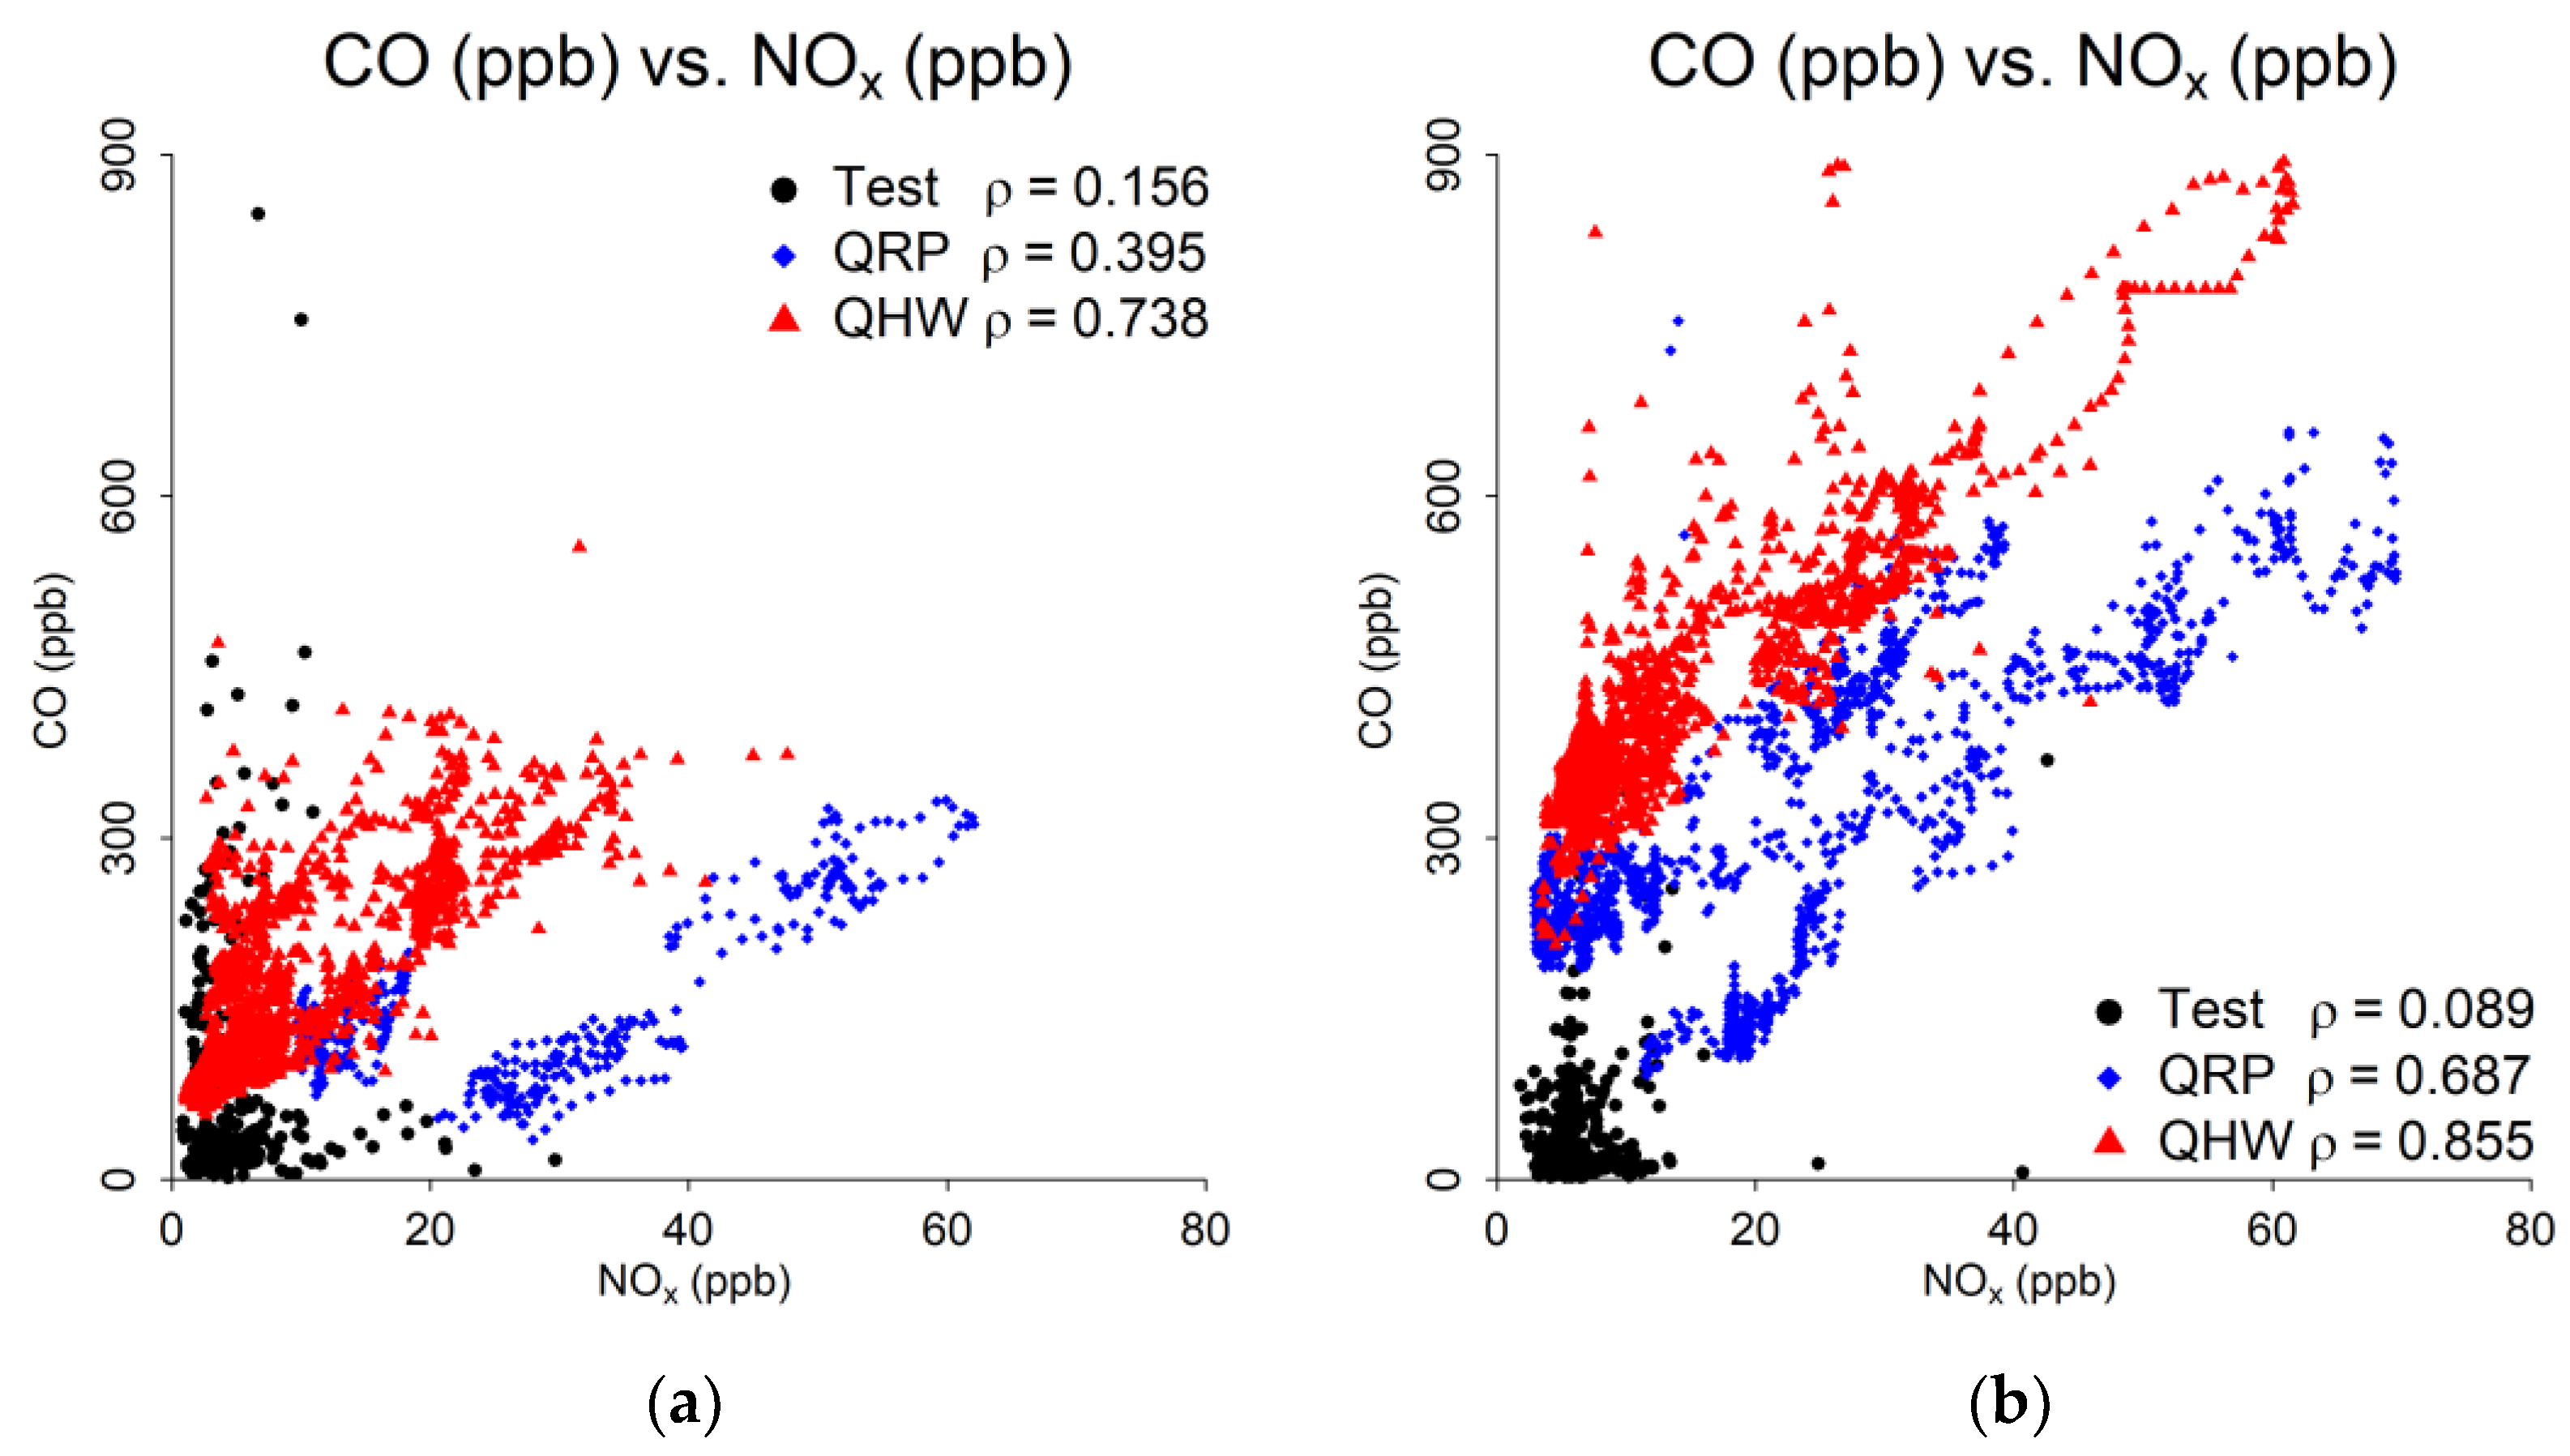
The CO vs. NOx comparison is shown in Figure 5 below. Both pollutants are primarily associated with fossil fuel combustion, particularly vehicular emissions. While both species show an increase on the second day, the comparatively larger increase in CO is likely associated with the wildfire plume. CO and ozone show a similar pattern, with both species displaying increased concentrations during the second day (Appendix A, Figure A1). As ozone increases following elevated periods of NOx (Figure 4c), its increase on the second day is likely associated with additional NOx from the wildfire.
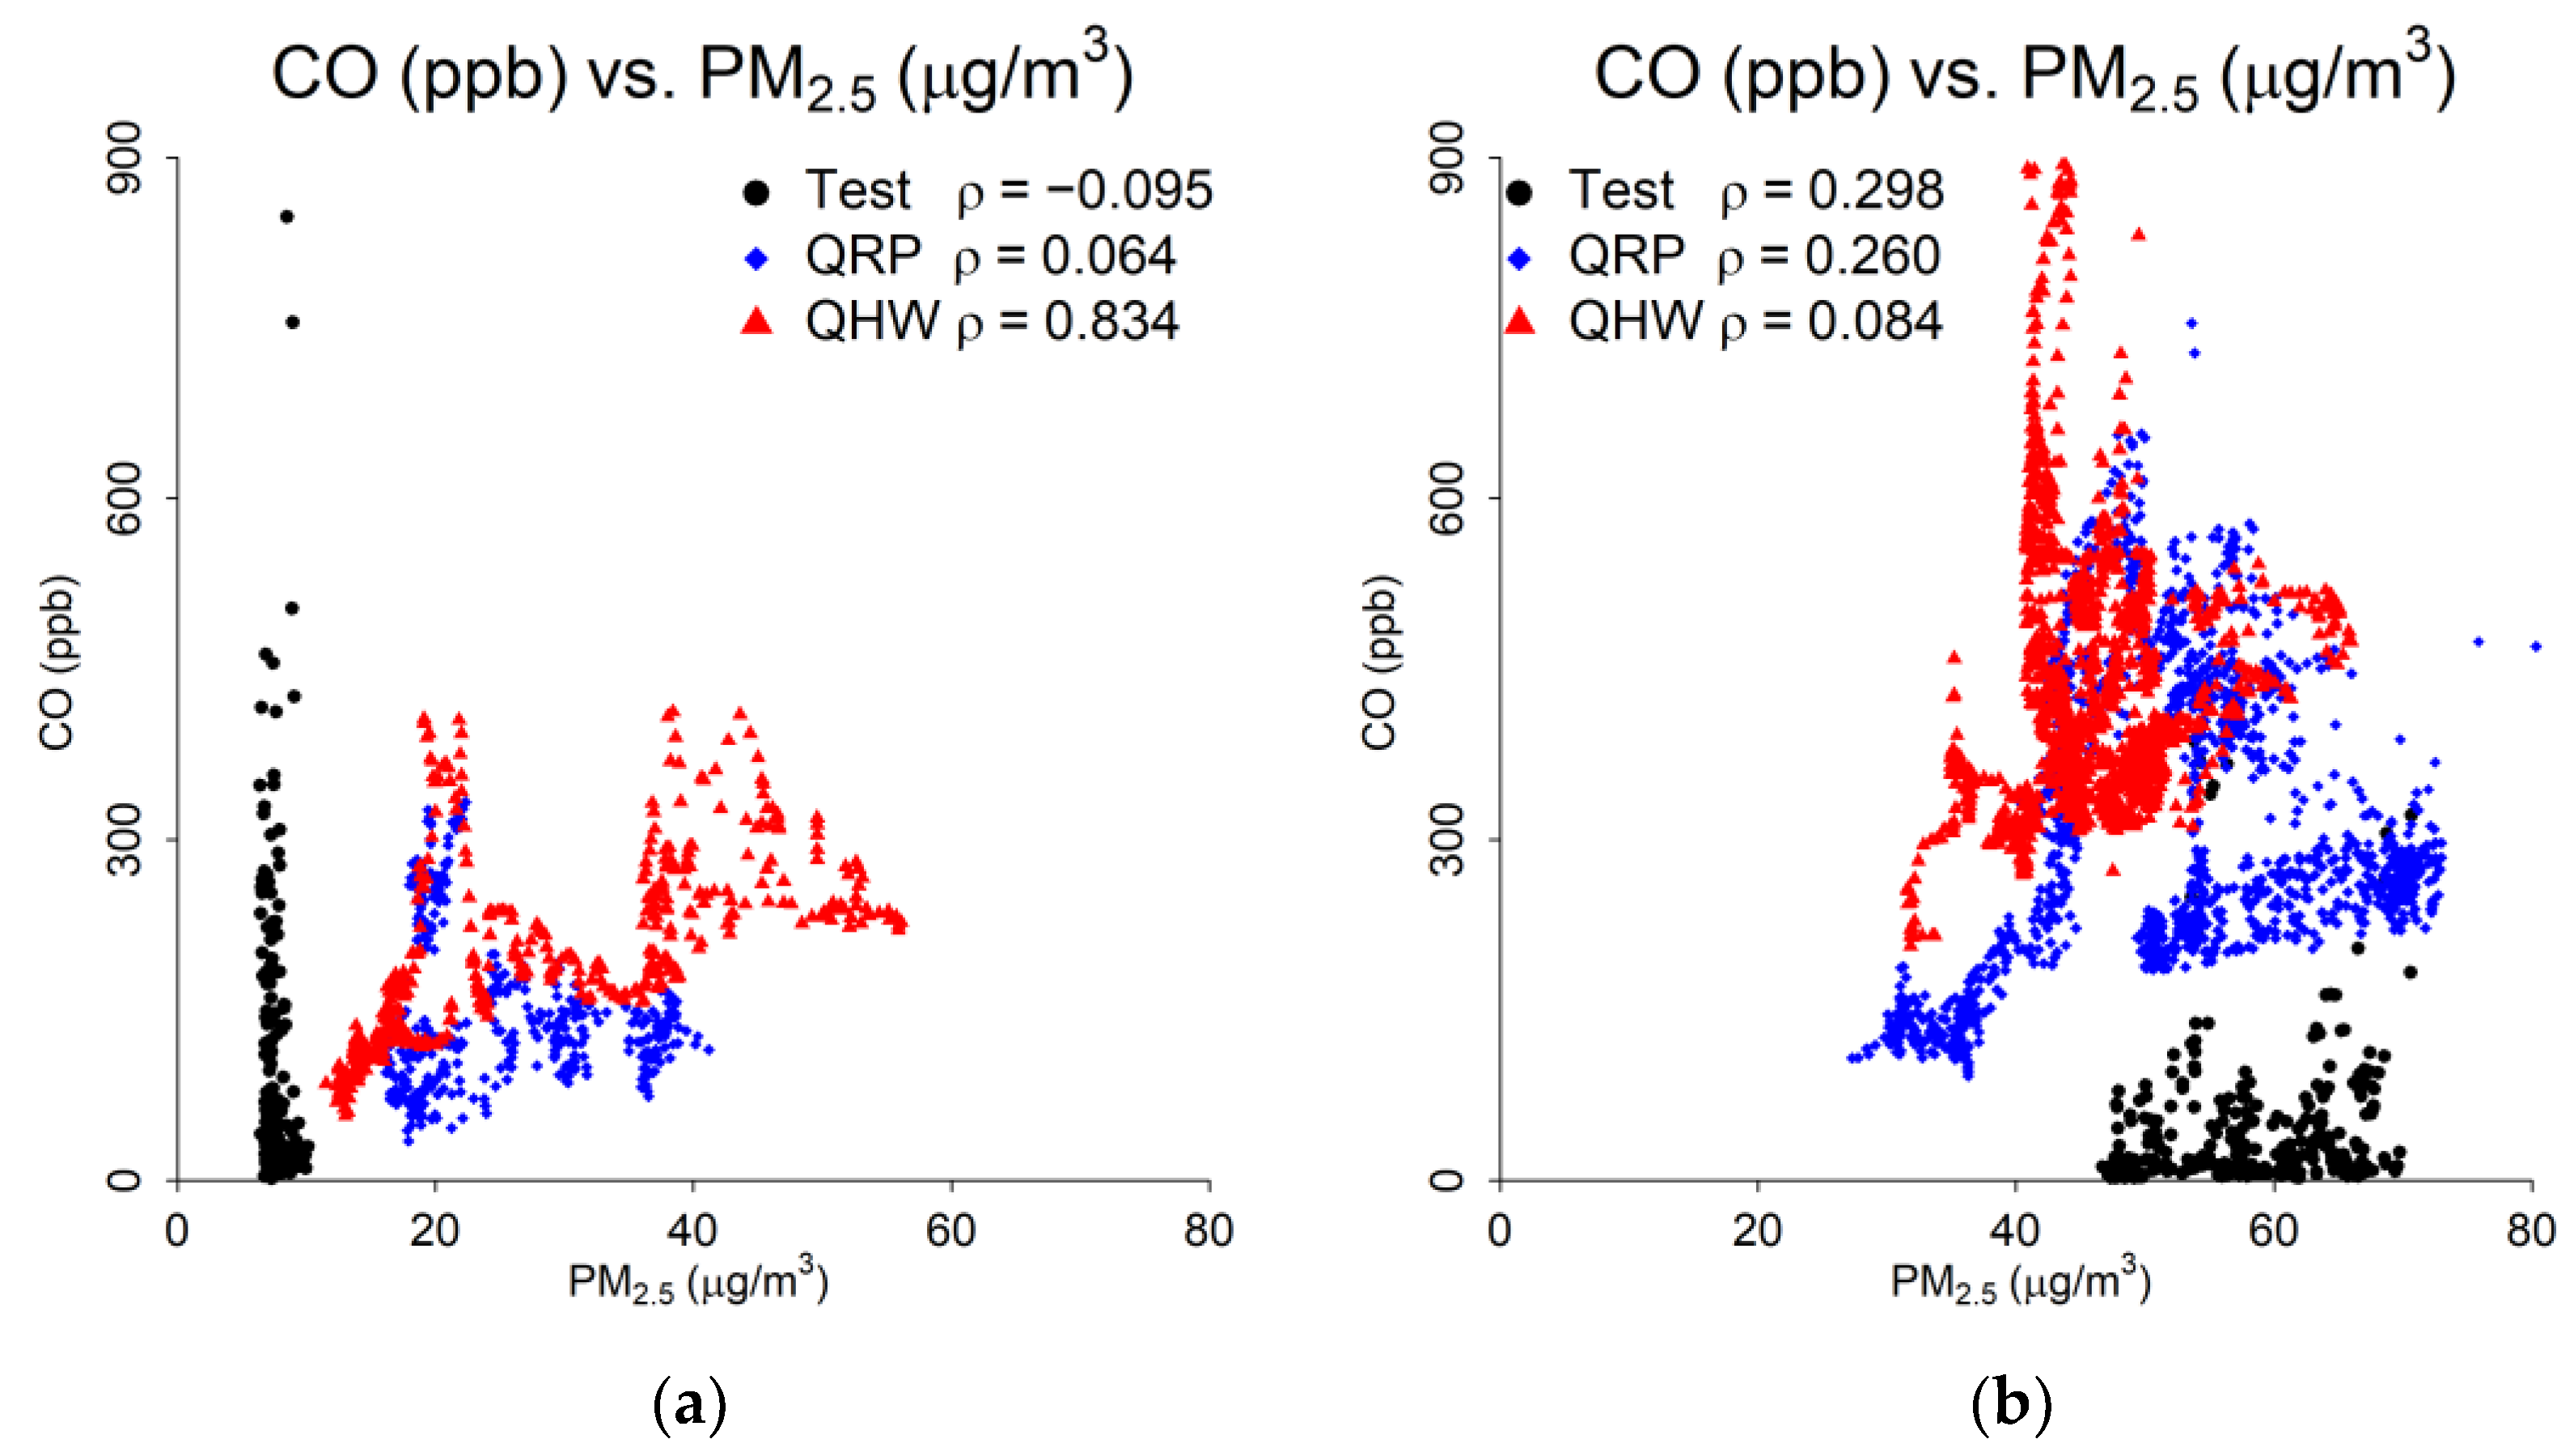
Figure 6 shows the CO vs. PM2.5 relationship. As noted in Section 3.1, both CO and PM2.5 increased on the second day due to the wildfire.
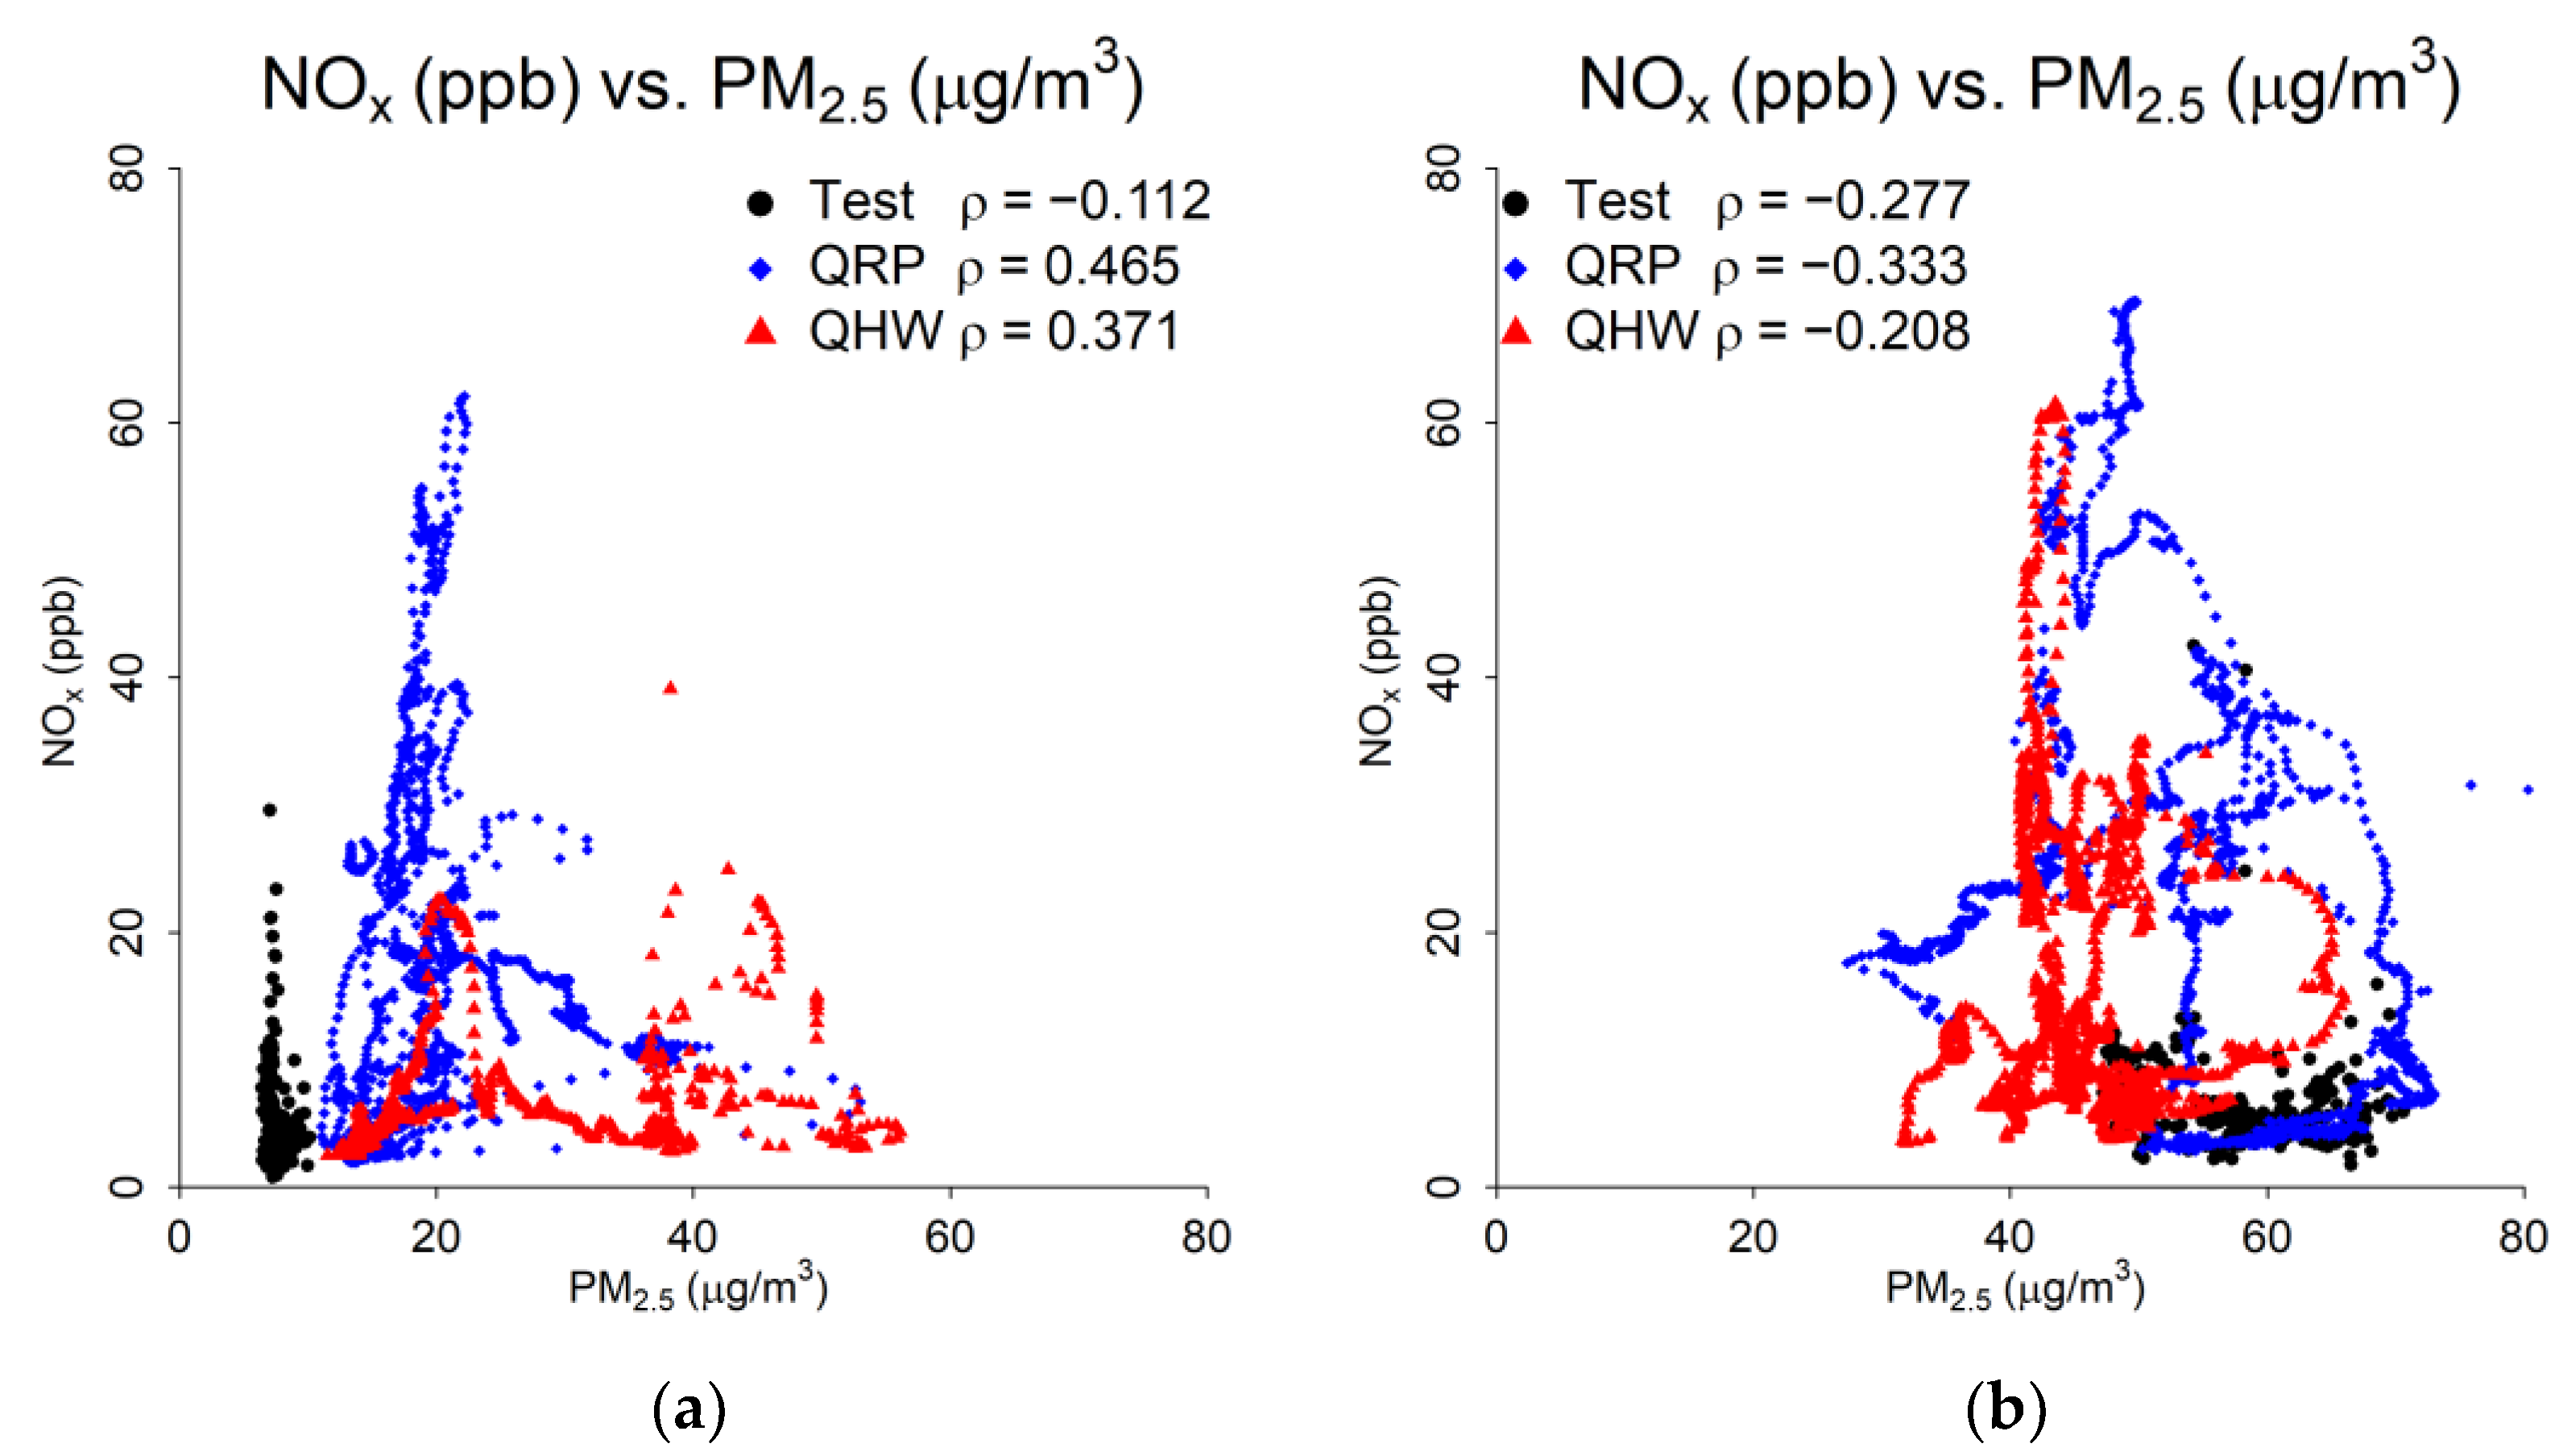
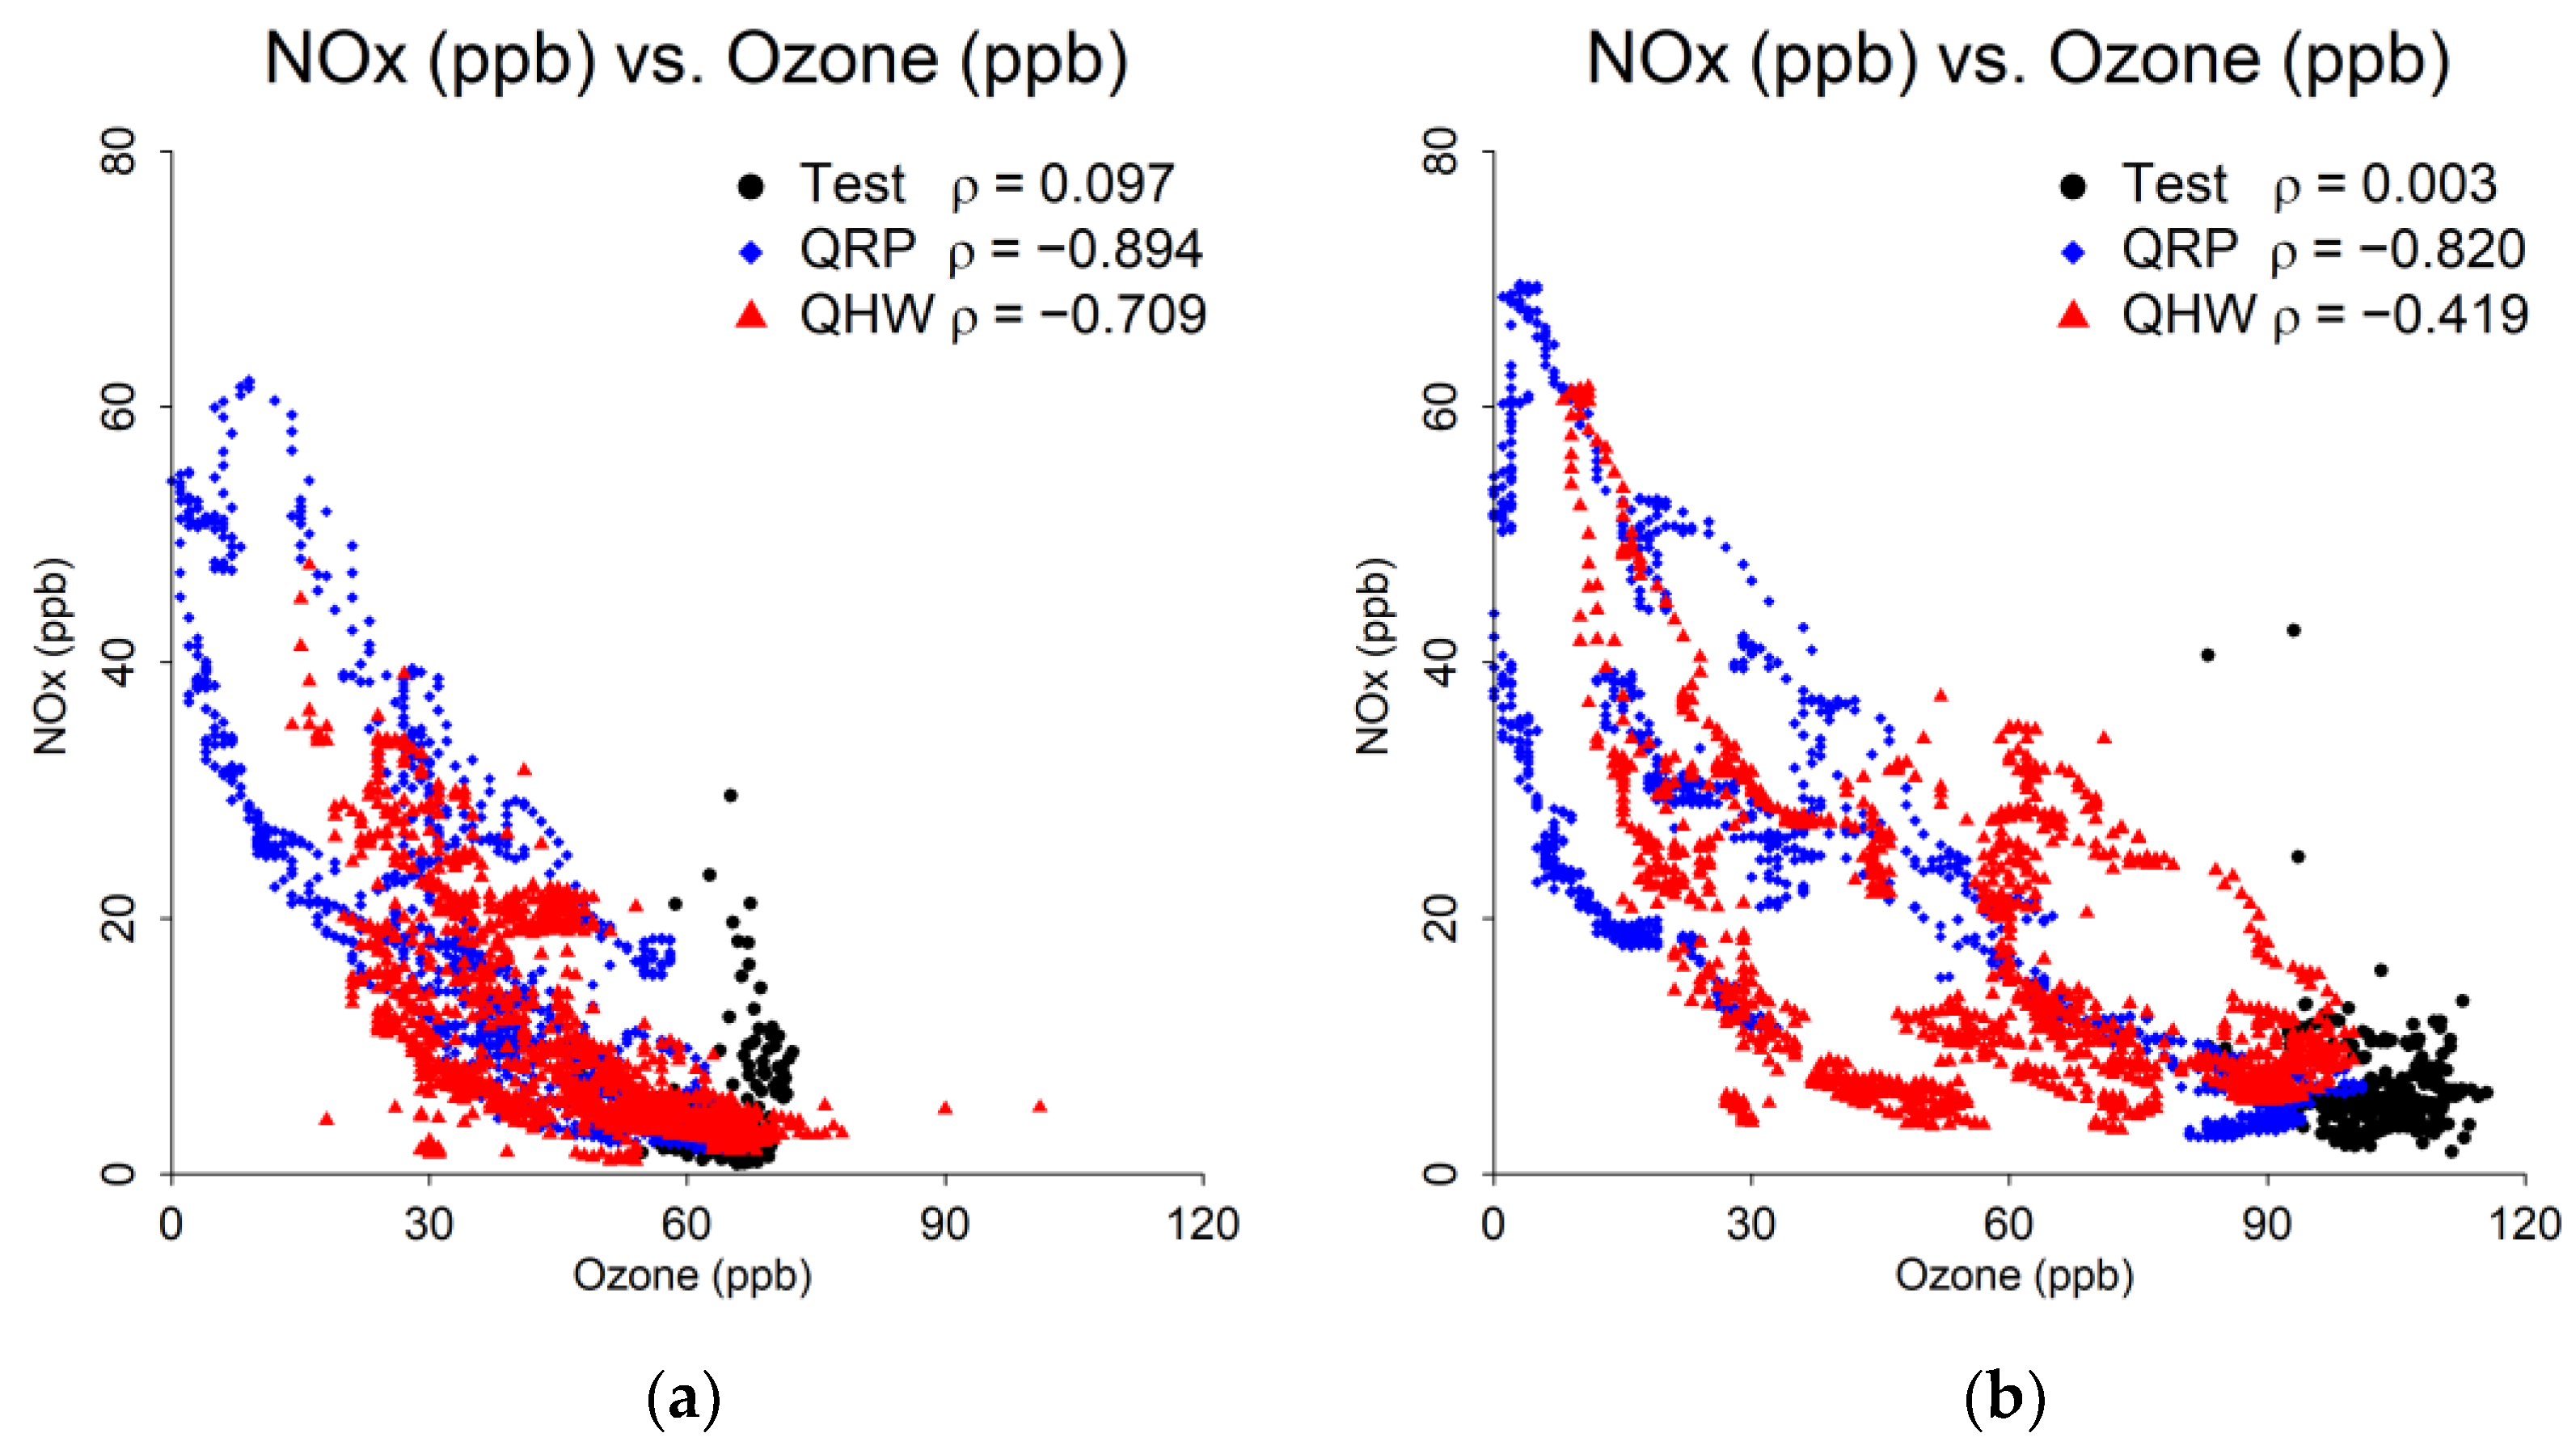
The diurnally varying NOx to ozone relationship is displayed in Figure 7 below. While the second day shows higher concentrations of both pollutants, the negative association between the two pollutants is relatively consistent and particularly salient for the QRP monitoring site. This is what we would expect to see with NOx levels higher at night as vehicle emissions pool near the surface, while NOx titration acts to destroy and lower ozone at night. The relationship between NOx and PM2.5 (Appendix A, Figure A2) remains relatively constant as both pollutants increase on the second day. However, PM2.5 increases at a higher rate on the second day compared to NOx. This is likely due to the additional NOx increases from the wildfire plume, which may result from the daytime secondary chemical production of ozone.
Figure 8 shows the relationship between ozone and PM2.5. On the first day, the two pollutants are negatively correlated, while on the second day, they are positively correlated. The wildfire plume steadily increased PM2.5 throughout the second day, as well as a modest increase in NOx. The increased NOx led to higher ozone values following a similar temporal pattern as PM2.5. In contrast, on the first day, PM2.5 readings decreased in the middle of the day, but ozone increased.
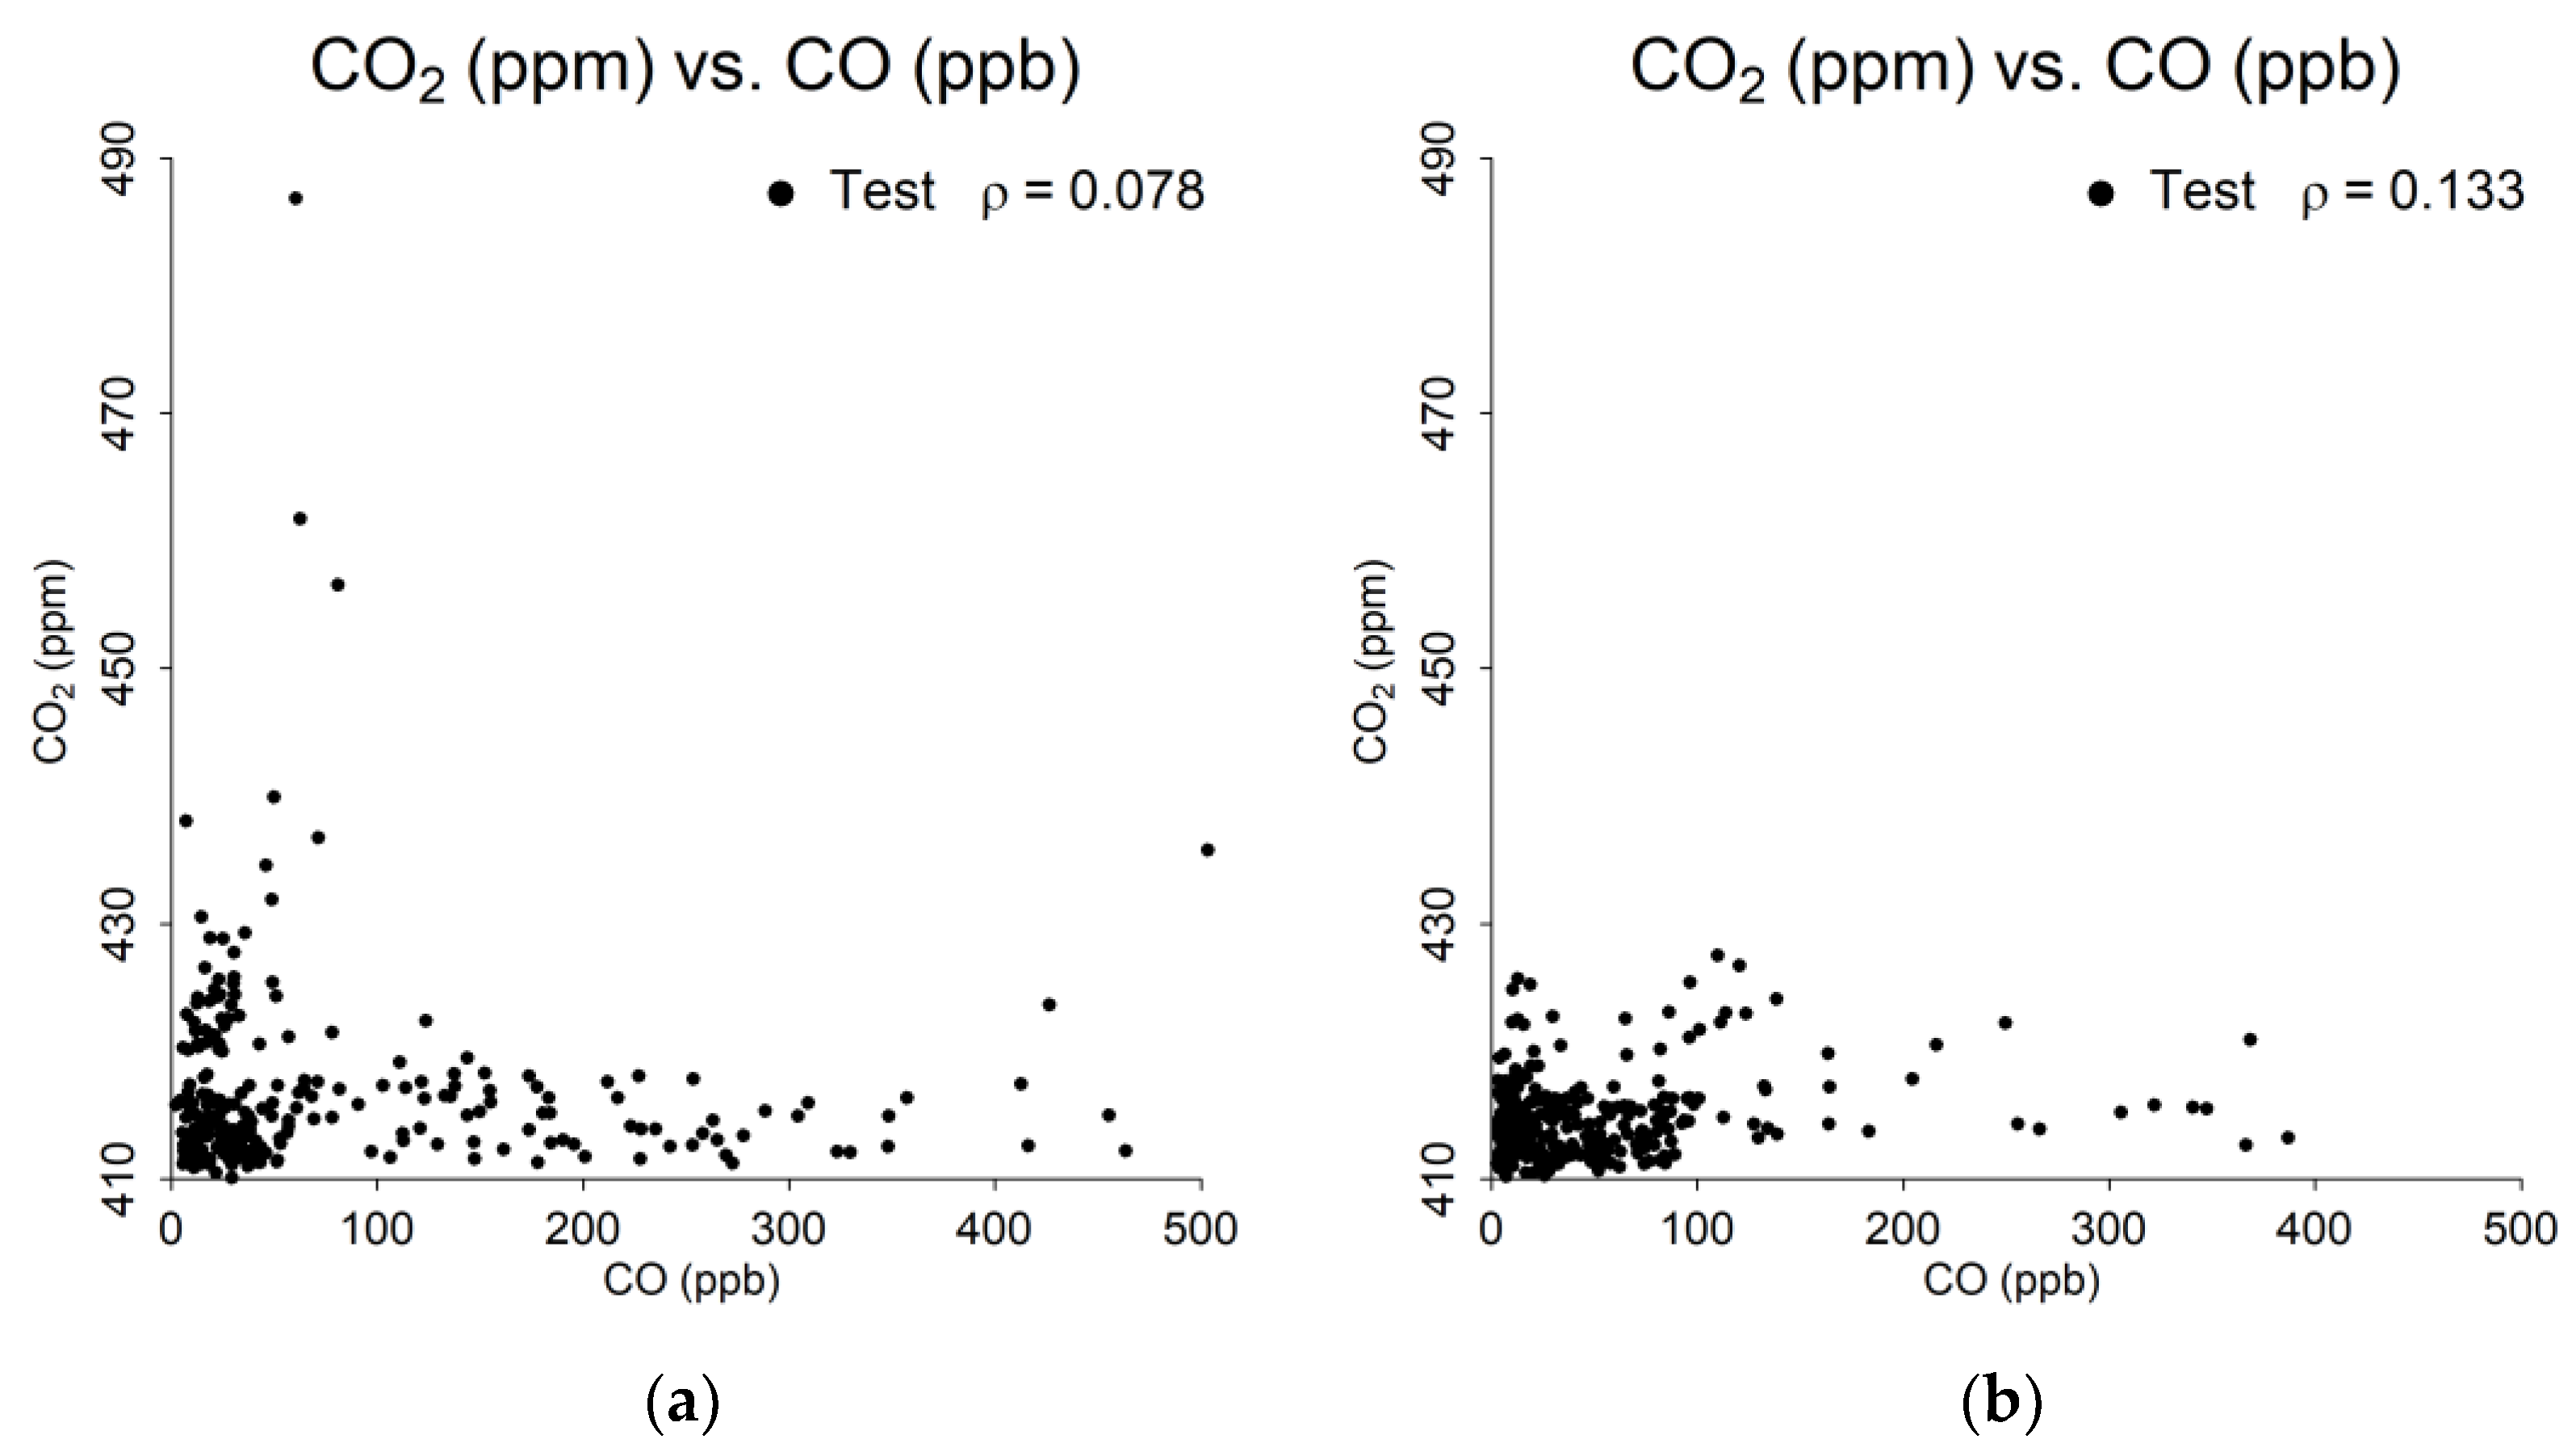
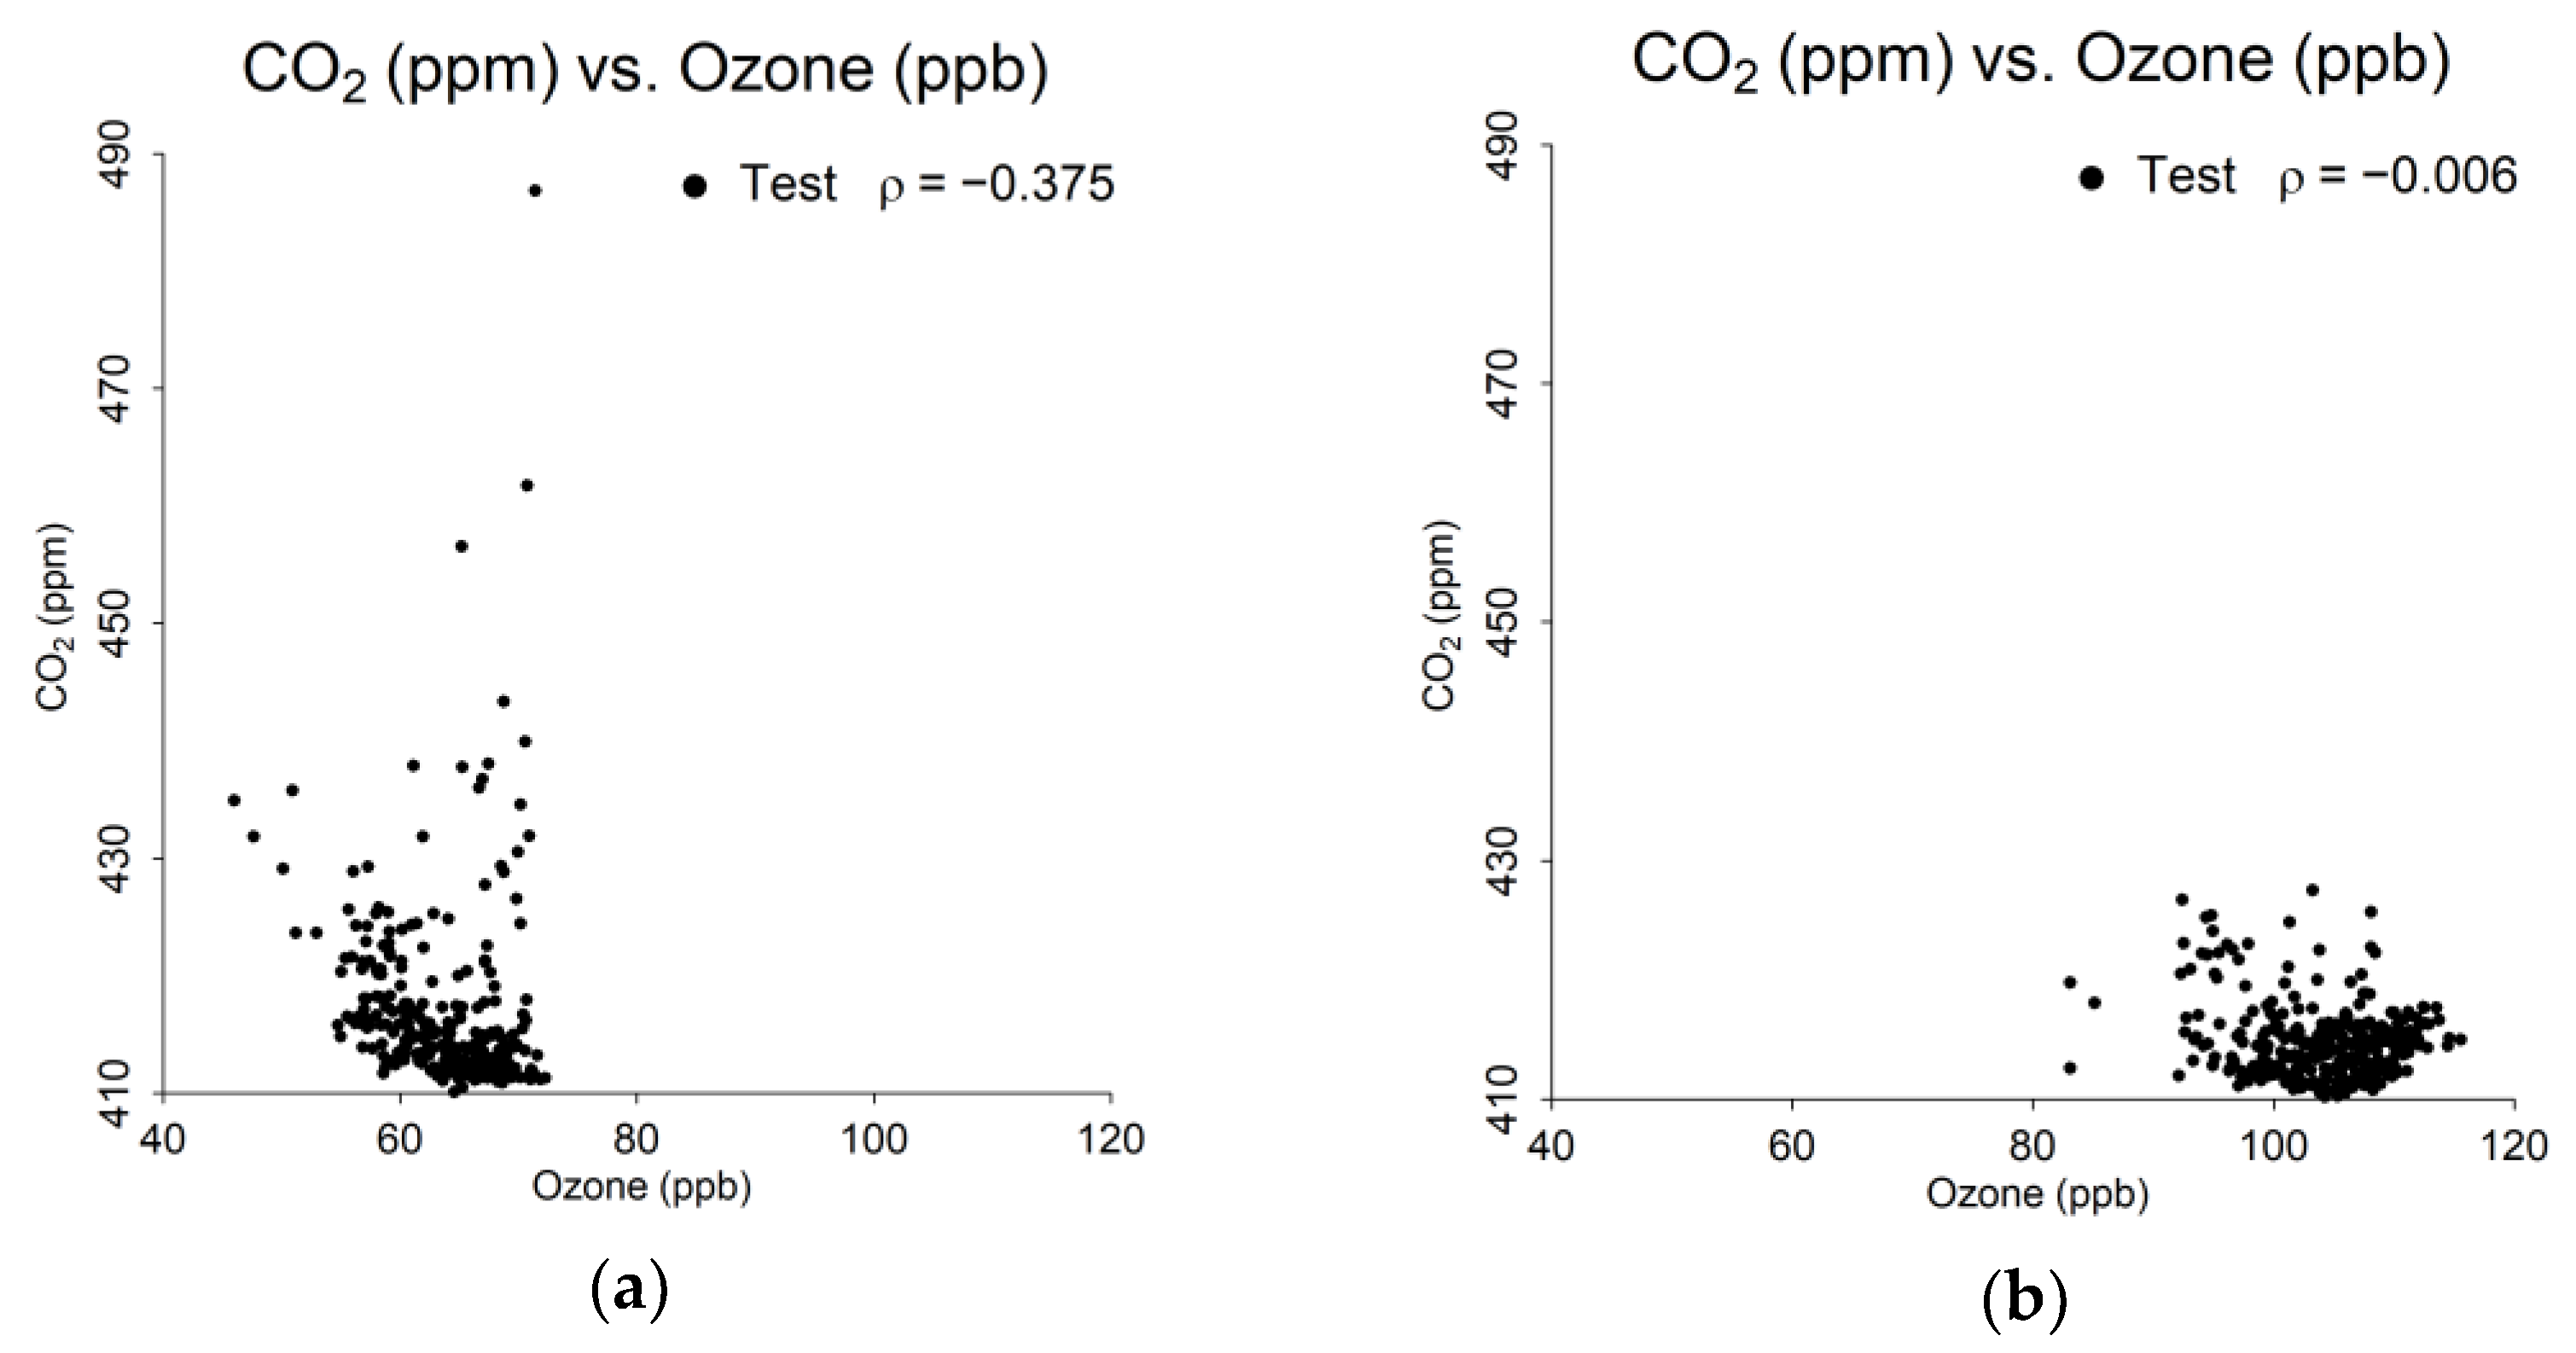
The relationship between CO2 and NOx (Figure 9) becomes substantially stronger on the second study day. Although both pollutant concentrations increased on the second day, on the first day, CO2 had some elevated readings that did not correspond to the respective NOx signal. The relationship between CO2 and CO does not show salient differences between the two days (Appendix A, Figure A3). CO2 and ozone transitioned from having a negative relationship to nearly no association (Appendix A, Figure A4). The opposite pattern (positive association on the first day to negative on the second day) was observed between CO2 and PM2.5 (Appendix A, Figure A5). CO2 and CH4 were positively associated on the first day and became somewhat less positive on the second day (Appendix A, Figure A6).
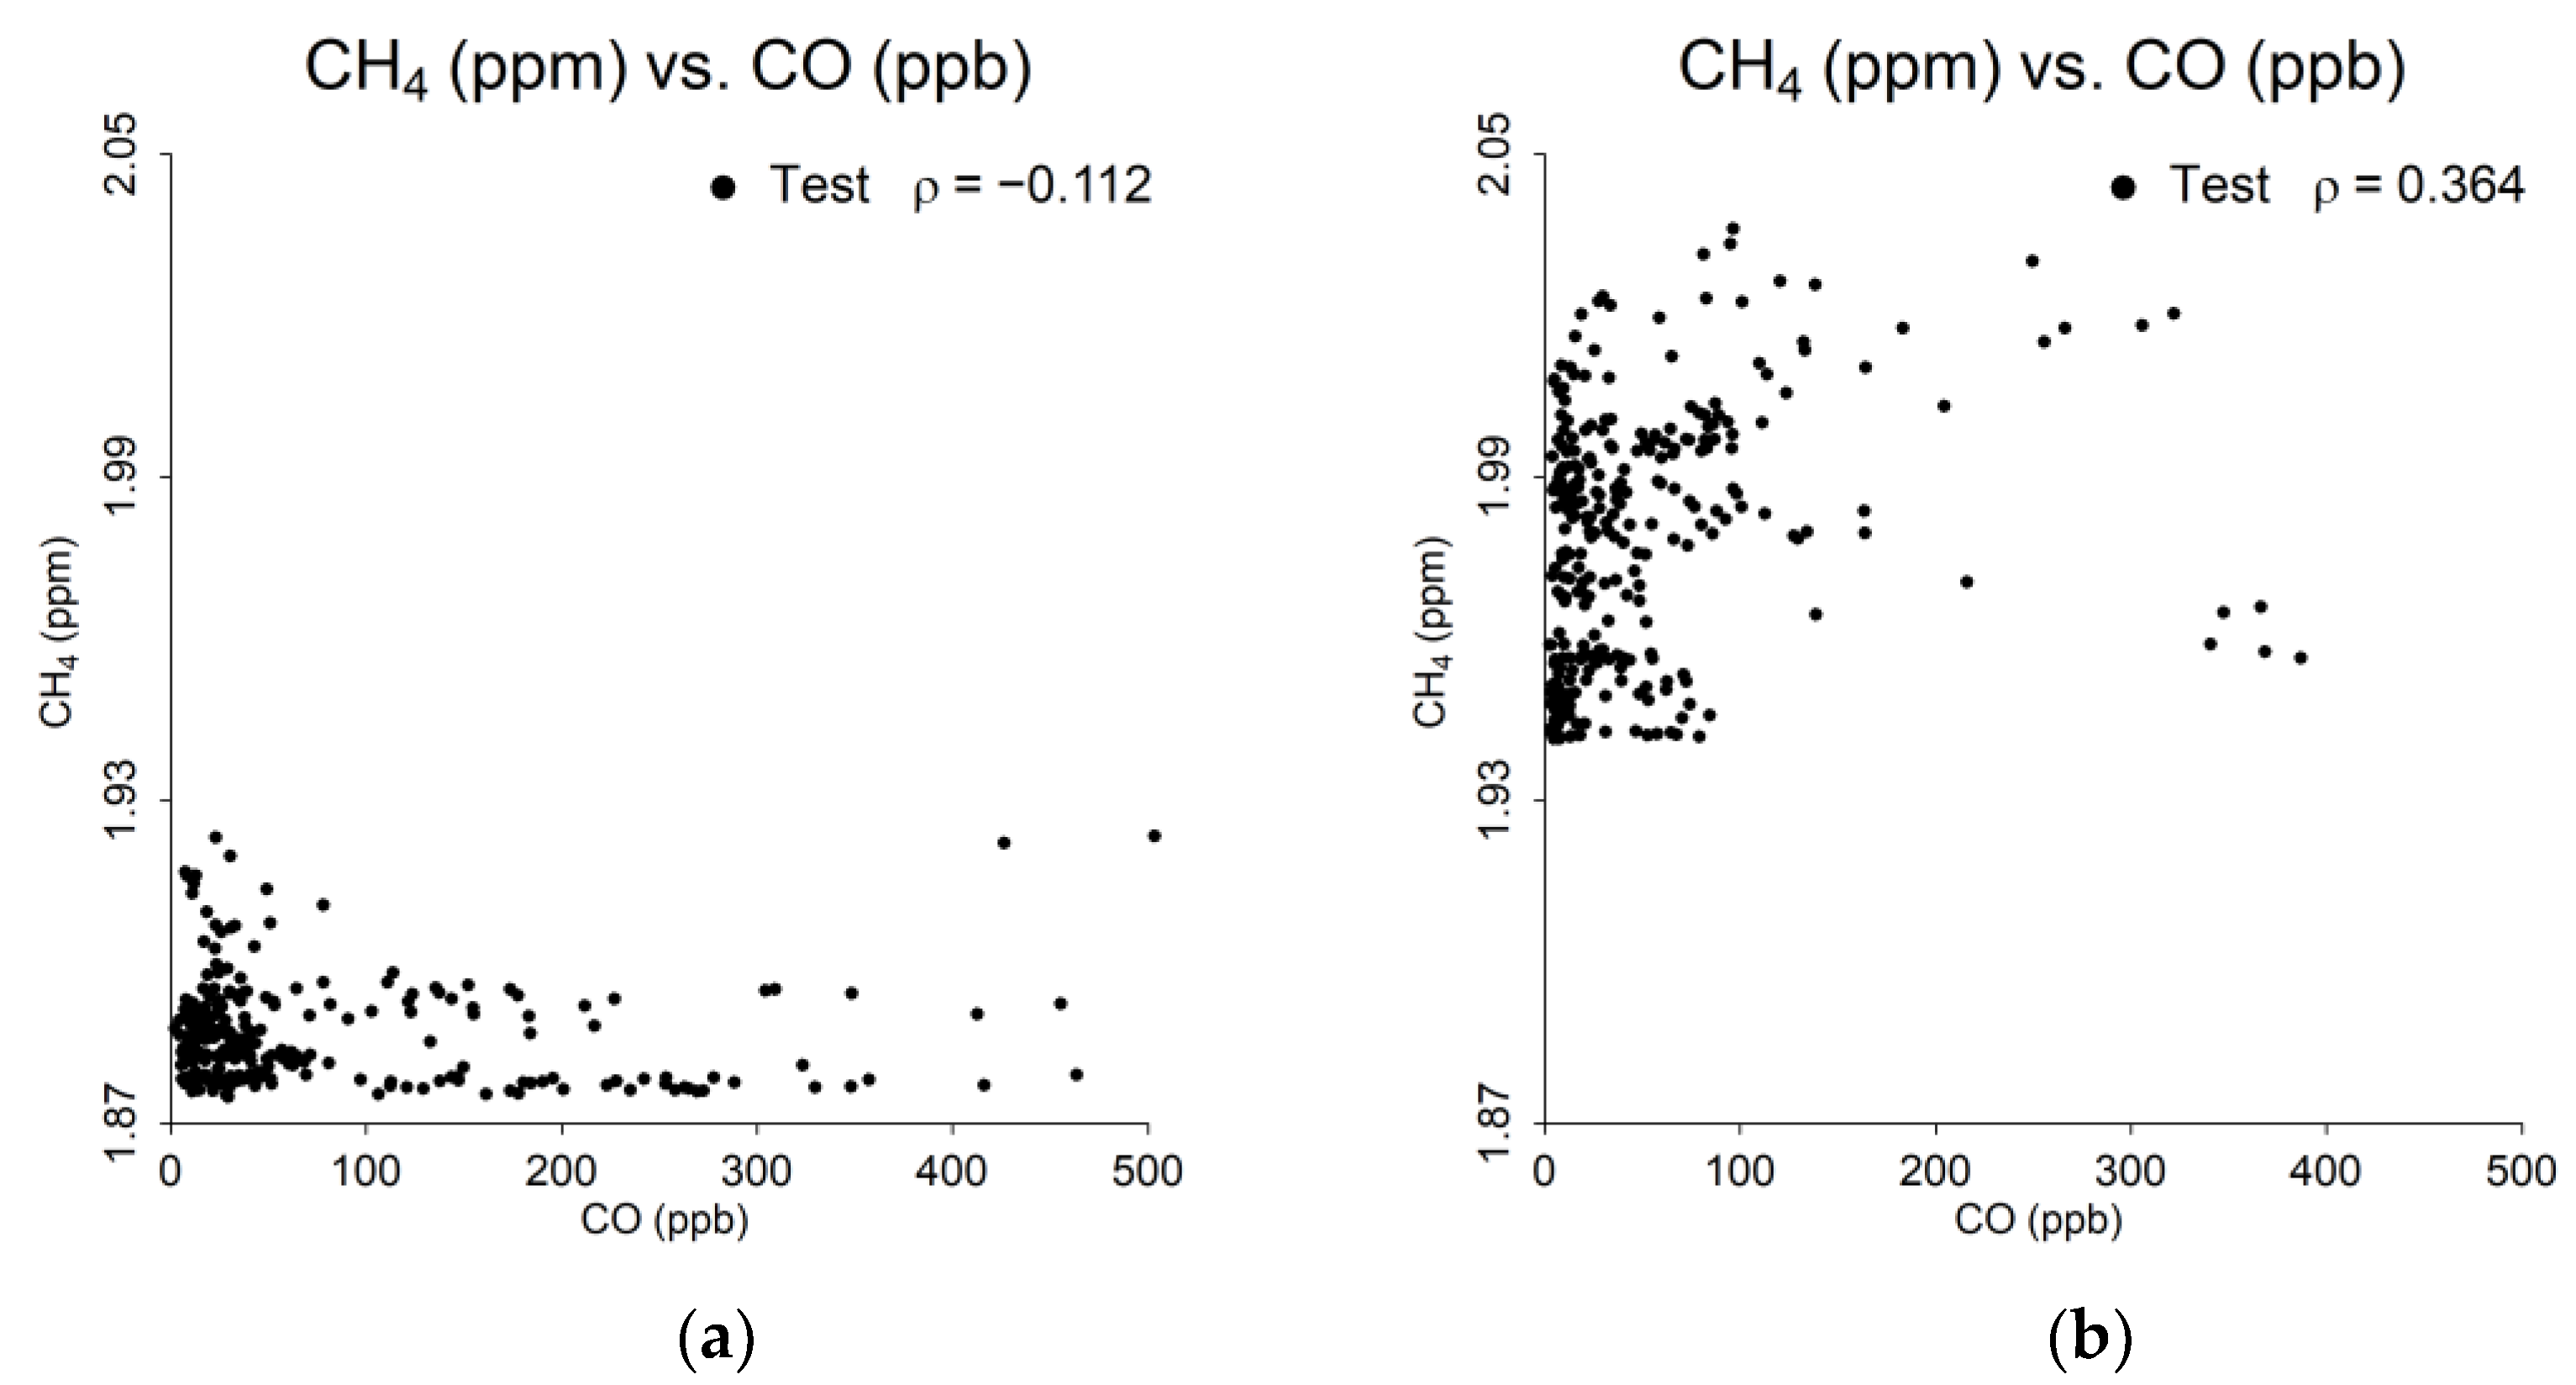
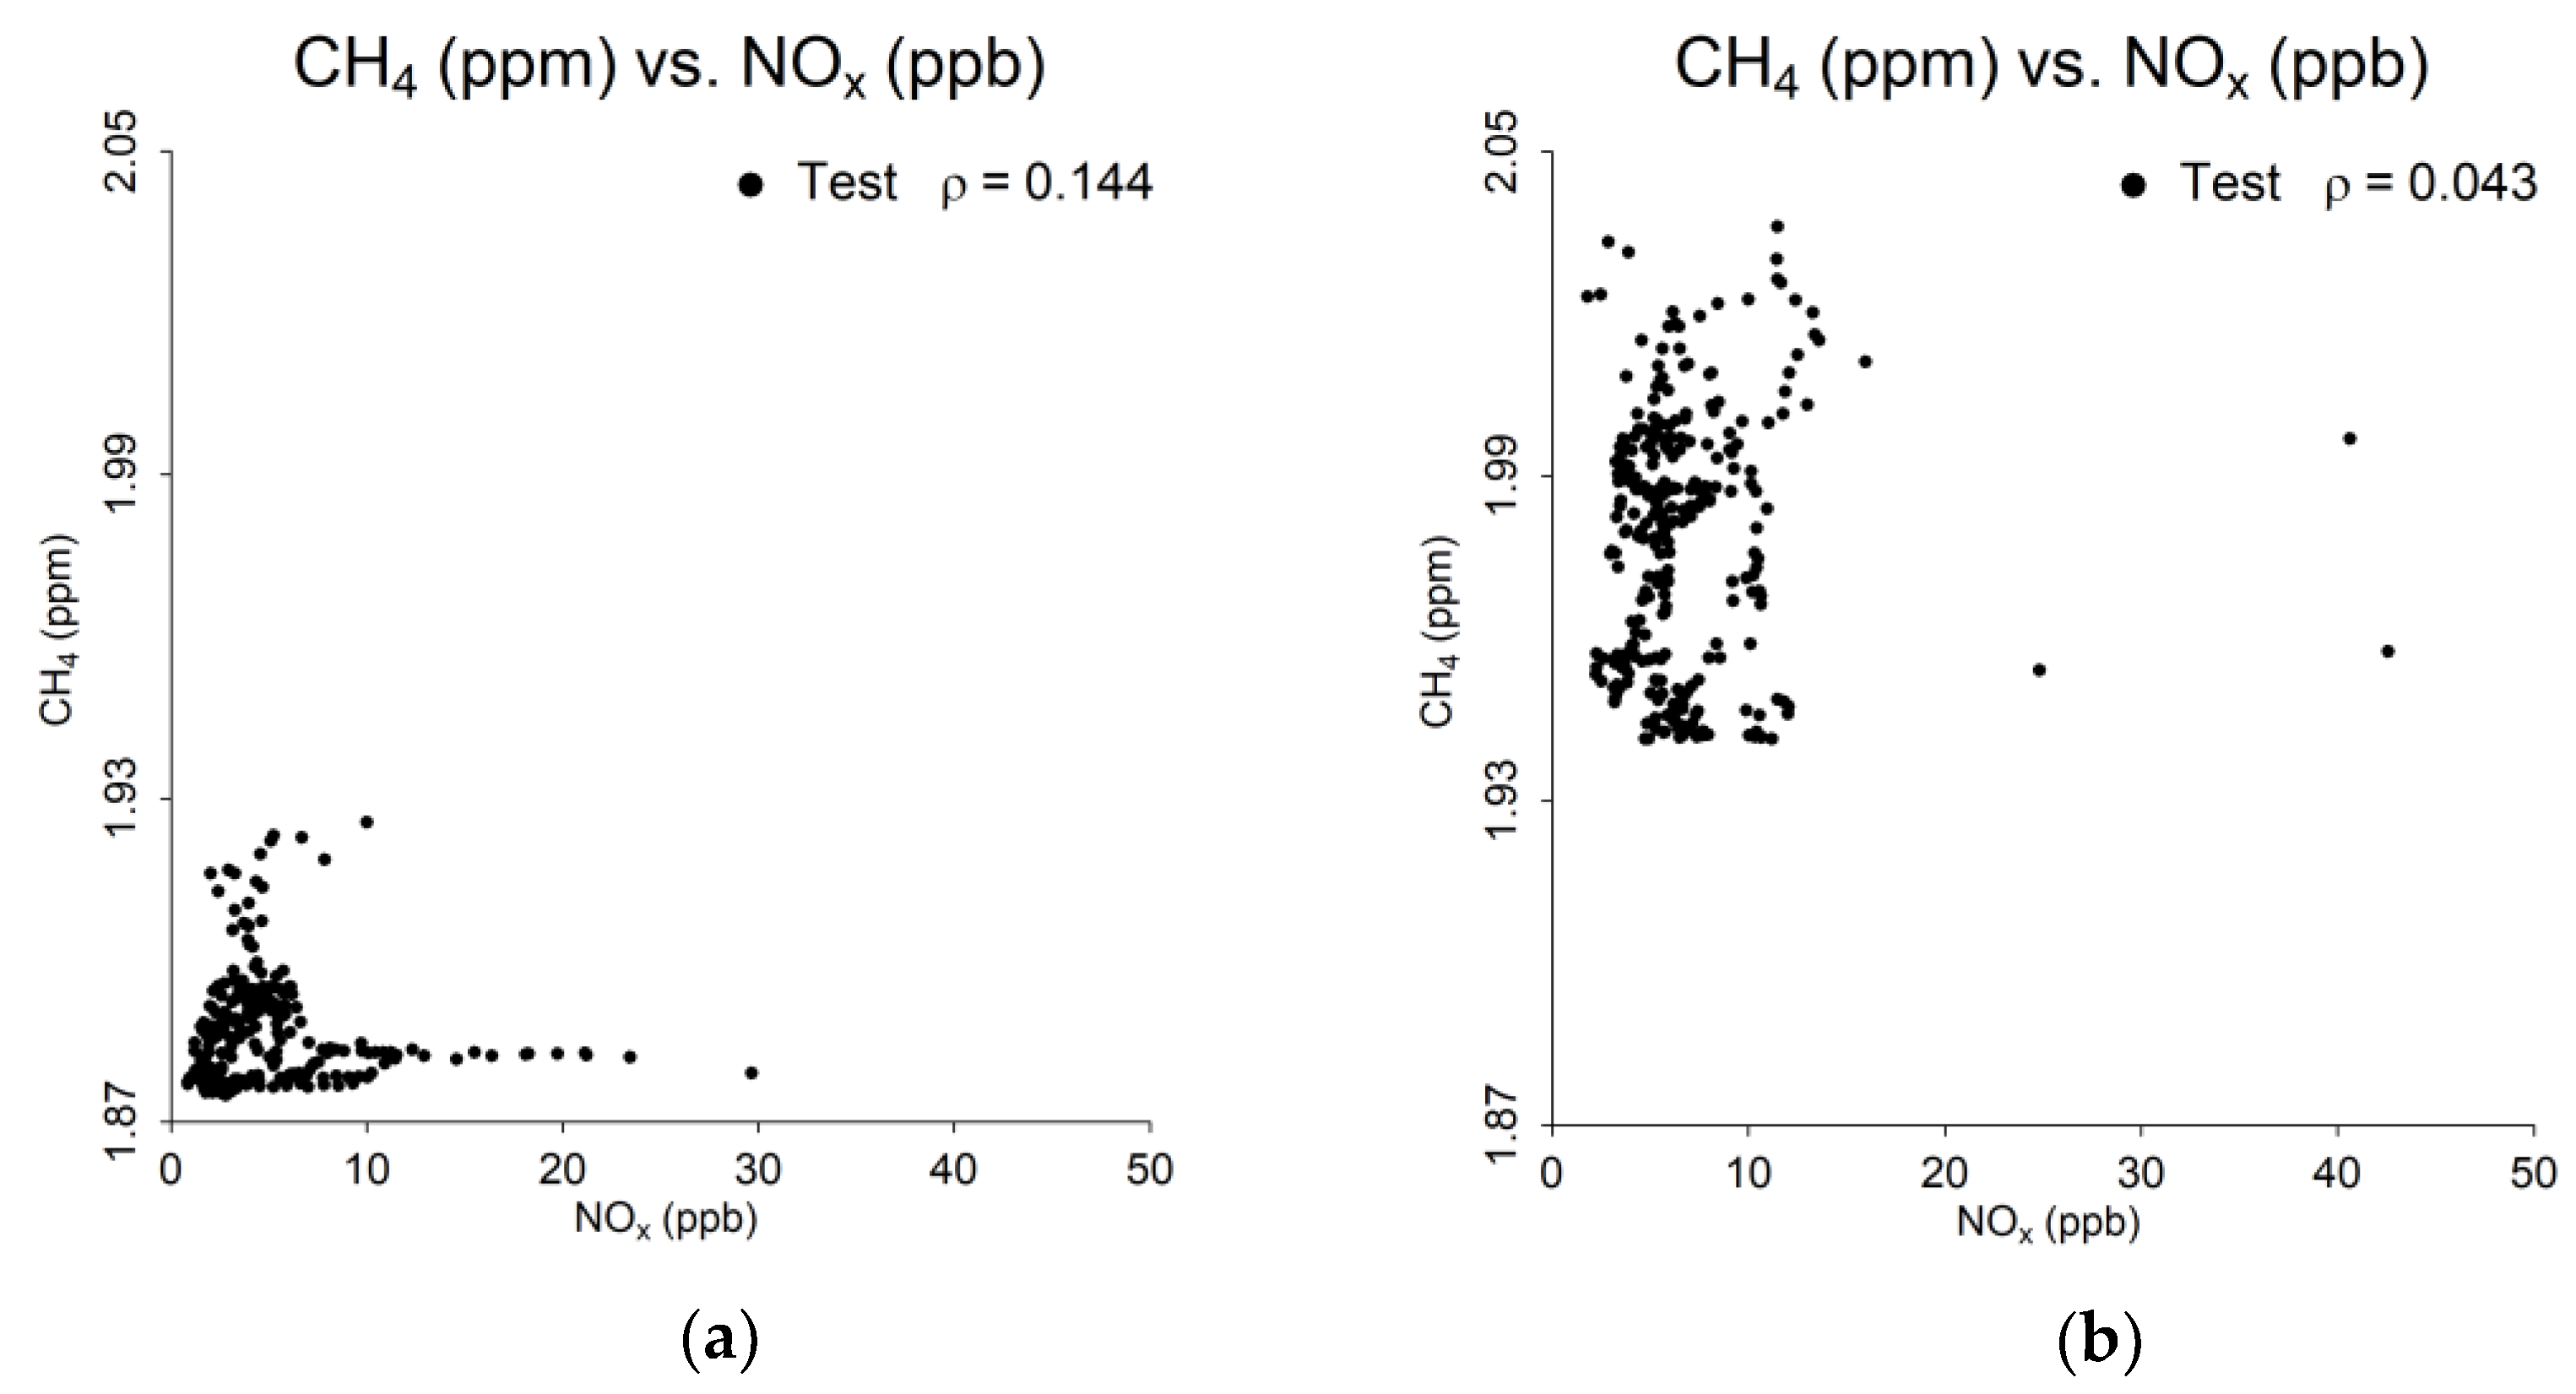
The CH4 and ozone comparison is shown in Figure 10. On the first day, the relationship between the two gases was strongly negative, and on the second day, both concentrations increased, but no clear relationship was observed. The relationships between CH4 and CO (Appendix A, Figure A7), as well as CH4 and NOx (Appendix A, Figure A8), did not show a strong correlation on the first day. However, on the second day, the former did not change, while the latter became more positive. The positive correlation between CH4 and PM2.5 increased on the second day since both pollutants are associated with the wildfire plume (Appendix A, Figure A9).

4. Discussion

Pollutant Interplay

The results of this research show the impact of combining multiple pollution sources on the air quality of various locations in a city. Our case study was limited in both the number of pollutants measured and the length of the study. Both should be expanded to gain improved insights in the future. Our goal in this short pilot study was to disentangle information about the impacts of wildfire smoke on urban air quality by analyzing relationship patterns of many co-emitted pollutants associated with wildfire plumes without conducting a detailed and expensive chemical precursor analysis, which has been carried out in other field and modeling studies (e.g., Rickly et al. [47]). Based on this study, we found that elevated summertime ozone combined with urban sources provided the baseline pollution levels for the three study areas. The wildfire plume raised the concentrations of all pollutants with the greatest effect on PM2.5, CH4, CO, and ozone.
With respect to the pollutant time series (Section 3.1), our findings demonstrate clear interactions between urban and wildfire emissions. As discussed by Rickly et al. [47], how ozone concentrations observed in urban areas respond to the increase in precursor pollutants from wildfire depends on whether the urban environment is in a NOx-sensitive or NOx-saturated (VOC-sensitive) regime [47]. There are insufficient chemical precursor (e.g., VOCs) measurements to determine that for this study; however, based on notable ozone increases observed on the second day (30–40 ppbv ozone increases compared to the first day), it appears that the wildfire precursor pollutants are contributing to elevated levels of urban ozone on the second day as the smoke plume impacts strengthened (Figure 4c). While no observations of ozone were available immediately upstream of the SLV, ozone increases due to photochemical reactions may have occurred before the wildfire smoke-impacted airmass approached SLV. Once this airmass settled in the SLV, chemical reactions between wildfire and urban precursor pollutants commenced. Urban ozone increases due to wildfire smoke emissions, which are also superimposed over the diurnal interplay between NOx and the ozone production cycle observed in the urban environment in general. NOx levels are higher at night, and NOx titration destroys ozone at night while being a key precursor for the daytime chemical cycle of ozone production at the same time (Figure 4c,d). Thus, ozone’s temporal pattern is nearly opposite of NOx (Figure 4b,c). Despite this, the second day’s ozone is higher, again likely due to contributions from the wildfire. As a result, ozone is a secondary pollutant, and the concentrations at all sites resemble each other more closely (Figure 4c).
In addition, we measured CO2 and CH4 for approximately five hours a day, and while CO2 showed similar concentrations on both days (Figure 4e), CH4 was higher on the second day (Figure 4f), likely due to impacts from the wildfire. It is unclear why there has been no strong increase in CO2 from wildfire smoke, and this is something that needs to be analyzed more carefully in a future expanded study. In addition to showing overall higher CH4 on the second day (Figure 4f), there are several peaks like those seen in PM2.5 (Figure 4d), which may be attributed to the wildfire plume passing through.
As discussed by Frausto-Vicencio et al. [48], increases in both CO2 and CH4 are to be expected from larger wildfires, with a notable fraction of California’s CH4 emissions now found to originate from intense wildfires such as the California Complex Wildfire, which was highlighted in Frausto-Vicencio et al. [48]. In this example, during the latter parts of each day, CO2 increased, and this may be attributed to a lowered boundary layer in the evening (Figure 4e).
The NOx/ozone cycle was clearly demonstrated throughout the short case study period observed in this research, with NOx titration reducing nighttime ozone. The wildfire plume on the second day increased NOx, which was converted to ozone during the sunniest parts of the day. Although ozone decreased on the second night, it remained at a higher level than the first night. This adds to our understanding of how wildfires create new pollution patterns in urban landscapes.
The impact of the wildfire plume on pollutant concentrations cannot be overstated. For multiple pollutant pairs, the influx of additional contaminants either strengthened or reversed correlation patterns. Furthermore, CH4 and PM2.5 increased near lockstep during the second day. The NOx increases resulted in elevated ozone levels on the second day and higher baseline evening concentrations as well.
Because limited data exists on urban pollution during episodes where elevated wildfire smoke interacts chemically with pre-existing urban pollution in the WUI, long-term monitoring of these interactions and quantifying how both criteria pollutants and hazardous air pollutants vary across space and time in urban regions during wildfires is needed. More studies like Rice et al. 2023 [15] are needed across a range of cities and smoke sources (grassland versus timber or other fires) to better understand the complexity of WUIs [49,50]. As discussed by Wang et al. [14], we need “Monitoring gas phase species in addition to PM during wildfire season to inform public health guidance”. Satellite data, in concert with expanded spatial long-term monitoring of wildfire pollutants encroaching on cities, will be key to elucidating more fully the impact of wildfire pollutants on urban air quality. Low-cost but accurate sensors deployed strategically across the landscape, such as black carbon sensors [51], could provide new insights.
This case study spanned only two days; however, this was enough time to show the effect of the wildfire plume on air quality. The COVID-19 testing site sensor operated five hours a day but was able to capture both the impact of the wildfire as well as emissions associated with vehicular traffic at the site. The UDAQ sites do not measure greenhouse gases, and this limited the comparison of CO2 and CH4 to each other and the other criteria pollutants present across locations.

5. Conclusions

The impacts of a wildfire plume (elevated ozone and PM2.5) on an urban interface provide an important illustration of interaction effects within complex, dynamic systems. In this case, the summer wildfire produced elevated criteria pollutant and greenhouse gas concentrations in the Salt Lake Valley of Utah. CH4 and PM2.5 increased at comparable rates, and increased NOx led to higher ozone levels. The compounded effects of urban emissions and exceptional pollution events, such as wildfires, may pose substantial health risks. As a result, urban air quality policies should be updated to protect public health, particularly for vulnerable populations who will be the least able to adapt efficiently and effectively to such impacts. This preliminary case study supports the expansion of this research to include a long-term study on the interactions of variable intensity wildfire smoke plumes on urban air pollution exposure. The WUI highlighted in this preliminary study is one example of many human-influenced, coupled systems. These unique systems are biophysical, economic, social, and technological in nature [52]. As we begin to better acknowledge and manage human–environment interactions, which are highly dynamic and in a state of continued change, we will need to consider some alternatives to the homeostatic processes we currently use to preserve them. For example, more widespread use and adoption of alert wildfire smoke warning systems such as the WHO Vegetation Fire and Smoke Pollution Warning Advisory and Assessment System (VFSP-WAS) are needed (Baklanov et al. 2021) so that policy makers can use that information to protect urban populations from the growing threat of wildfire pollution in the era of anthropogenic climate change. We need a whole new generation of governance systems or regimes to cope with the challenges of the Anthropocene. Otherwise, the current system of trial and error will be risky, and failure will result in severe reductions in human welfare [53].

Author Contributions

Conceptualization, C.A. and D.L.M.; methodology, C.A. and S.A.G.; software, D.L.M.; validation, D.L.M. and S.A.G.; formal analysis, D.L.M., E.T.C. and T.M.B.; investigation, D.L.M., E.T.C. and T.M.B.; resources, C.A.; data curation, D.L.M. and S.A.G.; writing—original draft preparation, D.L.M., E.T.C. and T.M.B.; writing—review and editing, C.A., D.L.M., E.T.C., S.A.G. and T.M.B.; visualization, D.L.M. and E.T.C.; supervision, C.A.; project administration, C.A.; funding acquisition, C.A. All authors have read and agreed to the published version of the manuscript.

Funding

This research received no external funding.

Data Availability Statement

The data presented in this study are available on request from the corresponding author.

Acknowledgments

We would like to thank Ryan Bares from the Utah Division of Air Quality for instrumentation development.

Conflicts of Interest

The authors declare no conflicts of interest.

Appendix A

Figure A1. CO vs. ozone at the testing site (test—black dots) and UDAQ regulatory air quality monitoring sites Rose Park (QRP—blue diamonds) and Hawthorne (QHW—red triangles), along with their respective Spearman correlation coefficients: (a) day one (20 August 2020) and (b) day two (21 August 2020).
Fire 07 00184 g0a1
Figure A2. NOx vs. PM2.5 at the testing site (test—black dots) and UDAQ regulatory air quality monitoring sites Rose Park (QRP—blue diamonds) and Hawthorne (QHW—red triangles), along with their respective Spearman correlation coefficients: (a) day one (20 August 2020) and (b) day two (21 August 2020).
Fire 07 00184 g0a2
Figure A3. CO2 vs. CO at the testing site along with the respective Spearman correlation coefficient: (a) day one (20 August 2020) and (b) day two (21 August 2020).
Fire 07 00184 g0a3
Figure A4. CO2 vs. ozone at the testing site along with the respective Spearman correlation coefficient: (a) day one (20 August 2020) and (b) day two (21 August 2020).
Fire 07 00184 g0a4
Figure A5. CO2 vs. PM2.5 at the testing site along with the respective Spearman correlation coefficient: (a) day one (20 August 2020) and (b) day two (21 August 2020).
Fire 07 00184 g0a5
Figure A6. CO2 vs. CH4 at the testing site along with the respective Spearman correlation coefficient: (a) day one (20 August 2020) and (b) day two (21 August 2020).
Fire 07 00184 g0a6
Figure A7. CH4 vs. CO at the testing site along with the respective Spearman correlation coefficient: (a) day one (20 August 2020) and (b) day two (21 August 2020).
Fire 07 00184 g0a7
Figure A8. CH4 vs. NOx at the testing site along with the respective Spearman correlation coefficient: (a) day one (20 August 2020) and (b) day two (21 August 2020).
Fire 07 00184 g0a8
Figure A9. CH4 vs. PM2.5 at the testing site along with the respective Spearman correlation coefficient: (a) day one (20 August 2020) and (b) day two (21 August 2020).
Fire 07 00184 g0a9

References

  1. Vansintjan, A. The Anthropocene debate: Why is such a useful concept starting to fall apart? Entitle Blog, 26 June 2015. [Google Scholar]
  2. Chasek, P.S. Global Environmental Politics; Routledge: Boca Raton, FL, USA, 2018. [Google Scholar]
  3. Steg, L.; Bolderdijk, J.W.; Keizer, K.; Perlaviciute, G. An Integrated Framework for Encouraging Pro-environmental Behaviour: The role of values, situational factors and goals. J. Environ. Psychol. 2014, 38, 104–115. [Google Scholar] [CrossRef]
  4. Hysa, A. Indexing the vegetated surfaces within WUI by their wildfire ignition and spreading capacity, a comparative case from developing metropolitan areas. Int. J. Disaster Risk Reduct. 2021, 63, 102434. [Google Scholar] [CrossRef]
  5. Benney, T.M.; Cantwell, D.; Singer, P.; Derhak, L.; Bey, S.; Saifee, Z. Understanding Perceptions of Health Risk and Behavioral Responses to Air Pollution in the State of Utah (USA). Atmosphere 2021, 12, 1373. [Google Scholar] [CrossRef]
  6. Juráň, S.; Grace, J.; Urban, O. Temporal changes in ozone concentrations and their impact on vegetation. Atmosphere 2021, 12, 82. [Google Scholar] [CrossRef]
  7. Mallia, D.V.; Lin, J.C.; Urbanski, S.; Ehleringer, J.; Nehrkorn, T. Impacts of upwind wildfire emissions on CO, CO2, and PM2.5 concentrations in Salt Lake City, Utah. J. Geophys. Res. Atmos. 2015, 120, 147–166. [Google Scholar] [CrossRef]
  8. Steffen, W.; Rockström, J.; Richardson, K.; Lenton, T.M.; Folke, C.; Liverman, D.; Summerhayes, C.P.; Barnosky, A.D.; Cornell, S.E.; Crucifix, M. Trajectories of the Earth System in the Anthropocene. Proc. Natl. Acad. Sci. USA 2018, 115, 8252–8259. [Google Scholar] [CrossRef] [PubMed]
  9. Lassman, W.; Ford, B.; Gan, R.W.; Pfister, G.; Magzamen, S.; Fischer, E.V.; Pierce, J.R. Spatial and temporal estimates of population exposure to wildfire smoke during the Washington state 2012 wildfire season using blended model, satellite, and in situ data. GeoHealth 2017, 1, 106–121. [Google Scholar] [CrossRef]
  10. Wu, Y.; Nehrir, A.R.; Ren, X.; Dickerson, R.R.; Huang, J.; Stratton, P.R.; Gronoff, G.; Kooi, S.A.; Collins, J.E.; Berkoff, T.A. Synergistic aircraft and ground observations of transported wildfire smoke and its impact on air quality in New York City during the summer 2018 LISTOS campaign. Sci. Total Environ. 2021, 773, 145030. [Google Scholar] [CrossRef] [PubMed]
  11. Miller, D.D.; Bajracharya, A.; Dickinson, G.N.; Durbin, T.A.; McGarry, J.K.; Moser, E.P.; Nuñez, L.A.; Pukkila, E.J.; Scott, P.S.; Sutton, P.J. Diffusive uptake rates for passive air sampling: Application to volatile organic compound exposure during FIREX-AQ campaign. Chemosphere 2022, 287, 131808. [Google Scholar] [CrossRef]
  12. Buysse, C.E.; Kaulfus, A.; Nair, U.; Jaffe, D.A. Relationships between particulate matter, ozone, and nitrogen oxides during urban smoke events in the western US. Environ. Sci. Technol. 2019, 53, 12519–12528. [Google Scholar] [CrossRef] [PubMed]
  13. Schneider, S.R.; Lee, K.; Santos, G.; Abbatt, J.P. Air quality data approach for defining wildfire influence: Impacts on PM2.5, NO2, CO, and O3 in Western Canadian cities. Environ. Sci. Technol. 2021, 55, 13709–13717. [Google Scholar] [CrossRef] [PubMed]
  14. Wang, Z.-M.; Wang, P.; Wagner, J.; Kumagai, K. Impacts on Urban VOCs and PM2.5 during a Wildfire Episode. Environments 2024, 11, 63. [Google Scholar] [CrossRef]
  15. Rice, R.B.; Boaggio, K.; Olson, N.E.; Foley, K.M.; Weaver, C.P.; Sacks, J.D.; McDow, S.R.; Holder, A.L.; LeDuc, S.D. Wildfires Increase Concentrations of Hazardous Air Pollutants in Downwind Communities. Environ. Sci. Technol. 2023, 57, 21235–21248. [Google Scholar] [CrossRef] [PubMed]
  16. McClure, C.D.; Jaffe, D.A. Investigation of high ozone events due to wildfire smoke in an urban area. Atmos. Environ. 2018, 194, 146–157. [Google Scholar] [CrossRef]
  17. Selimovic, V.; Yokelson, R.J.; McMeeking, G.R.; Coefield, S. Aerosol mass and optical properties, smoke influence on O3, and high NO3 production rates in a western US city impacted by wildfires. J. Geophys. Res. Atmos. 2020, 125, e2020JD032791. [Google Scholar] [CrossRef]
  18. Childs, M.L.; Li, J.; Wen, J.; Heft-Neal, S.; Driscoll, A.; Wang, S.; Gould, C.F.; Qiu, M.; Burney, J.; Burke, M. Daily Local-Level Estimates of Ambient Wildfire Smoke PM2.5 for the Contiguous US. Environ. Sci. Technol. 2022, 56, 13607–13621. [Google Scholar] [CrossRef] [PubMed]
  19. Abatzoglou, J.T.; Kolden, C.A.; Williams, A.P.; Lutz, J.A.; Smith, A.M. Climatic influences on interannual variability in regional burn severity across western US forests. Int. J. Wildland Fire 2017, 26, 269–275. [Google Scholar] [CrossRef]
  20. Wasserman, T.N.; Mueller, S.E. Climate influences on future fire severity: A synthesis of climate-fire interactions and impacts on fire regimes, high-severity fire, and forests in the western United States. Fire Ecol. 2023, 19, 43. [Google Scholar] [CrossRef]
  21. Ninneman, M.; Jaffe, D.A. The impact of wildfire smoke on ozone production in an urban area: Insights from field observations and photochemical box modeling. Atmos. Environ. 2021, 267, 118764. [Google Scholar] [CrossRef]
  22. Selimovic, V.; Yokelson, R.J.; McMeeking, G.R.; Coefield, S. In situ measurements of trace gases, PM, and aerosol optical properties during the 2017 NW US wildfire smoke event. Atmos. Chem. Phys. 2019, 19, 3905–3926. [Google Scholar] [CrossRef]
  23. Baklanov, A.; Chew, B.N.; Frassoni, A.; Gan, C.; Goldammer, J.; Keywood, M.; Mangeon, S.; Manseau, P.M.; Pavlovic, R. The WMO Vegetation Fire and Smoke Pollution Warning Advisory and Assessment System (VFSP-WAS): Concept, current capabilities, research and development challenges and the way ahead. Biodivers. Bras. BioBras. 2021, 11, 179–201. [Google Scholar] [CrossRef]
  24. de Groot, W.J.; Goldammer, J.G.; Keenan, T.; Brady, M.A.; Lynham, T.J.; Justice, C.O.; Csiszar, I.A.; O’Loughlin, K. Developing a global early warning system for wildland fire. For. Ecol. Manag. 2006, 234, S10. [Google Scholar] [CrossRef]
  25. Mendoza, D.L.; Benney, T.M.; Olson, C.S.; Crosman, E.T.; Gonzales, S.A.; Chaudhari, M.; Anderson, C. Pollution hot spots and the impact of drive-through COVID-19 testing sites on urban air quality. Environ. Res. Health 2023, 1, 045001. [Google Scholar] [CrossRef]
  26. Gately, C.K.; Hutyra, L.R.; Peterson, S.; Wing, I.S. Urban emissions hotspots: Quantifying vehicle congestion and air pollution using mobile phone GPS data. Environ. Pollut. 2017, 229, 496–504. [Google Scholar] [CrossRef] [PubMed]
  27. Whiteman, C.D.; Hoch, S.W.; Horel, J.D.; Charland, A. Relationship between particulate air pollution and meteorological variables in Utah’s Salt Lake Valley. Atmos. Environ. 2014, 94, 742–753. [Google Scholar] [CrossRef]
  28. Lareau, N.P.; Crosman, E.; Whiteman, C.D.; Horel, J.D.; Hoch, S.W.; Brown, W.O.J.; Horst, T.W. The Persistent Cold-Air Pool Study. Bull. Am. Meteorol. Soc. 2013, 94, 51–63. [Google Scholar] [CrossRef]
  29. Mendoza, D.L.; Buchert, M.P.; Lin, J.C. Modeling net effects of transit operations on vehicle miles traveled, fuel consumption, carbon dioxide, and criteria air pollutant emissions in a mid-size US metro area: Findings from Salt Lake City, UT. Environ. Res. Commun. 2019, 1, 091002. [Google Scholar] [CrossRef]
  30. Bares, R.; Lin, J.C.; Hoch, S.W.; Baasandorj, M.; Mendoza, D.L.; Fasoli, B.; Mitchell, L.; Catharine, D.; Stephens, B.B. The Wintertime Covariation of CO2 and Criteria Pollutants in an Urban Valley of the Western United States. J. Geophys. Res. Atmos. 2018, 123, 2684–2703. [Google Scholar] [CrossRef]
  31. Baasandorj, M.; Hoch, S.W.; Bares, R.; Lin, J.C.; Brown, S.S.; Millet, D.B.; Martin, R.; Kelly, K.; Zarzana, K.J.; Whiteman, C.D.; et al. Coupling between Chemical and Meteorological Processes under Persistent Cold-Air Pool Conditions: Evolution of Wintertime PM2.5 Pollution Events and N2O5 Observations in Utah’s Salt Lake Valley. Environ. Sci. Technol. 2017, 51, 5941–5950. [Google Scholar] [CrossRef] [PubMed]
  32. Call, B. Understanding Utah’s Air Quality; Utah Department of Environmental Quality Division of Air Quality: Salt Lake City, UT, USA, 2018; Volume 11, p. 2020.
  33. United States Environmental Protection Agency. 2020 National Emissions Inventory (NEI) Data; United States Environmental Protection Agency: Washington, DC, USA, 2021.
  34. Silcox, G.D.; Kelly, K.E.; Crosman, E.T.; Whiteman, C.D.; Allen, B.L. Wintertime PM2.5 concentrations during persistent, multi-day cold-air pools in a mountain valley. Atmos. Environ. 2012, 46, 17–24. [Google Scholar] [CrossRef]
  35. Google Maps. Available online: https://www.google.com/maps (accessed on 12 December 2023).
  36. United States Geological Survey. Elevation Point Query Service; United States Geological Survey: Washington, DC, USA, 2024.
  37. Bush, S.; Hopkins, F.; Randerson, J.; Lai, C.-T.; Ehleringer, J. Design and application of a mobile ground-based observatory for continuous measurements of atmospheric trace gas and criteria pollutant species. Atmos. Meas. Tech. 2015, 8, 3481–3492. [Google Scholar] [CrossRef]
  38. Hopkins, F.M.; Kort, E.A.; Bush, S.E.; Ehleringer, J.R.; Lai, C.T.; Blake, D.R.; Randerson, J.T. Spatial patterns and source attribution of urban methane in the Los Angeles Basin. J. Geophys. Res. Atmos. 2016, 121, 2490–2507. [Google Scholar] [CrossRef]
  39. Mendoza, D.L.; Benney, T.M.; Bares, R.; Fasoli, B.; Anderson, C.; Gonzales, S.A.; Crosman, E.T.; Bayles, M.; Forrest, R.T.; Contreras, J.R.; et al. Air Quality and Behavioral Impacts of Anti-Idling Campaigns in School Drop-Off Zones. Atmosphere 2022, 13, 706. [Google Scholar] [CrossRef]
  40. Wilkinson, J.; Bors, C.; Burgis, F.; Lorke, A.; Bodmer, P. Measuring CO2 and CH4 with a portable gas analyzer: Closed-loop operation, optimization and assessment. PLoS ONE 2018, 13, e0193973. [Google Scholar] [CrossRef]
  41. Mitchell, L.E.; Crosman, E.T.; Jacques, A.A.; Fasoli, B.; Leclair-Marzolf, L.; Horel, J.; Bowling, D.R.; Ehleringer, J.R.; Lin, J.C. Monitoring of greenhouse gases and pollutants across an urban area using a light-rail public transit platform. Atmos. Environ. 2018, 187, 9–23. [Google Scholar] [CrossRef]
  42. Yver Kwok, C.; Laurent, O.; Guemri, A.; Philippon, C.; Wastine, B.; Rella, C.; Vuillemin, C.; Truong, F.; Delmotte, M.; Kazan, V. Comprehensive laboratory and field testing of cavity ring-down spectroscopy analyzers measuring H2O, CO2, CH4 and CO. Atmos. Meas. Tech. 2015, 8, 3867–3892. [Google Scholar] [CrossRef]
  43. 2B Technologies Inc. Ozone Monitor Operation Manual Model 205. 2024. Available online: https://2btech.io/wp-content/uploads/docs/manuals/model_205_revE-6.pdf (accessed on 1 May 2024).
  44. 2B Technologies Inc. NO2/NO/NOx Monitor Operation Manual Model 405 nm. 2024. Available online: https://2btech.io/wp-content/uploads/docs/manuals/model_405nm_revJ-4.pdf (accessed on 1 May 2024).
  45. Met One Instruments Inc. ES-642 Dust Monitor Operation Manual. 2013. Available online: https://metone.com/wp-content/uploads/2019/05/ES-642-9800-Rev-F.pdf (accessed on 1 May 2024).
  46. Utah Division of Air Quality. Utah Division of Air Quality 2020 Annual Report. 2021. Available online: https://documents.deq.utah.gov/air-quality/planning/air-quality-policy/DAQ-2021-000768.pdf (accessed on 1 May 2024).
  47. Rickly, P.S.; Coggon, M.M.; Aikin, K.C.; Alvarez, R.J.; Baidar, S.; Gilman, J.B.; Gkatzelis, G.I.; Harkins, C.; He, J.; Lamplugh, A. Influence of wildfire on urban ozone: An observationally constrained box modeling study at a site in the Colorado front range. Environ. Sci. Technol. 2023, 57, 1257–1267. [Google Scholar] [CrossRef] [PubMed]
  48. Frausto-Vicencio, I.; Heerah, S.; Meyer, A.G.; Parker, H.A.; Dubey, M.; Hopkins, F.M. Ground solar absorption observations of total column CO, CO2, CH4, and aerosol optical depth from California’s Sequoia Lightning Complex Fire: Emission factors and modified combustion efficiency at regional scales. Atmos. Chem. Phys. 2023, 23, 4521–4543. [Google Scholar] [CrossRef]
  49. Bento-Gonçalves, A.; Vieira, A. Wildfires in the wildland-urban interface: Key concepts and evaluation methodologies. Sci. Total Environ. 2020, 707, 135592. [Google Scholar] [CrossRef] [PubMed]
  50. Taccaliti, F.; Marzano, R.; Bell, T.L.; Lingua, E. Wildland–urban interface: Definition and physical fire risk mitigation measures, a systematic review. Fire 2023, 6, 343. [Google Scholar] [CrossRef]
  51. Mendoza, D.L.; Hill, L.D.; Blair, J.; Crosman, E.T. A Long-Term Comparison between the AethLabs MA350 and Aerosol Magee Scientific AE33 Black Carbon Monitors in the Greater Salt Lake City Metropolitan Area. Sensors 2024, 24, 965. [Google Scholar] [CrossRef]
  52. Young, O. Navigating the sustainability transition: Governing complex and dynamic socio-ecological systems. In Global Environmental Commons: Analytical and Political Challenges in Building Governance Mechanisms; Oxford Academic: Oxford, UK, 2012; pp. 80–104. [Google Scholar] [CrossRef]
  53. Betsill, M.M.; Benney, T.M.; Gerlak, A.K. Agency in Earth System Governance; Cambridge University Press: Cambridge, UK, 2020. [Google Scholar] [CrossRef]
Figure 1. Salt Lake City and Salt Lake County within Utah and the United States (left inset) with the interstate highways (I-15, I-80, I-215) and population density noted. The COVID-19 testing site is denoted with a green “X”; the Utah Division of Air Quality (UDAQ) regulatory air quality monitoring sites are Hawthorne (yellow circle) and Rose Park (blue circle).
Fire 07 00184 g001
Figure 2. NASA MODIS corrected reflectance (true color) imagery at 1 km resolution showing the California Complex Wildfire plume: (a) Terra 18:50 UTC 19 August 2020; (b) Terra 19:35 UTC 20 August 2020; (c) Terra 18:40 UTC 21 August 2020; and (d) Terra 19:20 UTC 22 August 2020. MODIS imagery is from the NASA Worldview application (https://worldview.earthdata.nasa.gov accessed on 15 May 2024), part of the NASA Earth Observing System Data and Information System (EOSDIS). Salt Lake City is denoted by a red star. Smoke from wildfires is a gray color, and the general westward transport trajectory of wildfire smoke from California towards Salt Lake City during the episode is illustrated by red arrows in (b).
Fire 07 00184 g002
Figure 3. Study period wind roses at Salt Lake City International Airport: (a) 20 August 2020 and (b) 21 August 2020.
Fire 07 00184 g003
Figure 4. Time series between 20 and 22 August 2020 of study pollutants at the COVID-19 testing site (black line) and UDAQ regulatory air quality monitoring sites Rose Park (blue line) and Hawthorne (red line): (a) carbon monoxide (CO); (b) nitrogen oxides (NOx); (c) ozone (O3); (d) fine particulate matter (PM2.5); (e) carbon dioxide (CO2); and (f) methane (CH4).
Fire 07 00184 g004aFire 07 00184 g004b
Figure 5. CO vs. NOx at the testing site (test—black dots) and UDAQ regulatory air quality monitoring sites Rose Park (QRP—blue diamonds) and Hawthorne (QHW—red triangles), along with their respective Spearman correlation coefficients: (a) day one (20 August 2020) and (b) day two (21 August 2020). Note that the COVID-19 testing site operated approximately 6 h a day (from 13:00 h to 19:00 h) while the UDAQ sites operated continuously.
Fire 07 00184 g005
Figure 6. CO vs. PM2.5 at the testing site (test—black dots) and UDAQ regulatory air quality monitoring sites Rose Park (QRP—blue diamonds) and Hawthorne (QHW—red triangles), along with their respective Spearman correlation coefficients: (a) day one (20 August 2020) and (b) day two (21 August 2020). Note that the COVID-19 testing site operated approximately 6 h a day (from 13:00 h to 19:00 h) while the UDAQ sites operated continuously.
Fire 07 00184 g006
Figure 7. NOx vs. ozone at the testing site (test—black dots) and UDAQ regulatory air quality monitoring sites Rose Park (QRP—blue diamonds) and Hawthorne (QHW—red triangles), along with their respective Spearman correlation coefficients: (a) day one (20 August 2020) and (b) day two (21 August 2020). Note that the COVID-19 testing site operated approximately 6 h a day (from 13:00 h to 19:00 h) while the UDAQ sites operated continuously.
Fire 07 00184 g007
Figure 8. Ozone vs. PM2.5 at the testing site (test—black dots) and UDAQ regulatory air quality monitoring sites Rose Park (QRP—blue diamonds) and Hawthorne (QHW—red triangles), along with their respective Spearman correlation coefficients: (a) day one (20 August 2020) and (b) day two (21 August 2020). Note that the COVID-19 testing site operated approximately 6 h a day (from 13:00 h to 19:00 h) while the UDAQ sites operated continuously.
Fire 07 00184 g008
Figure 9. CO2 vs. NOx at the testing site along with the respective Spearman correlation coefficient: (a) day one (20 August 2020) and (b) day two (21 August 2020).
Fire 07 00184 g009
Figure 10. CH4 vs. ozone at the testing site along with the respective Spearman correlation coefficient: (a) day one (20 August 2020) and (b) day two (21 August 2020).
Fire 07 00184 g010
Table 1. Instruments found at the three measurement sites.
Measurement SitePollutants MeasuredLocation Relative to COVID-19 Testing Site
Mobile VanCO, NOx, PM2.5, O3, CO2, CH45 m west
UDAQ Rose ParkCO, NOx, PM2.5, O31.5 km northwest
UDAQ HawthorneCO, NOx, PM2.5, O34.5 km southeast
Disclaimer/Publisher’s Note: The statements, opinions and data contained in all publications are solely those of the individual author(s) and contributor(s) and not of MDPI and/or the editor(s). MDPI and/or the editor(s) disclaim responsibility for any injury to people or property resulting from any ideas, methods, instructions or products referred to in the content.