Article

Hyperspectral Reflectance and Chemical Composition of Pre- and Post-Fire Soils from Three 2021 Western USA Megafires

1
Division of Atmospheric Sciences, Desert Research Institute, Reno, NV 89512, USA
2
Department of Physics, University of Nevada, Reno, NV 89557, USA
3
Division of Hydrologic Sciences, Desert Research Institute, Las Vegas, NV 89119, USA
4
Division of Earth and Ecosystem Sciences, Desert Research Institute, Reno, NV 89512, USA
*
Author to whom correspondence should be addressed.
Fire 2023, 6(12), 471; https://doi.org/10.3390/fire6120471
Submission received: 9 November 2023 / Revised: 13 December 2023 / Accepted: 14 December 2023 / Published: 16 December 2023
(This article belongs to the Special Issue Post-fire Effects on Environment)

Abstract

:
Over the past two decades, wildfire activity in the western USA has increased, especially in California. Wildfires not only affect air quality but also the environment at large, including chemical and physical properties of fire-affected soils, which are of great interest for prediction and mitigation of hydrological consequences. Hyperspectral reflectance can be used to remotely assess the effects of fires on soil and here we use it to characterize soils before and after three 2021 California wildfires (Dixie, Beckwourth Complex, and Caldor fire). We acquired reflectance spectra and compared changes in these spectra with changes in the chemistry of analyzed soils. For all three fires, the results show that 700 nm wavelength reflectance of ash samples collected 1 and 1.5 years after fire decreased between 36% and 76% compared to that of samples collected right after the fires. Additionally, significantly higher visible reflectance has been found for unburned compared to burned soil samples in each region that was studied. Infrared transmission measurements were used to characterize the carbonate content of soil and ash samples demonstrating a mostly positive relationship between carbonate content and visible reflectance, indicating a possible cause and effect between the two.

1. Introduction

Over the past two decades, wildfire activity has increased in terms of frequency, intensity, and size in the western USA, especially in California and Nevada [1,2,3,4]. This has been attributed to climate change causing rising temperatures and altered precipitation patterns [1,3], but also to population growth, especially in the Wildland Urban Interface (WUI) [5,6,7,8]; accumulation of fuels due to historical fire suppression [5,6]; and extended drought conditions and heat waves [5,6]. As part of the increase in fire size, western USA megafires (>160 km2 in size [7]) [2,9,10,11] have increased in frequency by up to 1000% over the past 40 years [3] despite increased suppression efforts. Roughly 5224 km2 of land were burned by three 2021 California megafires: the Dixie, Beckwourth Complex, and Caldor fires [3]. For example, the 2021 Dixie fire was the largest single wildfire in the history of California and burned 3898 km2 of land, mostly conifer forest [7,12]. Accelerated runoff and soil erosion were two major consequences of this and other recent California wildfires [3], which were largely caused by the formation of water-repellent soils during these fires [8,12,13,14,15,16]. Previous studies discussed changes in soil chemical and physical properties caused by wildfires [8,13,17,18,19,20].
There are several remote sensing technologies, such as hyperspectral reflectance spectroscopy, that can complement conventional methods for studying soil physical and chemical properties [21,22,23,24,25,26]. These technologies can be used for multiple soil science applications and allow for timely, nondestructive, and accurate acquisition of soil spectral characteristics. For example, remote sensing tools are used to estimate soil moisture content, which is important for assessing water exchange between soil and the atmosphere [27]. In addition, several studies have used remote sensing for characterizing post-fire soil properties [21,22,23]. For example, Sestak et al. [25] collected soil samples of different burn severities after fires in Croatia and acquired their reflectance spectra with an Analytical Spectral Devices Spectroradiometer (ASD FieldSpec) under laboratory conditions. They concluded that the average reflectance of soil samples collected immediately after fires was higher than that of those collected later after the fires. Rosero-Vlasova et al. [23] used different laboratory setups of ASD FieldSpec for characterizing soils from wildfires and showed that some bands in visible, near-infrared, and shortwave infrared regions are of importance, and can be used to detect organic matter, clay minerals, iron, water, and aluminum oxides. Finley et al. [24] investigated fire-induced soil hydrophobicity (FISH) and spectral properties of the soils across the burned areas in southern Idaho rangelands using ASD FieldSpec in the field, and found that soils with high water repellency showed 5% to 10% less reflectance in the near-infrared region of the spectrum than soils with low or moderate water repellency. Vetrita et al. [26] also examined spectral changes associated with fires in Indonesia using ASD FieldSpec, and showed that shortwave infrared and near-infrared regions are most crucial for differentiating between burned and unburned areas. Thus, understanding the hyperspectral reflectance of post-fire soils is of the essence for predicting, characterizing, and mitigating post-fire cascading disasters. Fourier-transform infrared (FTIR) spectroscopy is one of the commonly used techniques for analyzing the chemical composition of dust and soil [28,29,30,31,32,33,34]. In the present study, we investigate changes in ash samples that were collected after recent megafires to study the evolution of surface soils in burned regions after fire activity. According to some studies [35], chemical changes in post-fire soils can be detected with different techniques, of which FTIR spectroscopy is the most commonly and successfully used. FTIR spectroscopy can be employed for characterizing chemical compounds in soils and assessing the different organic substances responsible for FISH [21,28,30,33,36,37,38]. Physical and chemical soil properties can also be investigated with hyperspectral soil reflectance measurements, which have an added advantage of the potential for remote sensing. However, there is a large knowledge gap in the spectral analysis of post-fire soils and how soil spectral properties associate with soil chemical composition. Moreover, only very limited research has been conducted on fire-affected soils to study the evolution of surface soils in burned regions after fire activity in the western USA [39]. This research is focused on the spectral analysis of fire affected soils and their comparison with unburned soils.
For this purpose, in the present study, ash, and burned and unburned soil samples from three 2021 megafires in California, USA (the Dixie, Beckwourth Complex, and Caldor fires) were collected, and reflectance analysis of pre- and post-fire soils as well as of ash were performed using the ASD FieldSpec technique. The results were compared with FTIR chemical analysis data to determine whether remote sensing can be used to characterize chemical soil properties and thus soil hydrologic response to fires. Moreover, temporal changes in both reflectance and transmittance spectra of ash and soil samples were analyzed for better understanding of the chemical changes in soil samples during post-fire recovery.

2. Materials and Methods
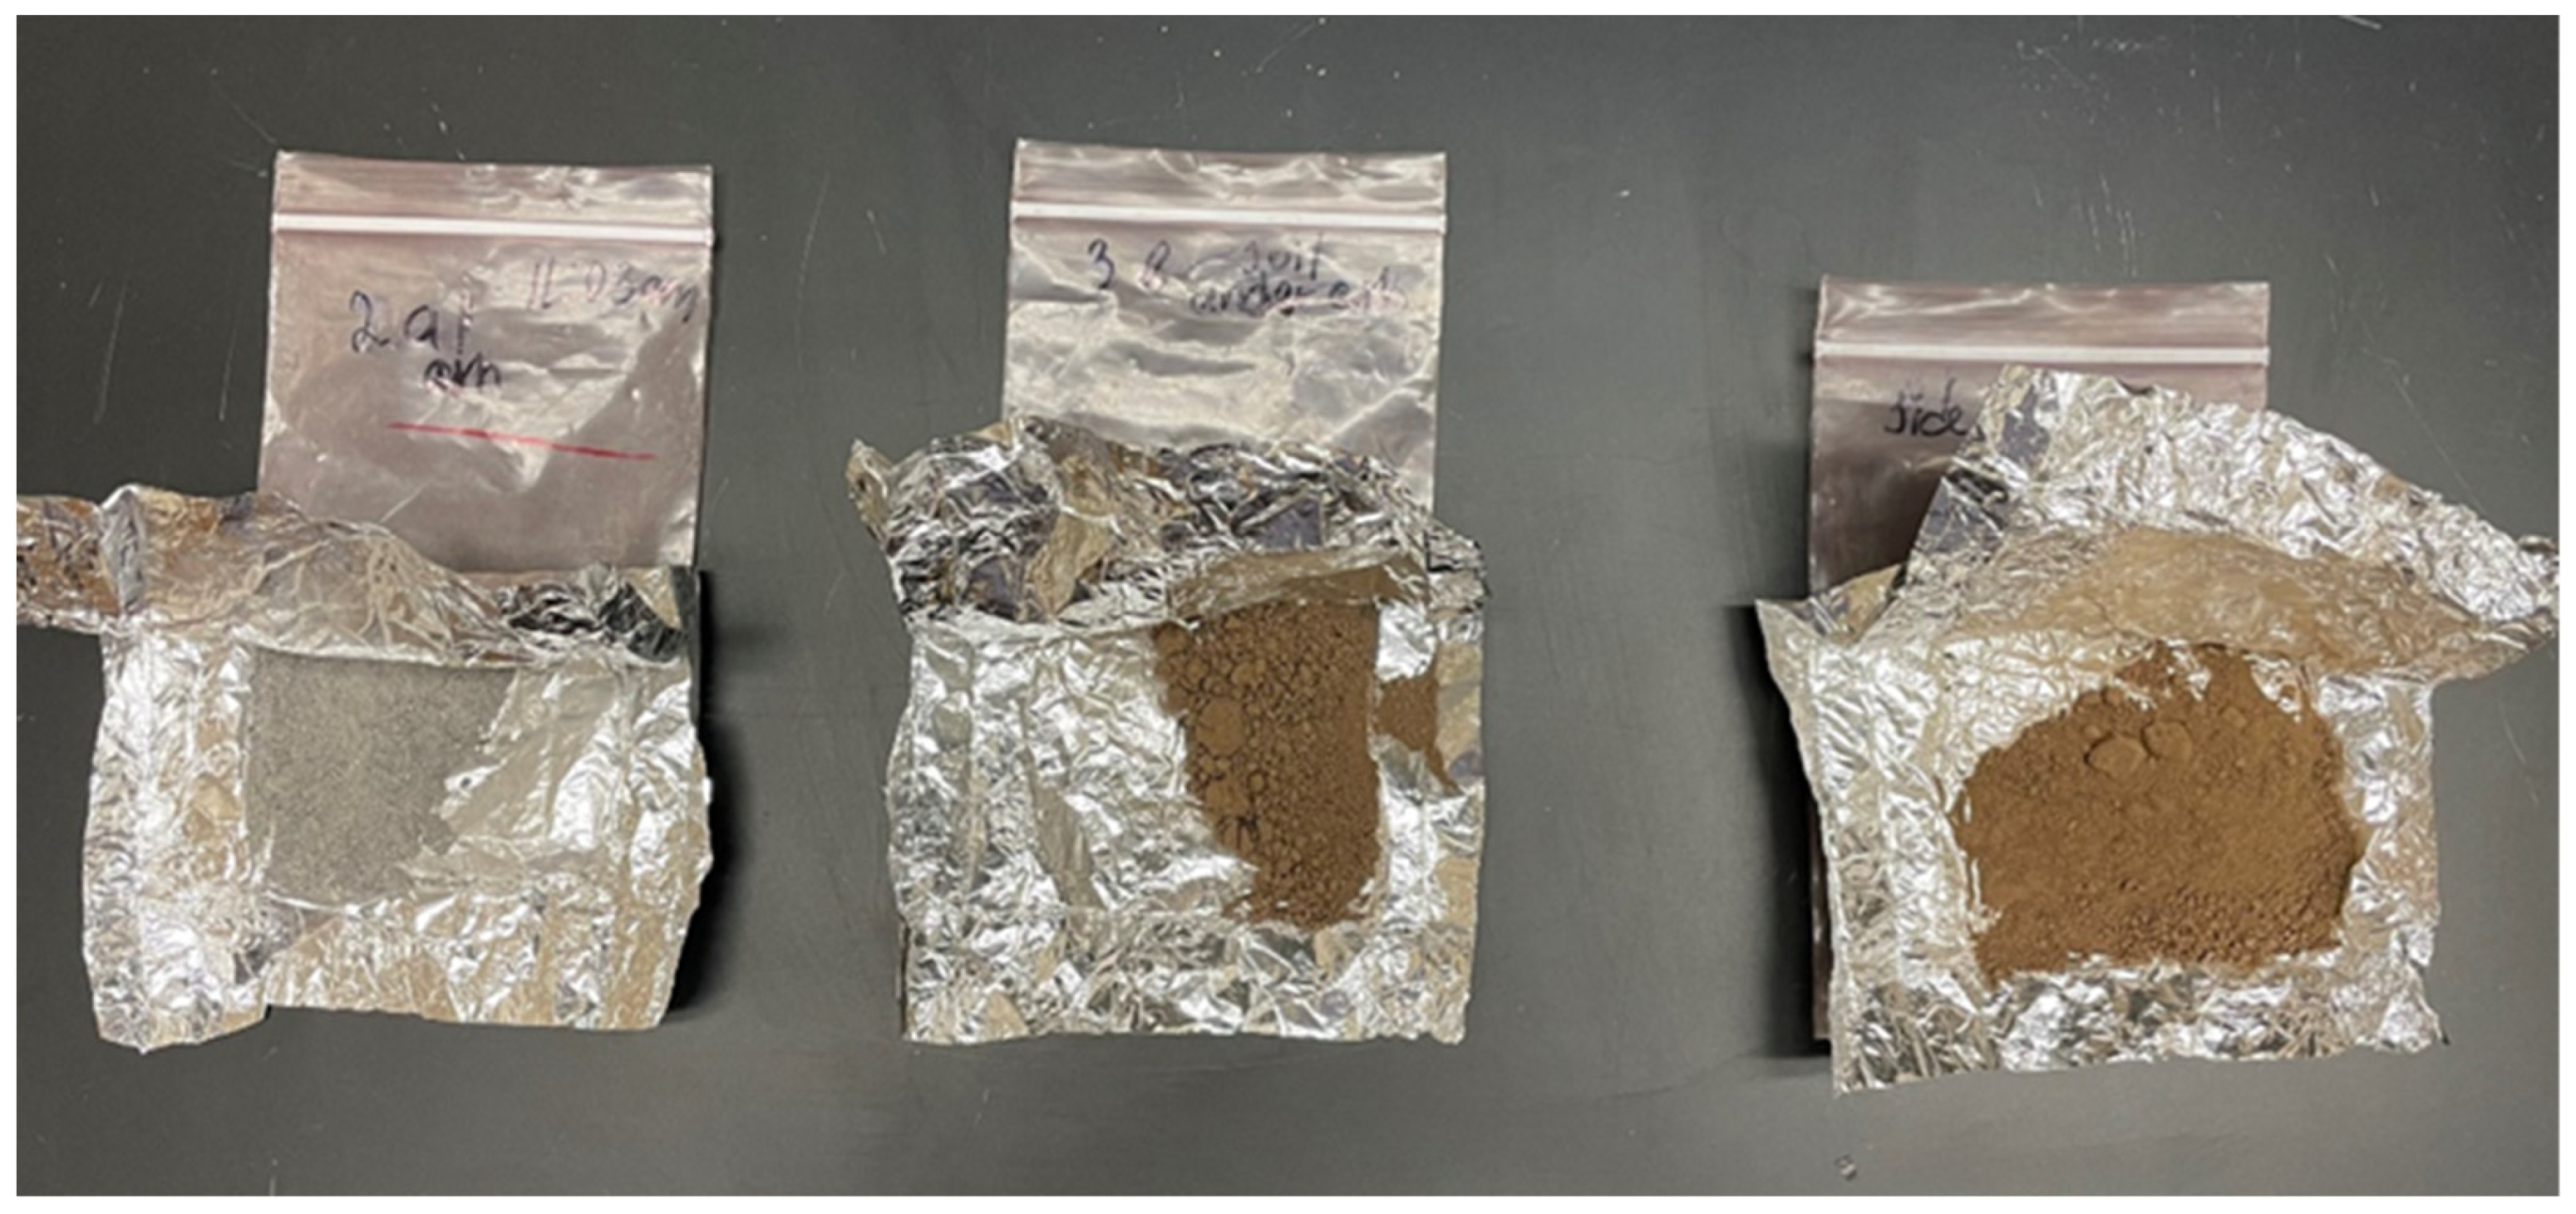
2.1. Sampling

This research was conducted after three megafires (the Dixie, Beckwourth Complex, and Caldor fires) that occurred during 2021 in conifer forests of California and Nevada, USA (Figure S1). Details such as the start and ending times, burned land area, and the Global Positioning System (GPS) location of our sampling sites within the fire perimeters are presented in Table 1.
Three types of samples (ash, burned soils, and unburned soils) were collected from the regions of three megafires (Table 1 and Table S1). Based on visual observation of the areas, medium- and high-severity burned areas were chosen for ash and soil sampling. Approximately 10 to 100 g of each of the samples, including ash, and burned and unburned soil, were collected into aluminum foil envelopes and were kept in a sample cooler during transport to the laboratory [3]. The ash samples were collected from the ash layer above the soil. After removing this ash layer, the burned soil was sampled. Unburned soil was collected from a similar depth at a nearby unburned area. Three to five replicates for each of the samples were collected. Figure 1 shows examples of these three sample types that were collected fresh after the Dixie fire. Such samples were collected immediately after fire (0 months), 1 year, and 1.5 years after the wildfire. Samples were packed in aluminum foil envelopes and stored at −20 °C. Most of the particles in the ash samples were between 200 and 250 μm in diameter, whereas most of the burned and unburned soil particles were between 1 and 2 mm in diameter, as determined with a Malvern Mastersizer 3000 (Malvern Panalytical, Malvern, UK).

2.2. Spectral Measurements

Soil reflectance measurements were performed on the rooftop of the Northern Nevada Science Center (NNSC) of Desert Research Institute (DRI) (latitude 39°34′17.76″ N, longitude 119°48′3.6″ E, elevation 1516 m) using an ASD FieldSpec3 (ASD Inc., Boulder, CO, USA). Prior to the measurements, the soil samples were air dried at a relative humidity of 20% to 30% and at a room temperature of 22 to 24 °C. Also, the surface of all the samples was leveled and smoothed with a clean spatula. The ASD FieldSpec3 instrument integrates three separate spectrometers each dedicated to a specific spectral range (first detector: 350–1000 nm, second detector: 1000–1830 nm, and third detector: 1830–2500 nm). Combining data from these three sensors into one spectrum caused minor artifacts in the reflectance spectra near the boundaries of these spectral ranges. The reflectance spectra were acquired over the wavelength range of 350 nm to 2500 nm; measurements were taken at seven different spots within the leveled surface area of each of the samples and 10 spectra were collected at each spot. For this research, a Field of View (FOV) of 18° was used. During the measurements, the entrance aperture of the device was held approximately 2 cm above the sample surface. All measurements utilized natural sunlight near solar noon (12:00 through 14:00 local time) on 28 July 2023, a sunny day with clear sky conditions. Calibrations were performed for each sample and included measuring dark current and white reference reflectance from a Spectralon calibration target.
Reflectance spectra were exported using ViewSpecPro version 6.2 and RS3 version 6.4.0 software (Analytical Spectral Devices, Inc., Boulder, CO, USA) for further data analysis. The ASD FieldSpec3 automatically calculated the relative reflectance by dividing the reflectance of the sample surface by that of the calibration (i.e., Spectralon) target. Noisy spectral regions were caused by strong atmospheric absorption and included wavelengths between 1832 and 1926 nm, and between 2453 and 2500 nm; data for these noisy regions were removed before further analysis. Further spectral analysis was performed using MS Excel and included locating wavelengths with the maximum ratio of unburned and burned soil sample reflectance.

2.3. FTIR Measurements

FTIR transmission spectra with a spectral resolution of 4 cm−1 were acquired using a Nicolet 380 FTIR spectrometer (Thermo Fisher Scientific Inc., Waltham, MA, USA). Ash samples from the Dixie fire, collected in 2021, 2022, and 2023, were chosen for FTIR analysis that included 32 spectral scans with a total collection time of ~39 s for each sample. Two 1 g samples were obtained from each ash sample and one of them was washed with water and dried using a centrifuge (Southwest Science, Roebling, NJ, USA) at DRI. The other 1 g sample was left dry and unmodified. Calcium carbonate (CaCO3) was purchased from Fisher Chemical (Fair Lawn, NJ, USA) for use as an additional sample. All samples were sieved with a 20 μm USA standard test sieve (Gilson Company, Inc., Columbus, OH, USA). Potassium bromide (KBr) (PIKE Technologies, Inc., Madison, WI, USA) was ground for preparing pellets, which were then compressed and prepared using a CrushIRTM, a 15 US ton (13.6 metric ton) hydraulic press (PIKE Technologies, Madison, WI, USA). To prepare pellets, 200 mg of KBr and ~0.5 mg of analyte were used [33]. Pellets were made under a pressure of ∼10 t cm−2 (~15 MPa). The FTIR spectra were acquired over the wavenumber range of 4000 to 400 cm−1 (2.5 to 25 μm wavelengths). The spectra were exported using OMNIC (Thermo Fisher Scientific, Inc., Waltham, MA, USA) software for further analysis.

3. Results and Discussion

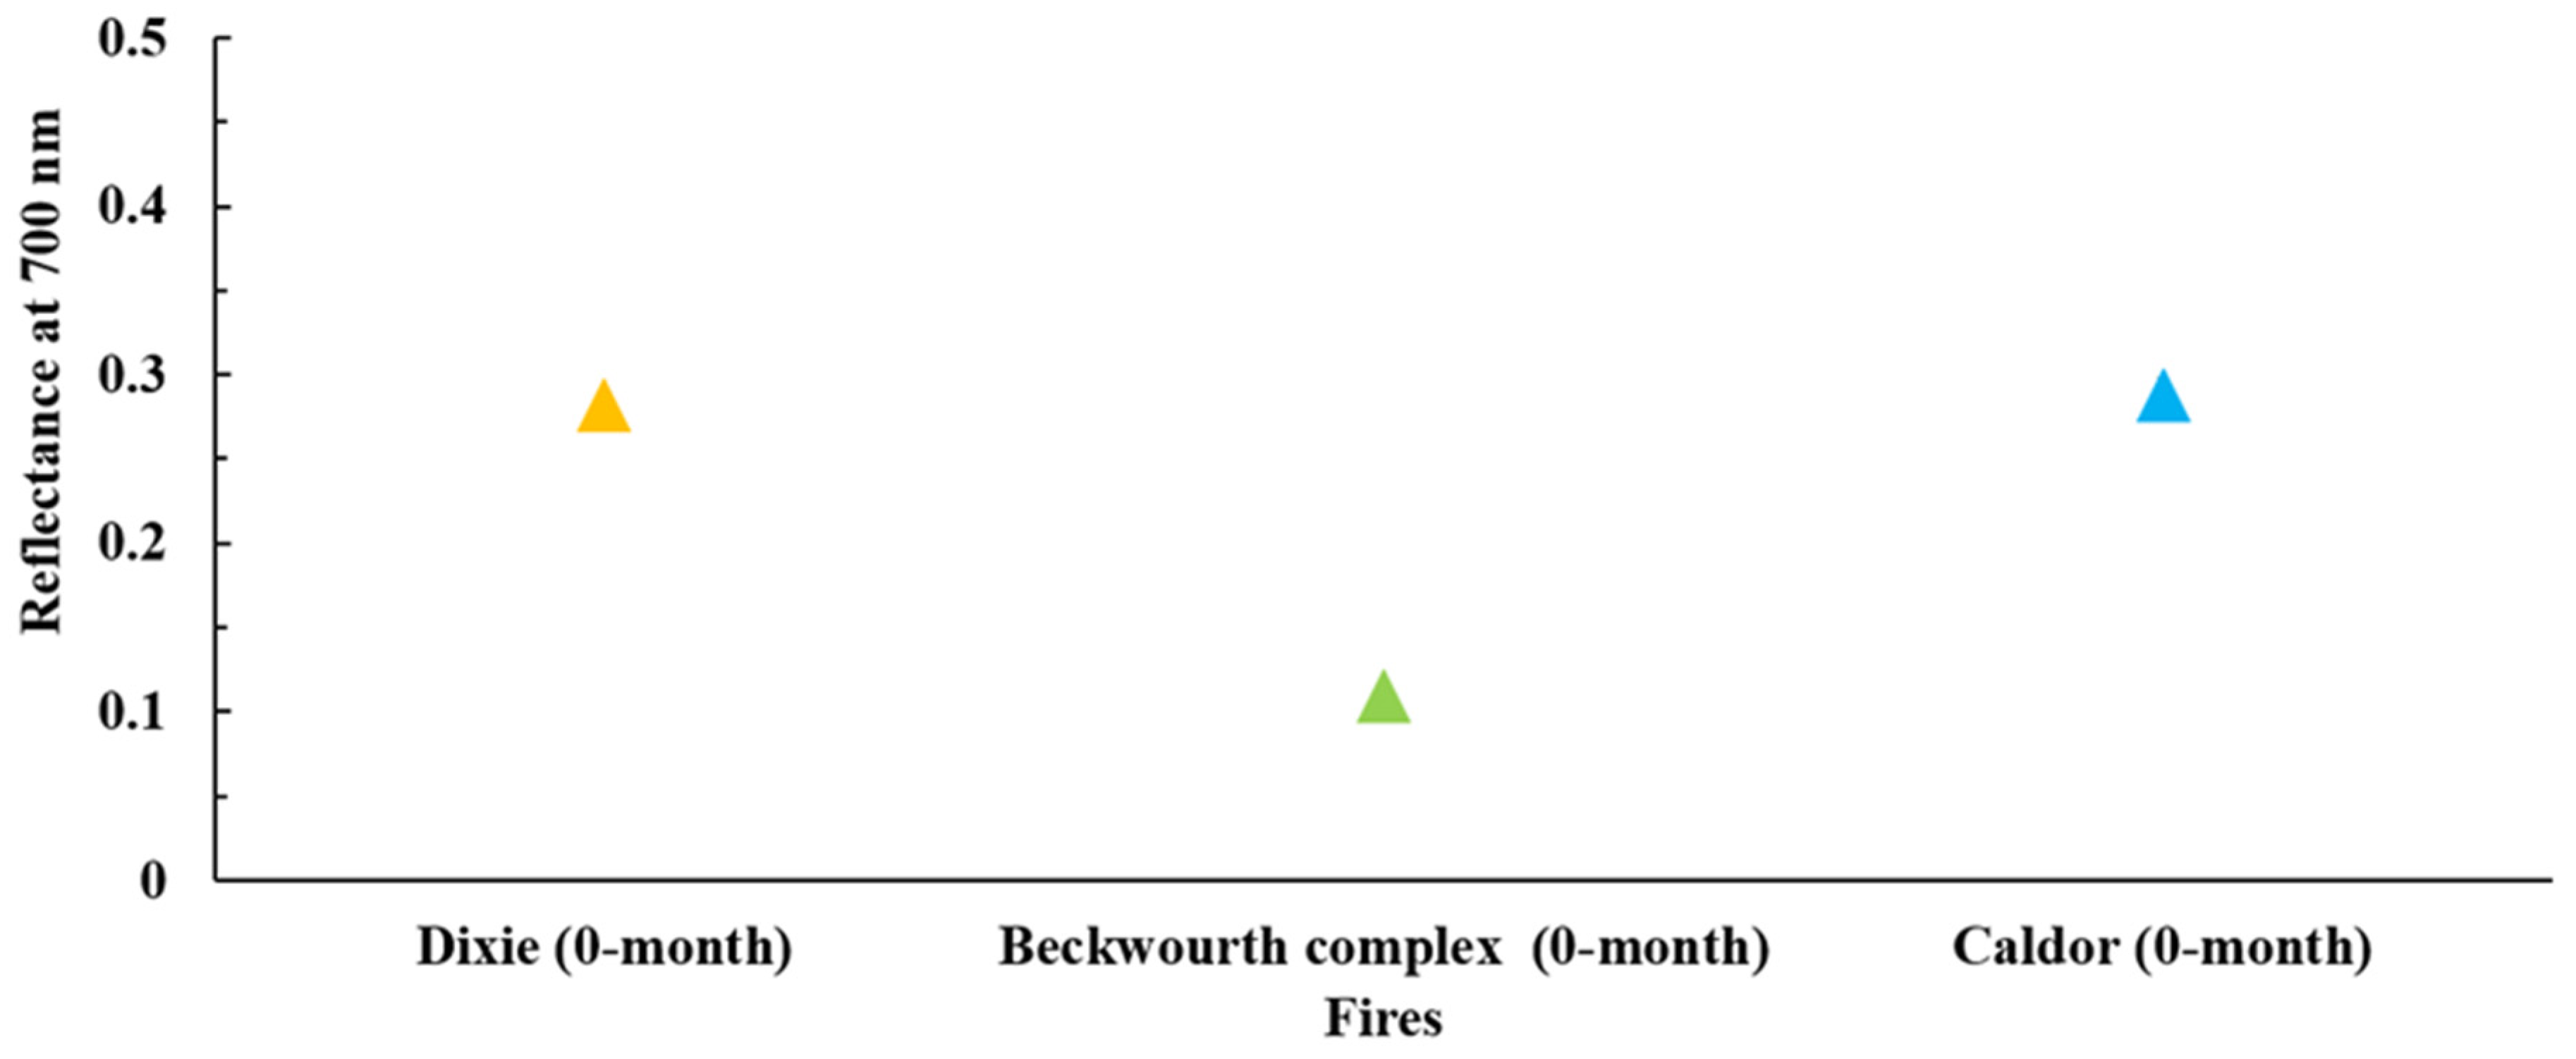
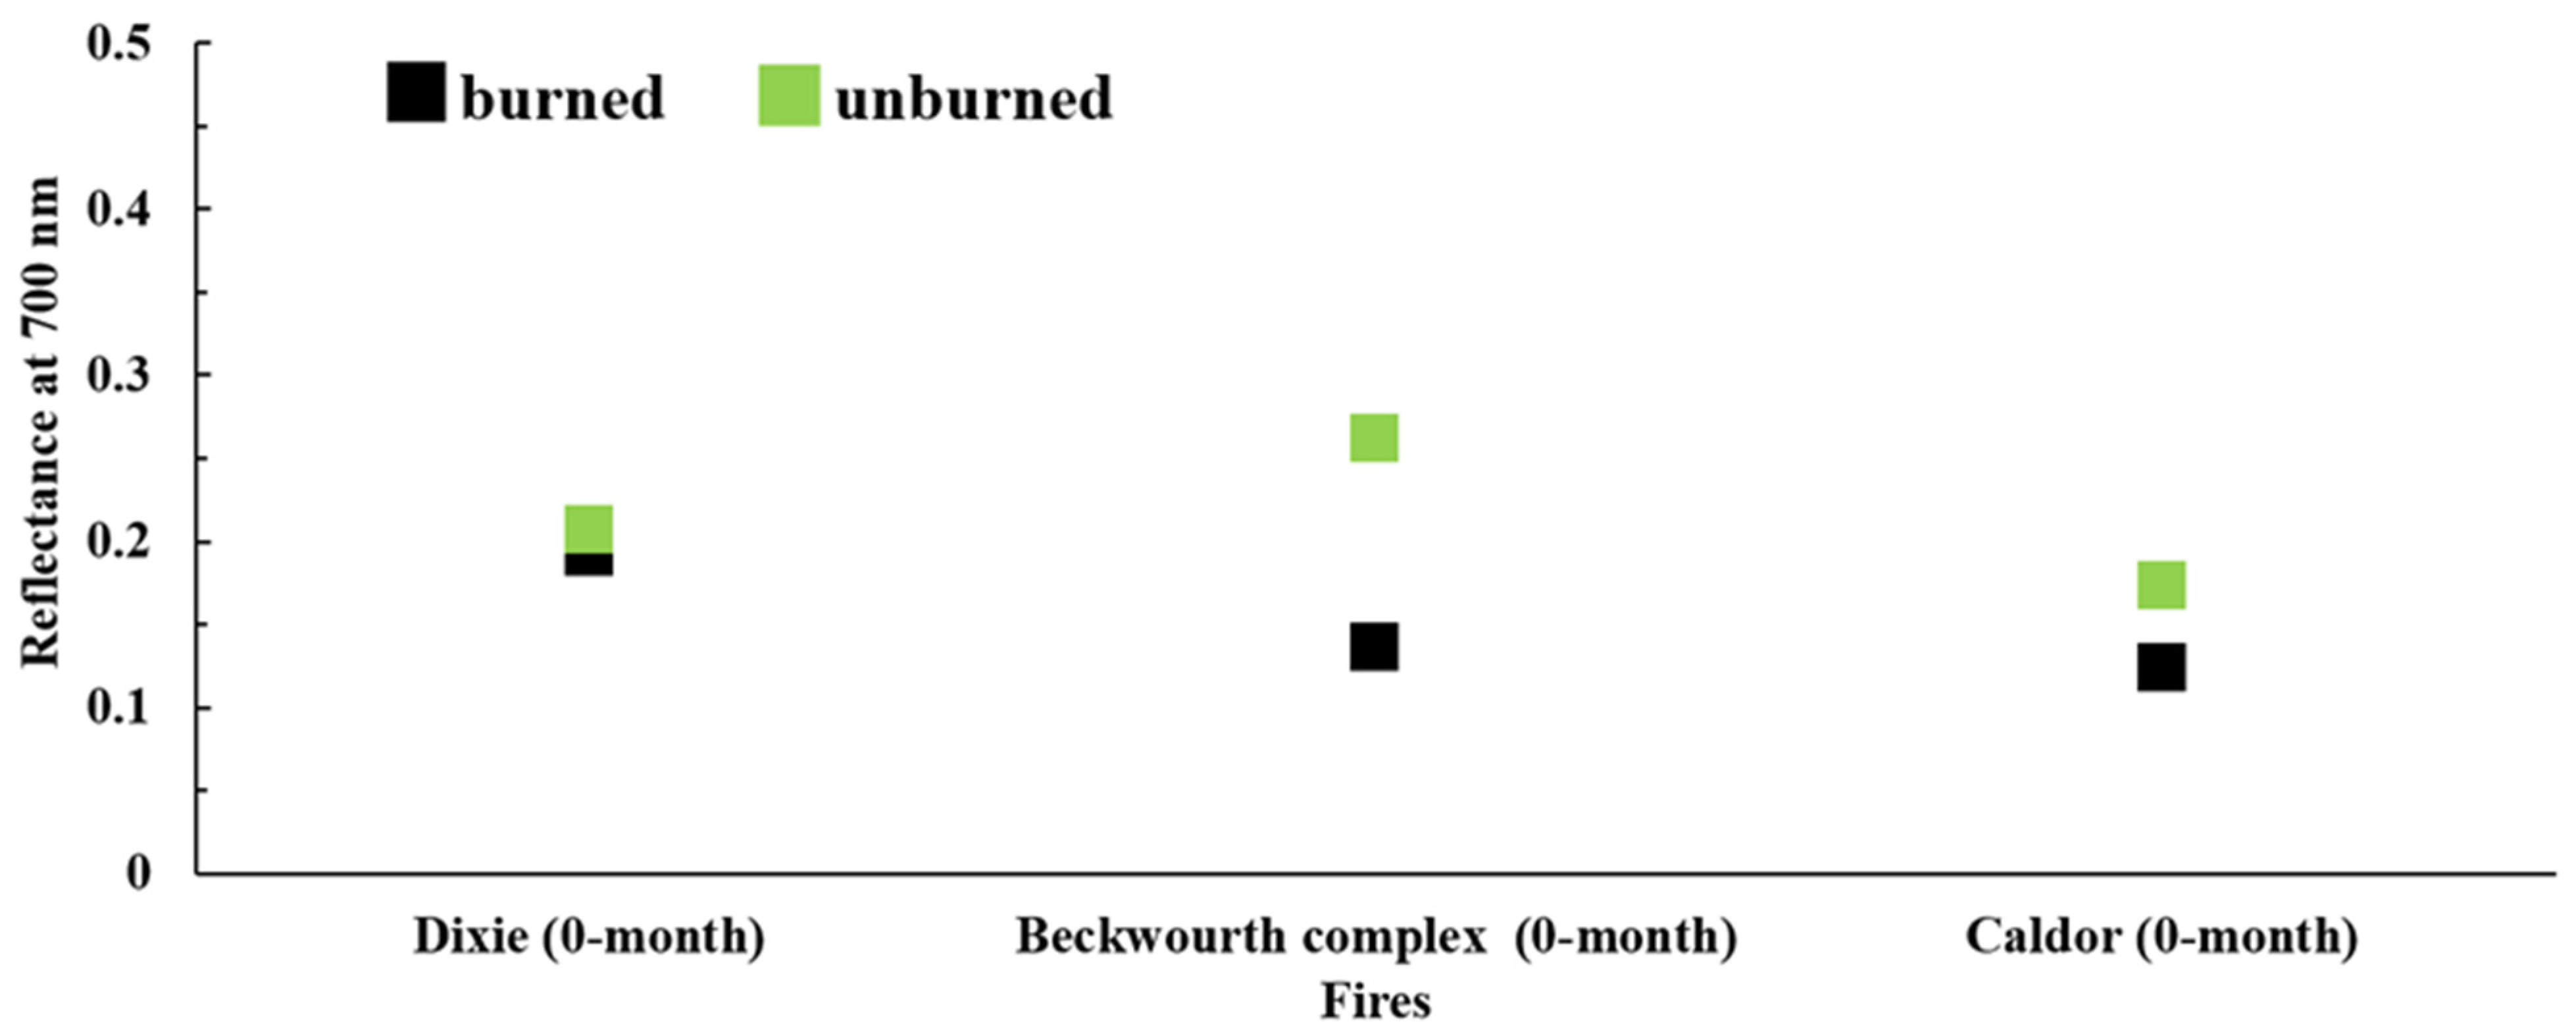
3.1. Reflectance Analysis of 0-Month Samples

Figure 2 shows the reflectance spectra of the 0-month (i.e., collected immediately after the fires) ash, burned soil, and unburned soil samples for the Dixie, Beckwourth Complex, and Caldor fires. Comparison between unburned and burned soil reflectance spectra in the visible range (400–700 nm) shows that unburned soils have higher reflectance than burned soils for all fires. This is especially noticeable for soil from the Beckwourth Complex (Figure 2b) and Caldor fires (Figure 2c), which have significantly different reflectance for the visible spectrum range. Above the visible range (>700 nm), the reflectance spectra behave differently for different analyzed samples. For example, ash has the highest reflectance in the Dixie and Caldor fires followed by burned soils, whereas in the Beckwourth Complex fire, ash, burned soil, and unburned soil reflectances are very close.
To simplify the assessment of the reflectance spectra for all samples, reflectances in the visible range of spectra were compared. Most of the fires experienced the highest variation (highest difference in reflectance signal) between burned and unburned soil samples at ~700 nm, so this wavelength was chosen for further comparison in reflectance between analyzed samples (Table 1, Figure 3, Figure 4, Figure 5 and Figure 6). For all the fires, the highest difference in the reflectance between ash, burned soil, and unburned soil samples were observed between 350 nm and 850 nm wavelengths.
Figure 3 shows the reflectance at the 700 nm wavelength of ash samples collected immediately (0 months) after the Dixie, Beckwourth Complex, and Caldor fires. The reflectances observed for all these samples vary from ~0.1 to ~0.3 for the selected wavelength. Among all fires, the ash of the Beckwourth Complex fire has the lowest reflectance (0.110 ± 0.002), whereas, for ash from the Dixie (reflectance of 0.282 ± 0.007) and Caldor (reflectance of 0.287 ± 0.011) fires, those reflectances were approximately two to three times higher than that for ash from the Beckwourth Complex fire. Roy et al. [40] measured the reflectance of 15 black char and white mineral ash samples collected after prescribed fires using a portable spectroradiometer. All these reflectances fall within the range of ~0.1 to ~0.4 in the visible part of the spectrum (390 to 830 nm). In another report and case study by Laes et al. [41], the reflectance of ash samples collected after the Hayman fire varied between 0 and 0.2 in the visible range. Although the sources of ash, locations of the fires, and many other parameters were different in those two studies (Roy et al., 2010 [40]; Laes et al., 2004 [41]), they still confirm that some of our results, such as the ash reflectance in the Beckwourth Complex fire, are comparable to their data, whereas our Dixie and Caldor fires ash reflectances were a bit higher than the respective values in those studies.
Figure 4 shows that the reflectances for 0-month burned soils and unburned soils from the Dixie, Beckwourth Complex, and Caldor fires vary from ~0.1 to ~0.3. The burned soil sample from the Dixie fire had the highest reflectance (0.193 ± 0.002), ~36% compared to the Beckwourth Complex fire (0.136 ± 0.001), and ~58% compared to the Caldor fire (0.123 ± 0.002), with the Beckwourth Complex and Caldor fires having similar reflectances for burned soils. However, unburned soils from the Beckwourth Complex fire (0.262 ± 0.006) had higher reflectance, ~19% higher than unburned soils from the Dixie fire (0.207 ± 0.002) and ~35% higher than those from the Caldor fire (0.173 ± 0.002). For all fires, unburned soils have higher reflectance than burned soils at 700 nm: Dixie (0.207 ± 0.002 vs. 0.193 ± 0.002, p < 0.0001), Caldor (0.173 ± 0.002 vs. 0.123 ± 0.002, p < 0.0001), and Beckwourth Complex (0.262 ± 0.006 vs. 0.136 ± 0.001, p < 0.0001). The smallest difference in reflectance of burned and unburned soil samples at 700 nm was observed for the Dixie fire, whereas the largest difference between these two soil sample types was noticed for the Beckwourth Complex fire.
Based on t-test calculations, the difference in the reflectance between burned and unburned soil samples (at 700 nm) was statistically significant for all fires with p values less than 0.0001 [3]. This difference is most likely due to chemical differences between burned and unburned soil samples. For example, the presence of black carbon in burned samples can lower the reflectance. Our laboratory experiments confirmed this observation by adding black carbon to the unburned soil sample (Figure S2).

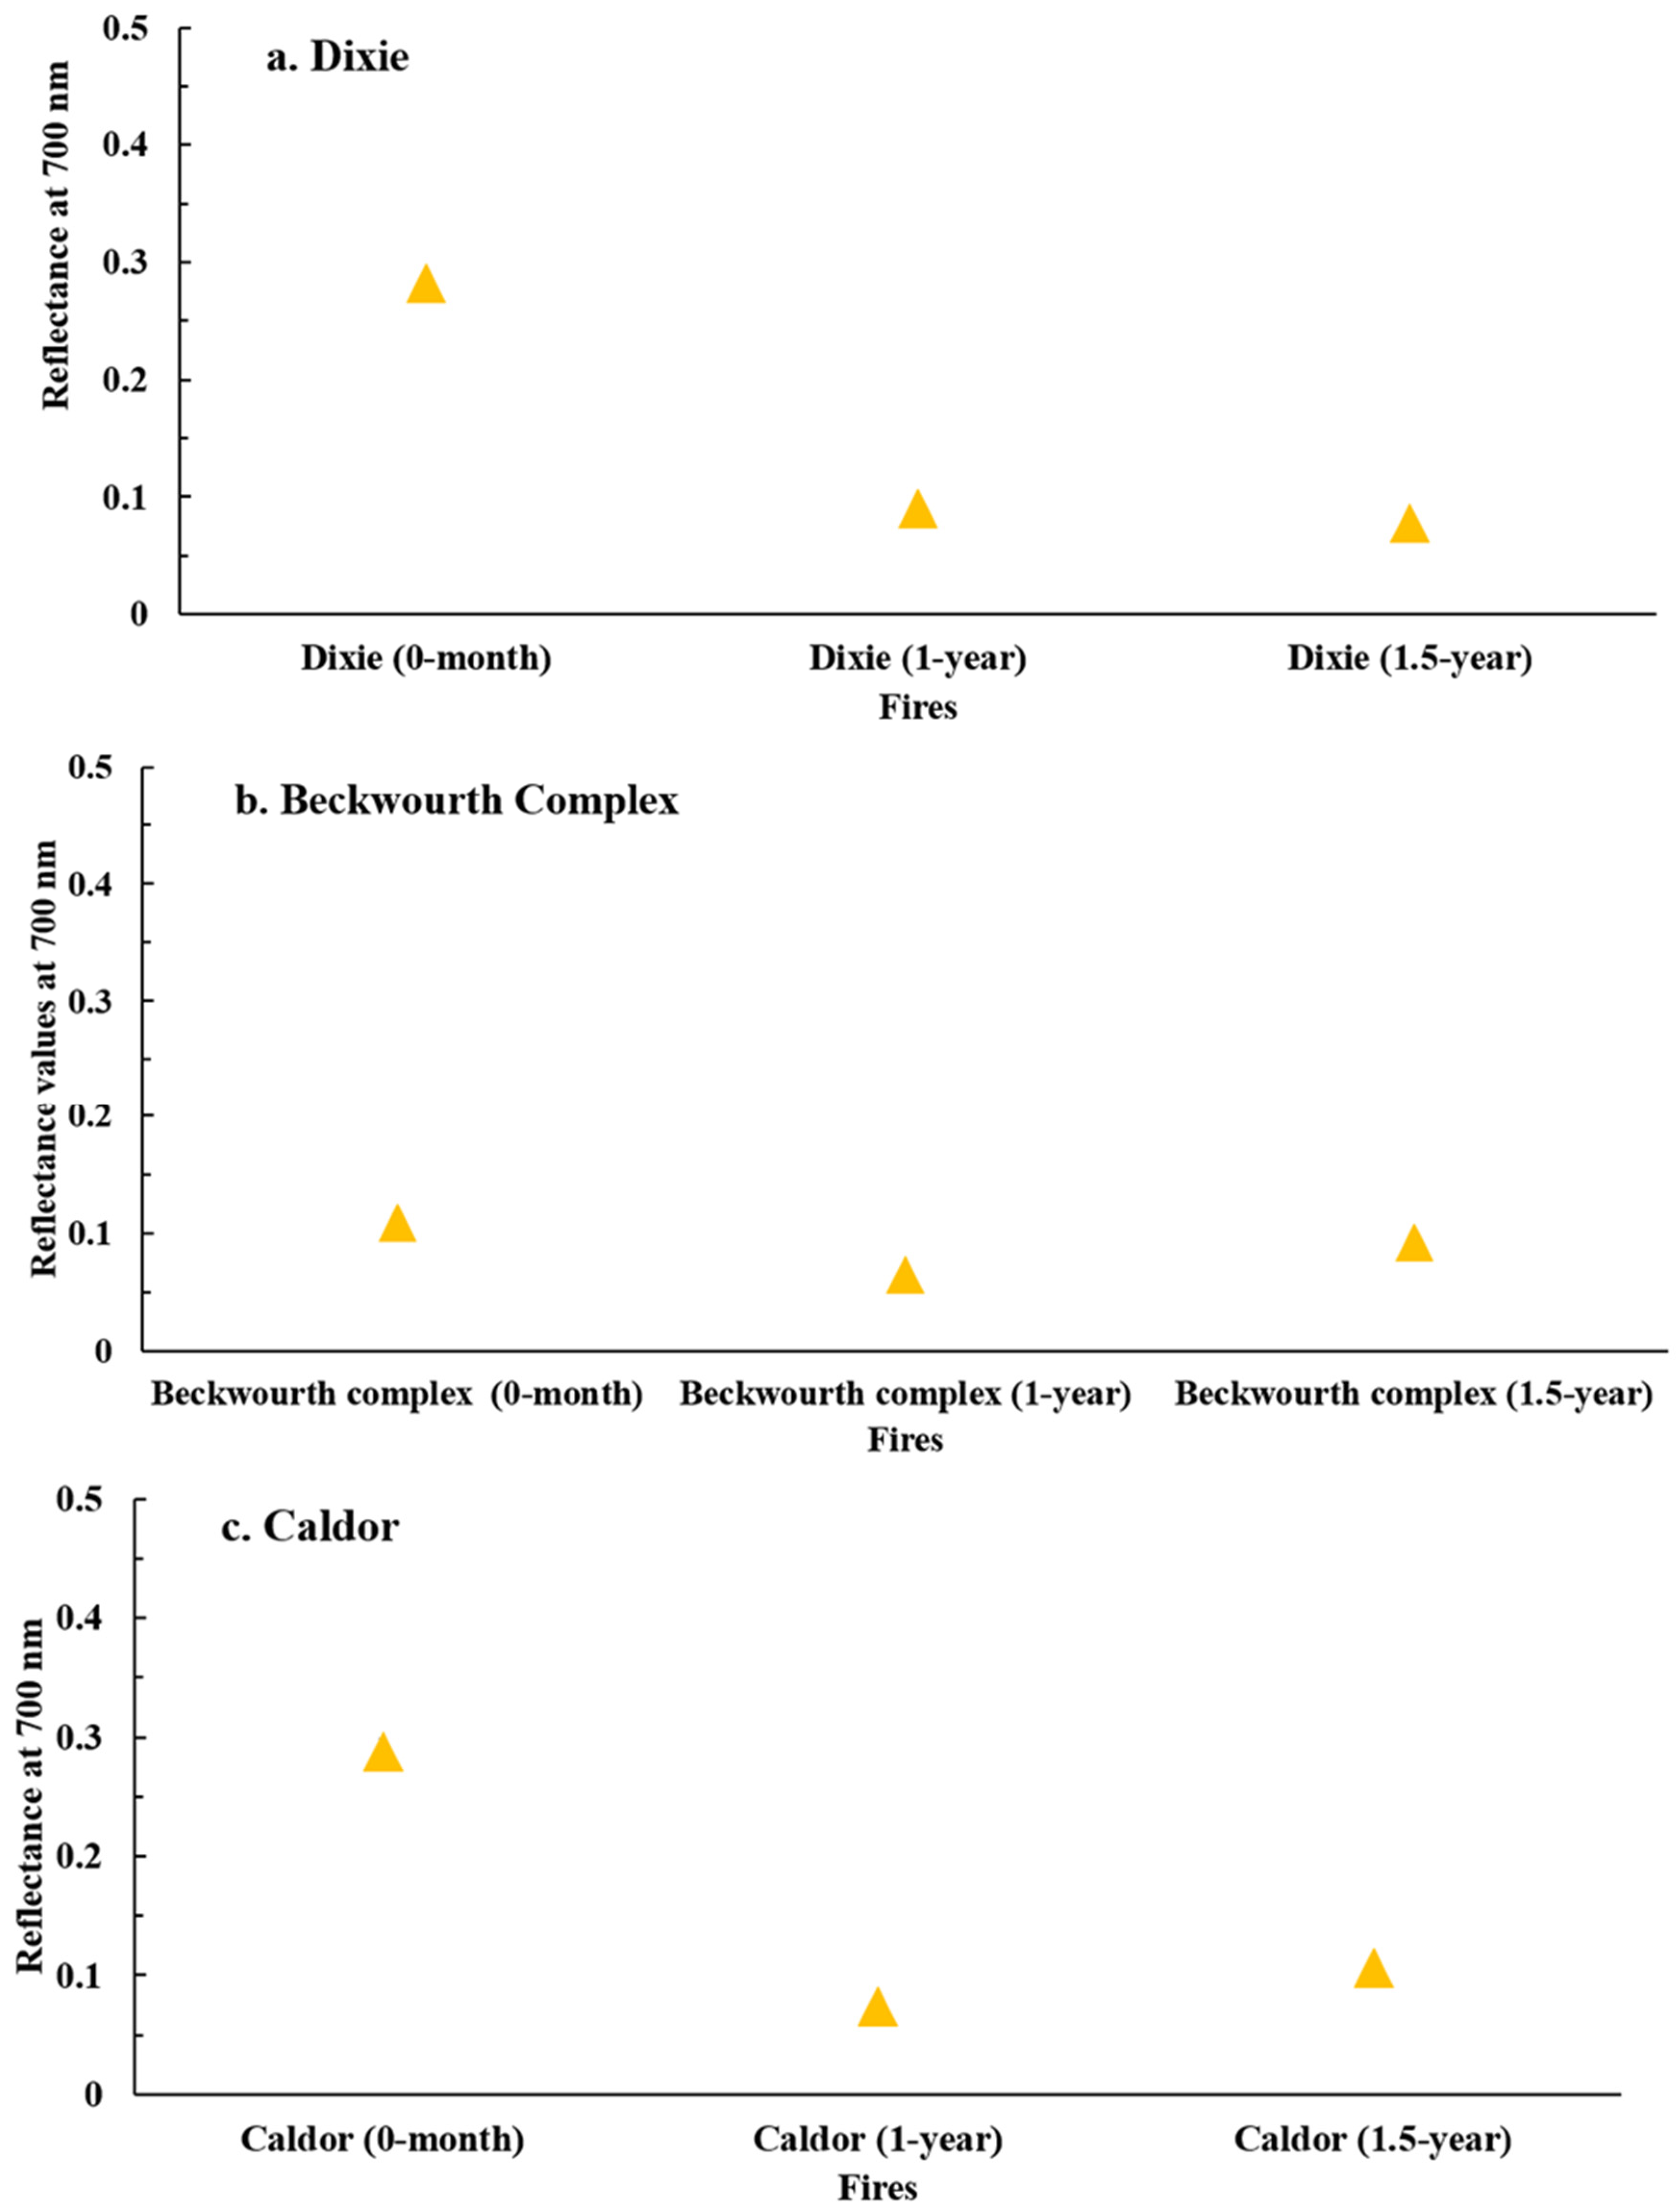
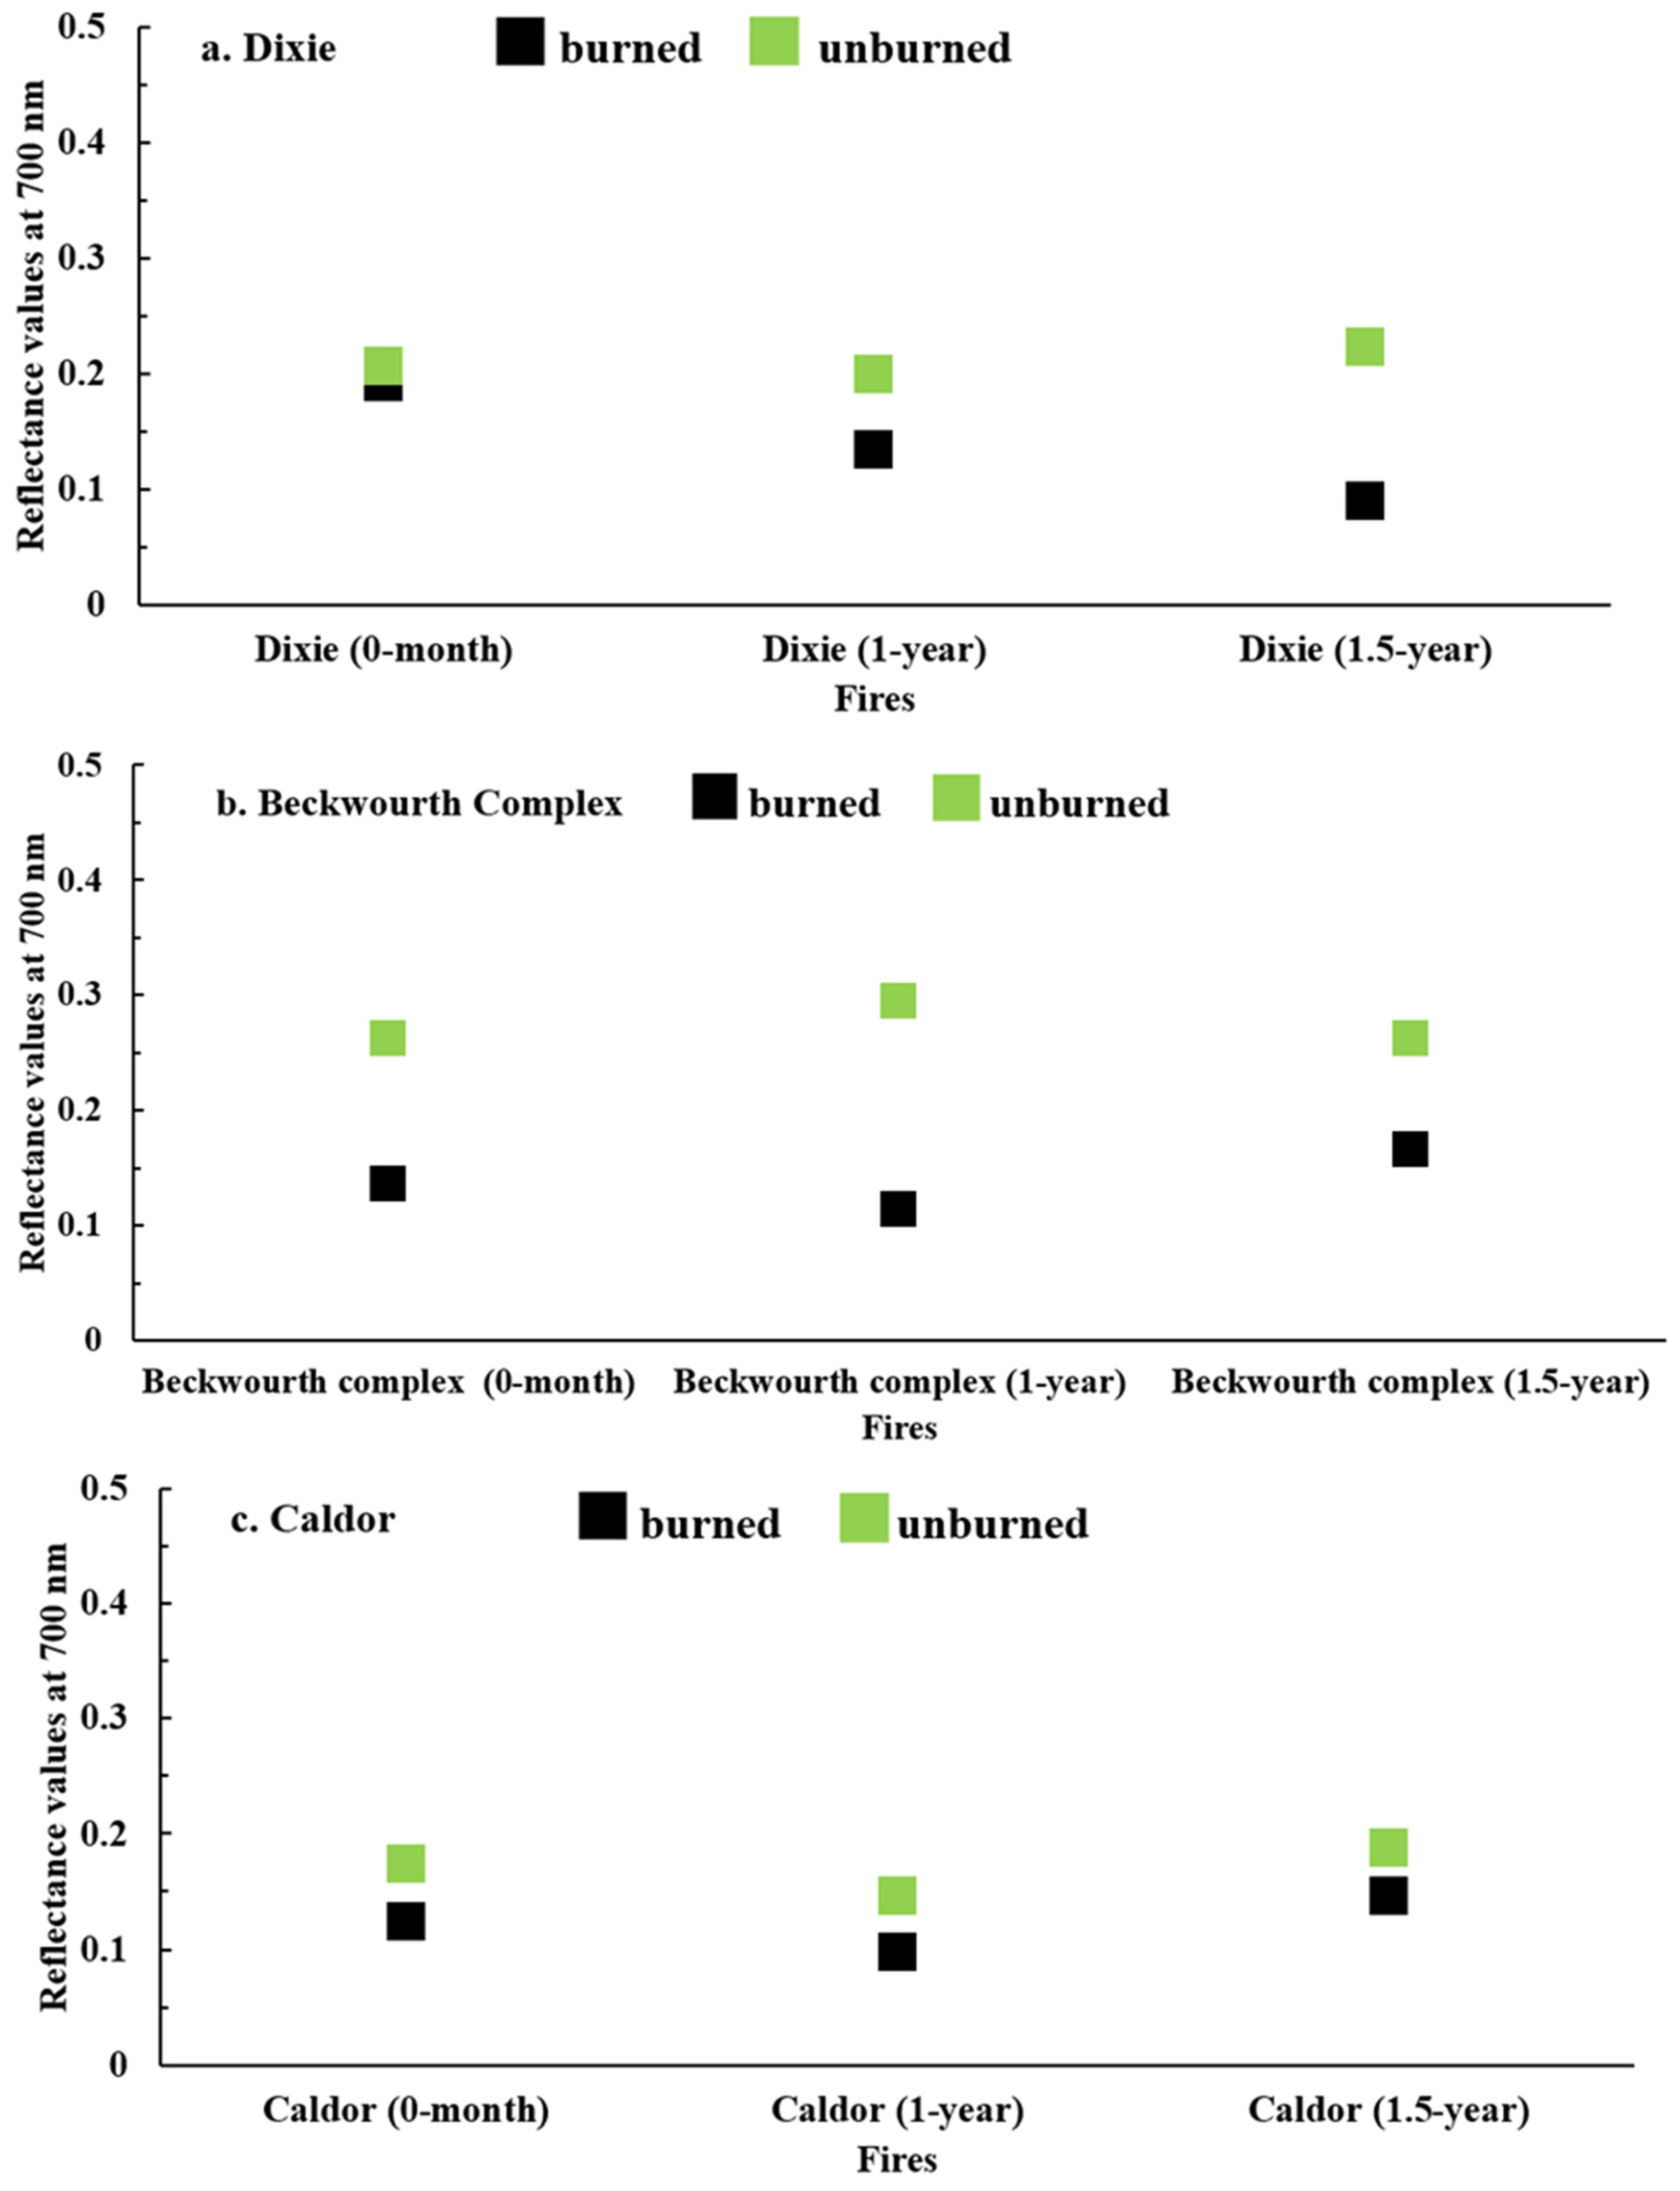
3.2. Temporal Analysis of Reflectance after the Fire

The 700 nm reflectances of ash samples collected 0 months, 1 year, and 1.5 years after the fire are presented in Figure 5 for all fires. The reflectance of all ash samples decreased within one year, with a slight decrease (Dixie fire) or slight increase (Beckwourth Complex and Caldor fires) 1.5 years after the fires, with reflectances ranging from ~0.1 to ~0.3 for all fires. In the case of the Dixie fire in Figure 5a, 0-month ash samples have the highest reflectance value, whereas 1-year, and 1.5-year ash samples have similar reflectances and have experienced reductions of ~68% and ~71% compared to the 0-month sample. In Figure 5b, the 1-year and 1.5-year ash samples from the Beckwourth Complex fire have slightly different reflectances, with a 1-year reduction of ~36% and a 1.5-year reduction of ~18% compared to the 0-month ash sample. Figure 5c shows that the Caldor 1-year and 1.5-year ash samples have reduced reflectances of ~76%, and ~62% compared to the 0-month sample. Overall, it is clear that, for all analyzed ash samples, the reflectance was highest for 0-month (or fresh) ash and reduced after 1 year’s time with subsequent small positive or negative changes after 1.5 years. Our findings, in terms of ash reflectance decrease, agree with other studies [23,25]. To the best of our knowledge, we could not find studies that have focused on the temporal resolution of ash reflectance spectra. However, studies such as Šestak et al. [25] found that reflectances of soil samples were higher immediately after a fire and decreased over time. There are several reasons that can cause such a decrease in reflectance, such as a change in the chemical composition of ash due to washout processes, microbial activities, etc. [25]. Our experiments on laboratory-generated ash showed that washed ash is lower in reflectance than unwashed ash (Figure S3) and this is most likely due to leaching of highly reflective compounds such as carbonate.
Figure 6 shows changes in 700 nm reflectance for 0-month, 1-year, and 1.5-year samples between burned and unburned soils for the Dixie, Beckwourth Complex, and Caldor fires. The reflectance for both burned and unburned soil samples varies from ~0.1 to ~0.3 with reflectances for unburned soils always being higher than for burned soils from the same fire for all three sampling times. Unburned soil reflectance was fairly unchanged over time for all fires.
Figure 6a shows the difference in reflectance spectra between the burned and unburned soils for the Dixie fire at 0 months, 1 year, and 1.5 years. The reflectance for the burned soil was reduced by 32% after 1 year and by 53% after 1.5 years compared to the 0-month sample. In the case of unburned soil, the reflectance stayed in the range of 0.2 and 0.22 over time. The 0-month and 1-year unburned soil samples have similar reflectance, whereas the 1.5-year unburned soil samples have a slightly increased reflectance (by ~10% and 5%) compared to the 1-year and 0-month soils, respectively. Figure 6b shows that, for the Beckwourth Complex soil samples, the highest difference between burned and unburned soil sample reflectance is observed for 1-year samples. The 1.5-year unburned soil samples have a reflectance increased by ~15% in comparison with the near-identical reflectance of 1-year and 0-month samples. The reflectances of the 1-year burned soil samples have decreased ~21%, and ~35% compared to the 0-month and 1.5-year samples. Figure 6c shows that, for Caldor fire soil samples, the reflectance of 1-year burned soil has decreased ~17% and 33% compared to the 0-month and 1.5-year samples. The 1-year unburned soil followed the same trend; its reflectance decreased ~12% and 21% compared to the 0-month and 1.5-year samples.
The reflectances of burned and unburned soil samples fall within the range of 0.03 to 0.29 in the visible wavelength range employed in our research. These values agree with reported data by Rosero-Vlasova et al. [23]. In their paper, the reflectance for burned soil samples ranged from ~0.1 to ~0.5 in the visible range. Regardless of the location of burns and other parameters, the reflectance values for burned and unburned soils found in our study are similar to the burned and unburned soil reflectances in the previous research paper by Rosero-Vlasova et al. [23].
As discussed in Section 3.2, a clear decrease in the reflectance of ash samples over time was observed for all fires analyzed for the present study. We hypothesize that some water-soluble inorganic compounds (e.g., carbonates [30]) that cause high reflectance of the ash may have been washed out over time during rain or snow melt events, and thus caused a reduction in the ash reflectance over time. To check this hypothesis, chemical analysis of 0-month, 1-year, and 1.5-year ash samples collected after the Dixie fire was performed using the FTIR technique.

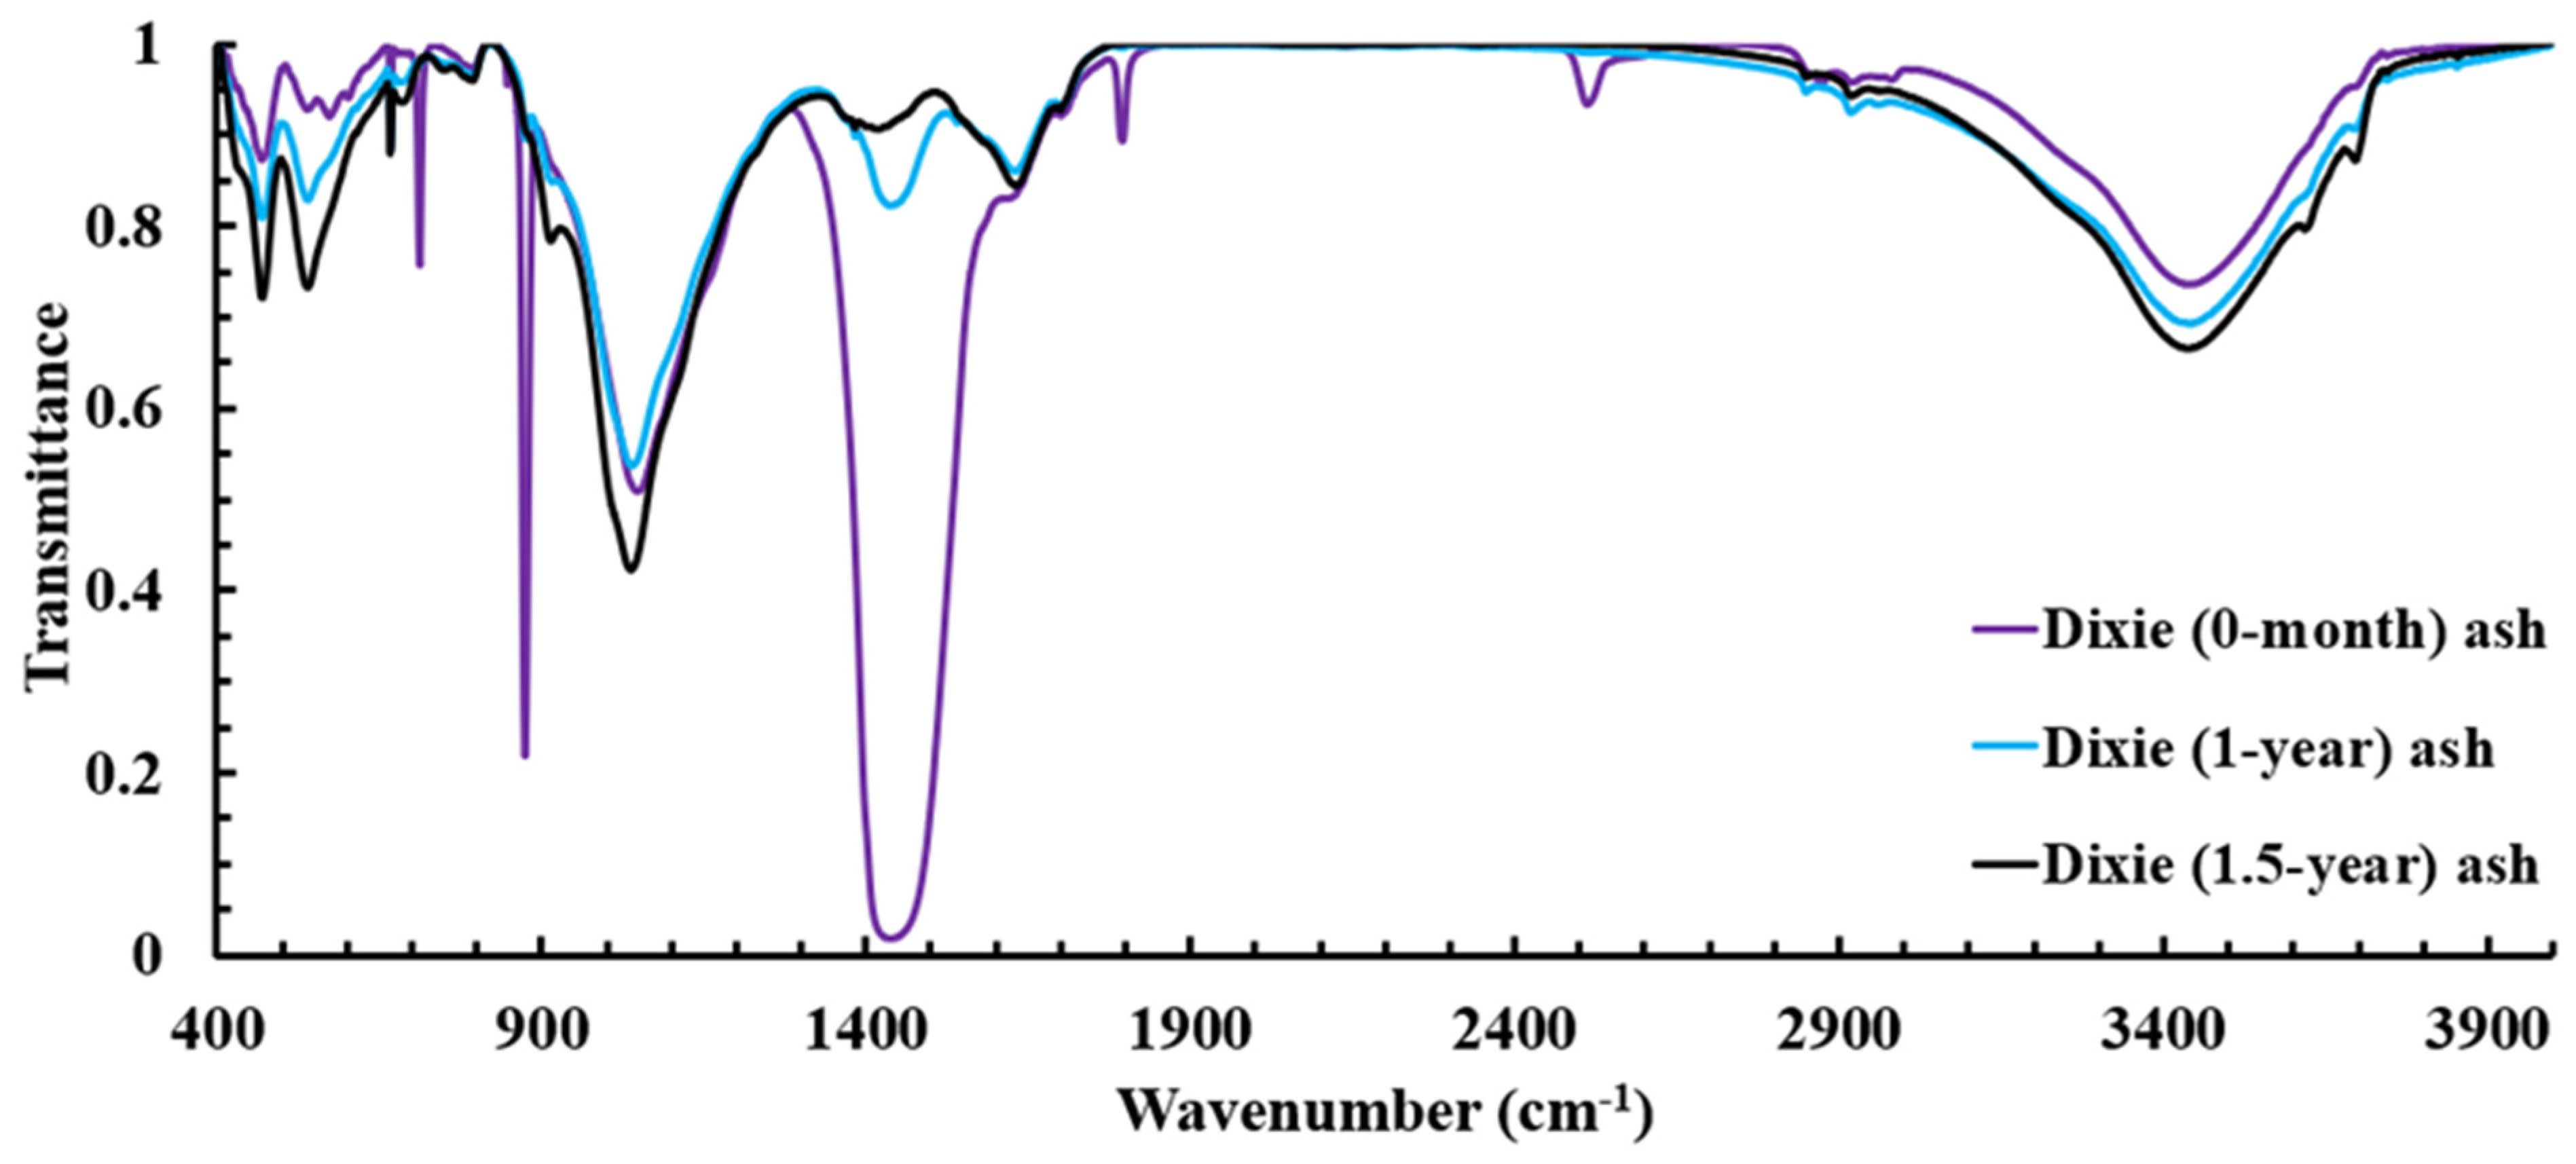
3.3. FTIR Characterization of Ash Samples

Following the temporal reduction in ash reflectance for all fires, as discussed in the previous section, FTIR measurements were carried out for 2021, 2022, and 2023 fire ash samples. Only the results for ash samples from the Dixie fire are presented to confirm the reductions in carbonate concentrations and their impact on lowering ash reflectance over time. Figure 7 shows the FTIR transmittance spectra of the 0-month, 1-year, and 1.5-year Dixie fire ash samples. For the 0-month ash sample, there is a strong band absorption at 1440.6 cm−1, which is proven to be a strong carbonate signal [28]. For the 1-year and 1.5-year ash samples, this signal is significantly weaker, which supports our hypothesis that carbonate concentration was reduced over time and this reduction in carbonate has caused the lower reflectances over the years. We validated the presence of a carbonate peak by analysis of carbonate standard with FTIR, and by adding carbonate to our ash samples and observing the increase in the carbonate peak signal (Figure S4). Moreover, we performed washing on laboratory-generated ash and observed a decrease in the carbonate peak in the FTIR spectra of the washed ash sample (Figure S5).
During a fire, an ash layer commonly forms on the surface of the soil. This layer can affect soil erosion and surface runoff depending on its wettability, which can be highly absorbent or water repellent depending on the temperature of combustion. The ash from wildfires is a combination of both organic and inorganic compounds [31]. The chemical structure and composition of ash depends on parameters such as fuel type, temperature and duration of combustion, etc. [30,31]. In low-intensity burns, the combustion is not complete and the ash contains mostly organic matter with carbon as the main compound by mass. However, in high-intensity fires, the ash layer looks more whitish and is composed of mainly mineral and inorganics that contain calcium, magnesium, sodium, and potassium [30,31]. Overall, the ash pH and calcium carbonate concentration increase in lighter ash, whereas the darker ash is associated with more total nitrogen and organic carbon. As known from the literature [30], carbonates are the main ingredients in ash that cause the whiteness and are formed following organic matter combustion in high-severity wildfires [30]. In addition, these compounds contribute to higher reflectances, as mentioned in the previous section.

4. Conclusions

Spectral properties of ash and soil samples collected in 2021, 2022, and 2023 from three megafires (the Dixie, Beckwourth Complex, and Caldor fires) were analyzed using ASD FieldSpec3 reflectance spectra obtained with solar illumination over the solar spectral range of 350 nm to 2500 nm. To our knowledge, this is the first study on detailed spectral characterization of post-fire soils from recent California megafires.
Our results show that, for soils from all three megafires, visible reflectance for unburned soils is higher than for burned soils, including for samples collected 1 and 1.5 years after the fires, compared to samples collected immediately after the fire. p values for reflectance data for unburned and burned soil sets are less than 0.0001 at a 700 nm wavelength. No clear trend was observed in the change in reflectance for unburned and burned soil over time. In the case of the ash samples, for all the fires, a distinct decrease in reflectance was observed over 1.5 years after the fires: Dixie ~71%; Beckwourth Complex, ~18%; and Caldor, ~62%.
To shed light on the reason for decreasing reflectance of ash samples over time, FTIR chemical analysis was performed. A very noticeable reduction (over 90% of area) in the carbonate signal (near 1440.6 cm−1) explains the reduction in reflectance for 1-year and 1.5-year ash samples from all fires. Thus, we can conclude that this reduction in the ash reflectance is most likely due to washing out of highly reflecting inorganic salts, including carbonates, from ashes during rain and snowmelt events. The present study has several limitations due to budget and time constraints and due to fire size. For example, a limited number of samples was collected and we focused only on medium- and high-severity burn areas. Another limitation is that only topsoil layers were collected and analyzed post-fire. However, these results are essential for understanding how ash at the surface ages due to leaching of carbonates. Overall, our results can help with the further development of remote sensing techniques for post-fire soil analysis.
Moreover, based on our results, reflectance of fire-affected soils and ashes can be connected with their chemical composition. Future research may include (1) correlations between hyperspectral reflectance and soil chemistry; (2) further examination of the links between spectral soil reflectance and other soil physical properties including FISH; and (3) an assessment of ash age and chemistry based on its spectral reflectance. Our results will be useful for predicting soil properties, including FISH, on a large (e.g., watershed) scale, and the remote detection of burned and unburned areas from Unmanned Aircraft Systems (UASs) and satellite remote sensing data.

Supplementary Materials

The following supporting information can be downloaded at: https://www.mdpi.com/article/10.3390/fire6120471/s1, Figure S1: Map with red fire perimeter lines of the Dixie, Beckwourth Complex, Caldor, and Mosquito fires as well as the locations of the respective sampling sites; sample site locations are indicated by yellow triangles [3] © Copyright 2023 by Vera Samburova; Figure S2: FTIR transmittance spectra for ash, and black carbon samples prepared with KBr pellets for Dixie 0-month ash sample; Figure S3: Reflectance spectra for unwashed and washed laboratory generated ash samples; Figure S4: FTIR transmittance spectra for ash, and calcium carbonate samples prepared with KBr pellets for Dixie 0-month ash sample; Figure S5: FTIR transmittance spectra for ash samples prepared with KBr pellets for laboratory generated ash samples before and after wash; Table S1: Summary of the collected samples; * only zero-month samples (samples collected shortly after the fire) were analyzed; ** Soil classification is according to USDA-NRCS using the NRCS Web Soil Survey; SOM—soil organic matter. © Copyright 2023 by Vera Samburova.

Author Contributions

Conceptualization, Y.R.,V.S., H.M. and M.B.; methodology, Y.R., V.S. and H.M.; validation, Y.R., V.S., M.B., B.S. and H.M.; formal analysis, Y.R., V.S. and H.M.; investigation, Y.R., V.S., M.B., B.S. and H.M.; resources, Y.R., V.S. and H.M.; data curation, Y.R., V.S. and H.M.; writing—original draft preparation, Y.R., V.S. and H.M.; writing—review and editing, Y.R., V.S., M.B., B.S. and H.M.; visualization, Y.R., V.S. and H.M.; supervision, V.S. and H.M.; sampling and sample preparation, Y.R.,V.S., B.S. and H.M. All authors have read and agreed to the published version of the manuscript.

Funding

This research was funded in part through 22-23 Nevada NASA Space Grant Fellowship, NSF EPSCoR RII Track1: Harnessing the Data Revolution for Fire Science (HDRFS) under Grant No. OIA-2148788 and National Science Foundation under Grant No. EAR2154013.

Institutional Review Board Statement

Not applicable.

Informed Consent Statement

Not applicable.

Data Availability Statement

The data presented in this study are available on request from the corresponding author.

Acknowledgments

The authors thank Analytical Spectral Devices, Inc., for their assistance and support, Steve Kohl for experimental help and discussion, Stephen M. Spain for his assistance with the FTIR instrument, and Mohammad R. Sadrian for helping with FTIR measurements.

Conflicts of Interest

The authors declare no conflict of interest.

References

  1. Radeloff, V.C.; Helmers, D.P.; Kramer, H.A.; Mockrin, M.H.; Alexandre, P.M.; Bar-Massada, A.; Butsic, V.; Hawbaker, T.J.; Martinuzzi, S.; Syphard, A.D.; et al. Rapid growth of the US wildland-urban interface raises wildfire risk. Proc. Natl. Acad. Sci. USA 2018, 115, 3314–3319. [Google Scholar] [CrossRef] [PubMed]
  2. Arkle, R.S.; Pilliod, D.S. Prescribed fires as ecological surrogates for wildfires: A stream and riparian perspective. For. Ecol. Manag. 2010, 259, 893–903. [Google Scholar] [CrossRef]
  3. Samburova, V.; Schneider, E.; Rüger, C.P.; Inouye, S.; Sion, B.; Axelrod, K.; Bahdanovich, P.; Friederici, L.; Raeofy, Y.; Berli, M.; et al. Modification of Soil Hydroscopic and Chemical Properties Caused by Four Recent California, USA Megafires. Fire 2023, 6, 186. [Google Scholar] [CrossRef]
  4. McClure, C.D.; Jaffe, D.A. US particulate matter air quality improves except in wildfire-prone areas. Proc. Natl. Acad. Sci. USA 2018, 115, 7901–7906. [Google Scholar] [CrossRef] [PubMed]
  5. Steel, Z.L.; Safford, H.D.; Viers, J.H. The fire frequency-severity relationship and the legacy of fire suppression in California forests. Ecosphere 2015, 6, 23. [Google Scholar] [CrossRef]
  6. Keeley, J.E.; Syphard, A.D. Large California wildfires: 2020 fires in historical context. Fire Ecol. 2021, 17, 11. [Google Scholar] [CrossRef]
  7. CalFire. Available online: https://www.fire.ca.gov/incidents (accessed on 27 October 2023).
  8. Letey, J. Causes and consequences of fire-induced soil water repellency. Hydrol. Process. 2001, 15, 2867–2875. [Google Scholar] [CrossRef]
  9. Fernandez-Marcos, M.L. Potentially Toxic Substances and Associated Risks in Soils Affected by Wildfires: A Review. Toxics 2022, 10, 31. [Google Scholar] [CrossRef]
  10. Lobell, D.B.; Asner, G.P. Moisture effects on soil reflectance. Soil Sci. Soc. Am. J. 2002, 66, 722–727. [Google Scholar] [CrossRef]
  11. Jordán, A.; Zavala, L.M.; Granged, A.J.P.; Gordillo-Rivero, Á.J.; García-Moreno, J.; Pereira, P.; Bárcenas-Moreno, G.; de Celis, R.; Jiménez-Compán, E.; Alanís, N. Wettability of ash conditions splash erosion and runoff rates in the post-fire. Sci. Total Environ. 2016, 572, 1261–1268. [Google Scholar] [CrossRef]
  12. Doerr, S.H.; Woods, S.W.; Martin, D.A.; Casimiro, M. ‘Natural background’ soil water repellency in conifer forests of the north-western USA: Its prediction and relationship to wildfire occurrence. J. Hydrol. 2009, 371, 12–21. [Google Scholar] [CrossRef]
  13. Wu, Y.C.; Zhang, N.; Slater, G.; Waddington, J.M.; de Lannoy, C.F. Hydrophobicity of peat soils: Characterization of organic compound changes associated with heat-induced water repellency. Sci. Total Environ. 2020, 714, 15. [Google Scholar] [CrossRef] [PubMed]
  14. Doerr, S.H.; Shakesby, R.A.; Walsh, R.P.D. Soil water repellency: Its causes, characteristics and hydro-geomorphological significance. Earth Sci. Rev. 2000, 51, 33–65. [Google Scholar] [CrossRef]
  15. DeBano, L.F. Water Repellent Soils: A State-of-the-Art; US Department of Agriculture, Forest Service, Pacific Southwest Forest and Range Experiment Station: Washington, DC, USA, 1981; Volume 46. [Google Scholar]
  16. DeBano, L.F.; Krammes, J. Water repellent soils and their relation to wildfire temperatures. Hydrol. Sci. J. 1966, 11, 14–19. [Google Scholar] [CrossRef]
  17. Samburova, V.; Shillito, R.M.; Berli, M.; Khlystov, A.Y.; Moosmuller, H. Effect of Biomass-Burning Emissions on Soil Water Repellency: A Pilot Laboratory Study. Fire 2021, 4, 24. [Google Scholar] [CrossRef]
  18. Atanassova, I.; Doerr, S.H. Changes in soil organic compound composition associated with heat-induced increases in soil water repellency. Eur. J. Soil Sci. 2011, 62, 516–532. [Google Scholar] [CrossRef]
  19. Chen, J.J.; Pangle, L.A.; Gannon, J.P.; Stewart, R.D. Soil water repellency after wildfires in the Blue Ridge Mountains, United States. Int. J. Wildland Fire 2020, 29, 1009–1020. [Google Scholar] [CrossRef]
  20. Sion, B.; Samburova, V.; Berli, M.; Baish, C.; Bustarde, J.; Houseman, S. Assessment of the Effects of the 2021 Caldor Megafire on Soil Physical Properties, Eastern Sierra Nevada, USA. Fire 2023, 6, 66. [Google Scholar] [CrossRef]
  21. Viscarra Rossel, R.A.; Walvoort, D.J.J.; McBratney, A.B.; Janik, L.J.; Skjemstad, J.O. Visible, near infrared, mid infrared or combined diffuse reflectance spectroscopy for simultaneous assessment of various soil properties. Geoderma 2006, 131, 59–75. [Google Scholar] [CrossRef]
  22. Yu, H.; Kong, B.; Wang, Q.; Liu, X.; Liu, X. Hyperspectral remote sensing applications in soil: A review. In Hyperspectral Remote Sensing; Elsevier: Amsterdam, The Netherlands, 2020; pp. 269–291. [Google Scholar]
  23. Rosero-Vlasova, O.A.; Perez-Cabello, F.; Lloveria, R.M.; Vlassova, L. Assessment of laboratory VIS-NIR-SWIR setups with different spectroscopy accessories for characterisation of soils from wildfire burns. Biosyst. Eng. 2016, 152, 51–67. [Google Scholar] [CrossRef]
  24. Finley, C.D. Field Evaluation and Hyperspectral Imagery Analysis of Fire-induced Water-Repellent Soils and Burn Severity in Southern Idaho Rangelands. Ph.D. Thesis, Idaho State University, Pocatello, ID, USA, 2006. [Google Scholar]
  25. Sestak, I.; Pereira, P.; Telak, L.J.; Percin, A.; Hrelja, I.; Bogunovic, I. Soil Chemical Properties and Fire Severity Assessment Using VNIR Proximal Spectroscopy in Fire-Affected Abandoned Orchard of Mediterranean Croatia. Agronomy 2022, 12, 129. [Google Scholar] [CrossRef]
  26. Vetrita, Y.; Santoso, I.; Kartika, T.; Prasasti, I. Indonesian savanna fire-related spectral analysis. In IOP Conference Series, Earth and Environmental Science; IOP Publishing: Bristol, UK, 2022; Volume 1109, p. 012076. [Google Scholar] [CrossRef]
  27. Finn, M.P.; Lewis, M.; Bosch, D.D.; Giraldo, M.; Yamamoto, K.; Sullivan, D.G.; Kincaid, R. Remote Sensing of Soil Moisture Using Airborne Hyperspectral Data. Gisci. Remote Sens. 2011, 48, 522–540. [Google Scholar] [CrossRef]
  28. Tatzber, M.; Stemmer, M.; Spiegel, H.; Katzlberger, C.; Haberhauer, G.; Gerzabek, M.H. alternative method to measure carbonate in soils by FT-IR spectroscopy. Environ. Chem. Lett. 2007, 5, 9–12. [Google Scholar] [CrossRef]
  29. Bruckman, V.J.; Wriessnig, K. Improved soil carbonate determination by FT-IR and X-ray analysis. Environ. Chem. Lett. 2013, 11, 65–70. [Google Scholar] [CrossRef] [PubMed]
  30. Dlapa, P.; BodÍ, M.B.; Mataix-Solera, J.; CerdÀ, A.; Doerr, S.H. FT-IR spectroscopy reveals that ash water repellency is highly dependent on ash chemical composition: Soil water repellency. Catena 2013, 108, 35–43. [Google Scholar] [CrossRef]
  31. Bodi, M.B.; Martin, D.A.; Balfour, V.N.; Santin, C.; Doerr, S.H.; Pereira, P.; Cerda, A.; Mataix-Solera, J. Wildland fire ash; production, composition and eco-hydro-geomorphic effects. Earth Sci. Rev. 2014, 130, 103–127. [Google Scholar] [CrossRef]
  32. Alayet, F.; Nouha, M.; Abdelaziz, S.; Saadi, A. Continuum removed band depth analysis for carbonate mining waste quantification using X-ray diffraction and hyperspectral spectroscopy in the north of Tunisia. J. Appl. Remote Sens. 2017, 11, 016021. [Google Scholar] [CrossRef]
  33. Sadrian, M.R.; Calvin, W.M.; Engelbrecht, J.P.; Moosmüller, H. Spectral Characterization of Parent Soils From Globally Important Dust Aerosol Entrainment Regions. J. Geophys. Res. Atmos. 2023, 128, e2022JD037666. [Google Scholar] [CrossRef]
  34. Ben-Dor, E.; Chabrillat, S.; Dematte, J.A.M.; Taylor, G.R.; Hill, J.; Whiting, M.L.; Sommer, S. Using Imaging Spectroscopy to study soil properties. Remote Sens. Environ. 2009, 113, S38–S55. [Google Scholar] [CrossRef]
  35. De la Rosa, J.M.; Merino, A.n.; Jiménez Morillo, N.T.; Jiménez-González, M.A.; González-Pérez, J.A.; González-Vila, F.J.; Knicker, H.; Almendros, G. Unveiling the effects of fire on soil organic matter by spectroscopic and thermal degradation methods. In Fire Effects in Soil Properties; CSIRO Publishing: Clayton, Australia, 2018; pp. 281–307. [Google Scholar]
  36. Simkovic, I.; Dlapa, P.; Doerr, S.H.; Mataix-Solera, J.; Sasinkova, V. Thermal destruction of soil water repellency and associated changes to soil organic matter as observed by FTIR spectroscopy. Catena 2008, 74, 205–211. [Google Scholar] [CrossRef]
  37. Mastrolonardo, G.; Francioso, O.; Di Foggia, M.; Bonora, S.; Rumpel, C.; Certini, G. Application of thermal and spectroscopic techniques to assess fire-induced changes to soil organic matter in a Mediterranean forest. J. Geochem. Explor. 2014, 143, 174–182. [Google Scholar] [CrossRef]
  38. Margenot, A.J.; Calderón, F.J.; Goyne, K.W.; Dmukome, F.N.; Parikh, S.J. IR spectroscopy, soil analysis applications. In Encyclopedia of Spectroscopy and Spectrometry; Elsevier: Amsterdam, The Netherlands, 2016; pp. 448–454. [Google Scholar]
  39. Brown, P.T.; Hanley, H.; Mahesh, A.; Reed, C.; Strenfel, S.J.; Davis, S.J.; Kochanski, A.K.; Clements, C.B. Climate warming increases extreme daily wildfire growth risk in California. Nature 2023, 621, 760–766. [Google Scholar] [CrossRef] [PubMed]
  40. Roy, D.P.; Boschetti, L.; Maier, S.W.; Smith, A.M.S. Field estimation of ash and char colour-lightness using a standard grey scale. Int. J. Wildland Fire 2010, 19, 698–704. [Google Scholar] [CrossRef]
  41. Laes, D.; Maus, P.; Lewis, S.; Robichaud, P.; Kokaly, R. Postfire Burn-Severity Classification of the Hayman Fire, CO: Based on Hyperspectral Data—JFSP RFP 2001-2 Task. 2004. Available online: https://forest.moscowfsl.wsu.edu/engr/library/Robichaud/Robichaud2004p/2004p.pdf (accessed on 27 October 2023).
Figure 1. Soil samples collected shortly after the 2021 Dixie fire: ash, burned soil, and unburned soil (from left to right).
Fire 06 00471 g001
Figure 2. Reflectance spectra of 2021 ash, burned soil, and unburned soil samples collected after (a) Dixie, (b) Beckwourth Complex, and (c) Caldor fires. For each spectrum, seven replicate measurements were taken with ASD FieldSpec3 across leveled samples and each measurement (point) is the average of 10 collected reflectance spectra.
Fire 06 00471 g002
Figure 3. Reflectance of ash samples at 700 nm for samples collected fresh after the Dixie (yellow triangle), Beckwourth Complex (green triangle), and Caldor (blue triangle) fires. The standard deviations were calculated based on seven replicate measurements with ASD FieldSpec3 across leveled sample (each replicate was 10 collected reflectance spectra) and the error bars fall within the range of 0.002 to 0.011, which is too small to visualize in this figure.
Fire 06 00471 g003
Figure 4. Reflectance (at 700 nm) for burned and unburned soil samples collected immediately after the Dixie, Beckwourth Complex, and Caldor fires. The standard deviations were calculated based on seven replicate measurements with an ASD FieldSpec3 across leveled sample (each replicate comprised 10 collected reflectance spectra) and the error bars fall within the range of 0.001 to 0.006, which is too small to visualize in this figure.
Fire 06 00471 g004
Figure 5. Reflectance at 700 nm of ash samples collected fresh (0 month), 1 year, and 1.5 years after the (a) Dixie, (b) Beckwourth Complex, and (c) Caldor fires. Each triangle is the average of seven replicate measurements of reflectance at 700 nm wavelength. The standard deviations were calculated based on seven replicate measurements with an ASD FieldSpec3 across leveled sample (each replicate was 10 collected reflectance spectra) and the error bars fall within the range of 0.001 to 0.011, which is too small to visualize in this figure.
Fire 06 00471 g005
Figure 6. Plots of 700 nm reflectances for burned soil, and unburned soil samples collected fresh (0 month), 1 year, and 1.5 years after the (a) Dixie, (b) Beckwourth Complex, and (c) Caldor fires. Each triangle is the average of seven replicate measurements of reflectance at 700 nm wavelength. The standard deviations were calculated based on seven replicate measurements with an ASD FieldSpec3 across leveled samples (each replicate was 10 collected reflectance spectra) and the error bars fall within the range of 0.001 to 0.006, which is too small to visualize in this figure.
Fire 06 00471 g006
Figure 7. FTIR transmission spectra for ash samples prepared with KBr pellets for Dixie fire ash samples collected in 2021 (0 month), 2022 (1 year), and 2023 (1.5 years).
Fire 06 00471 g007
Table 1. Description of the four megafires; *—only ash samples were analyzed with FTIR [3].
Fire NameStart Date–
End Date
Burned Area (km2)Sample TypeSampling DatesMethod Used for AnalysisGPS Coordinates of Sampling Sites
Dixie13 July 2021–25 October 20213898Ash, burned and unburned soil5 October 2021
30 October 2022
20 June 2023
ASD FieldSpec3
FTIR *
39°58′41.9″ N
120°21′24.8″ W
Beckwourth Complex4 July 2021–22 September 2021428Ash, burned and unburned soil5 October 2021
30 October 2022
20 June 2023
ASD FieldSpec339°53′21.1″ N
120°12′02.9″ W
Caldor14 August 2021–21 October 2021898Ash, burned and unburned soil21 October 2021
19 November 2022
12 July 2023
ASD FieldSpec338°50′37.0″ N
120°01′59.8″ W
Disclaimer/Publisher’s Note: The statements, opinions and data contained in all publications are solely those of the individual author(s) and contributor(s) and not of MDPI and/or the editor(s). MDPI and/or the editor(s) disclaim responsibility for any injury to people or property resulting from any ideas, methods, instructions or products referred to in the content.

