
Evaluation and Optimization of Multi-Parameter Prediction Index for Coal Spontaneous Combustion Combined with Temperature Programmed Experiment


Abstract
:1. Introduction
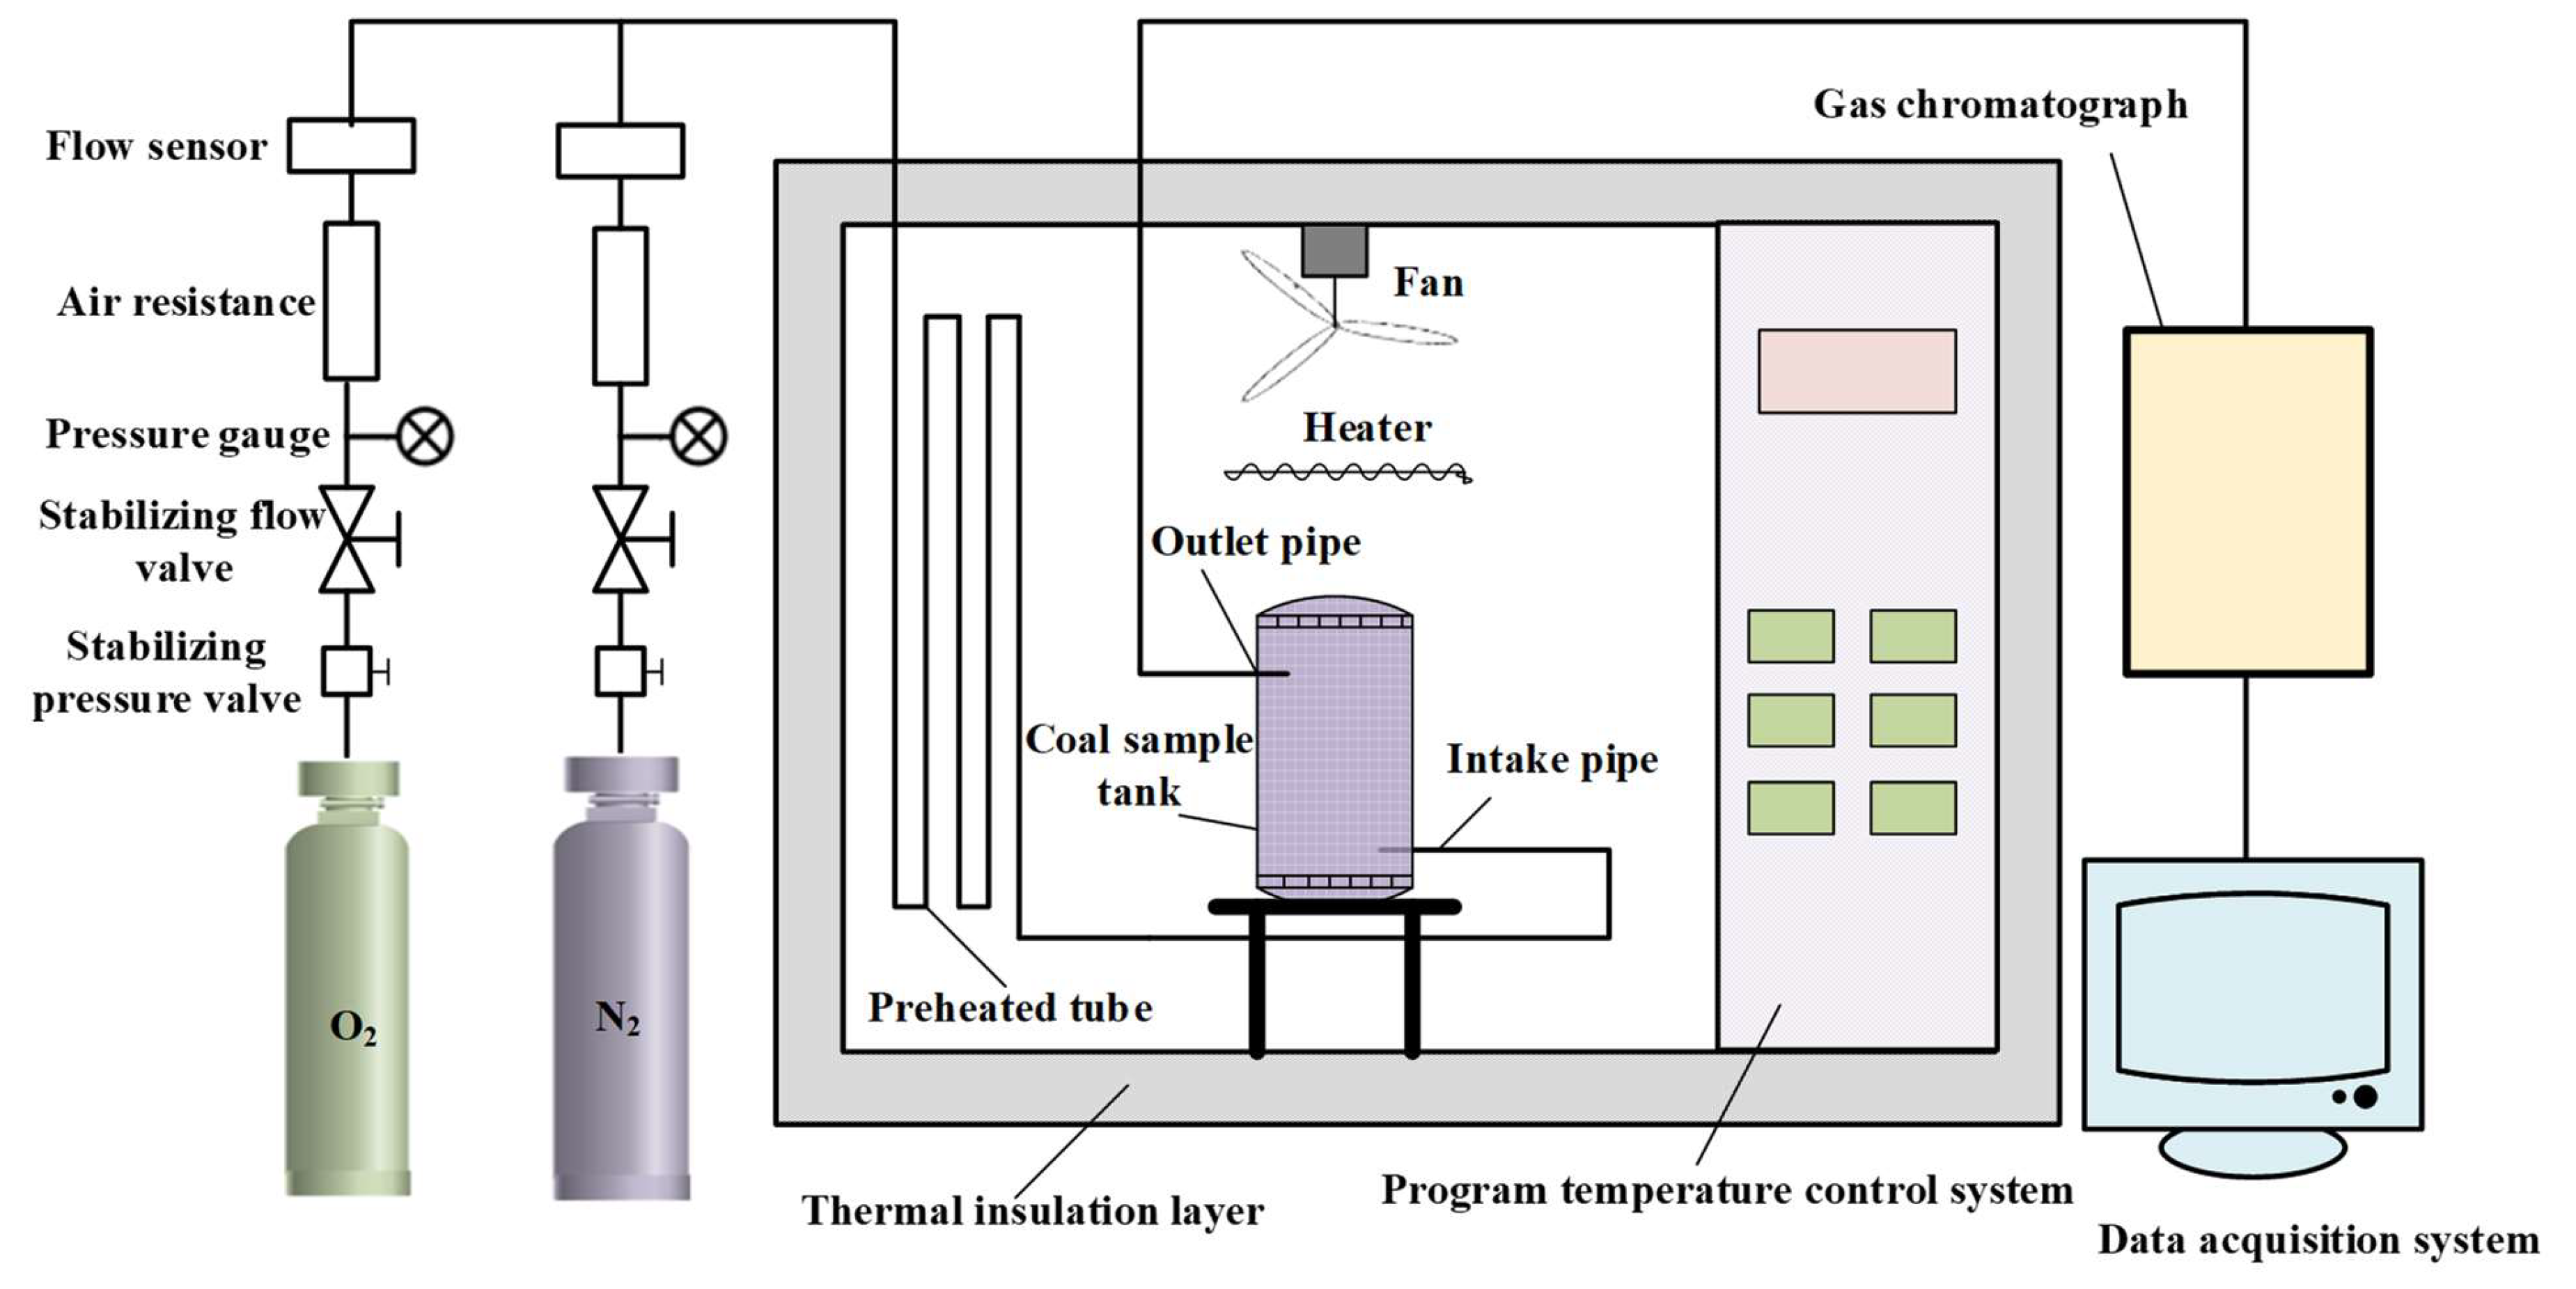
2. Experiment
2.1. Materials
2.2. Methods
- After checking and ensuring good gas tightness and proper functioning of all instruments, coal samples are placed into the coal sample tank, and a layer of asbestos with a thickness of 2~3 mm above the coal samples is evenly applied to prevent blocking of the gas path.
- The gas flow required for the experiment was adjusted; that is, dry air (oxygen concentration: 20.96%) was injected into the coal sample tank at a steady flow rate of 100 mL/min.
- The temperature is set through the temperature control system. The initial temperature is set to 30 °C, and the heating rate is 1 °C/min until it is heated to 200 °C. Here, ensure that the heating rate of each experiment is the same so as to improve the comparability of experimental results. The temperature sensor is used to monitor tank temperature and coal temperature, respectively, and the two are compared to obtain the crossing point temperature.
- The gas composition and concentration at different temperatures are monitored by gas chromatograph. We monitor the outlet gas concentration and the gas concentration produced by pyrolysis every 10 °C increment in temperature. Finally, the experimental results are recorded and saved in the computer terminal of the data collection system.
3. Results and Analysis
3.1. Outlet Oxygen Concentration and Oxygen Consumption Rate
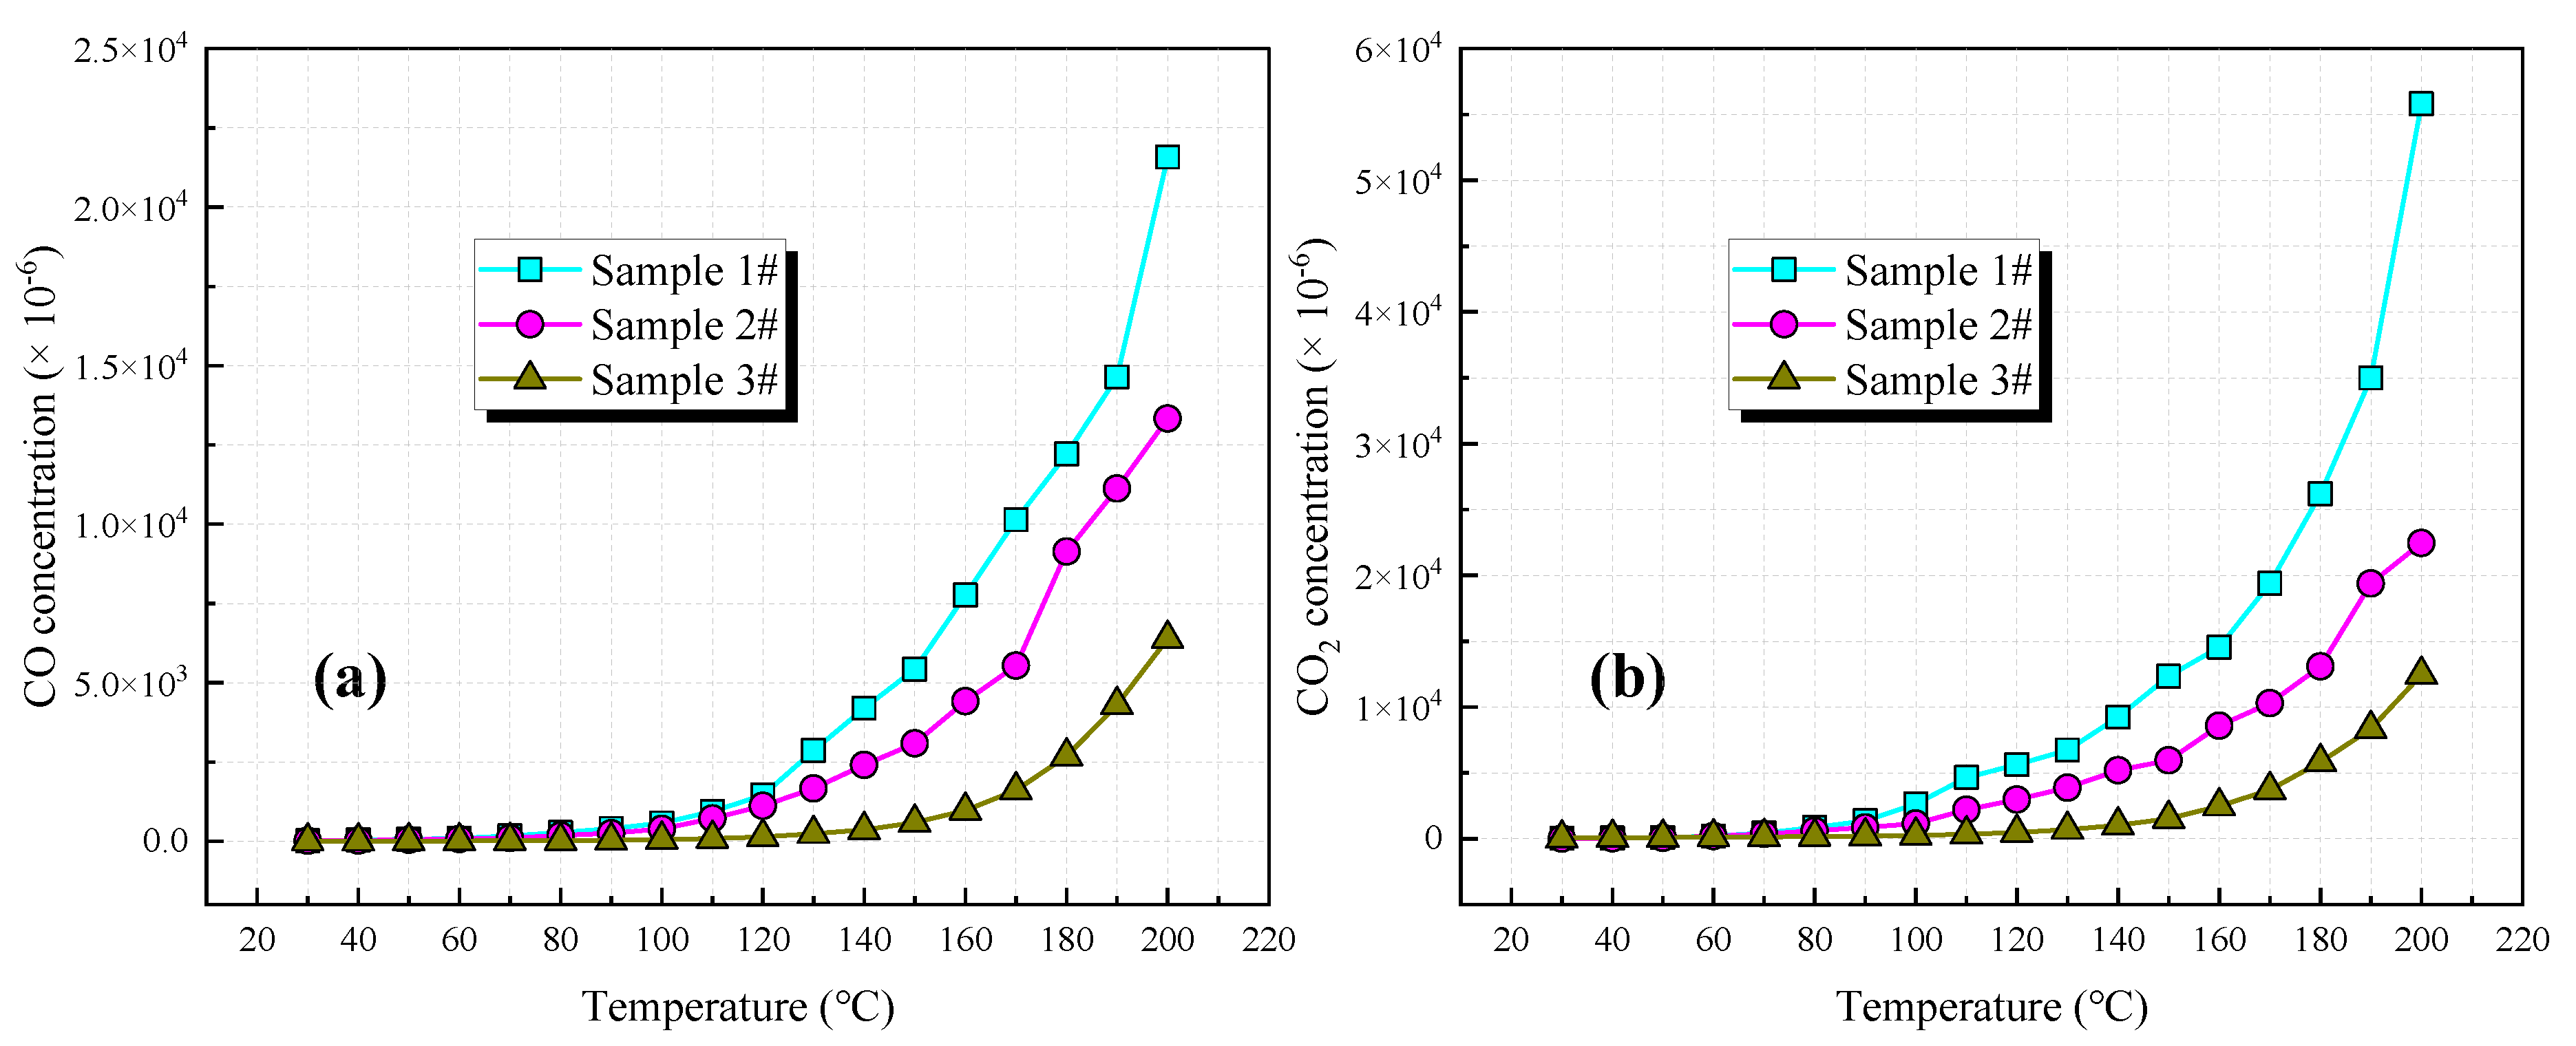
3.2. Gas Product Concentration
3.2.1. CO and CO2
3.2.2. CH4 and C2H6
3.2.3. C2H4
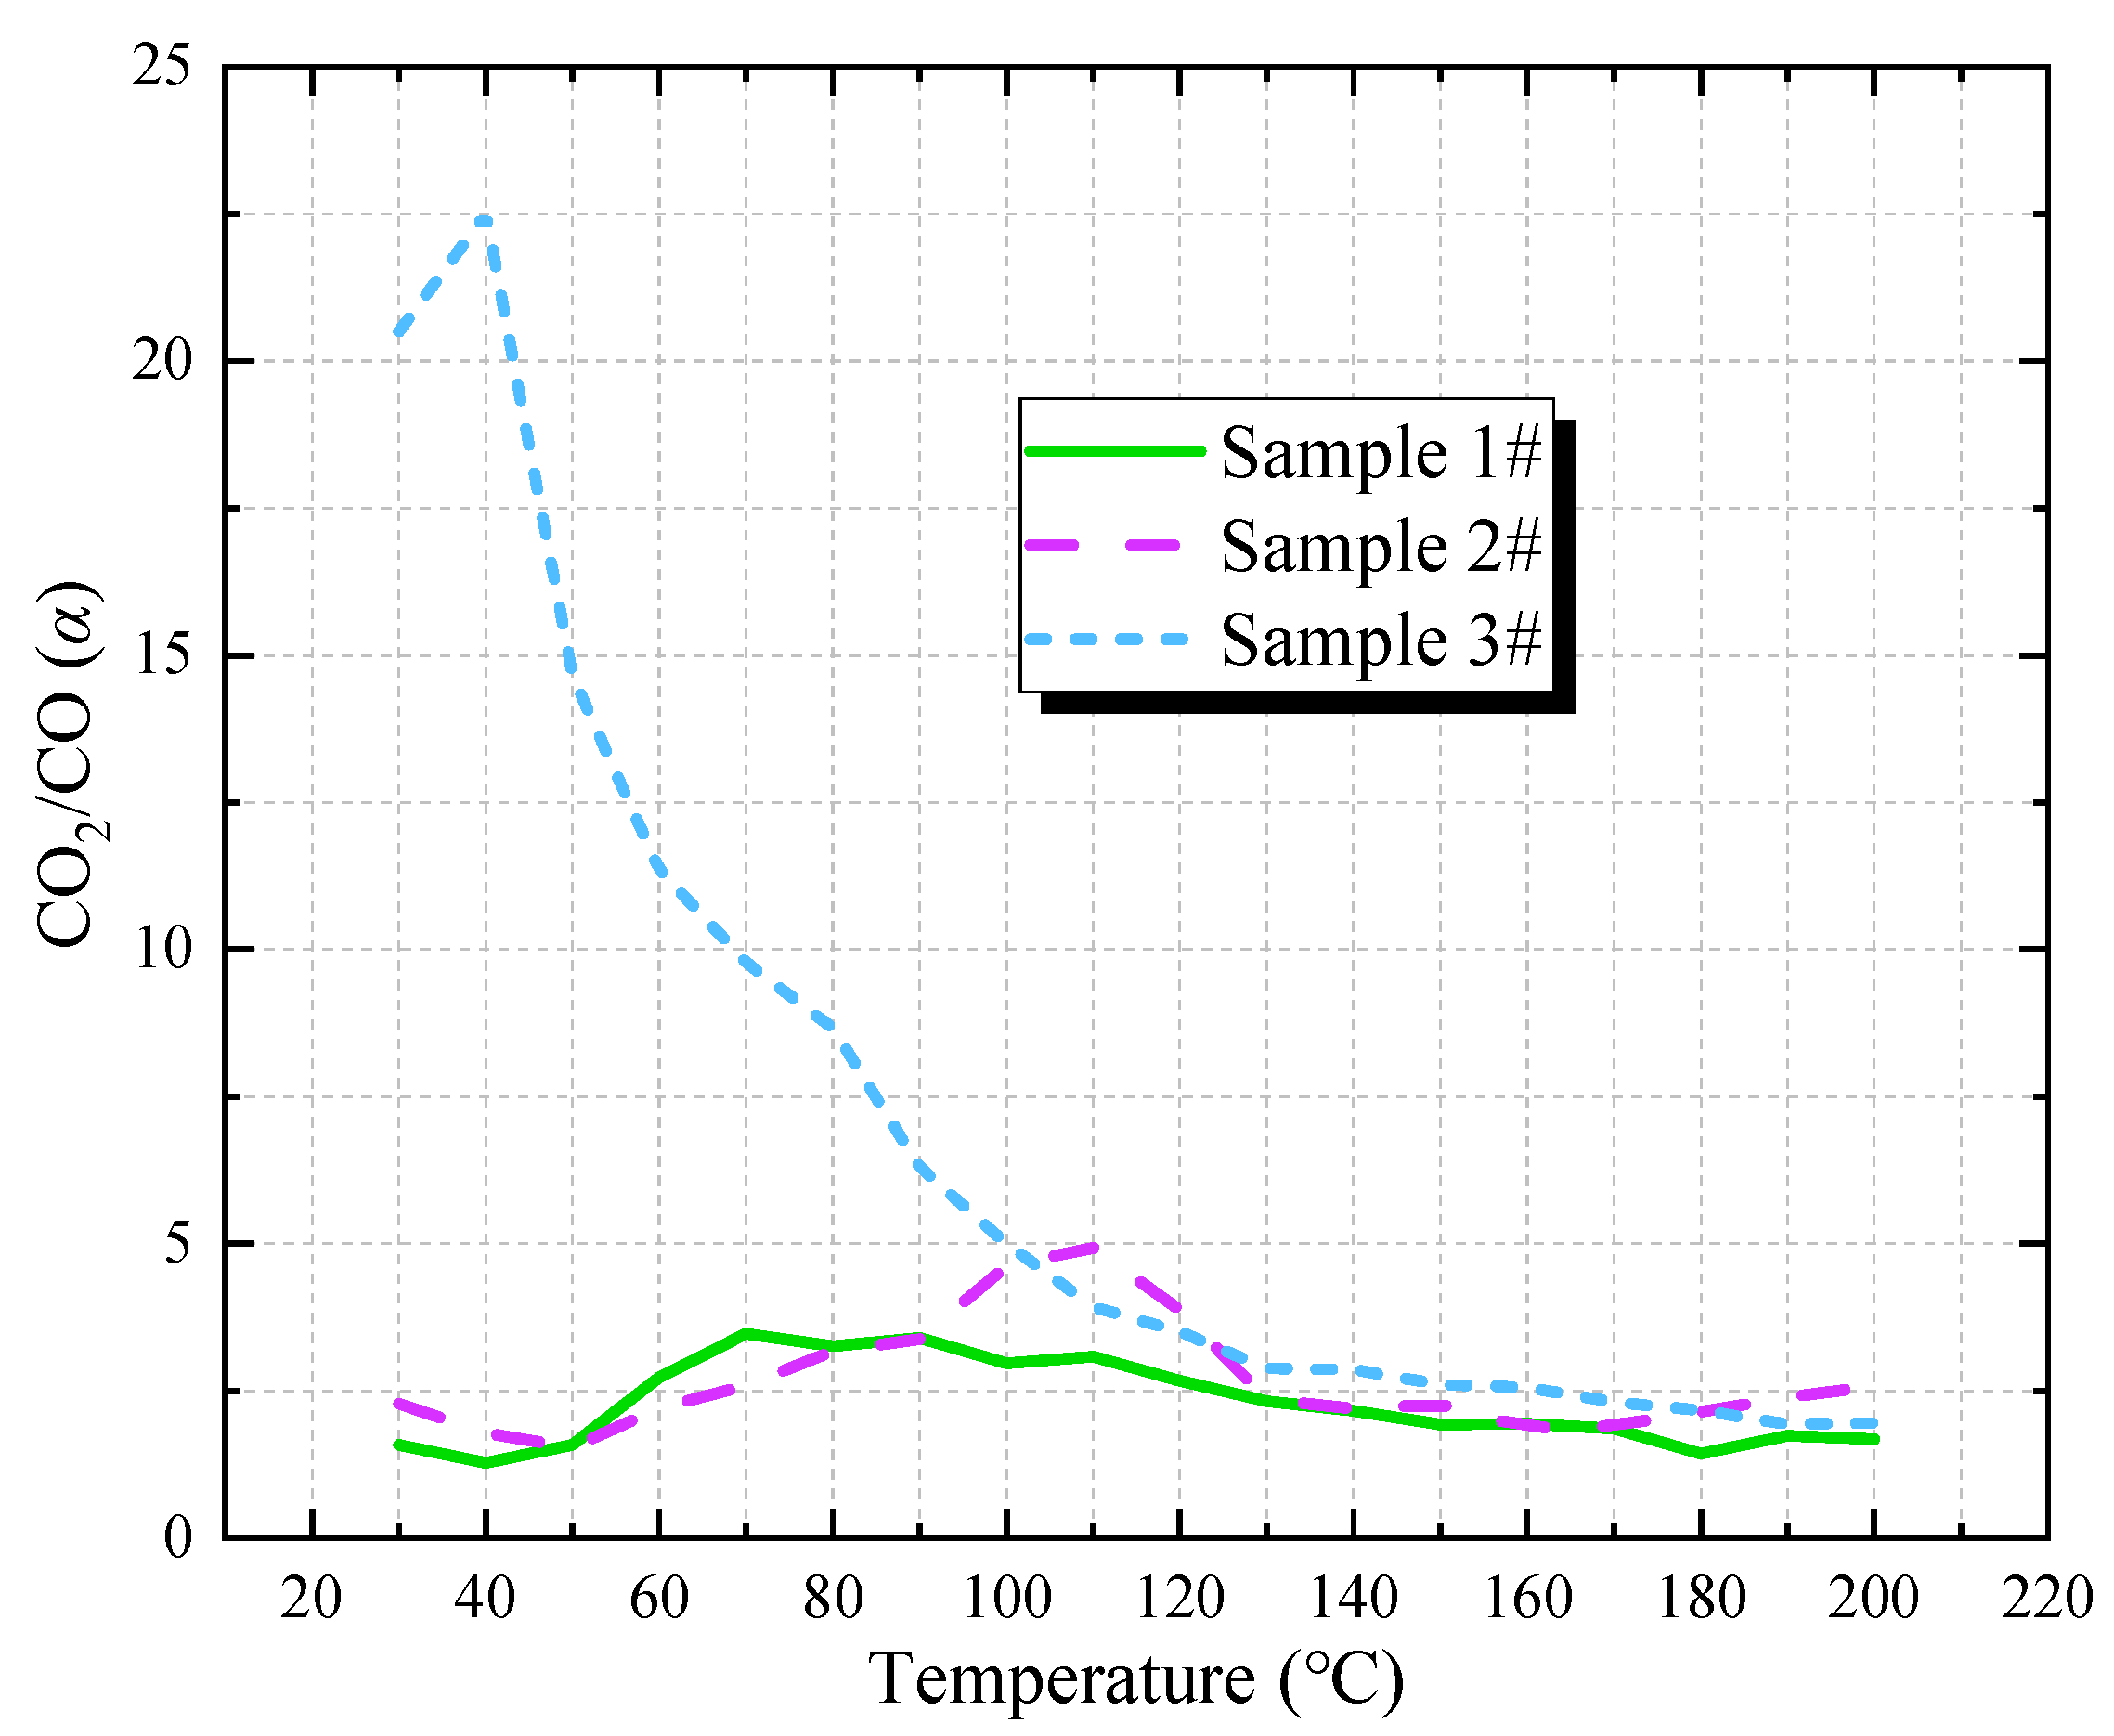
3.3. Change of Product Gas Concentration Ratio
3.3.1. CO2/CO
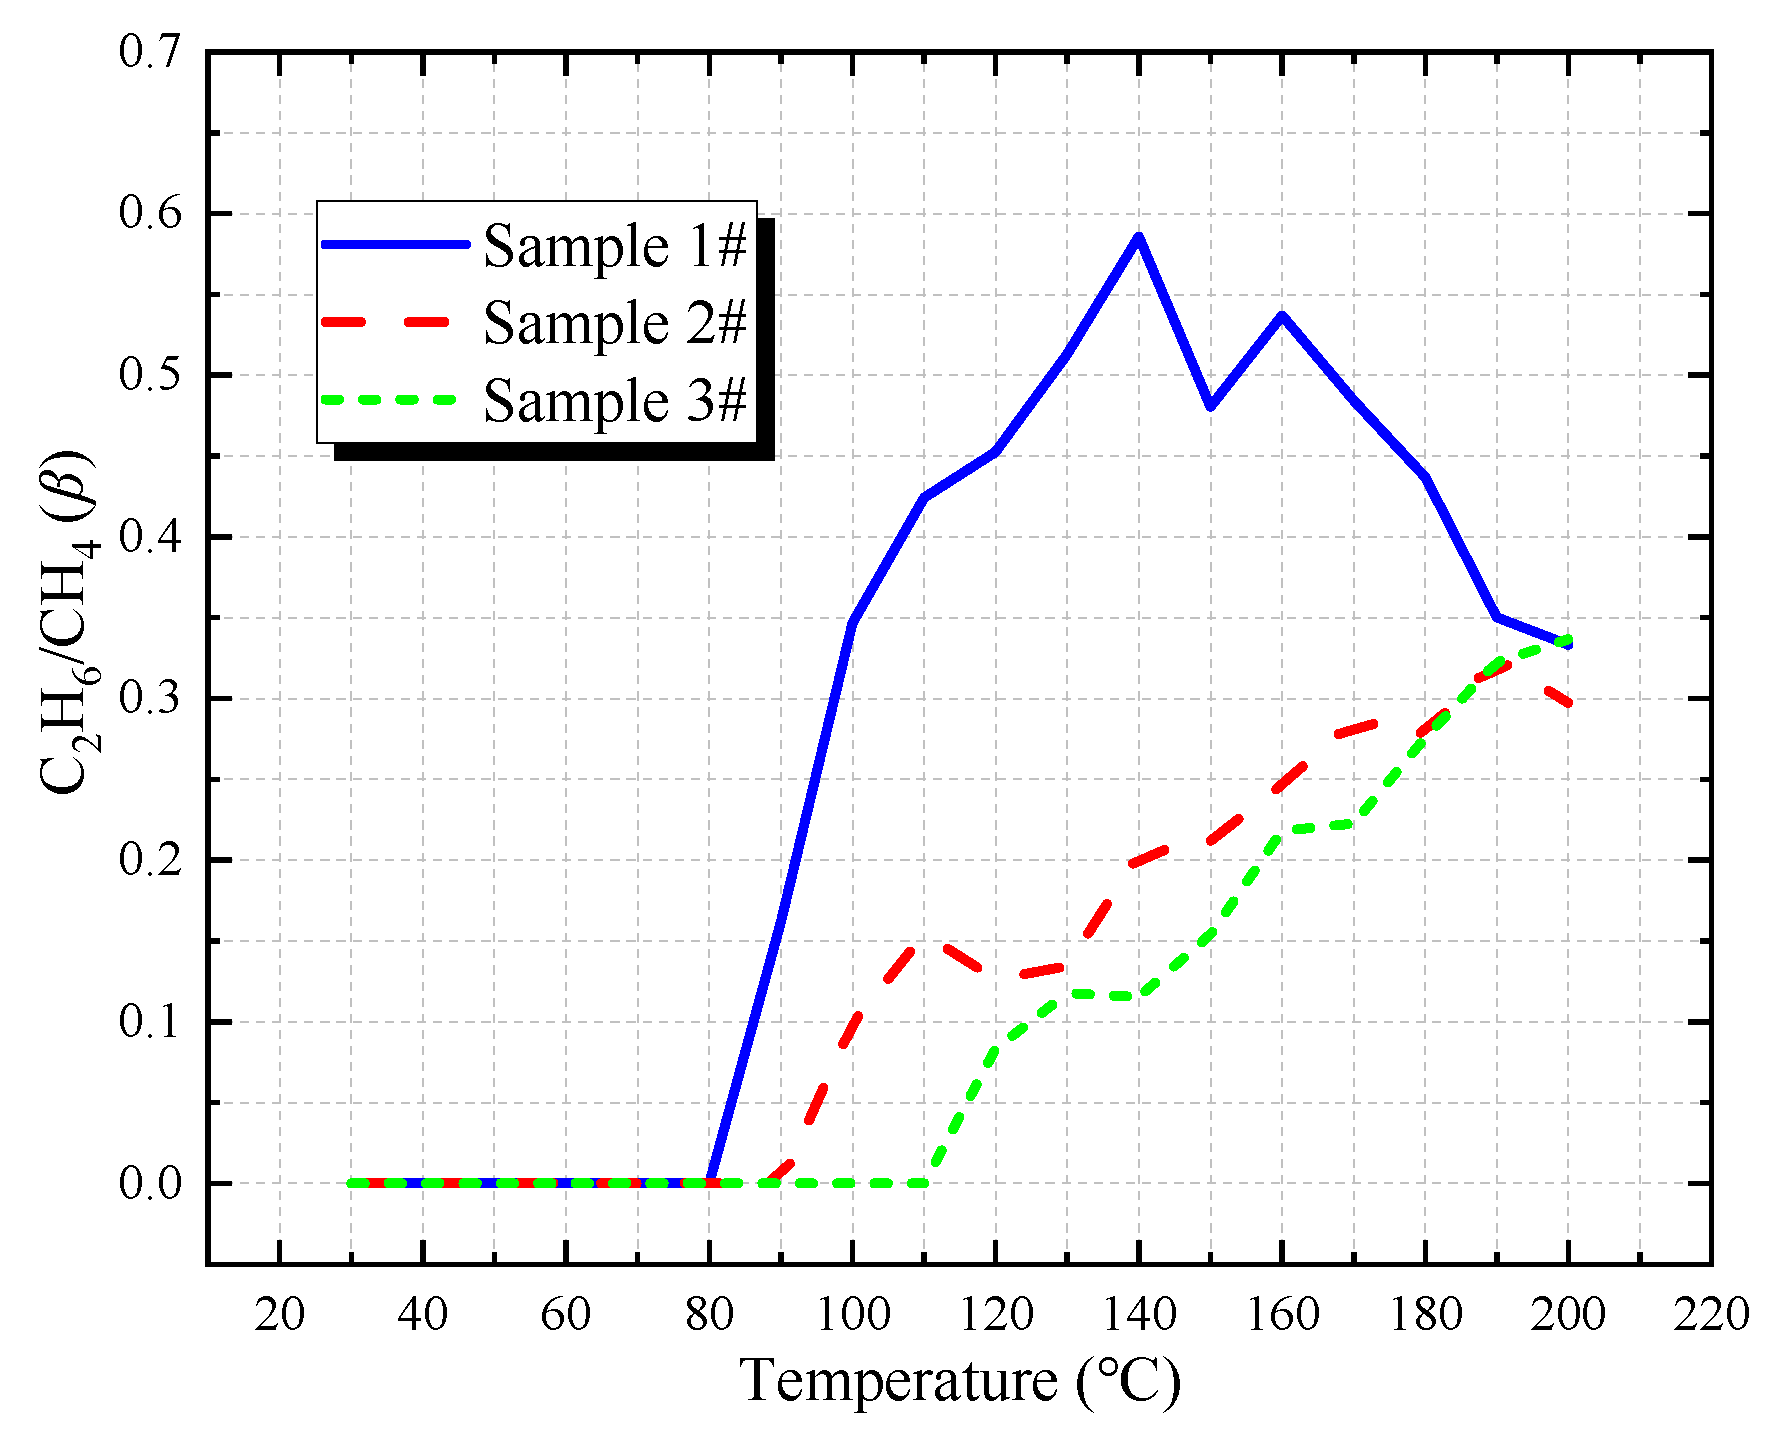
3.3.2. C2H6/CH4
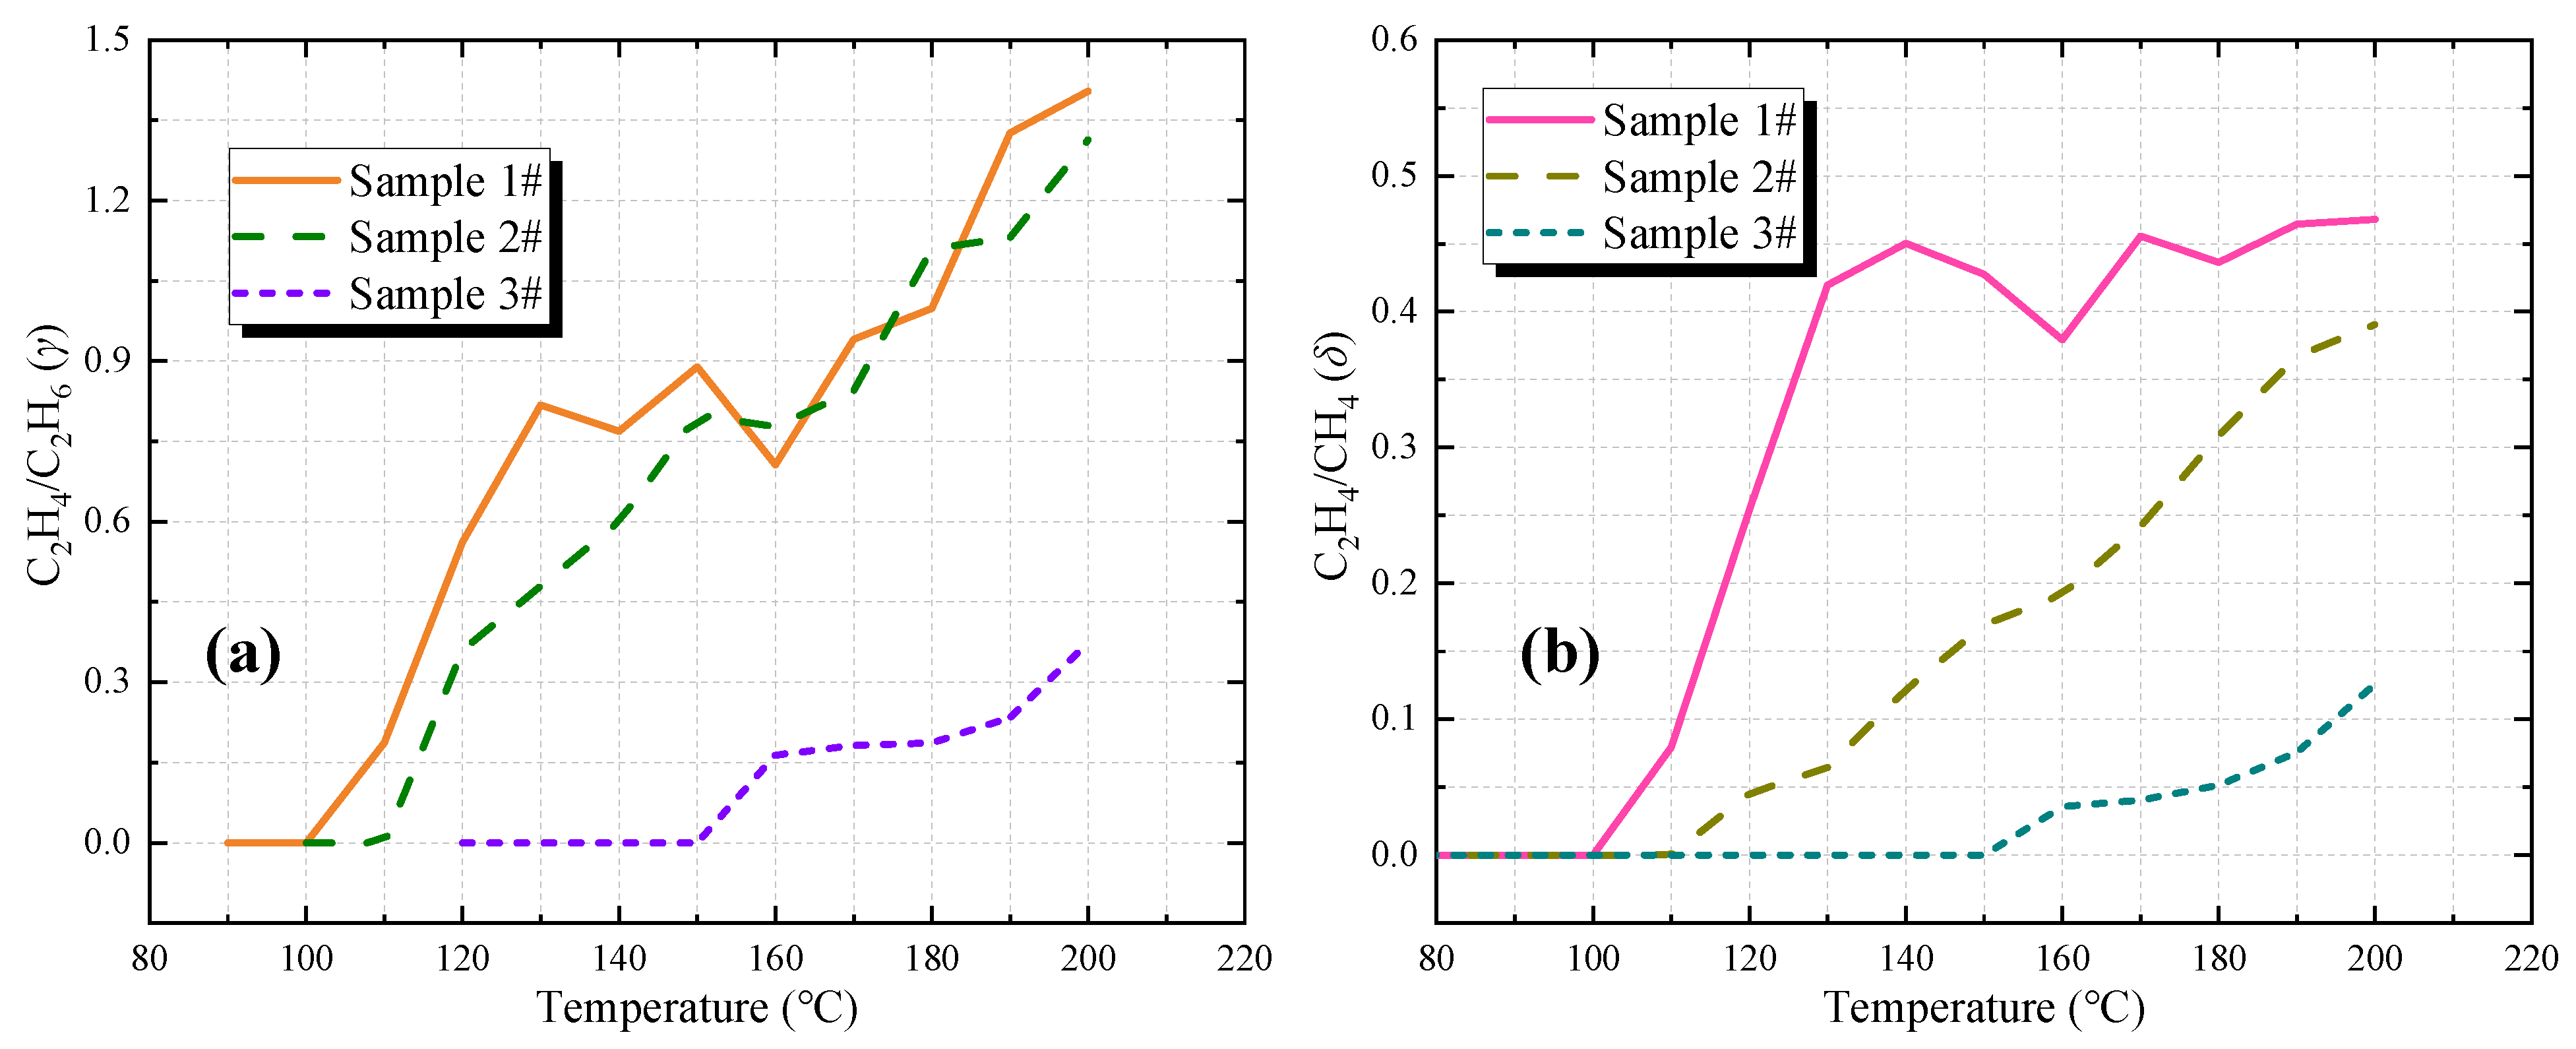
3.3.3. C2H4/C2H6 and C2H4/CH4
4. Establishment of Prediction Index System of Coal Spontaneous Combustion
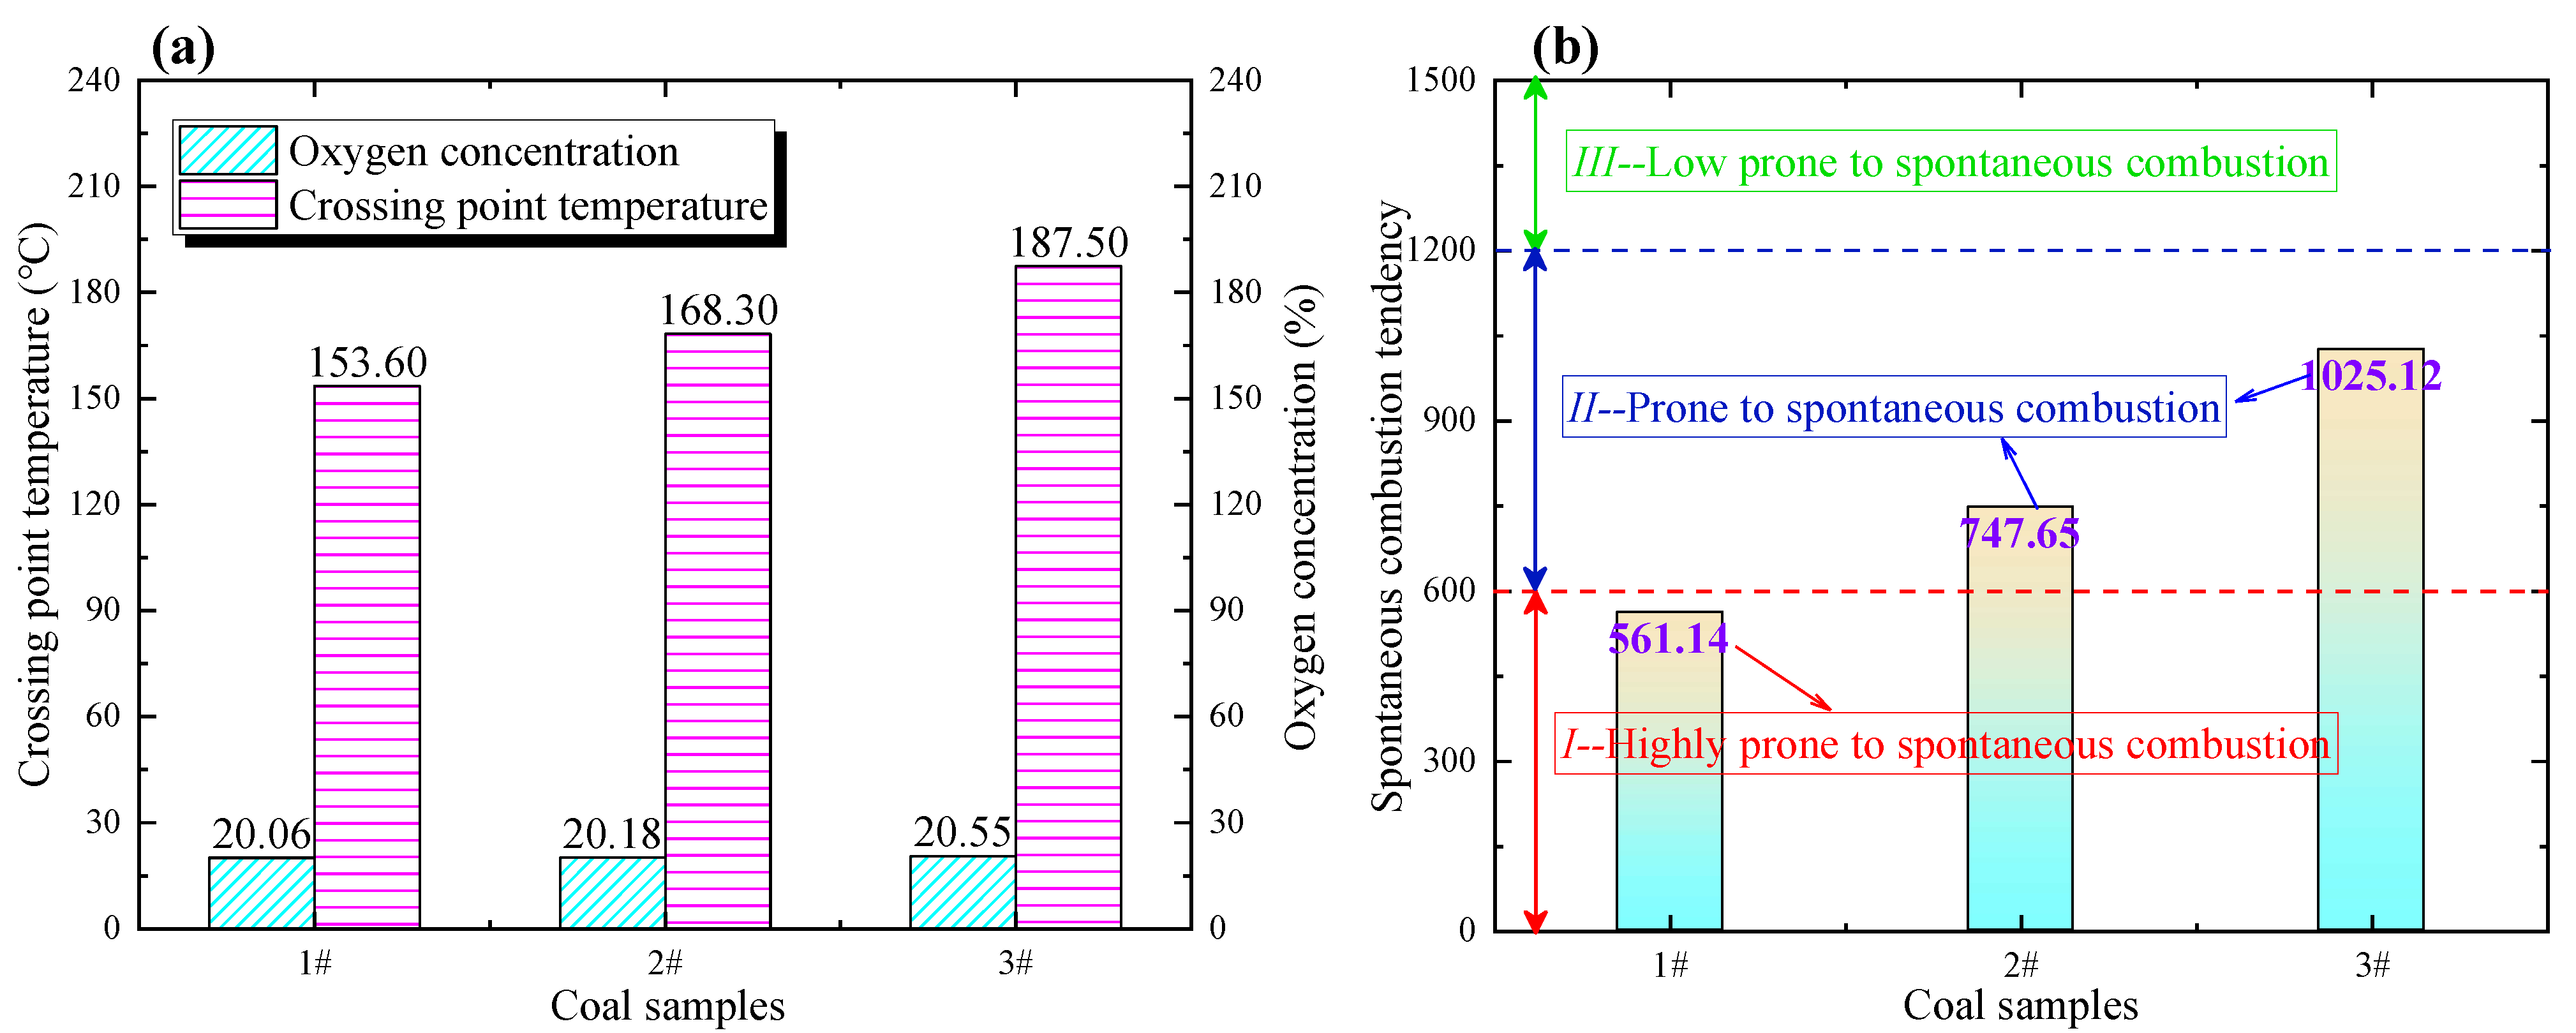
4.1. Determination of Coal Spontaneous Combustion Tendency
4.2. Prediction Index Optimization of Coal Spontaneous Combustion
4.2.1. Index Gases Concentration and Their Ratios
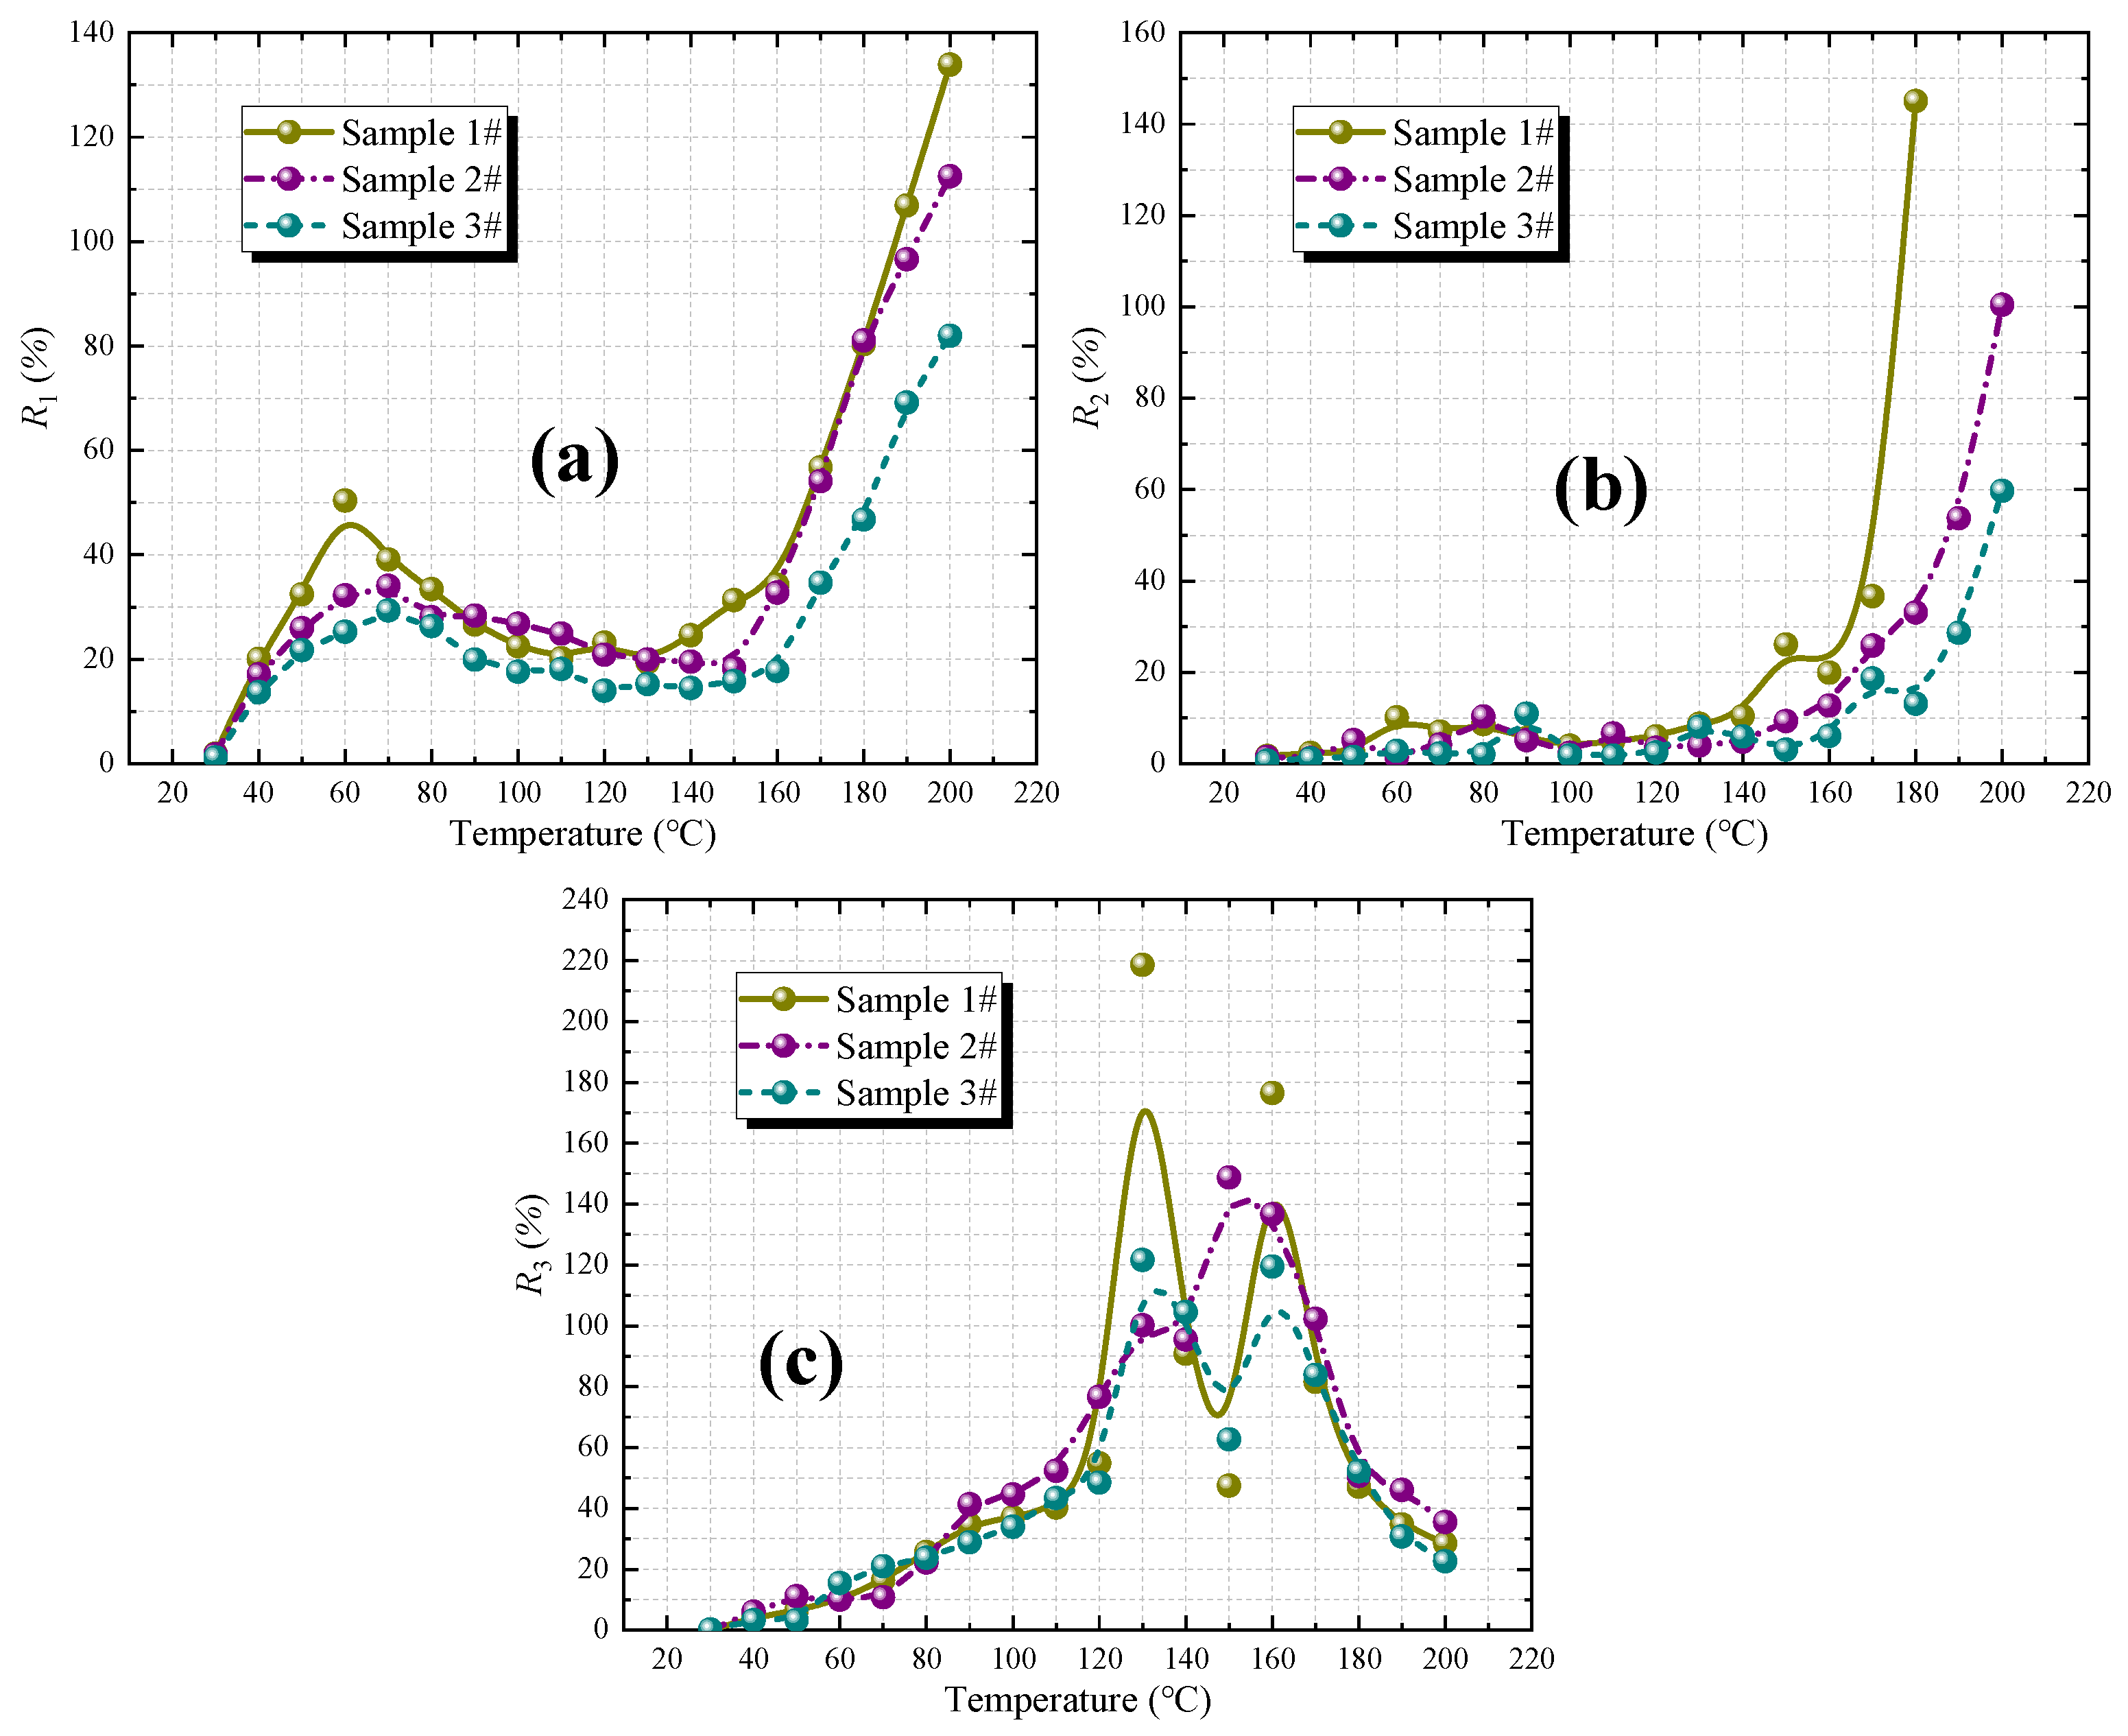
4.2.2. Fire Coefficient Index
4.3. Establishment of Prediction Index System of Coal Spontaneous Combustion
5. Conclusions
- (i)
- During the heating process of the coal sample, with the increase in temperature, the oxygen concentration at the outlet decreases gradually, while the oxygen consumption rate and the concentration of each generated gas gradually increase. Oxygen consumption rate is negatively correlated with coal rank. The higher the coalification degree of coal, the more lagging some characteristic temperature points in the spontaneous combustion process.
- (ii)
- Determination indexes of the spontaneous combustion tendency of three coal samples with different coalification degrees were determined, and their spontaneous combustion hazard levels were evaluated. Lignite is classified as Class I susceptible to spontaneous combustion, while long-flame coal and lean coal are classified as Class II capable of spontaneous combustion. Three kinds of fire coefficients were calculated to determine spontaneous combustion of coal. Taking lignite as an example, the range of critical temperature points in the spontaneous combustion process evaluated by the second fire coefficient R2 is 60~70 °C, and the range of dry cracking temperature points is 140~150 °C.
- (iii)
- A multi-parameter index system was established to predict the spontaneous combustion state of coal, in which the main indexes include CO concentration, C2H6/CH4, and the second fire coefficient R2. Auxiliary indicators include: C2H4 concentration, C2H6 concentration, CO2/CO, C2H6/CH4, C2H4/C2H6, C2H4/CH4, the first fire coefficient R1 and the third fire coefficient R3. In the actual situation, continuous correction of the relevant gas index parameters is required to comprehensively determine the spontaneous combustion of coal and provide support for fire prevention and suppression work in coal mines.
Author Contributions
Funding
Institutional Review Board Statement
Informed Consent Statement
Data Availability Statement
Conflicts of Interest
References
- Xue, D.; Hu, X.; Cheng, W.; Wei, J.; Zhao, Y.; Shen, L. Fire Prevention and Control Using Gel-Stabilization Foam to Inhibit Spontaneous Combustion of Coal: Characteristics and Engineering Applications. Fuel 2020, 264, 116903. [Google Scholar] [CrossRef]
- Wen, H.; Guo, J.; Jin, Y.; Wang, K.; Zhang, Y.; Zheng, X. Experimental Study on the Influence of Different Oxygen Concentrations on Coal Spontaneous Combustion Characteristic Parameters. Int. J. Oil Gas Coal Technol. 2017, 16, 187–202. [Google Scholar] [CrossRef]
- Deng, J.; Xiao, Y.; Li, Q.; Lu, J.; Wen, H. Experimental Studies of Spontaneous Combustion and Anaerobic Cooling of Coal. Fuel 2015, 157, 261–269. [Google Scholar] [CrossRef]
- Lu, P.; Liao, G.X.; Sun, J.H.; Li, P.D. Experimental Research on Index Gas of the Coal Spontaneous at Low-Temperature Stage. J. Loss Prev. Process Ind. 2004, 17, 243–247. [Google Scholar] [CrossRef]
- Xu, H.; Qin, Y.; Yang, D.; Zhang, F.; Wu, F.; Chu, X. Modeling of Diffusion Kinetics during Gas Adsorption in a Coal Seam with a Dimensionless Inversion Method. Fuel 2022, 326, 125068. [Google Scholar] [CrossRef]
- Bai, Z.; Wang, C.; Deng, J. Analysis of Thermodynamic Characteristics of Imidazolium-Based Ionic Liquid on Coal. J. Therm. Anal. Calorim. 2020, 140, 1957–1965. [Google Scholar] [CrossRef]
- Qin, Y.; Song, Y.; Liu, W.; Wei, J.; Lv, Q. Assessment of Low-Temperature Oxidation Characteristics of Coal Based on Standard Oxygen Consumption Rate. Process Saf. Environ. Prot. 2020, 135, 342–349. [Google Scholar] [CrossRef]
- Baris, K.; Kizgut, S.; Didari, V. Low-Temperature Oxidation of Some Turkish Coals. Fuel 2012, 93, 423–432. [Google Scholar] [CrossRef]
- Xie, J.; Xue, S.; Cheng, W.; Wang, G. Early Detection of Spontaneous Combustion of Coal in Underground Coal Mines with Development of an Ethylene Enriching System. Int. J. Coal Geol. 2011, 85, 123–127. [Google Scholar] [CrossRef]
- Li, J.L.; Lu, W.; Liang, Y.T.; Qi, G.S.; Kong, B.; Hu, X.M. Variation of CO2/CO Ratio during Pure-Oxidation of Feed Coal. Fuel 2020, 262, 116588. [Google Scholar] [CrossRef]
- Xiao, Y.; Ma, L.; Wang, Z.P.; Wen, H.; Deng, J. Law of Index Gases Adsorption and Condensability of Coal Spontaneous Combustion. Meitan Xuebao/J. China Coal Soc. 2007, 32, 1014–1018. [Google Scholar]
- Wang, J.; Zhang, Y.; Xue, S.; Wu, J.; Tang, Y.; Chang, L. Assessment of Spontaneous Combustion Status of Coal Based on Relationships between Oxygen Consumption and Gaseous Product Emissions. Fuel Process. Technol. 2018, 179, 60–71. [Google Scholar] [CrossRef]
- Wen, H.; Yu, Z.; Fan, S.; Zhai, X.; Liu, W. Prediction of Spontaneous Combustion Potential of Coal in the Gob Area Using Co Extreme Concentration: A Case Study. Combust. Sci. Technol. 2017, 189, 1713–1727. [Google Scholar] [CrossRef]
- Guo, J.; Wen, H.; Zheng, X.; Liu, Y.; Cheng, X. A Method for Evaluating the Spontaneous Combustion of Coal by Monitoring Various Gases. Process Saf. Environ. Prot. 2019, 126, 223–231. [Google Scholar] [CrossRef]
- Liu, H.; Wang, F.; Ren, T.; Qiao, M.; Yan, J. Influence of Methane on the Prediction Index Gases of Coal Spontaneous Combustion: A Case Study in Xishan Coalfield, China. Fuel 2021, 289, 119852. [Google Scholar] [CrossRef]
- Itay, M.; Hill, C.R.; Glasser, D. A Study of the Low Temperature Oxidation of Coal. Fuel Process. Technol. 1989, 21, 81–97. [Google Scholar] [CrossRef]
- Ma, L.; Zou, L.; Ren, L.F.; Chung, Y.H.; Zhang, P.Y.; Shu, C.M. Prediction Indices and Limiting Parameters of Coal Spontaneous Combustion in the Huainan Mining Area in China. Fuel 2020, 264, 116883. [Google Scholar] [CrossRef]
- Niu, H.; Deng, X.; Li, S.; Cai, K.; Zhu, H.; Li, F.; Deng, J. Experiment Study of Optimization on Prediction Index Gases of Coal Spontaneous Combustion. J. Cent. South Univ. 2016, 23, 2321–2328. [Google Scholar] [CrossRef]
- Willet, H.L. The Interpretation of Samples from behind Stoppings with a View to Reopening. Trans. Inst. Min. Eng. 1952, 111, 629–651. [Google Scholar]
- Ghosh, A.K.; Banerjee, D.D. Use of Carbon–Hydrogen Ratio as an Index in the Investigation of Explosions and Underground Fires. J. Mines Met. Fuels 1967, 15, 334–340. [Google Scholar]
- Graham, J.I. The Absorption of Oxygen by Coal: Part V. The Influence of Temperature on Rates of Absorption by Different Parts of the Barnsley Bed. Trans. Inst. Min. Eng. 1914, 48, 521–534. [Google Scholar]
- Zhao, J.; Deng, J.; Wang, T.; Song, J.; Zhang, Y.; Shu, C.M.; Zeng, Q. Assessing the Effectiveness of a High-Temperature-Programmed Experimental System for Simulating the Spontaneous Combustion Properties of Bituminous Coal through Thermokinetic Analysis of Four Oxidation Stages. Energy 2019, 169, 587–596. [Google Scholar] [CrossRef]
- Xue, S.; Dickson, B.; Wu, J. Application of 222Rn Technique to Locate Subsurface Coal Heatings in Australian Coal Mines. Int. J. Coal Geol. 2008, 74, 139–144. [Google Scholar] [CrossRef]
- Zhang, Y.; Wu, J.; Chang, L.; Wang, J.; Li, Z. Changes in the Reaction Regime during Low-Temperature Oxidation of Coal in Confined Spaces. J. Loss Prev. Process Ind. 2013, 26, 1221–1229. [Google Scholar] [CrossRef]
- Zhao, J.; Wang, W.; Fu, P.; Wang, J.; Gao, F. Evaluation of the Spontaneous Combustion of Soaked Coal Based on a Temperature-Programmed Test System and in-Situ FTIR. Fuel 2021, 294, 120583. [Google Scholar] [CrossRef]
- Zhao, J.; Deng, J.; Song, J.; Shu, C.M. Effectiveness of a High-Temperature-Programmed Experimental System in Simulating Particle Size Effects on Hazardous Gas Emissions in Bituminous Coal. Saf. Sci. 2019, 115, 353–361. [Google Scholar] [CrossRef]
- Yang, Y.; Li, Z.; Si, L.; Hou, S.; Li, Z.; Li, J. Study on Test Method of Heat Release Intensity and Thermophysical Parameters of Loose Coal. Fuel 2018, 229, 34–43. [Google Scholar] [CrossRef]
- Nie, B.; Yan, H.; Liu, P.; Chen, Z.; Peng, C.; Wang, X.; Yin, F.; Gong, J.; Wei, Y.; Lin, S.; et al. Experimental Investigation on Spontaneous Combustion Oxidation Characteristics and Stages of Coal with Different Metamorphic Degrees. Environ. Sci. Pollut. Res. 2023, 30, 8269–8279. [Google Scholar] [CrossRef]
- Zhang, Y.; Wang, J.; Wu, J.; Xue, S.; Li, Z.; Chang, L. Modes and Kinetics of CO2 and CO Production from Low-Temperature Oxidation of Coal. Int. J. Coal Geol. 2015, 140, 1–8. [Google Scholar] [CrossRef]
- Song, Z.; Kuenzer, C. Coal Fires in China over the Last Decade: A Comprehensive Review. Int. J. Coal Geol. 2014, 133, 72–99. [Google Scholar] [CrossRef]
- Standardization Administration of China. The Test Method of Oxidation Kinetics for the Propensity of Coal to Spontaneous Combustion; Standardization Administration of China: Beijing, China, 2008. [Google Scholar]
- Singh, A.K.; Singh, R.V.K.; Singh, M.P.; Chandra, H.; Shukla, N.K. Mine Fire Gas Indices and Their Application to Indian Underground Coal Mine Fires. Int. J. Coal Geol. 2007, 69, 192–204. [Google Scholar] [CrossRef]
- Liang, Y.; Zhang, J.; Wang, L.; Luo, H.; Ren, T. Forecasting Spontaneous Combustion of Coal in Underground Coal Mines by Index Gases: A Review. J. Loss Prev. Process Ind. 2019, 57, 208–222. [Google Scholar] [CrossRef]
- Wang, C.; Zhao, X.; Bai, Z.; Deng, J.; Shu, C.; Zhang, M. Comprehensive Index Evaluation of the Spontaneous Combustion Capability of Different Ranks of Coal. Fuel 2021, 291, 120087. [Google Scholar] [CrossRef]


| No. | Coal Rank | Proximate Analysis | Ultimate Analysis | |||||||
|---|---|---|---|---|---|---|---|---|---|---|
| Mad (%) | Ad (%) | Vdaf (%) | FCad | C | O | N | H | S | ||
| 1# | Lignite | 26.35 | 10.86 | 40.21 | 67.19 | 65.12 | 23.28 | 1.67 | 4.06 | 1.34 |
| 2# | Long-flame coal | 10.23 | 9.14 | 31.73 | 75.93 | 72.48 | 17.43 | 1.52 | 5.12 | 0.72 |
| 3# | Lean coal | 8.19 | 7.05 | 18.62 | 78.69 | 75.95 | 10.06 | 1.89 | 5.61 | 1.03 |
| Coal Samples | Oxygen Volume Fraction at 70 °C (%) | Crossing Point Temperature (°C) | Determination Index of Spontaneous Combustion Tendency | Spontaneous Combustion Tendency Grade |
|---|---|---|---|---|
| Lignite | 20.06 | 153.61 | 561.14 | I |
| Long-flame coal | 20.18 | 168.32 | 747.65 | II |
| Lean coal | 20.55 | 187.54 | 1025.12 | II |
| Prediction Indicators | Gas Concentration | Gas Concentration Ratio | Fire Coefficient | ||||||||
|---|---|---|---|---|---|---|---|---|---|---|---|
| CO | C2H4 | C2H6 | C2H6/CH4 | CO2/CO | C2H6/CH4 | C2H4/C2H6 | C2H4/CH4 | R2 | R1 | R3 | |
| Main indicators | Yes | No | No | Yes | No | No | No | No | Yes | No | No |
| Auxiliary indicators | No | Yes | Yes | No | Yes | Yes | Yes | Yes | No | Yes | Yes |
Disclaimer/Publisher’s Note: The statements, opinions and data contained in all publications are solely those of the individual author(s) and contributor(s) and not of MDPI and/or the editor(s). MDPI and/or the editor(s) disclaim responsibility for any injury to people or property resulting from any ideas, methods, instructions or products referred to in the content. |
© 2023 by the authors. Licensee MDPI, Basel, Switzerland. This article is an open access article distributed under the terms and conditions of the Creative Commons Attribution (CC BY) license (https://creativecommons.org/licenses/by/4.0/).
Share and Cite
Xu, X.; Zhang, F. Evaluation and Optimization of Multi-Parameter Prediction Index for Coal Spontaneous Combustion Combined with Temperature Programmed Experiment. Fire 2023, 6, 368. https://doi.org/10.3390/fire6090368
Xu X, Zhang F. Evaluation and Optimization of Multi-Parameter Prediction Index for Coal Spontaneous Combustion Combined with Temperature Programmed Experiment. Fire. 2023; 6(9):368. https://doi.org/10.3390/fire6090368
Chicago/Turabian StyleXu, Xuefeng, and Fengjie Zhang. 2023. "Evaluation and Optimization of Multi-Parameter Prediction Index for Coal Spontaneous Combustion Combined with Temperature Programmed Experiment" Fire 6, no. 9: 368. https://doi.org/10.3390/fire6090368
APA StyleXu, X., & Zhang, F. (2023). Evaluation and Optimization of Multi-Parameter Prediction Index for Coal Spontaneous Combustion Combined with Temperature Programmed Experiment. Fire, 6(9), 368. https://doi.org/10.3390/fire6090368