1. Introduction
Fire behavior may be significantly impacted by fire-induced perturbations to the atmosphere. As the fire releases heat and moisture from fuel combustion, the fire induces turbulent circulations by altering the local thermal structure of the lower atmospheric boundary layer [
1]. These fire-induced perturbations in turn impact local fire Rate of Spread (ROS). To assess how the fire induces its own circulations (fire winds), observations and simulations of fires are necessary to determine how the fire changes local conditions. There have been multiple experiments conducted to observe fire–atmosphere coupling processes by sampling the fire environment. Some experiments intended to collect data on the fire-induced circulations, and other experiments were more focused on other aspects such as smoke transport and how fires impact the structure of the atmosphere [
1,
2,
3,
4,
5]. Such experiments are crucial to better our understanding of how fire circulations impact the local conditions and fire spread. In this study, we used a prescribed fire with multiple instruments within the burn plot to sample how the weather conditions change in response to the Fire Front Passage (FFP). The insight into the fundamental fire–atmosphere coupling processes that impact wildfire behavior is critical to improve our understanding of fire behavior in response to fire-induced winds [
6,
7]. Although experimental data can provide invaluable information for the analysis of fire-induced circulations, observations alone cannot be used to systematically quantify the fire winds. On one hand, the observed winds are a result of both the ambient wind fluctuations as well as fire winds. On another hand, the limited sampling resolution (typically just a few locations within the burn plot) makes reconstructing the 3D flow near the fire and quantifying fire-induced perturbations based on observation alone, not feasible. However, with the help of coupled fire–atmosphere simulations, it is possible to overcome these limitations. Numerical experiments with and without fire–atmosphere feedback initialized to render experimental burns (both in the sense of the meteorological conditions as well as the fuel and terrain) allow us to analyze and quantify the fire impacts by subtracting variables from one-way coupled simulation from the two-way coupled ones.
The experimental burn used in this study is the FireFlux2 (FF2) experimental burn. This burn took place in Texas in 2013 in a flat prairie with nearly homogenous grassy fuels. It was conducted to better understand micrometeorological aspects of fire spread [
5], and occurred during red flag warning conditions (high winds and low relative humidity), which allowed the fire to spread much faster than in typical experimental fires. Four meteorological towers were installed within the burn plot, each equipped with anemometers and thermocouples at varying heights, as well as pressure sensors, ground thermocouples, and a SODAR that collected data on how the fire affects local atmospheric conditions. Additionally, two infrared (IR) cameras collected video footage showing the fire progression. There was also a radiosonde launched near the time of ignition to gather information about the vertical structure of the atmosphere before the burn.
The FF2 experiment was a follow-up from the original FireFlux experiment that occurred in 2006. The FireFlux burn provided a unique opportunity for rigorous validations of many coupled fire–atmosphere models [
8,
9,
10,
11]. The unique characteristic of the FF2 burn compared with FireFlux stems from the fact that the FF2 burn was conducted under stronger winds, with more instruments, and with improved IR fire mapping as well as more comprehensive meteorological measurements. The purpose of the FireFlux burn was to study fire–atmosphere interactions during a fast-spreading grass fire by measuring the wind, turbulence, and temperature [
9]. The authors found the FireFlux burn altered the local conditions by generating strong turbulence (4–5×greater than ambient conditions [
4]) which could be seen downstream from the fire front due to the downward transport of higher momentum [
4]. This indicated that the fire not only impacts conditions at the fire front, but well ahead of the fire front as well.
Combining these observations from the FireFlux burn with model simulations allows for a new perspective into how fire-induced perturbations impact the fires’ propagation and surrounding conditions. One experiment that conducted an analysis using the FireFlux burn occurs in [
11] where they use the ForeFire/Meso-NH model in a Large Eddy Simulation (LES) configuration to determine how fire-induced perturbations impact the shape of the fire, the fire forcing on the atmospheric flow in the lowest layers, and the impacts of the fire-induced wind on the surrounding atmosphere [
11]. They found that the shape of the fire front is strongly affected by the fire-induced winds as the fire head becomes narrower and propagates faster, which matches the observations [
4,
11]. With a similar fire shape, the heat flux injected in the atmosphere as well as the wind perturbations in both the model and observations were consistent. The only difference between the model and observations was a slight wind shift which occurred during the burn and impacted the fire progression. As the fire propagated through the towers, it produced downdrafts just before FFP, which occurred in both the simulations and observations, then a fast increase in winds when the fire front was under the tower due to heating [
11]. After that, downdrafts occurred after FFP in both the simulation and observations [
11]. This behavior indicates how the fire-induced updrafts and downdrafts impacted the surrounding atmosphere, creating vertical perturbations.
Similar experiments were analyzed based on Australian grassfires from [
12] and numerical simulations from [
13] using the University of Utah’s Large-scale Eddy Simulation model [
14]. These experiments were performed to examine the variability in fire behavior under two types of atmospheric boundary layers using a coupled fire atmosphere model. However, Ref [
14] also analyzed how the fire-induced winds impact the ROS using a one-way coupled simulation and a two-way coupled simulation. They found that the two-way coupled simulation tended to spread more in the downwind direction compared to the one-way coupled simulation, which spread more along the flanks of the fire. This indicated that the fire-induced winds affected the overall shape of the fire.
Another set of numerical experiments using a coupled fire–atmosphere model was conducted in [
15] to test how fires impact the surrounding conditions and how they create their own weather. Three different experiments were conducted under different ambient conditions with three short fire lines, and two longer fire lines with homogeneous fuels. The different ambient conditions consisted of varying wind intensities. In the simulations with the weak wind, the position of the fire front remained mostly stationary and the fireline began to break up [
15]. With stronger winds, the fire front progressed much faster and took on a conical shape [
15]. These shapes were explained by how the lower-level convergence produced by the hot convective columns tilted downstream from the fire front [
15]. This tilt shifted the center of the convergence ahead of the fire front, so that with faster ambient winds, the tilt was stronger, and the center of the convergence zone was farther downwind from the fire front [
15]. Because of the locations ahead of the fire front, the convergence increased the flow across the fire front, and accelerated fire progression. Under weak ambient conditions, the fire line began to break up without generating as strong of a convective column due to limited propagation speed and intensity.
Despite the extensive previous knowledge on how fire-induced circulations impact fire spread and how they alter the local conditions both at the fire front and ahead of it, there still exists a knowledge gap on the circulations at both the head and flanks of the fire front, as well as how strong fire winds are. By using a model simulation that has been verified with field observations taken during the FF2 experiment, we can accurately quantify the effects from a fire on the local conditions and compare the head and flank circulations. With this study, we can then investigate fire–atmosphere interactions and their impacts on local weather conditions and the fire spread.
2. Methods
To analyze fire-induced circulations at the head and flanks of the fire, we used two idealized WRF-SFIRE simulations of the FF2 experimental burn—a two-way coupled run in which fire-released heat and moisture fluxes were fed to the atmosphere to resolve the fire-induced winds, and the one-way coupled simulation in which fire-released heat and moisture fluxes were neglected. These runs allowed us to investigate the impact of fire–atmosphere interactions on local winds and the fire propagation, and the difference between the wind fields and the rate of spread from these simulations allowed us to quantify the fire winds and the effects of fire–atmosphere coupling on fire propagation.
WRF-SFIRE [
2,
16,
17,
18] used in this study is a two-way coupled fire–atmosphere model that couples the Weather Research Forecasting (WRF) model with a fire spread model (SFIRE). SFIRE is a fire spread model that incorporates the level set method [
16] using the semi-empirical Rothermel fire spread model [
19]. WRF-SFIRE uses two separate meshes: a three-dimensional atmospheric mesh and a refined fire mesh at the surface [
9]. The model can simulate both idealized and real cases and is fast enough to be used for operations. WRF-SFIRE has been used to simulate both wildfires near real time (e.g., [
20,
21]) as well as experimental fires (e.g., [
5,
9]). WRF-SFIRE numerical simulations of experimental burns were also conducted to support planning of experimental burns (e.g., [
5]). Models like WRF-SFIRE have been developed to represent the first-order effect of fire–atmosphere interactions at landscape-to-micrometeorological scales [
6]. Coupled fire–atmosphere simulations along with observational data can therefore be used to investigate small-scale fire–atmosphere processes impacting near-fire circulations that control fire behavior.
The set-up for the FF2 WRF-SFIRE simulation consisted of one domain with an atmospheric grid of 200 × 320 grid points (west-east × south-north) and a time step of 0.0025 s. Each grid point in the atmospheric mesh was 5 m × 5 m with 80 vertical levels reaching 1200 m. The fire grid contained 2000 × 3200 grid points with each point being 0.5 m × 0.5 m in size. The model used a stretched vertical mesh with the first model level placed at 1.05 m above the ground and the vertical resolution gradually decreased to an average of 27.75 m at the top of the domain. At the top of the domain the simulation used a sponge layer. This simulation was run on flat ground and used fuel category 3 in the Albini categories (tall grass) with a 14% fuel moisture, and fuel load set to 0.64 kg/m
2 according to the FF2 fuel observations taken prior to the burn. Tall grass was chosen as it best represents the fuel at the burn site.
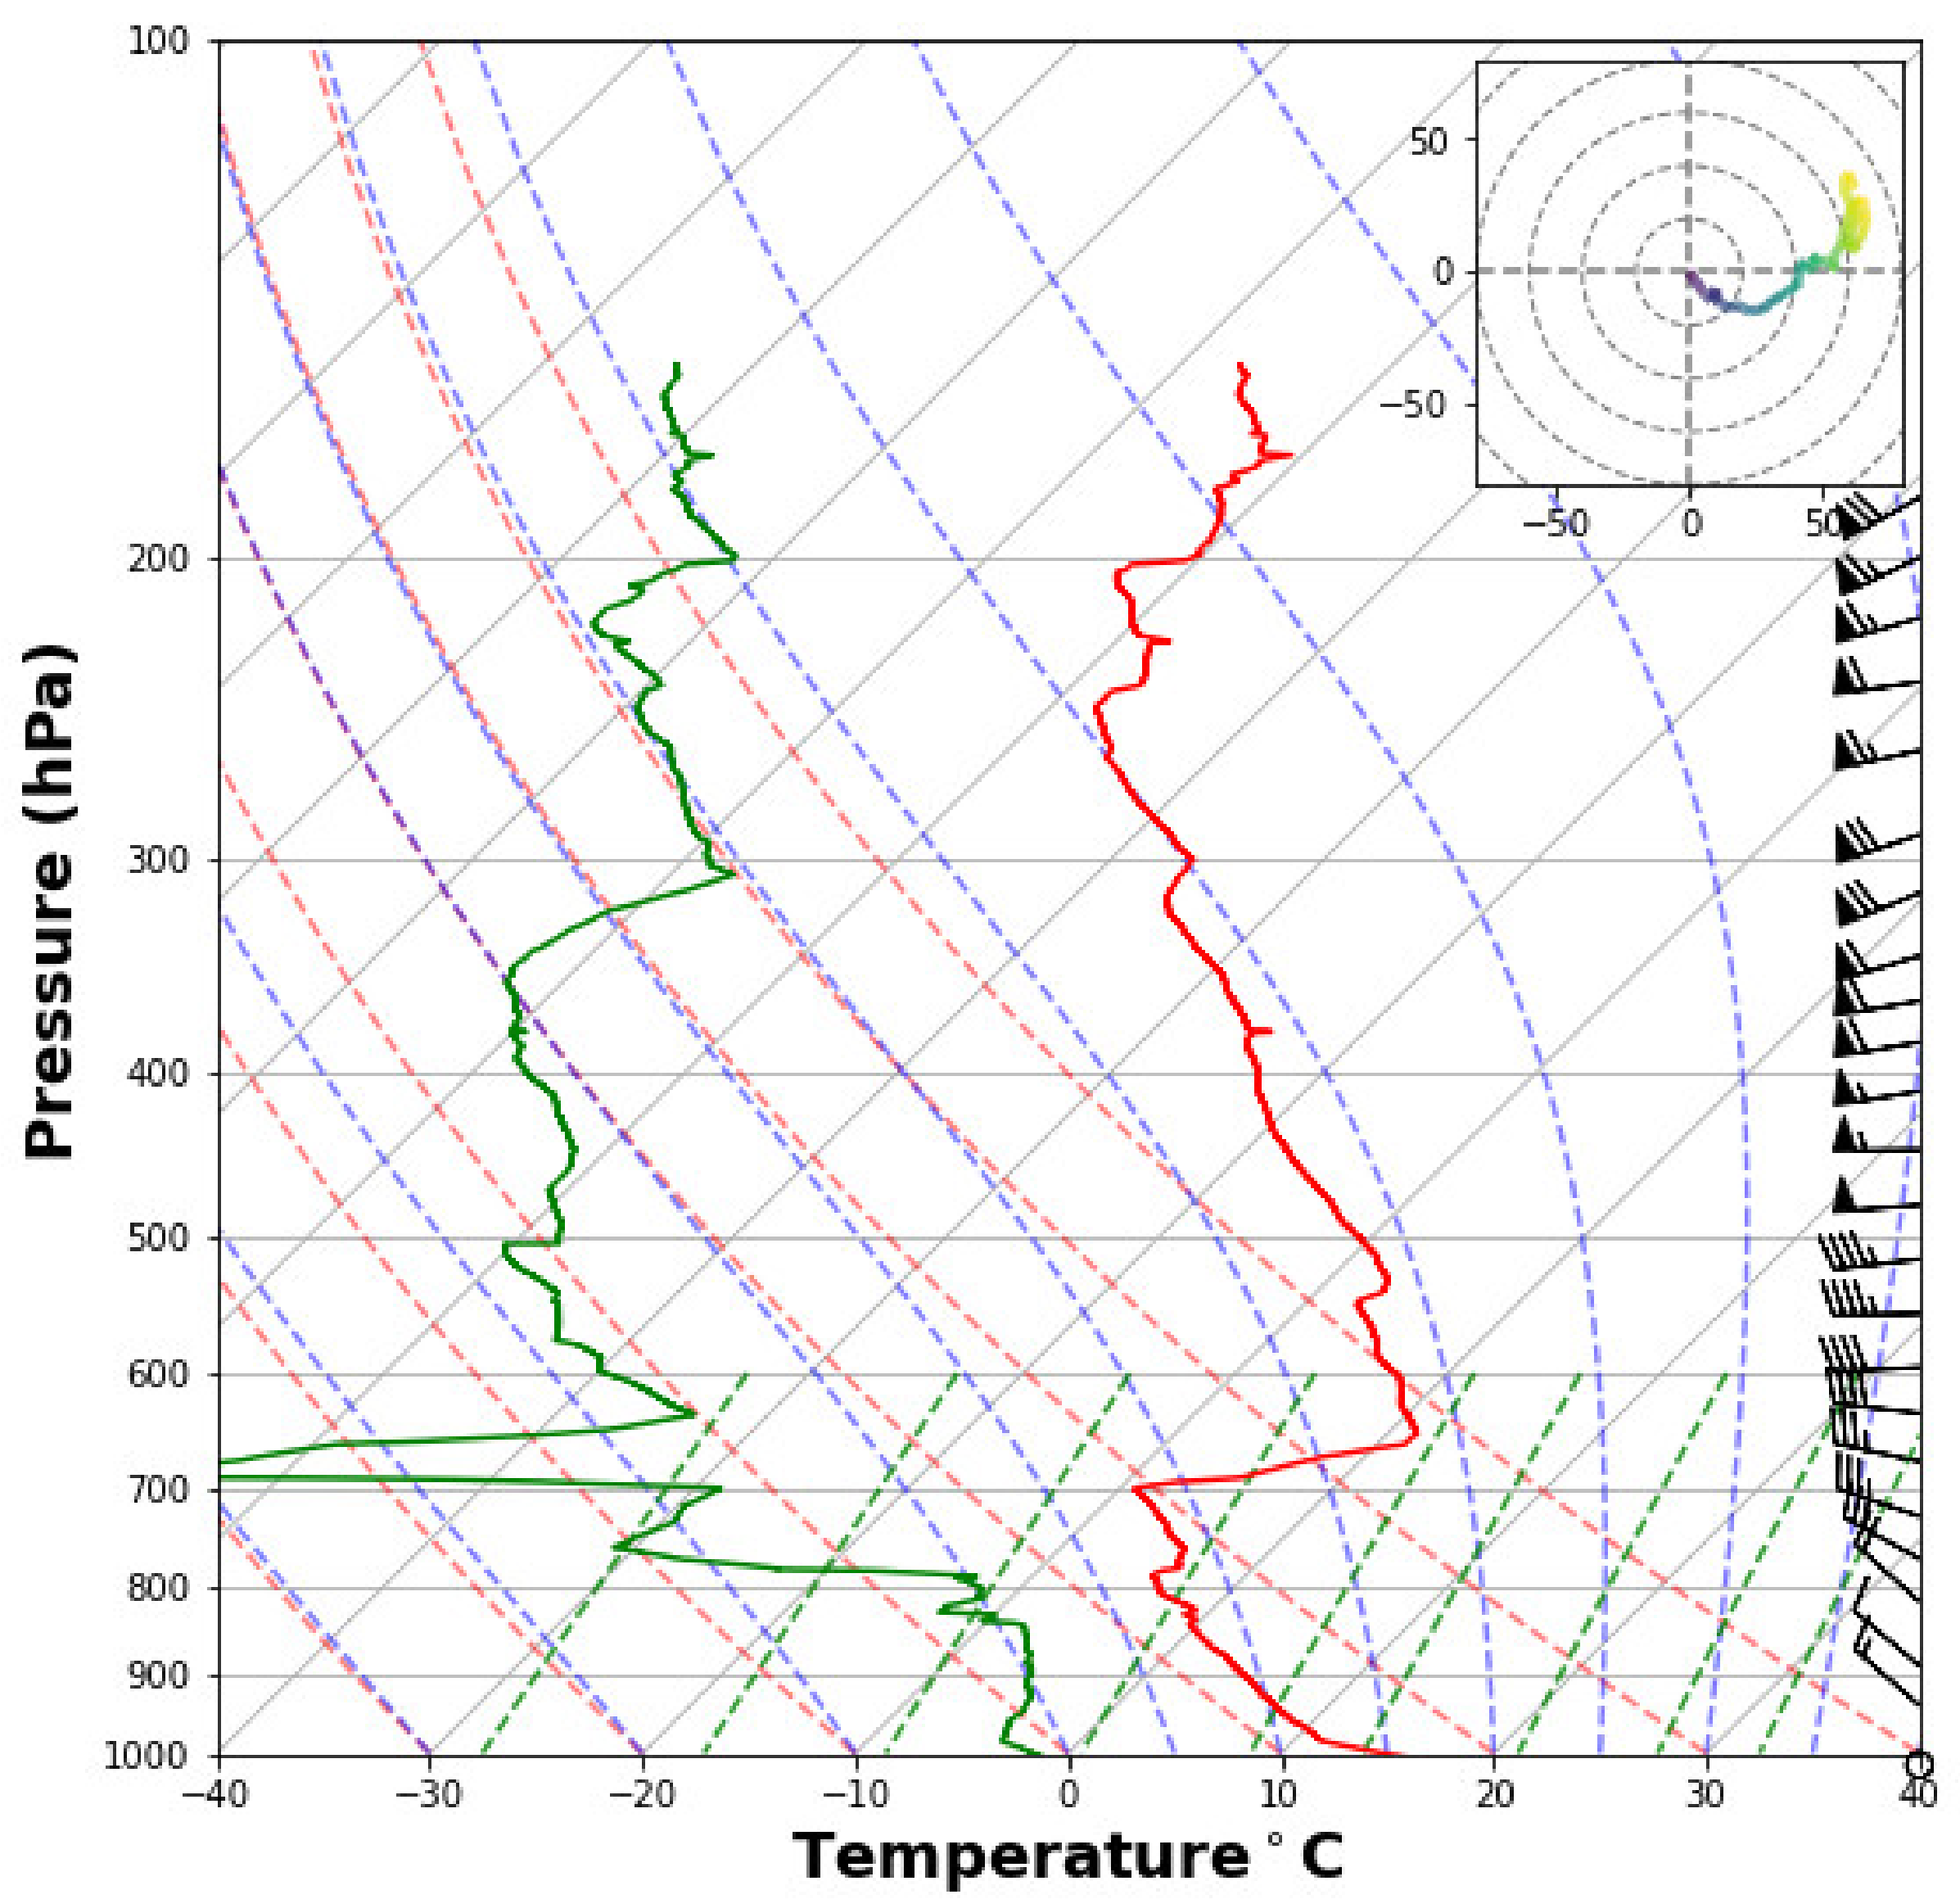
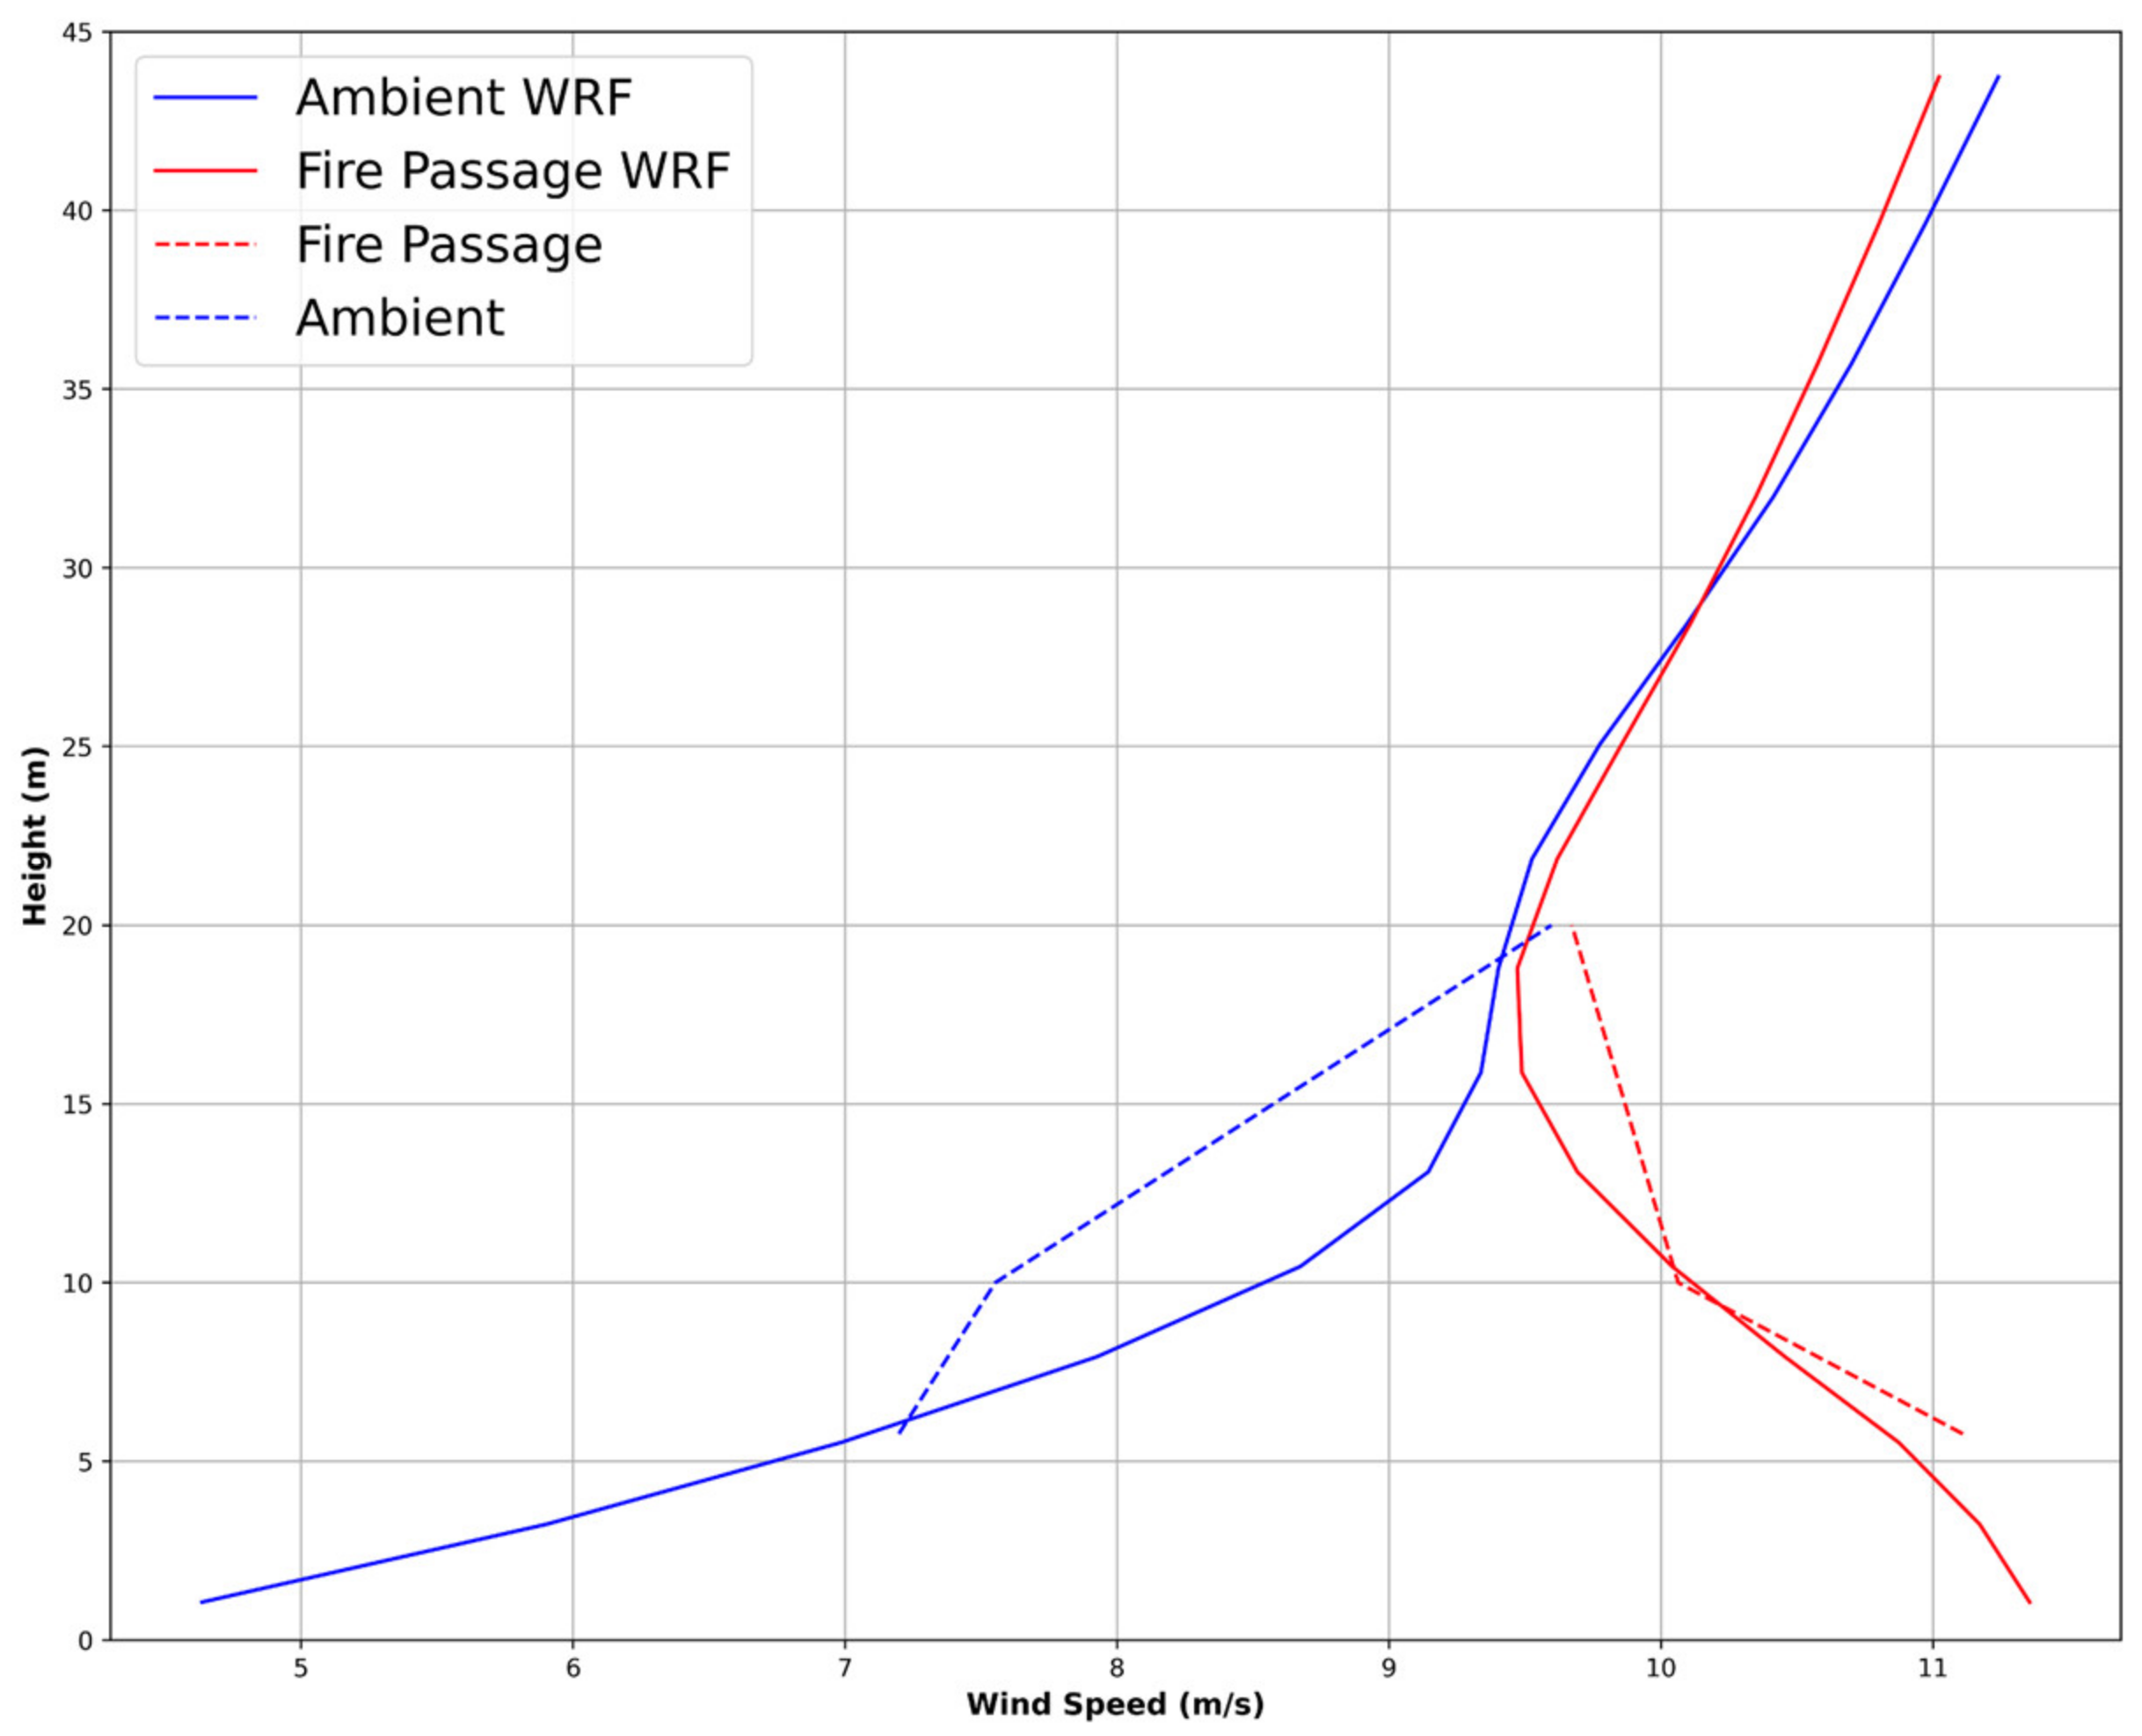
Table 1 contains more details about the FF2 simulation set-up. To initialize winds in the model, we used data from the sounding launched at 14:24 CST (as seen in
Figure 1) along with the SODAR and tower data to create a vertical wind profile representative of the initial conditions before the burn. We then averaged the wind speed from all the towers at all available heights before ignition (from 15:00–15:04) to initialize the model. Each tower shown in
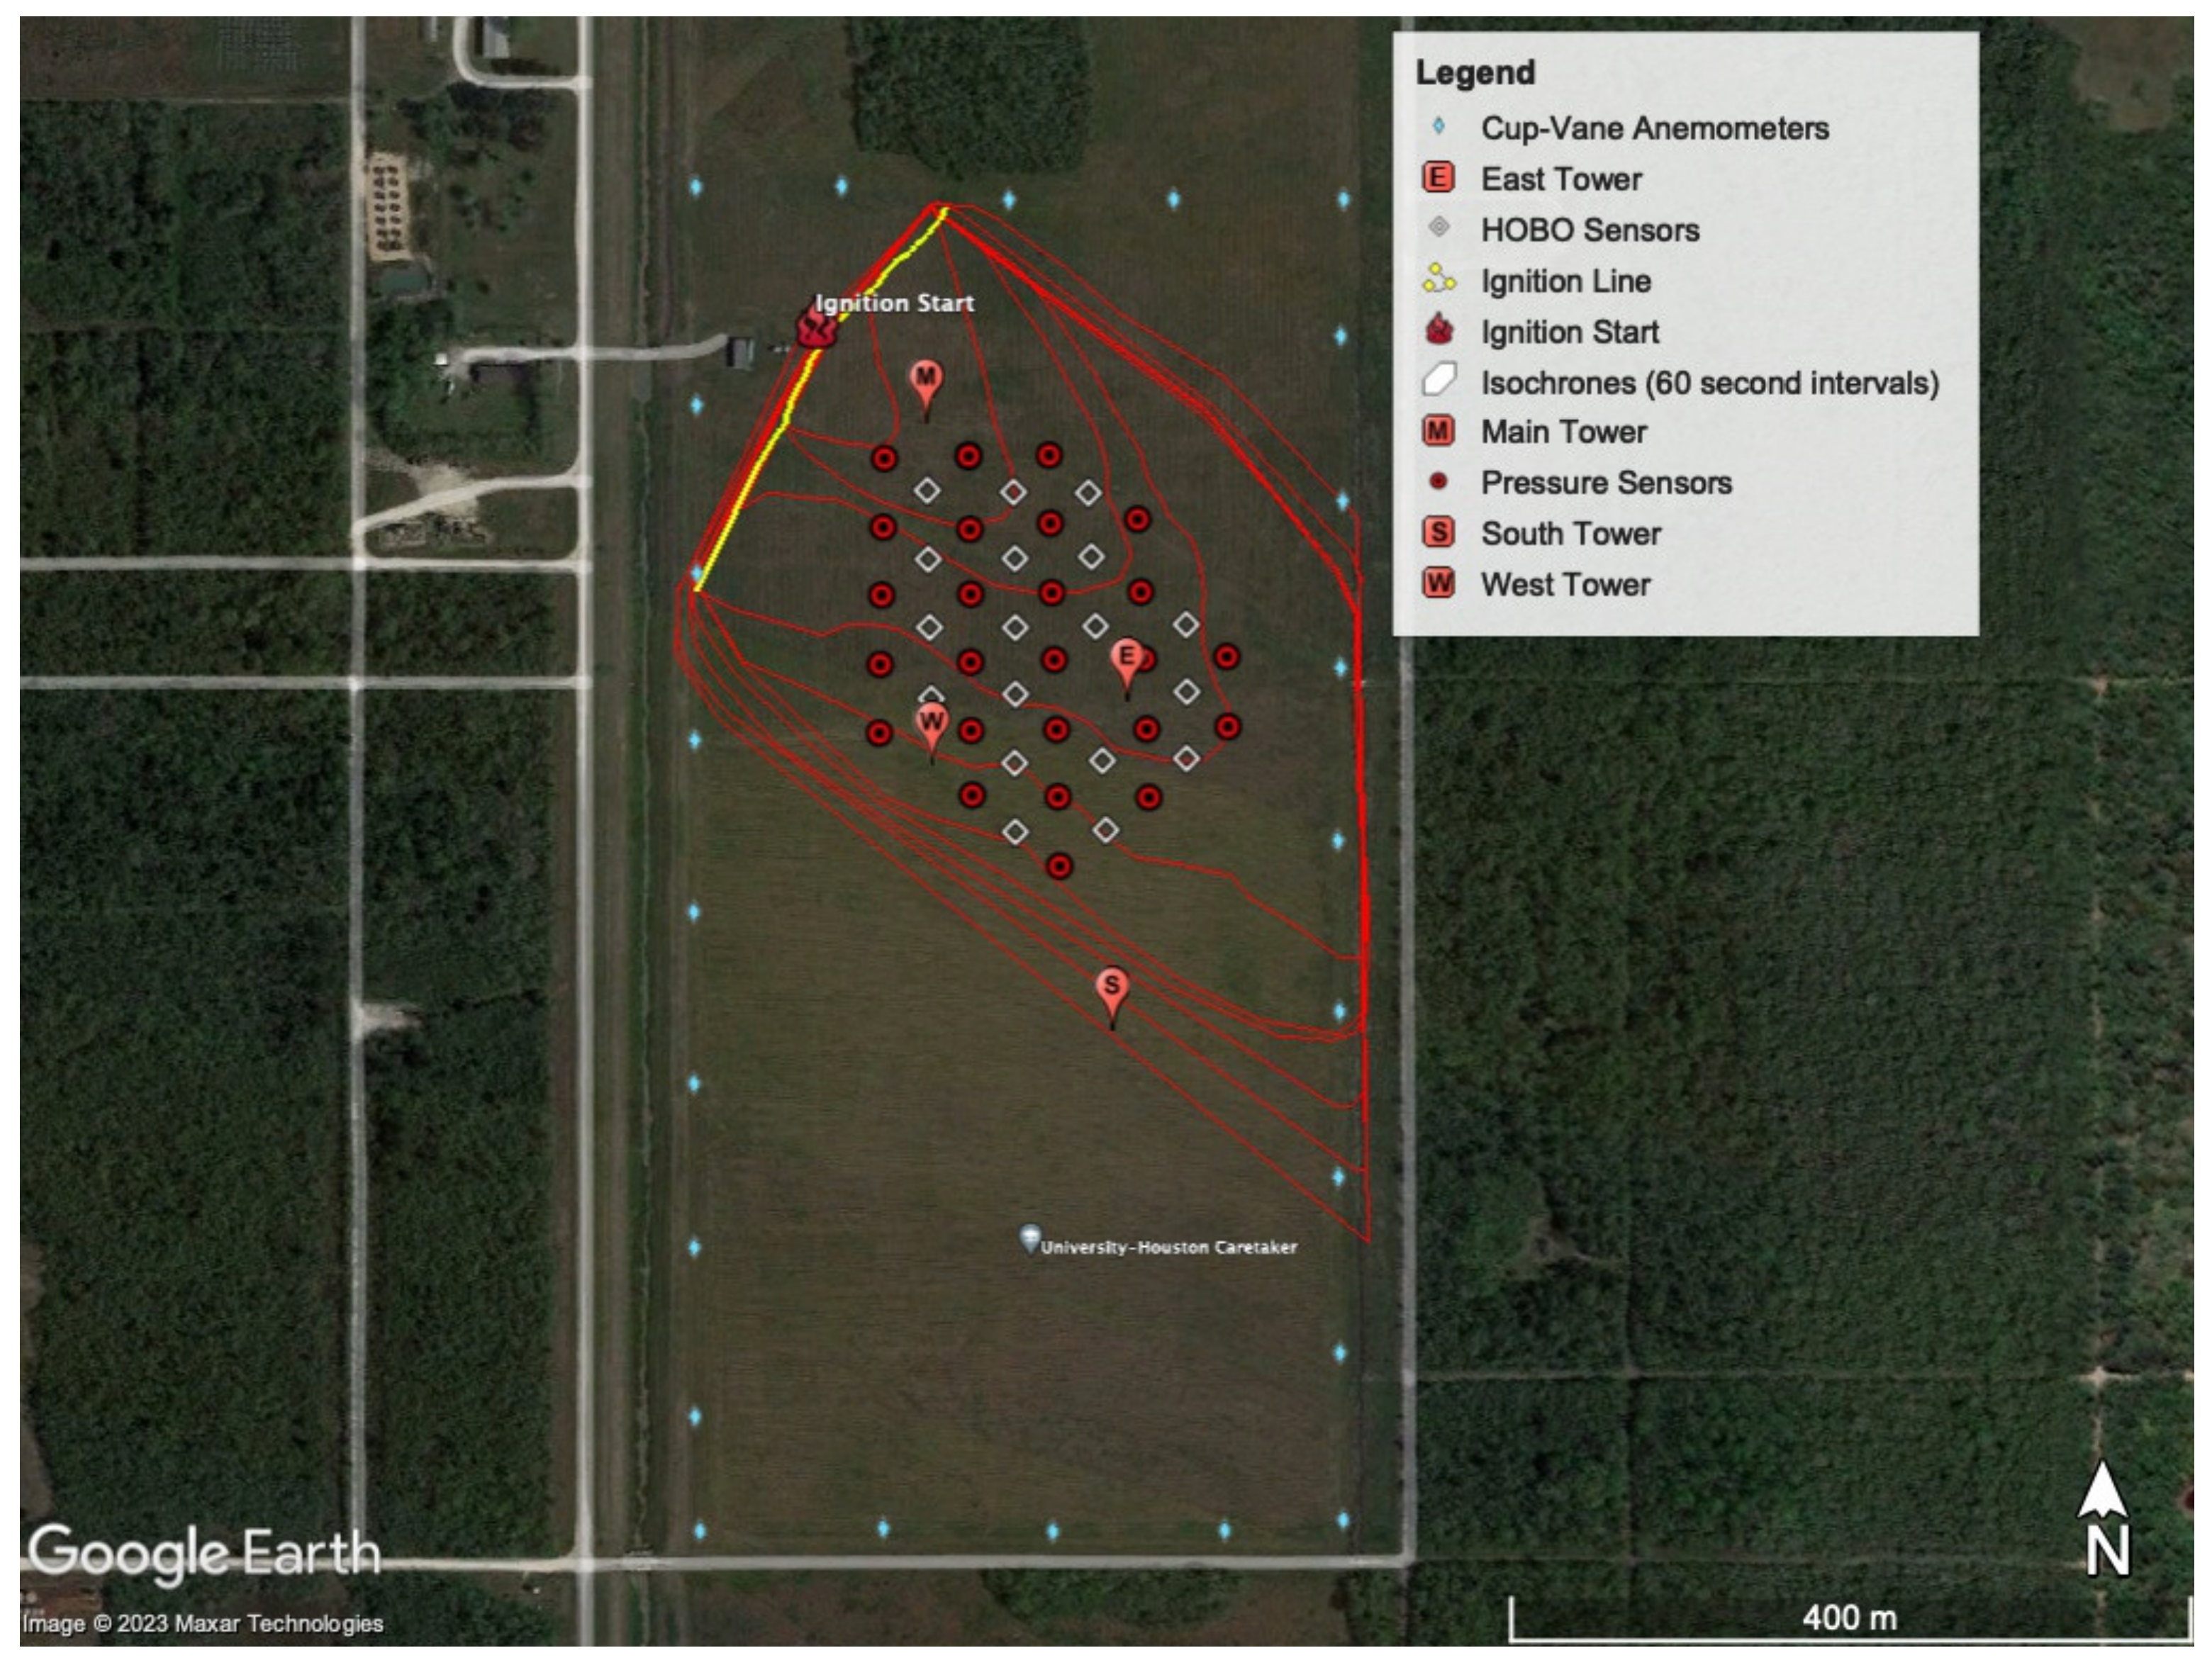
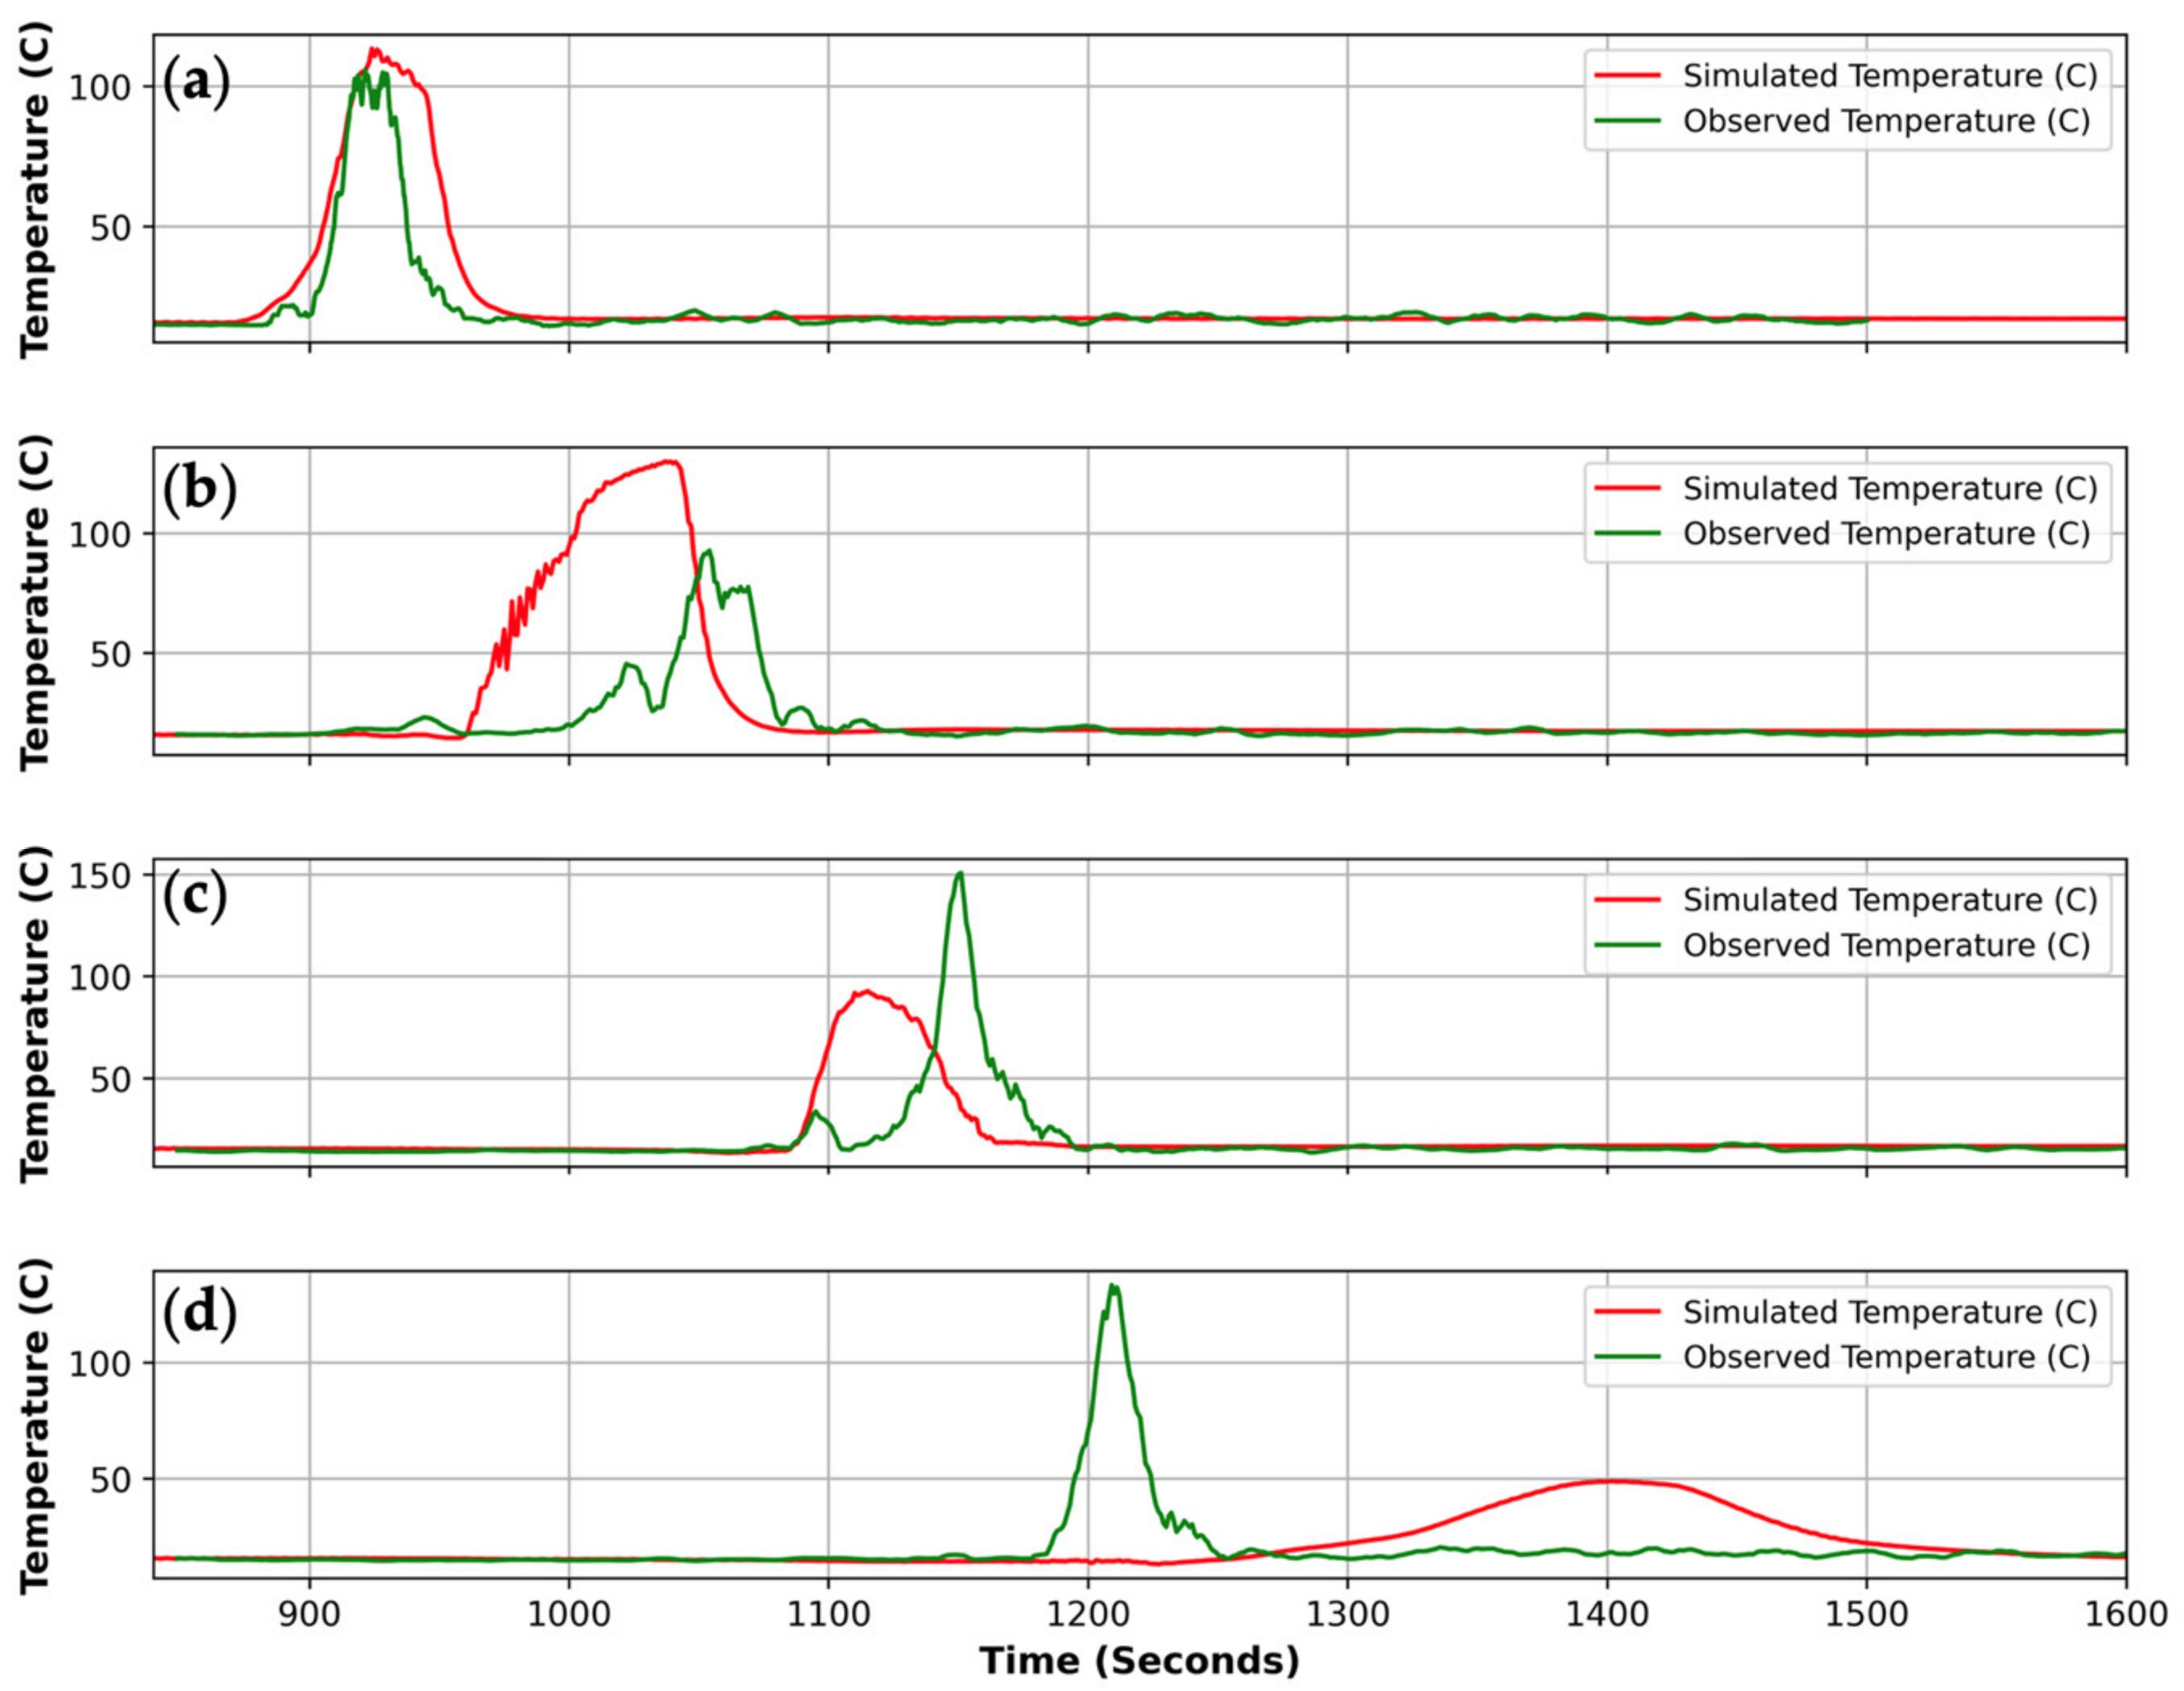
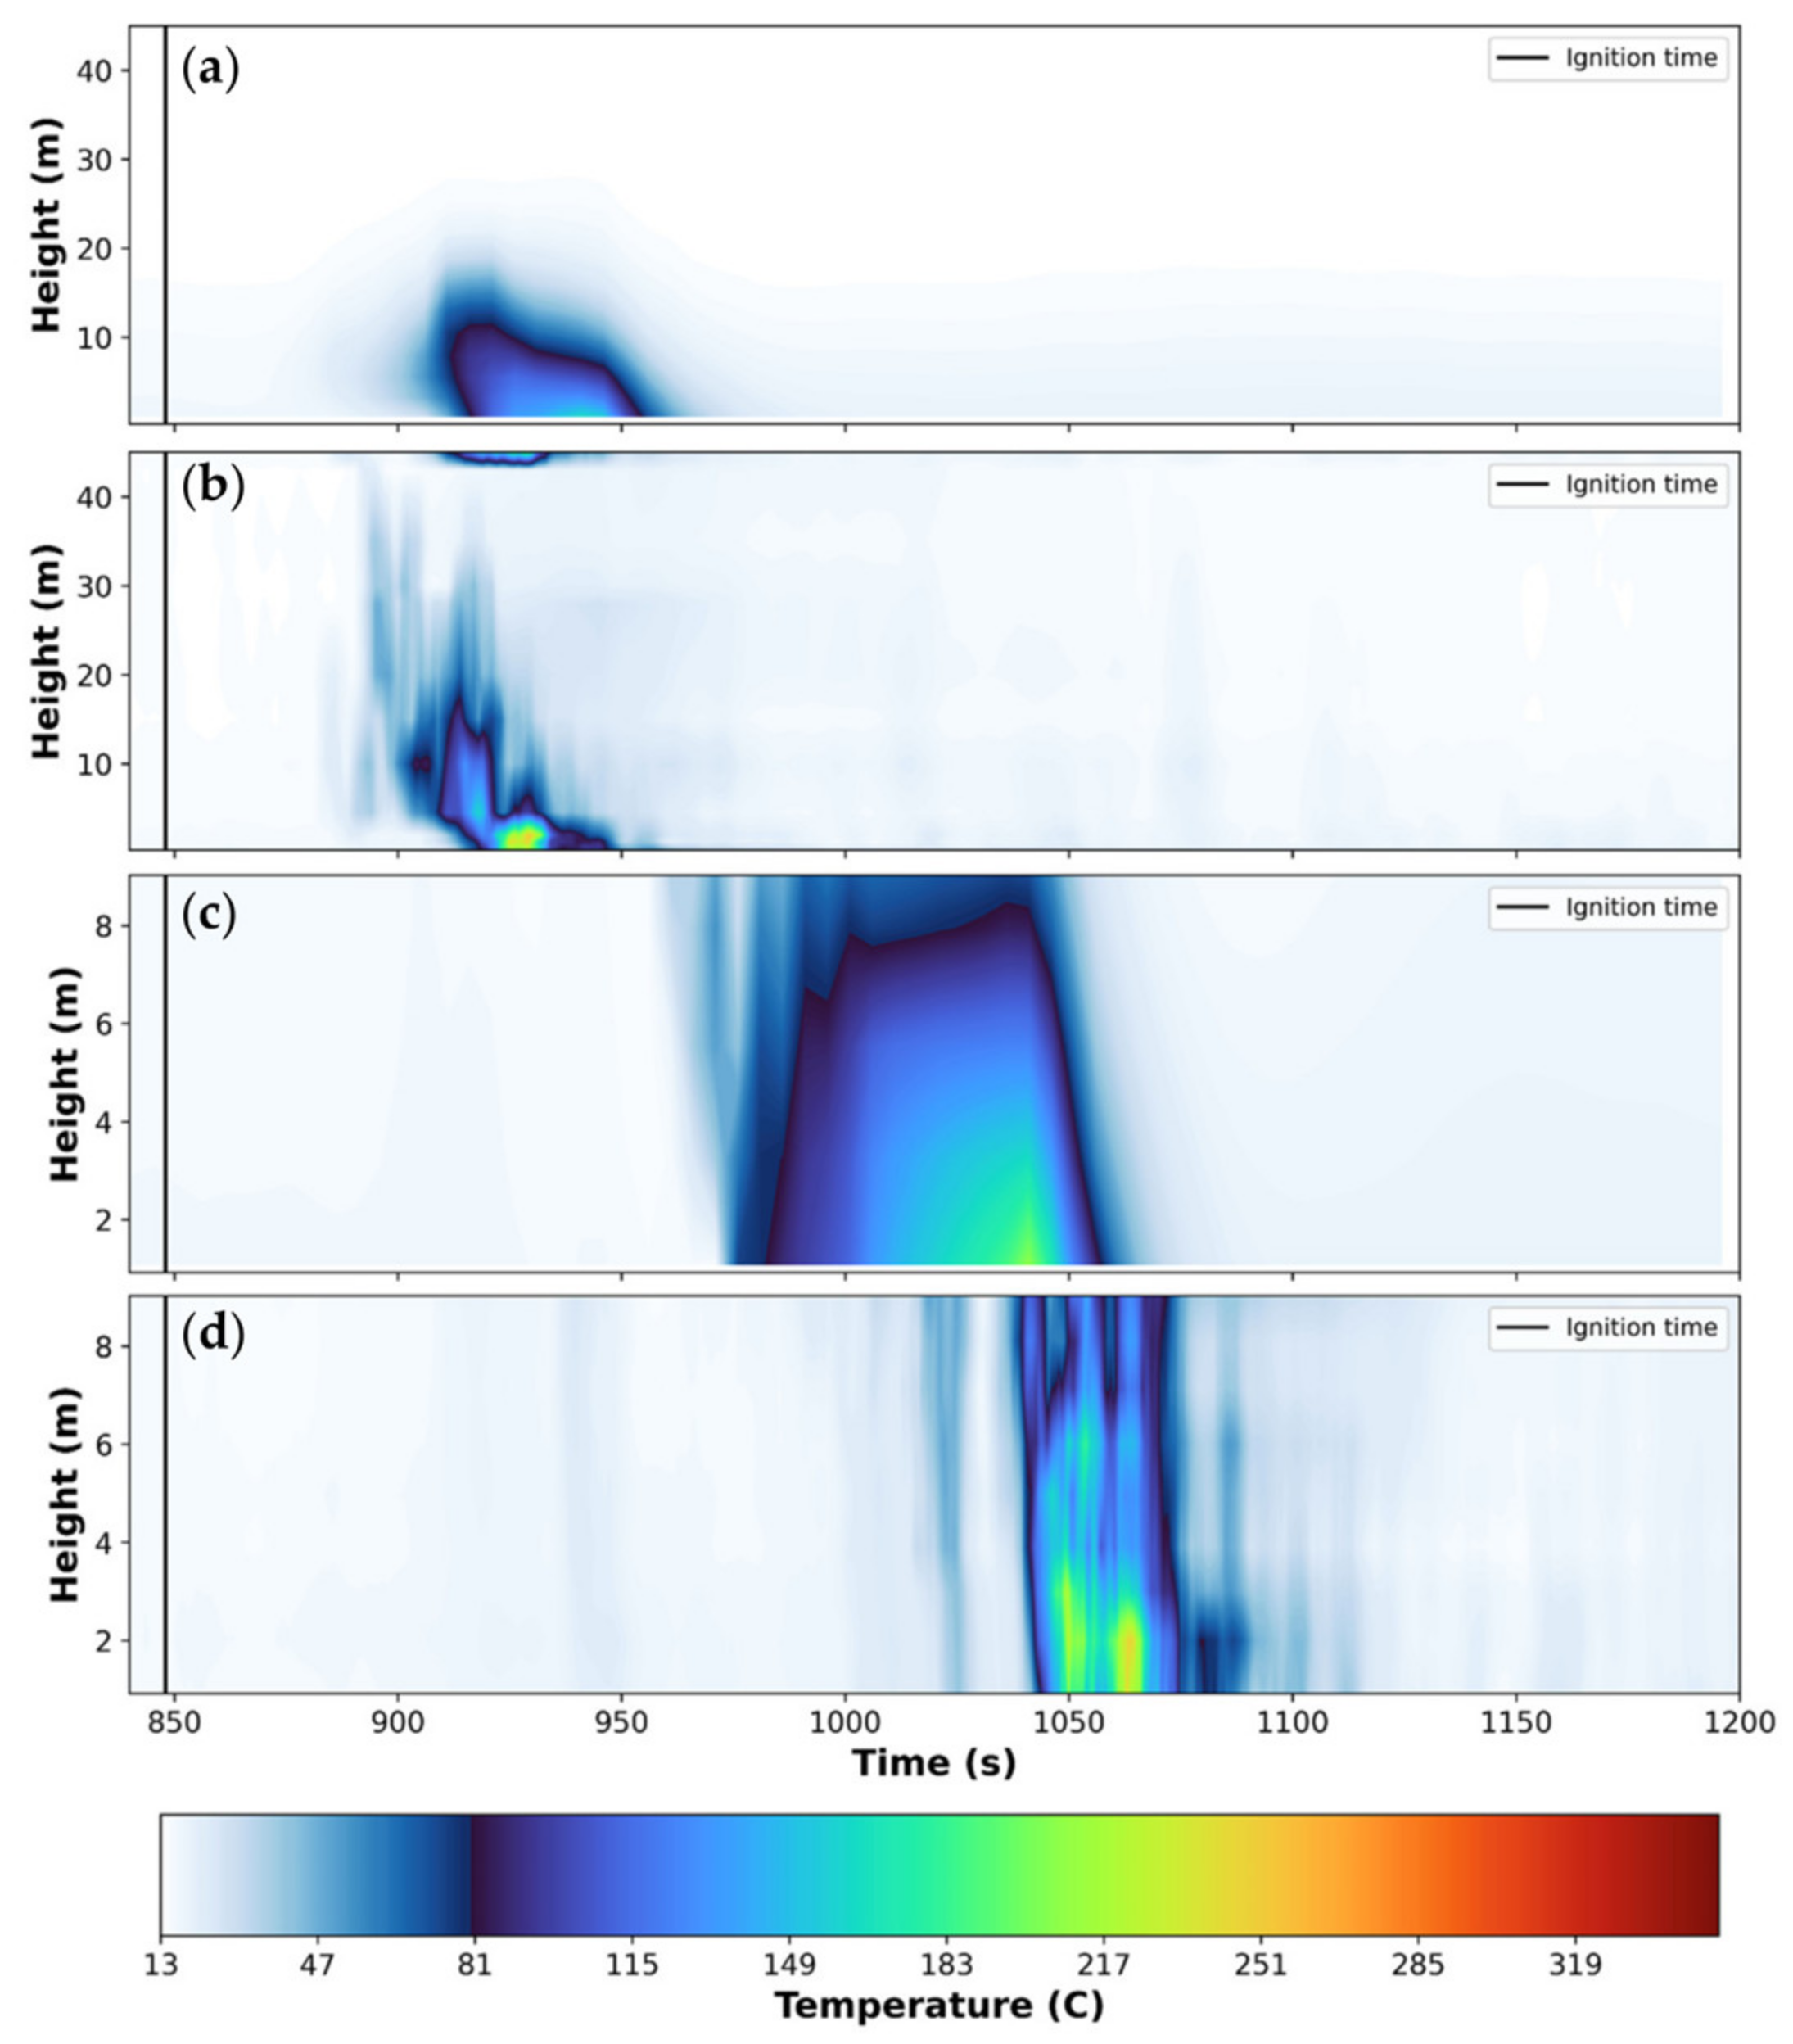
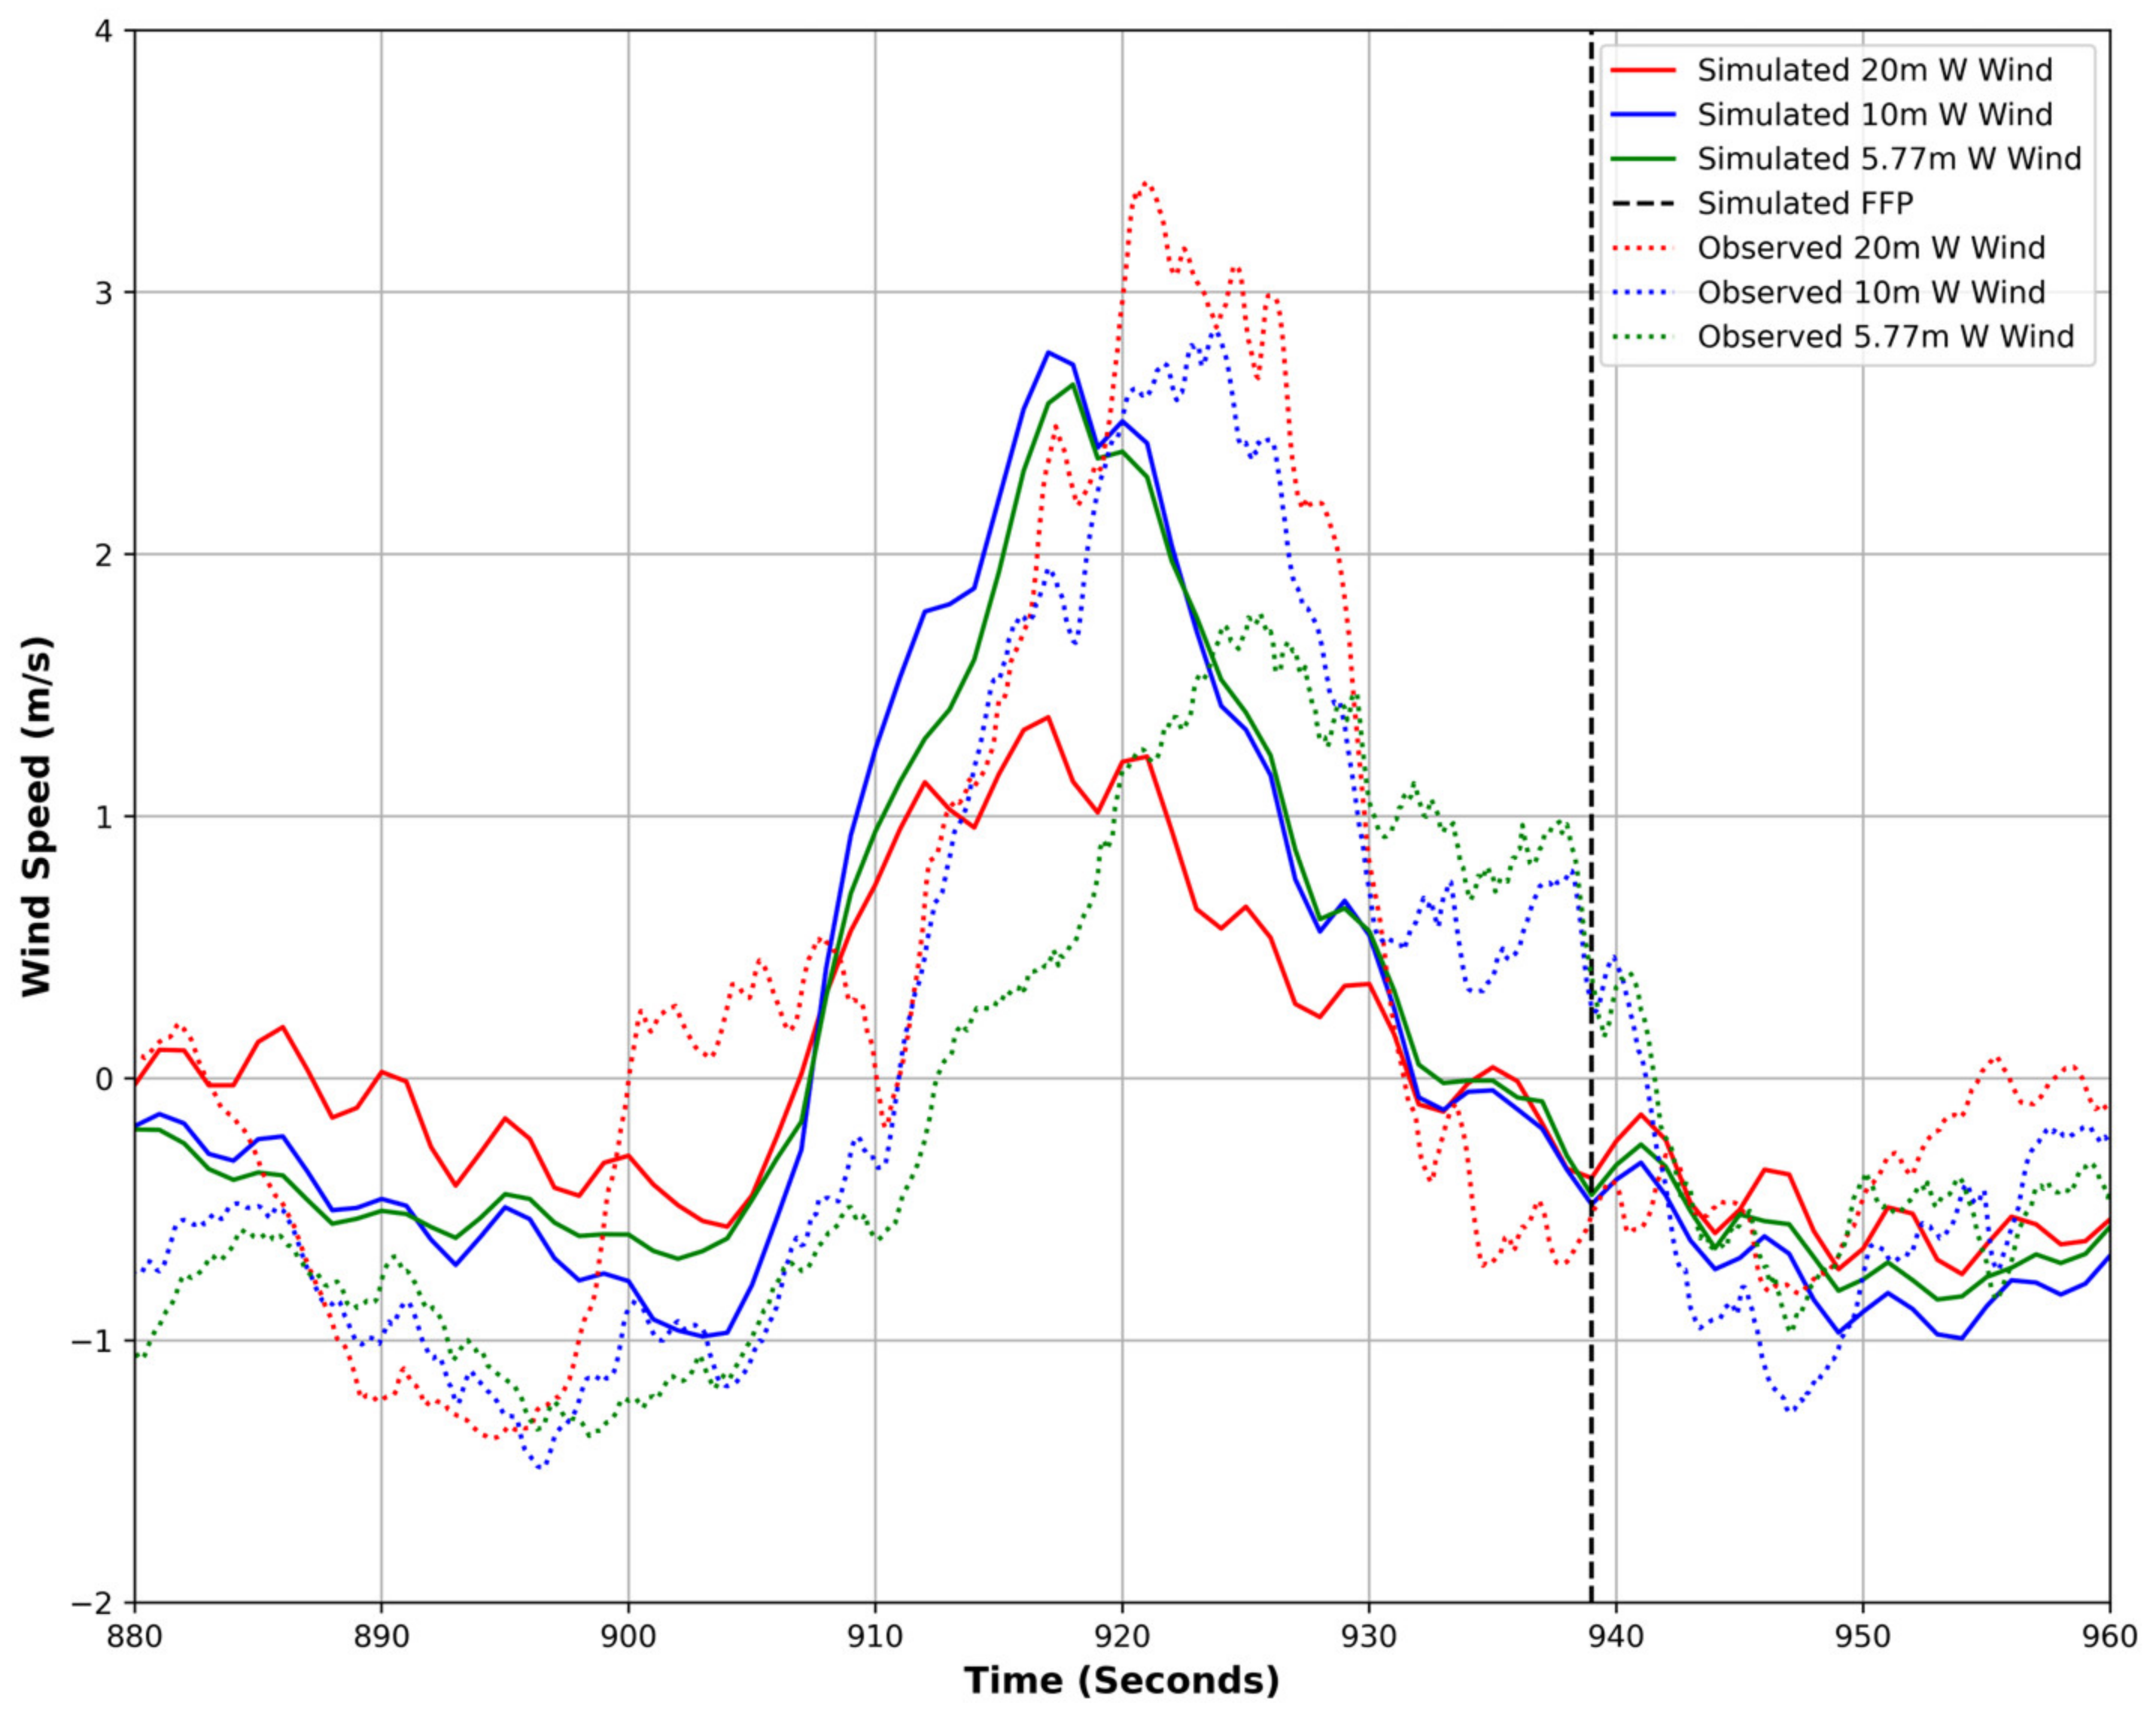
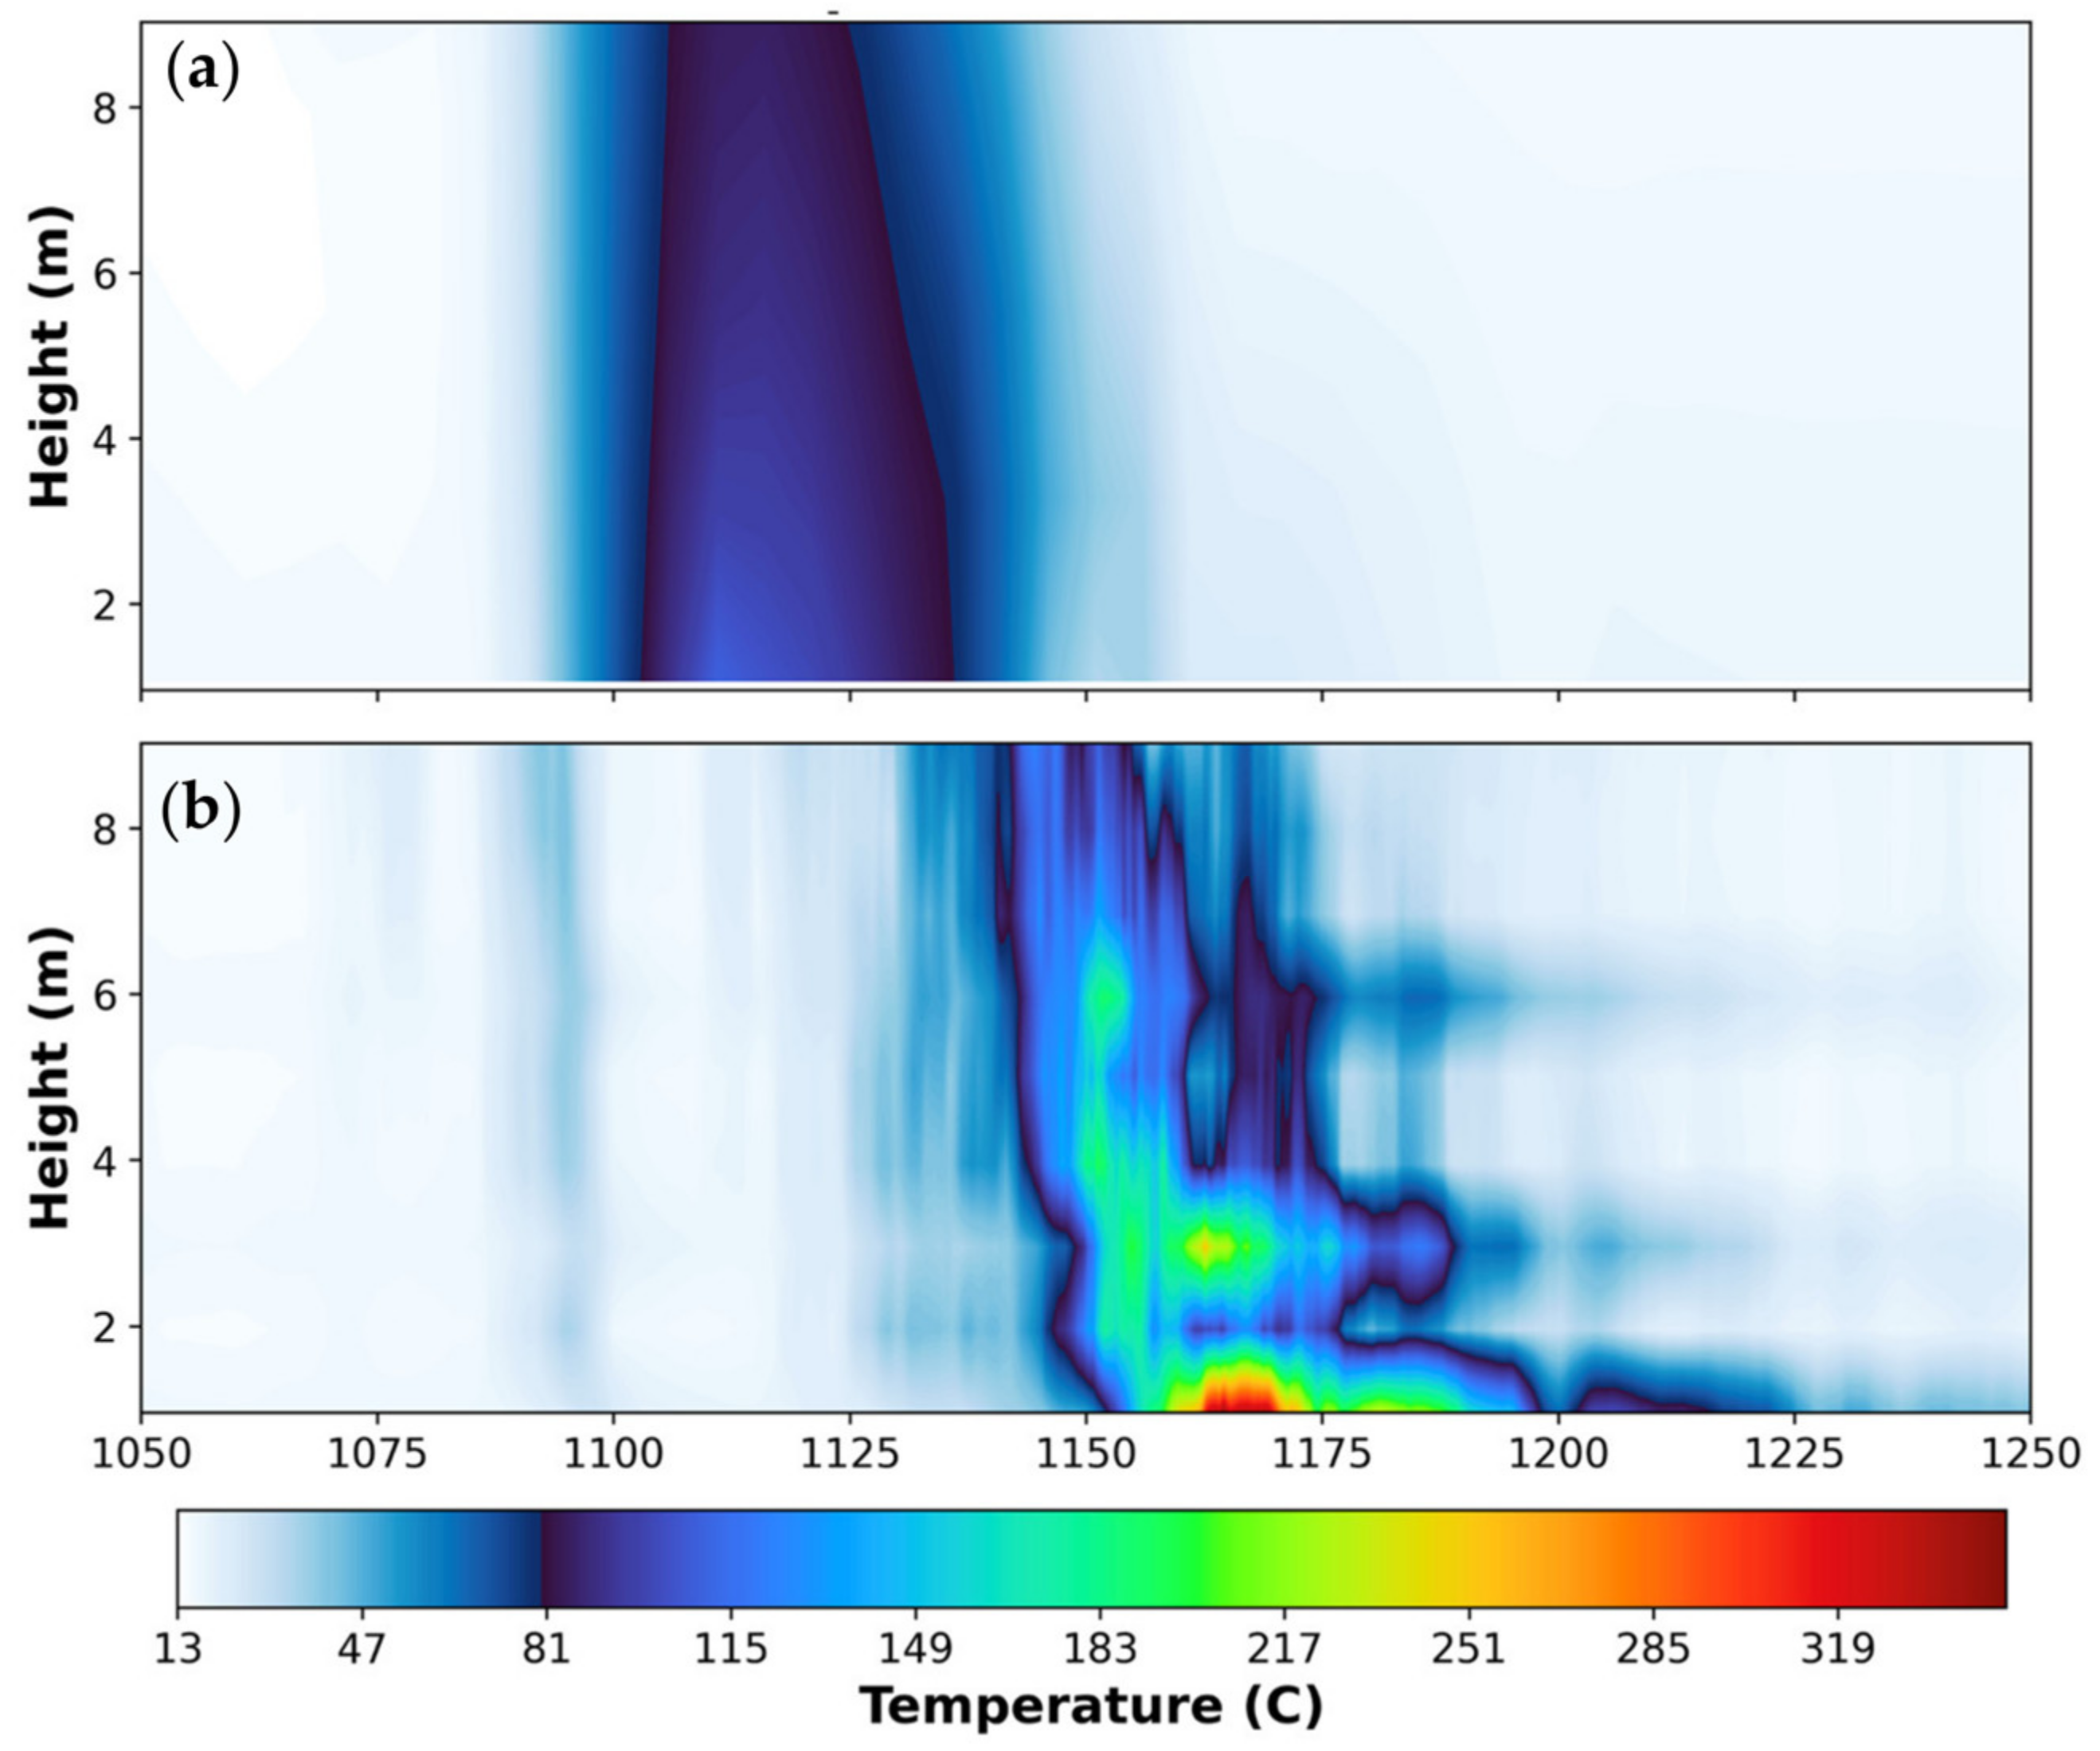
Figure 2 was equipped with sonic anemometers at different heights that recorded both temperature and wind, as well as thermocouples that recorded temperature. These anemometers are capable of measuring temperatures over 350 °C as they were specifically designed and calibrated for fire applications. Data from these anemometers were used to initialize the model and validate the simulated winds. The peak temperature from sonic anemometers was used to verify the timing of the FFP at the tower locations. The thermocouples provided information on the duration as well as the vertical structure of the thermal perturbation, which was used to verify the simulated temperature profile at each tower. A full list of the instruments can be found in [
5].
The simulation started at 14:50 CST and the initial 14 min were used to spin up the atmospheric model before the fire ignition. The fire was ignited using two walking ignitions starting at 15:04:08 CST, representing the GPS-ed firefighters’ paths. The simulation was run for 40 min (14:50–15:30 CST) which was sufficient to simulate the FFP through the locations of all meteorological towers. To quantify fire-induced circulations after completing the coupled simulation, another identical simulation but with the fire-induced fluxes turned off was executed. The results from this run, referred to as a one-way coupled simulation, were subtracted from the fully coupled simulation to quantify fire-induced winds and thermal perturbations.
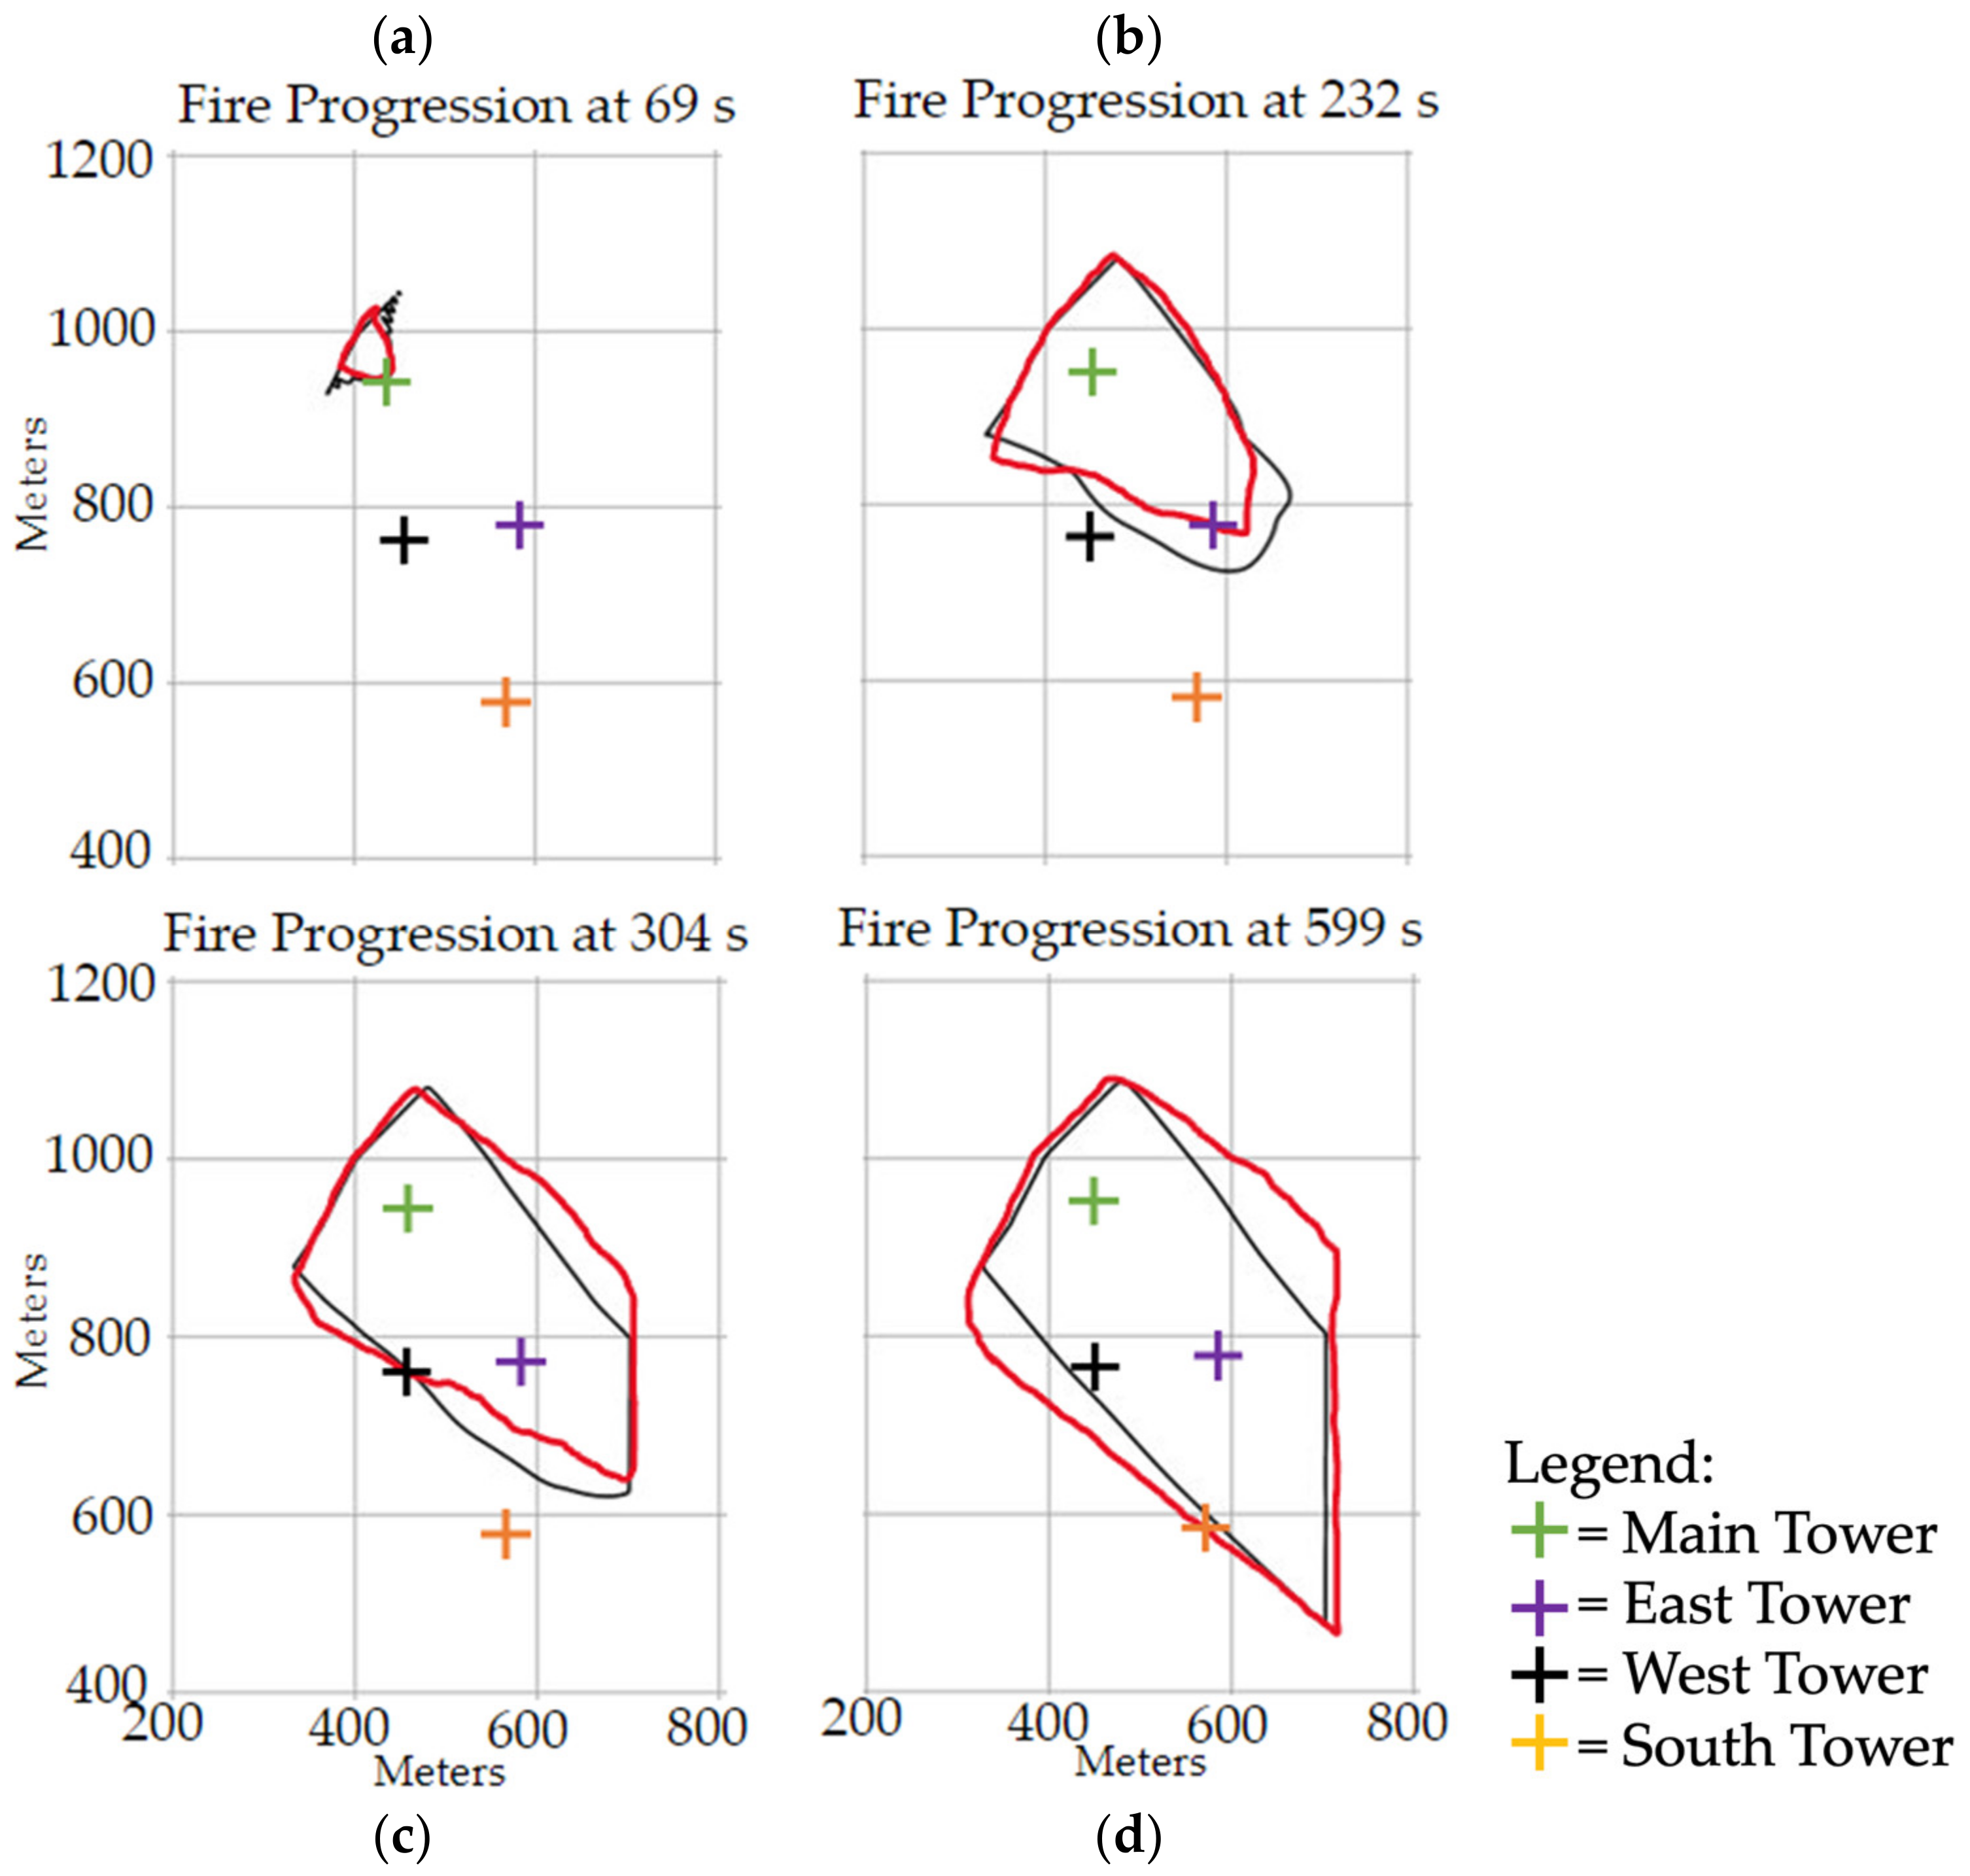
The towers located within the burn plot provided observations of the fire ROS as well as the circulations at both the flanks and the head of fire. The East Tower (ET) and Main Tower (MT) sampled the head fire, while the West Tower (WT) and South tower (ST) sampled the flank of the fire. Therefore, the towers provided not only an indication of the ROS, but also sampled the fire-induced circulations at the head and at the flanks of the fire. The observational data along with the numerical experiments were used to investigate and contrast fire effects at the head and at the flanks.
4. Conclusions
In this study, we used the FF2 observations as well as numerical simulations performed with WRF-SFIRE to investigate the fire-induced perturbations in winds and temperature at the fire head and at the flanks during moderate winds (10–12 m/s). To determine the fire-induced circulations, two idealized simulations were used. The two-way coupled one where the fire heat and moisture fluxes were fed into the atmosphere and the one-way coupled, in which atmospheric winds were used to drive the fire propagation, but fire fluxes were not injected into the atmosphere. The differences between these simulations allowed us to quantify the fire effects on the local meteorology near the head of the fire and near the flanks.
The comparison between the simulated and observed fire progression indicates that the model realistically captured the timing of the FFP through the MT and the initial ROS matched nearly perfectly with the observations (1.04 m/s compared to 1.00 m/s). The rate of fire head progression towards the ET was overestimated by about 8.6% (1.45 m/s compared to 1.33 m/s). However, later into the experiment, the timing of the flank passages through the west and south towers were simulated with smaller accuracy, most probably due to the wind direction shift that happened during the burn but could not be implemented in the idealized simulation. This resulted in differences in the shape of the fire between the simulation and observations later in the simulation, and errors in the simulated timing of the flank passage through the short towers.
However, our main focus was on the vertical structures of the plume at the MT and ET which were captured realistically in terms of the temperature range, as well as vertical and horizontal plume extent. Despite discrepancies between the simulated lateral fire extent and observations, the simulation accurately predicted the structure of the thermal plume with temperatures profiles similar to the observed temperatures at the head of the fire. The widths of the thermal plume were resolved realistically. These thermal plumes then generated updrafts which changed both the horizontal and vertical wind velocities near the fire front. However, the analysis of the vertical velocities indicates that during the FFP through the first tower (about 60 s from the ignition start) the flow was not fully resolved yet.
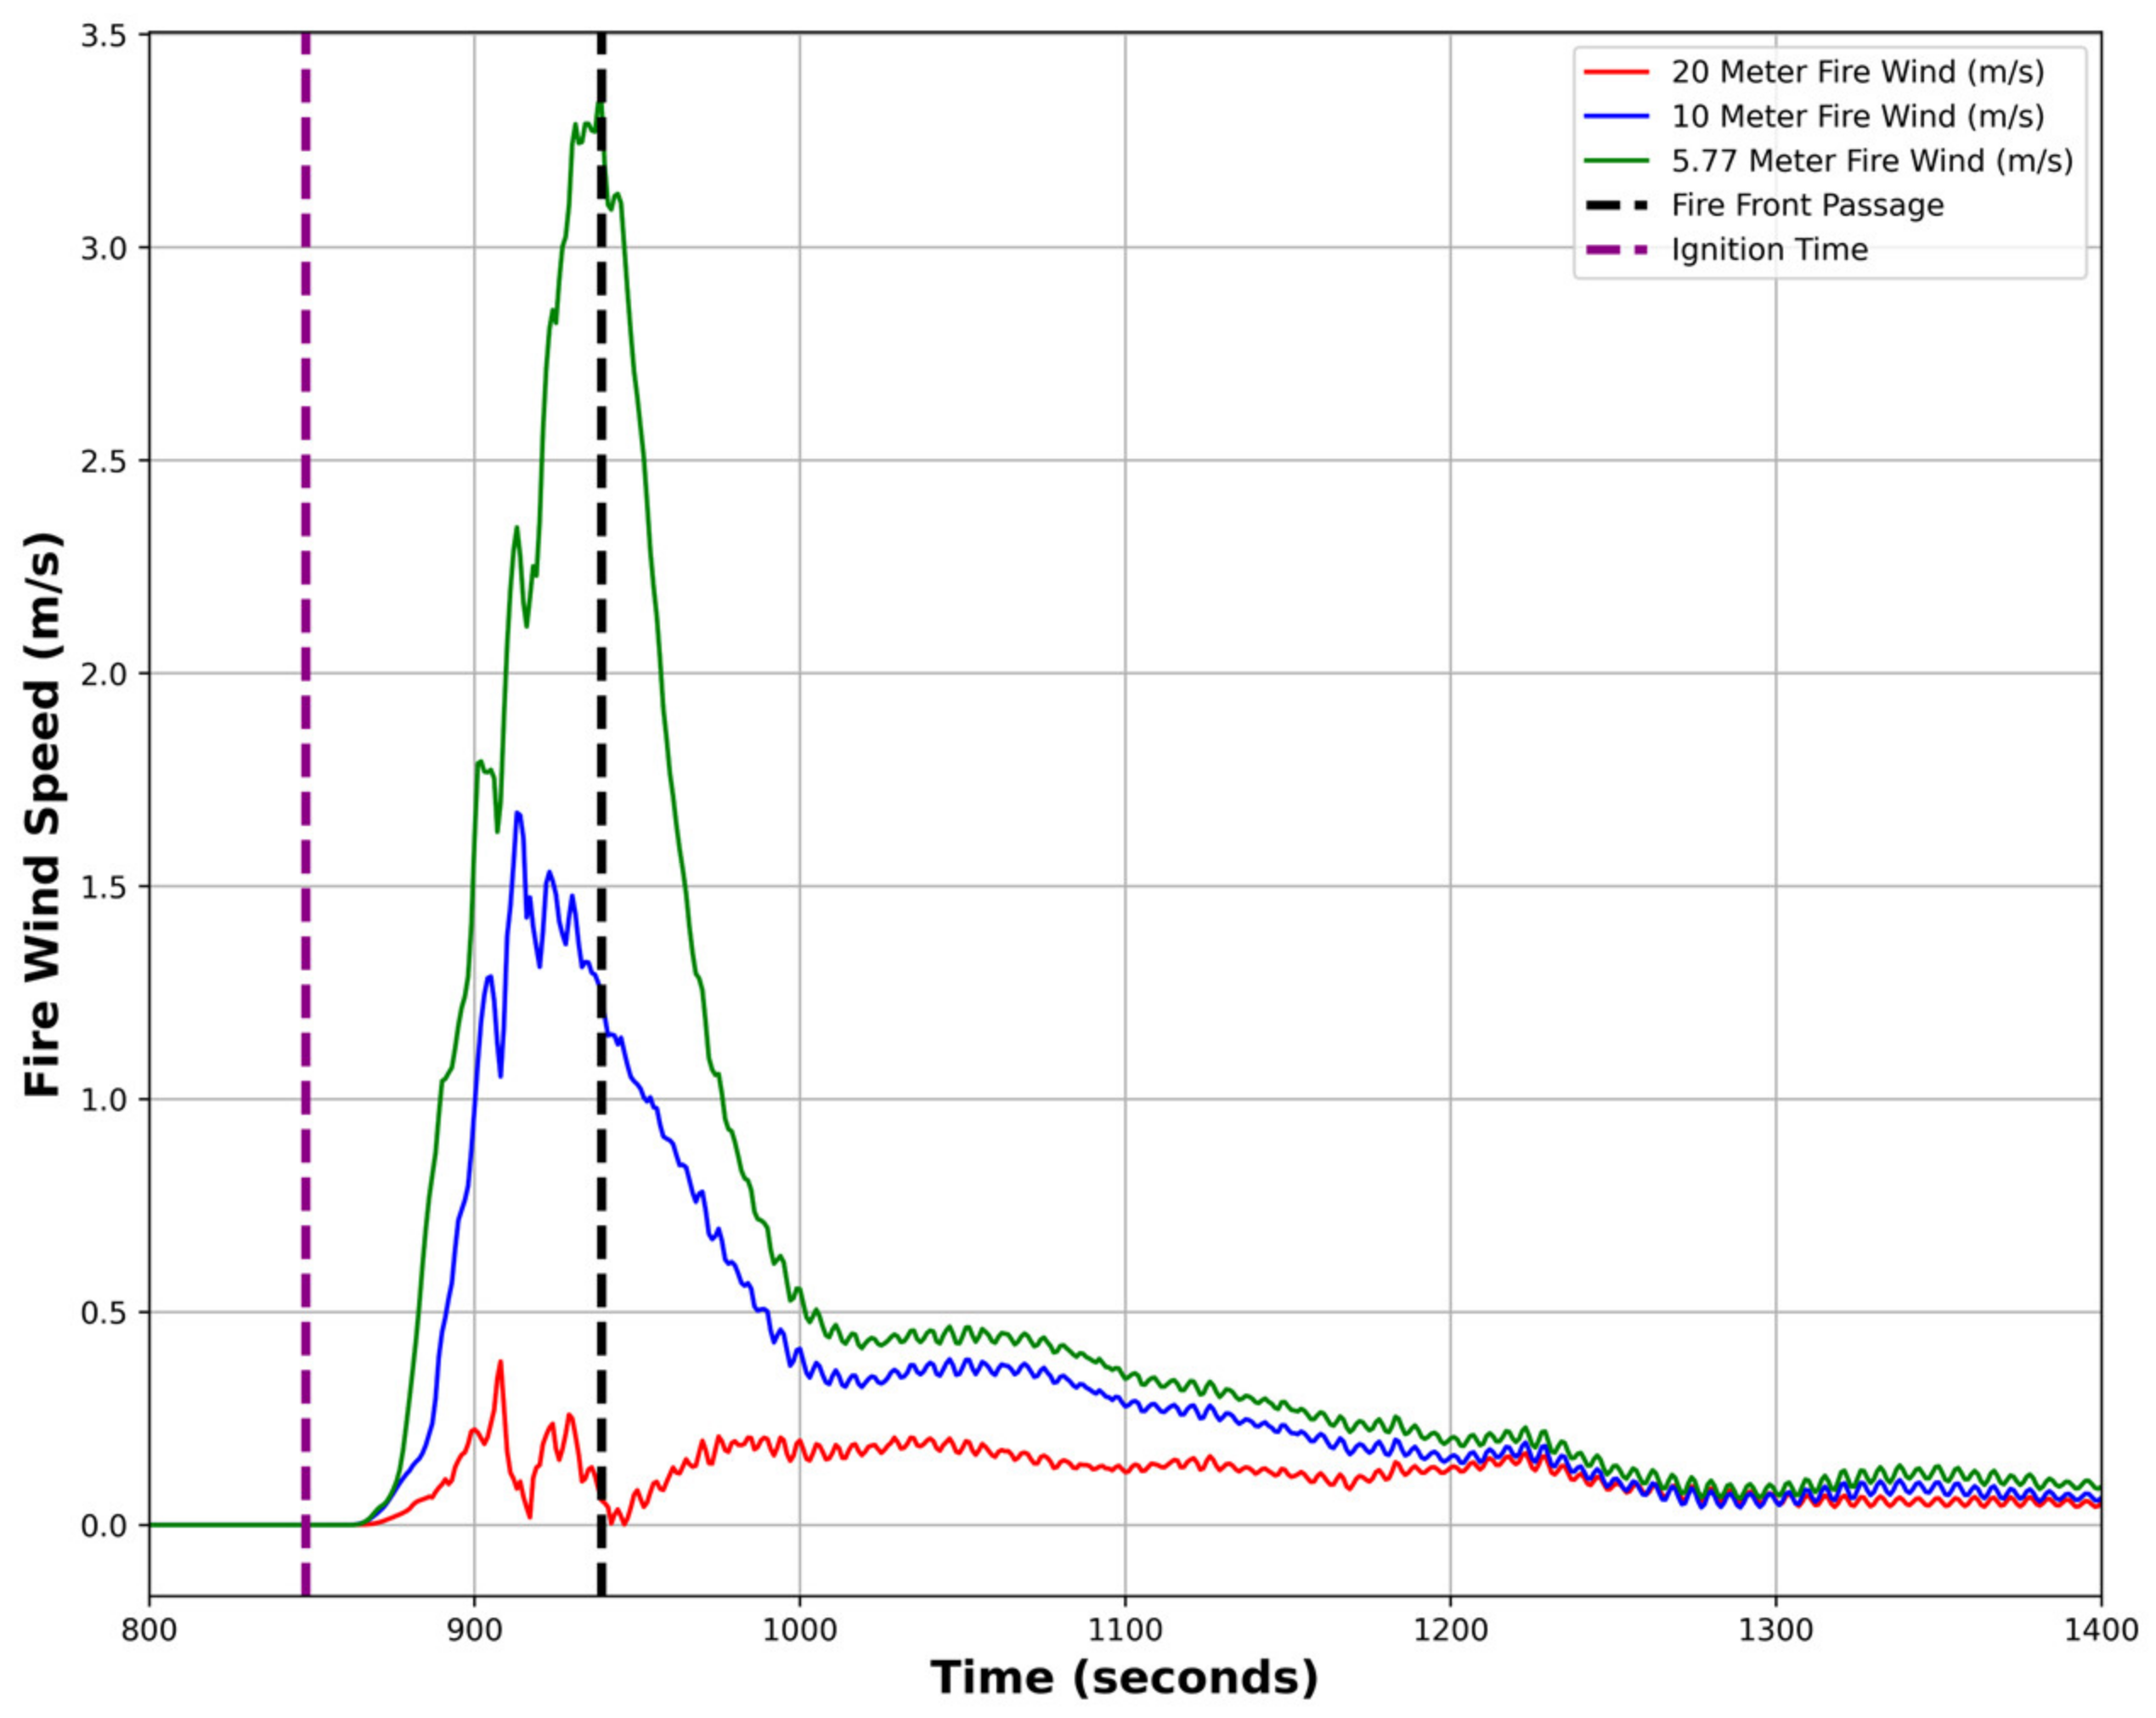
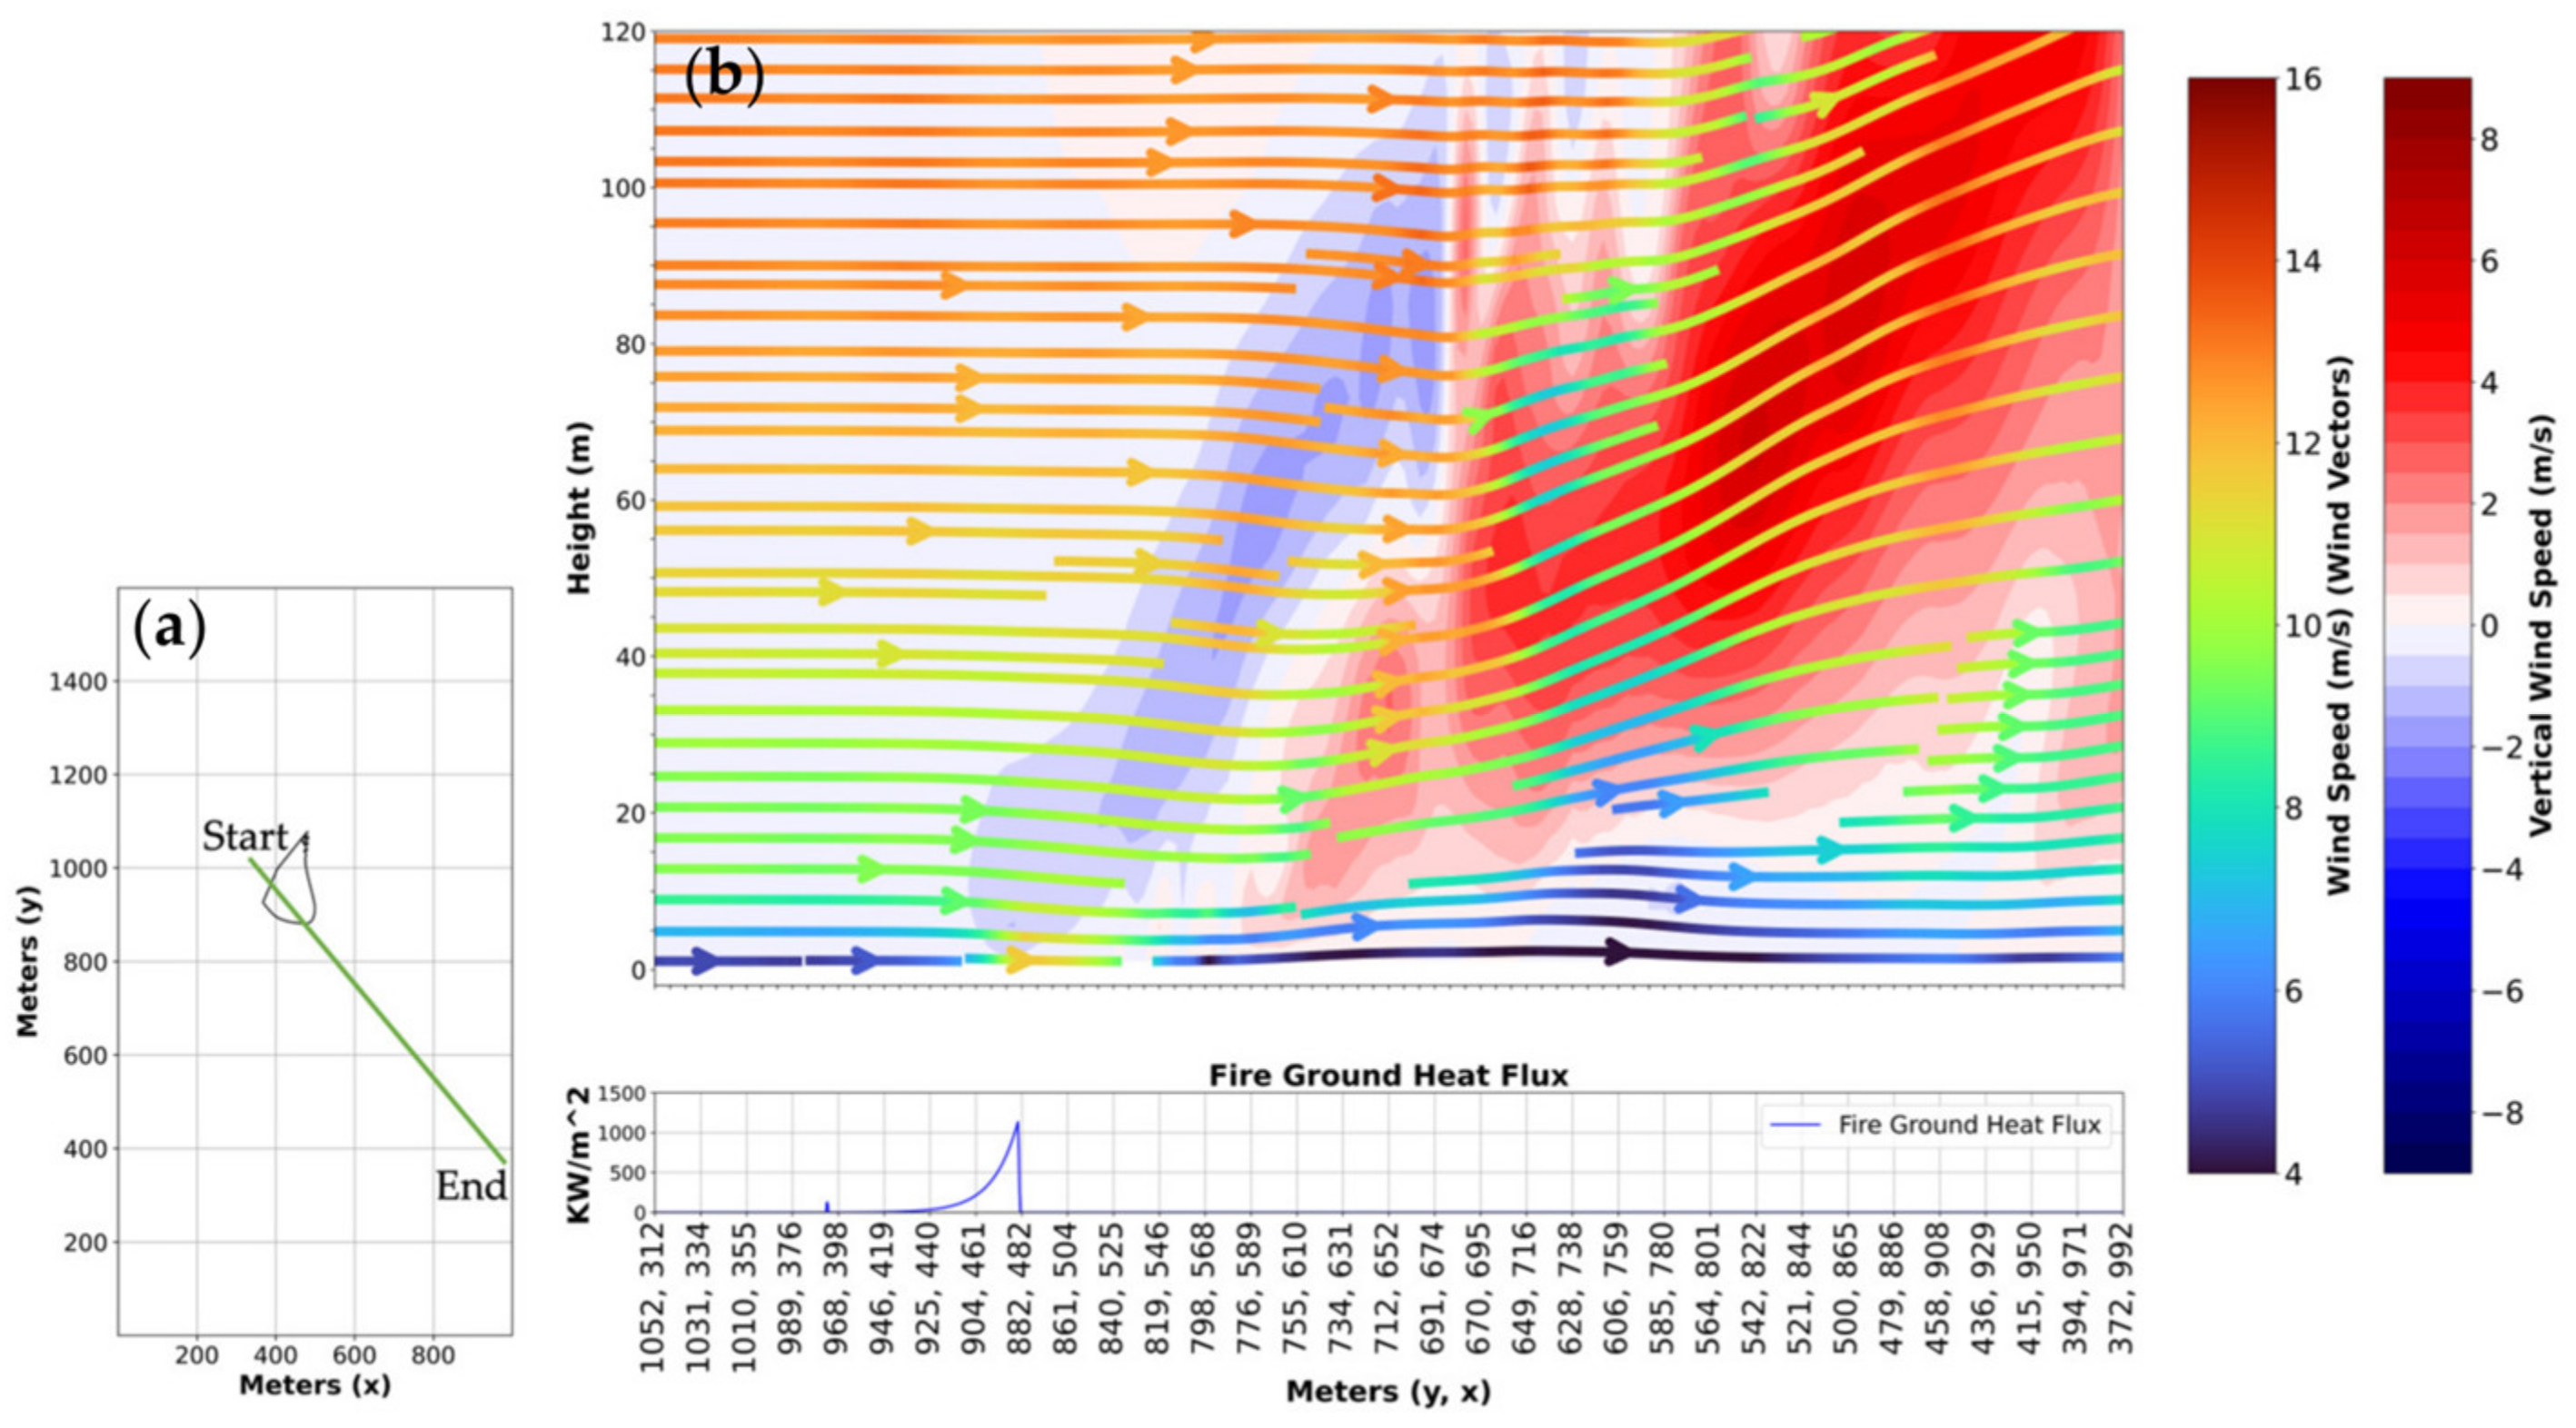
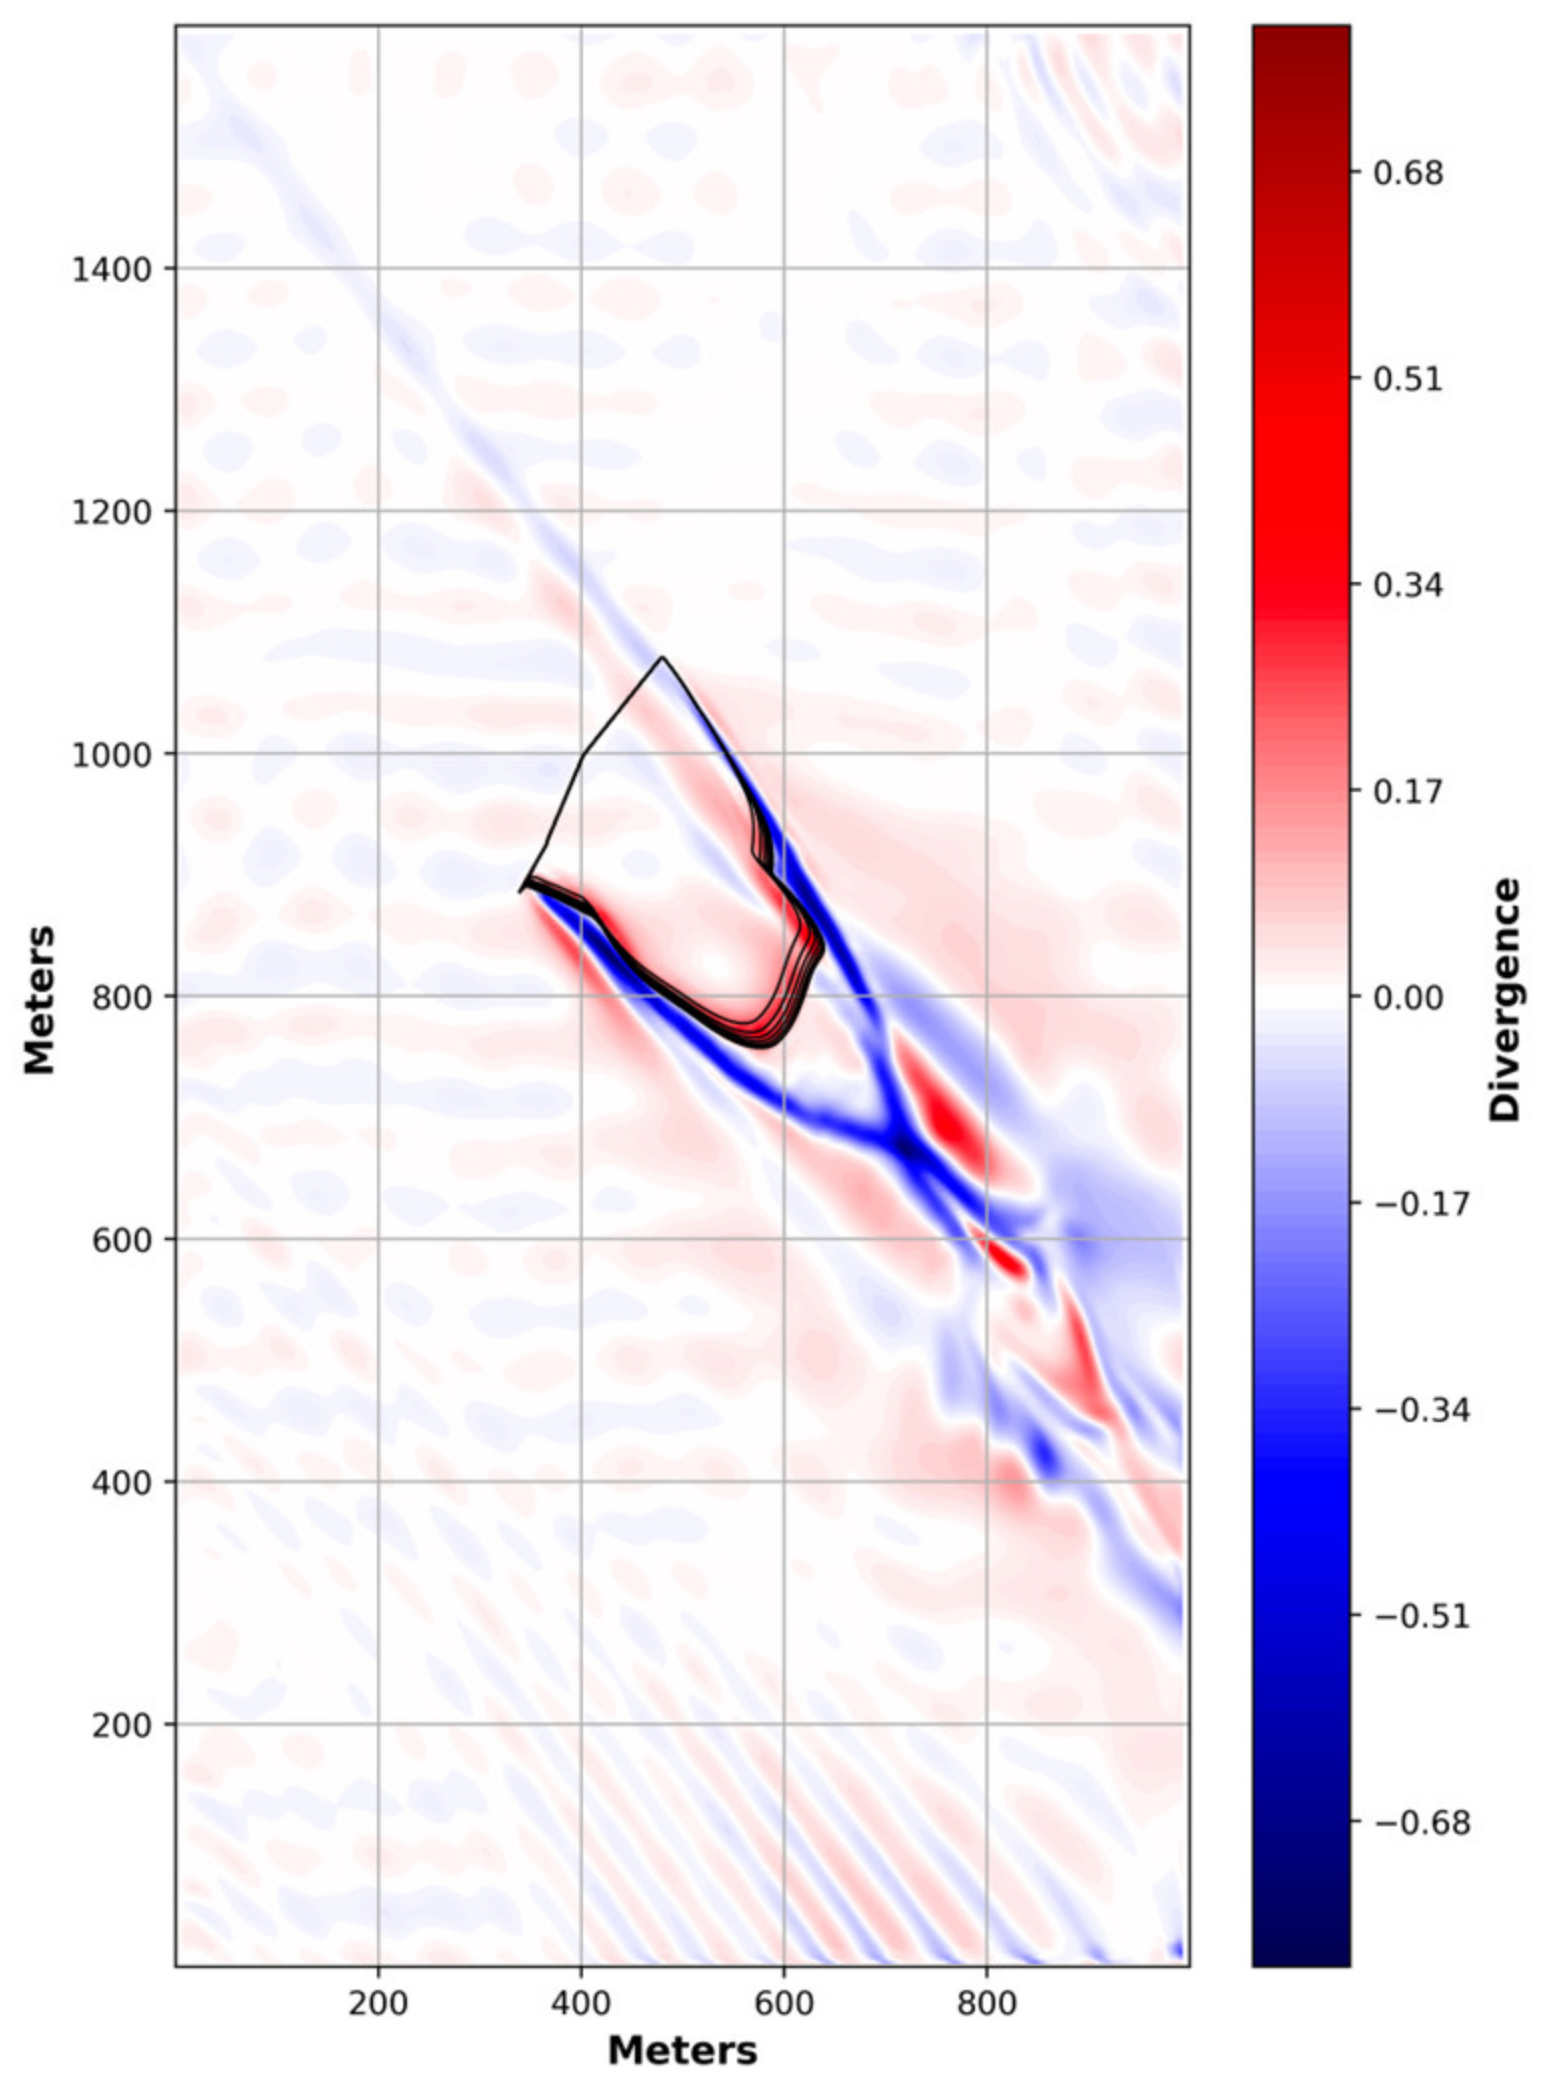
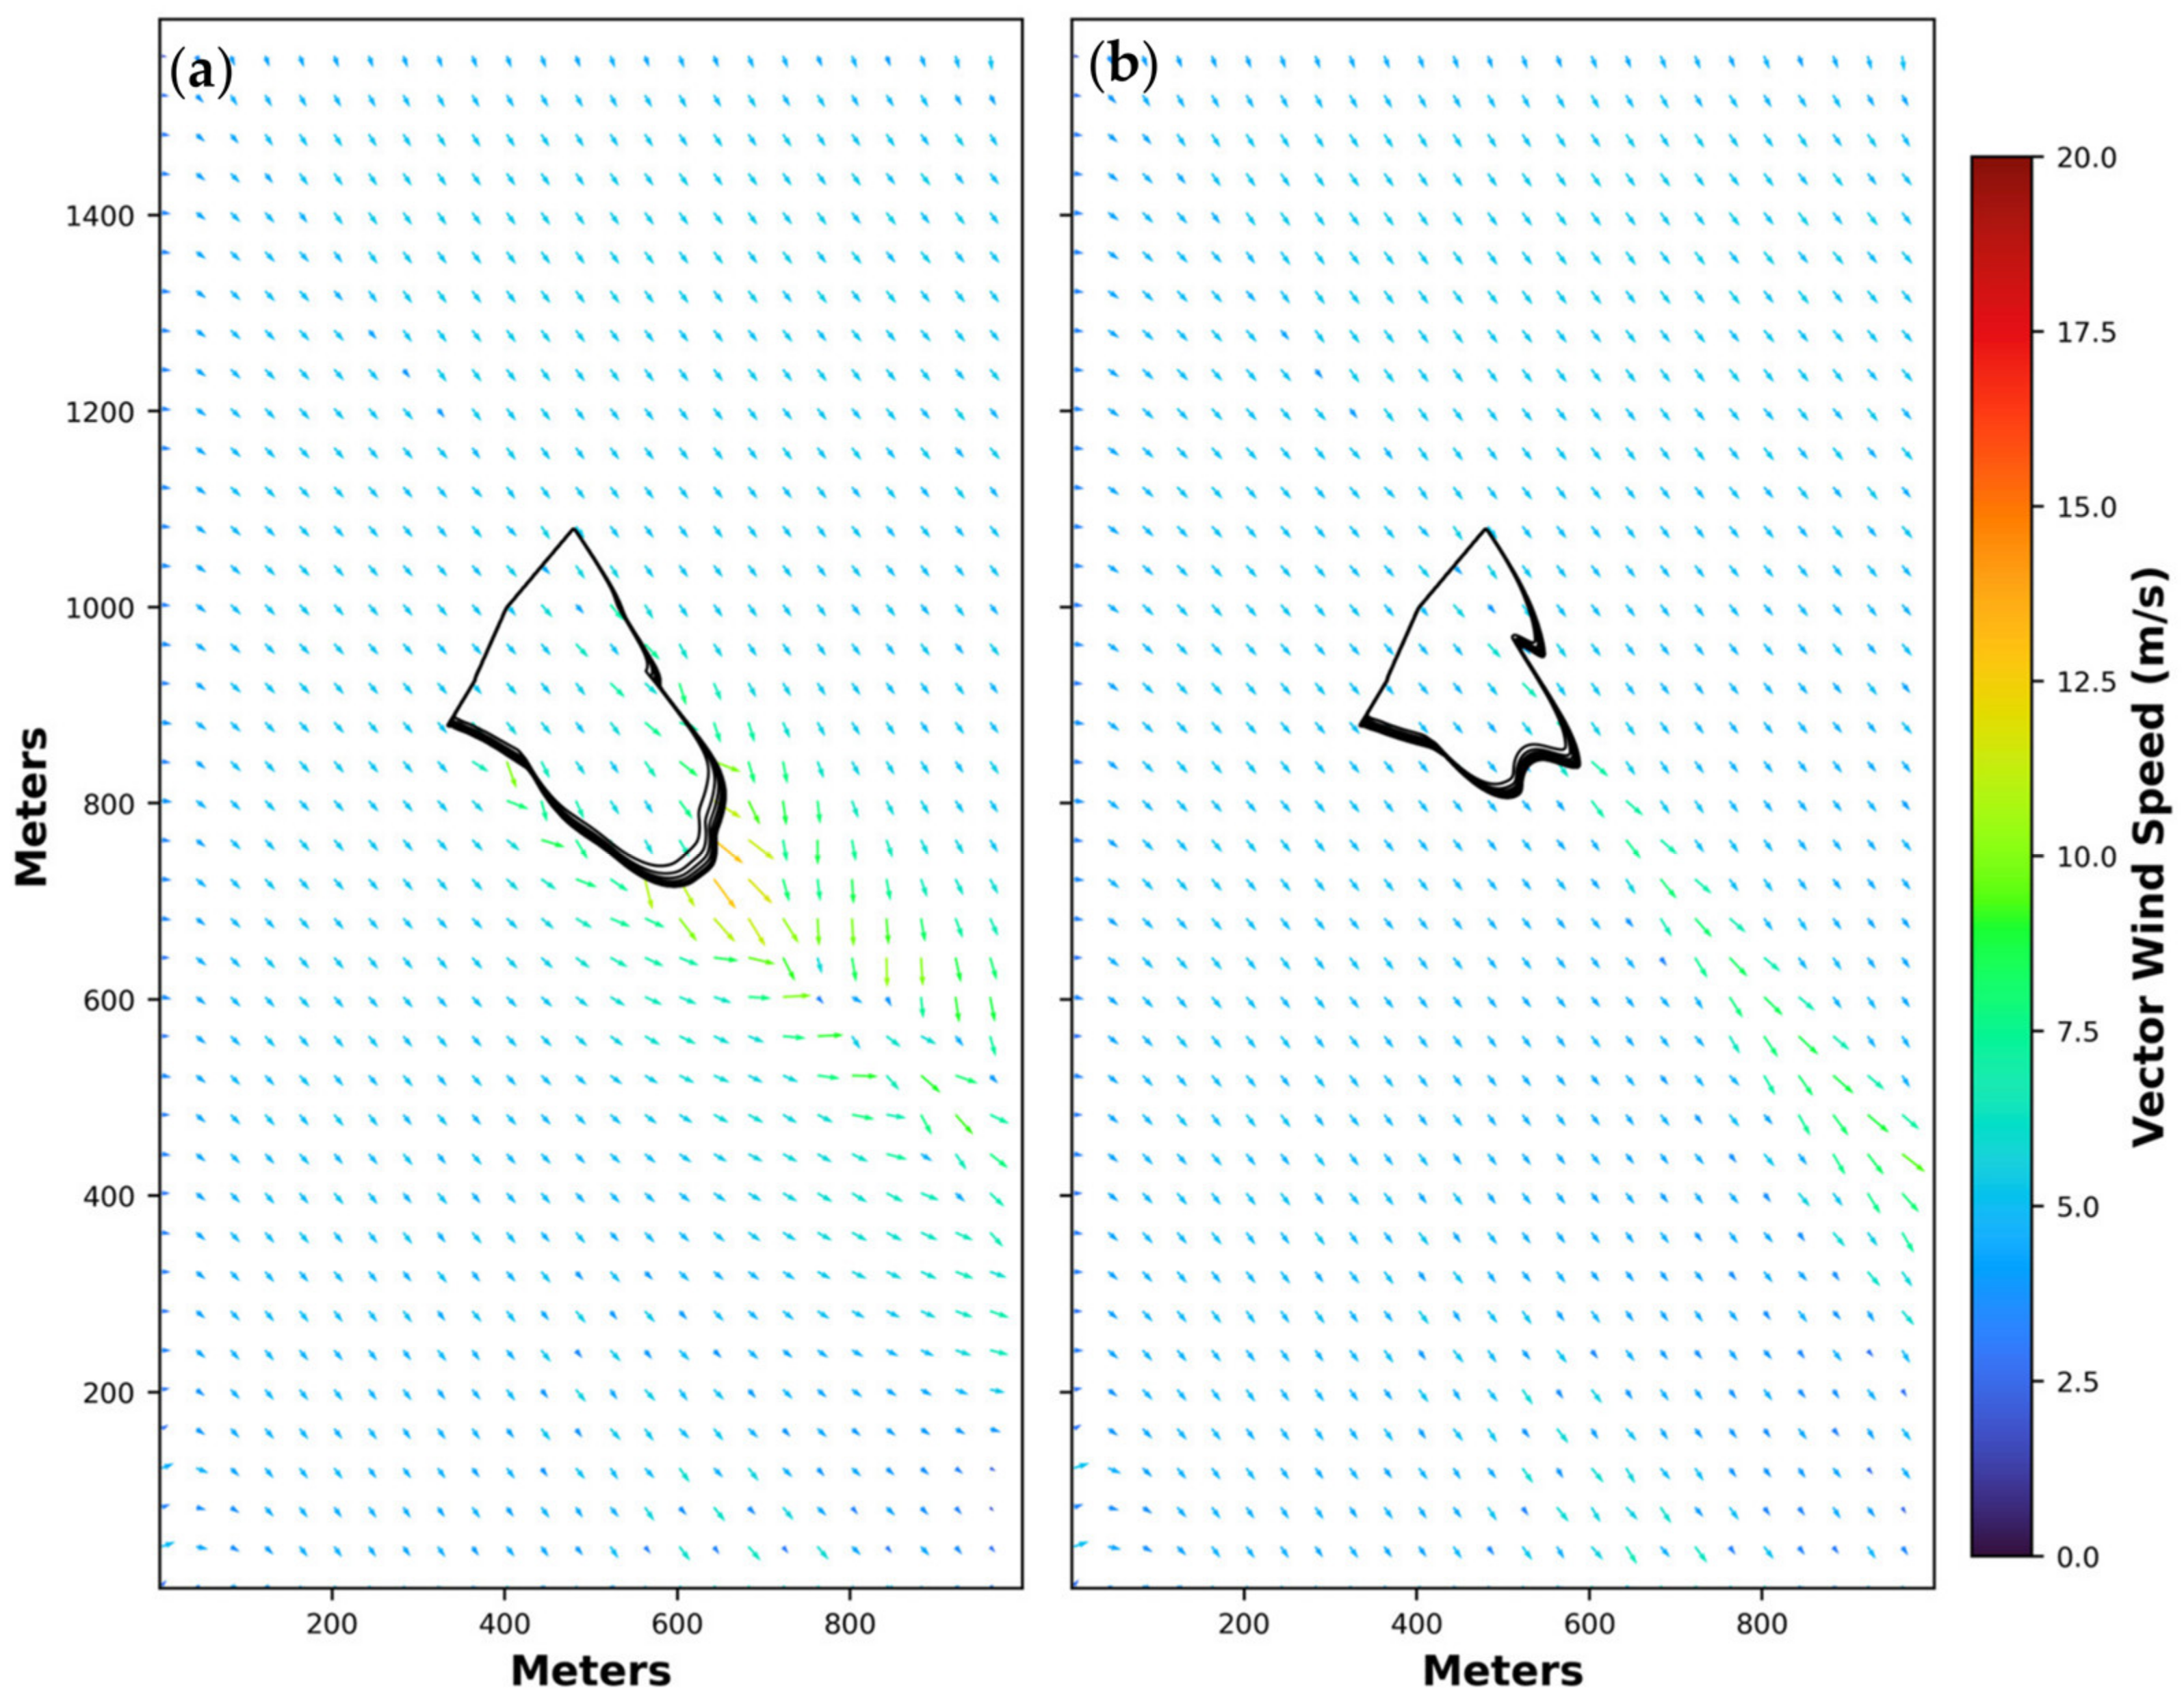
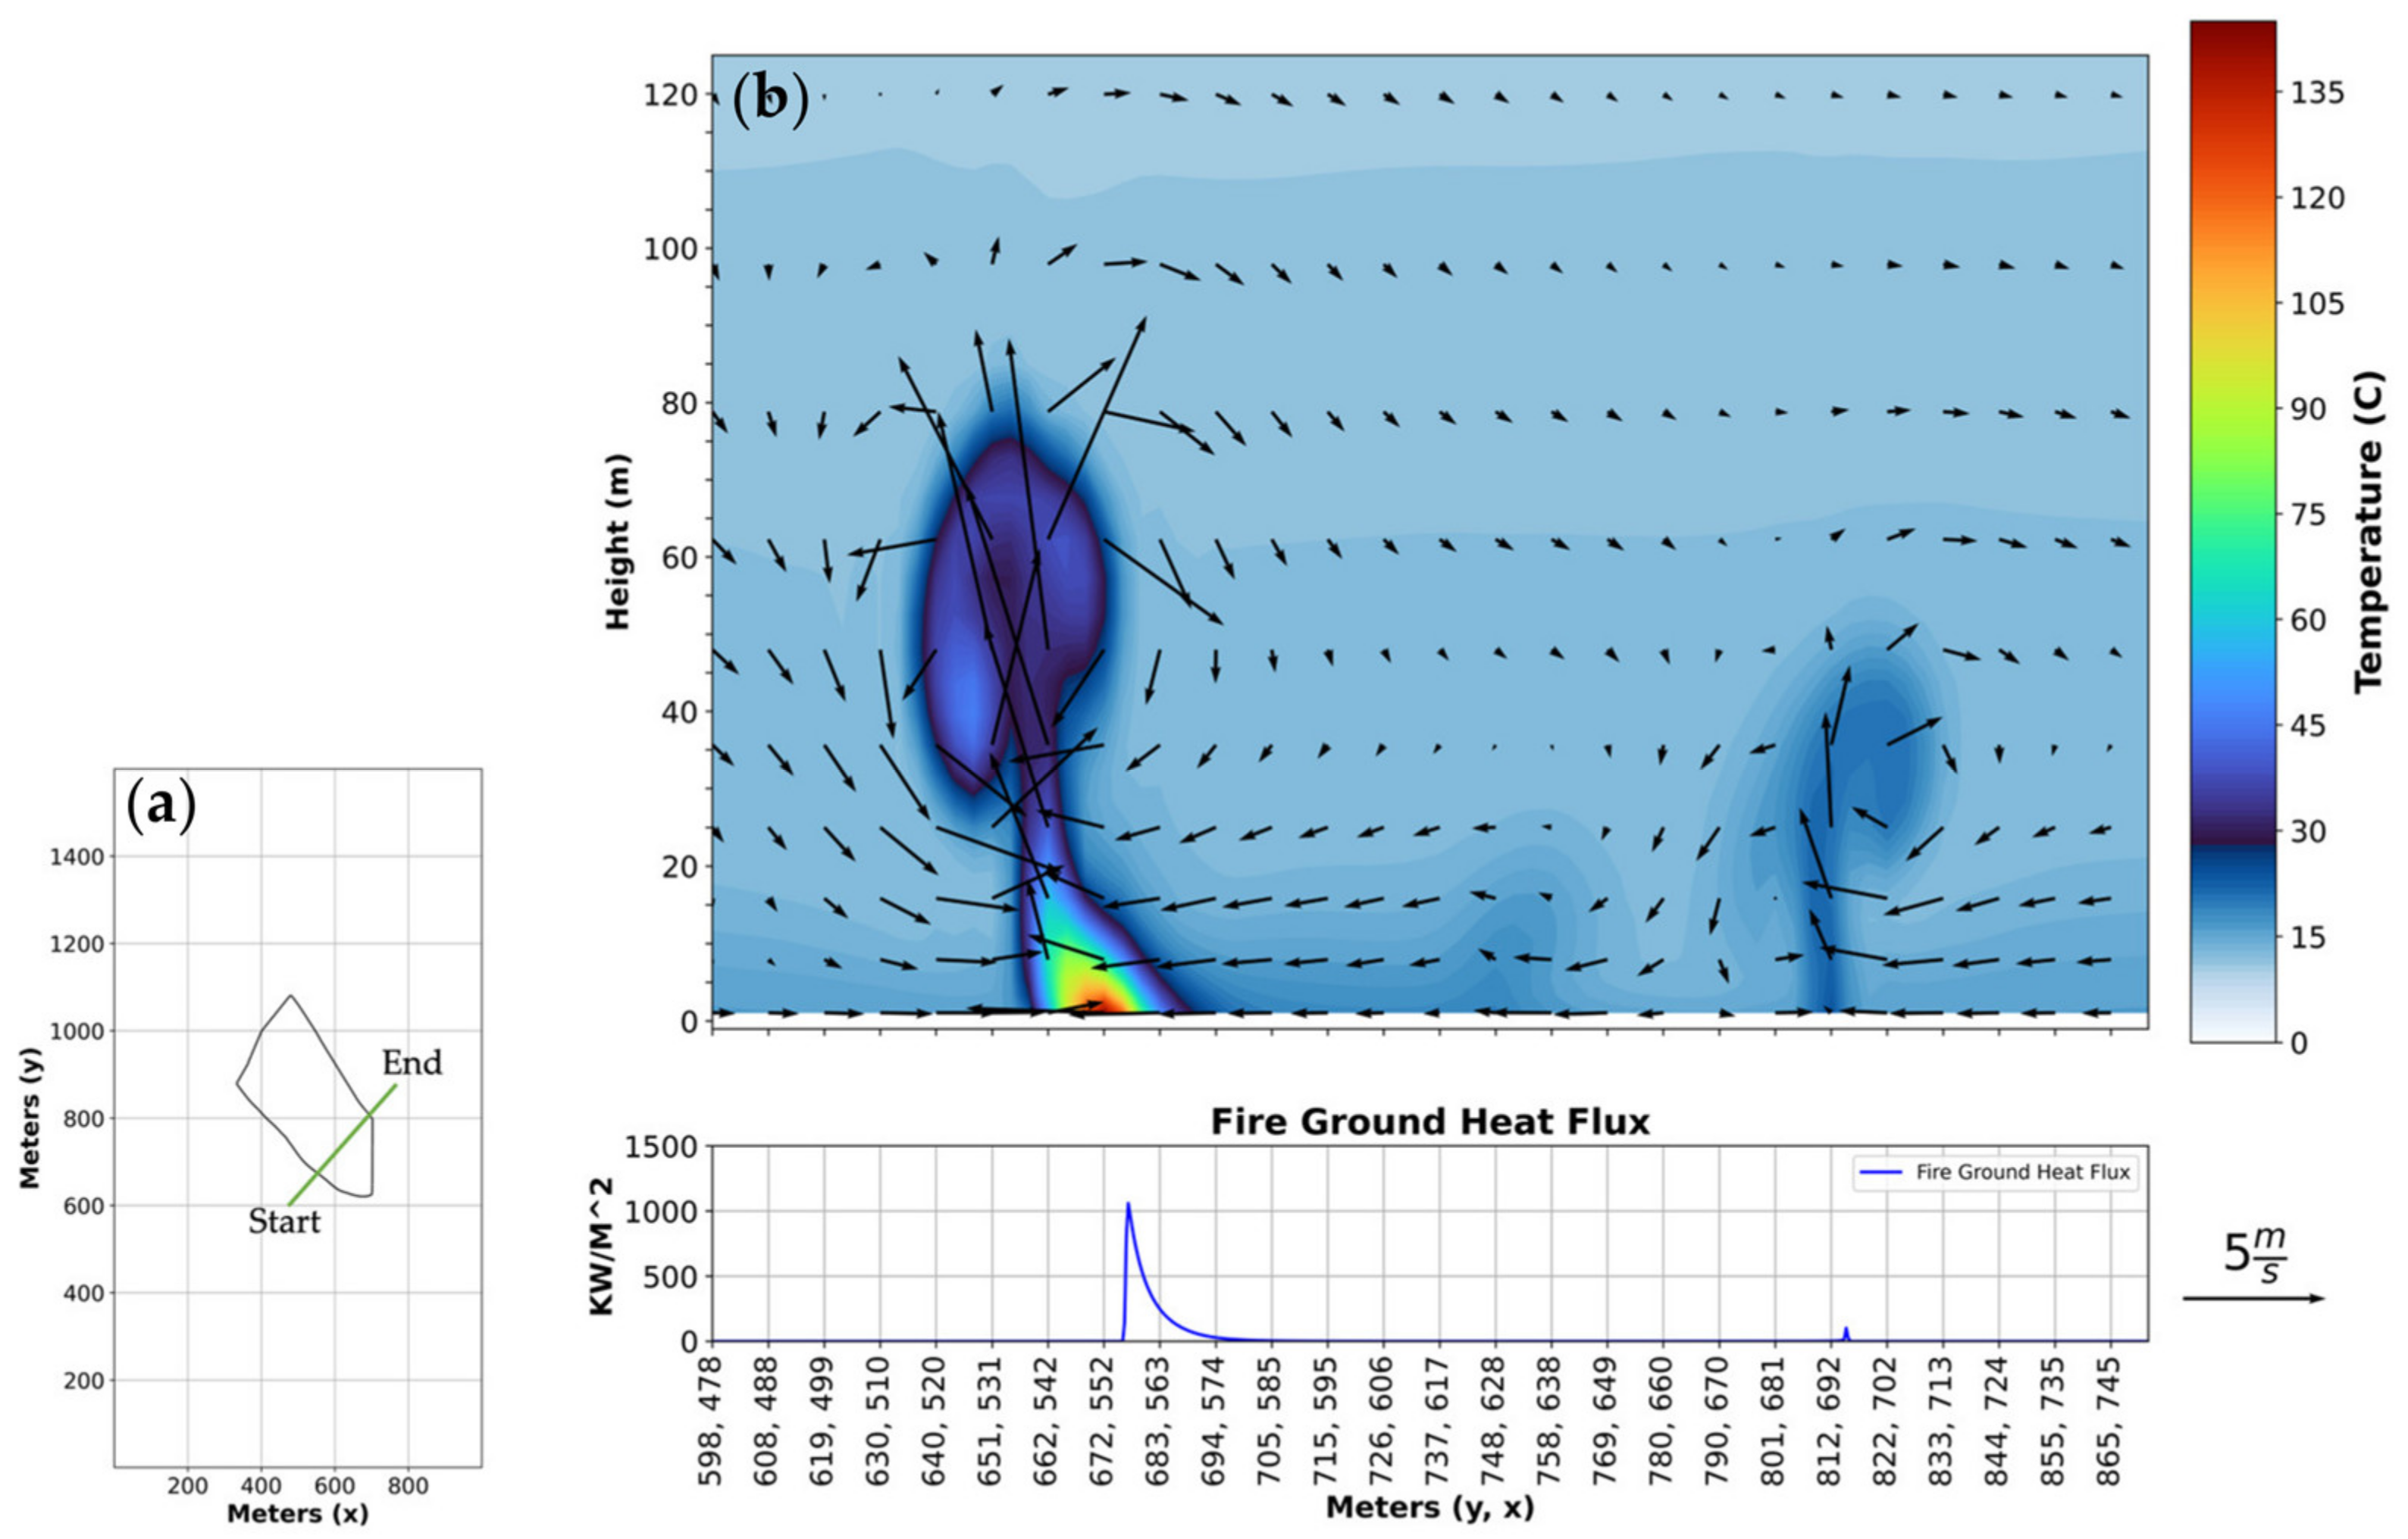
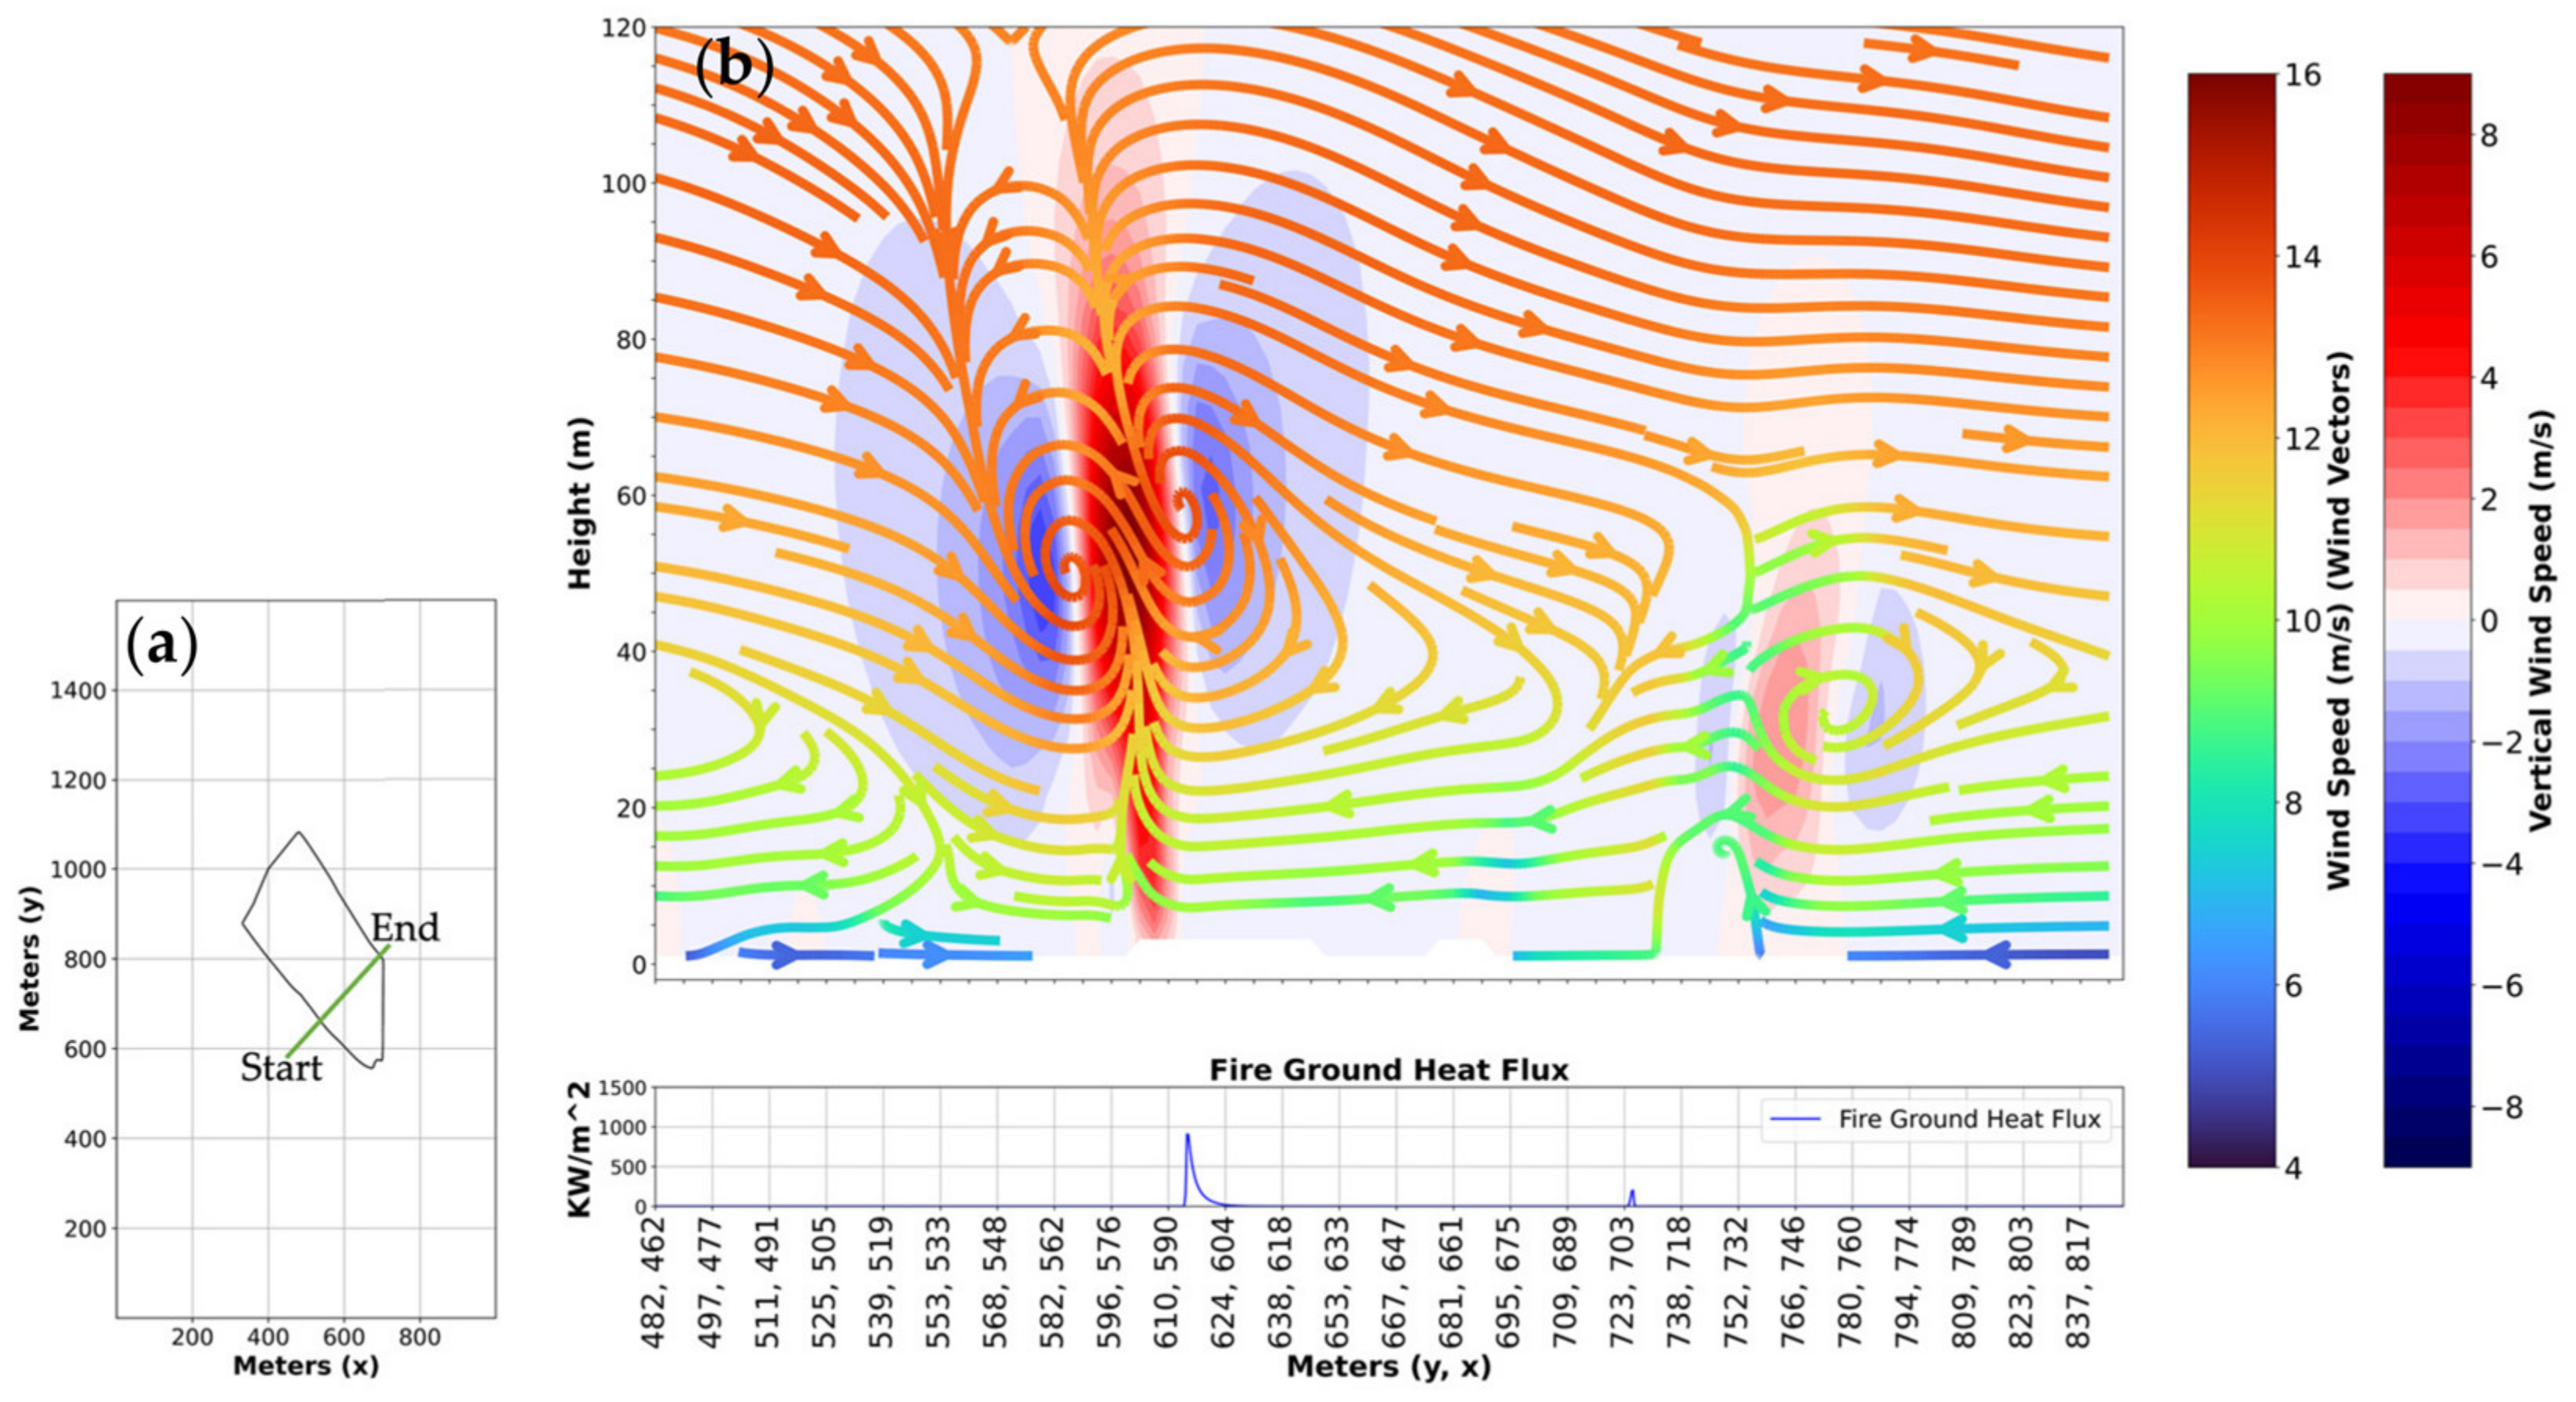
The numerical simulations were used to analyze the fire-induced circulations at the head and flanks of the fire, and to investigate their impact on fire propagation. At the fire head, the strongest fire winds occurred near the surface and decreased with height. As the fire heated up the surrounding atmosphere, it created hot air masses which were driven up due to buoyant forcing. Consequently, this forcing generated updrafts as strong as 6.1 m/s, which were pushed ahead of the fire front by the ambient wind. Strong surface convergence occurred ahead of the fire front and induced a cross-fire flow. This flow directly affected the ROS, as the accelerated winds over the fire increased the rate of spread. The horizontal fire-induced winds reached 3.3 m/s and increased the ambient winds by around 37.3%. The uncoupled simulations confirmed that without this effect, the fire would spread approximately 36.2% slower. This effect also led to the reversal of the typical logarithmic vertical wind profile during the FFP leading to the wind speed being the strongest at the surface and decreasing with height.
The inclusion of the two-way coupling, which allowed us to resolve fire winds, significantly improved the representation of fire behavior. The underestimation in the fire propagation speed in one-way coupled simulation reaching on average 43%, was reduced to just 6% in the two-way coupled run resolving the impact of fire winds on fire behavior.
The flanks of the fire did not spread as fast as the head fire since they did not generate as strong a cross-fire wind as the head, and the wind direction was approximately parallel to both flanks. As a result, the ROS values between two-way coupling and one-way coupling at the flanks were similar. The flanks of the fire experienced convergent flow at the fire front instead of ahead of the fire front like the head fire, which limited the cross-fire flow that could accelerate its progression.
It has to be noted that the presented results are based on the analysis of a relatively small grassfire. Although it is expected that the fire-induced circulations are similarly important during wildfires, the lack of comprehensive observations of micrometeorological conditions near the active wildfires precludes a rigorous analysis of fire–atmosphere interactions at much larger scales. However, as the data from larger experiments such as California Fire Dynamics Experiment (CalFiDe [
22]) become available, a similar analysis of the impact of fire–atmosphere interactions on the wildfire dynamic will become possible.
