
Precision of Visual Perception of Developing Fires

Abstract
:1. Precision of Visual Perception of Developing Fires
1.1. Role of Perception in Fire Safety Egress Models
1.2. Observer Perceptions of Developing Fires
1.3. Non-Symbolic Quantity Perception
1.4. Visual Perception of Dynamic Objects
1.5. The Present Study
2. Experiment 1
2.1. Methods
2.1.1. Participants
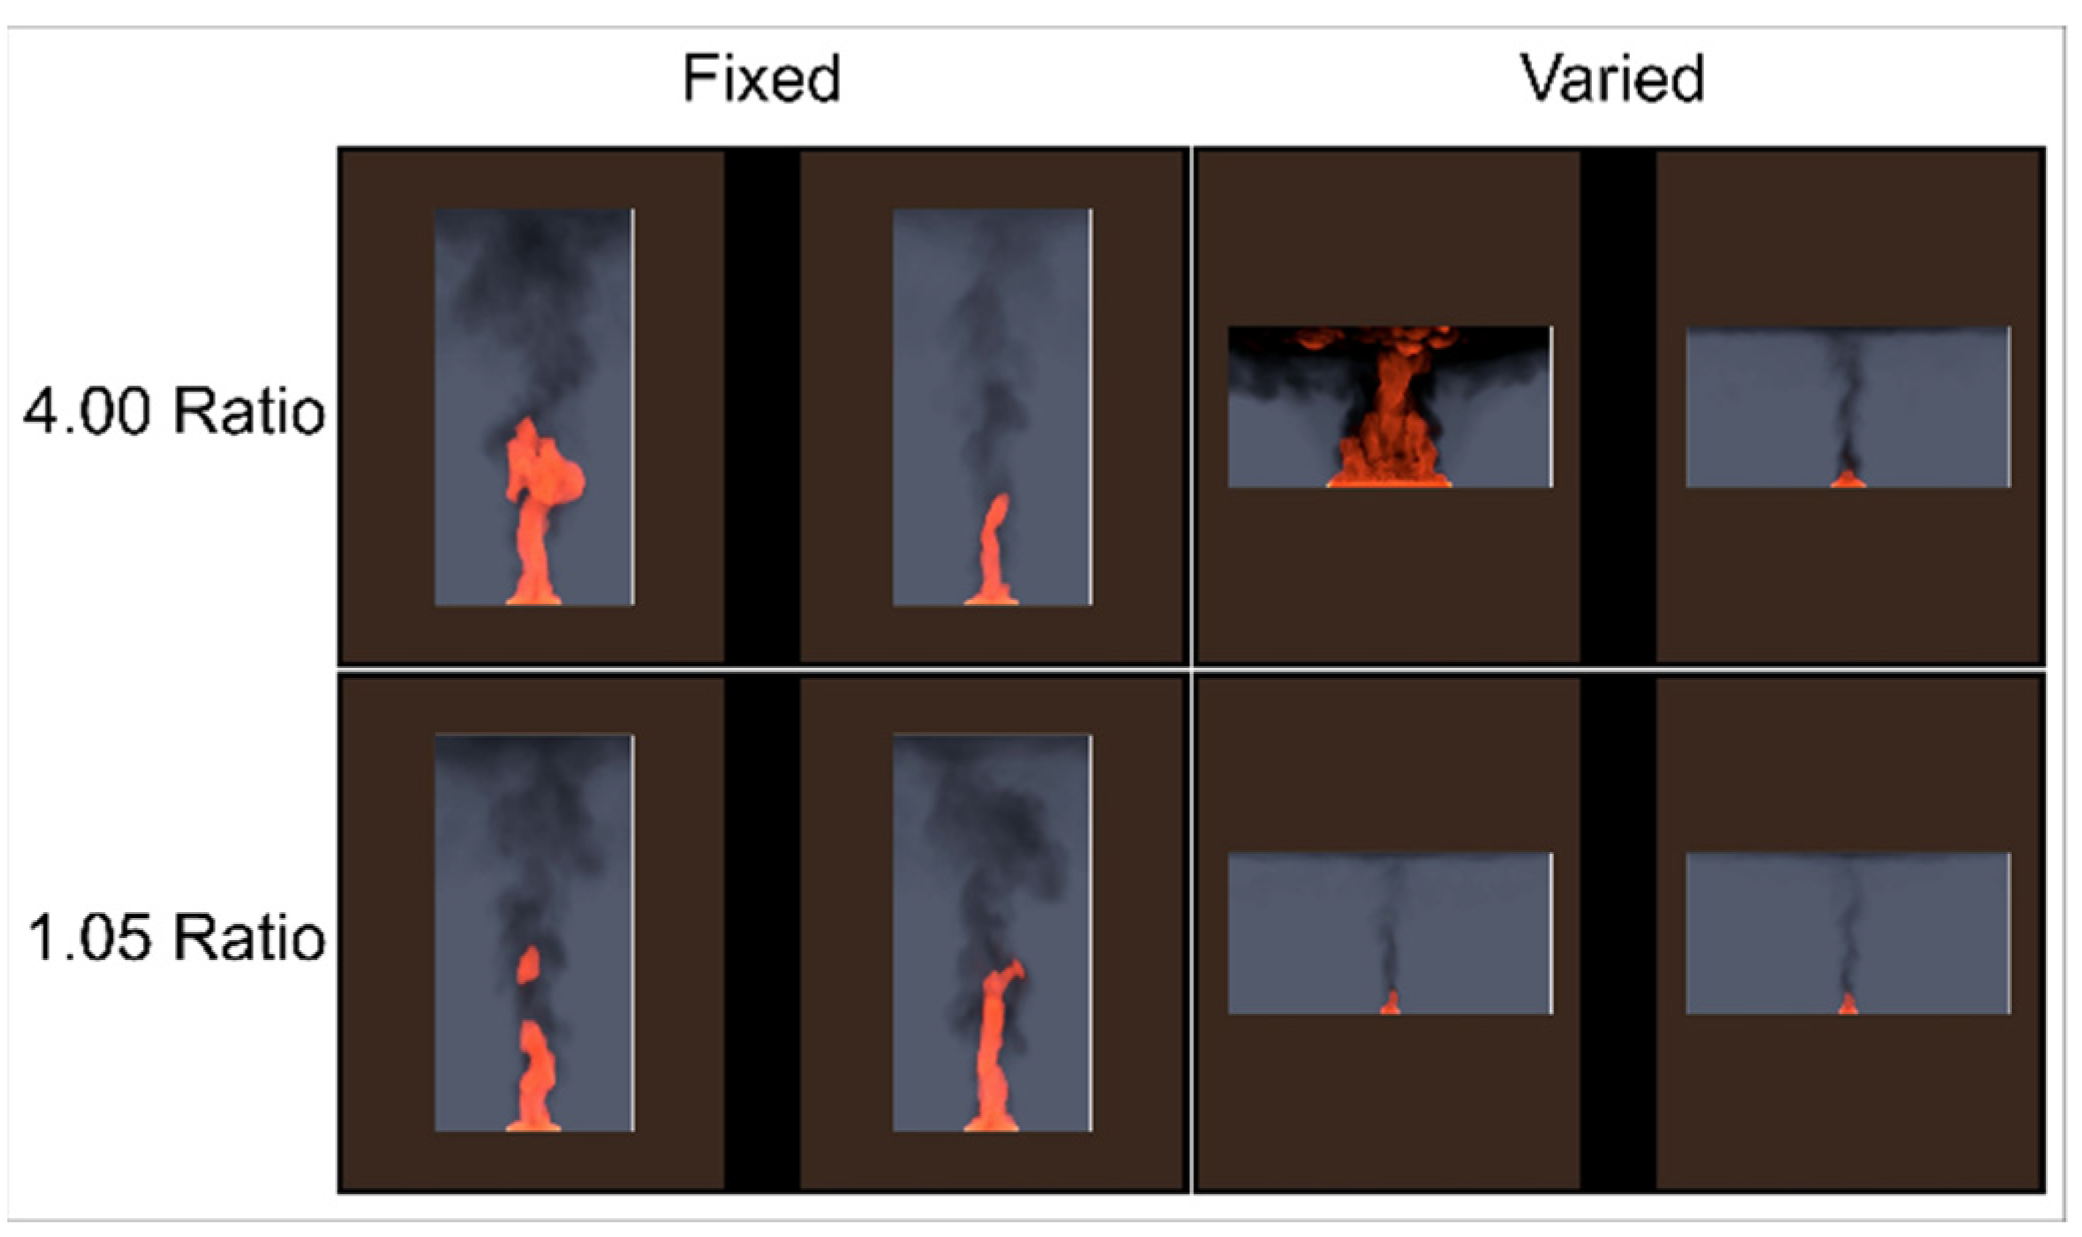
2.1.2. Materials
2.1.3. Procedure
2.1.4. Design
2.2. Results
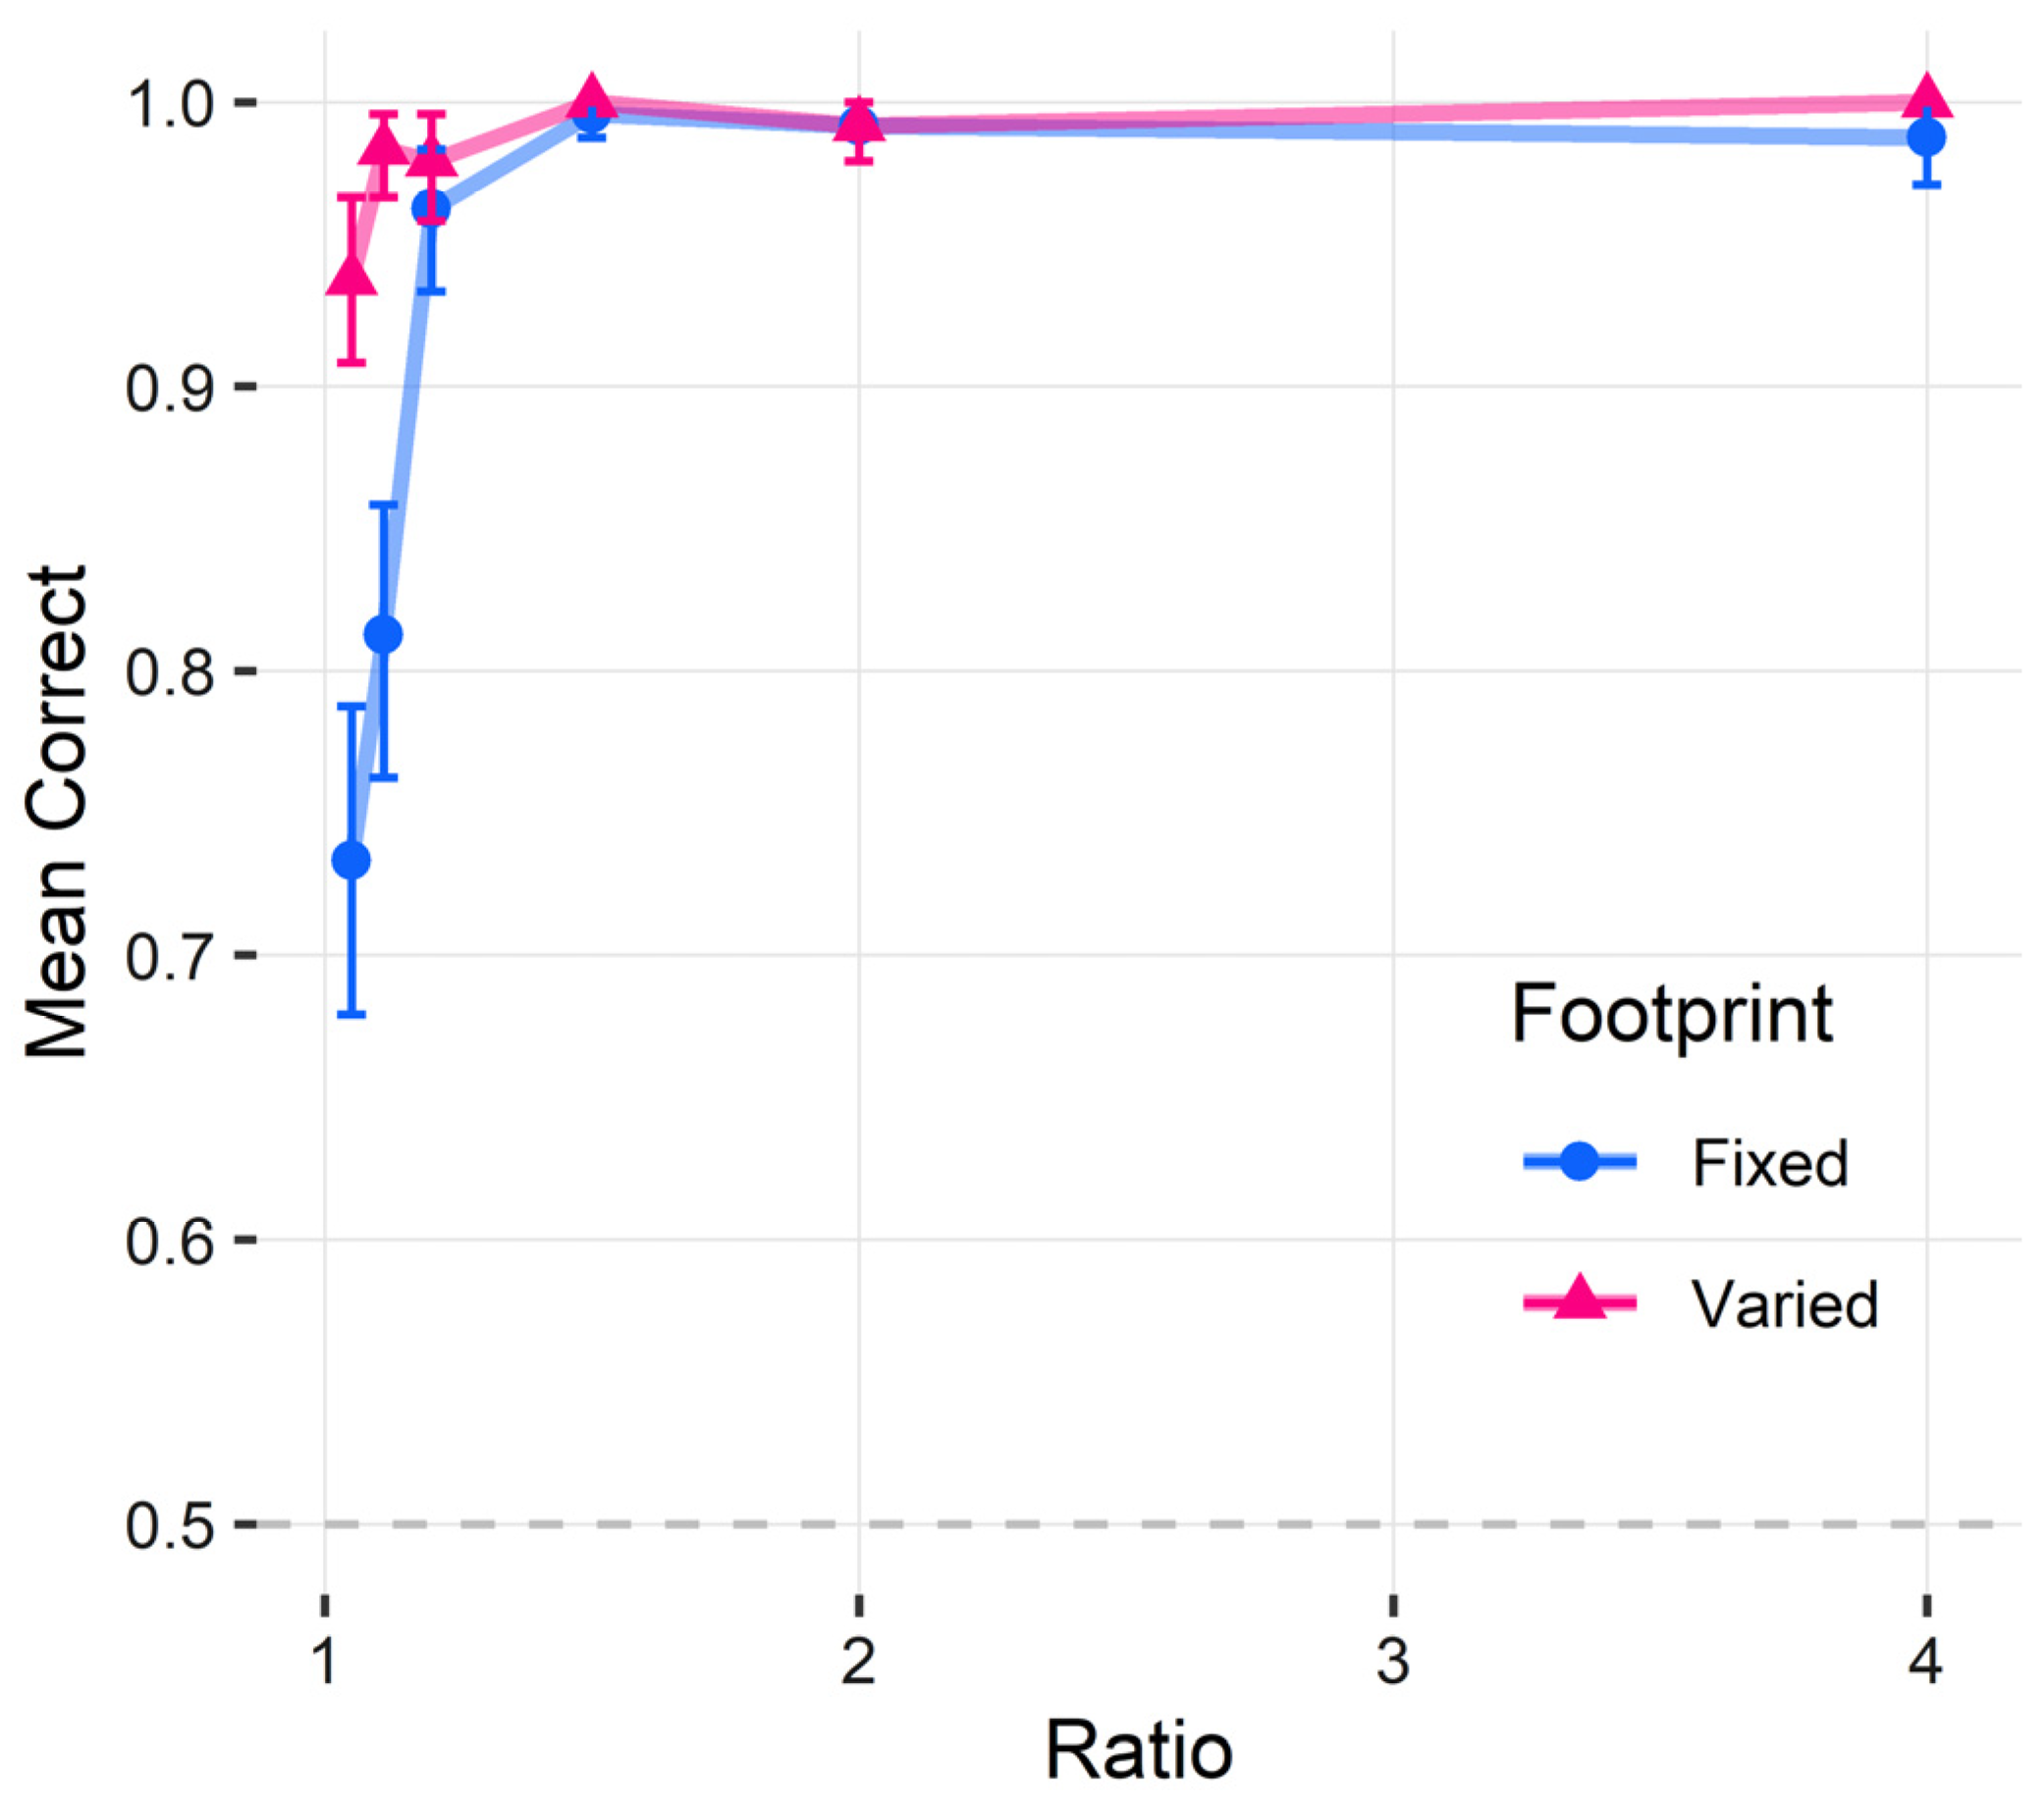
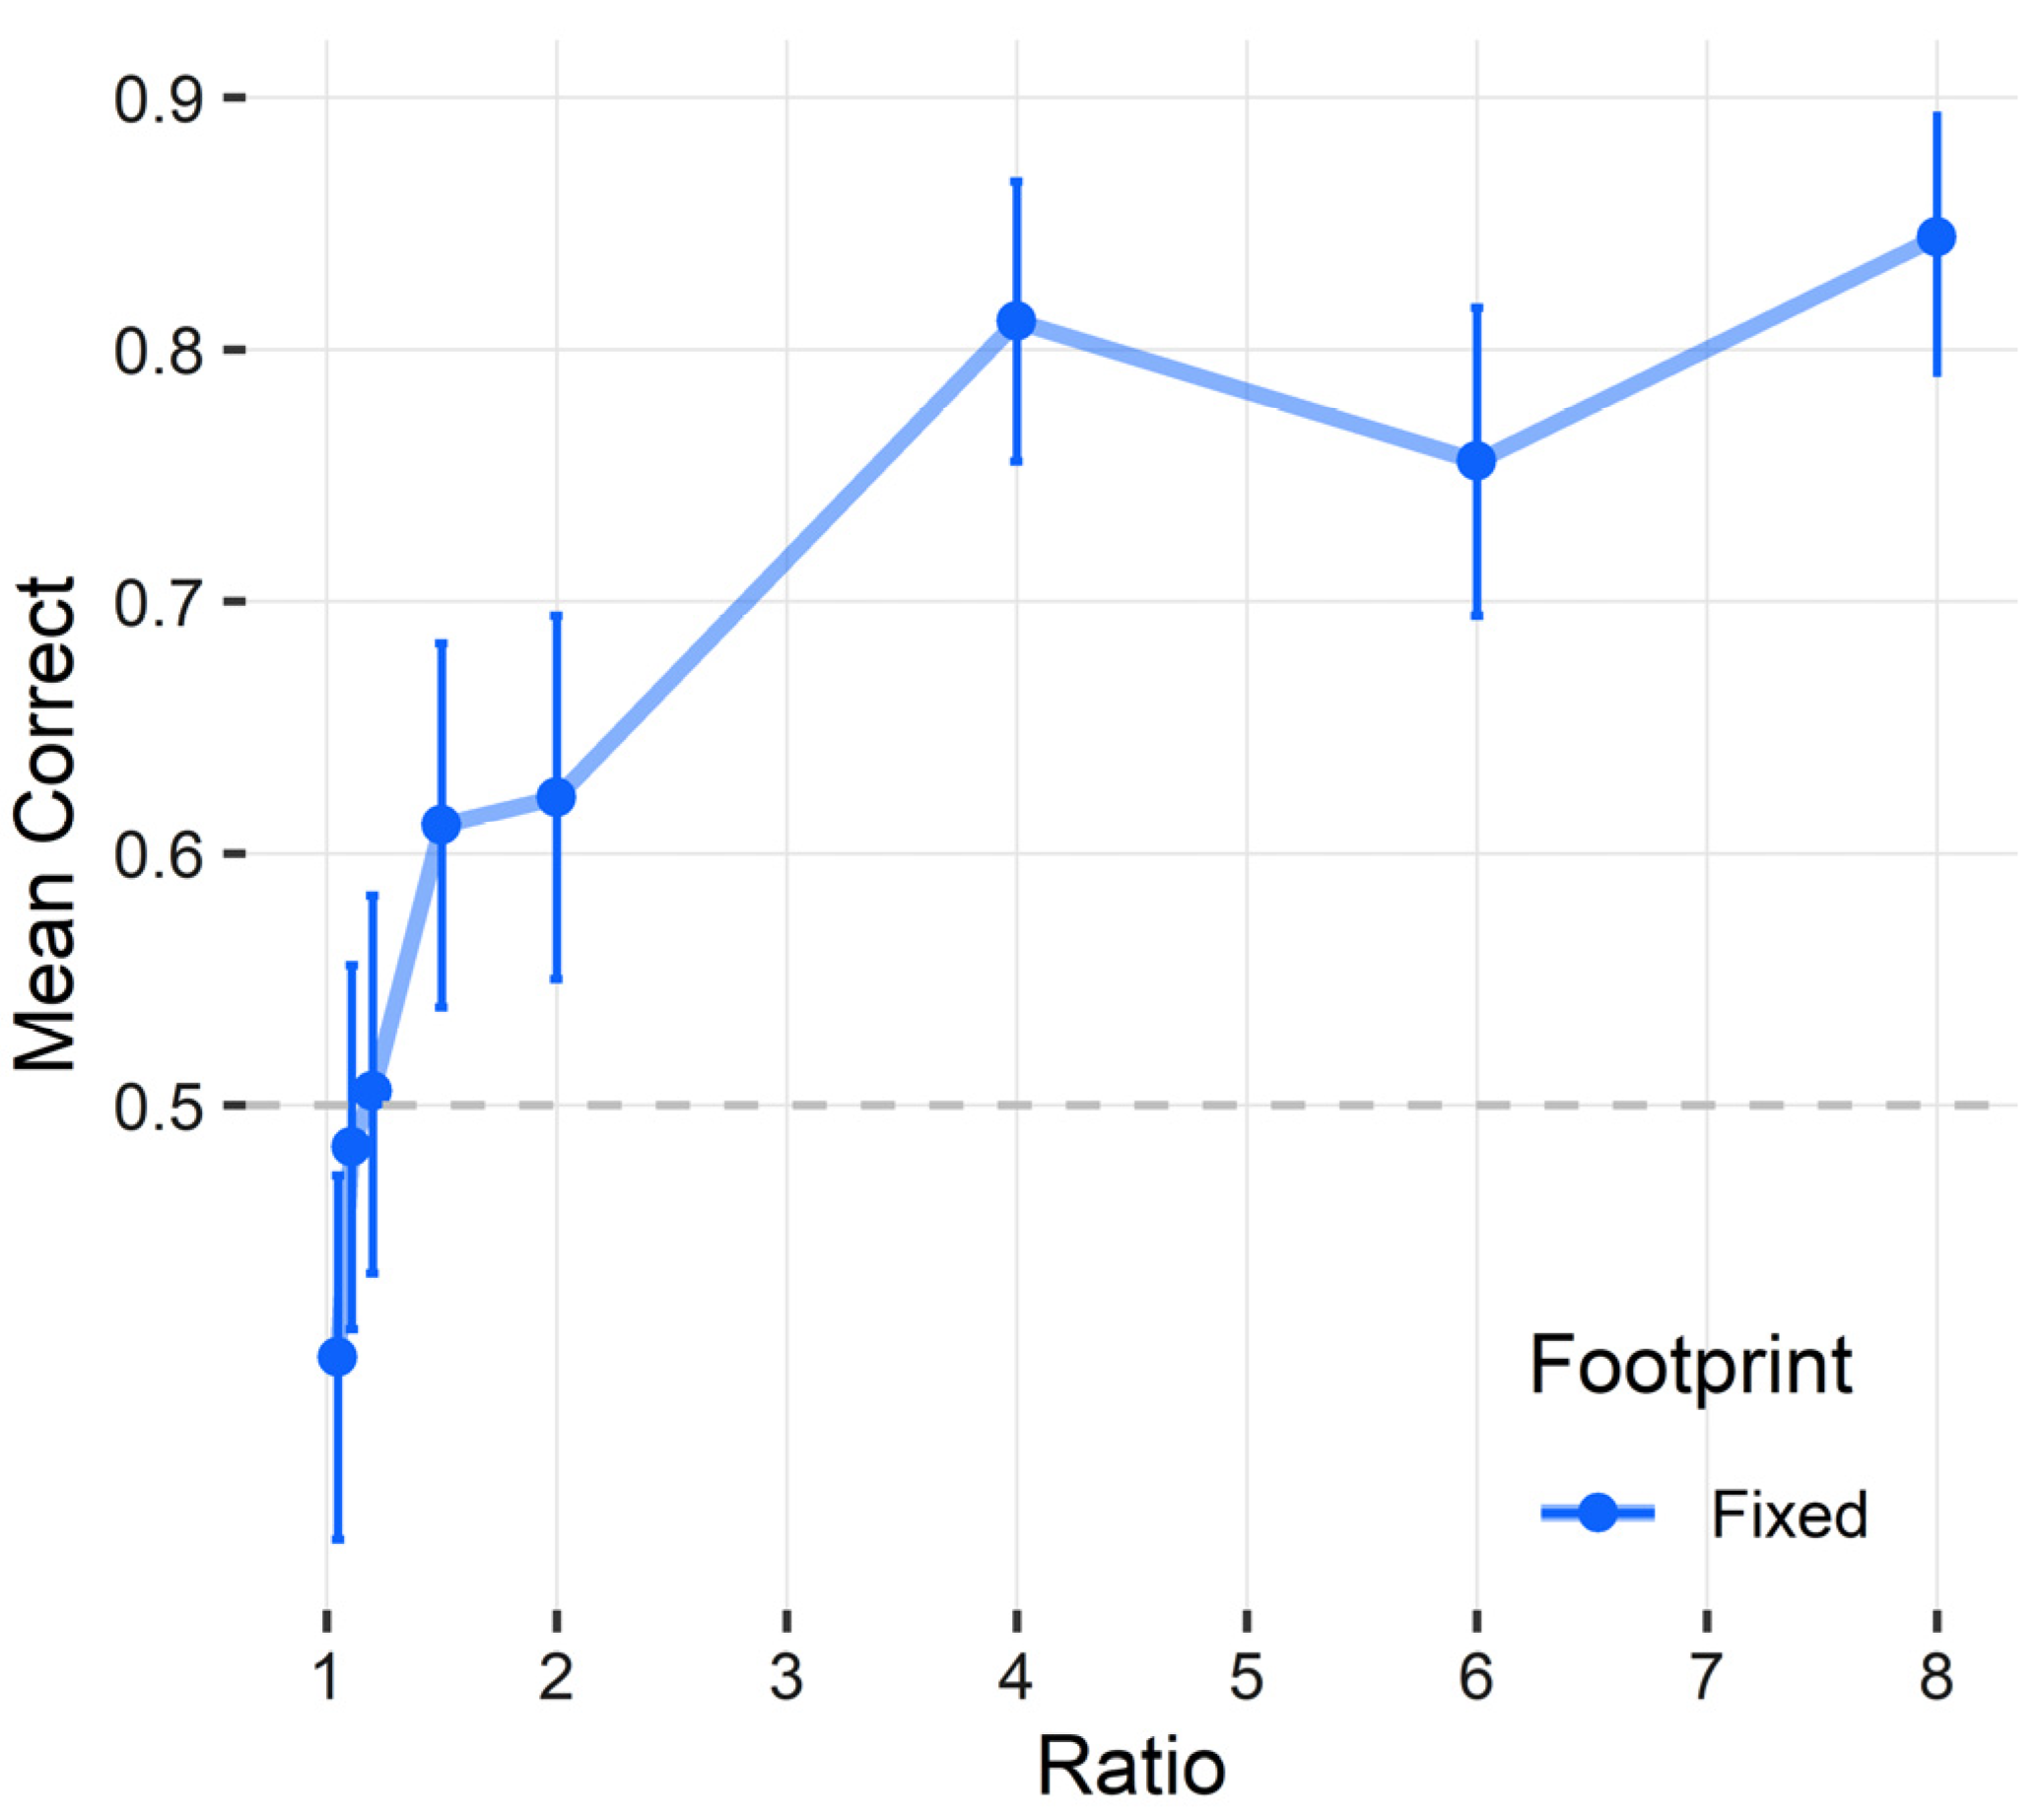
2.2.1. Performance
2.2.2. Weber Fraction
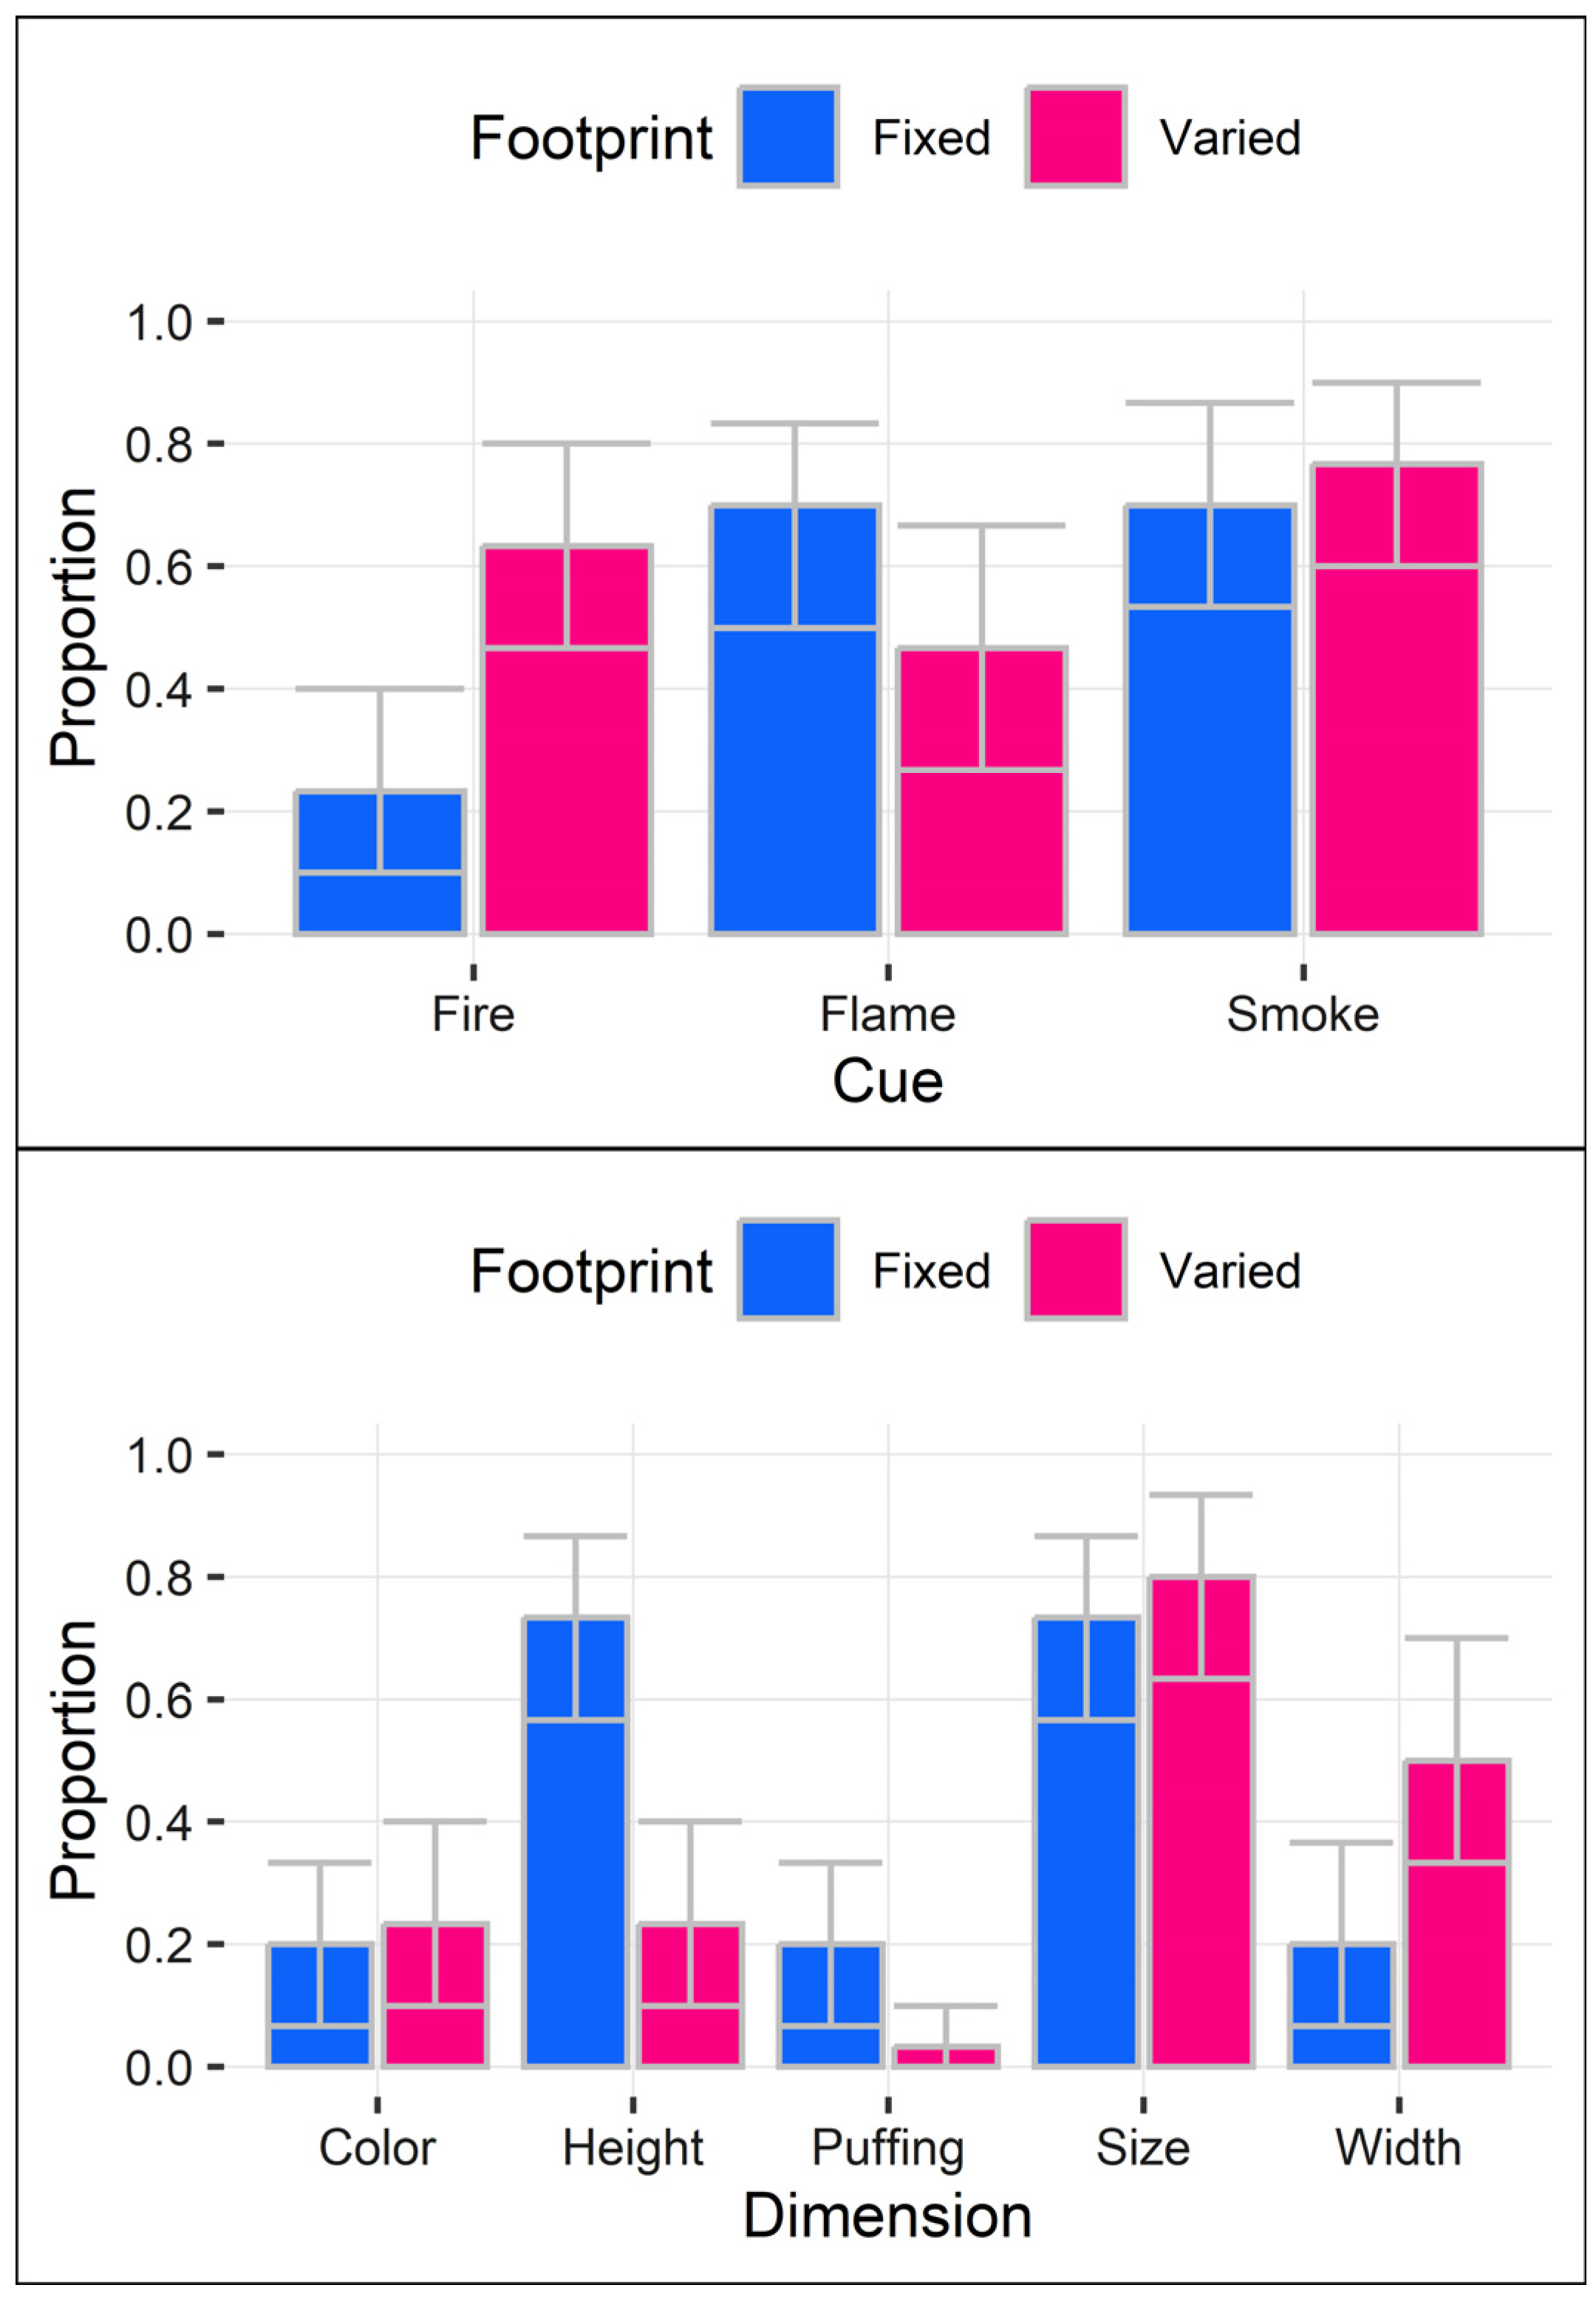
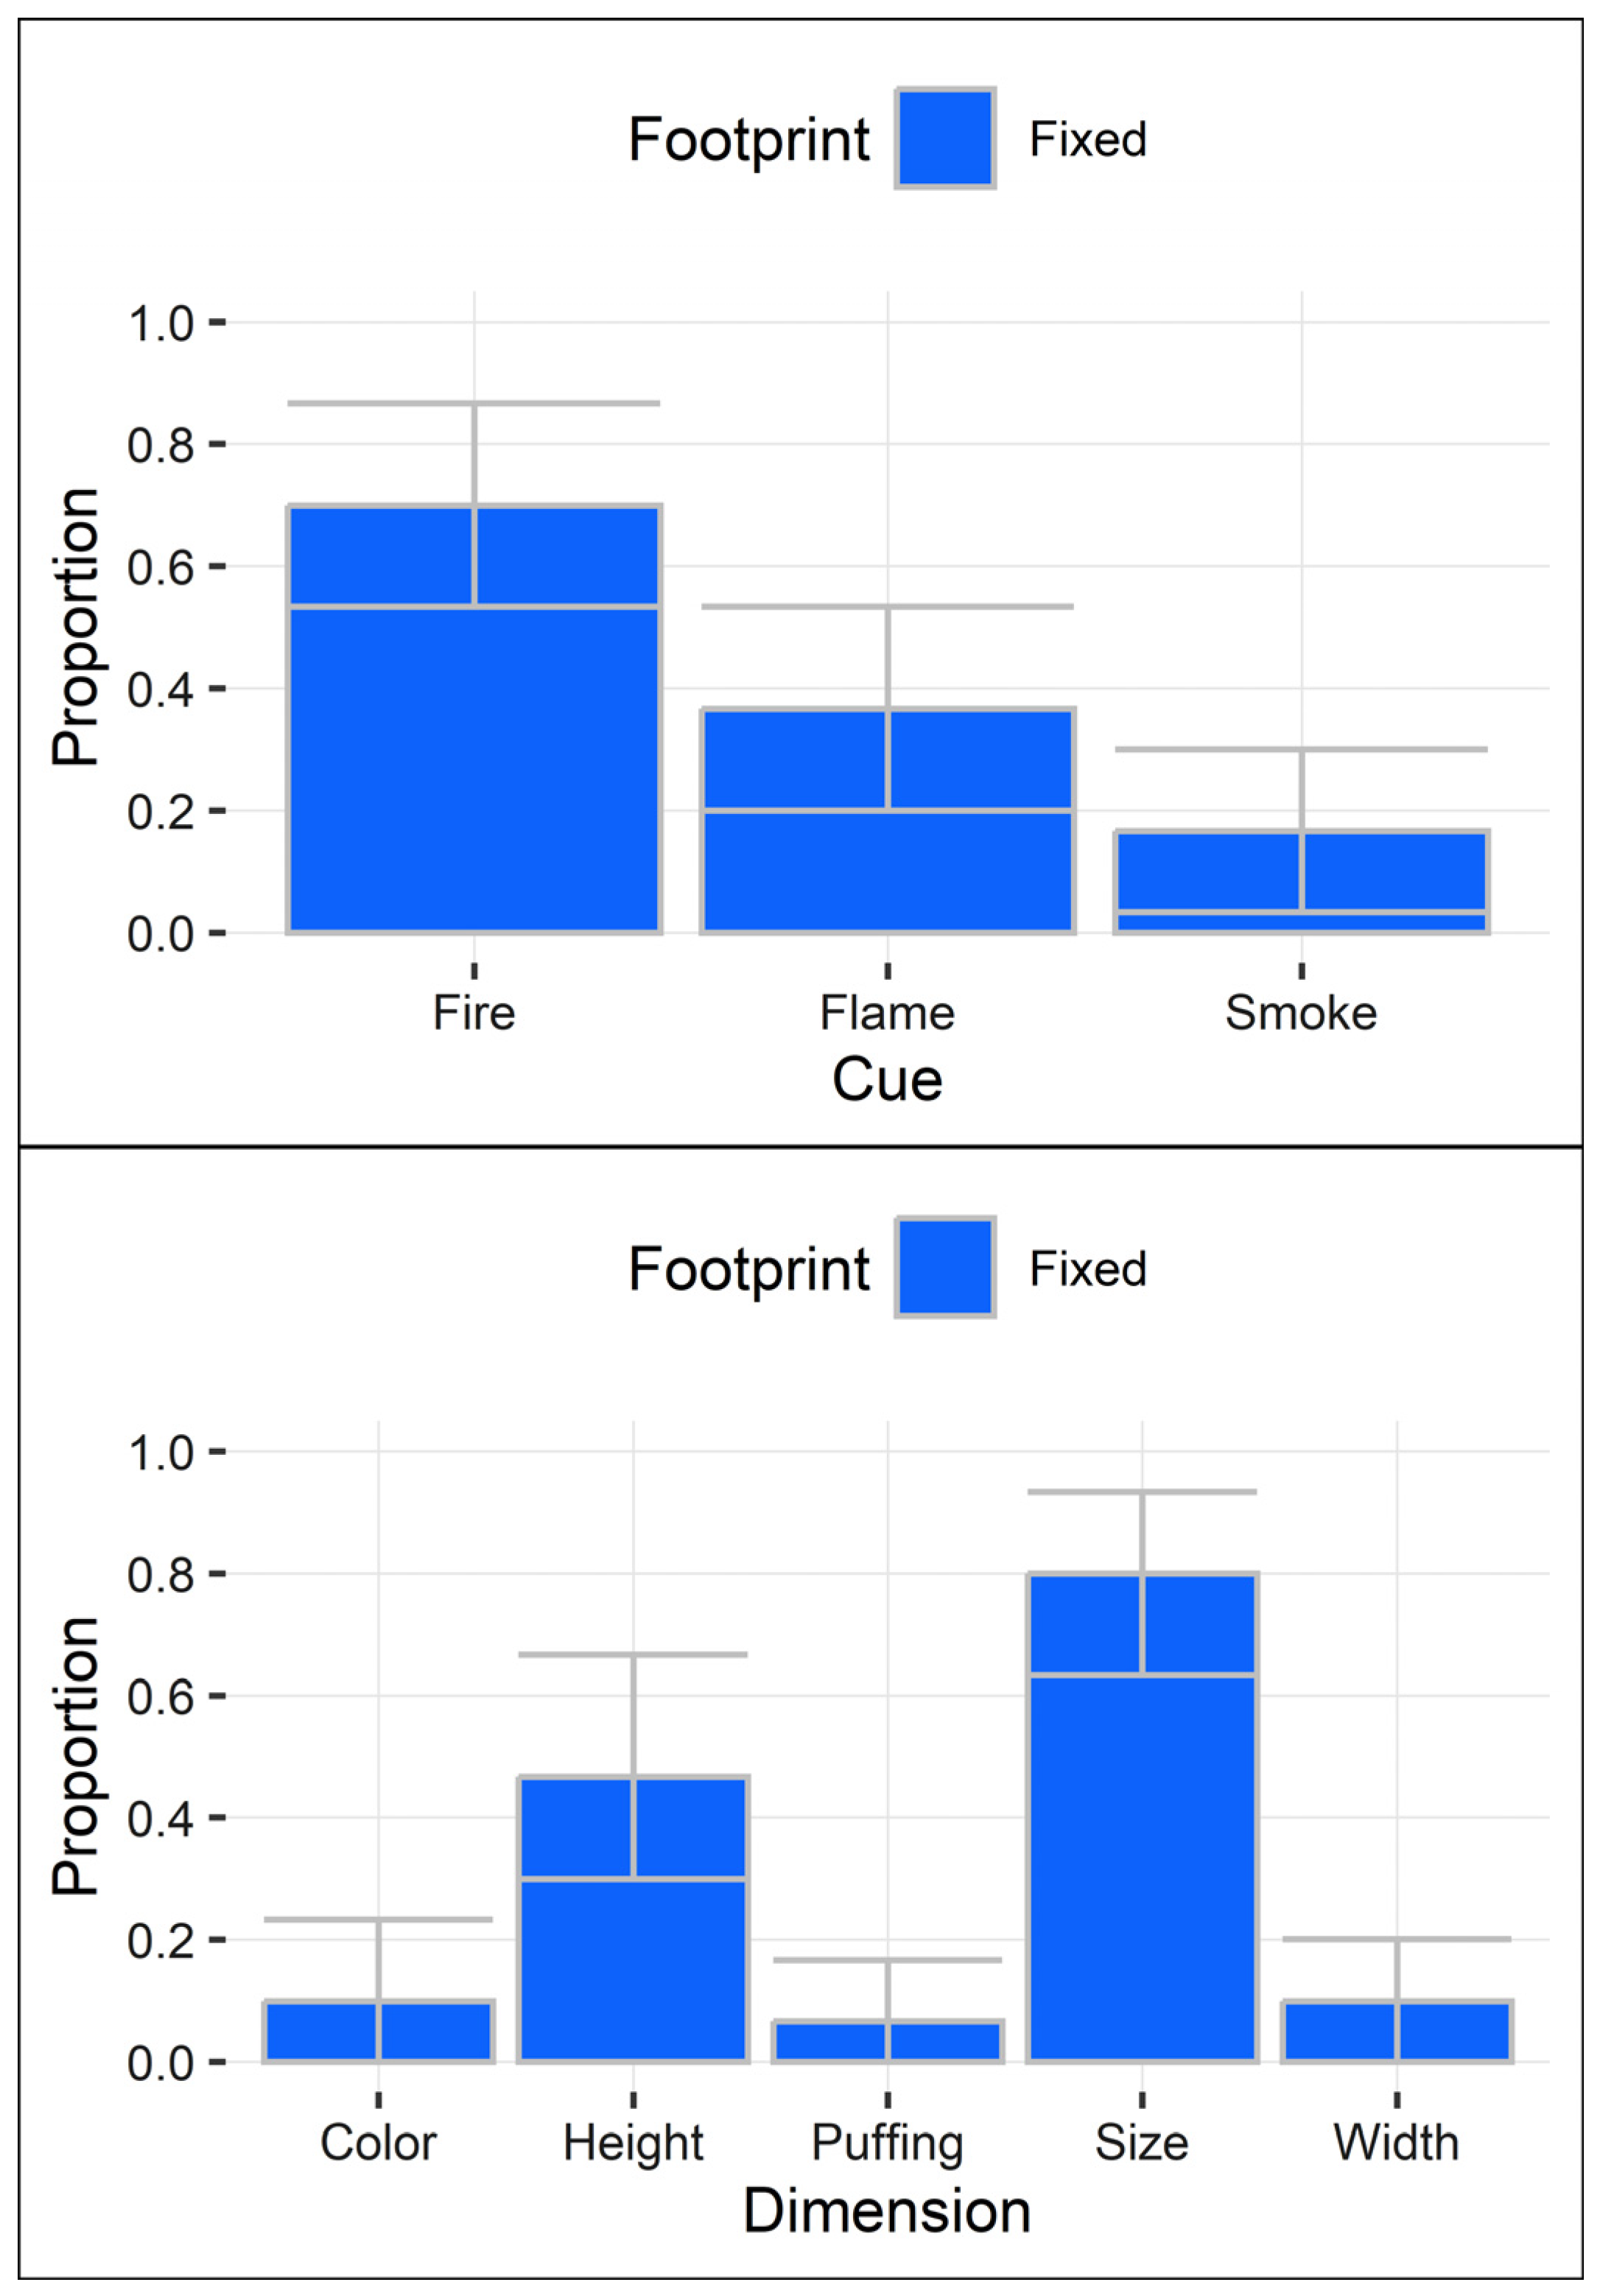
2.2.3. Qualitative Analysis
2.3. Discussion
3. Experiment 2
3.1. Methods
3.1.1. Participants
3.1.2. Materials
3.1.3. Procedure
3.1.4. Design
3.2. Results
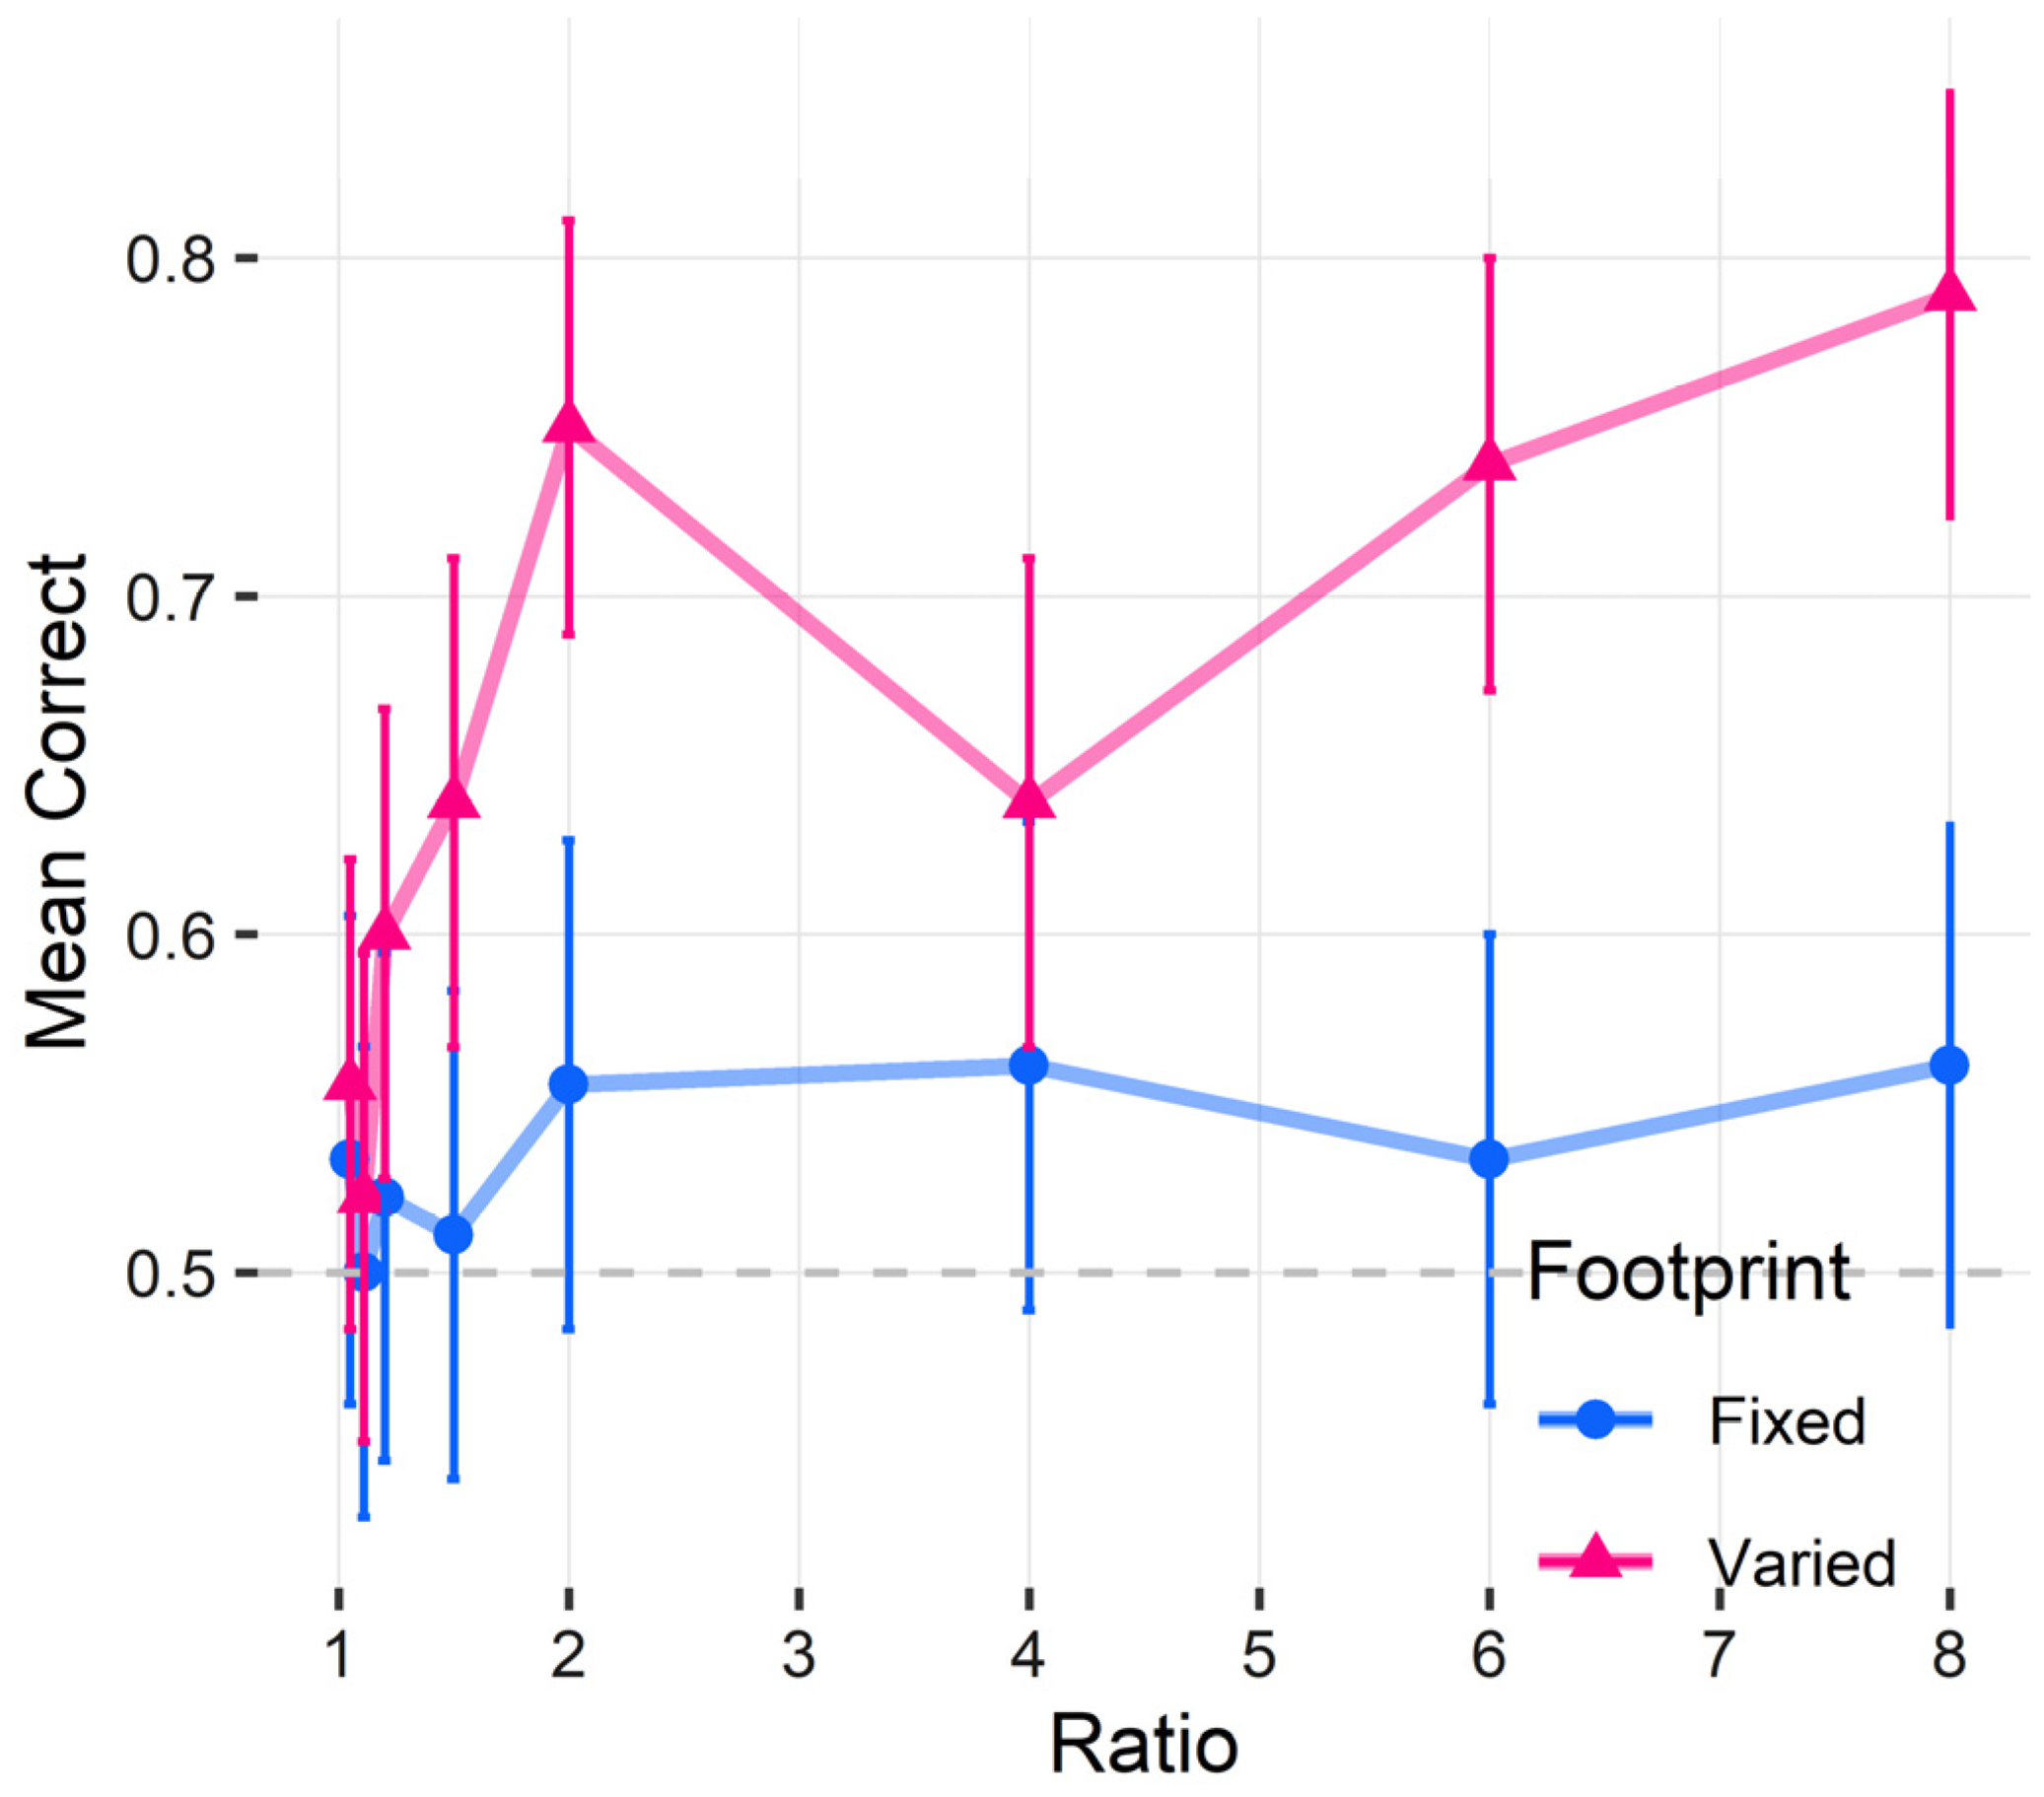
3.2.1. Performance
3.2.2. Weber Fraction
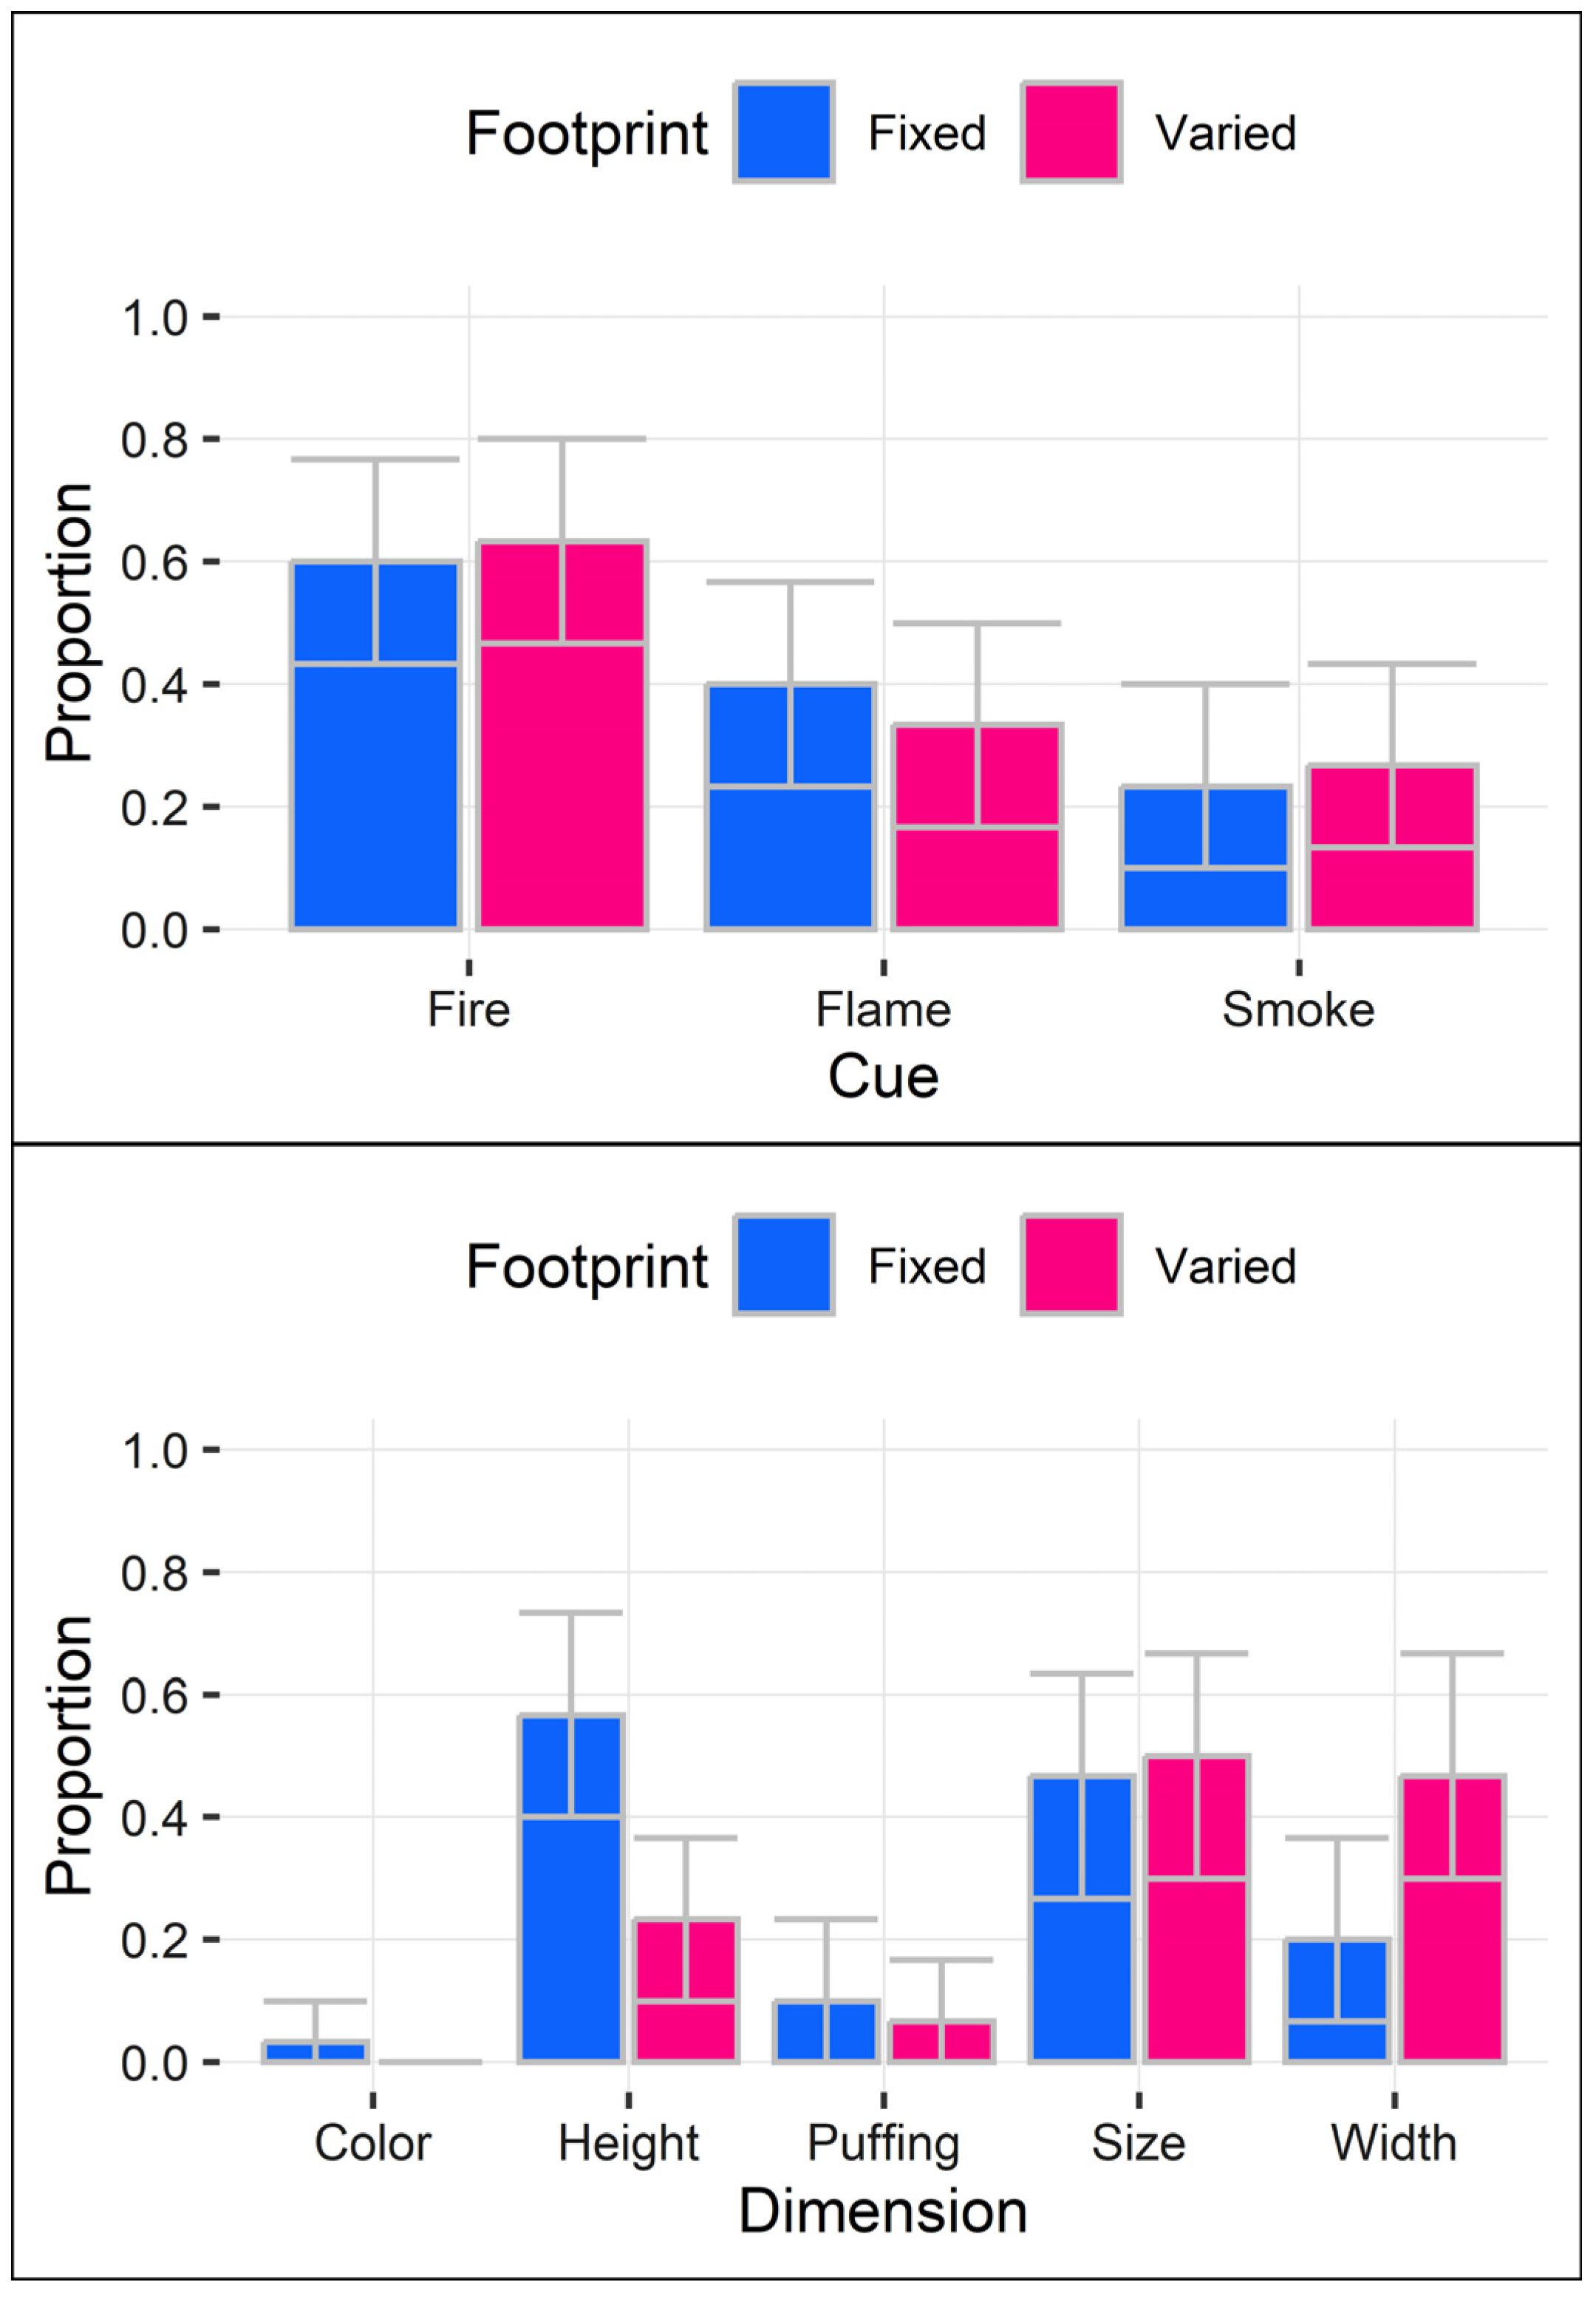
3.2.3. Qualitative Analysis
3.3. Discussion
4. Experiment 3
4.1. Methods
4.1.1. Participants
4.1.2. Materials
4.1.3. Procedure
4.1.4. Design
4.2. Results
4.2.1. Performance
4.2.2. Weber Fraction
4.2.3. Qualitative Analysis
4.3. Discussion
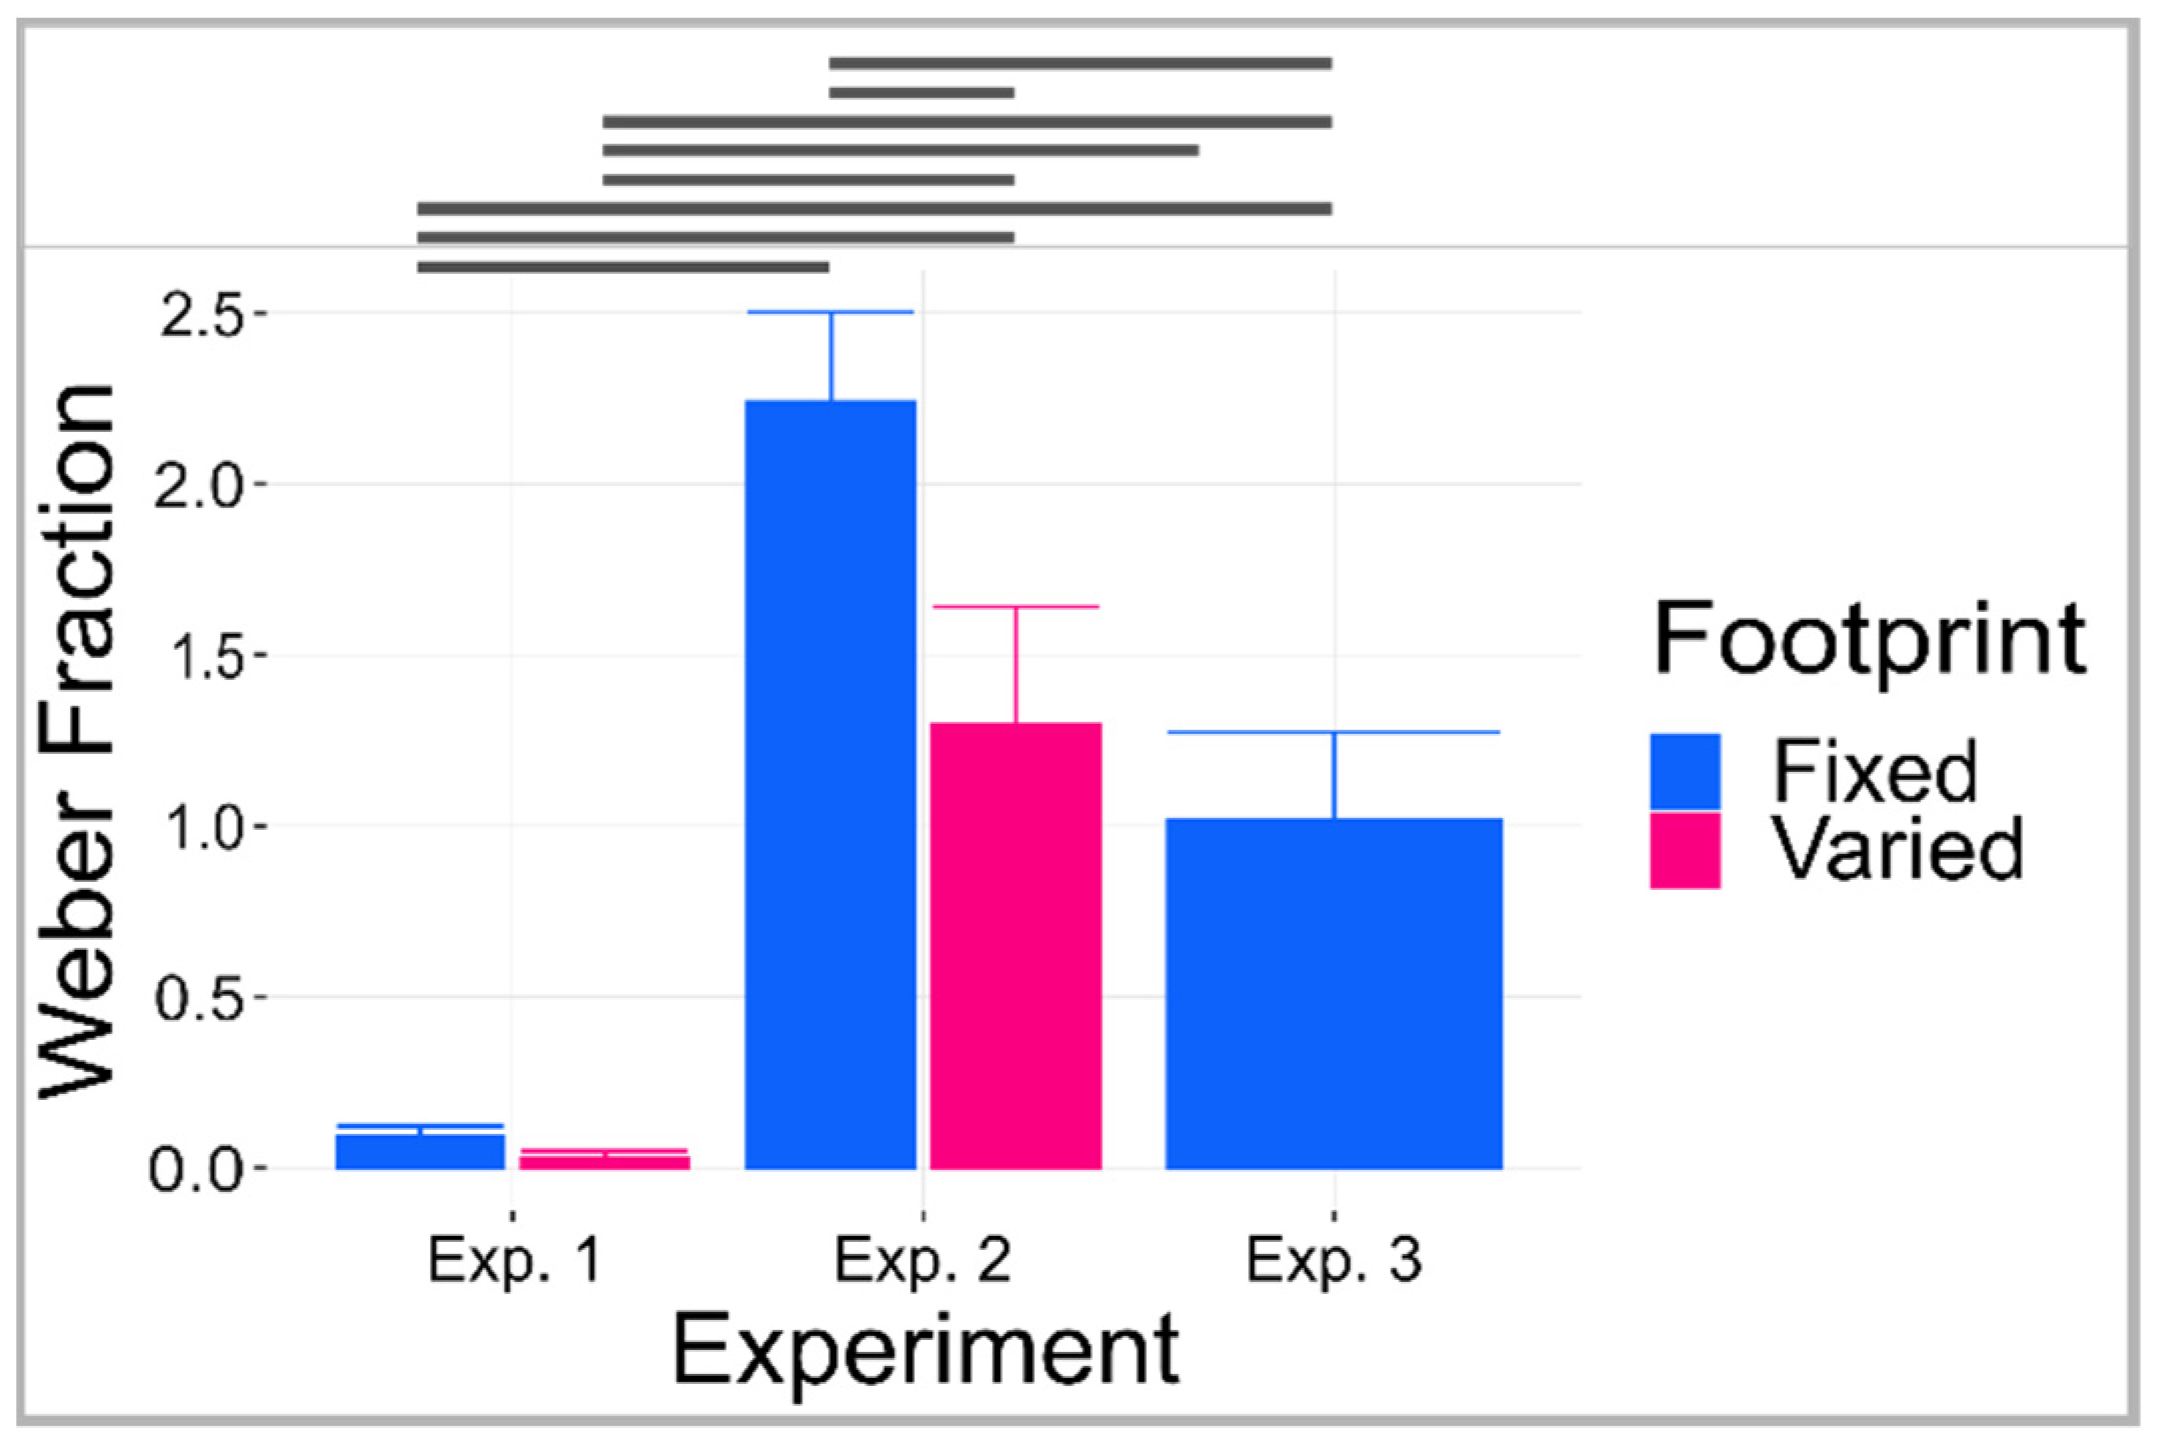
5. Cross-Experiment Weber Fraction Comparison
6. General Discussion
6.1. Precision of Fire Intensity Perception
6.2. Impact of Growth on Fire Precision
6.3. Implications for Models of Occupant Behavior
6.4. Limitations and Future Directions
Supplementary Materials
Author Contributions
Funding
Institutional Review Board Statement
Informed Consent Statement
Data Availability Statement
Conflicts of Interest
References
- Bryan, J.L. Smoke as a Determinant of Human Behavior in Fire Situations; University of Maryland: College Park, MD, USA, 1977. [Google Scholar]
- Kinateder, M.T.; Kuligowski, E.D.; Reneke, P.A.; Peacock, R.D. Risk perception in fire evacuation behavior revisited: Definitions, related concepts, and empirical evidence. Fire Sci. Rev. 2015, 4, 1–26. [Google Scholar] [CrossRef]
- Kuligowski, E.D.; Gwynne, S.M.V.; Kinsey, M.J.; Hulse, L. Guidance for the model user on representing human behavior in egress models. Fire Technol. 2017, 53, 649–672. [Google Scholar] [CrossRef] [PubMed]
- Kuligowski, E.D. Predicting human behavior during fires. Fire Technol. 2013, 49, 101–120. [Google Scholar] [CrossRef]
- Canter, D.; Breaux, J.; Sime, J. Domestic, multiple occupancy, and hospital fires. Fires Hum. Behav. 1980, 8, 117–136. [Google Scholar]
- Kim, H.-J.; Lilley, D.G. Heat release rates of burning items in fires. J. Propuls. Power 2002, 18, 866–870. [Google Scholar]
- Lourenco, S.F.; Bonny, J.W.; Fernandez, E.P.; Rao, S. Nonsymbolic number and cumulative area representations contribute shared and unique variance to symbolic math competence. Proc. Natl. Acad. Sci. USA 2012, 109, 18737–18742. [Google Scholar] [CrossRef] [PubMed]
- Babrauskas, V.; Peacock, R.D. Heat release rate: The single most important variable in fire hazard. Fire Saf. J. 1992, 18, 255–272. [Google Scholar] [CrossRef]
- MBIE. C/VM2 Verification Method: Framework for Fire Safety Design for New Zealand Building Code Clauses C1–C6 Protection from Fire; Ministry of Business, Innovation and Employment Wellington: Wellington, New Zealand, 2014. [Google Scholar]
- Quintiere, J.G. Fundamentals of Fire Phenomena; Wiley: Hoboken, NJ, USA, 2006; ISBN 978-0-470-09113-5. [Google Scholar]
- Ciani, F.; Capobelli, M. Fire Growth Rate Strategies in FDS. J. Phys. Conf. Ser. 2018, 1107, 042007. [Google Scholar]
- Canter, D.; Powell, J.; Booker, K. Psychological Aspects of Informative Fire Warning System; Building Research Establishment Report; Department of the Environment: Garston, Watford, UK, 1987. [Google Scholar]
- Fridolf, K. Perceived Severity of Visually Accessible Fires; Lund University: Lund, Sweden, 2010. [Google Scholar]
- Hulse, L.M.; Galea, E.R.; Thompson, O.F.; Wales, D. Perception and recollection of fire hazards in dwelling fires. Saf. Sci. 2020, 122, 104518. [Google Scholar] [CrossRef]
- Halberda, J.; Mazzocco, M.M.M.; Feigenson, L. Individual Differences in Non-Verbal Number Acuity Correlate with Maths Achievement. Nature 2008, 455, 665–668. [Google Scholar] [CrossRef]
- Halberda, J.; Odic, D. Chapter 12—The Precision and Internal Confidence of Our Approximate Number Thoughts. In Mathematical Cognition and Learning; Geary, D.C., Berch, D.B., Koepke, K.M., Eds.; Evolutionary Origins and Early Development of Number Processing; Elsevier: London, UK, 2015; Volume 1, pp. 305–333. [Google Scholar]
- Dakin, S.C.; Tibber, M.S.; Greenwood, J.A.; Kingdom, F.A.A.; Morgan, M.J. A common visual metric for approximate number and density. Proc. Natl. Acad. Sci. USA 2011, 108, 19552–19557. [Google Scholar] [CrossRef]
- Odic, D. Children’s intuitive sense of number develops independently of their perception of area, density, length, and time. Dev. Sci. 2018, 21, e12533. [Google Scholar] [CrossRef]
- Calderone, J.B.; Kaiser, M.K. Visual acceleration detection: Effect of sign and motion orientation. Percept. Psychophys. 1989, 45, 391–394. [Google Scholar] [CrossRef] [PubMed]
- Mueller, A.S.; Timney, B. Visual Acceleration Perception for Simple and Complex Motion Patterns. PLoS ONE 2016, 11, e0149413. [Google Scholar] [CrossRef]
- McGrattan, K.; Hostikka, S.; McDermott, R.; Floyd, J.; Weinschenk, C.; Overholt, K. Fire Dynamics Simulator User’s Guide; National Institute of Standards and Technology: Gaithersburg, MD, USA, 2021; p. 386. [Google Scholar]
- PyroSim. Thunderhead Engineering. [Computer Software]. 2022. Available online: https://www.thunderheadeng.com/pyrosim (accessed on 8 March 2022).
- Piantadosi, S.T. Efficient estimation of Weber’s W. Behav. Res. Methods 2016, 48, 42–52. [Google Scholar] [CrossRef]
- Kadosh, R.C.; Kadosh, K.C.; Henik, A. When Brightness Counts: The Neuronal Correlate of Numerical–Luminance Interference. Cereb. Cortex 2008, 18, 337–343. [Google Scholar] [CrossRef]
- Bates, D.M.; Mächler, M.; Bolker, B.M.; Walker, S.C. Fitting linear mixed-effects models using lme4. J. Stat. Softw. 2015, 67, 1–48. [Google Scholar] [CrossRef]
- Kuznetsova, A.; Brockhoff, P.B.; Christensen, R.H.B. lmerTest package: Tests in linear mixed effects models. J. Stat. Softw. 2017, 82, 1–19. [Google Scholar] [CrossRef]
- Ben-Shachar, M.; Lüdecke, D.; Makowski, D. Effectsize: Estimation of Effect Size Indices and Standardized Parameters. J. Open Source Softw. 2020, 5, 2815. [Google Scholar] [CrossRef]
- Hothorn, T.; Bretz, F.; Westfall, P. Simultaneous Inference in General Parametric Models. Biom. J. 2008, 50, 346–363. [Google Scholar] [CrossRef]
- Lenth, R.V.; Buerkner, P.; Herve, M.; Love, J.; Miguez, F.; Riebl, H.; Singmann, H. Emmeans: Estimated Marginal Means, Aka Least-Squares Means (1.7.3) [Computer Software]. 2022. Available online: https://CRAN.R-project.org/package=emmeans (accessed on 7 March 2023).
- Wickham, H. ggplot2: Elegant Graphics for Data Analysis; Springer: Cham, Switzerland, 2016; ISBN 978-3-319-24277-4. [Google Scholar]
- Mueller, A.S.; González, E.G.; McNorgan, C.; Steinbach, M.J.; Timney, B. Effects of vertical direction and aperture size on the perception of visual acceleration. Perception 2016, 45, 670–683. [Google Scholar] [PubMed]
- DeWind, N.K.; Adams, G.K.; Platt, M.L.; Brannon, E.M. Modeling the approximate number system to quantify the contribution of visual stimulus features. Cognition 2015, 142, 247–265. [Google Scholar] [CrossRef] [PubMed]
- Wang, Y.; Vul, E. The role of kinematic properties in multiple object tracking. J. Vis. 2021, 21, 22. [Google Scholar] [CrossRef] [PubMed]
- Brouwer, A.-M.; Brenner, E.; Smeets, J.B.J. Perception of acceleration with short presentation times: Can acceleration be used in interception? Percept. Psychophys. 2002, 64, 1160–1168. [Google Scholar] [CrossRef]
- Stocker, A.A.; Simoncelli, E.P. Noise characteristics and prior expectations in human visual speed perception. Nat. Neurosci. 2006, 9, 578–585. [Google Scholar] [CrossRef]
- Shaw, E.; Roper, T.; Nilsson, T.; Lawson, G.; Cobb, S.V.G.; Miller, D. The heat is on: Exploring user behaviour in a multisensory virtual environment for fire evacuation. In Proceedings of the Conference on Human Factors in Computing Systems—Proceedings, Glasgow, UK, 4–9 May 2019. [Google Scholar]


| Experiment | Fire Comparison | Footprint Conditions |
|---|---|---|
| 1 | Intensity (HRR) | Fixed Varied |
| 2 | Growth (t2 curve) | Fixed Varied |
| 3 | Growth (linear curve) | Fixed |
Disclaimer/Publisher’s Note: The statements, opinions and data contained in all publications are solely those of the individual author(s) and contributor(s) and not of MDPI and/or the editor(s). MDPI and/or the editor(s) disclaim responsibility for any injury to people or property resulting from any ideas, methods, instructions or products referred to in the content. |
© 2023 by the authors. Licensee MDPI, Basel, Switzerland. This article is an open access article distributed under the terms and conditions of the Creative Commons Attribution (CC BY) license (https://creativecommons.org/licenses/by/4.0/).
Share and Cite
Bonny, J.W.; Milke, J.A. Precision of Visual Perception of Developing Fires. Fire 2023, 6, 328. https://doi.org/10.3390/fire6090328
Bonny JW, Milke JA. Precision of Visual Perception of Developing Fires. Fire. 2023; 6(9):328. https://doi.org/10.3390/fire6090328
Chicago/Turabian StyleBonny, Justin W., and James A. Milke. 2023. "Precision of Visual Perception of Developing Fires" Fire 6, no. 9: 328. https://doi.org/10.3390/fire6090328
APA StyleBonny, J. W., & Milke, J. A. (2023). Precision of Visual Perception of Developing Fires. Fire, 6(9), 328. https://doi.org/10.3390/fire6090328