


A New Perspective on Hydrogen Chloride Scavenging at High Temperatures for Reducing the Smoke Acidity of PVC Cables in Fires, IV: The Impact of Acid Scavengers at High Temperatures on Flame Retardance and Smoke Emission

 ,
, 
Abstract
:1. Introduction
1.1. Thermal Degradation, Thermal Decomposition, Pyrolysis, and Combustion: The Basic Concepts
1.2. The First Stage of the Thermal Decomposition/Combustion
1.3. The Second Stage of the Thermal Decomposition/Combustion
1.4. Low-Smoke Acidity Compounds and Acid Scavengers at High Temperatures in the Condensed Phase
2. Materials and Methods
2.1. Materials

| Raw Materials | Trade Name | REA1 [phr] | REA2 [phr] | REA3 [phr] | REA4 [phr] | REA5 [phr] | REA6 [phr] | REA7 [phr] | REA8 [phr] | REA9 [phr] |
|---|---|---|---|---|---|---|---|---|---|---|
| PVC | Inovyn 271 PC | 100 | 100 | 100 | 100 | 100 | 100 | 100 | 100 | 100 |
| DINP | Diplast N | 50 | 50 | 50 | 50 | 50 | 50 | 50 | 50 | 50 |
| ESBO | Reaflex EP/6 | 2 | 2 | 2 | 2 | 2 | 2 | 2 | 2 | 2 |
| Antioxidant | Arenox A10 | 0.1 | 0.1 | 0.1 | 0.1 | 0.1 | 0.1 | 0.1 | 0.1 | 0.1 |
| COS | RPK B-CV/ 3038 | 5 | 5 | 5 | 5 | 5 | 5 | 5 | 5 | 5 |
| Sb2O3 | RI004 | 0 | 3 | 3 | 3 | 3 | 3 | 3 | 3 | 3 |
| CaCO3 | Atomfor S | 0 | 0 | 90 | 0 | 0 | 0 | 0 | 0 | 0 |
| CaCO3 | Hydrocarb 95 T | 0 | 0 | 0 | 90 | 0 | 0 | 0 | 0 | 0 |
| UPCC | Winnofil S | 0 | 0 | 0 | 0 | 90 | 0 | 0 | 0 | 90 |
| HTAS 2 | AS-6B | 0 | 0 | 0 | 0 | 0 | 90 | 0 | 0 | 0 |
| Mg(OH)2 | Ecopyren 3.5 | 0 | 0 | 0 | 0 | 0 | 0 | 90 | 0 | 30 |
| Al(OH)3 | Aluprem T GR 4 | 0 | 0 | 0 | 0 | 0 | 0 | 0 | 90 | 0 |
2.2. Test Apparatuses
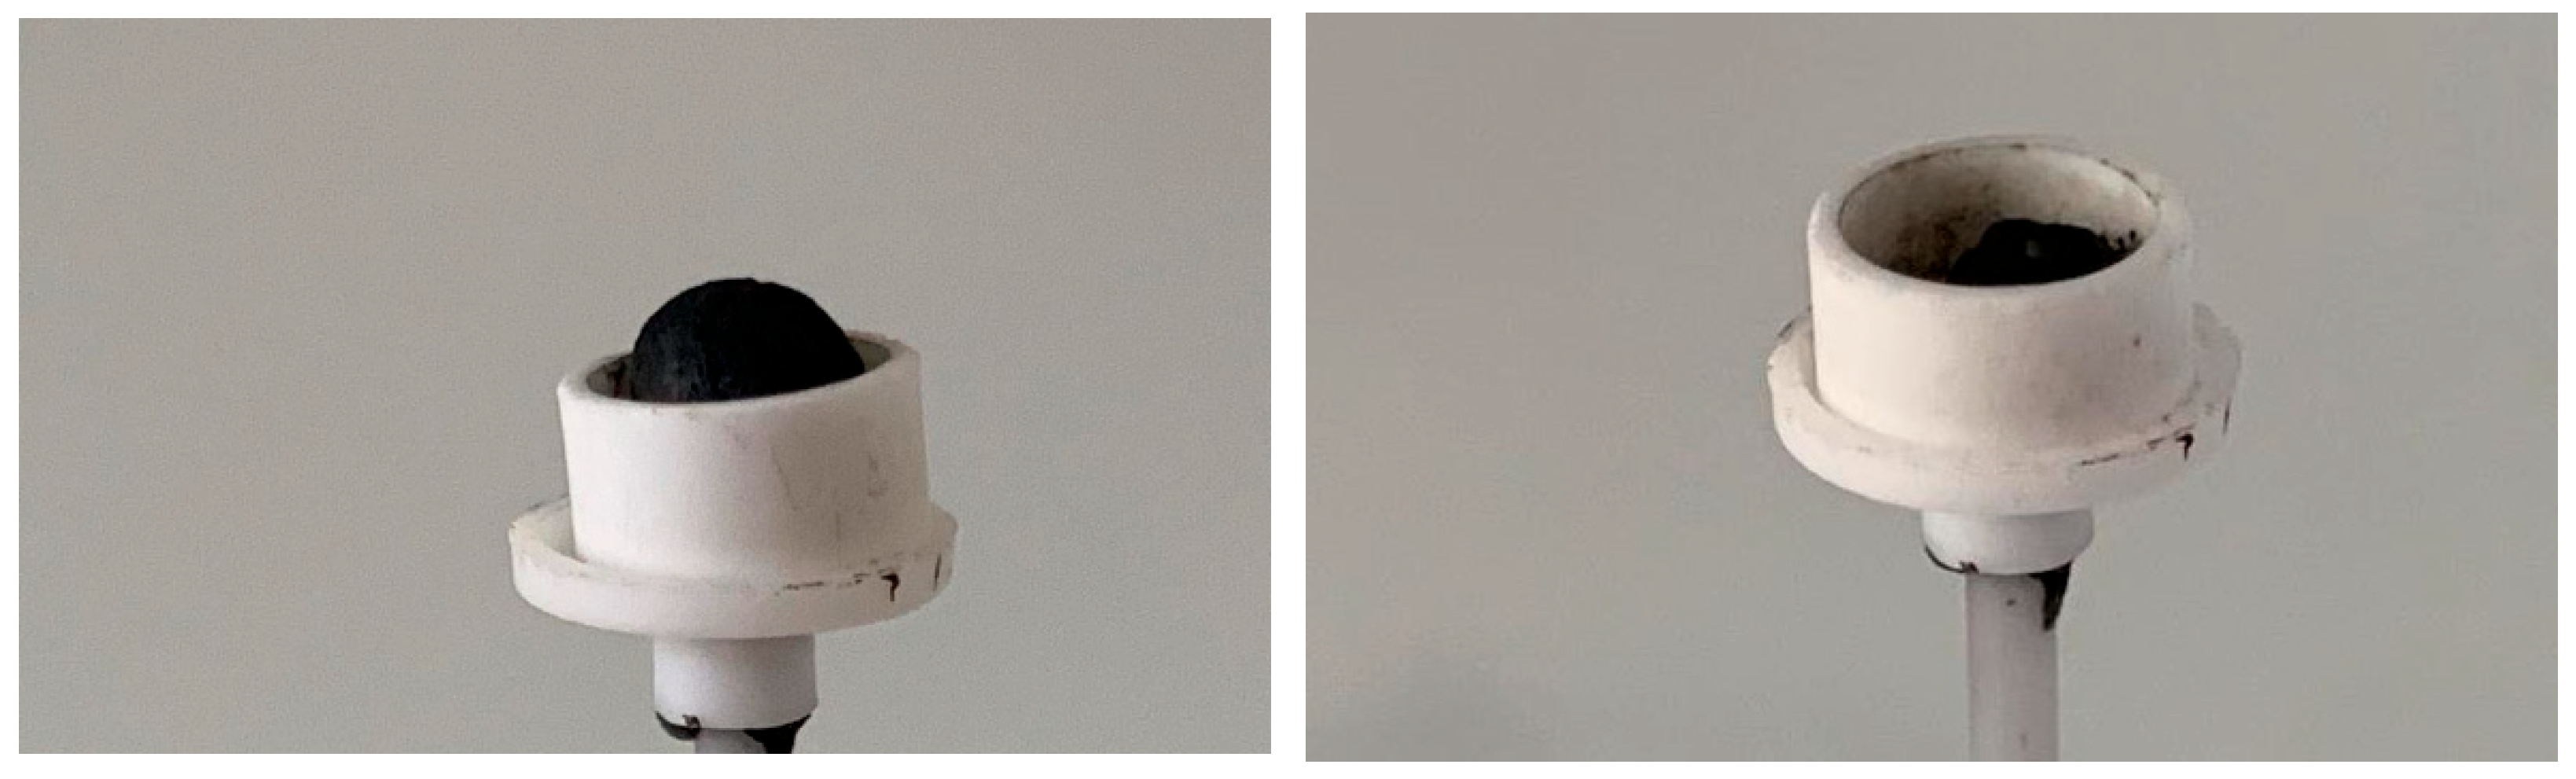
2.3. Sample Preparation
2.4. Internal Tests and International Technical Standards Used
3. Results
4. Discussion
4.1. Description of the Impact of Acid Scavengers on pH and Conductivity
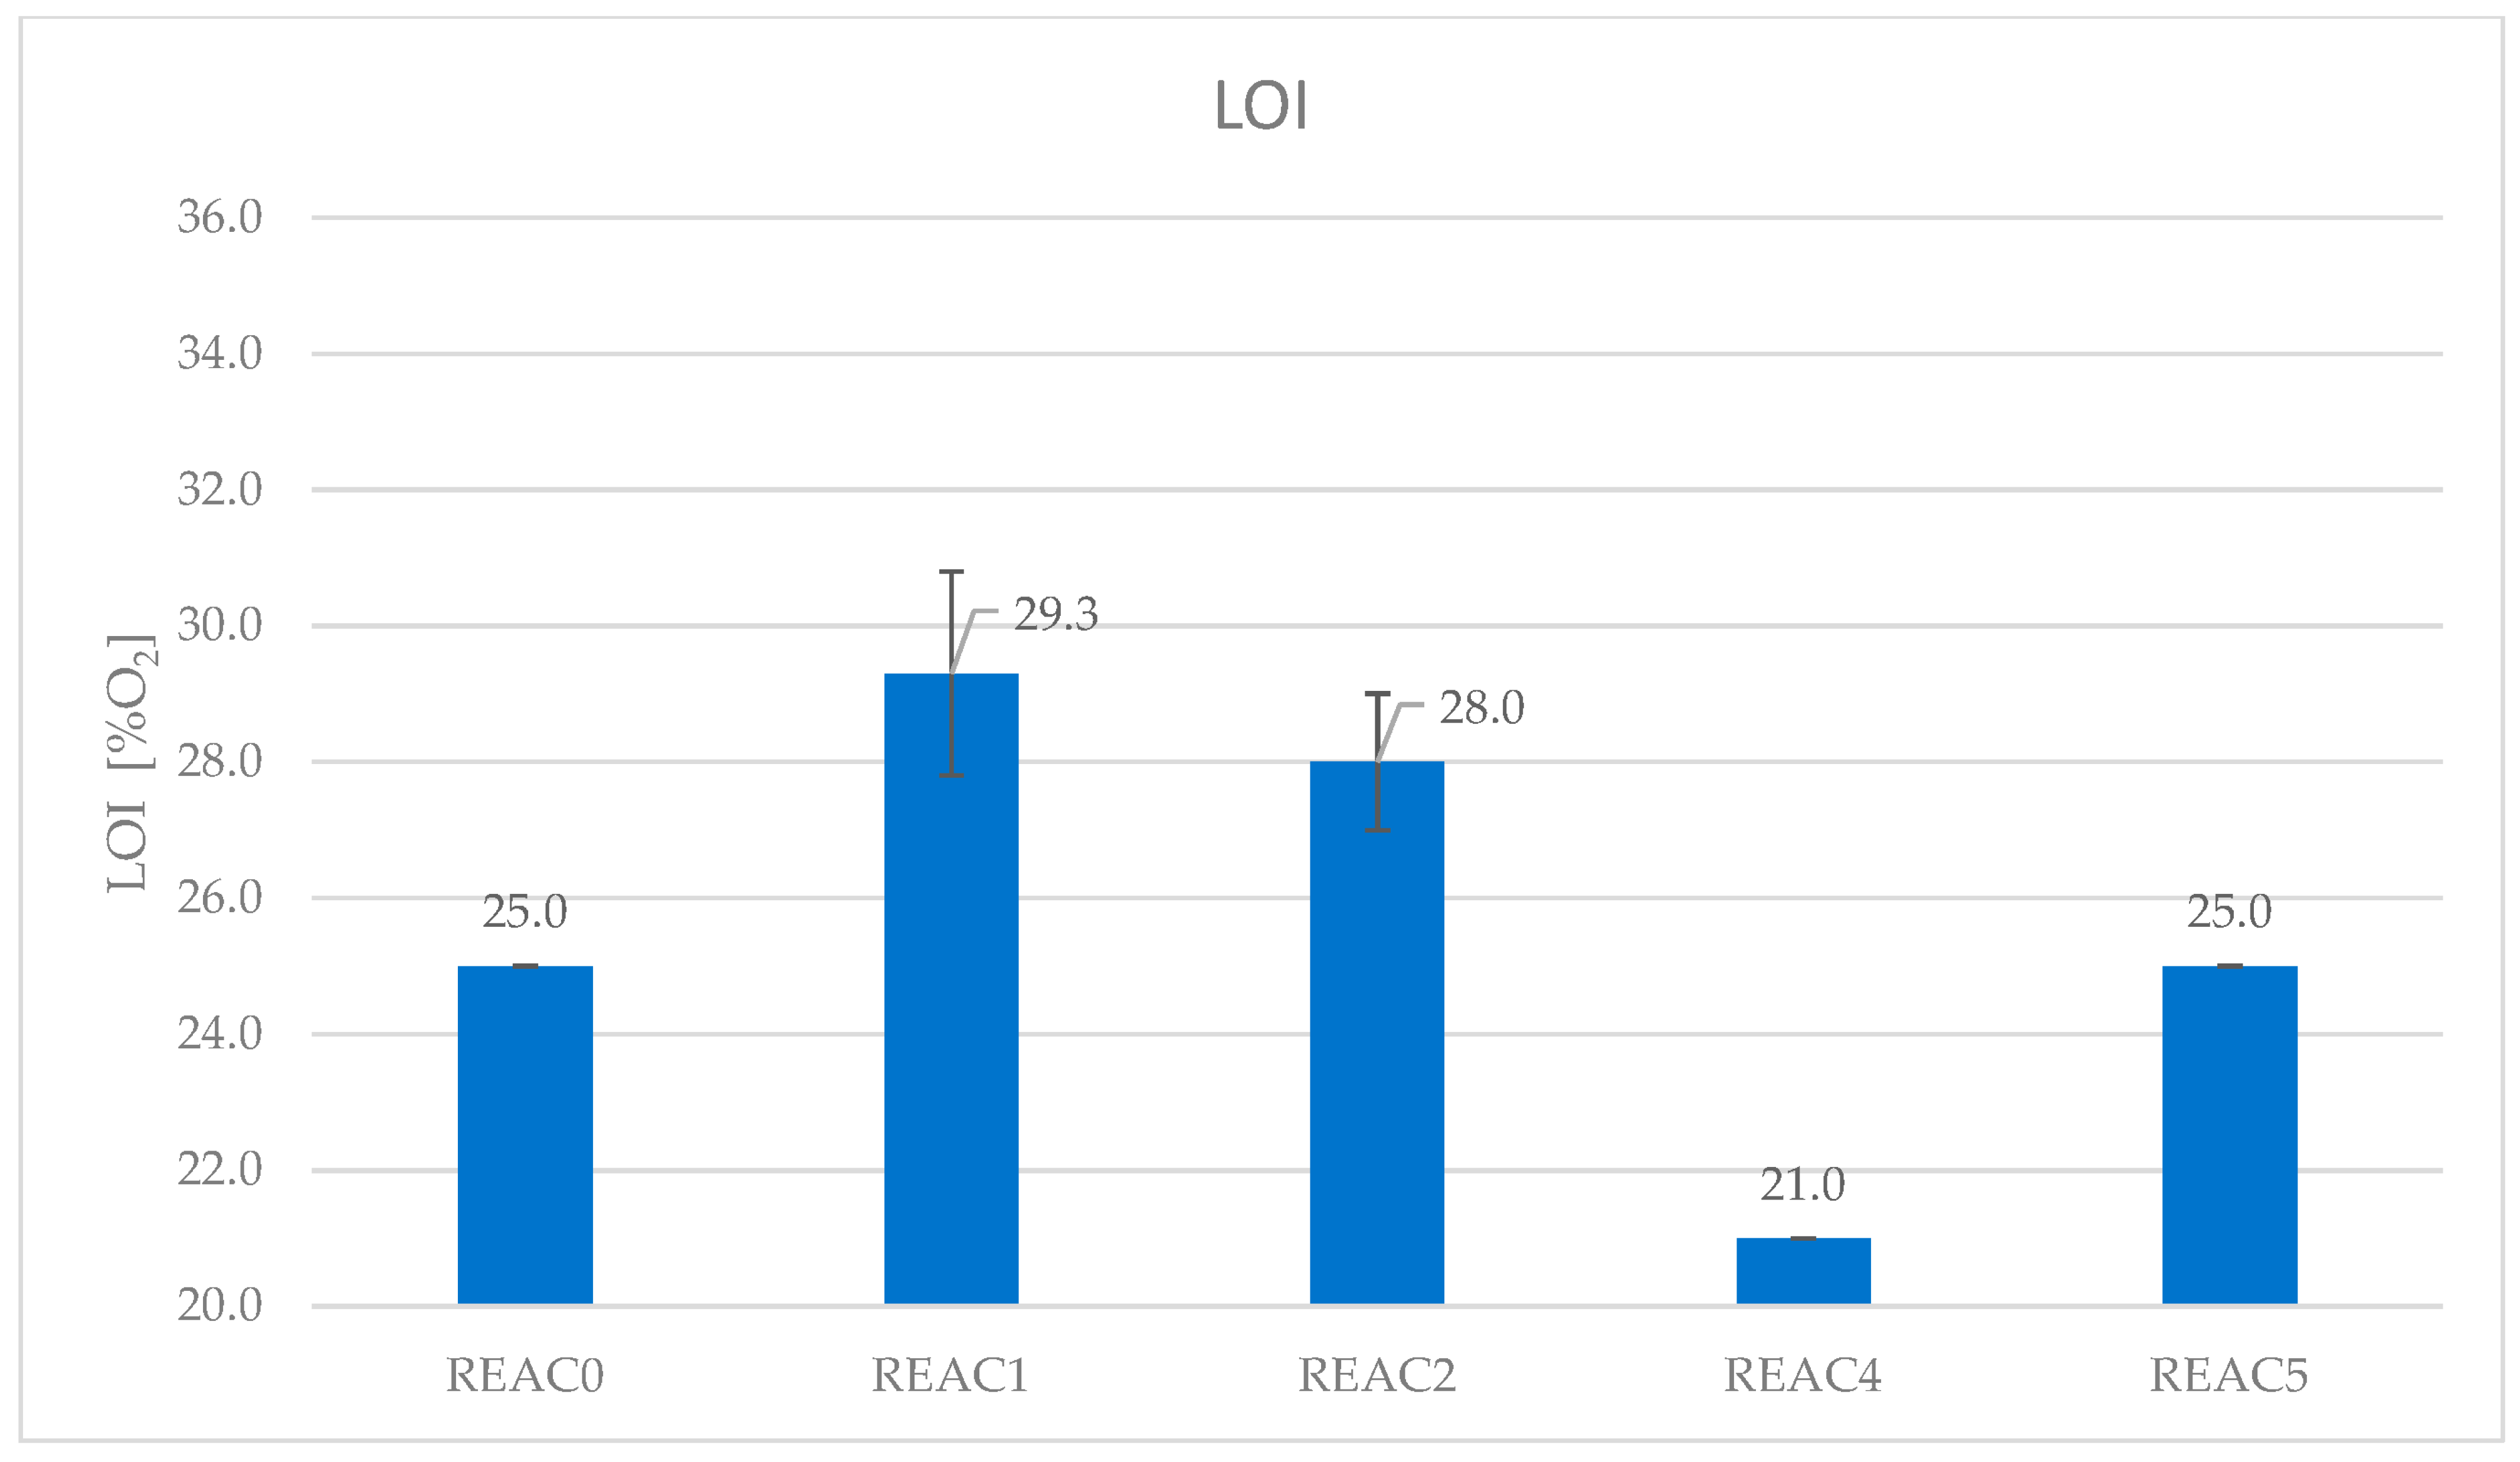
4.2. Effect of Acid Scavenging on LOI
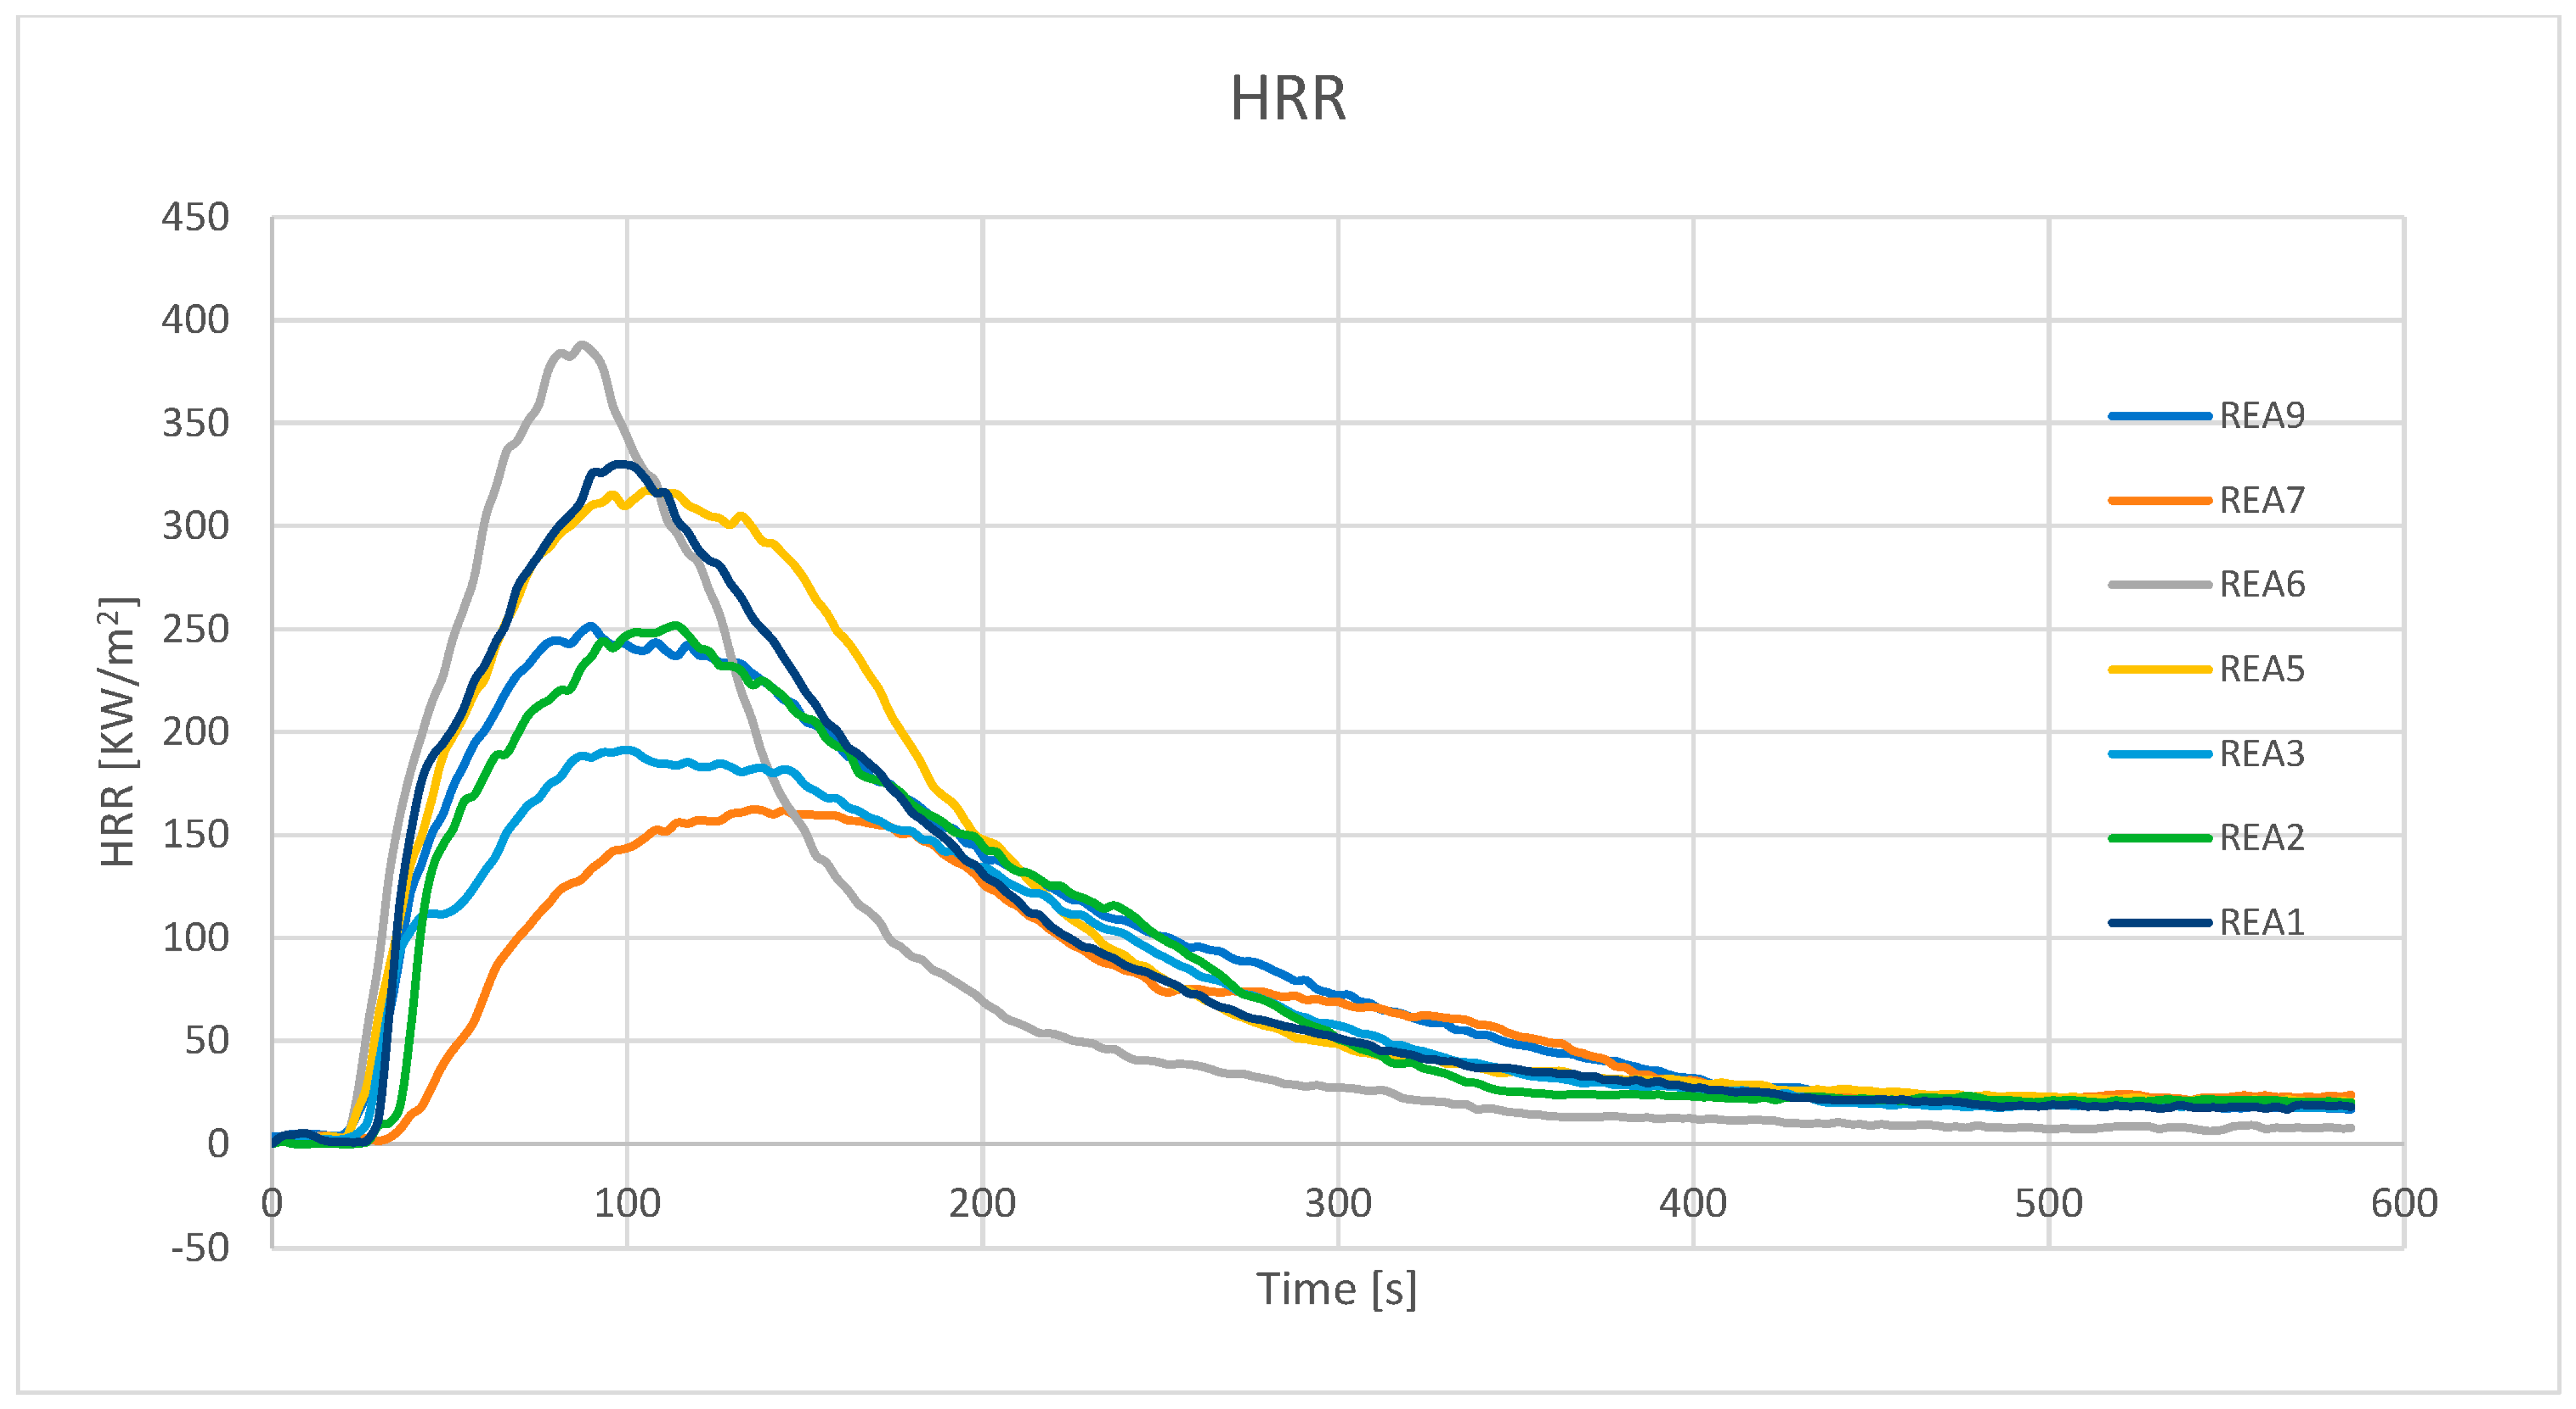
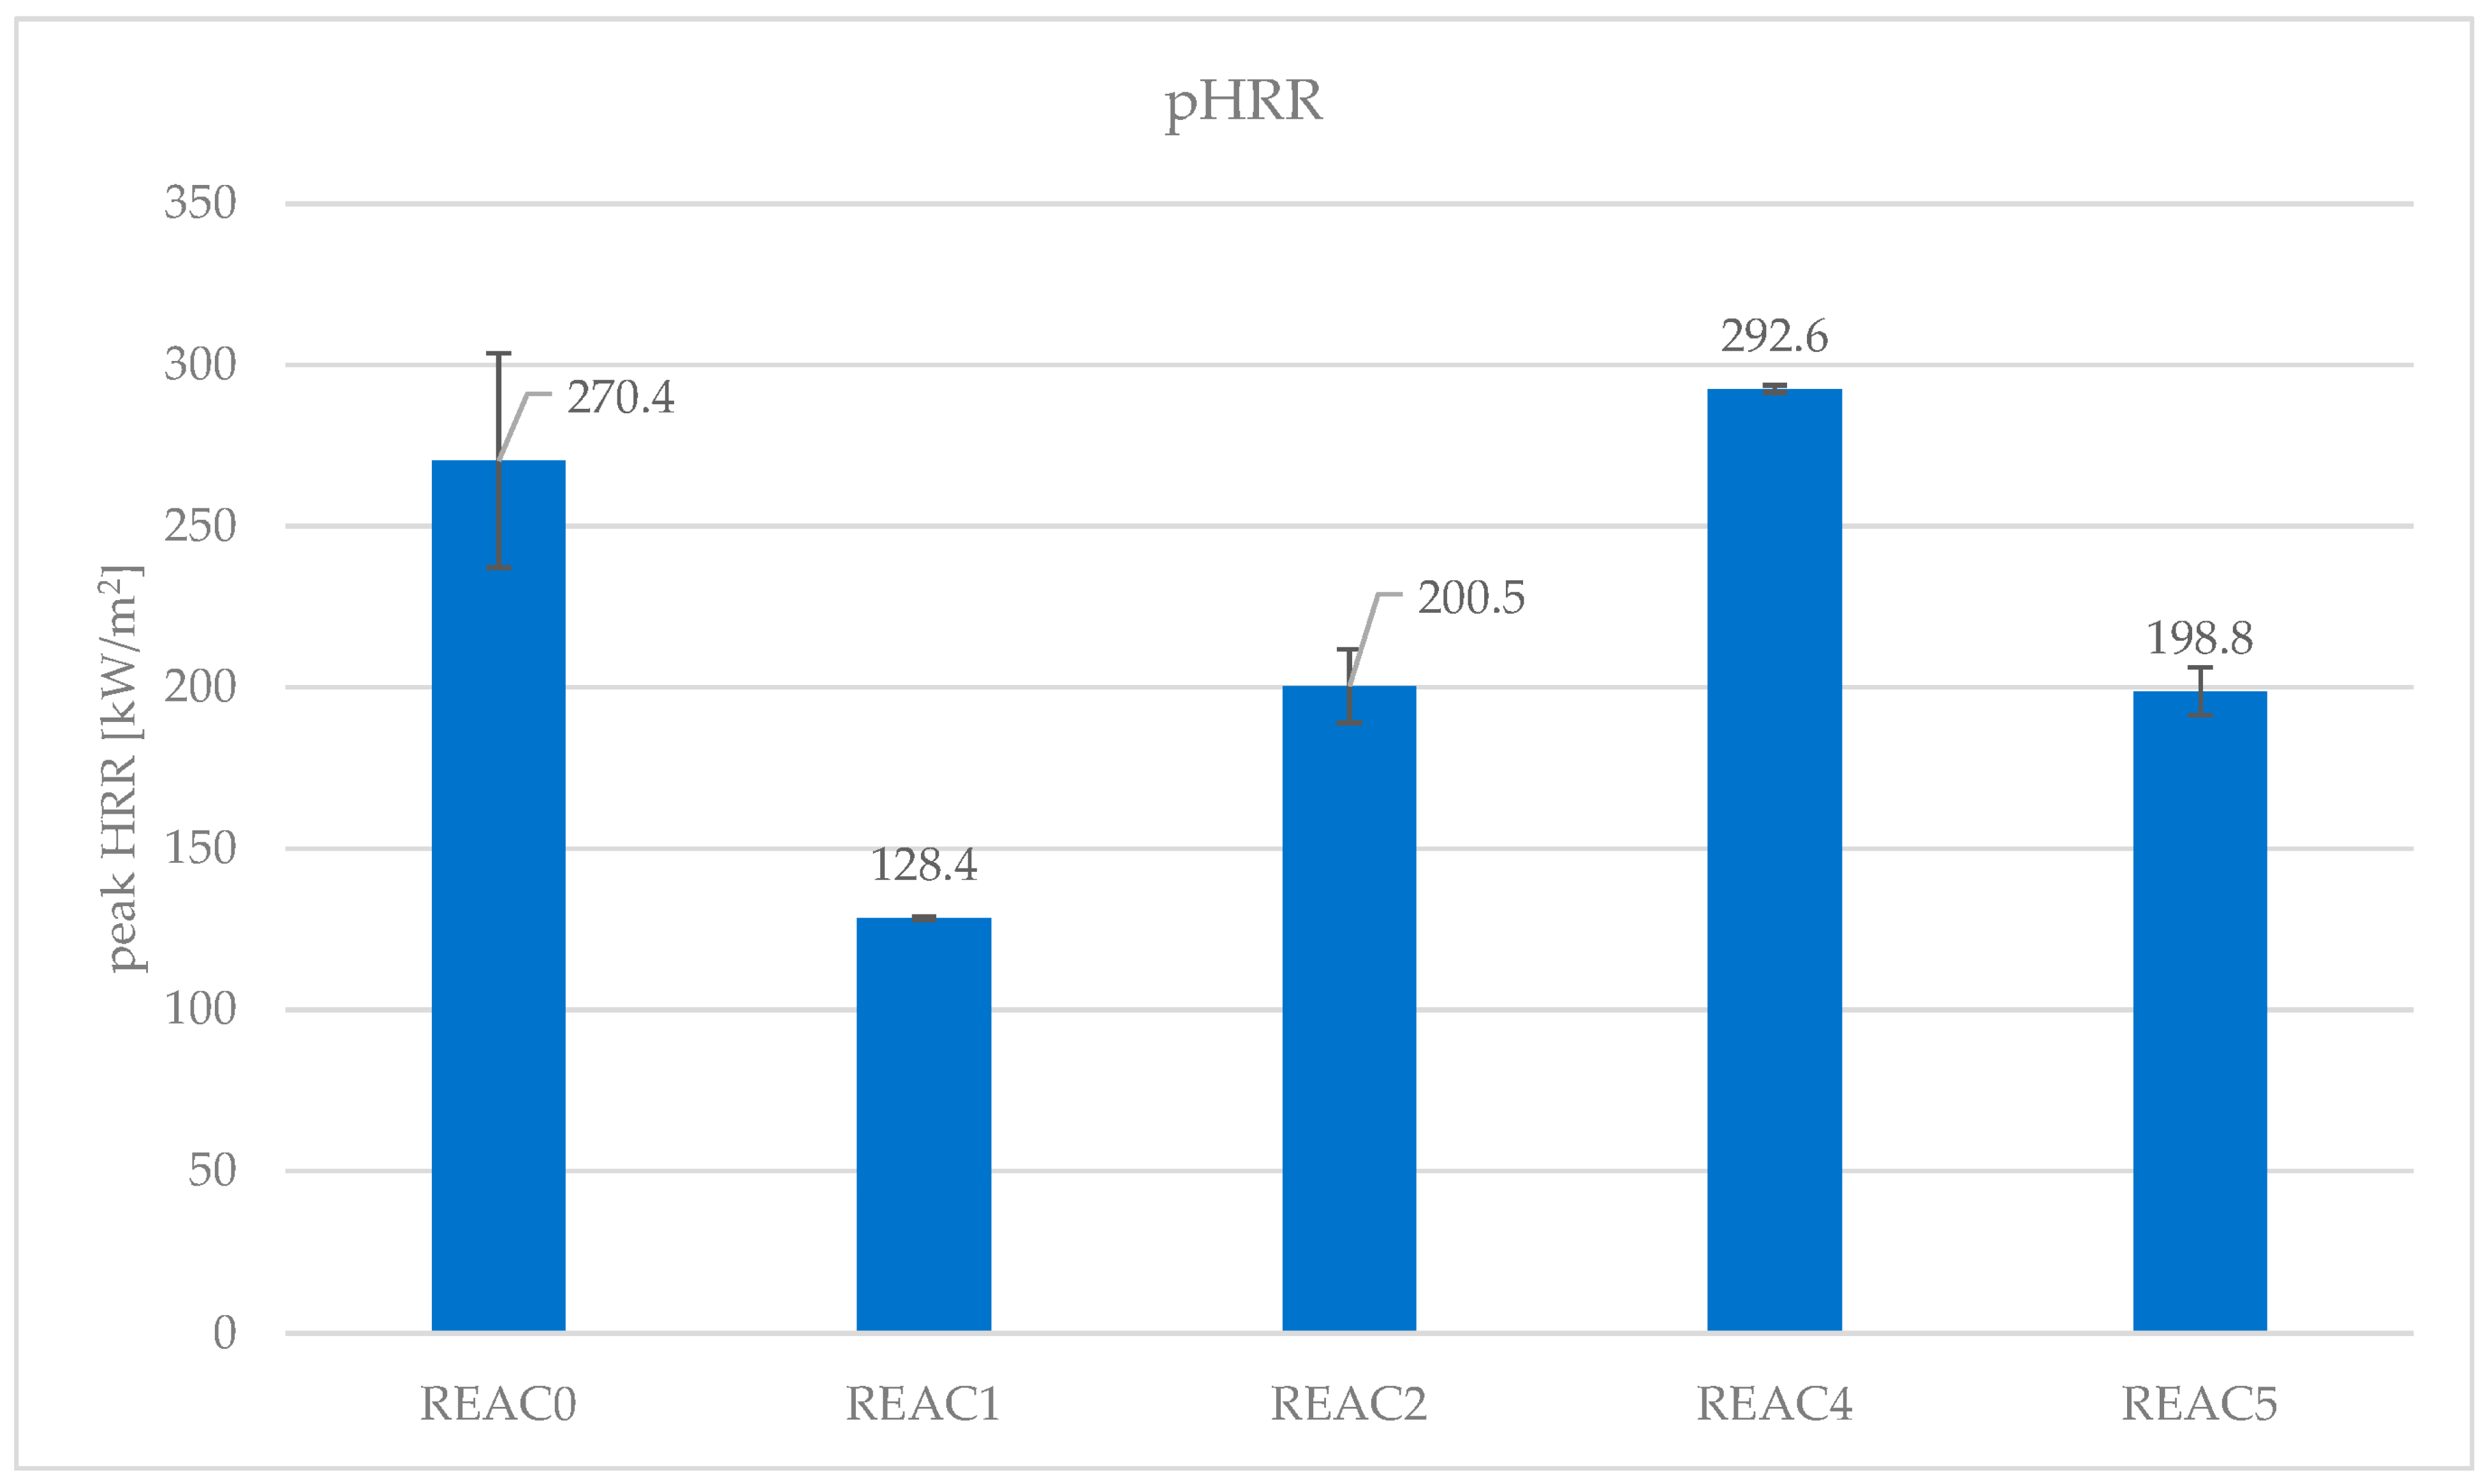
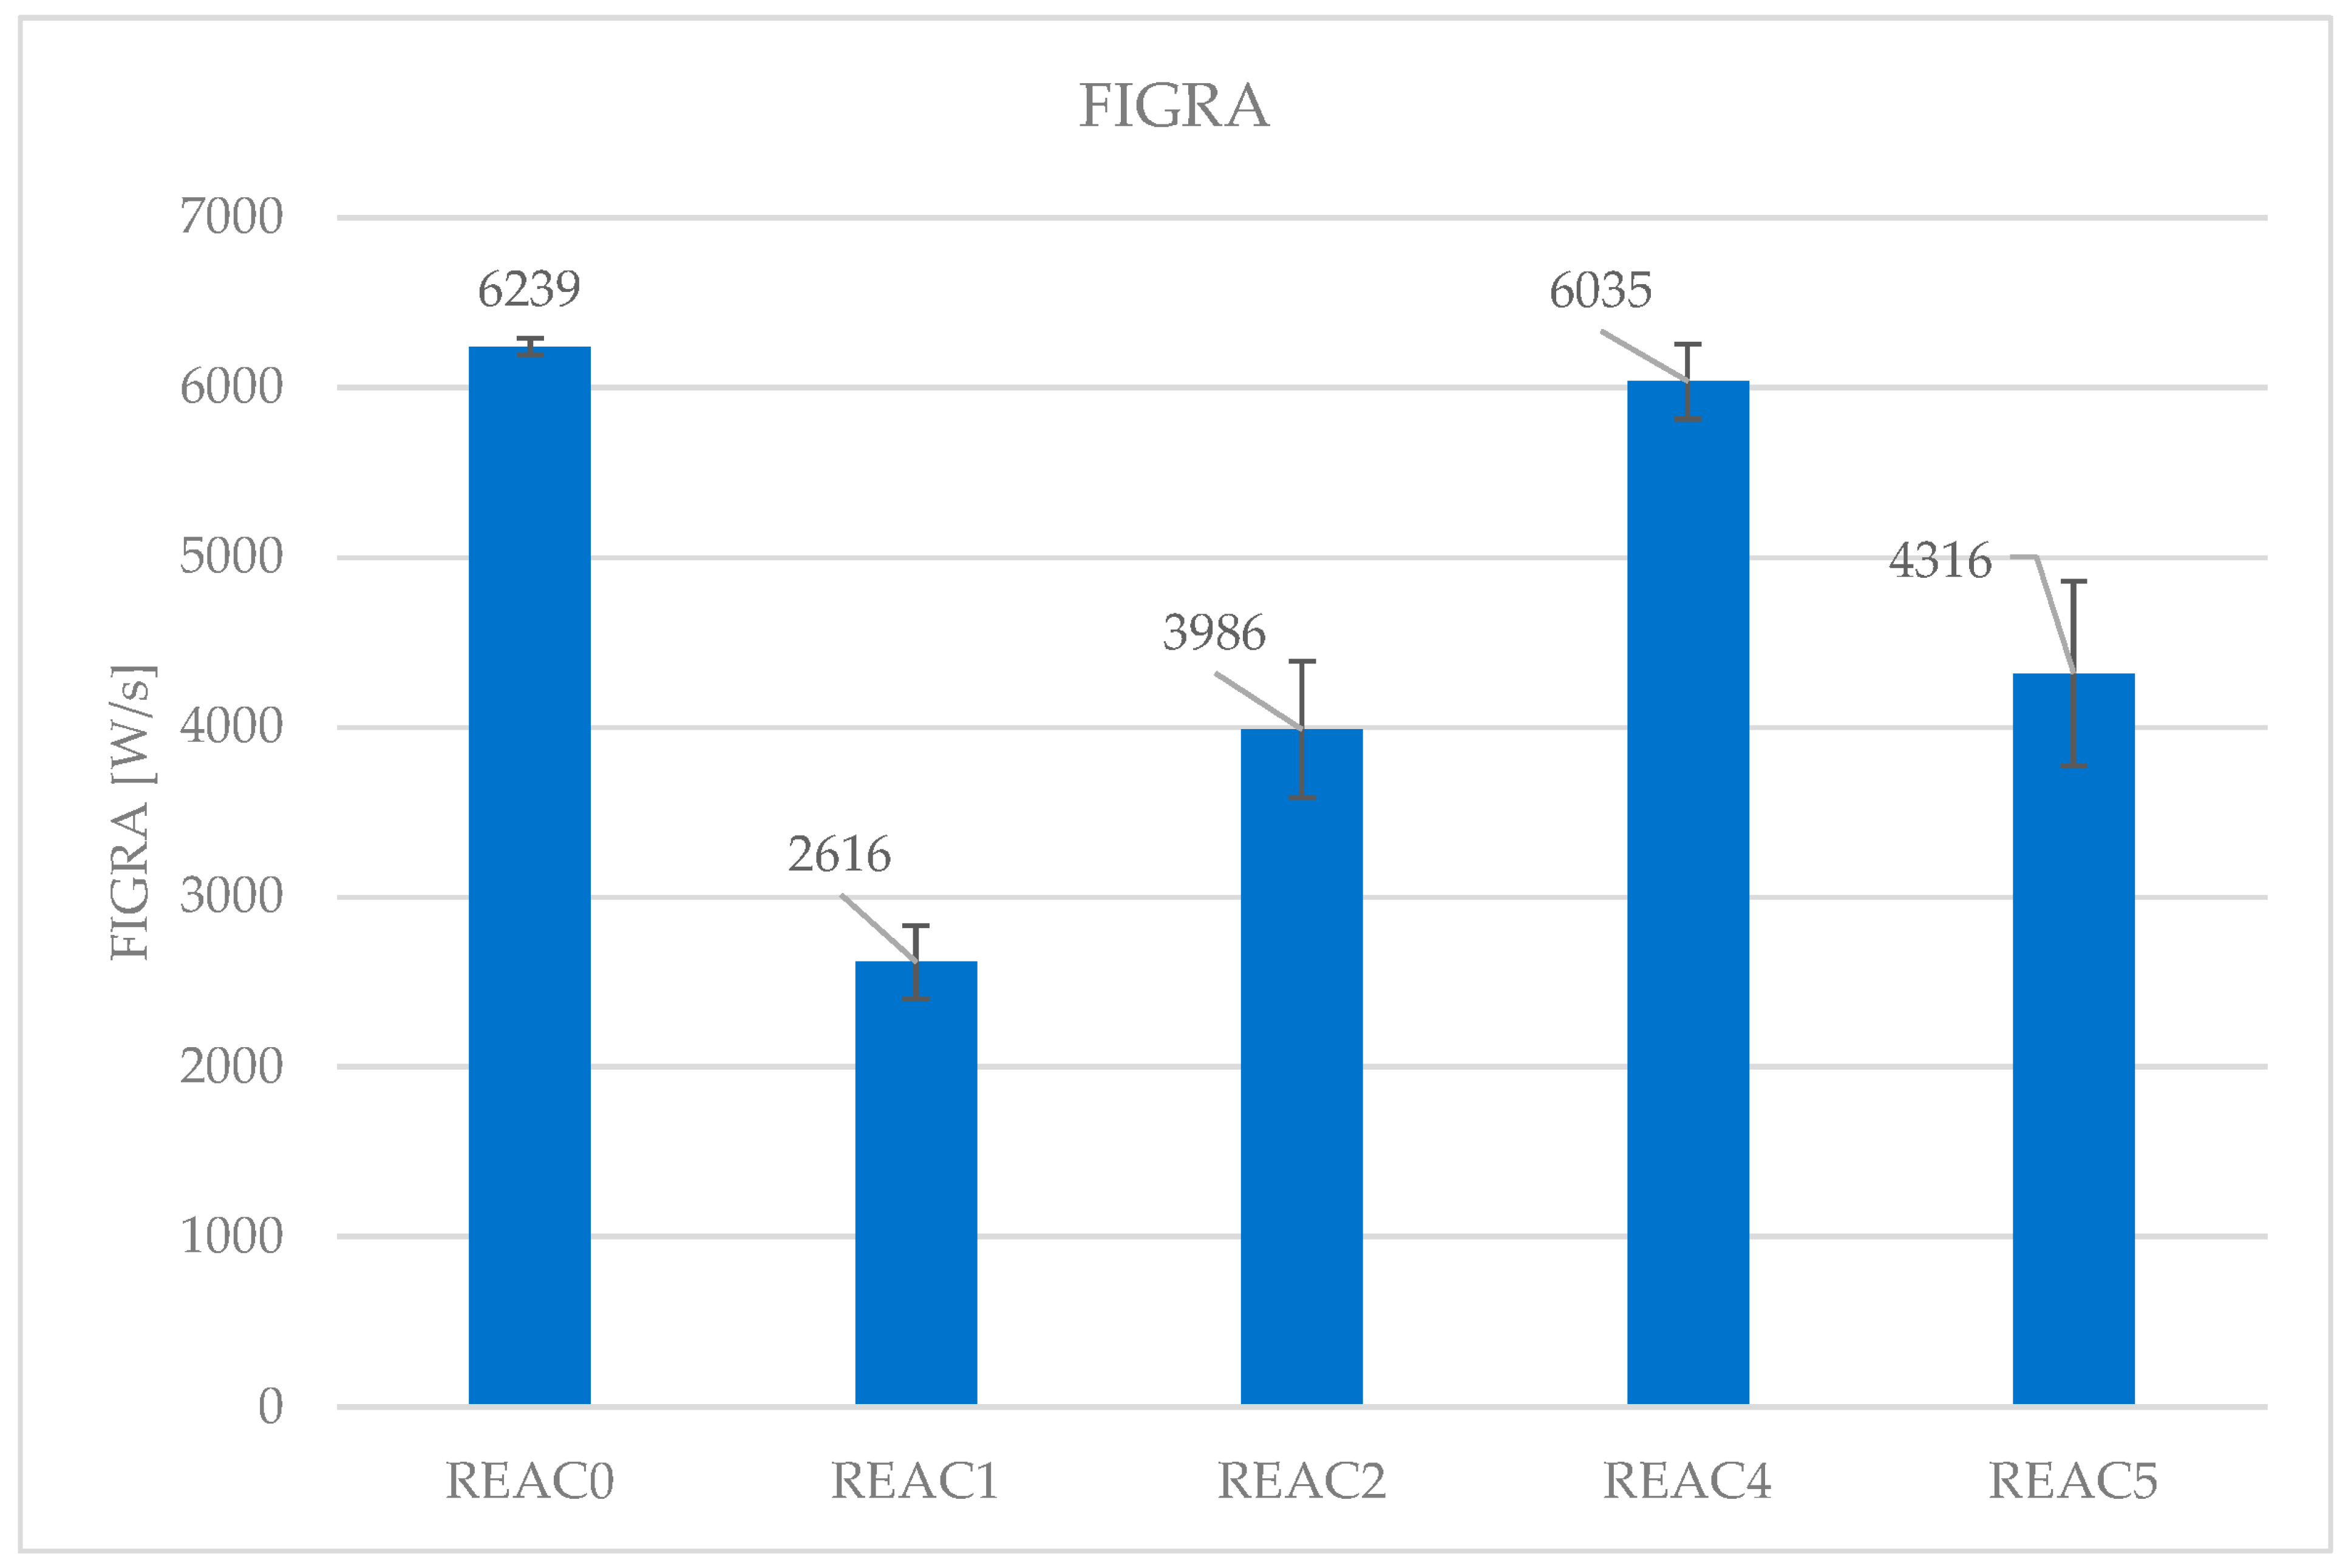
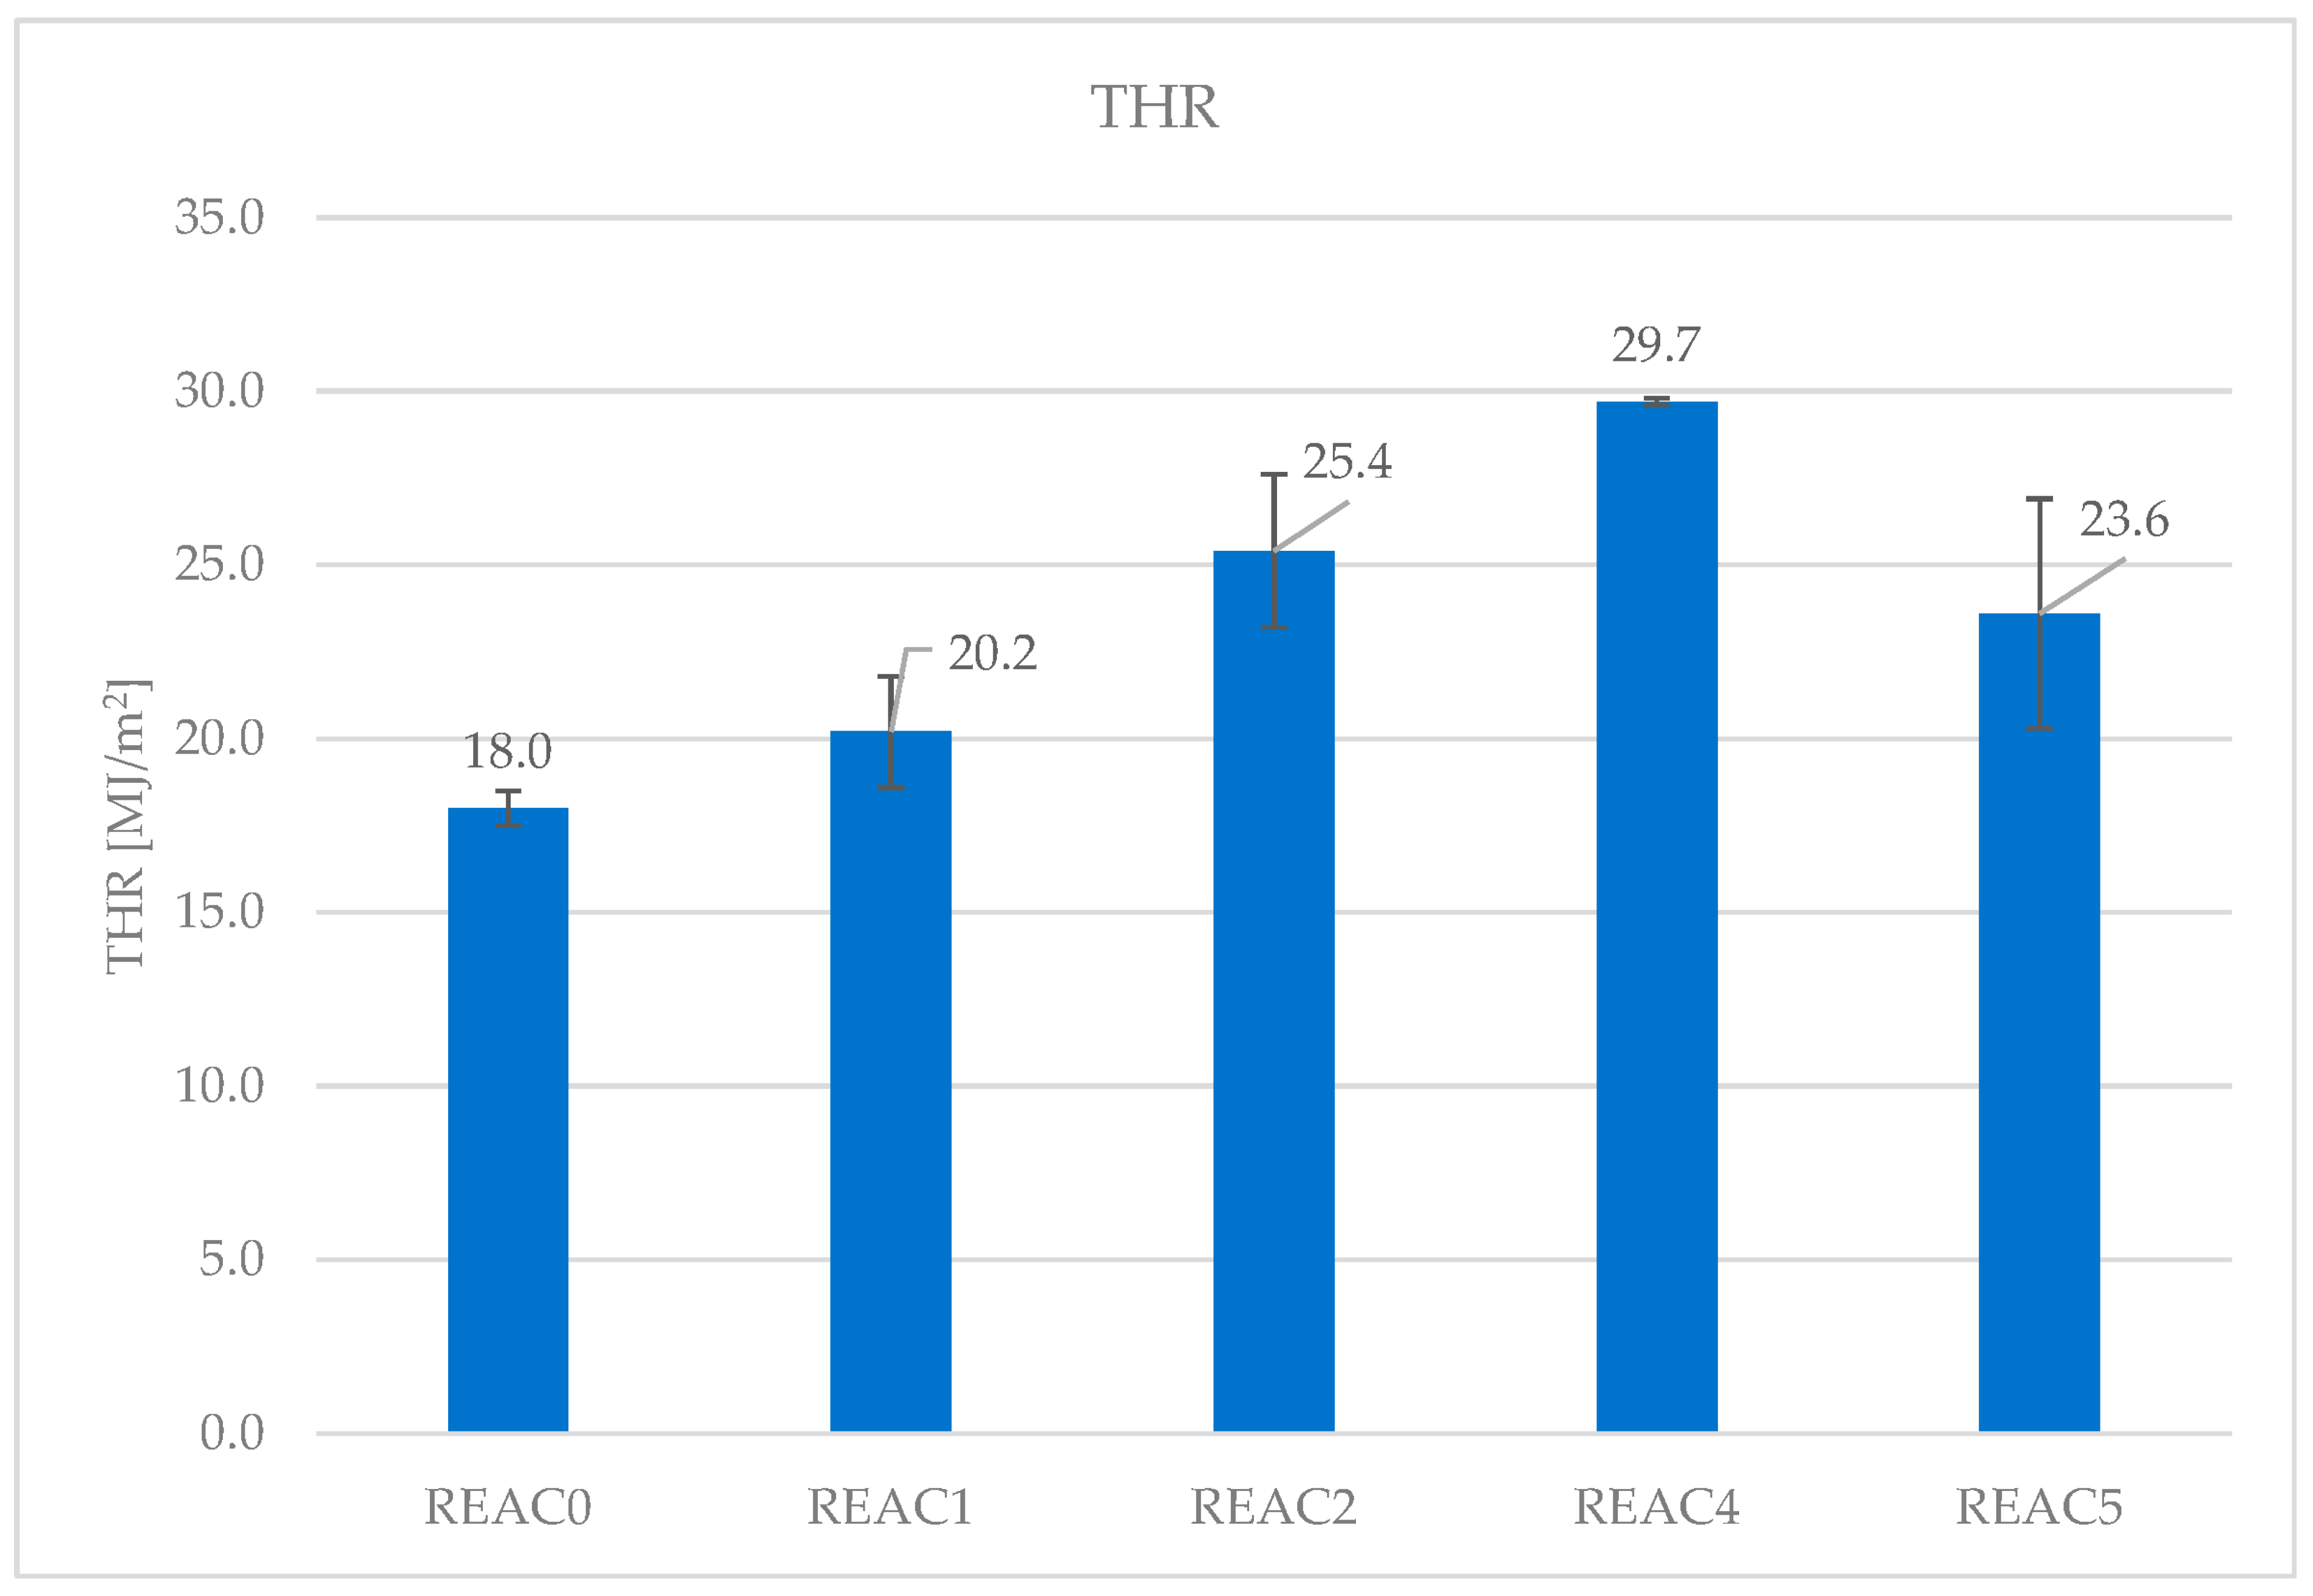
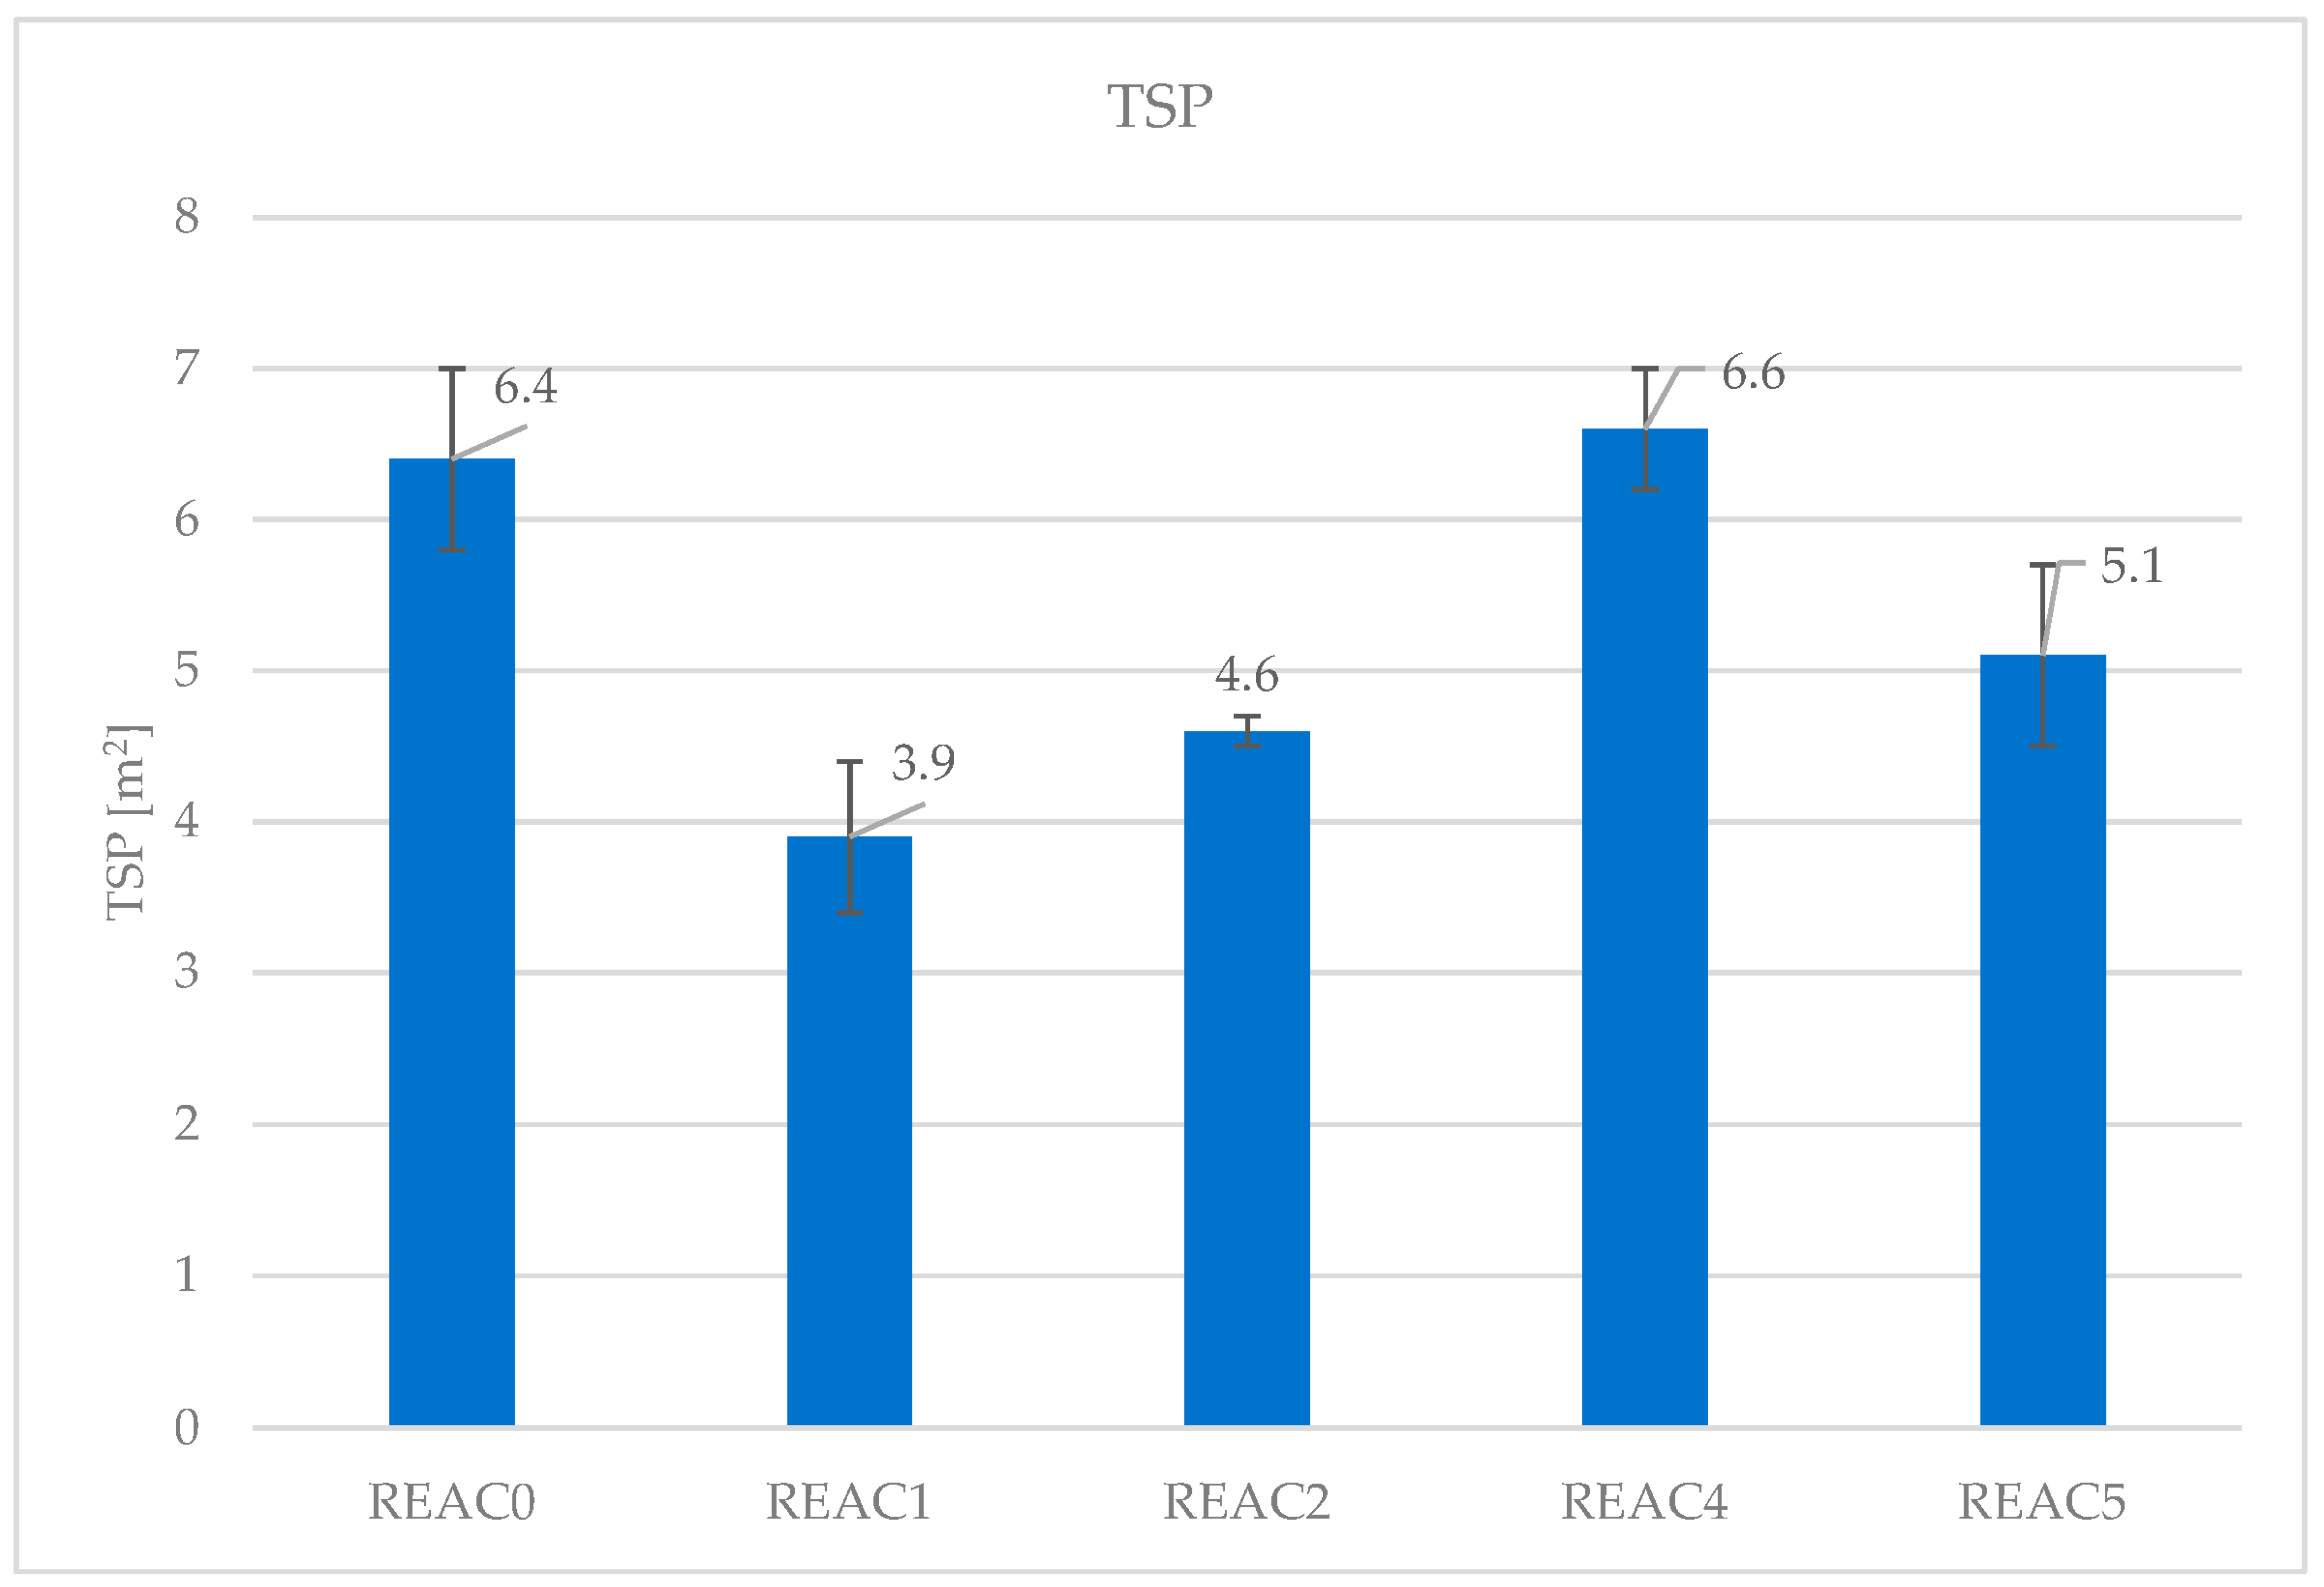
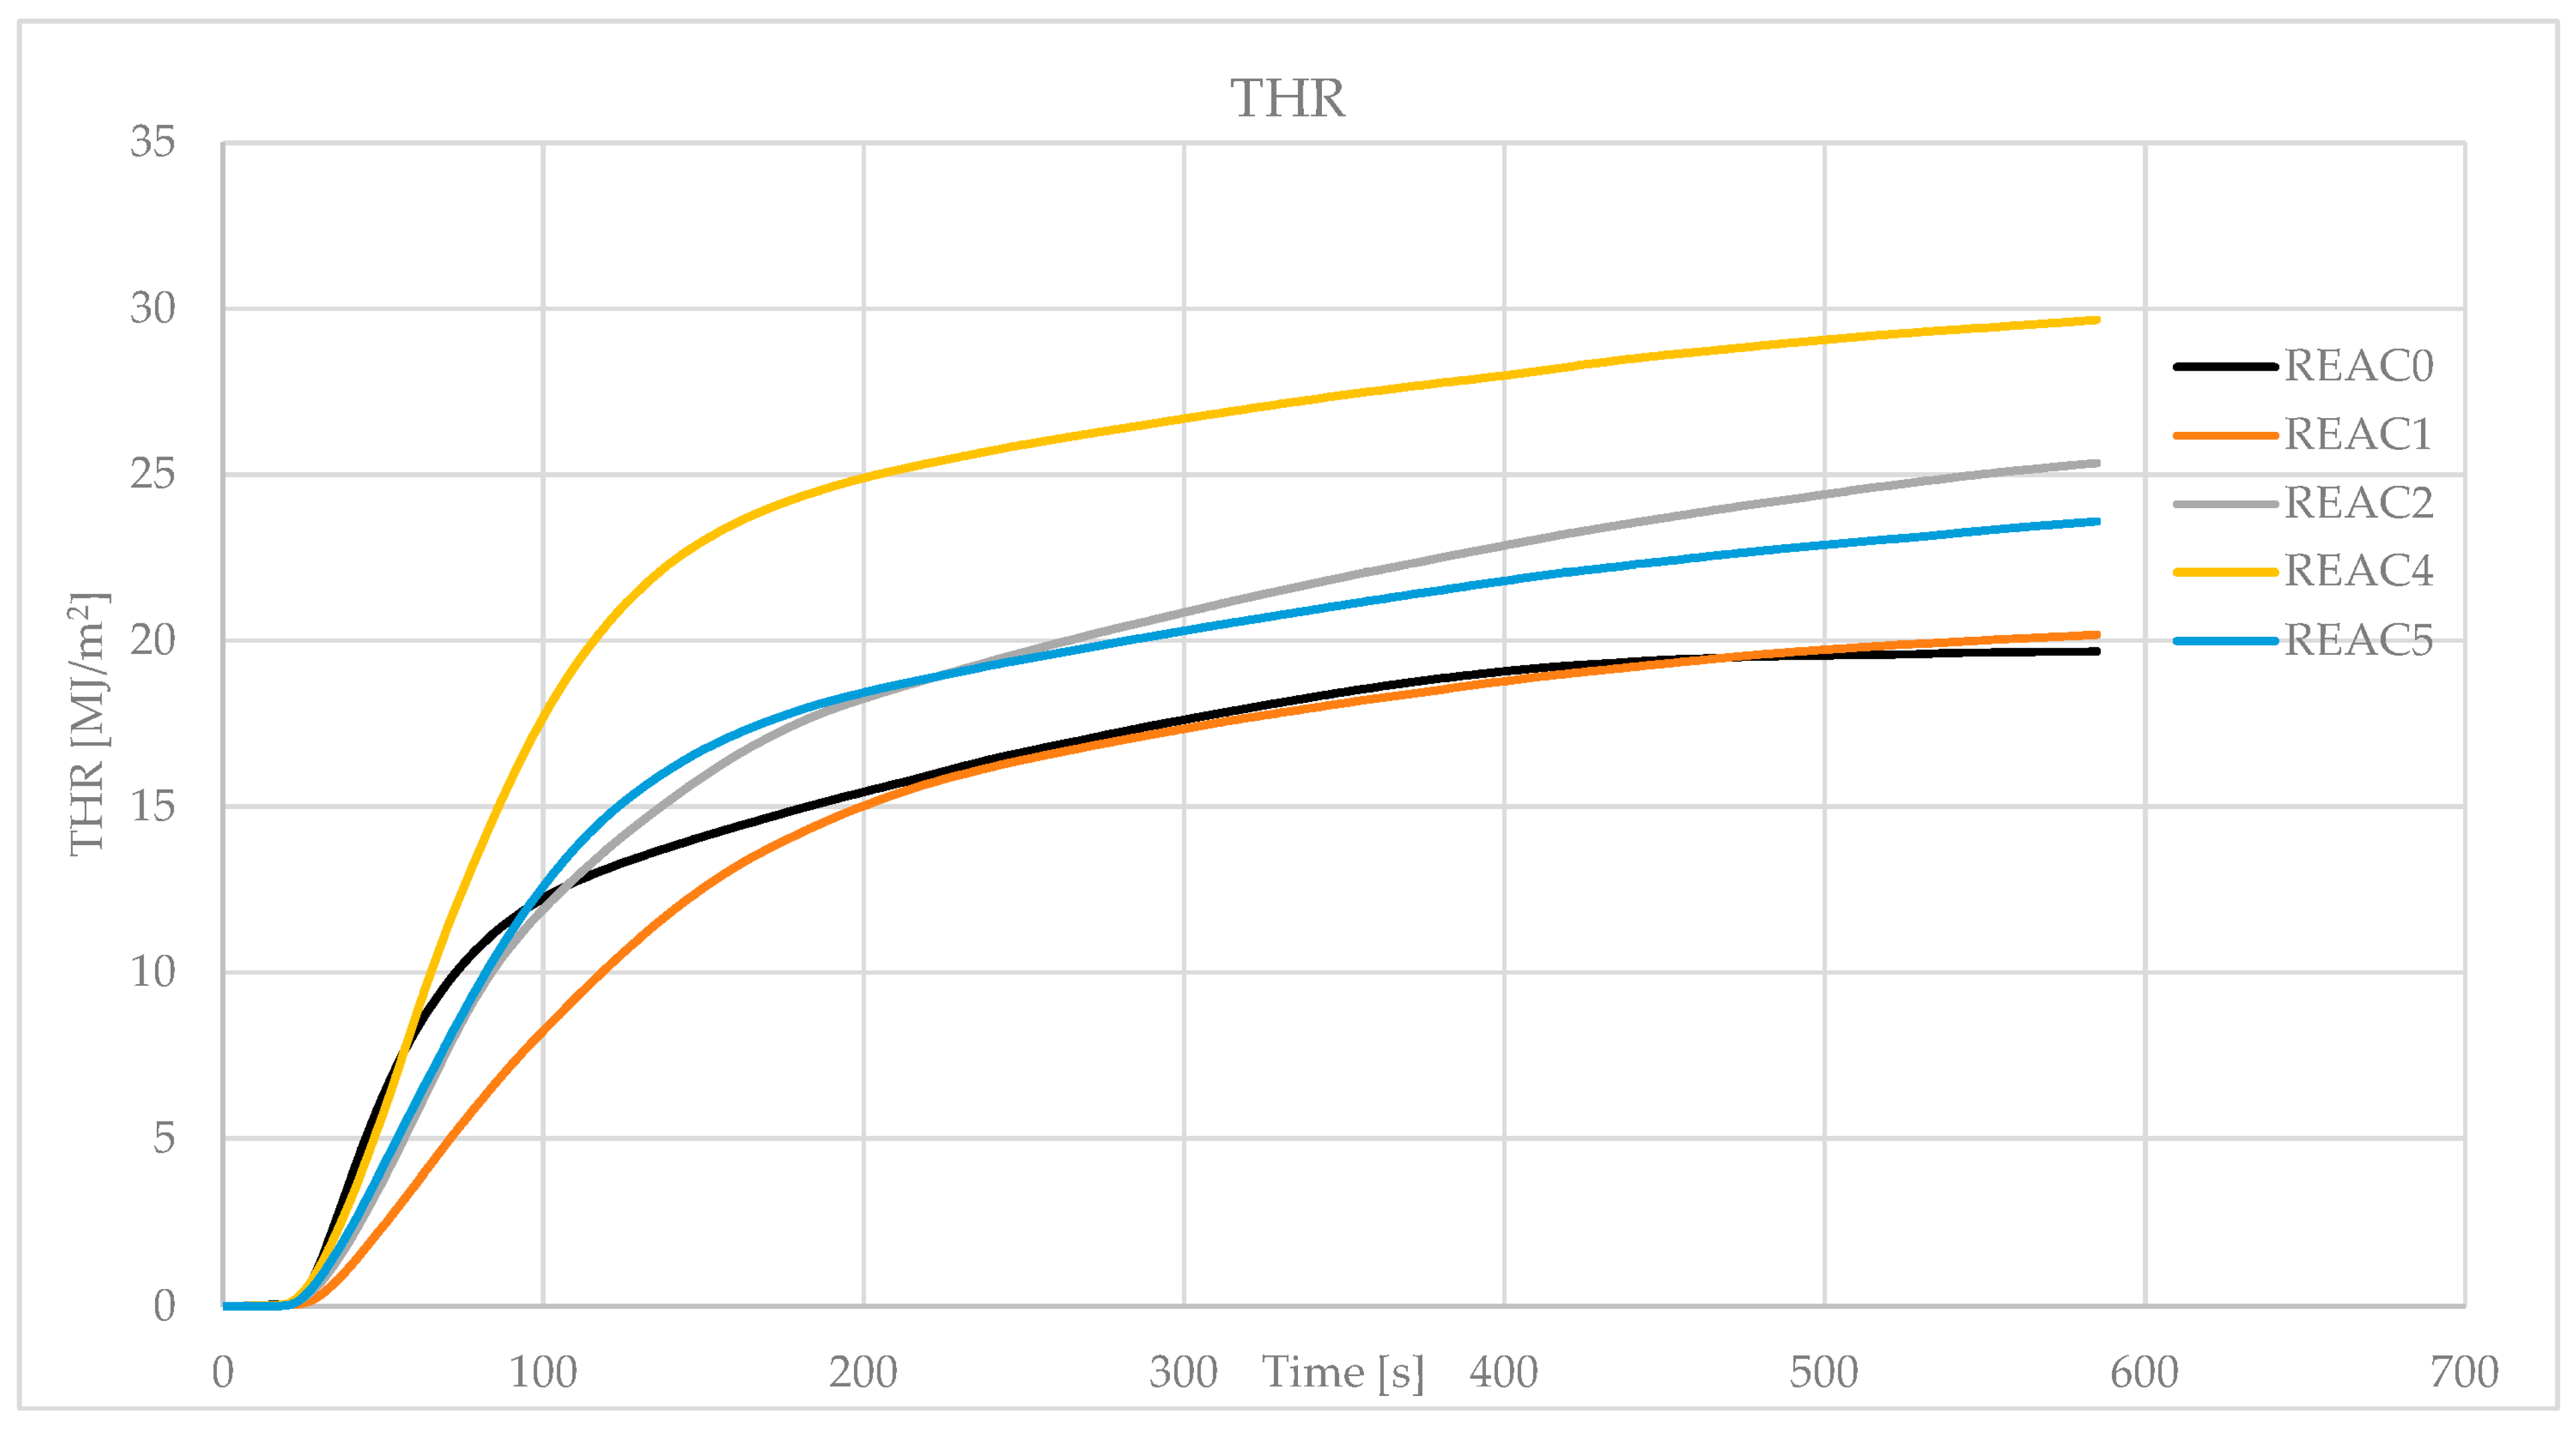
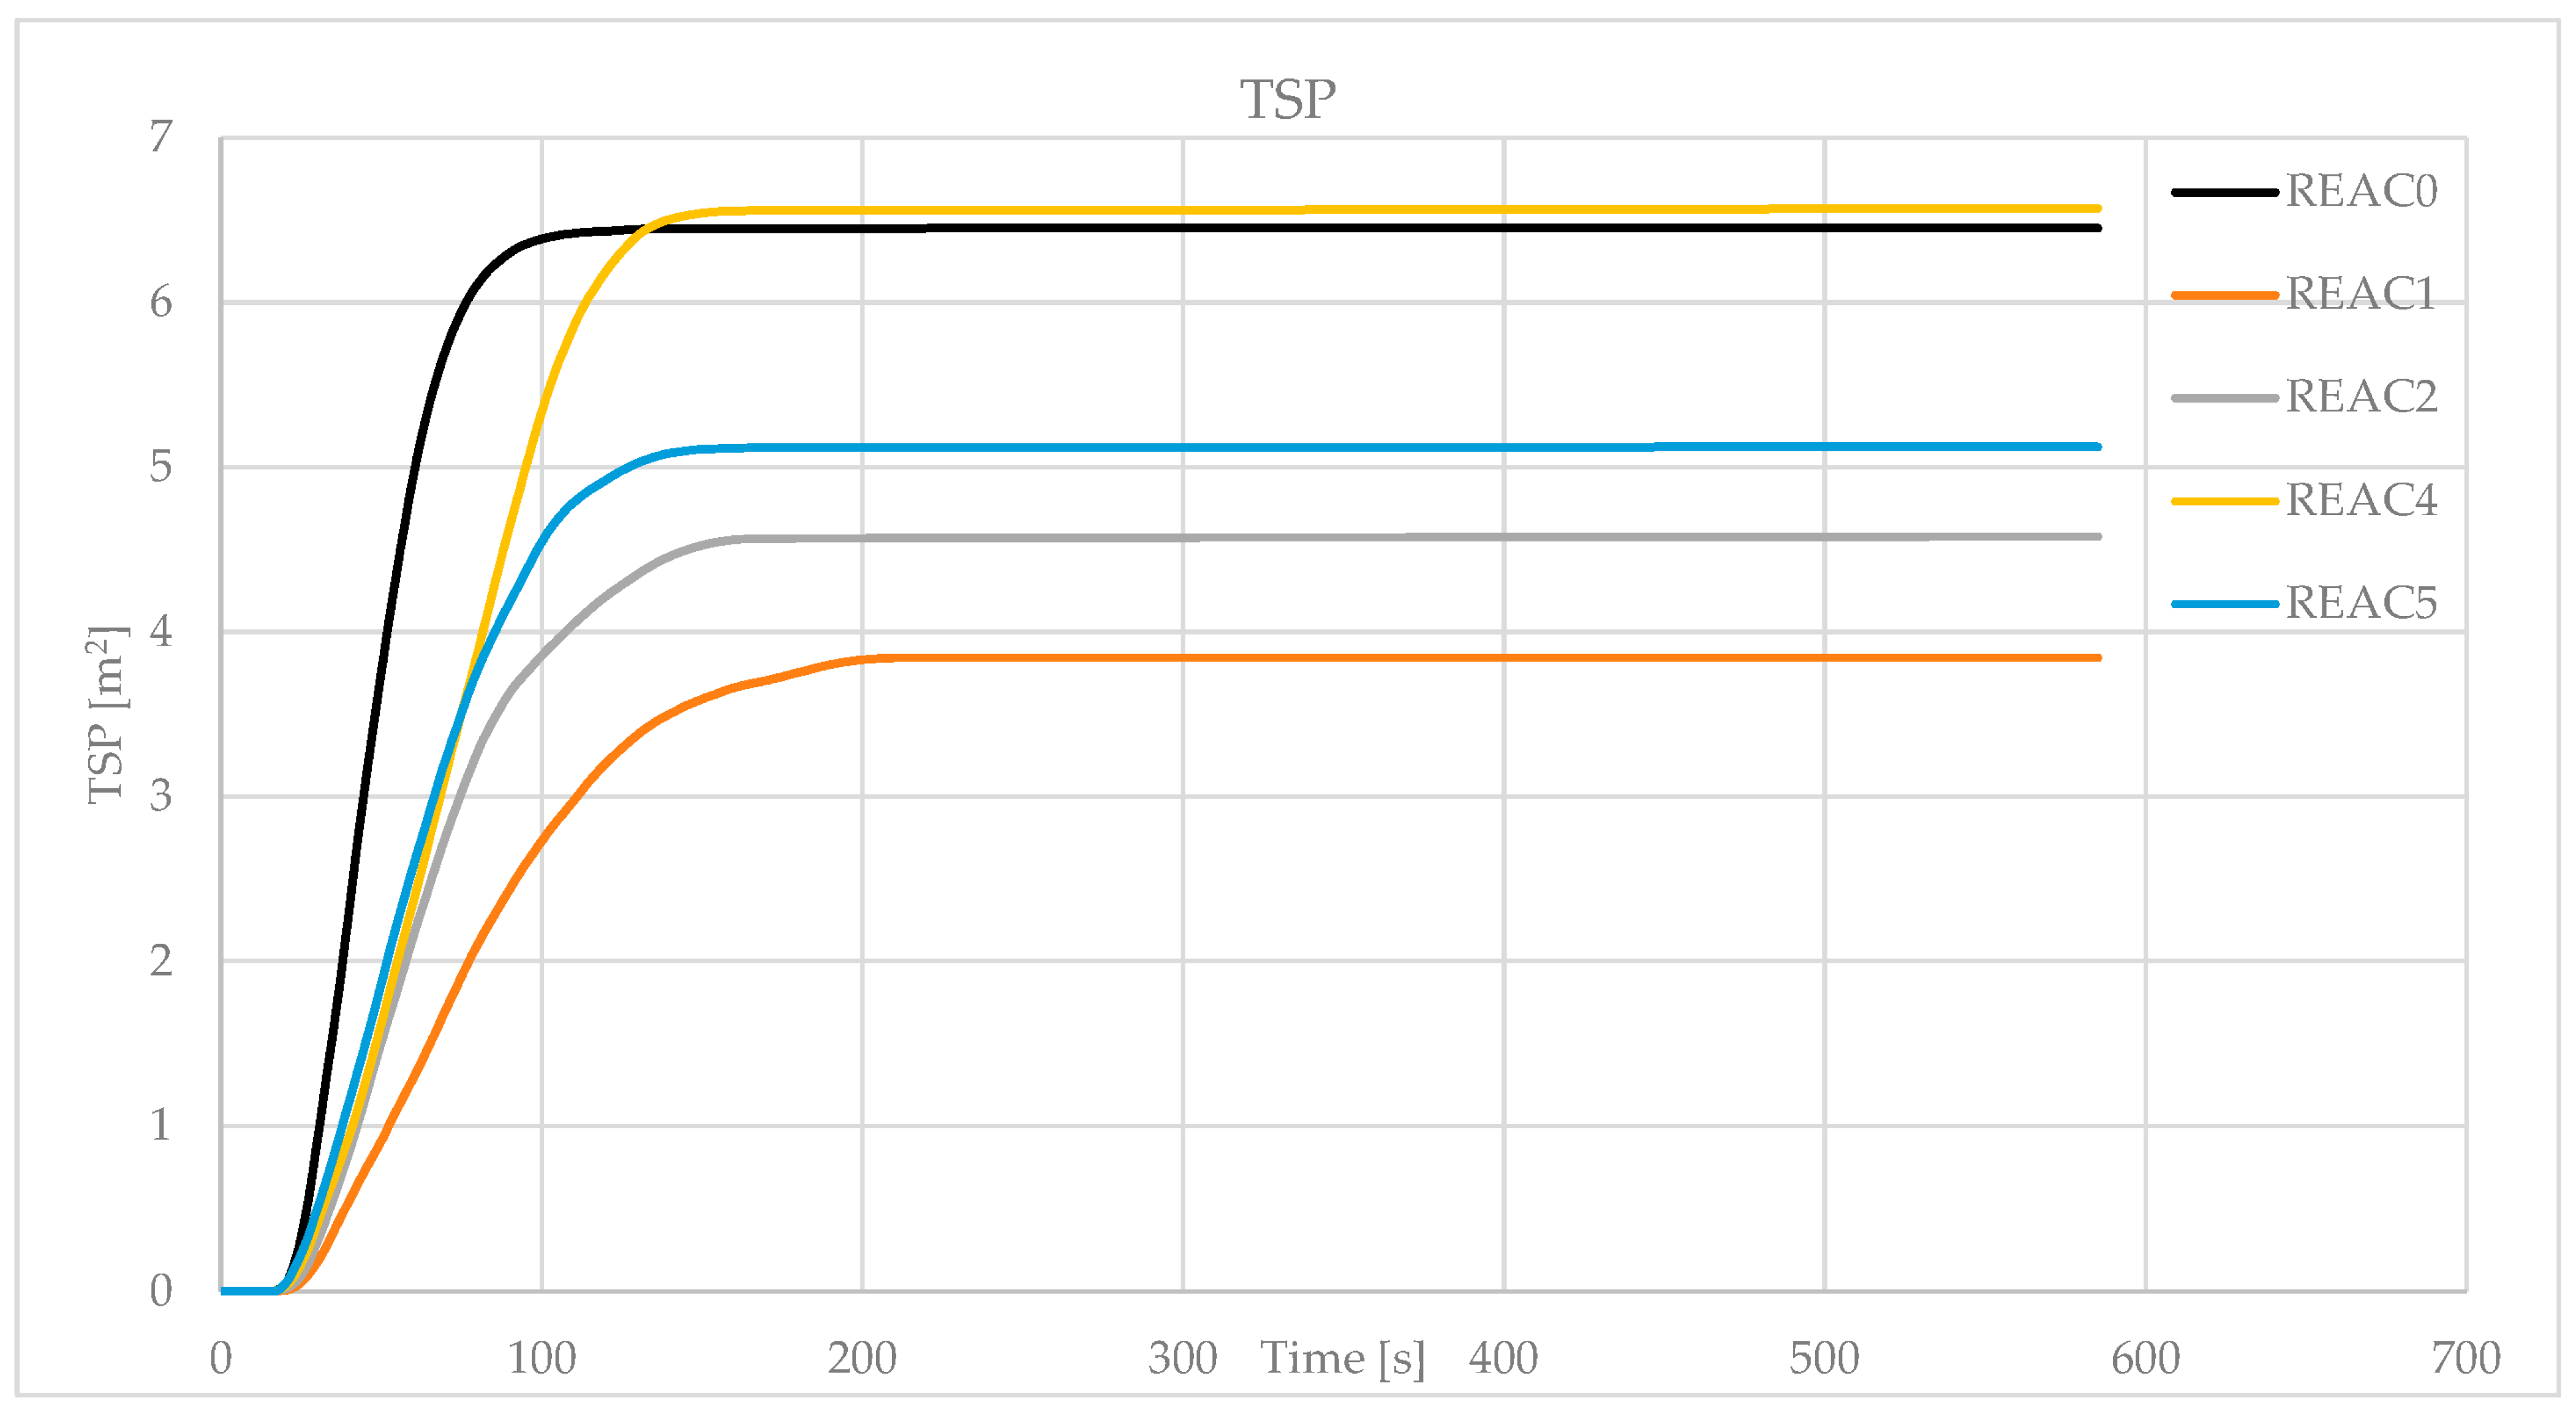
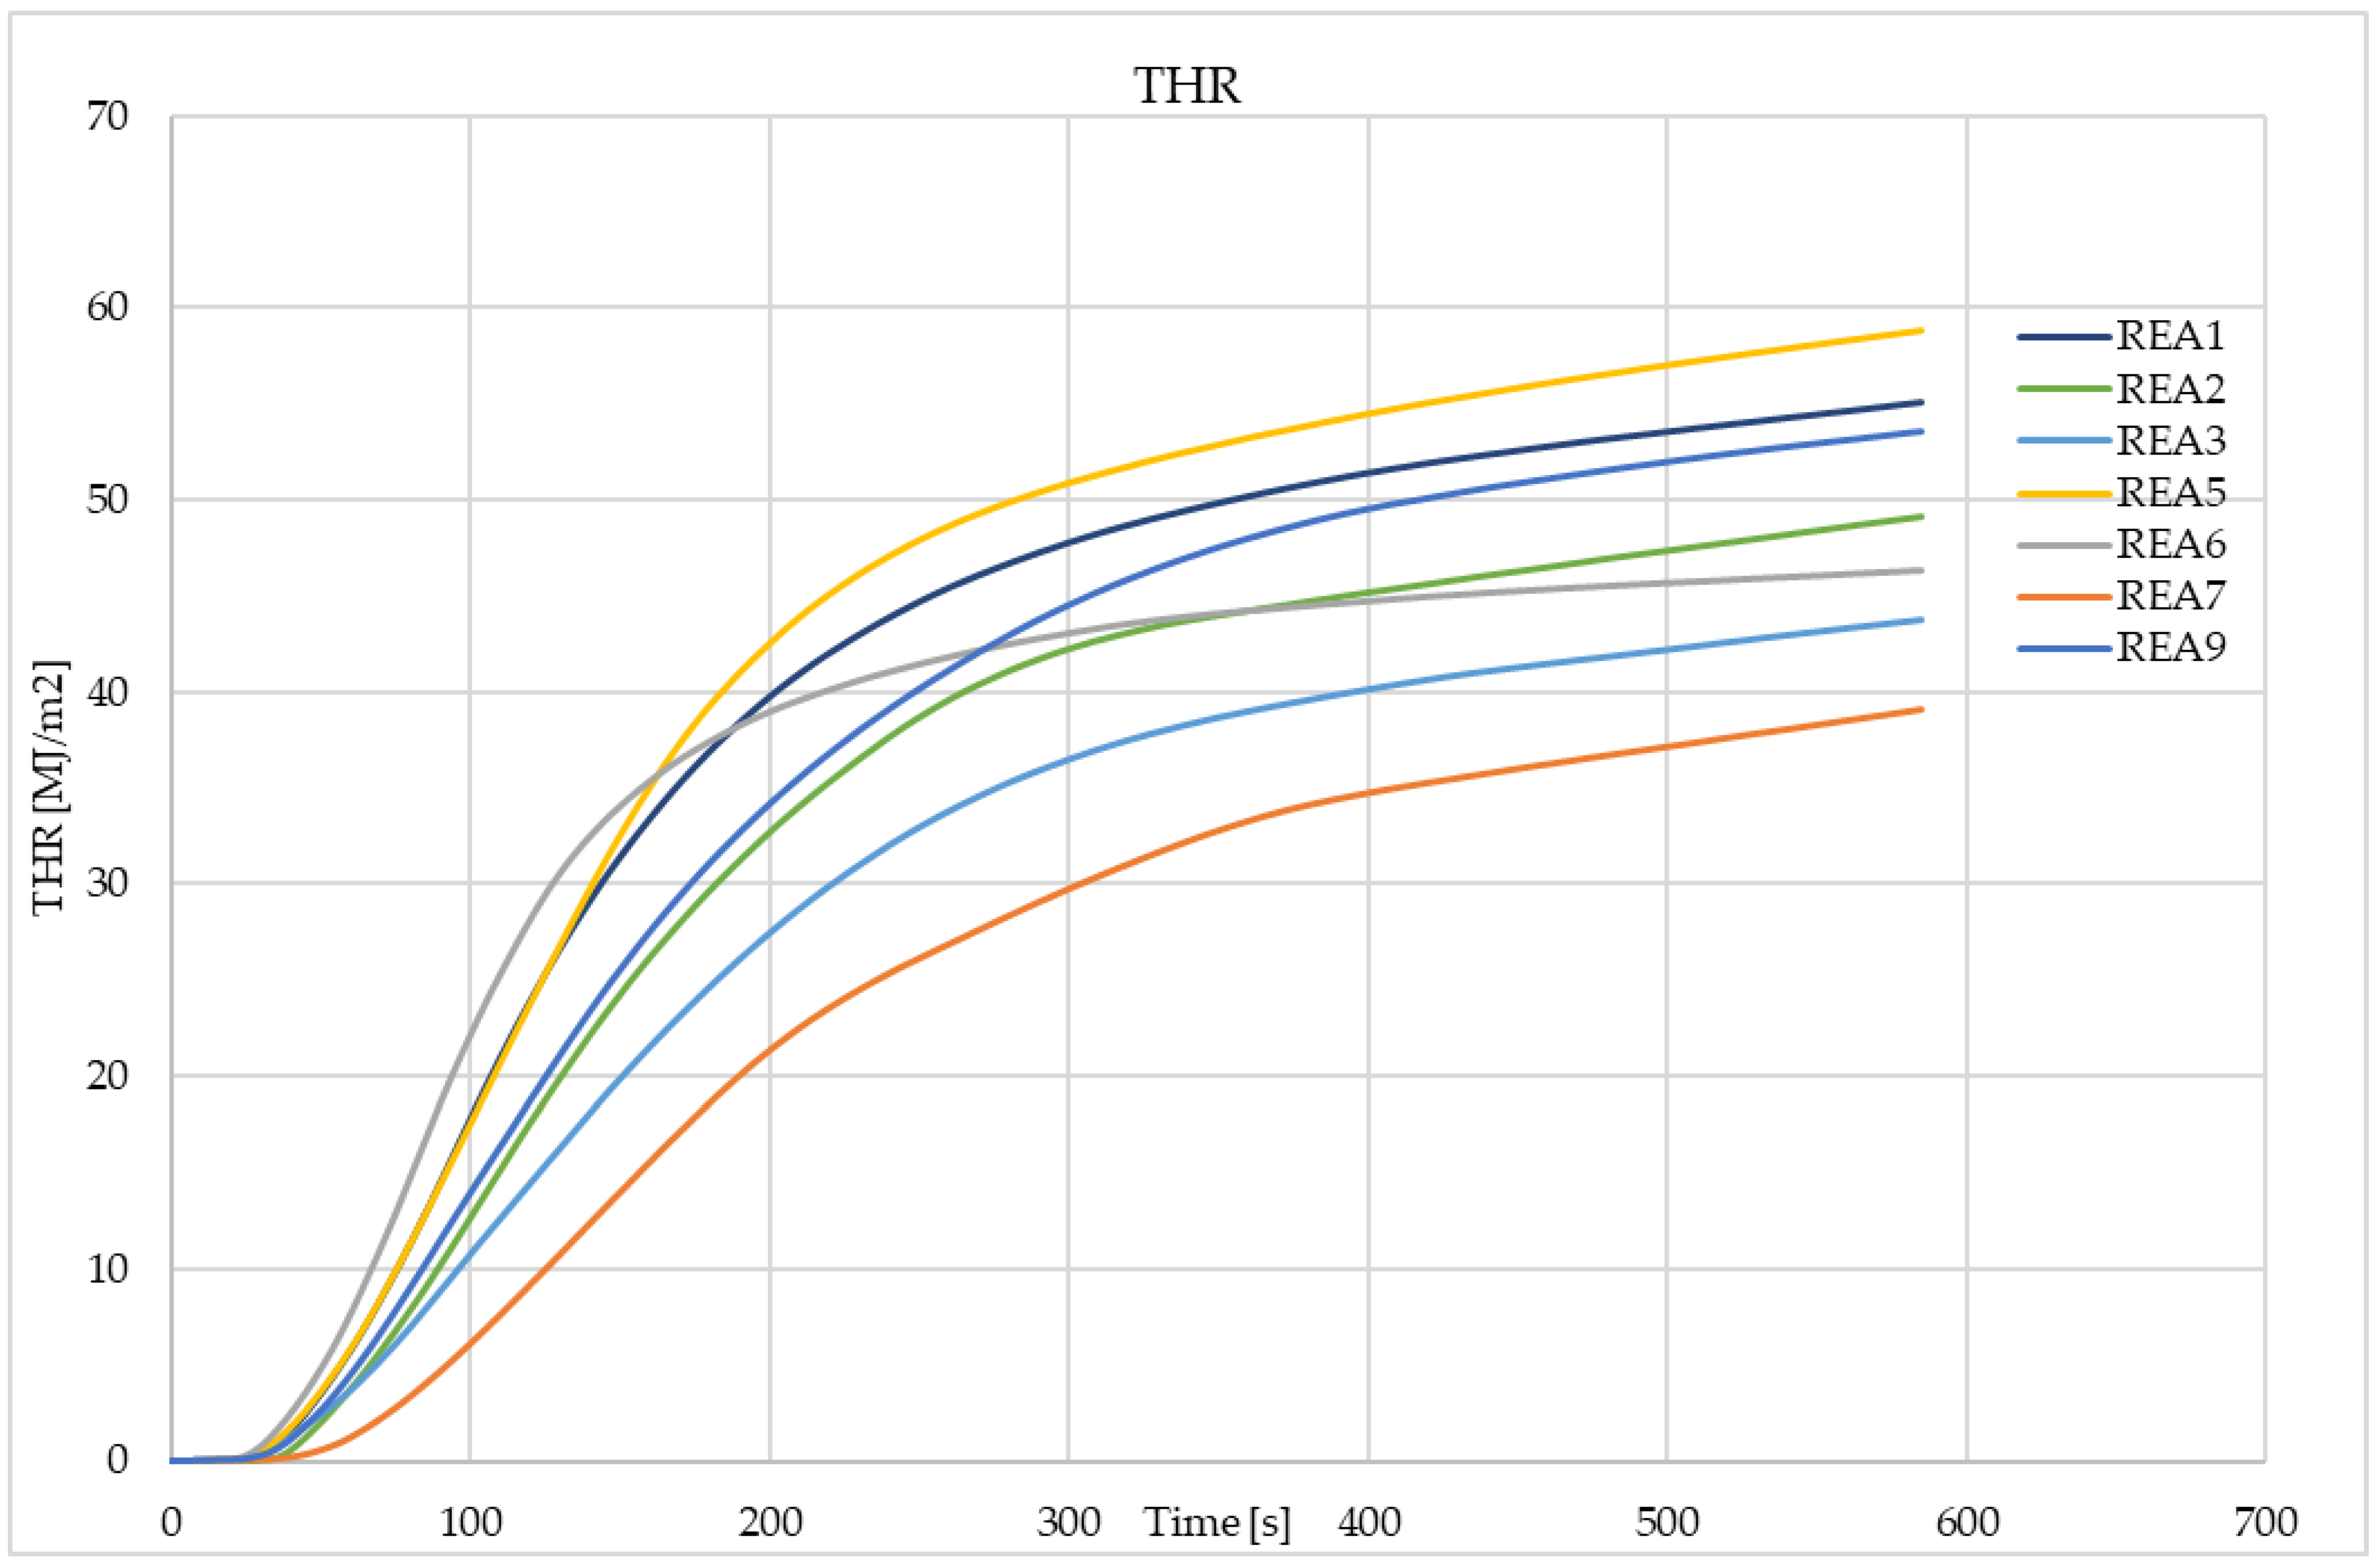
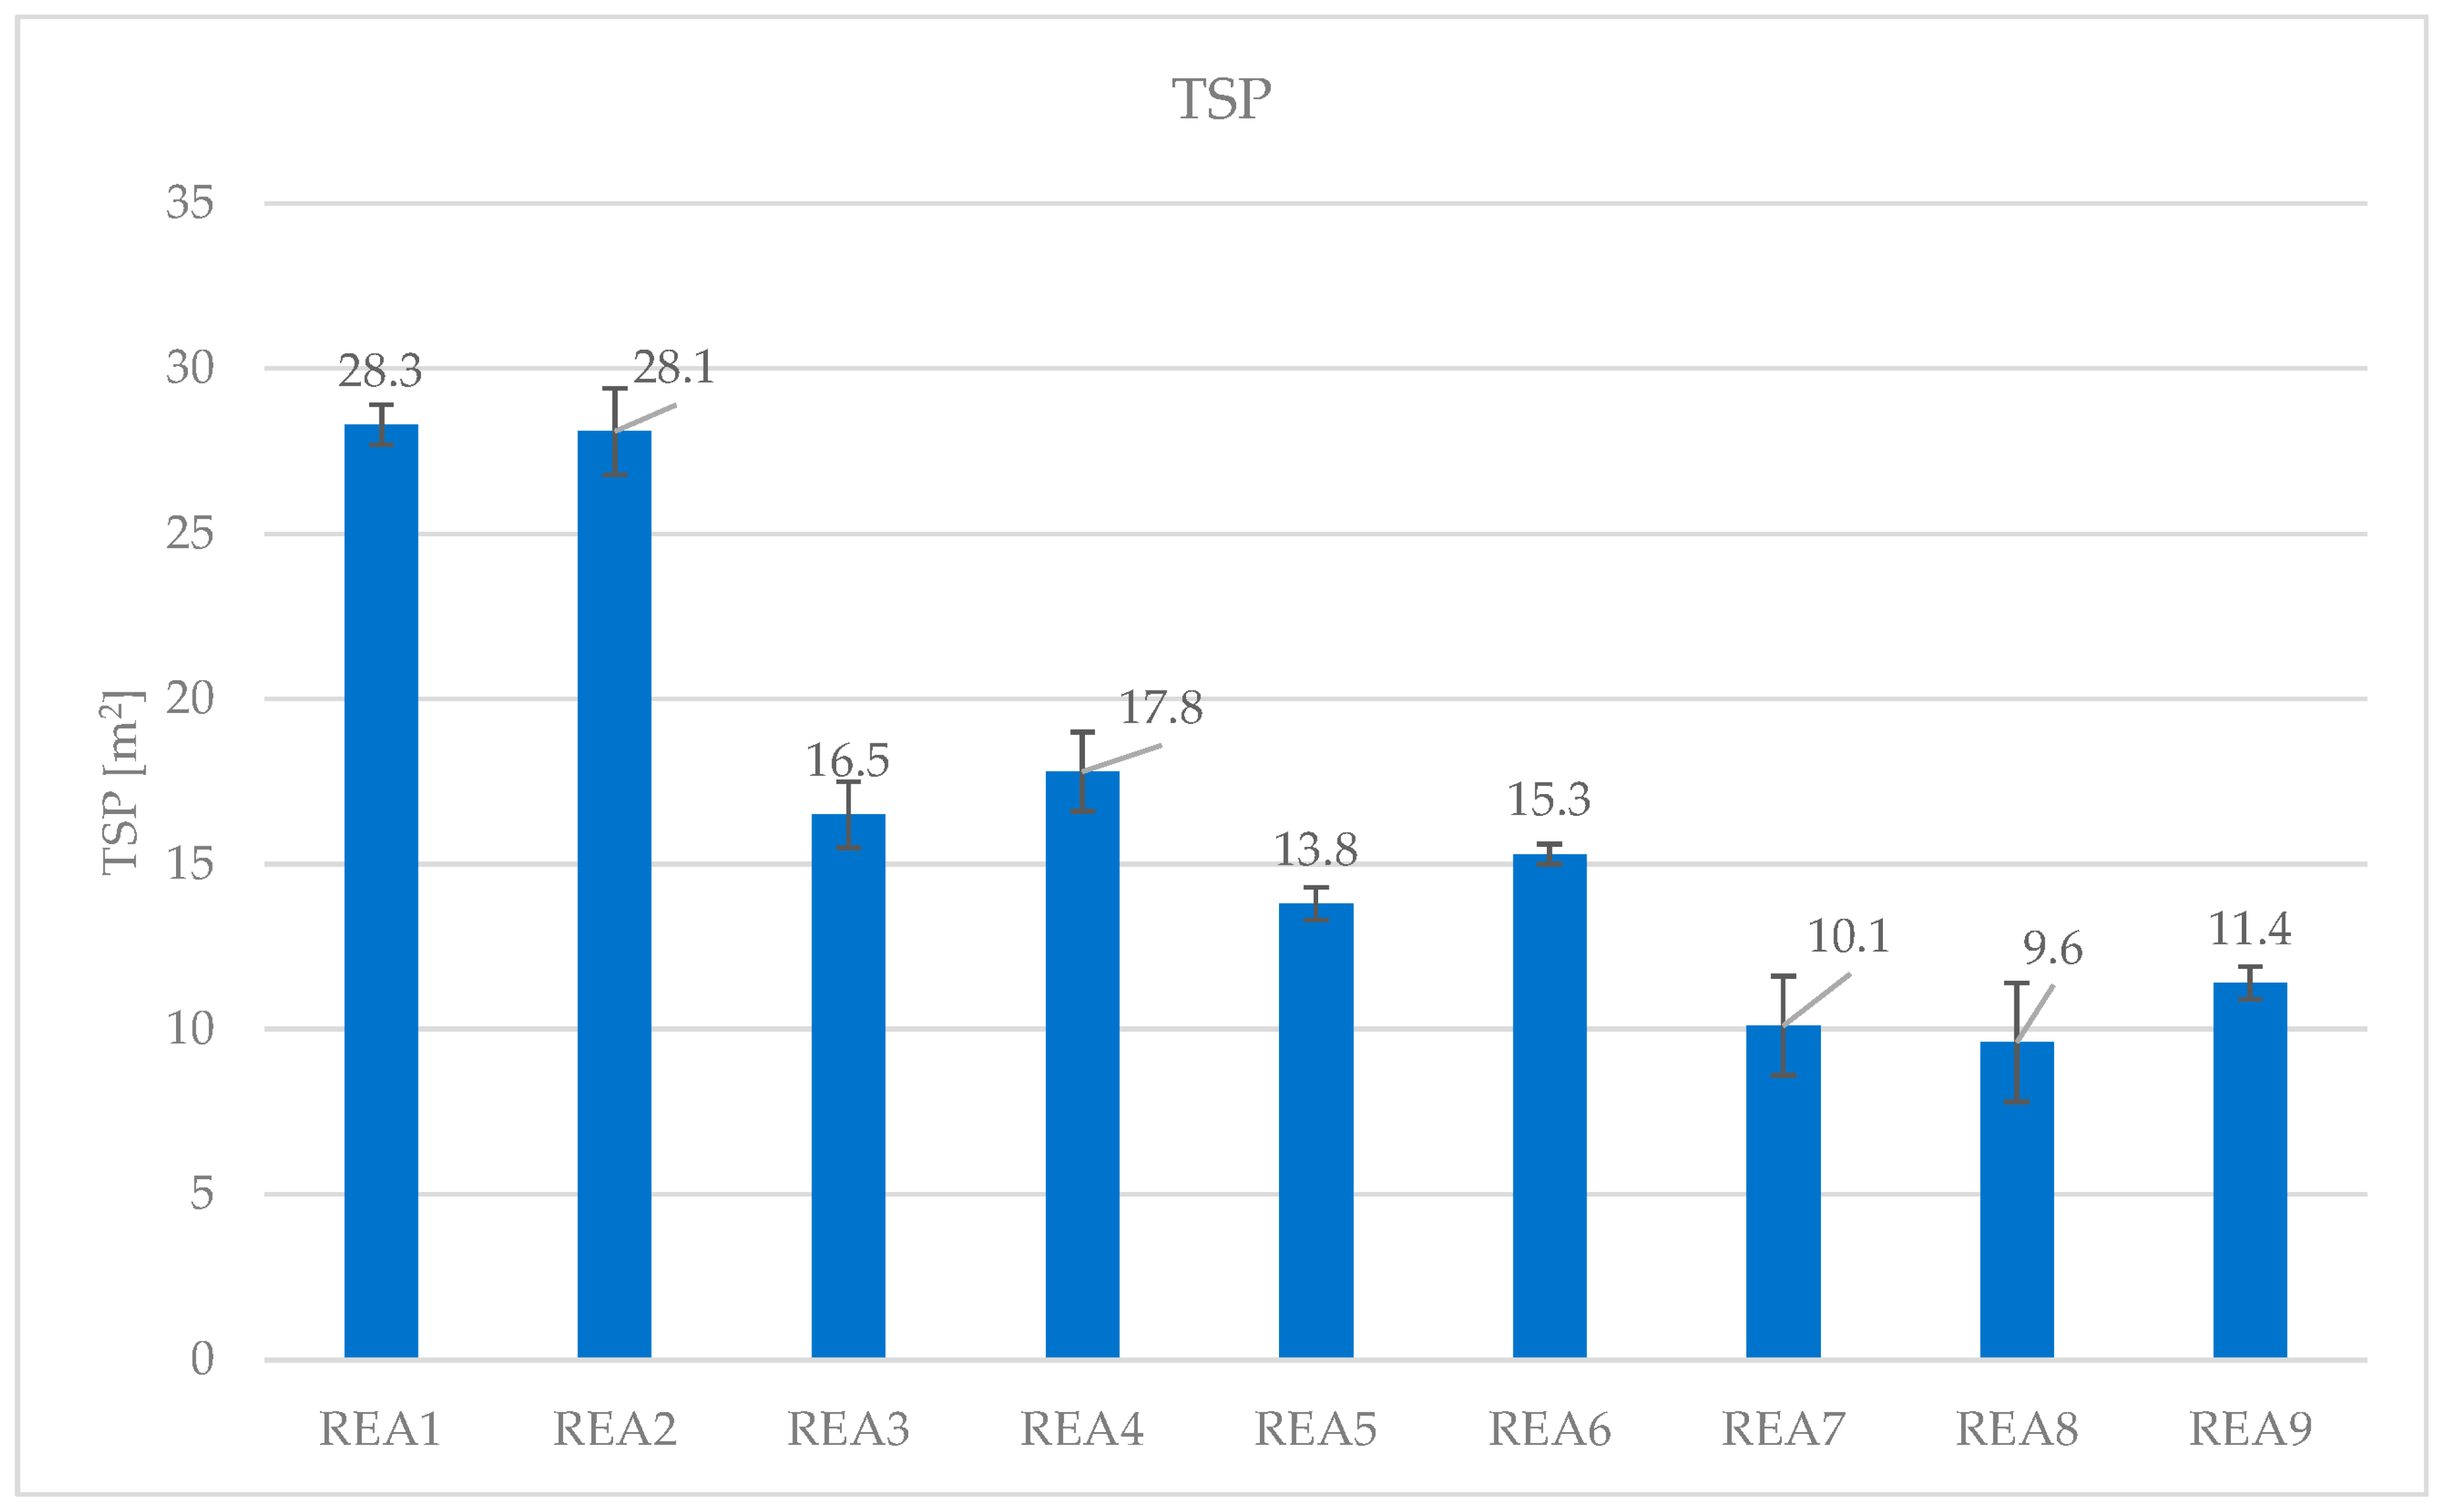
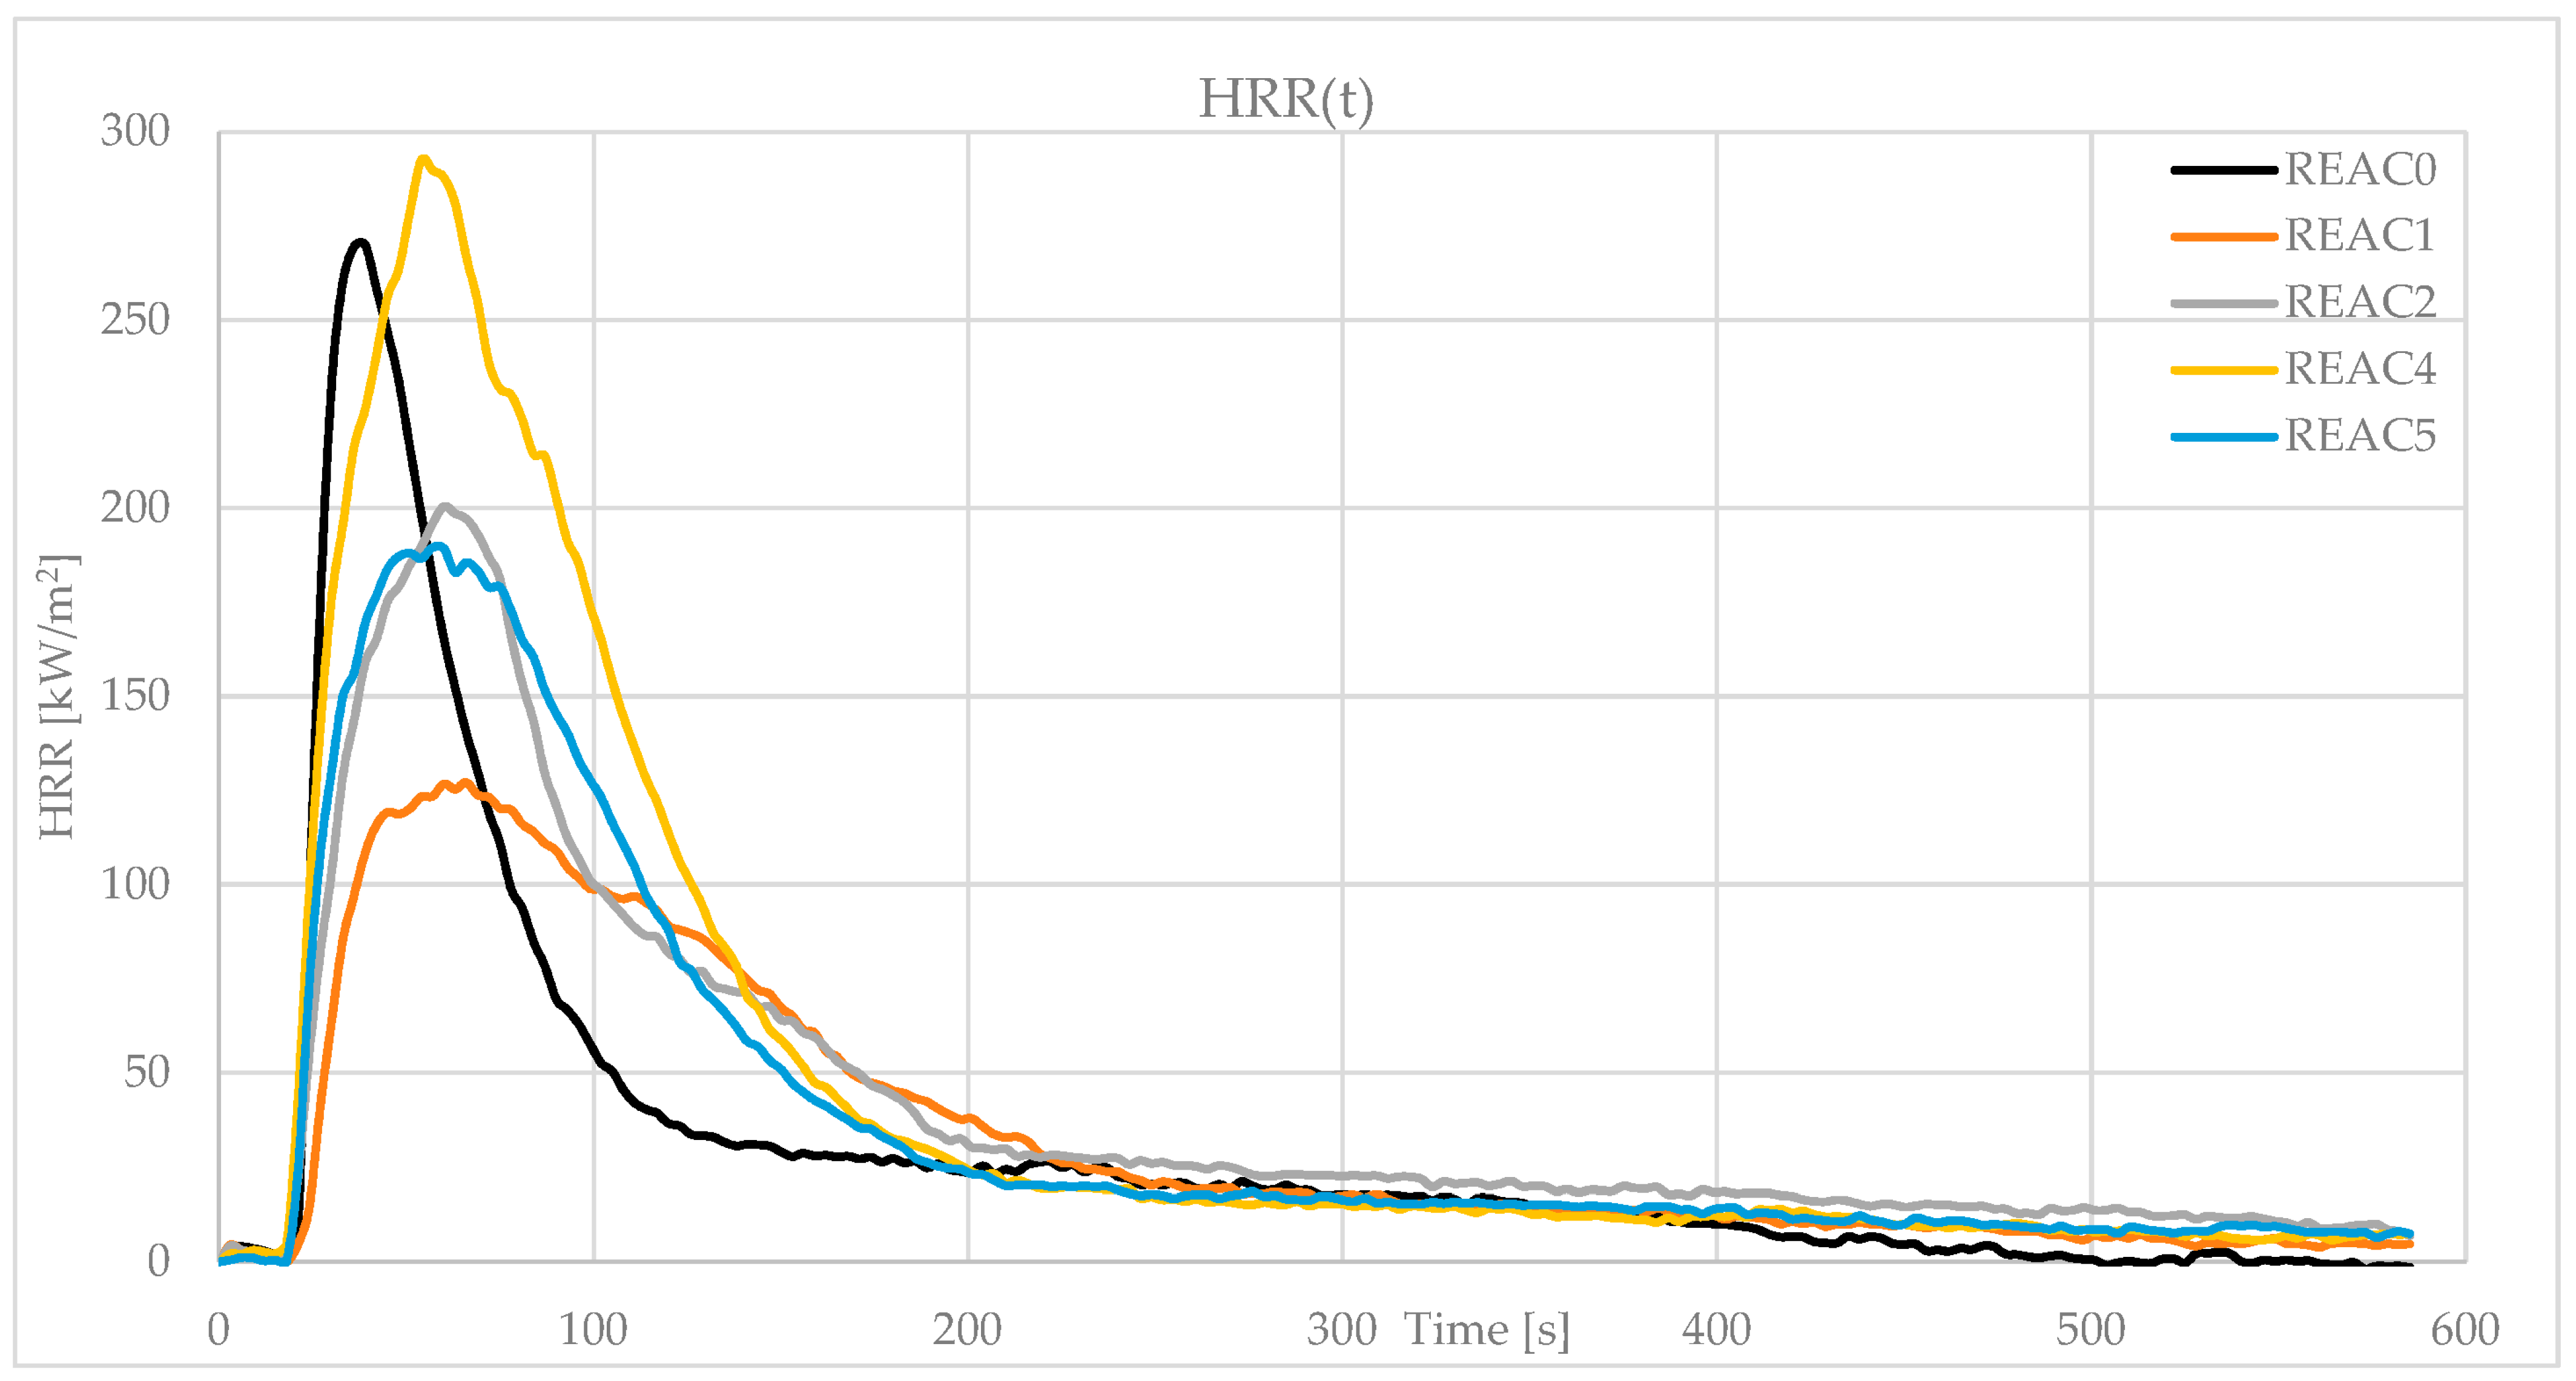
4.3. Effect of Acid Scavenging on Heat Release Rate and Smoke Production Measured in Cone Calorimetry
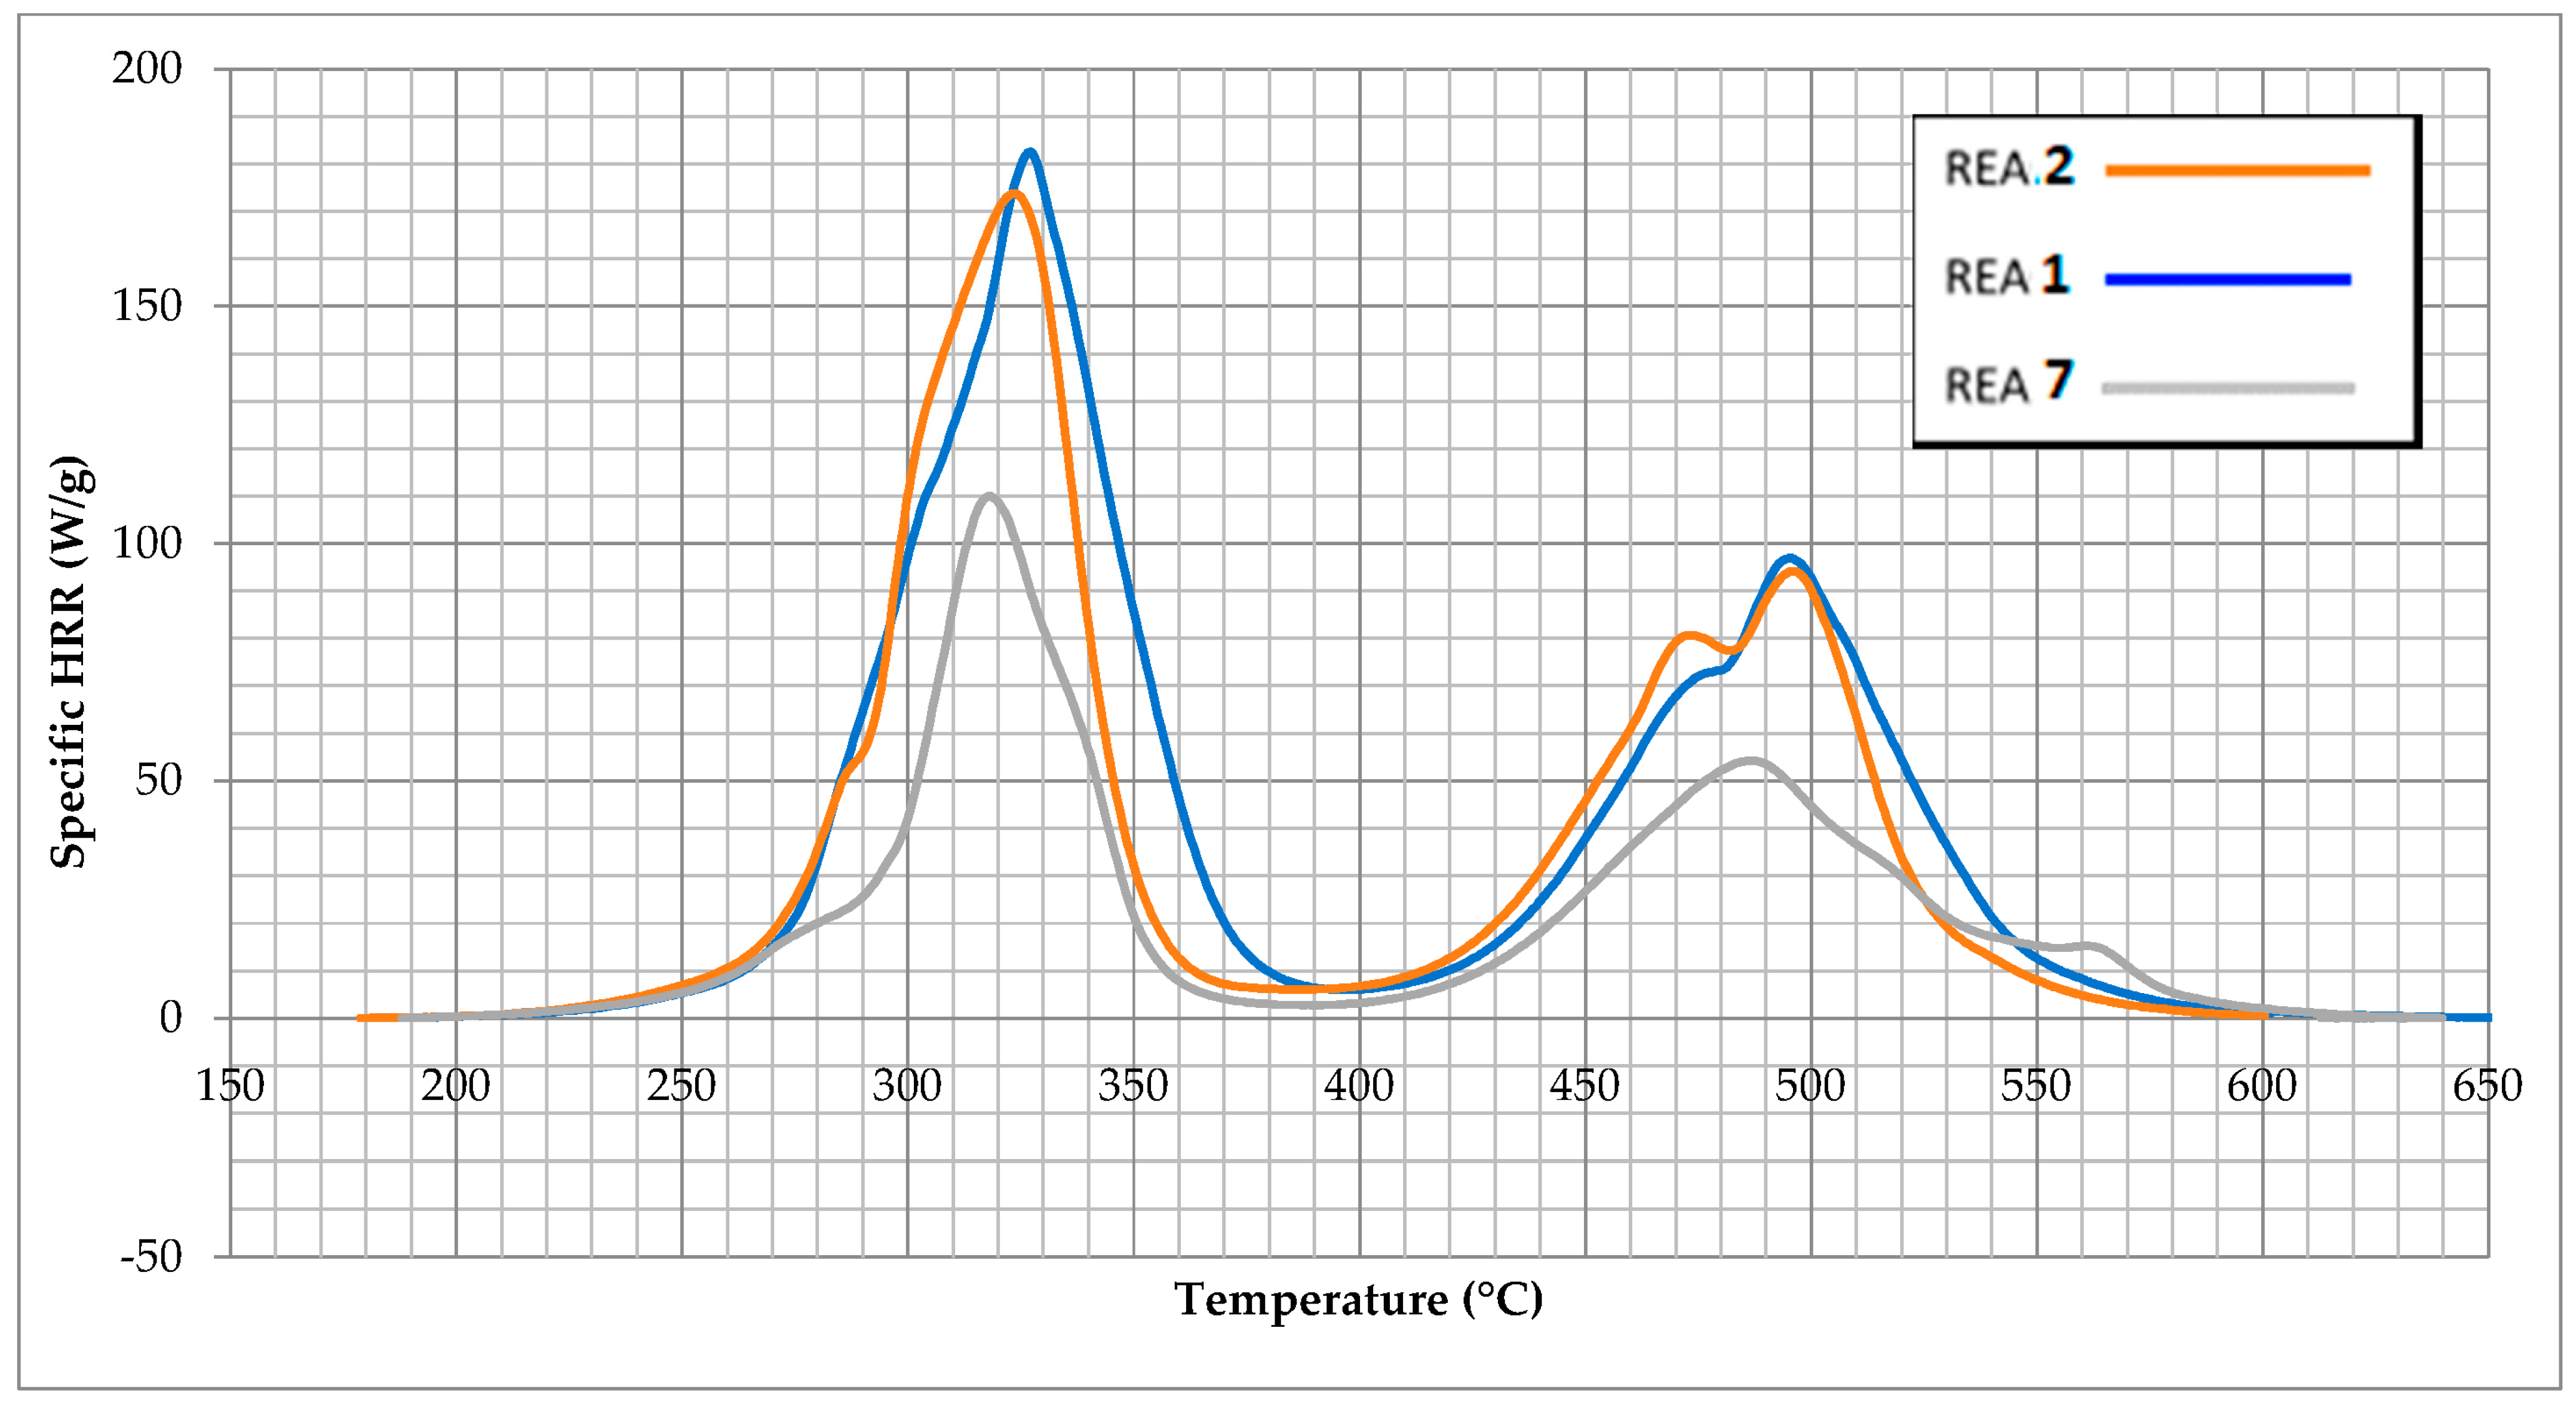
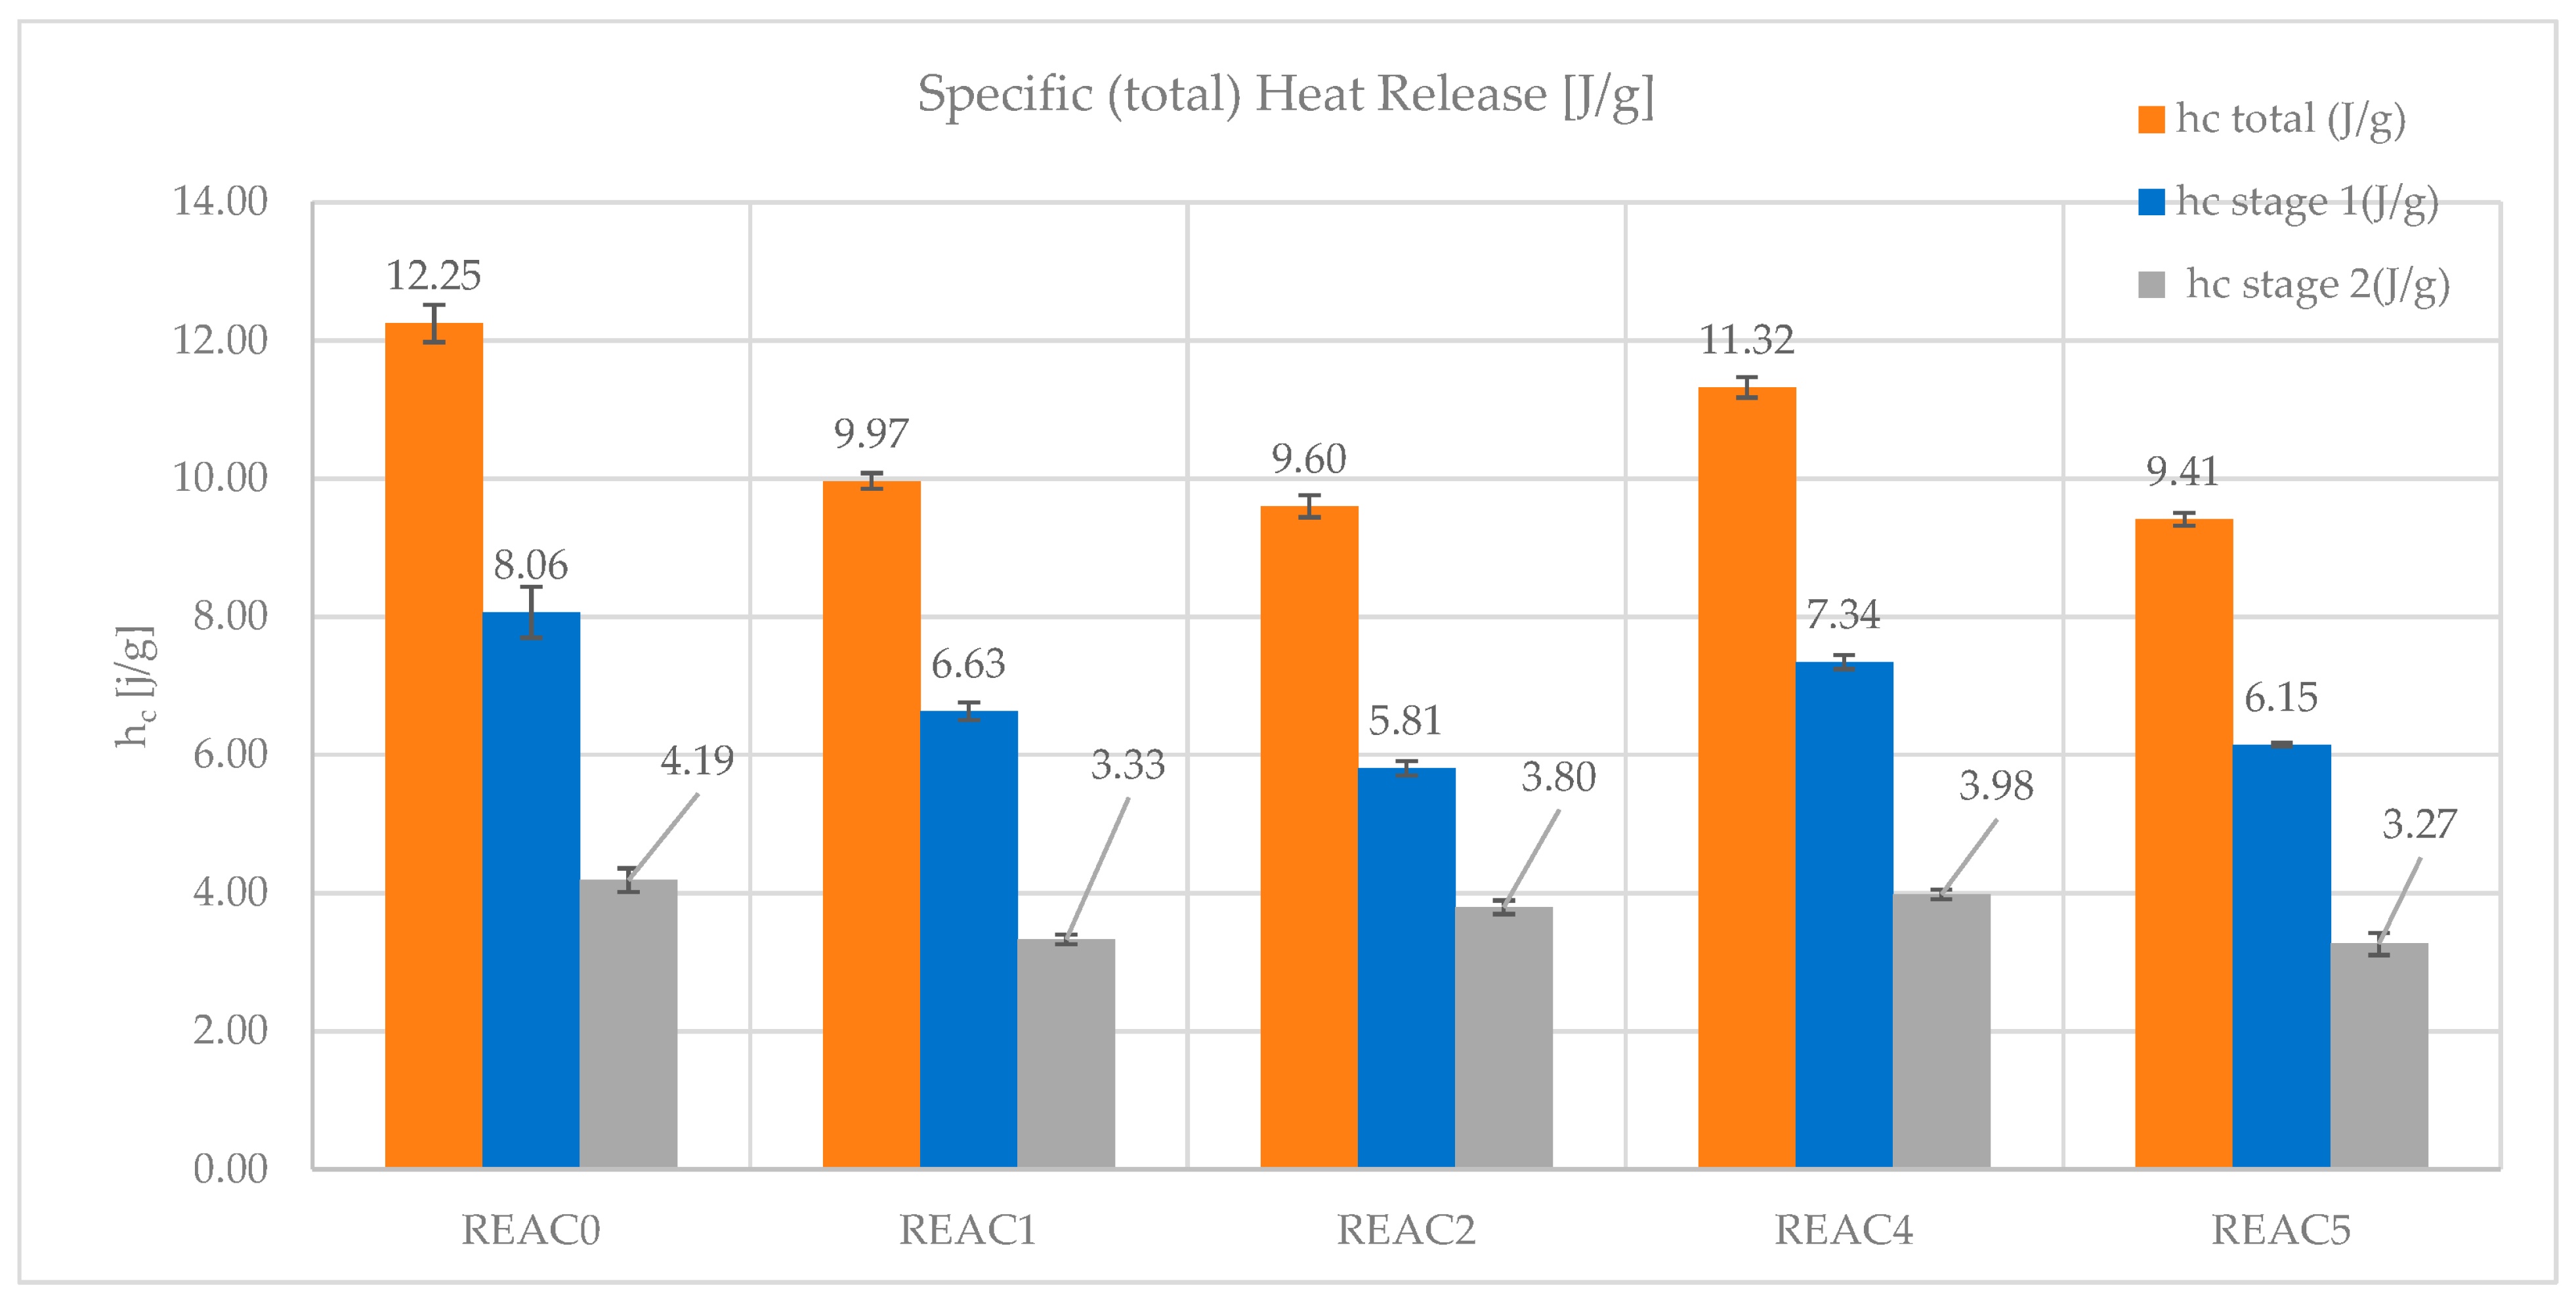
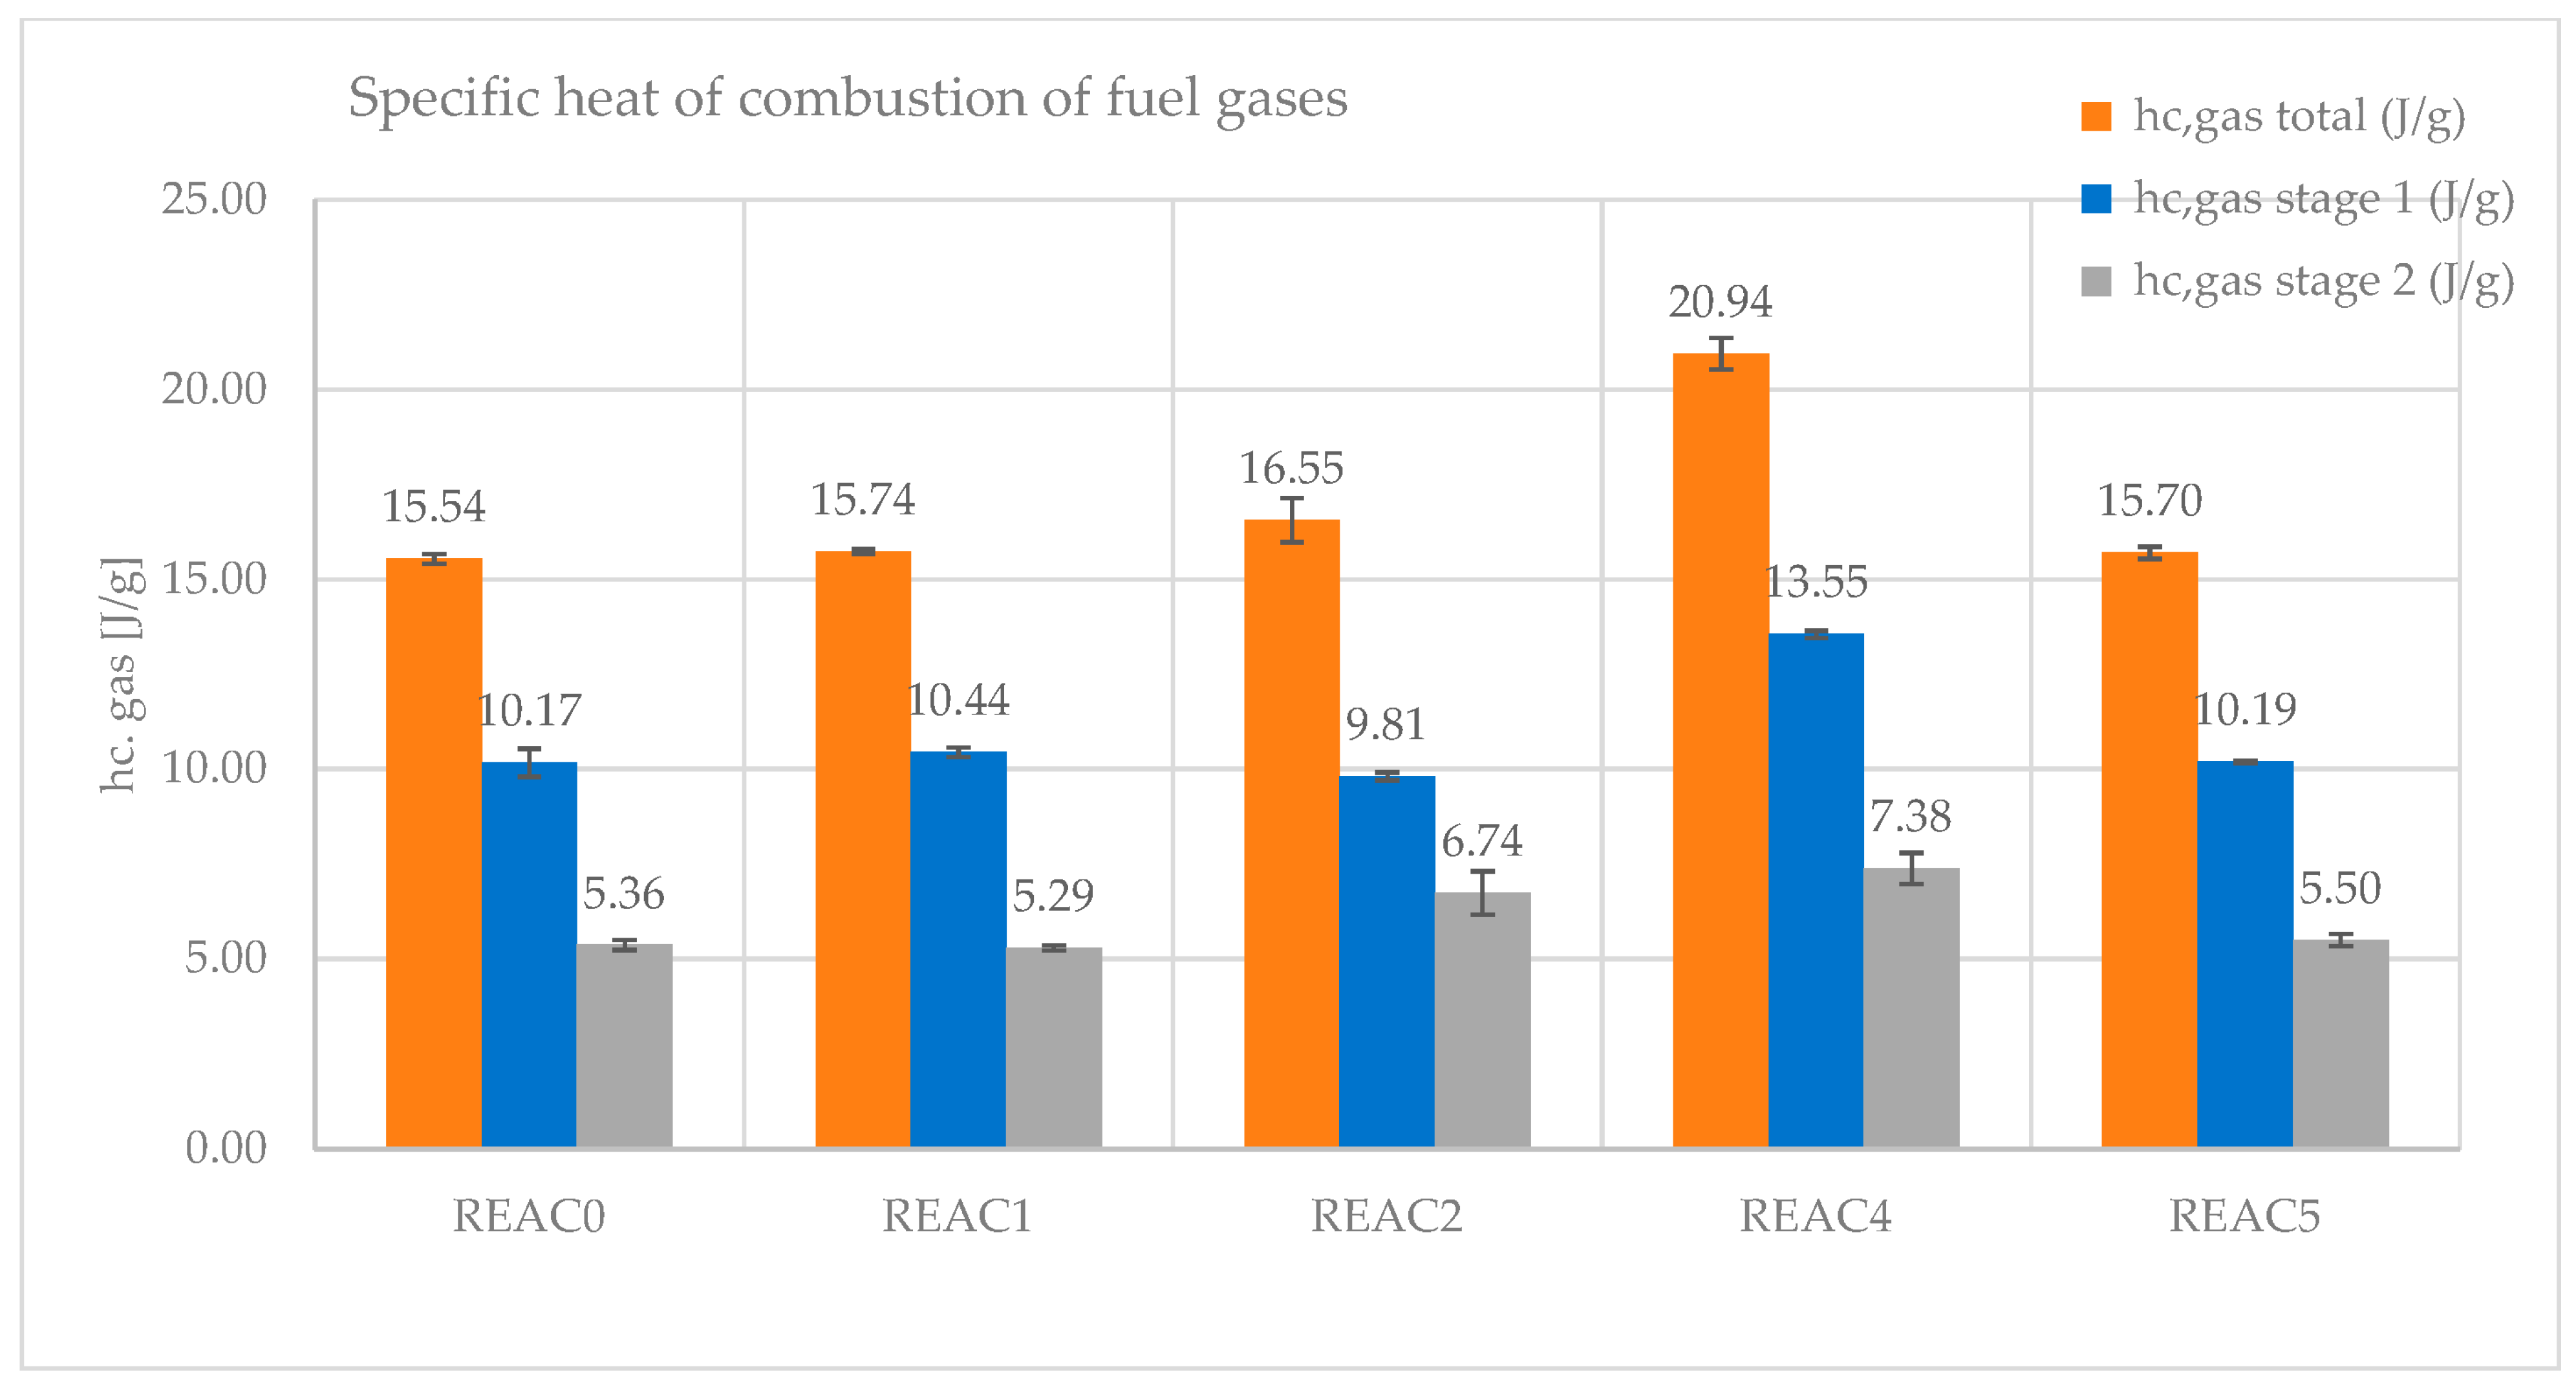
4.4. Effect of Acid Scavenging on Measures from MCC
- -
- The maximum of the specific HRR (T) (Qmax). It is calculated for stages 1 and 2.
- -
- The heat release temperature (Tmax) corresponds to the Qmax of stages 1 and 2.
- -
- The heat release capacity (ηc) is the maximum rate of heat release divided by the heating rate.
- -
- The specific (total) heat release (hc). It is derived from the specific HRR (T) integral and represents the total heat released in the test. It calculates the contribution of hc in stages 1 and 2.
- -
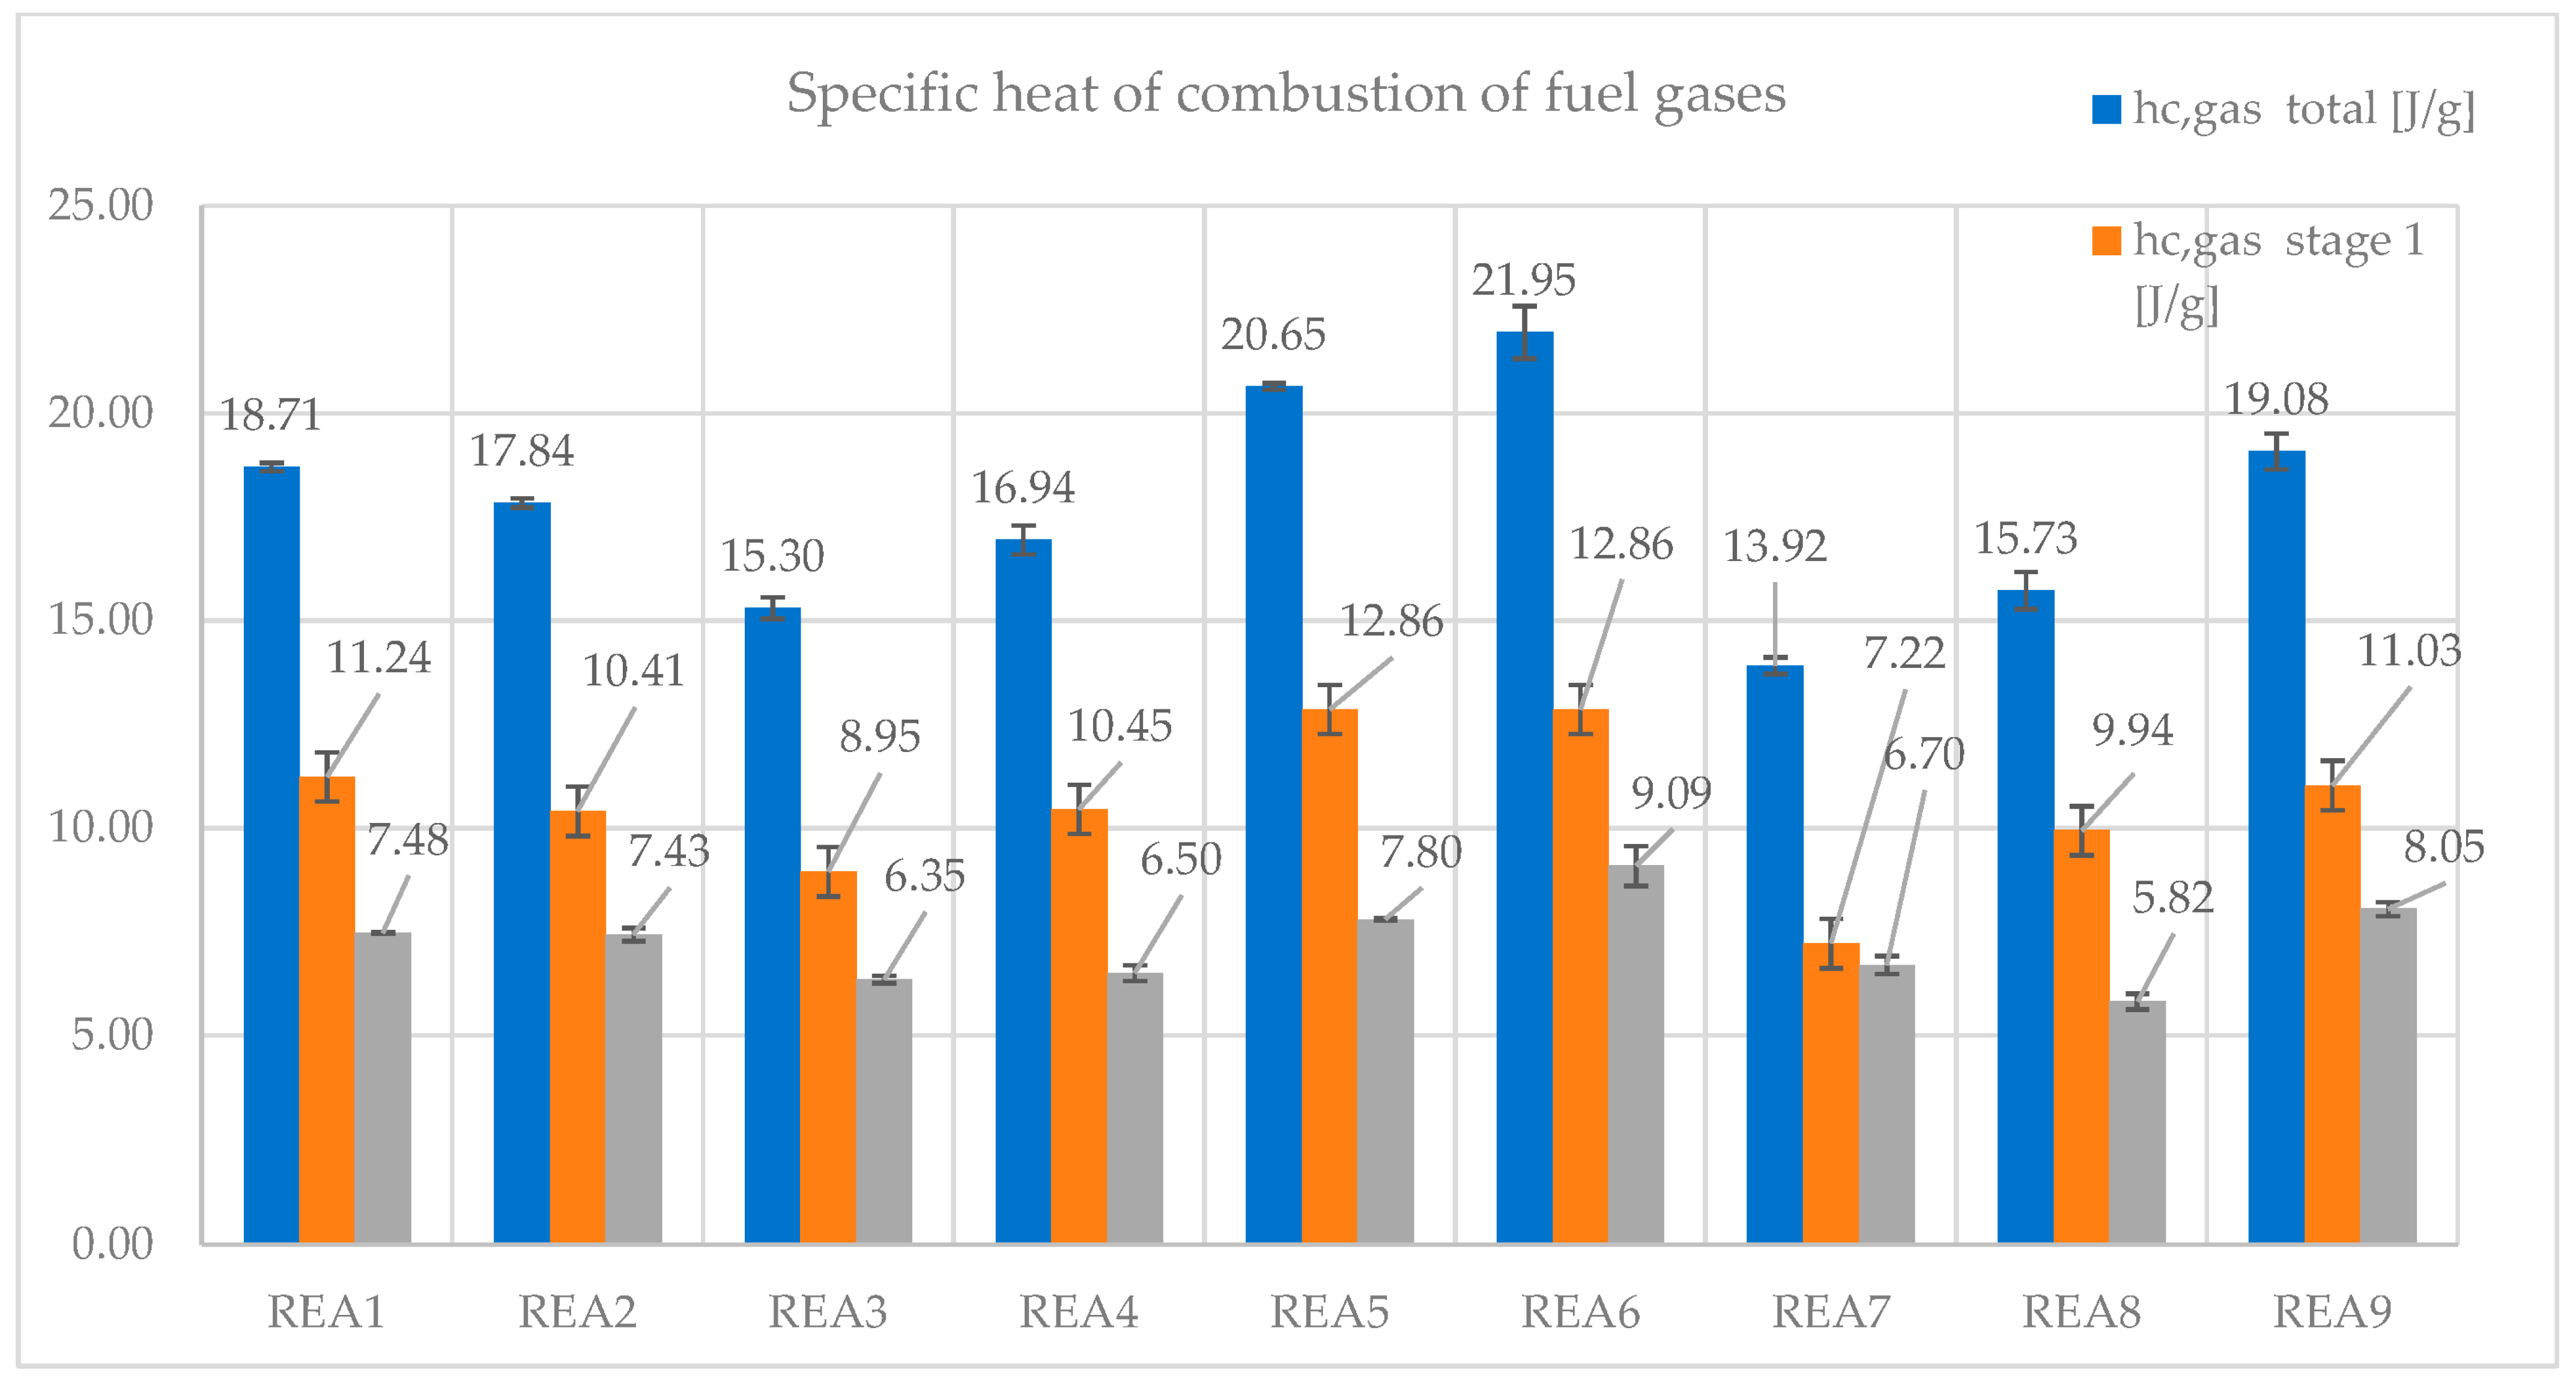
- The specific heat of combustion of the fuel gases is the heat of combustion per gram of fuel burned in the combustor (hc gas). It accounts for the energy released from the combustion of the fuels in the gas phase. It has also been split as the contribution from stages 1 and 2.
- -
- The fire growth capacity (FGC) is defined in ASTM D7309-21 as a measure considering chemical processes responsible for igniting and burning combustible materials [26]. It is derived from other MCC measures such as ηc, ignition, and burning temperatures. FGC has been built considering the tendency of a material to ignite and spread the flame away from the fire source: ignitability and flame spread. FGC, a measure coming from a flammability micro-scale test, has been correlated to several other measures from bench-scale tests used by Federal Aviation to discriminate levels of fire performances of the components in the cabin of an aircraft [26,39].
- -
- Char yield. The initial and final weight ratios complete the measures in Table 10.
4.4.1. MCC of the Formulation of Table 1
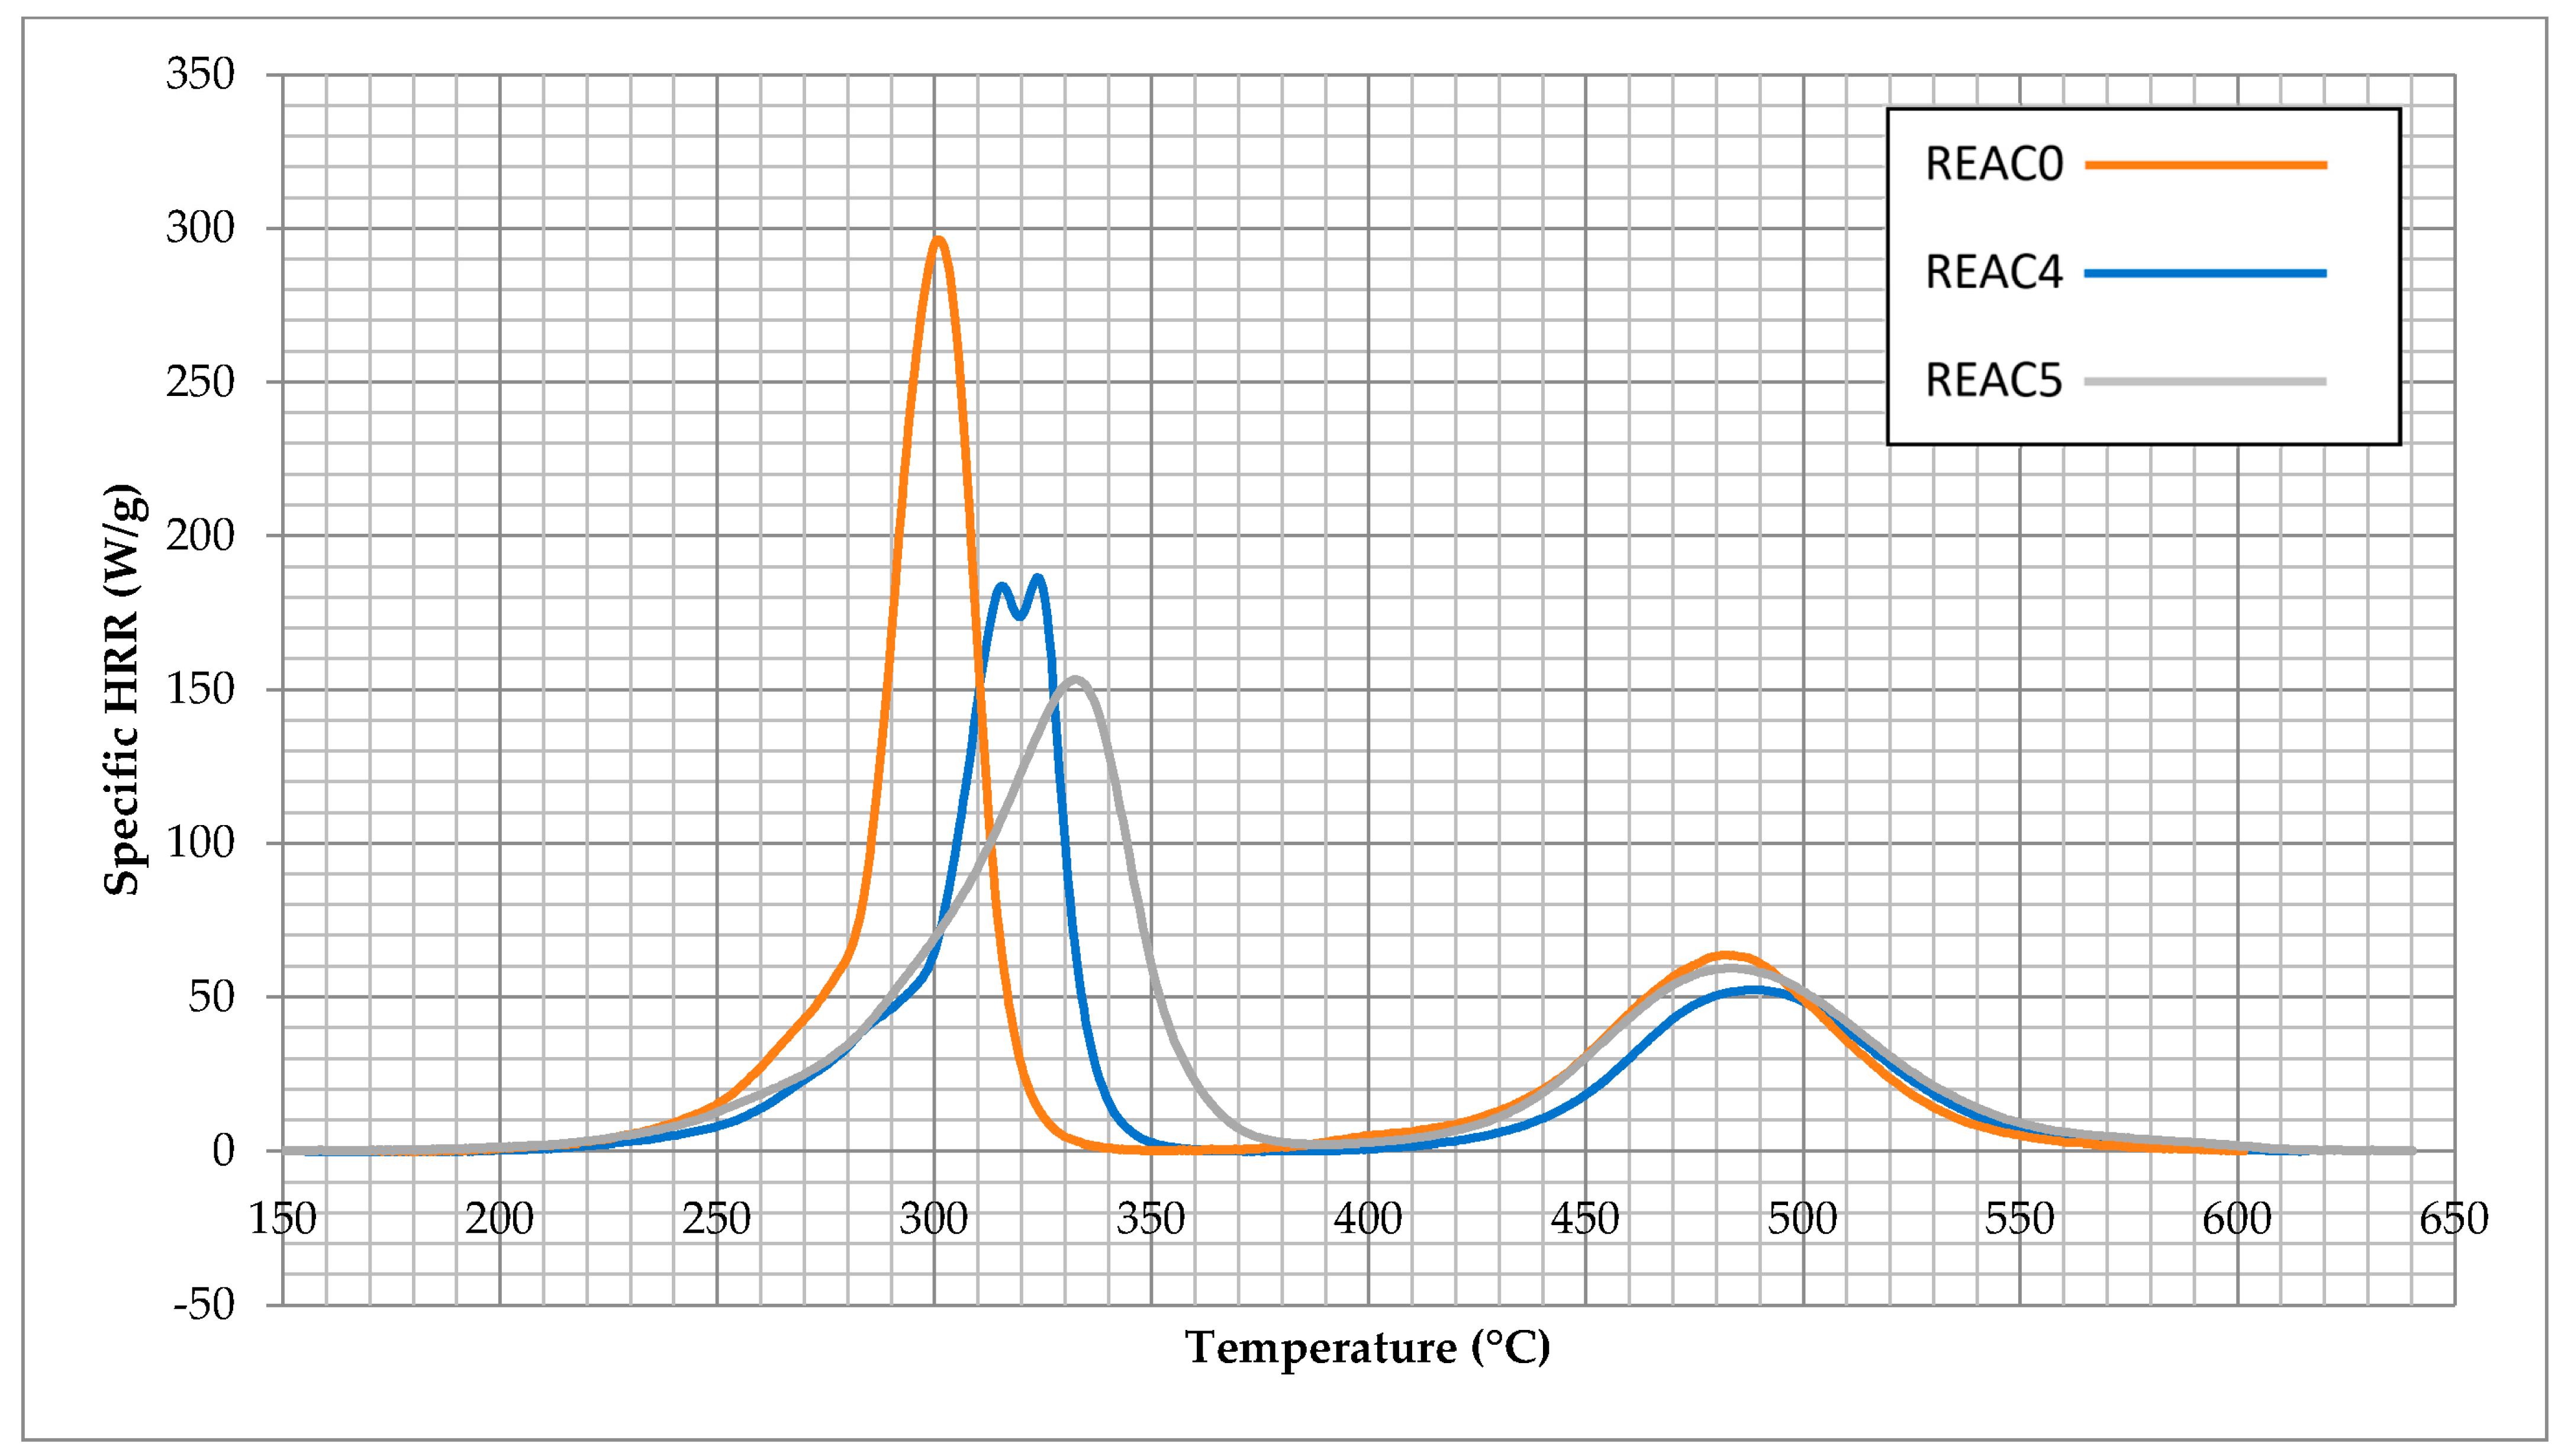
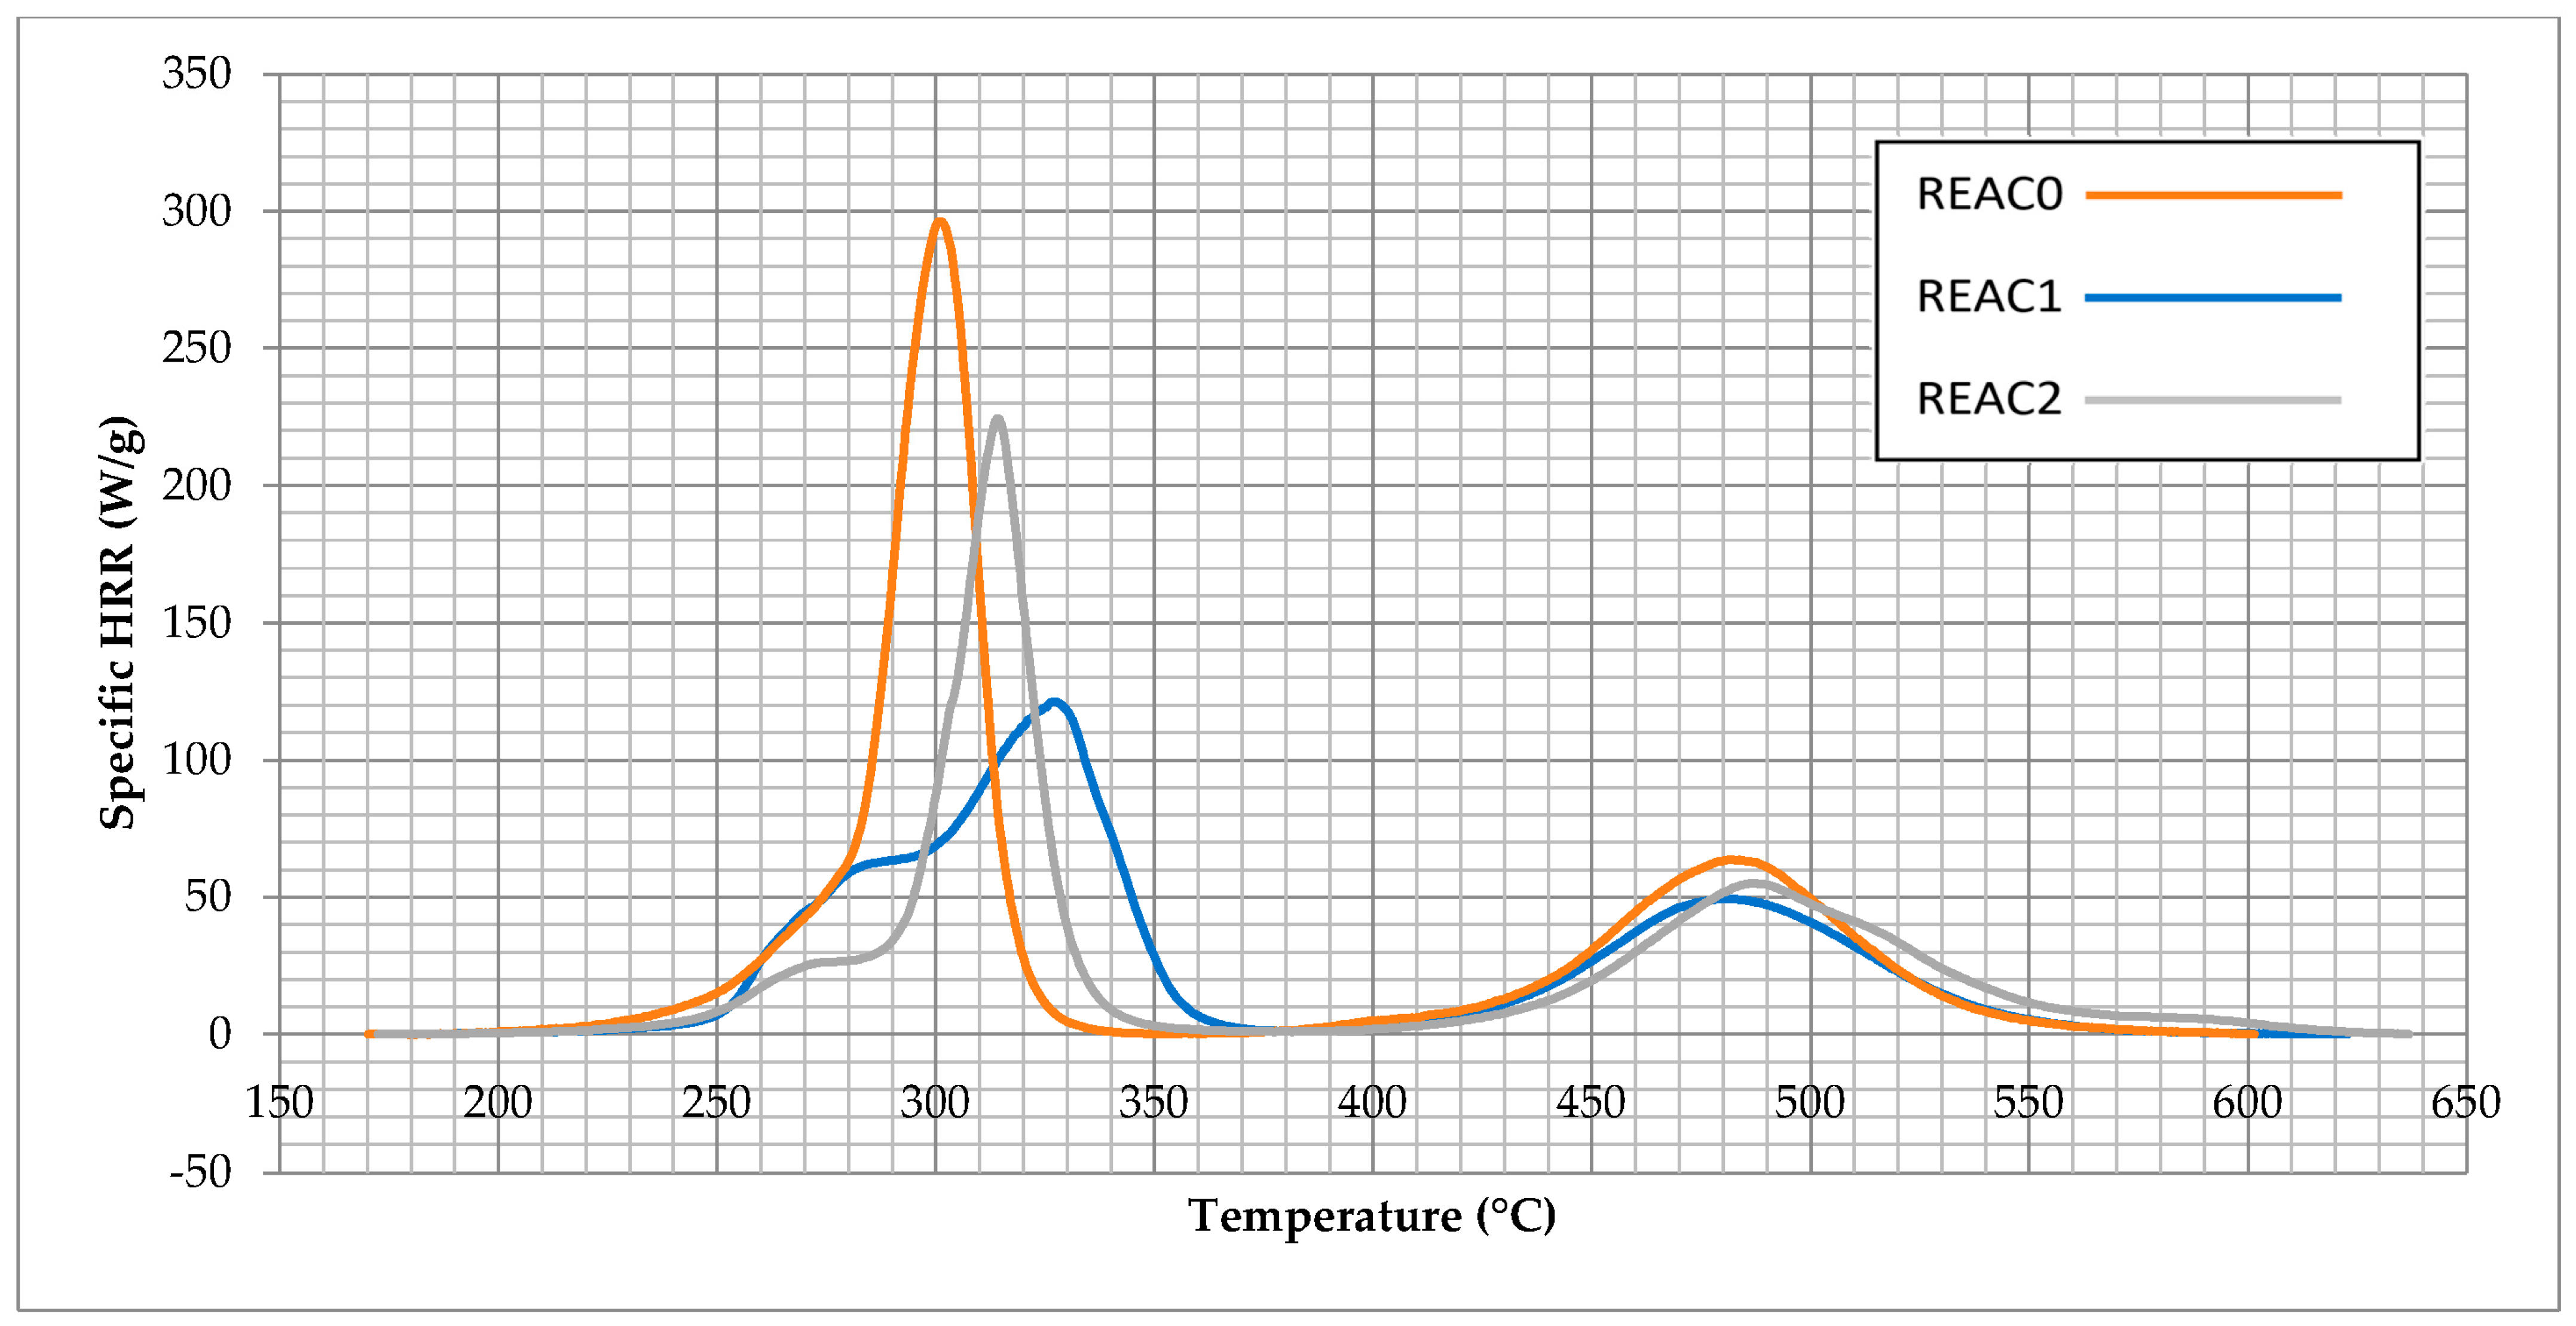
4.4.2. MCC of the Formulation of Table 2
5. Conclusions
Supplementary Materials
Author Contributions
Funding
Institutional Review Board Statement
Acknowledgments
Conflicts of Interest
Abbreviations
| PVC | Poly(vinyl chloride); |
| HCl | Hydrogen chloride; |
| EU | European Union; |
| CPD | Construction Product Directive; |
| CPR | Construction Product Regulation; |
| UPCC | Precipitated Calcium Carbonate; |
| GCC | Ground Calcium Carbonate; |
| Phr | Part per Hundred Resin; |
| DINP | Di Iso Nonyl Phthalate; |
| ESBO | Epoxidized Soy Bean Oil; |
| COS | Calcium Organic Stabilizer; |
| DDW | Double Deionized Water; |
| M | Mean; |
| SD | Standard Deviation; |
| CV | Coefficient of variation; |
| MCC | Micro Combustion Calorimetry |
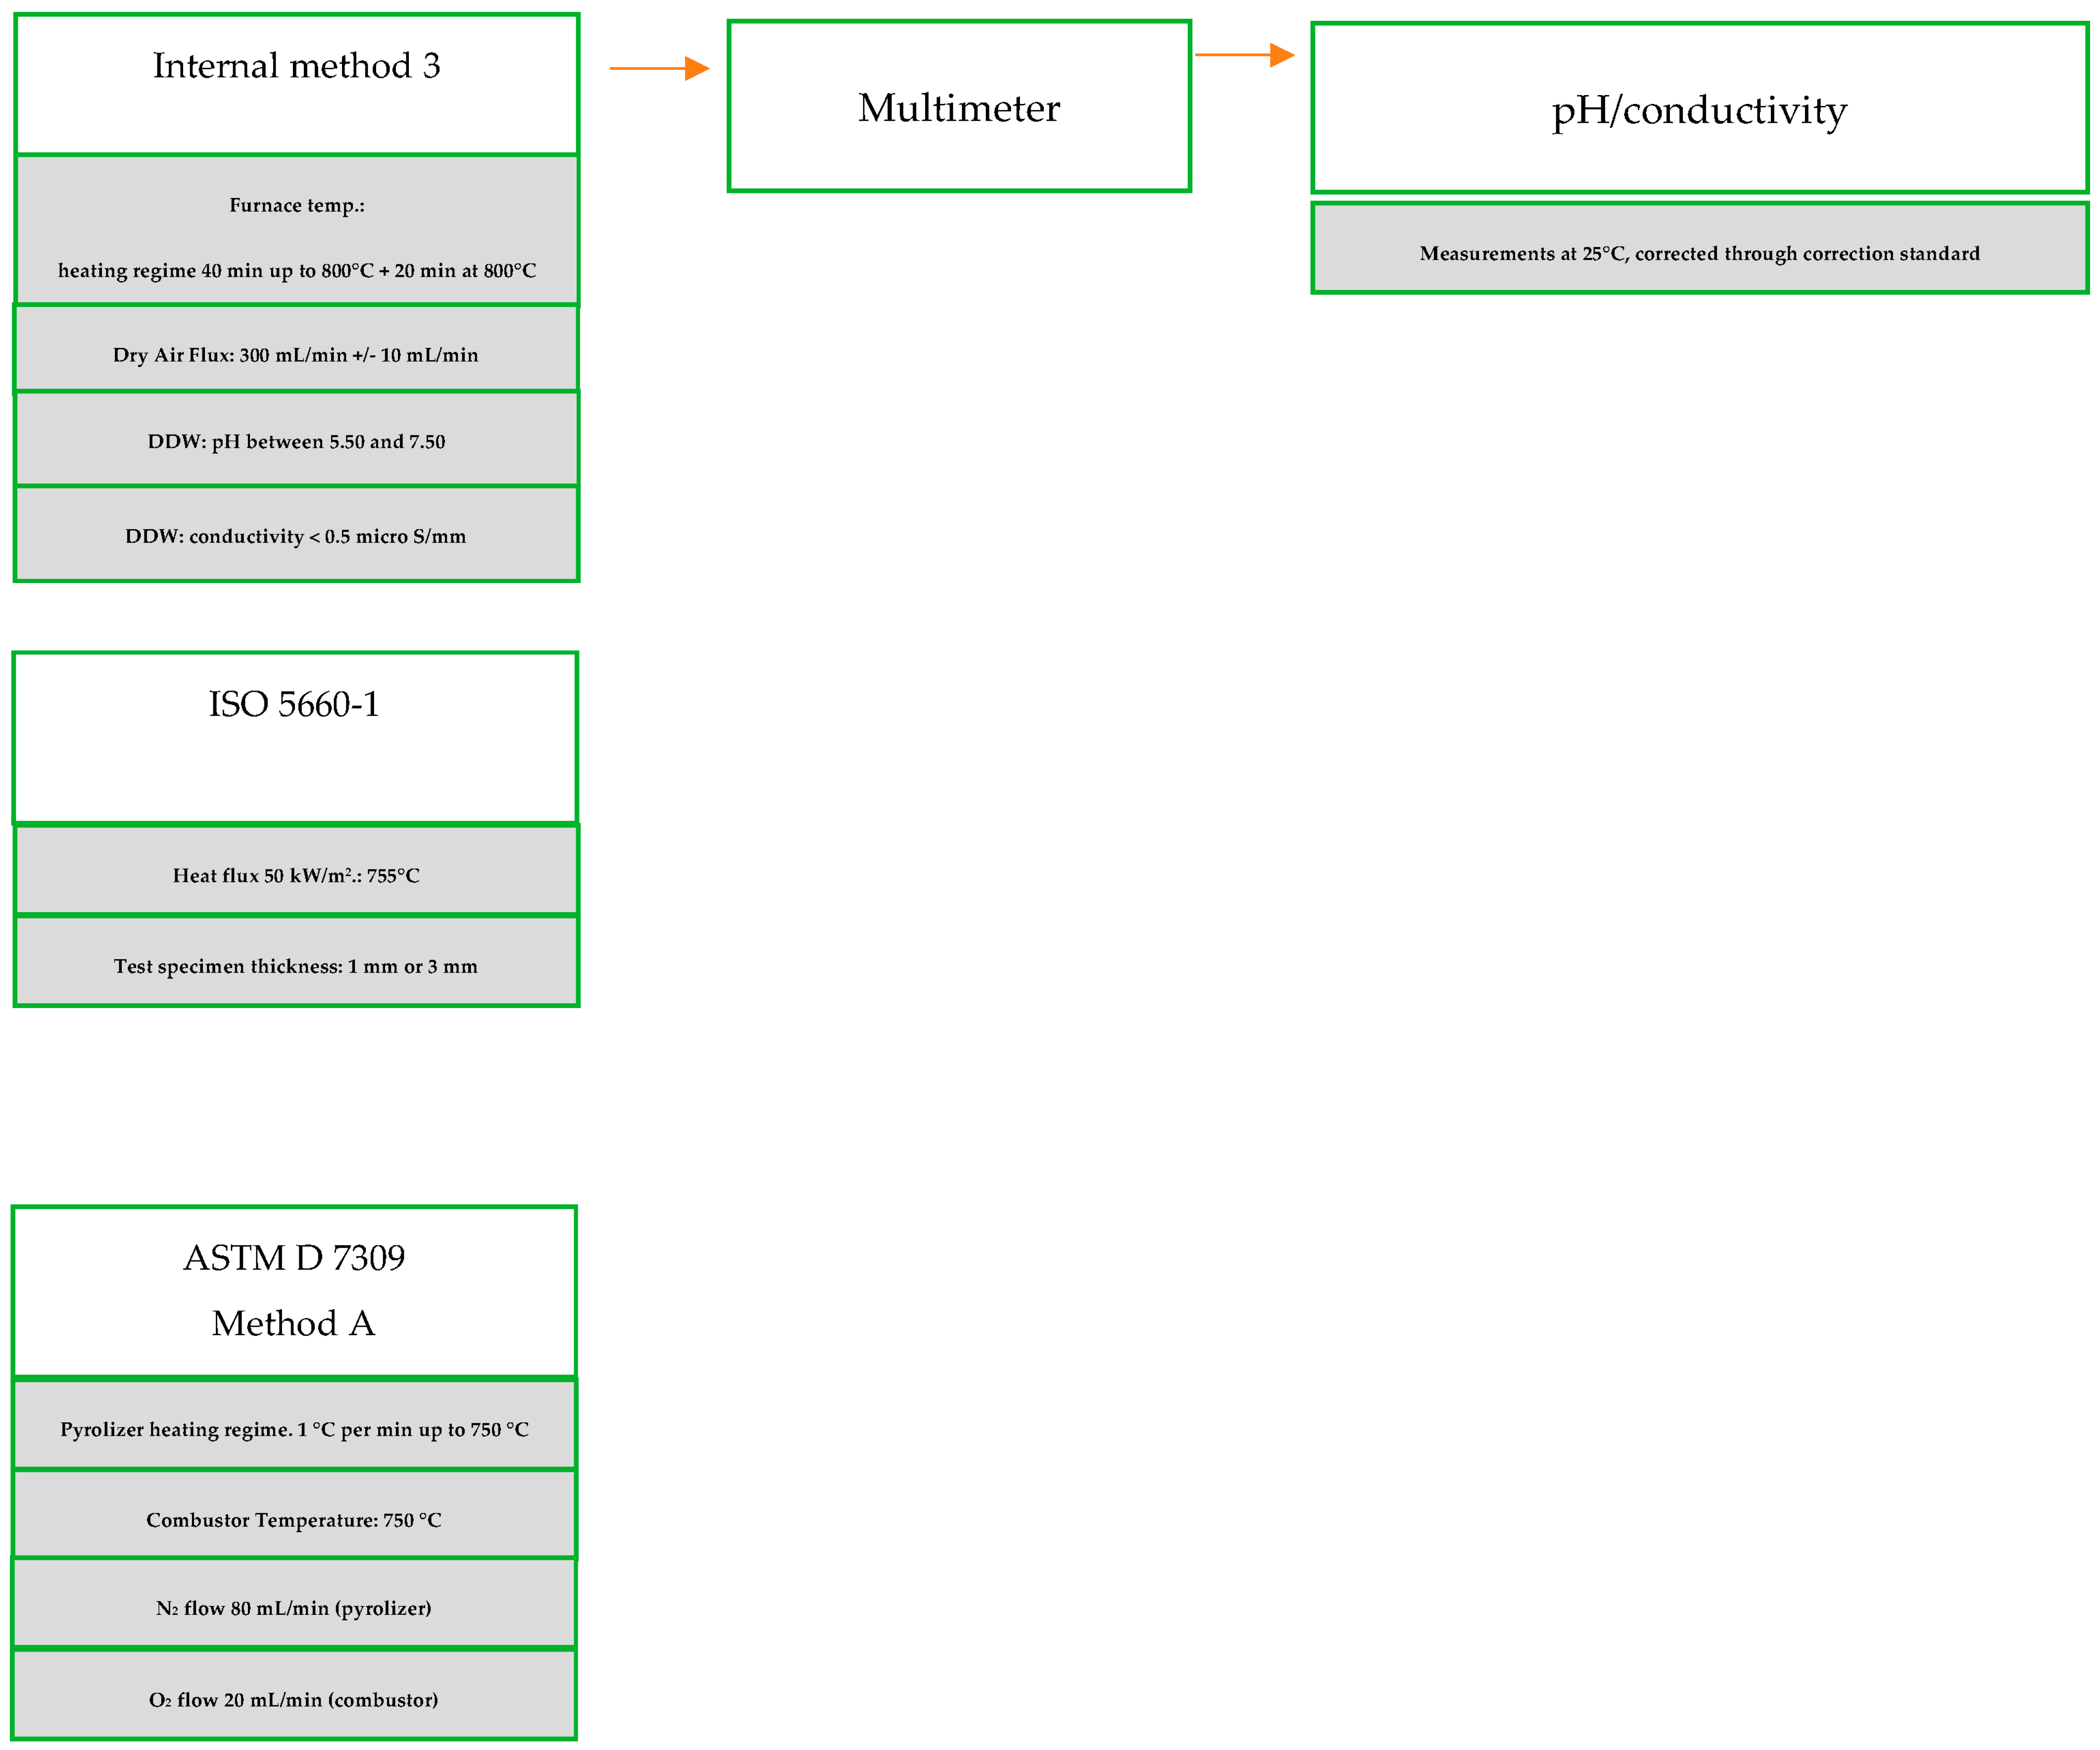
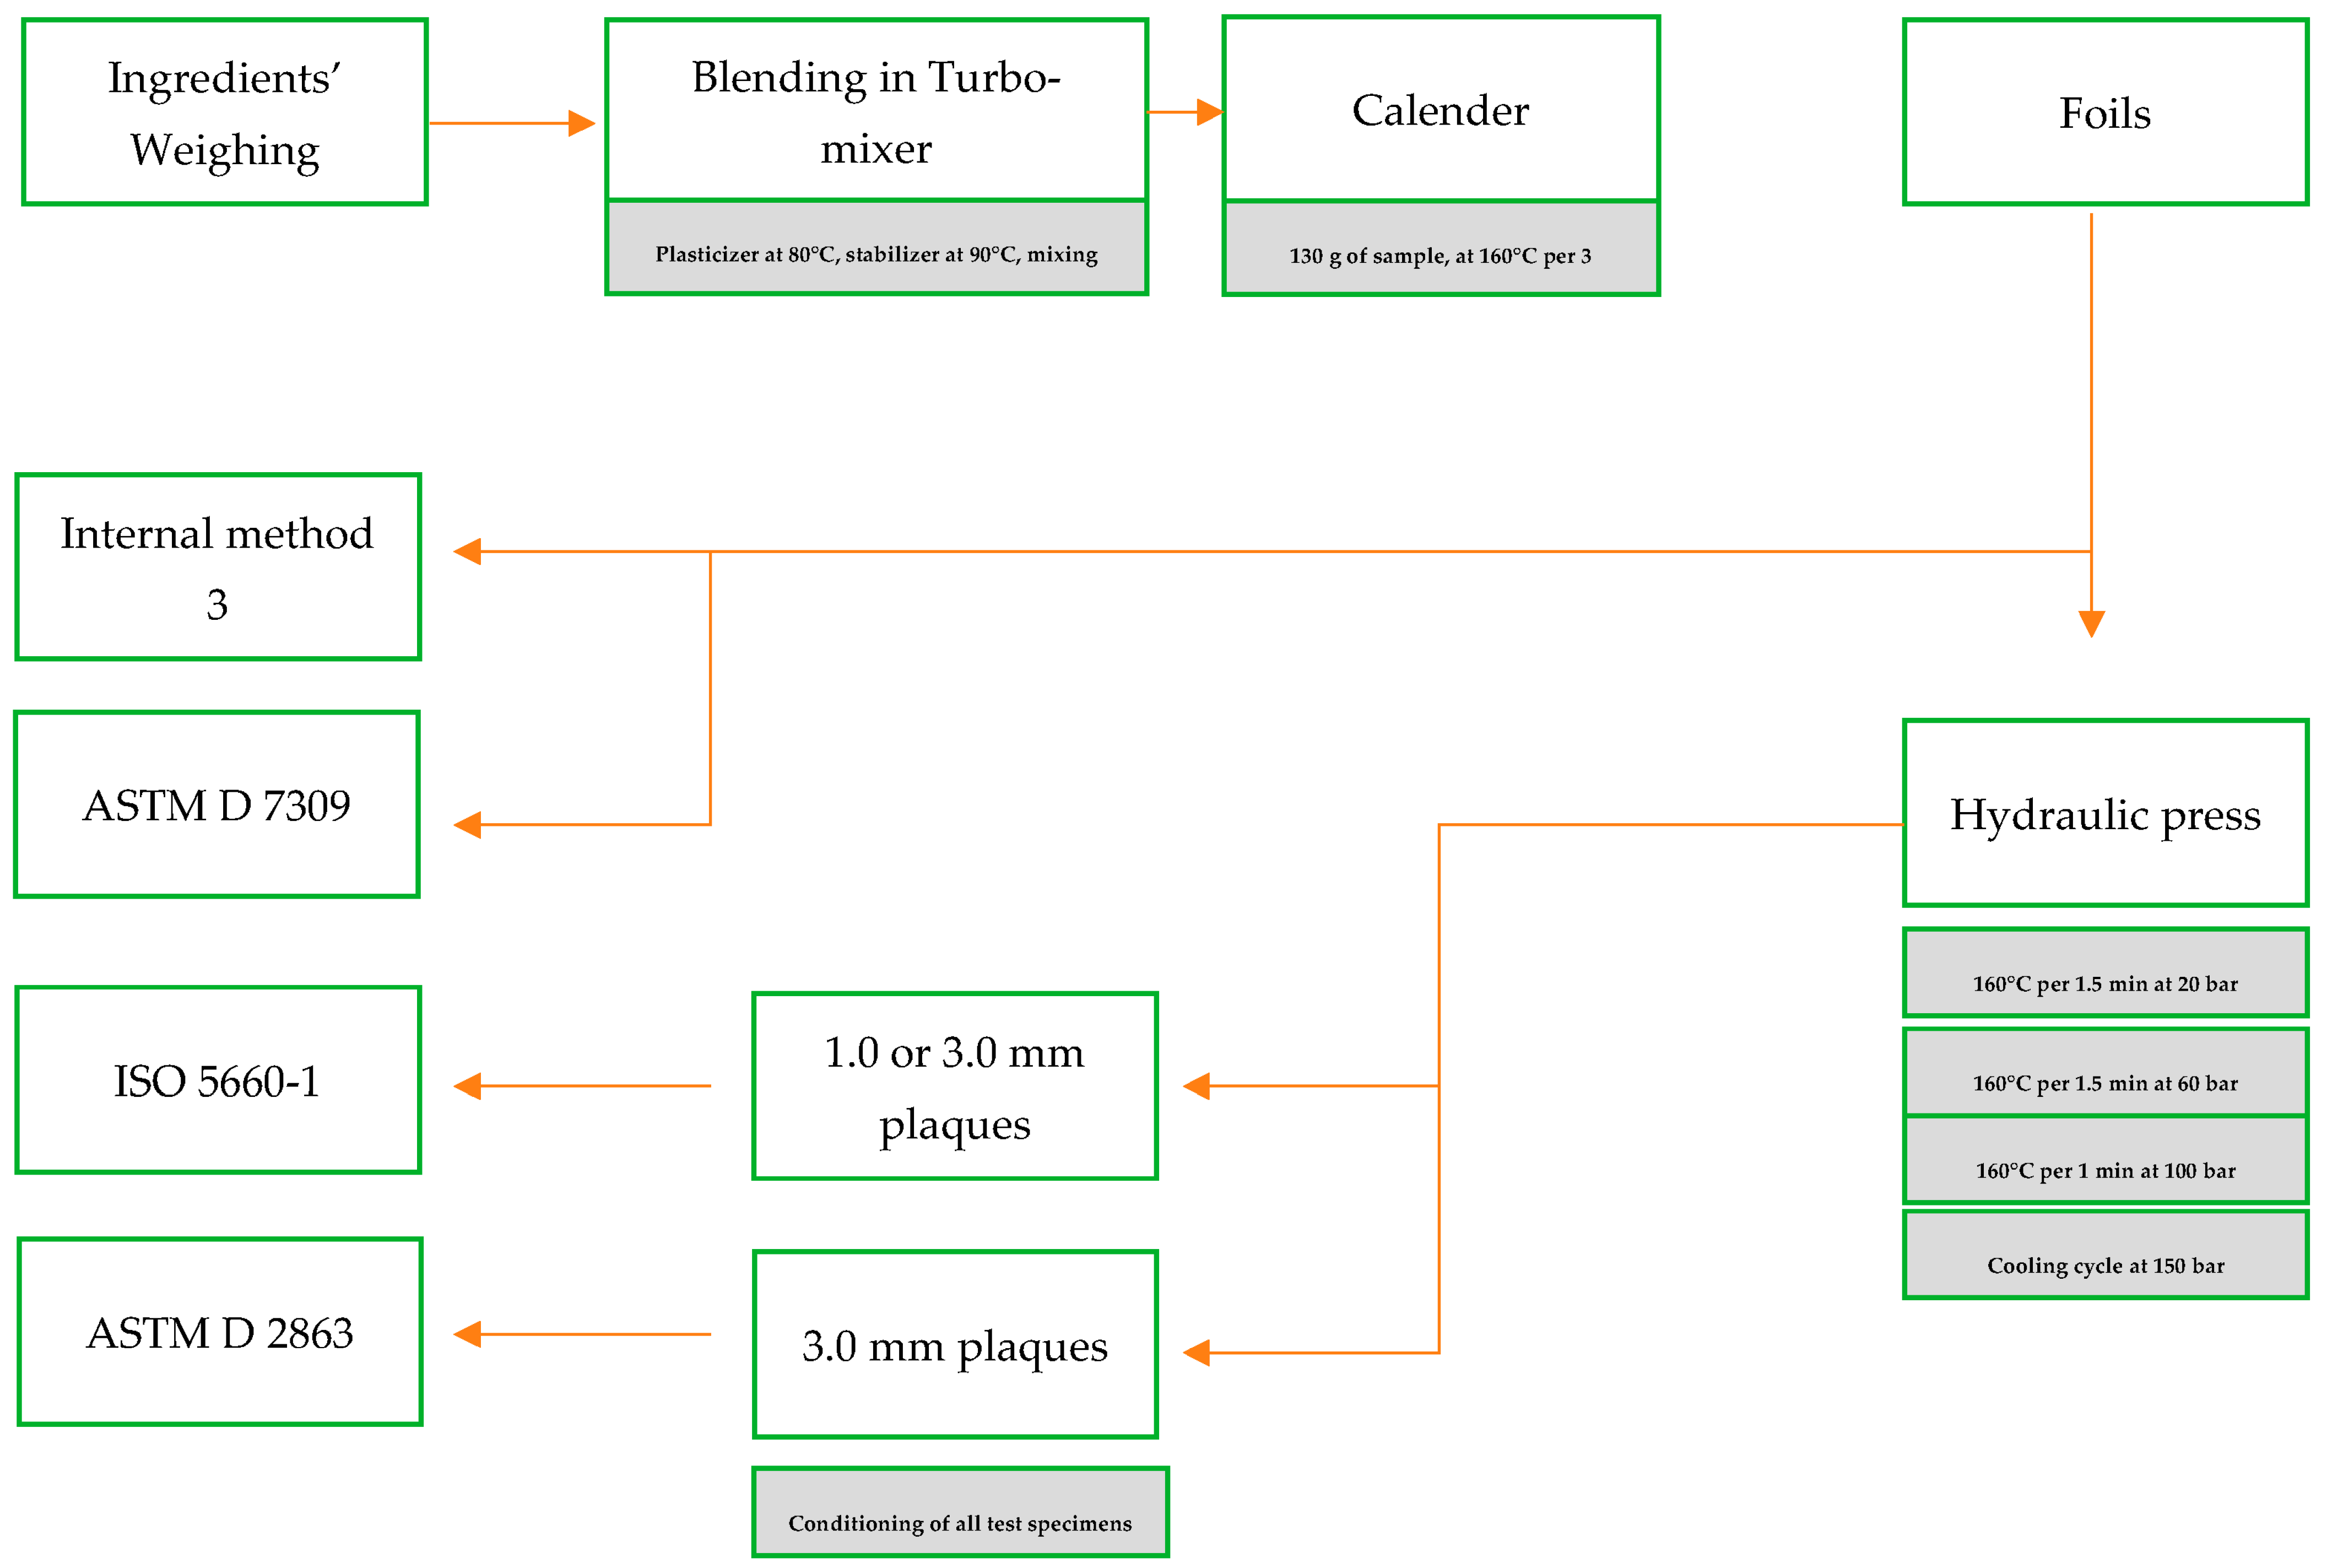
Appendix A. A Schematic Diagram of the Sample Preparation and Testing Process

References
- Hjertberg, T.; Sörvik, E.M. Thermal Degradation of PVC. In Degradation and Stabilisation of PVC; Owen, E.D., Ed.; Springer: Dordrecht, The Netherlands, 1984. [Google Scholar] [CrossRef]
- Starnes, W.H. How and to What Extent Are Free Radicals Involved in the Nonoxidative Thermal Dehydrochlorination of Poly(vinyl chloride). J. Vinyl Addit. Technol. 2012, 18, 71–75. [Google Scholar] [CrossRef]
- Starnes, W.H.; Ge, X. Mechanism of Autocatalysis in the Thermal Dehydrochlorination of Poly(vinyl chloride). Macromolecules 2004, 37, 352–359. [Google Scholar] [CrossRef]
- Starnes, W.H.; Wallach, J.A.; Yao, H. Six-Center Concerted Mechanism for Poly(vinyl chloride) Dehydrochlorination. Requiescat in Pace? Macromolecules 1996, 29, 7631–7633. [Google Scholar] [CrossRef]
- Starnes, W.H. Structural and mechanistic aspects of the thermal degradation of poly(vinyl chloride). Prog. Polym. Sci. 2002, 27, 2133–2170. [Google Scholar] [CrossRef]
- Lynda, P.B. The Dehydrochlorination Mechanism of the Internal Allylic Chloride Structure in Poly(Vinyl Chloride). Dissertations, Theses, and Masters Projects. Master’s Thesis, William & Mary, Williamsburg, VA, USA, 2000. [Google Scholar] [CrossRef]
- Schartel, B.; Hull, T.R. Development of fire-retarded materials—Interpretation of cone calorimeter data. FAM 2007, 31, 327–354. [Google Scholar] [CrossRef]
- Starnes, W.H.; Edelson, D. Mechanistic Aspects of the Behavior of Molybdenum(VI) Oxide as a Fire-Retardant Additive for Poly(vinylvinyl chloride). Macromolecules 1979, 12, 797–802. [Google Scholar] [CrossRef]
- Starnes, W.H.; Wescott, L.D.; Reents, W.D.; Cais, R.E.; Villacorta, G.M.; Plitz, I.M.; Anthony, L.J. Mechanism of poly(vinyl chloride) fire retardance by molybdenum(vi) oxide. Further evidence in favor of the Lewis acid theory. In Polymer Additives. Polymer Science and Technology; Kresta, J.E., Ed.; Springer: Boston, MA, USA, 2007; Volume 26, pp. 237–248. [Google Scholar] [CrossRef]
- Montaudo, G.; Puglisi, C. Evolution of aromatics in the thermal degradation of poly(vinyl chloride): A mechanistic study. Polym. Degrad. Stab. 1991, 33, 229–262. [Google Scholar] [CrossRef]
- Wu, C.H.; Wu, C.H.; Chang, C.Y.; Hor, J.L.; Shih, S.M.; Chen, L.W.; Chang, F.W. Two-stage pyrolysis model of PVC. Can. J. Chem. Eng. 1994, 72, 644–650. [Google Scholar] [CrossRef]
- Anthony, G.M. Kinetic and Chemical Studies of Polymer Cross-Linking Using Thermal Gravimetry and Hyphenated Methods. Degradation of Polyvinylchloride. Polym. Degrad. Stab. 1999, 64, 353–357. [Google Scholar] [CrossRef]
- O’Mara, M.M. Combustion of PVC. Pure Appl. Chem. 1977, 49, 649–660. [Google Scholar] [CrossRef]
- Ballistreri, A.; Foti, S.; Maravigna, P.; Montaudo, G.; Scamporrino, E. Effect of metal oxides on the evolution of aromatic hydrocarbons in the thermal decomposition of PVC. J. Polym. Sci. Polym. Chem. Ed. 1980, 18, 3101–3110. [Google Scholar] [CrossRef]
- Fenimore, C.P.; Martin, F.J. The Mechanisms of Pyrolysis, Oxidation, and Burning of Polymers. In NBS Special Publication 357; Wall, L.A., Ed.; Executive Agency: Brussels, Belgium, 1972; pp. 159–170. Available online: https://nvlpubs.nist.gov/nistpubs/Legacy/SP/nbsspecialpublication357.pdf (accessed on 1 June 2023).
- Marcilla, A.; Beltrán, M. Kinetic models for the thermal decomposition of commercial PVC resins and plasticizers studied by thermogravimetric analysis. Polym. Degrad. Stab. 1996, 53, 251–260. [Google Scholar] [CrossRef]
- Laoutid, F.; Bonnaud, L.; Alexandre, M.; Lopez-Cuesta, J.-M.; Dubois, P. New prospects in flame retardant polymer materials: From fundamentals to nanocomposites. Mater. Sci. Eng. Rep. 2009, 63, 100–125. [Google Scholar] [CrossRef]
- Edelson, D.; Kuck, V.J.; Lum, R.M.; Scalco, E.; Starnes, W.H.; Kaufman, S. Anomalous behavior of molybdenum oxide as a fire retardant for polyvinyl chloride. Combust. Flame 1980, 38, 271–283. [Google Scholar] [CrossRef]
- Pike, R.; Starnes, W.H.; Jeng, J.P.; Bryant, W.S.; Kourtesis, P.; Adams, C.W.; Bunge, S.D.; Kang, Y.M.; Kim, A.S.; Kim, J.H.; et al. Low-Valent Metals as Reductive Cross-Linking Agents: A New Strategy for Smoke Suppression of Poly(vinyl chloride). Macromolecules 1997, 30, 6957–6965. [Google Scholar] [CrossRef]
- Li, B.; Wang, J. A Cone Calorimetric Study of Flame Retardance and Smoke Emission of PVC. I. The Effect of Cuprous and Molybdic Oxides. J. Fire Sci. 1997, 15, 341–357. [Google Scholar] [CrossRef]
- Li, B. A study of the thermal decomposition and smoke suppression of poly(vinyl chloride) treated with metal oxides using a cone calorimeter at a high incident heat flux. Polym. Degrad. Stab. 2002, 78, 349–356. [Google Scholar] [CrossRef]
- Morley, J.C.; Grossman, R.F. Flame Retardants and Smoke Suppressants. In Handbook of Vinyl Formulating, 2nd ed.; Grossman, R.F., Ed.; John Wiley & Sons Inc.: Hoboken, NJ, USA, 2007; pp. 403–414. [Google Scholar] [CrossRef]
- Sarti, G. A New Perspective on Hydrogen Chloride Scavenging at High Temperatures for Reducing the Smoke Acidity of PVC Cables in Fires. I: An Overview of the Theory, Test Methods, and the European Union Regulatory Status. Fire 2022, 5, 127. [Google Scholar] [CrossRef]
- Sarti, G. A New Perspective on Hydrogen Chloride Scavenging at High Temperatures for Reducing the Smoke Acidity of PVC Cables in Fires. II: Some Examples of Acid Scavengers at High Temperatures in the Condensed Phase. Fire 2022, 5, 142. [Google Scholar] [CrossRef]
- ASTM D 2863:2019; Standard Test Method for Measuring the Minimum Oxygen Concentration to Support Candle-Like Combustion of Plastics (Oxygen Index). ASTM International: West Conshohocken, PA, USA, 2019. Available online: www.astm.org (accessed on 1 June 2023).
- ISO 5660-1:2015; Reaction-to-Fire Tests—Heat Release, Smoke Production and Mass Loss Rate—Part 1: Heat Release Rate (Cone Calorimeter Method) and Smoke Production Rate (Dynamic Measurement). ISO: Geneva, Switzerland, 2015. Available online: https://www.iso.org/standard/57957.html (accessed on 1 June 2023).
- ASTM D 7309:2019; Standard Test Method for Determining Flammability Characteristics of Plastics and Other Solid Materials Using Microscale Combustion Calorimetry. ASTM International: West Conshohocken, PA, USA, 2019. Available online: www.astm.org (accessed on 1 June 2023).
- Kipouros, G.J.; Sadoway, D.R. A thermochemical analysis of the production of anhydrous MgCl2. J. Light Met. 2001, 1, 111–117. [Google Scholar] [CrossRef]
- Galwey, A.K.; Laverty, G.M. The thermal decomposition of magnesium chloride dihydrate. Thermochim. Acta 1989, 138, 115–127. [Google Scholar] [CrossRef]
- Commercial PCC Purchased by Imerys. Available online: https://www.imerys-performance-minerals.com/system/files/2021-02/DATPCC_Winnofil_S_LSK_EN_2019-07.pdf (accessed on 1 June 2023).
- EN 60754-2:2014/A1:2020; Test on Gases Evolved during Combustion of Materials from Cables—Part 2: Determination of Acidity (by pH Measurement) and Conductivity. CENELEC: Brussels, Belgium, 2020.
- EN 60754-1:2014/A1:2020; Test on Gases Evolved during Combustion of Materials from Cables—Part 1: Determination of the Halogen Acid Gas Content. CENELEC: Brussels, Belgium, 2020.
- EN 138523:2022; Reaction to Fire Tests for Building Products—Building Products Excluding Floorings Exposed to the Thermal Attack by a Single Burning Item. CEN: Brussels, Belgium, 2022. Available online: https://store.uni.com/en-13823-2020-a1-2022 (accessed on 1 June 2023).
- Bassi, I. Characterization of PVC Compounds and Evaluation of Their Fire Performance, Focusing on the Comparison between EN 60754-1 and EN 60754-2 in the Assessment of the Smoke Acidity. Master’s Thesis, University of Bologna, Bologna, Italy, 2021. Available online: https://www.pvc4cables.org/images/assessment_of_the_smoke_acidity.pdf (accessed on 1 June 2023).
- Hirschler, M. Poly(vinyl chloride) and its fire properties. FAM 2017, 41, 993–1006. [Google Scholar] [CrossRef]
- Babrauskas, V.; Richard, D. Peacock, Heat release rate: The single most important variable in fire hazard. Fire Saf. J. 1992, 18, 255–272. [Google Scholar] [CrossRef]
- Sarti, G.; Piana, M. New formulations and test comparison for the classification of PVC cables under EU regulation n 305/2011 for construction products. In Proceedings of the AMI Cables 2019, Duesseldorf, Germany, 5–7 March 2019. [Google Scholar]
- Sarti, G.; Piana, M. PVC cables and smoke acidity: A review comparing performances of old and new compounds. In Proceedings of the AMI Cables 2020, Duesseldorf, Germany, 3–5 March 2020. [Google Scholar]
- DOT/FAA/TC-22/22 Federal Aviation Administration William, J. Hughes Technical Center Aviation Research Division Atlantic City International Airport New Jersey 08405. Final Report Microscale Flammability Criterion for Constituents of Aircraft Cabin Materials. 2022. Available online: https://www.fire.tc.faa.gov/pdf/TC22-22.pdf (accessed on 1 June 2023).
- Sarti, G.; Piana, M. PVC in cables for building and construction. Can the “European approach” be considered a good example for other countries? Acad. Lett. 2022, 5453. [Google Scholar] [CrossRef]


| Raw Materials | Trade Name | REAC0 [phr] | REAC1 [phr] | REAC2 [phr] | REAC4 [phr] | REAC5 [phr] |
|---|---|---|---|---|---|---|
| PVC | Inovyn 271 PC | 100 | 100 | 100 | 100 | 100 |
| DINP | Diplast N | 50 | 50 | 50 | 50 | 50 |
| GCC | Atomfor S | 0 | 30 | 30 | 0 | 90 |
| Al(OH)3 | Aluprem TGR4 | 0 | 60 | 0 | 0 | 0 |
| Mg(OH)2 | Ecopyren 3.5 | 0 | 0 | 60 | 0 | 0 |
| UPCC | Winnofil S | 0 | 0 | 0 | 90 | 0 |
| COS | RPK B-CV/ 3038 | 3.0 | 3.0 | 3.0 | 3.0 | 3.0 |
| Flame retardant | Reaguard B-FR/9211 | 10 | 10 | 10 | 10 | 10 |
| Test Apparatus | Producer | Model | Additional Information |
|---|---|---|---|
| Calender | Battaggion | MCC/N150X300-E | Temperature 160 °C—Milling Time 3’ |
| Halogen acid gas test apparatus | S.A. Associates | Standard model | Porcelain combustion boats |
| Multimeter for electric measurements | Mettler Toledo | S213 standard kit | |
| Conductivity electrode | Mettler Toledo | S213 standard kit | Reference thermocouple adjusting temperature fluctuations |
| pH electrode | ettler Toledo | S213 standard kit | Reference thermocouple adjusting temperature fluctuations |
| LOI test apparatus | FTT | Standard model | Test Specimen type IV; ASTM D 2863 |
| Cone calorimeter | FTT | Dual cone calorimeter | ISO 5660-1. Heat flux 50 K.W./m2, 1 or 3 mm test specimen thicknesses, with grid |
| Micro combustion calorimeter | FTT | Standard Model | Pyrolizer 1 °C/s, 750 °C, combustor 750 °C, method A of ASTM D 7309 |
| Technical Standard | Measurement | Temperature [°C] | Note |
|---|---|---|---|
| Internal method 3 | Multimeter Smoke acidity | 40 min to 800 °C +/−10 °C 20 min at 800°C +/−10 °C | DDW, pH, and conductivity. As EN 60754-2 with a heating regime of EN 60754-1 |
| ASTM D 2863 | LOI | 23 °C | Test specimens type IV. Method B |
| ISO 5660-1 | Time to ignition (TTI), (s) Time to flame out (TTFO) (s) Time to peak (TTP) (s) Peak of heat release rate (pHRR) (kW/m2) Total heat release (THR) (MJ/m2) Mass loss (%) Total smoke production (TSP) (m2) Peak of smoke production rate (m2/s) | 755 °C | Sample thicknesses 1 mm and 3 mm, area 88.4 cm2, sparkling source on |
| ASTM D 7309 | Yield of pyrolysis residue, (Yp) (g/g) Fire growth capacity (FGC) (J/g·K) Heat release capacity (ηc) (J/g·K) Maximum specific heat release rate (Qmax) (J/g) Heat release temperature (Tmax) (°C) Specific (total) heat release, hc (J/g) Specific heat of combustions of fuel gases, hc gas (J/g) | 750 °C combustor 1 °C/min to 750 °C pyrolizer |
| Formulation | REA1 | REA2 | REA3 | REA4 | REA5 | REA6 | REA7 | REA8 | REA9 |
|---|---|---|---|---|---|---|---|---|---|
| pH | 2.20 | 2.30 | 2.60 | 2.90 | 3.20 | 4.20 | 2.50 | 2.40 | 3.40 |
| CVpH | <5.0% | <5.0% | <5.0% | <5.0% | <5.0% | <5.0% | <5.0% | <5.0% | <5.0% |
| Conductivity (μS/mm) | 359.7 | 328.5 | 105.7 | 70.1 | 31.1 | 3.8 | 180.7 | 205.2 | 11.8 |
| CVc | <5.0% | <5.0% | <5.0% | <5.0% | <5.0% | <5.0% | <5.0% | <5.0% | <5.0% |
| Formulation | REAC0 | REAC1 | REAC2 | REAC4 | REAC5 |
|---|---|---|---|---|---|
| pH | 1.95 | 2.65 | 2.74 | 3.30 | 2.62 |
| CVpH | <5.0% | <5.0% | <5.0% | <5.0% | <5.0% |
| Conductivity (μS/mm) | 462.1 | 92.8 | 76.0 | 25.1 | 117.3 |
| CVc | <5.0% | <5.0% | <5.0% | <5.0% | <5.0% |
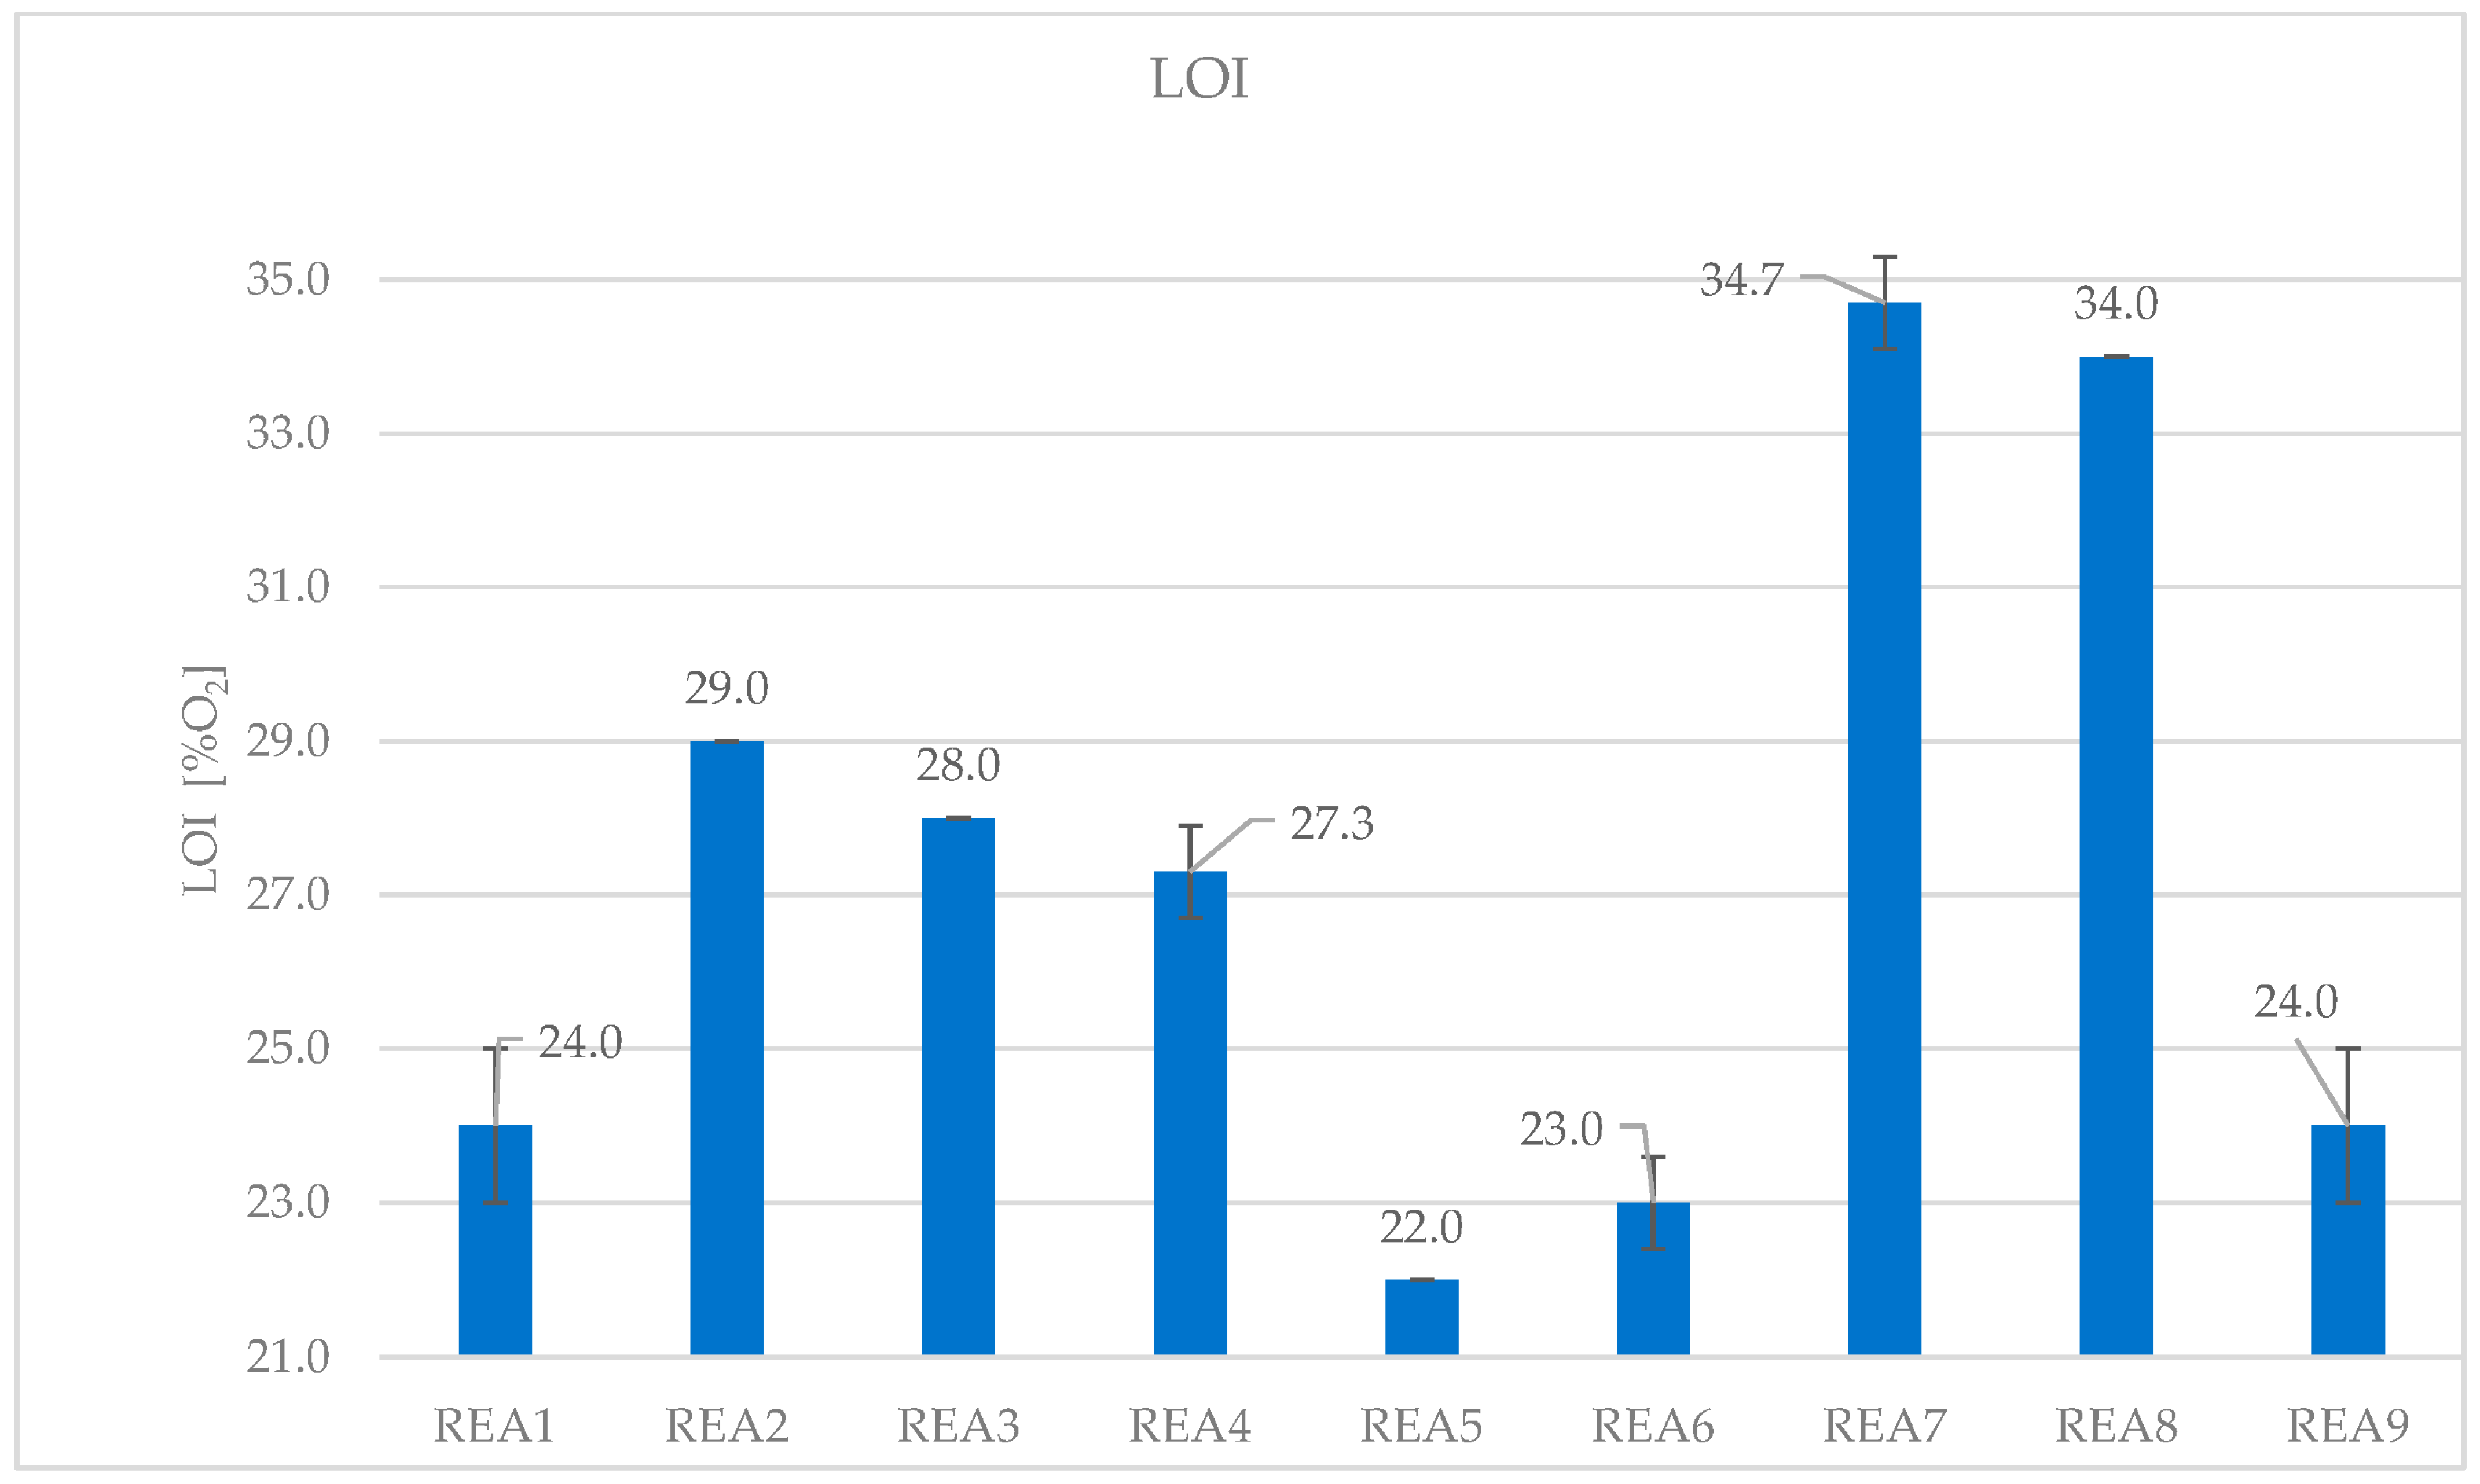
| Formulation | REA1 | REA2 | REA3 | REA4 | REA5 | REA6 | REA7 | REA8 | REA9 |
|---|---|---|---|---|---|---|---|---|---|
| LOI (O2%) | 24.0 | 29.0 | 28.0 | 27.3 | 22.0 | 23.0 | 34.7 | 34.0 | 24.0 |
| SD | 1.0 | 0.0 | 0.0 | 0.6 | 0.0 | 0.6 | 0.6 | 0.0 | 1.0 |
| Formulation | REAC0 | REAC1 | REAC2 | REAC4 | REAC5 |
|---|---|---|---|---|---|
| LOI (O2%) | 25.0 | 29.3 | 28.0 | 21.0 | 25.0 |
| SD | 0.0 | 1.5 | 1.0 | 0.0 | 0.0 |
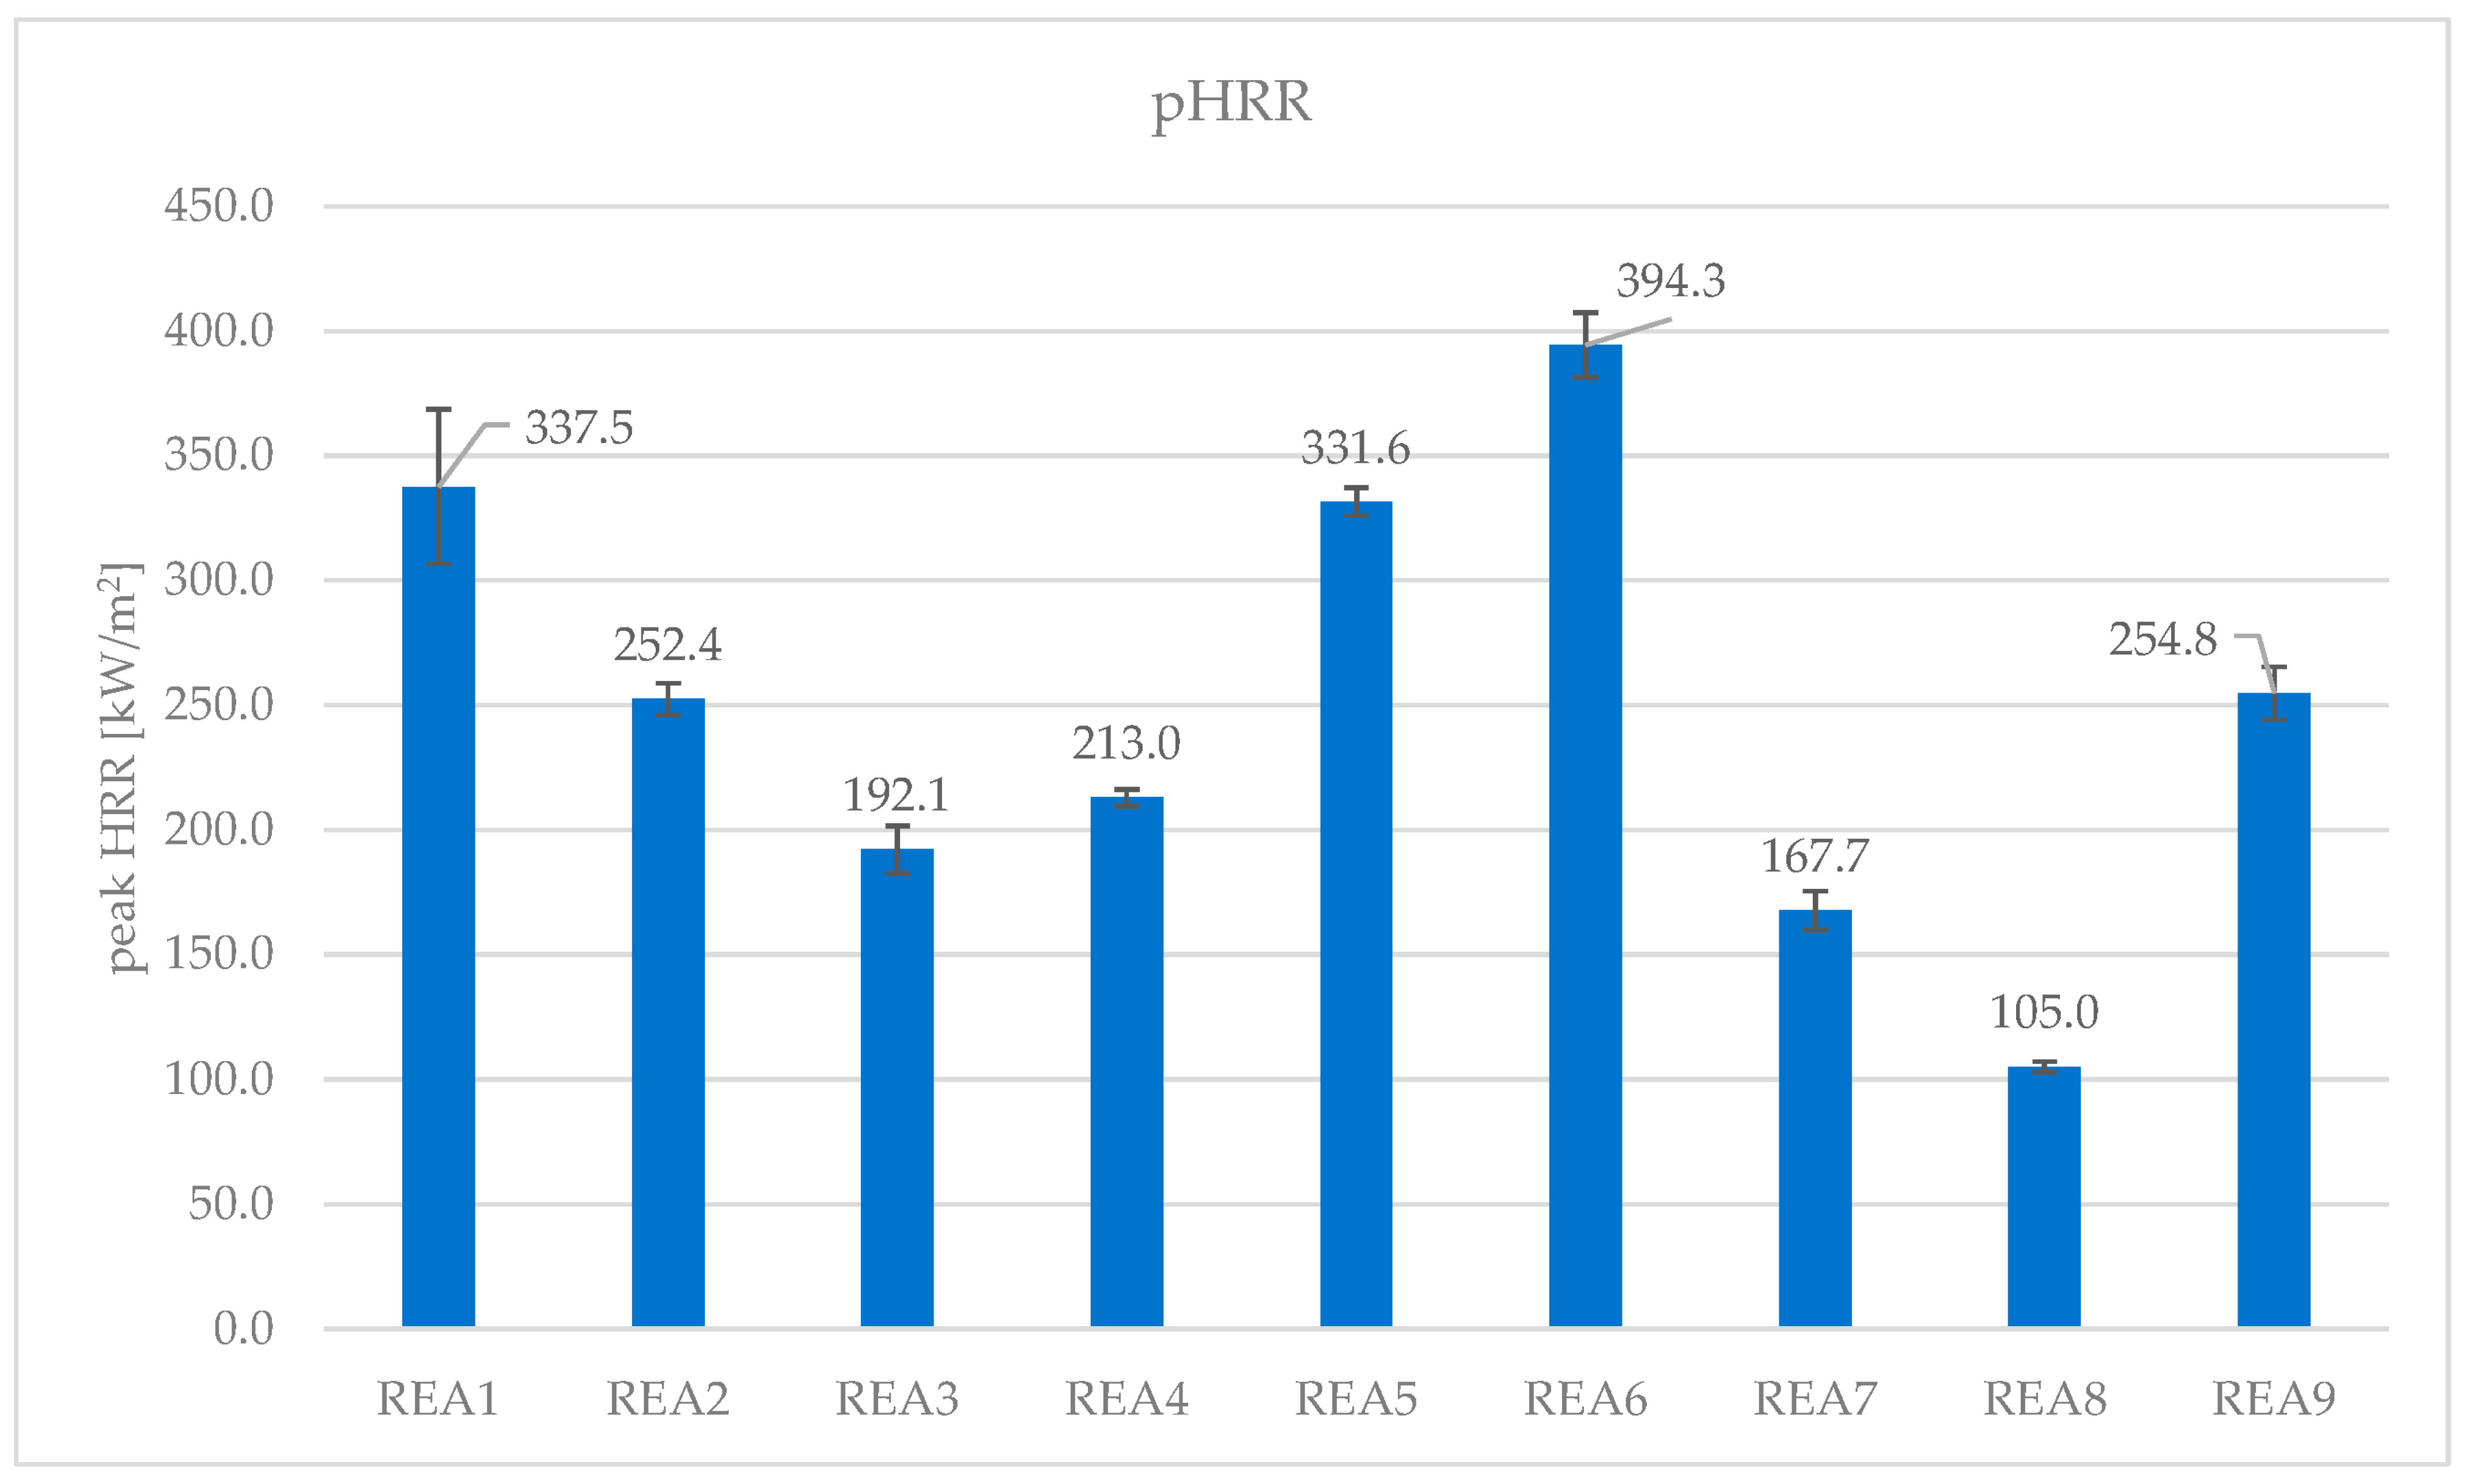
| Formulation | REA1 | REA2 | REA3 | REA4 | REA5 | REA6 | REA7 | REA8 | REA9 |
|---|---|---|---|---|---|---|---|---|---|
| peak HRR (kW/m2) | 337.5 | 252.4 | 192.1 | 213.0 | 331.6 | 394.3 | 167.7 | 105.0 | 254.8 |
| SD | 31.0 | 6.4 | 9.5 | 3.3 | 5.6 | 13.0 | 7.7 | 2.1 | 10.7 |
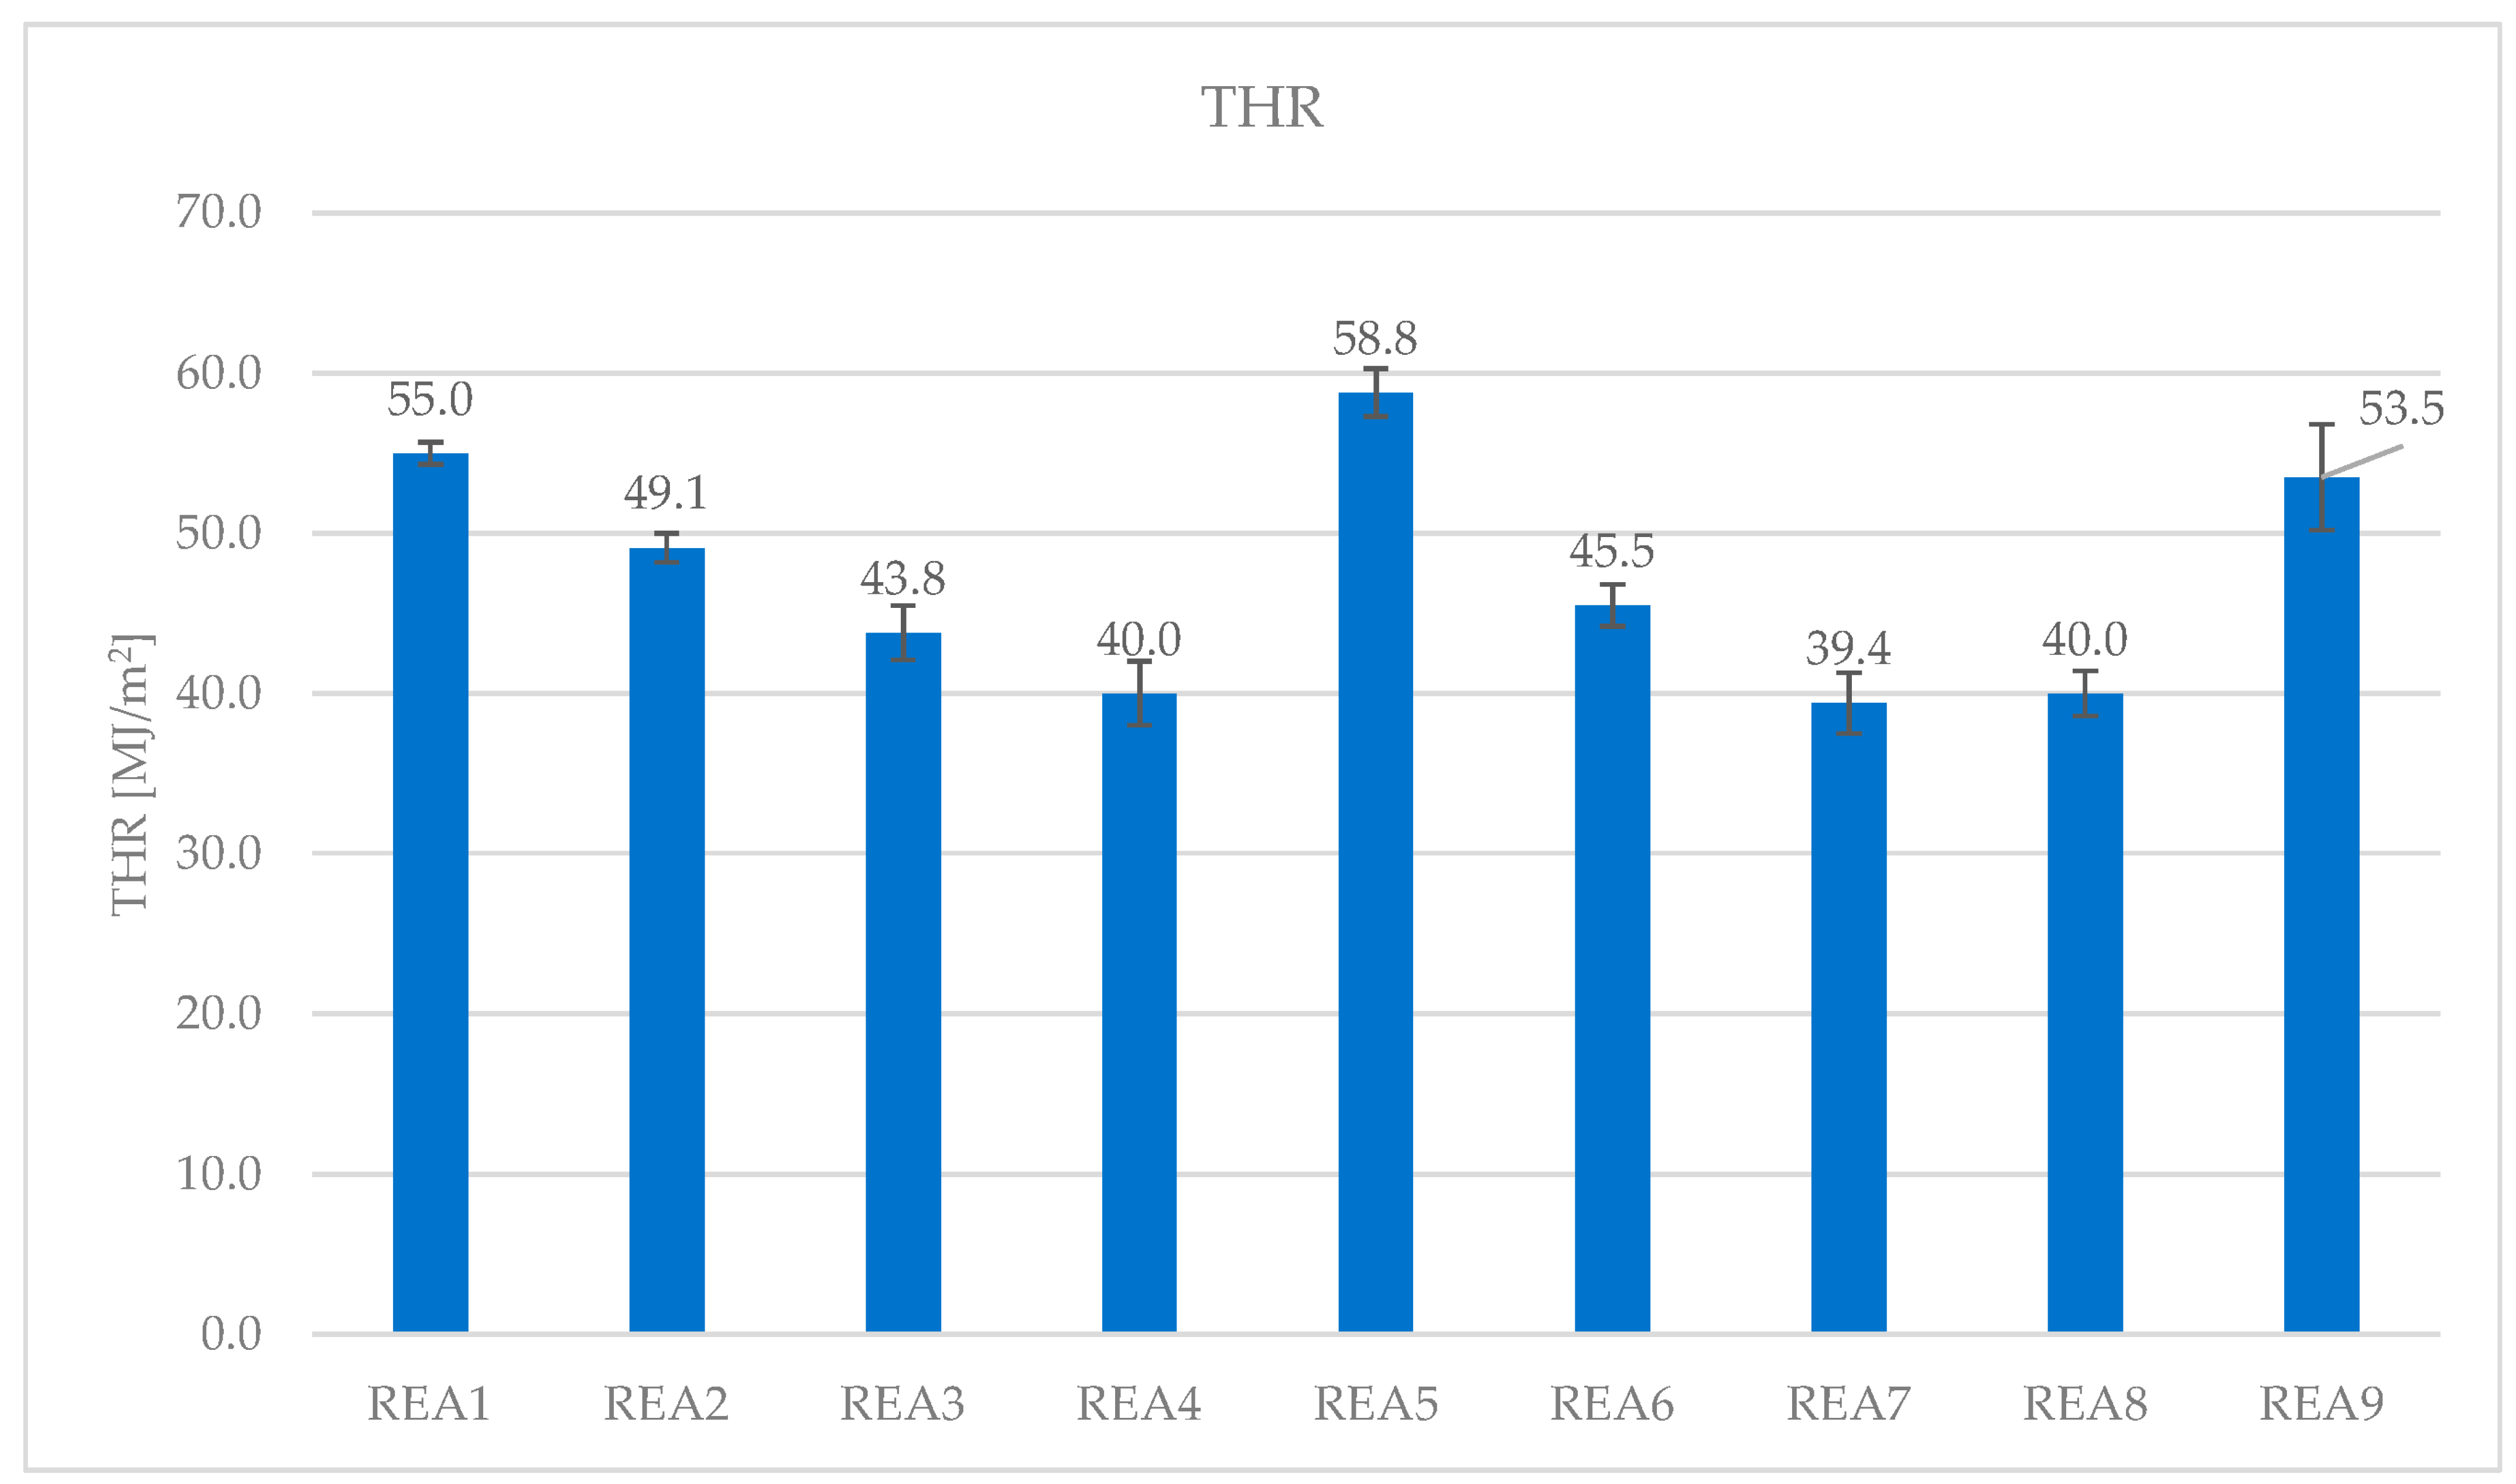
| THR (MJ/m2) | 55.0 | 49.1 | 43.8 | 40.0 | 58.8 | 45.5 | 39.4 | 40.0 | 53.5 |
| SD | 0.7 | 0.9 | 1.7 | 2.0 | 1.5 | 1.3 | 1.9 | 1.4 | 3.3 |
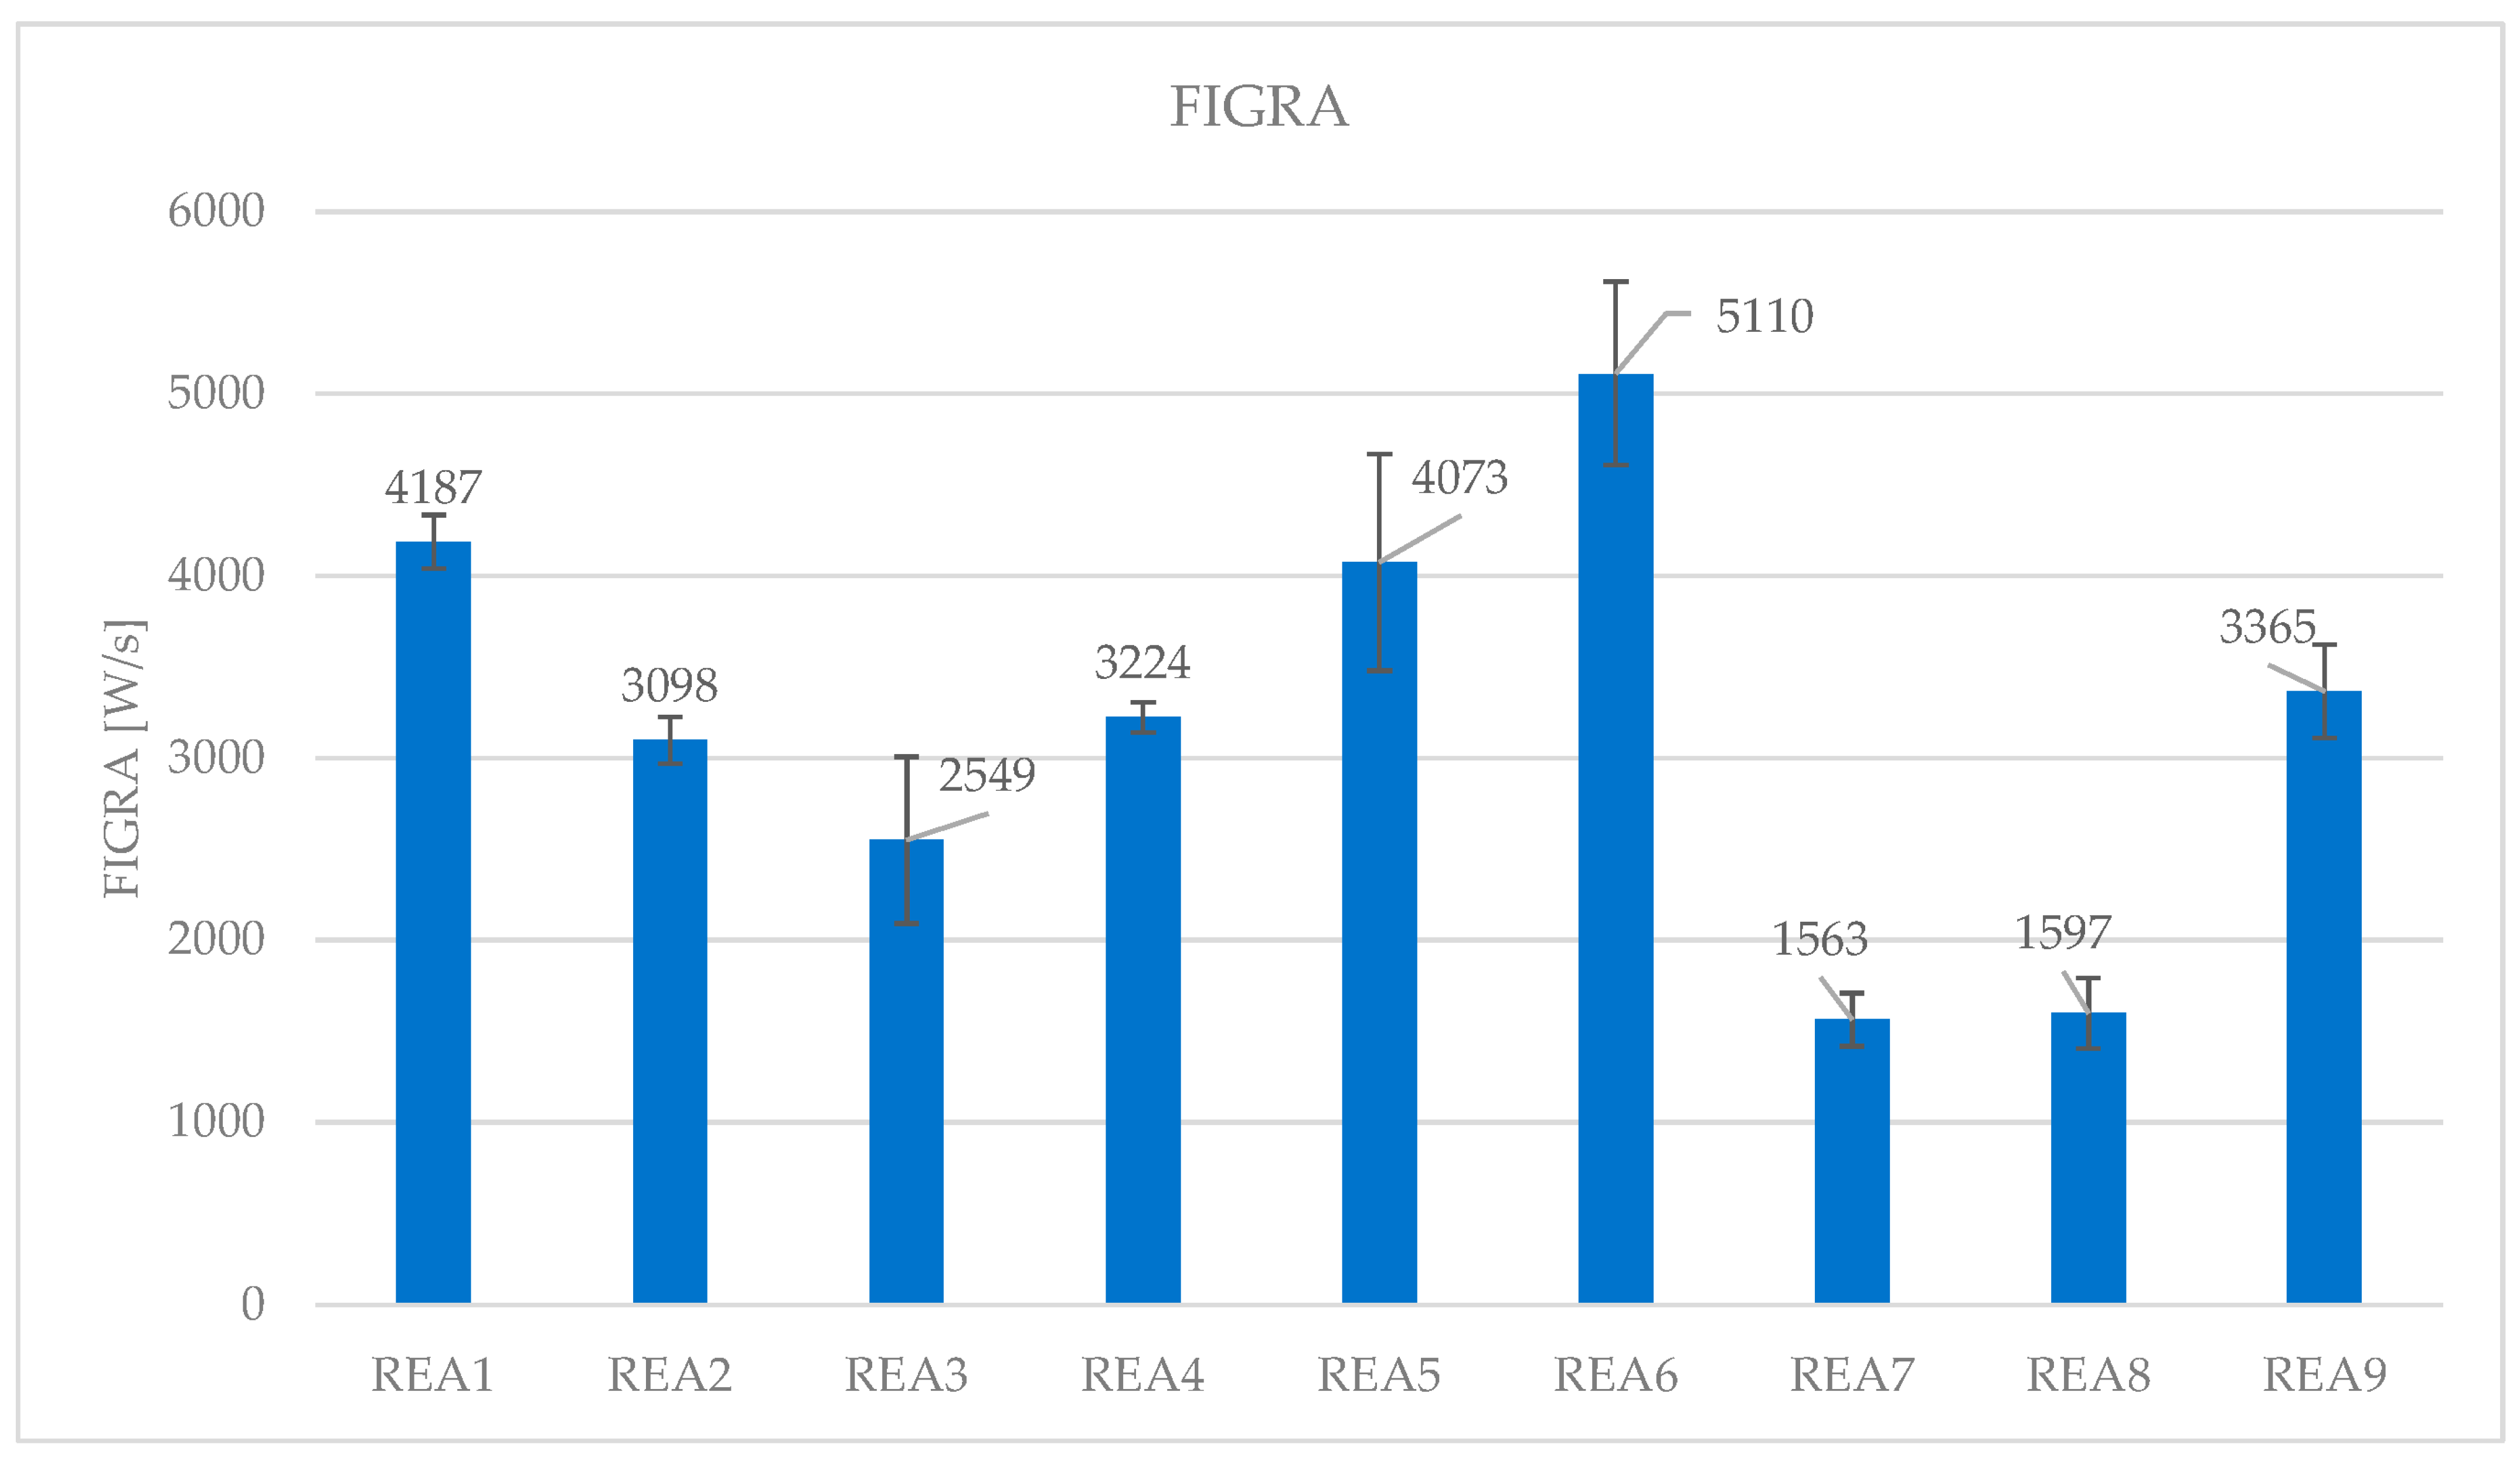
| FIGRA (W/s) | 4187 | 3098 | 2549 | 3224 | 4073 | 5110 | 1563 | 1597 | 3365 |
| SD | 147 | 129 | 458 | 83 | 594 | 503 | 146 | 194 | 255 |
| TSP (m2) | 28.3 | 28.1 | 16.5 | 17.8 | 13.8 | 15.3 | 10.1 | 9.6 | 11.4 |
| SD | 0.6 | 1.3 | 1.0 | 1.2 | 0.5 | 0.3 | 1.5 | 1.8 | 0.5 |
| Formulation | REAC0 | REAC1 | REAC2 | REAC4 | REAC5 |
|---|---|---|---|---|---|
| peak HRR (kW/m2) | 270.4 | 128.4 | 200.5 | 292.6 | 198.8 |
| SD | 33.2 | 0.5 | 11.4 | 1.1 | 7.4 |
| THR (MJ/m2) | 18.0 | 20.2 | 25.4 | 29.7 | 23.6 |
| SD | 0.5 | 1.6 | 2.2 | 0.1 | 3.3 |
| FIGRA (W/s) | 6239 | 2616 | 3986 | 6035 | 4316 |
| SD | 49 | 215 | 402 | 220 | 542 |
| TSP (m2) | 6.4 | 3.9 | 4.6 | 6.6 | 5.1 |
| SD | 0.6 | 0.5 | 0.1 | 0.4 | 0.6 |
| Formulation | REA1 | REA2 | REA3 | REA4 | REA5 | REA6 | REA7 | REA8 | REA9 |
|---|---|---|---|---|---|---|---|---|---|
| FGC (J/g·K) | 156.95 | 141.42 | 88.90 | 90.83 | 104.72 | 100.51 | 75.81 | 102.43 | 92.83 |
| SD | 5.52 | 2.41 | 0.70 | 0.19 | 0.23 | 3.05 | 2.73 | 1.63 | 1.20 |
| ηc (J/g·K) | 324.10 | 326.11 | 330.20 | 333.33 | 338.65 | 322.50 | 323.30 | 321.01 | 333.03 |
| SD | 24.08 | 8.77 | 4.94 | 0.97 | 5.30 | 13.23 | 13.41 | 7.75 | 6.71 |
| Qmax (J/g) stg 1 | 202.00 | 197.79 | 135.26 | 152.50 | 162.78 | 144.00 | 109.86 | 136.03 | 147.31 |
| SD | 4.78 | 4.65 | 0.65 | 3.33 | 5.94 | 4.51 | 2.13 | 7.80 | 2.19 |
| Tmax (°C) stg 1 | 324.1 | 326.1 | 330.2 | 333.3 | 338.6 | 322.5 | 323.3 | 321.0 | 333.0 |
| SD | 0.81 | 1.20 | 0.30 | 1.60 | 0.80 | 6.20 | 2.30 | 1.00 | 0.20 |
| Qmax (J/g) stg 2 | 101.61 | 96.93 | 51.36 | 51.37 | 57.34 | 51.97 | 52.62 | 48.77 | 59.49 |
| SD | 5.69 | 3.90 | 0.50 | 0.54 | 0.30 | 1.89 | 0.38 | 0.08 | 1.29 |
| Tmax (°C) stg 2 | 491.8 | 493.0 | 483.5 | 475.7 | 480.5 | 500.6 | 486.8 | 478.0 | 478.8 |
| SD | 0.99 | 1.10 | 0.16 | 1.00 | 0.30 | 1.70 | 0.40 | 2.20 | 0.90 |
| hc (J/g) total | 17.16 | 15.42 | 9.93 | 10.23 | 11.76 | 11.33 | 9.15 | 10.38 | 10.38 |
| SD | 0.19 | 0.17 | 0.12 | 0.06 | 0.03 | 0.16 | 0.10 | 0.09 | 0.08 |
| hc (J/g) stg 1 | 10.31 | 9.00 | 5.86 | 6.31 | 7.32 | 6.64 | 4.74 | 6.56 | 6.00 |
| SD | 0.18 | 0.17 | 0.08 | 0.06 | 0.04 | 0.21 | 0.09 | 0.17 | 0.06 |
| hc (J/g) stg 2 | 6.85 | 6.42 | 4.07 | 3.92 | 4.44 | 4.69 | 4.41 | 3.83 | 4.38 |
| SD | 0.20 | 0.17 | 0.16 | 0.05 | 0.02 | 0.11 | 0.11 | 0.07 | 0.10 |
| Yp (g/g) | 0.08 | 0.13 | 0.35 | 0.40 | 0.43 | 0.48 | 0.34 | 0.33 | 0.46 |
| SD | 0.03 | 0.01 | 0.02 | 0.02 | 0.00 | 0.02 | 0.01 | 0.02 | 0.02 |
| hc gas (J/g) total | 18.71 | 17.84 | 15.30 | 16.94 | 20.65 | 21.95 | 13.92 | 15.73 | 19.08 |
| SD | 0.12 | 0.27 | 0.35 | 0.54 | 0.11 | 1.11 | 0.42 | 0.32 | 0.60 |
| hc gas (J/g) stg 1 | 11.24 | 10.41 | 8.95 | 10.45 | 12.86 | 12.86 | 7.22 | 9.94 | 11.03 |
| SD | 0.10 | 0.11 | 0.26 | 0.35 | 0.08 | 0.63 | 0.20 | 0.45 | 0.43 |
| hc gas (J/g) stg 2 | 7.48 | 7.43 | 6.35 | 6.50 | 7.80 | 9.09 | 6.70 | 5.82 | 8.05 |
| SD | 0.02 | 0.16 | 0.09 | 0.19 | 0.03 | 0.48 | 0.22 | 0.19 | 0.17 |
| Formulation | REAC0 | REAC1 | REAC2 | REAC4 | REAC5 |
|---|---|---|---|---|---|
| FGC (J/g·K) | 102.68 | 83.66 | 79.99 | 93.90 | 76.69 |
| SD | 6.25 | 0.72 | 1.30 | 1.67 | 0.82 |
| ηc (J/g·K) | 366.66 | 212.13 | 259.66 | 229.07 | 287.92 |
| SD | 13.40 | 4.71 | 4.92 | 8.83 | 21.21 |
| Qmax (J/g) stg 1 | 277.68 | 123.38 | 196.29 | 141.61 | 166.51 |
| SD | 12.84 | 6.25 | 8.19 | 6.65 | 2.56 |
| Tmax (°C) stg 1 | 303.4 | 326.5 | 314.8 | 334.1 | 325.0 |
| SD | 0.1 | 1.7 | 0.8 | 1.4 | 0.8 |
| Qmax (J/g) stg 2 | 62.13 | 44.64 | 51.71 | 52.57 | 48.14 |
| SD | 3.50 | 1.00 | 1.05 | 1.20 | 1.25 |
| Tmax (°C) stg 2 | 481.6 | 481.2 | 485.2 | 482.8 | 485.9 |
| SD | 1.2 | 2.1 | 0.8 | 1.0 | 2.0 |
| hc (J/g) total | 12.25 | 9.97 | 9.60 | 11.32 | 9.41 |
| SD | 0.27 | 0.12 | 0.16 | 0.15 | 0.10 |
| hc (J/g) stg 1 | 8.06 | 6.63 | 5.81 | 7.34 | 6.15 |
| SD | 0.37 | 0.13 | 0.11 | 0.10 | 0.03 |
| hc (J/g) stg 2 | 4.19 | 3.33 | 3.80 | 3.98 | 3.27 |
| SD | 0.17 | 0.07 | 0.10 | 0.07 | 0.16 |
| Yp (g/g) | 0.18 | 0.36 | 0.43 | 0.44 | 0.39 |
| SD | 0.03 | 0.01 | 0.05 | 0.05 | 0.03 |
| hc gas (J/g) total | 15.54 | 15.74 | 16.55 | 20.94 | 15.70 |
| SD | 0.14 | 0.10 | 1.45 | 1.13 | 0.36 |
| hc gas (J/g) stg 1 | 10.17 | 10.44 | 9.81 | 13.55 | 10.19 |
| SD | 0.14 | 0.09 | 1.25 | 0.86 | 0.55 |
| hc gas (J/g) stg 2 | 5.36 | 5.29 | 6.74 | 7.38 | 5.50 |
| SD | 0.13 | 0.07 | 0.58 | 0.41 | 0.16 |
Disclaimer/Publisher’s Note: The statements, opinions and data contained in all publications are solely those of the individual author(s) and contributor(s) and not of MDPI and/or the editor(s). MDPI and/or the editor(s) disclaim responsibility for any injury to people or property resulting from any ideas, methods, instructions or products referred to in the content. |
© 2023 by the authors. Licensee MDPI, Basel, Switzerland. This article is an open access article distributed under the terms and conditions of the Creative Commons Attribution (CC BY) license (https://creativecommons.org/licenses/by/4.0/).
Share and Cite
Bassi, I.; Delchiaro, F.; Bandinelli, C.; Mazzocchetti, L.; Salatelli, E.; Sarti, G. A New Perspective on Hydrogen Chloride Scavenging at High Temperatures for Reducing the Smoke Acidity of PVC Cables in Fires, IV: The Impact of Acid Scavengers at High Temperatures on Flame Retardance and Smoke Emission. Fire 2023, 6, 259. https://doi.org/10.3390/fire6070259
Bassi I, Delchiaro F, Bandinelli C, Mazzocchetti L, Salatelli E, Sarti G. A New Perspective on Hydrogen Chloride Scavenging at High Temperatures for Reducing the Smoke Acidity of PVC Cables in Fires, IV: The Impact of Acid Scavengers at High Temperatures on Flame Retardance and Smoke Emission. Fire. 2023; 6(7):259. https://doi.org/10.3390/fire6070259
Chicago/Turabian StyleBassi, Iacopo, Francesca Delchiaro, Claudia Bandinelli, Laura Mazzocchetti, Elisabetta Salatelli, and Gianluca Sarti. 2023. "A New Perspective on Hydrogen Chloride Scavenging at High Temperatures for Reducing the Smoke Acidity of PVC Cables in Fires, IV: The Impact of Acid Scavengers at High Temperatures on Flame Retardance and Smoke Emission" Fire 6, no. 7: 259. https://doi.org/10.3390/fire6070259
APA StyleBassi, I., Delchiaro, F., Bandinelli, C., Mazzocchetti, L., Salatelli, E., & Sarti, G. (2023). A New Perspective on Hydrogen Chloride Scavenging at High Temperatures for Reducing the Smoke Acidity of PVC Cables in Fires, IV: The Impact of Acid Scavengers at High Temperatures on Flame Retardance and Smoke Emission. Fire, 6(7), 259. https://doi.org/10.3390/fire6070259