3.1. Comparison of Long Channel Single Node and Multiple Nodes
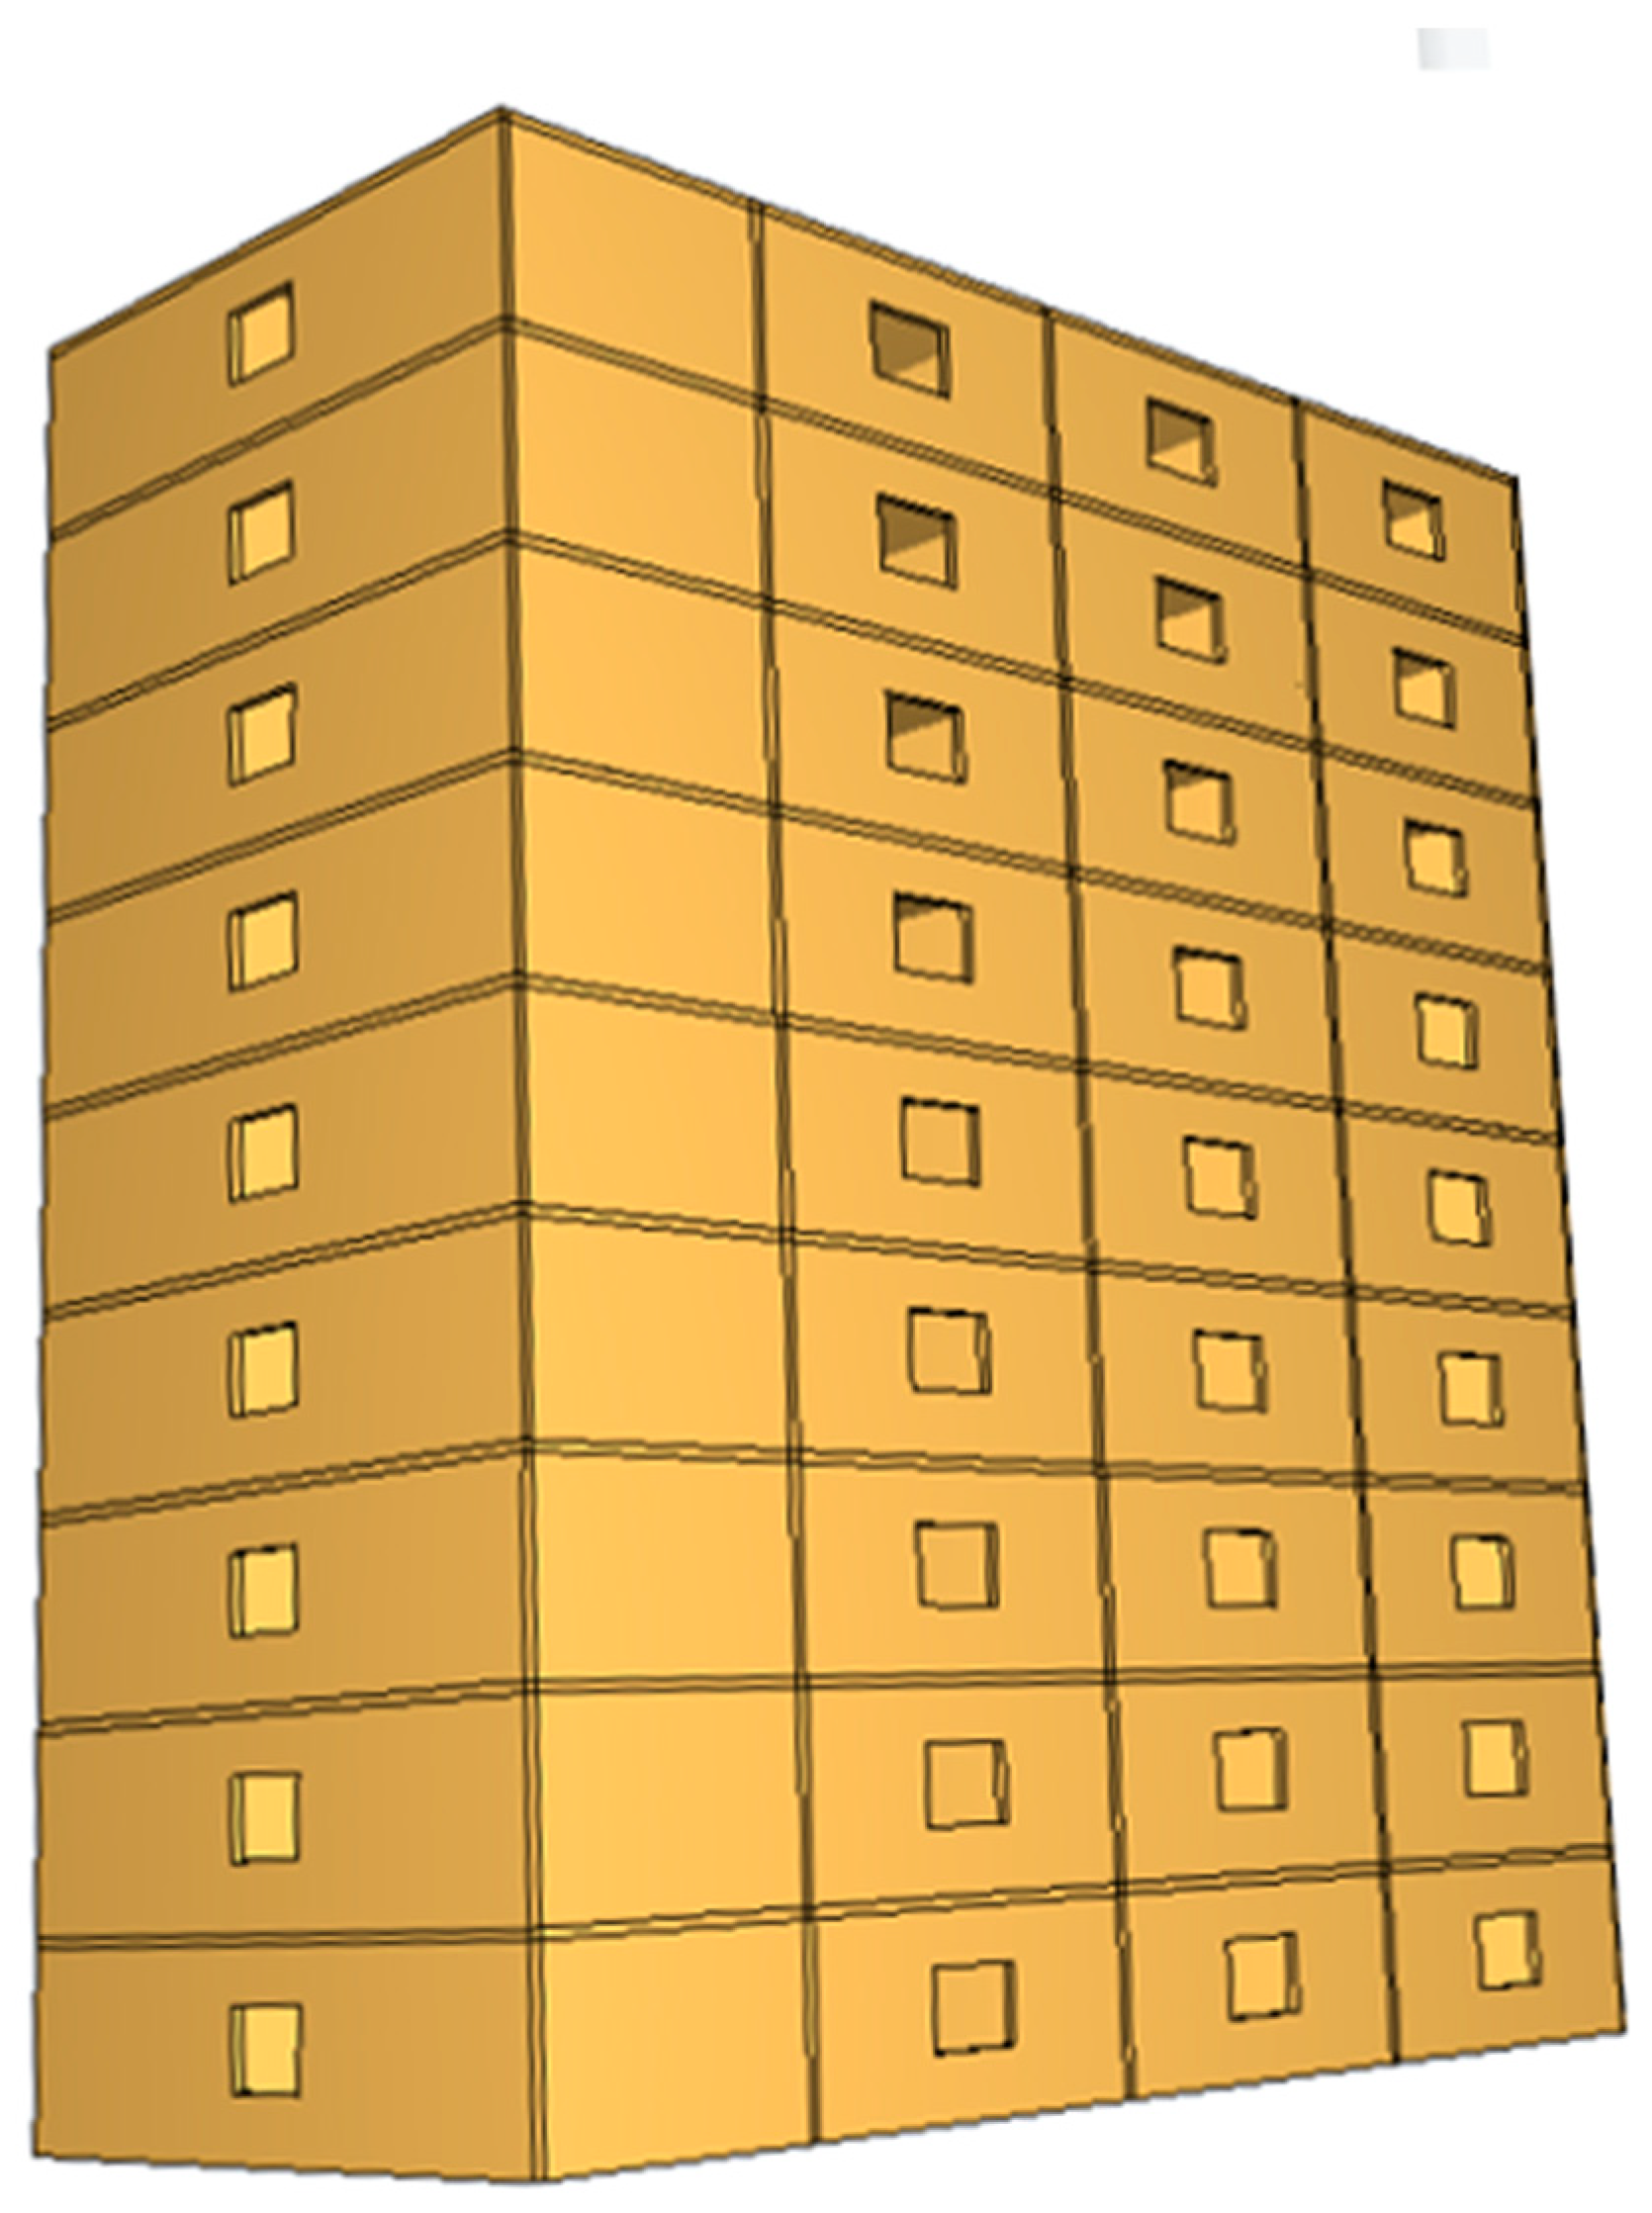
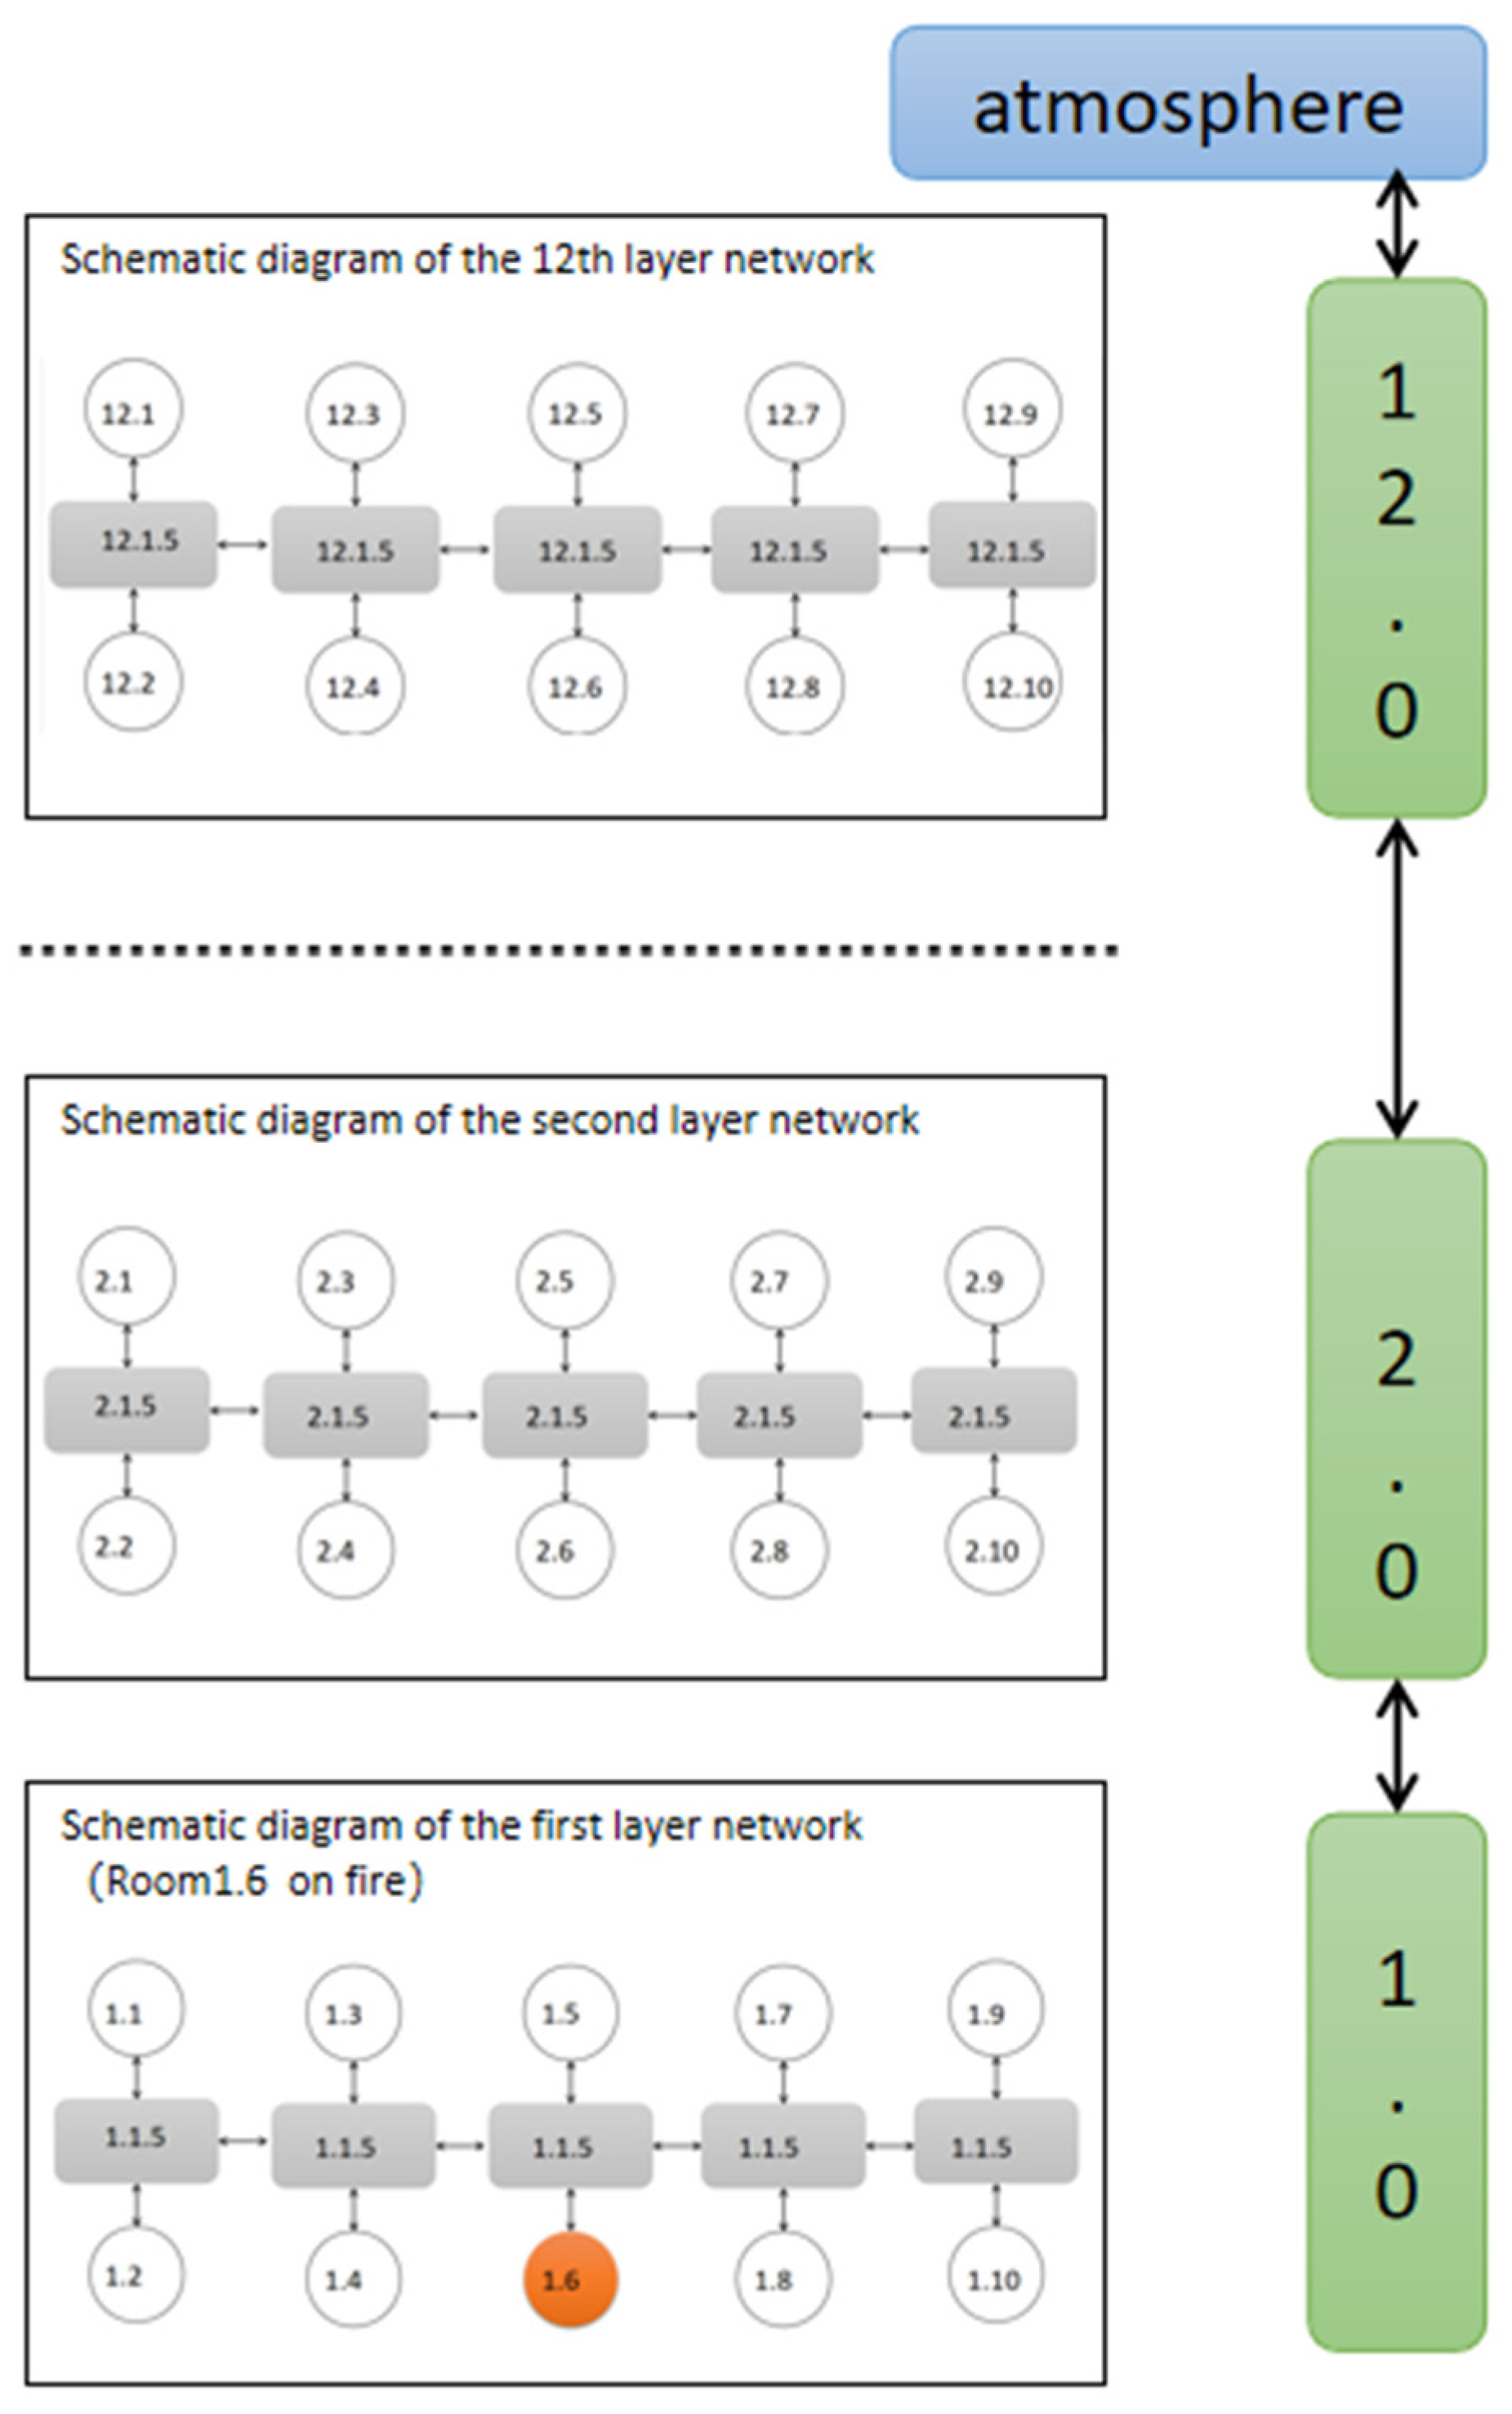
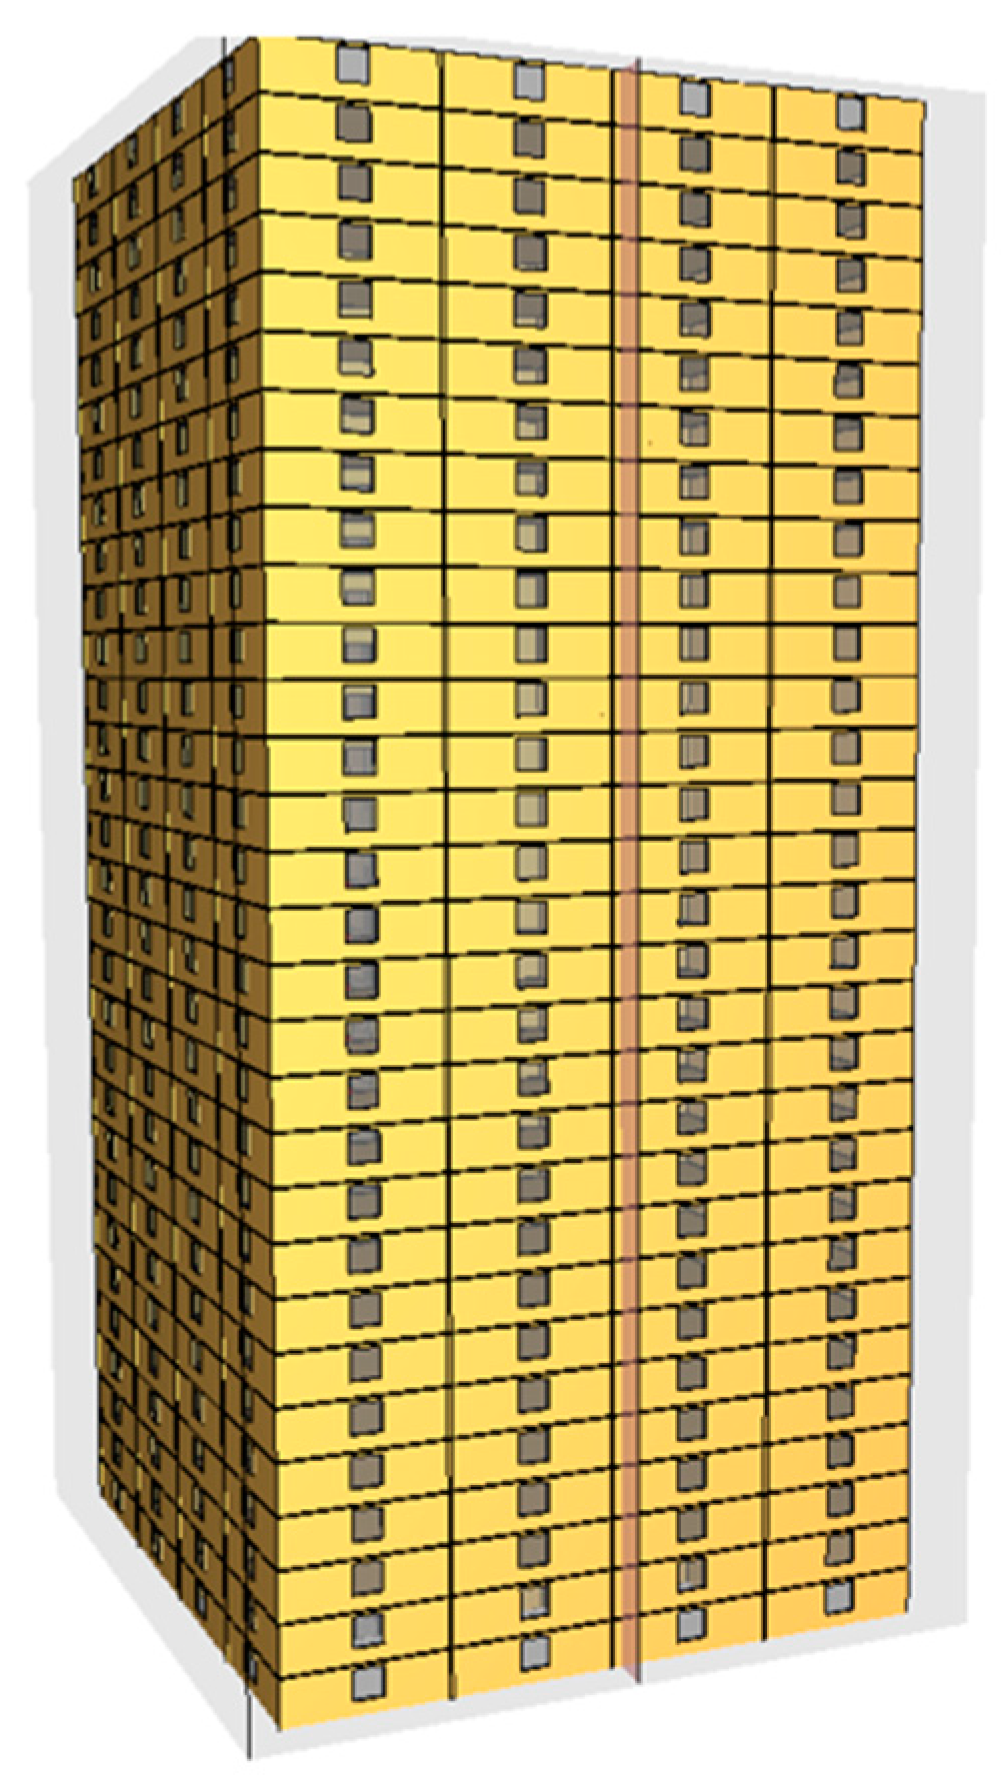
Channels can be represented as either a single node or a combination of multiple nodes. However, to simplify the process, save computation and modeling time, and homogeneously share the attributes of each node, previous research has generally represented horizontally connected passages such as corridors and vertically connected passages such as elevators and stairs as a single node, as shown in
Figure 8. Nonetheless, the attributes of horizontally and vertically connected passages are not homogeneous during the development of a fire. As the distribution of physical parameters, such as density and temperature of smoke, in the passages may be inconsistent [
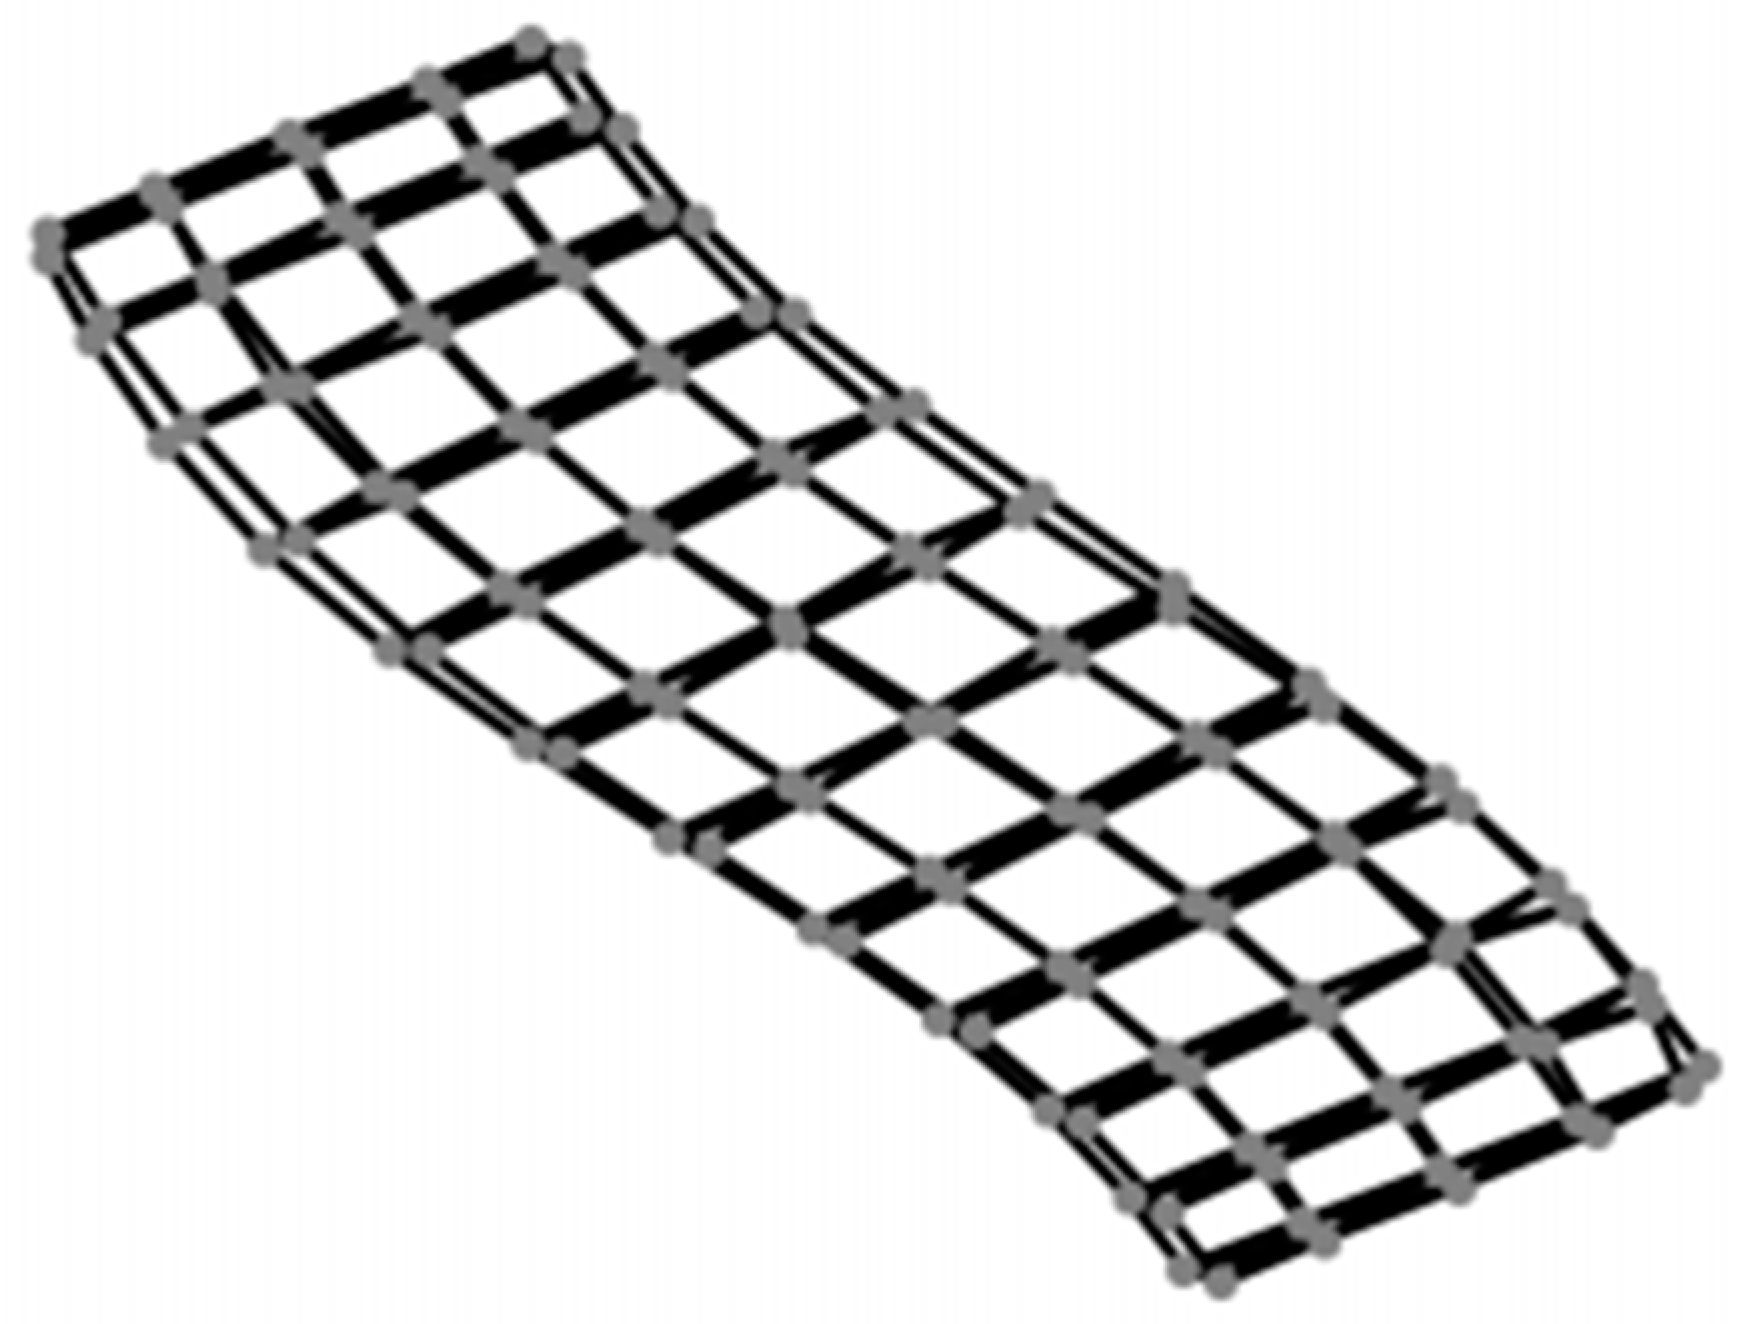
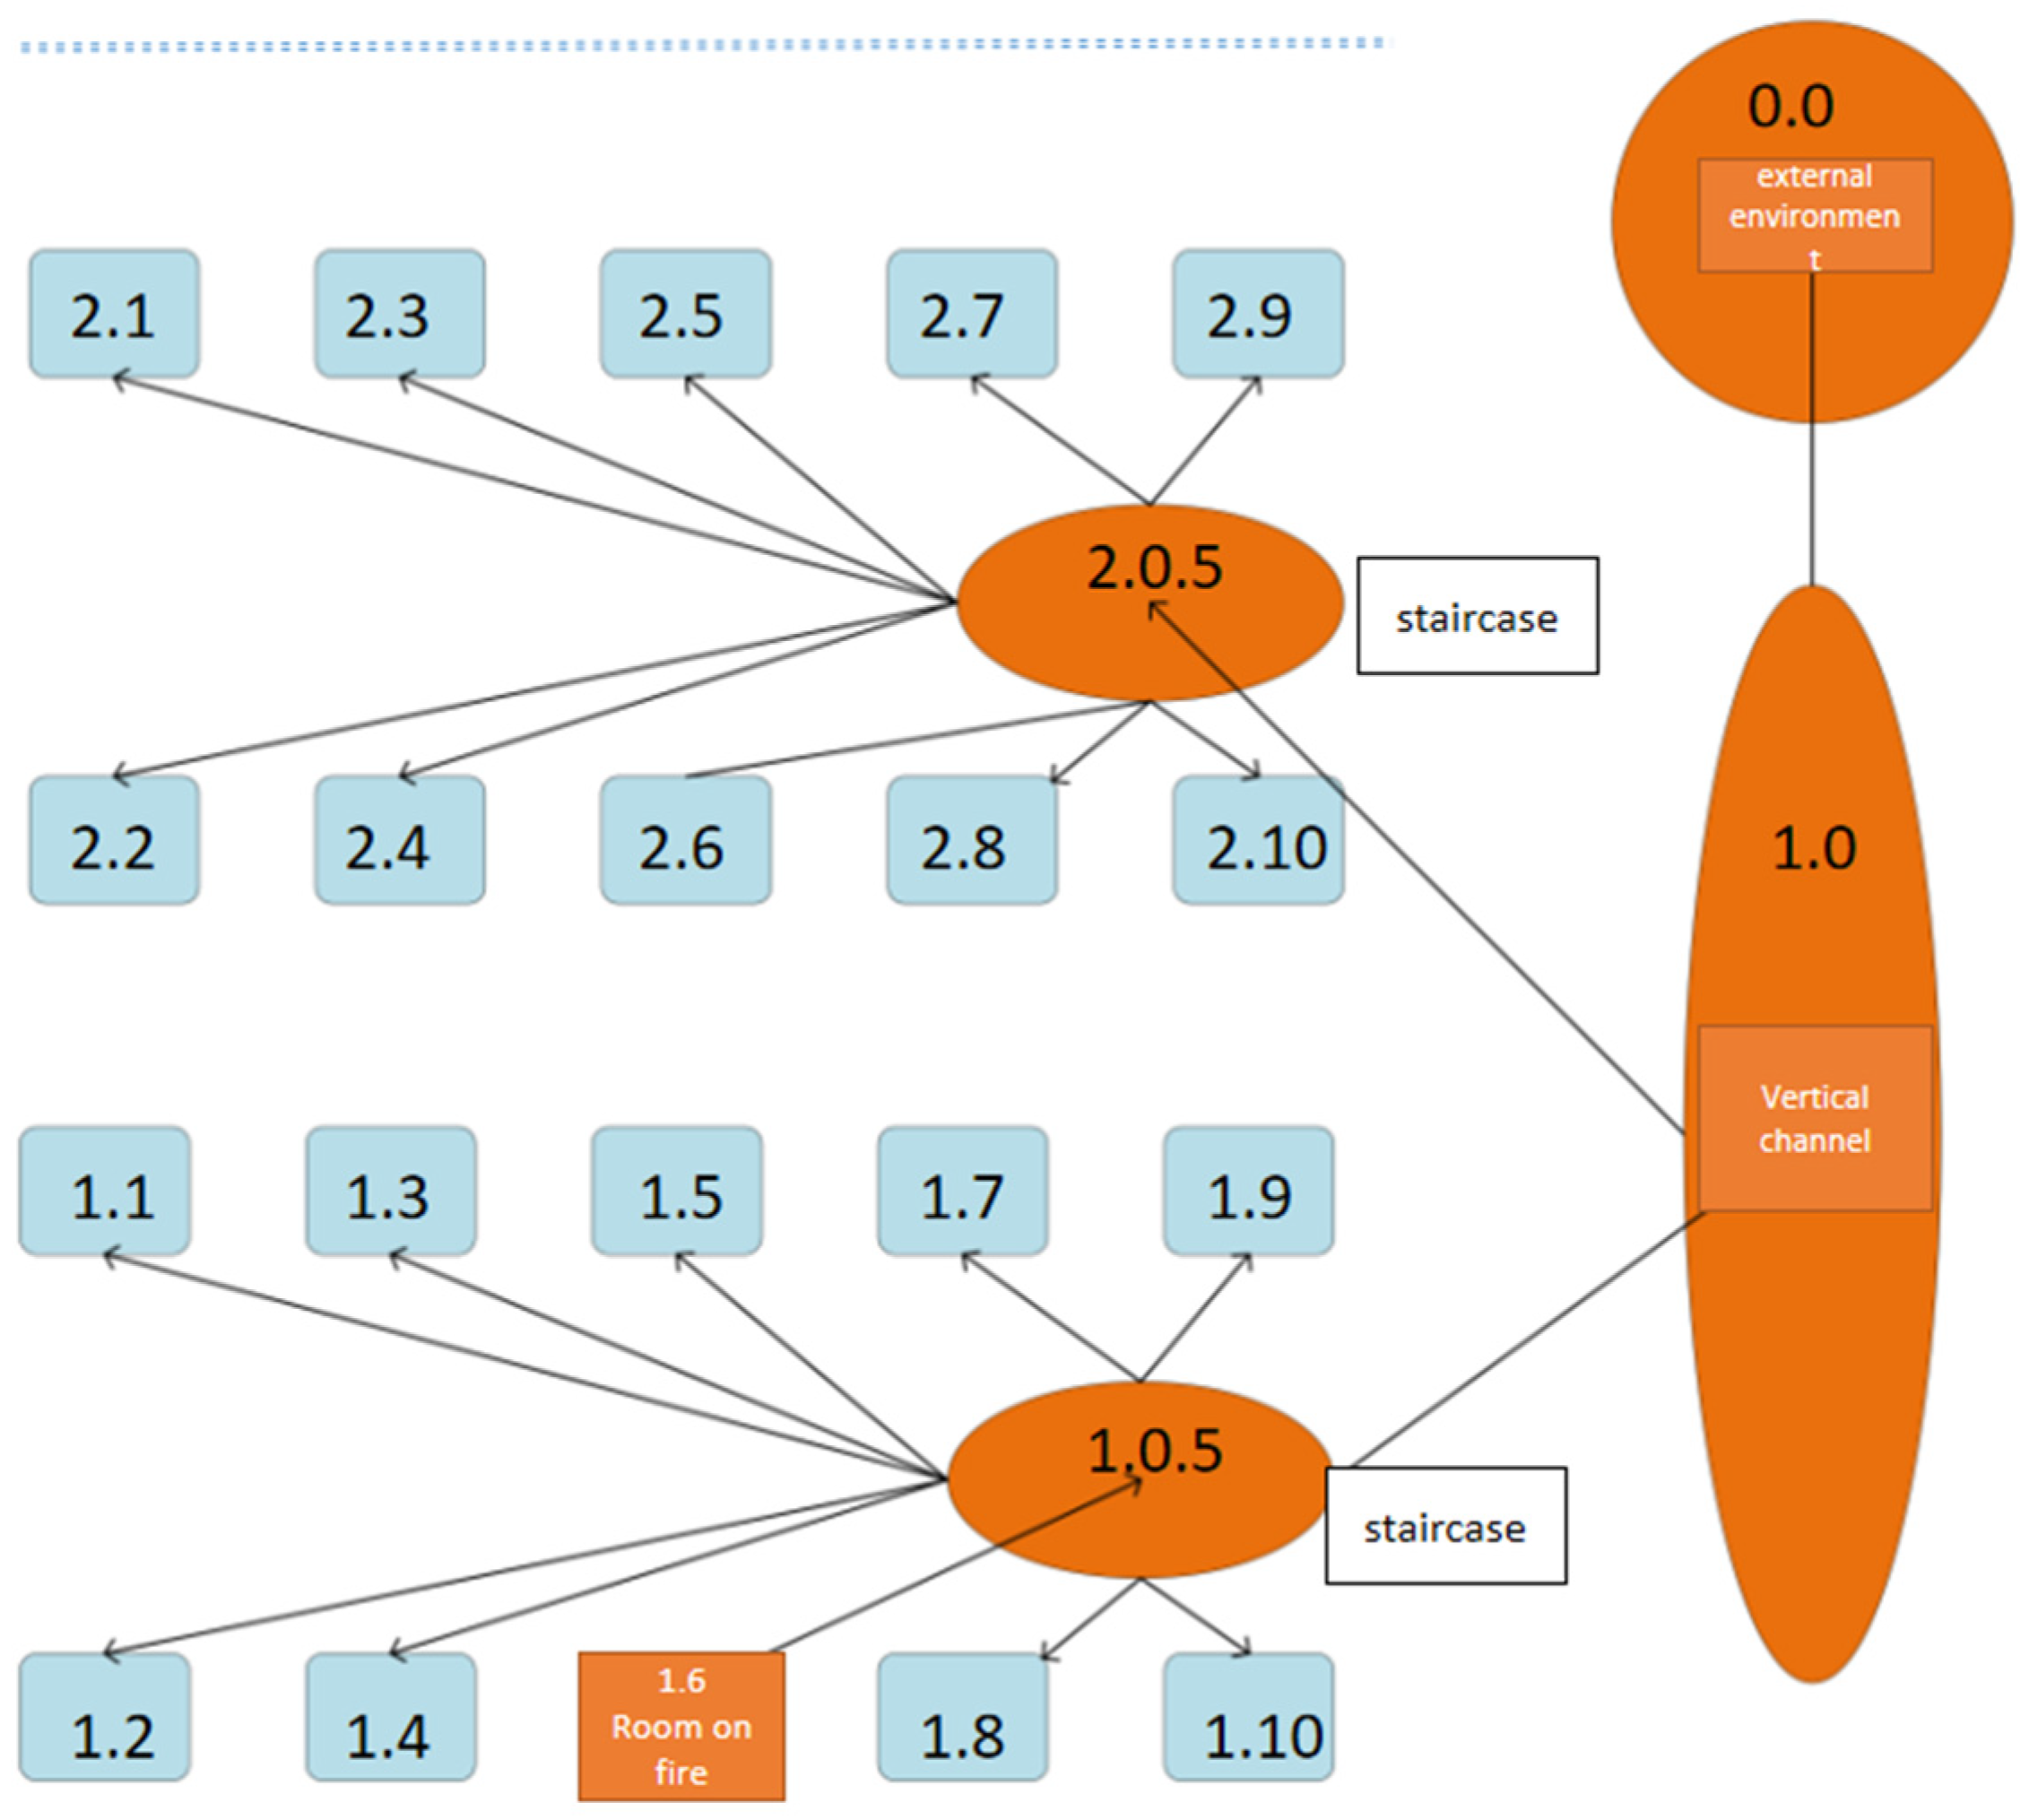
22], further verification is necessary to describe this non-homogeneous physical state process using a single node. Non-homogeneous physical state processes can cause confusion and inaccurate results in graph-based simulations. Therefore, this study carefully represents horizontally and vertically connected passages into single and multiple nodes for comparison. In the case of multiple nodes, passages are divided into several small nodes based on the geometric dimensions of the rooms and floors, with the number of nodes depending on the passage length. These nodes generally have different physical state attribute values in actual physical processes, as shown in
Figure 9. White nodes represent rooms, gray nodes represent corridors, red nodes represent the room on fire, green nodes represent staircases, and blue nodes represent the atmosphere. For ease of display, only the first five layers are shown.
To analyze the difference between single node and multi-node methods, compare the data in
Table 2 and
Table 3. In
Table 2 and subsequent tables, the darker the color, the earlier the smoke arrives. According to the simulation results in
Table 2, when treating the long passage as a single node, the smoke arrival time at different nodes is almost the same except for the first floor, which is significantly different from the conventional understanding. This indicates that using the single node method in non-homogeneous physical state processes will lead to inaccurate simulation results. Conversely,
Table 3 uses the multi-node method to simulate the long passage, and the results show that the smoke arrival time at different nodes is closer to the actual situation. Therefore, in subsequent research, the long passage will be treated as multiple nodes for study.
3.2. Simulation Results
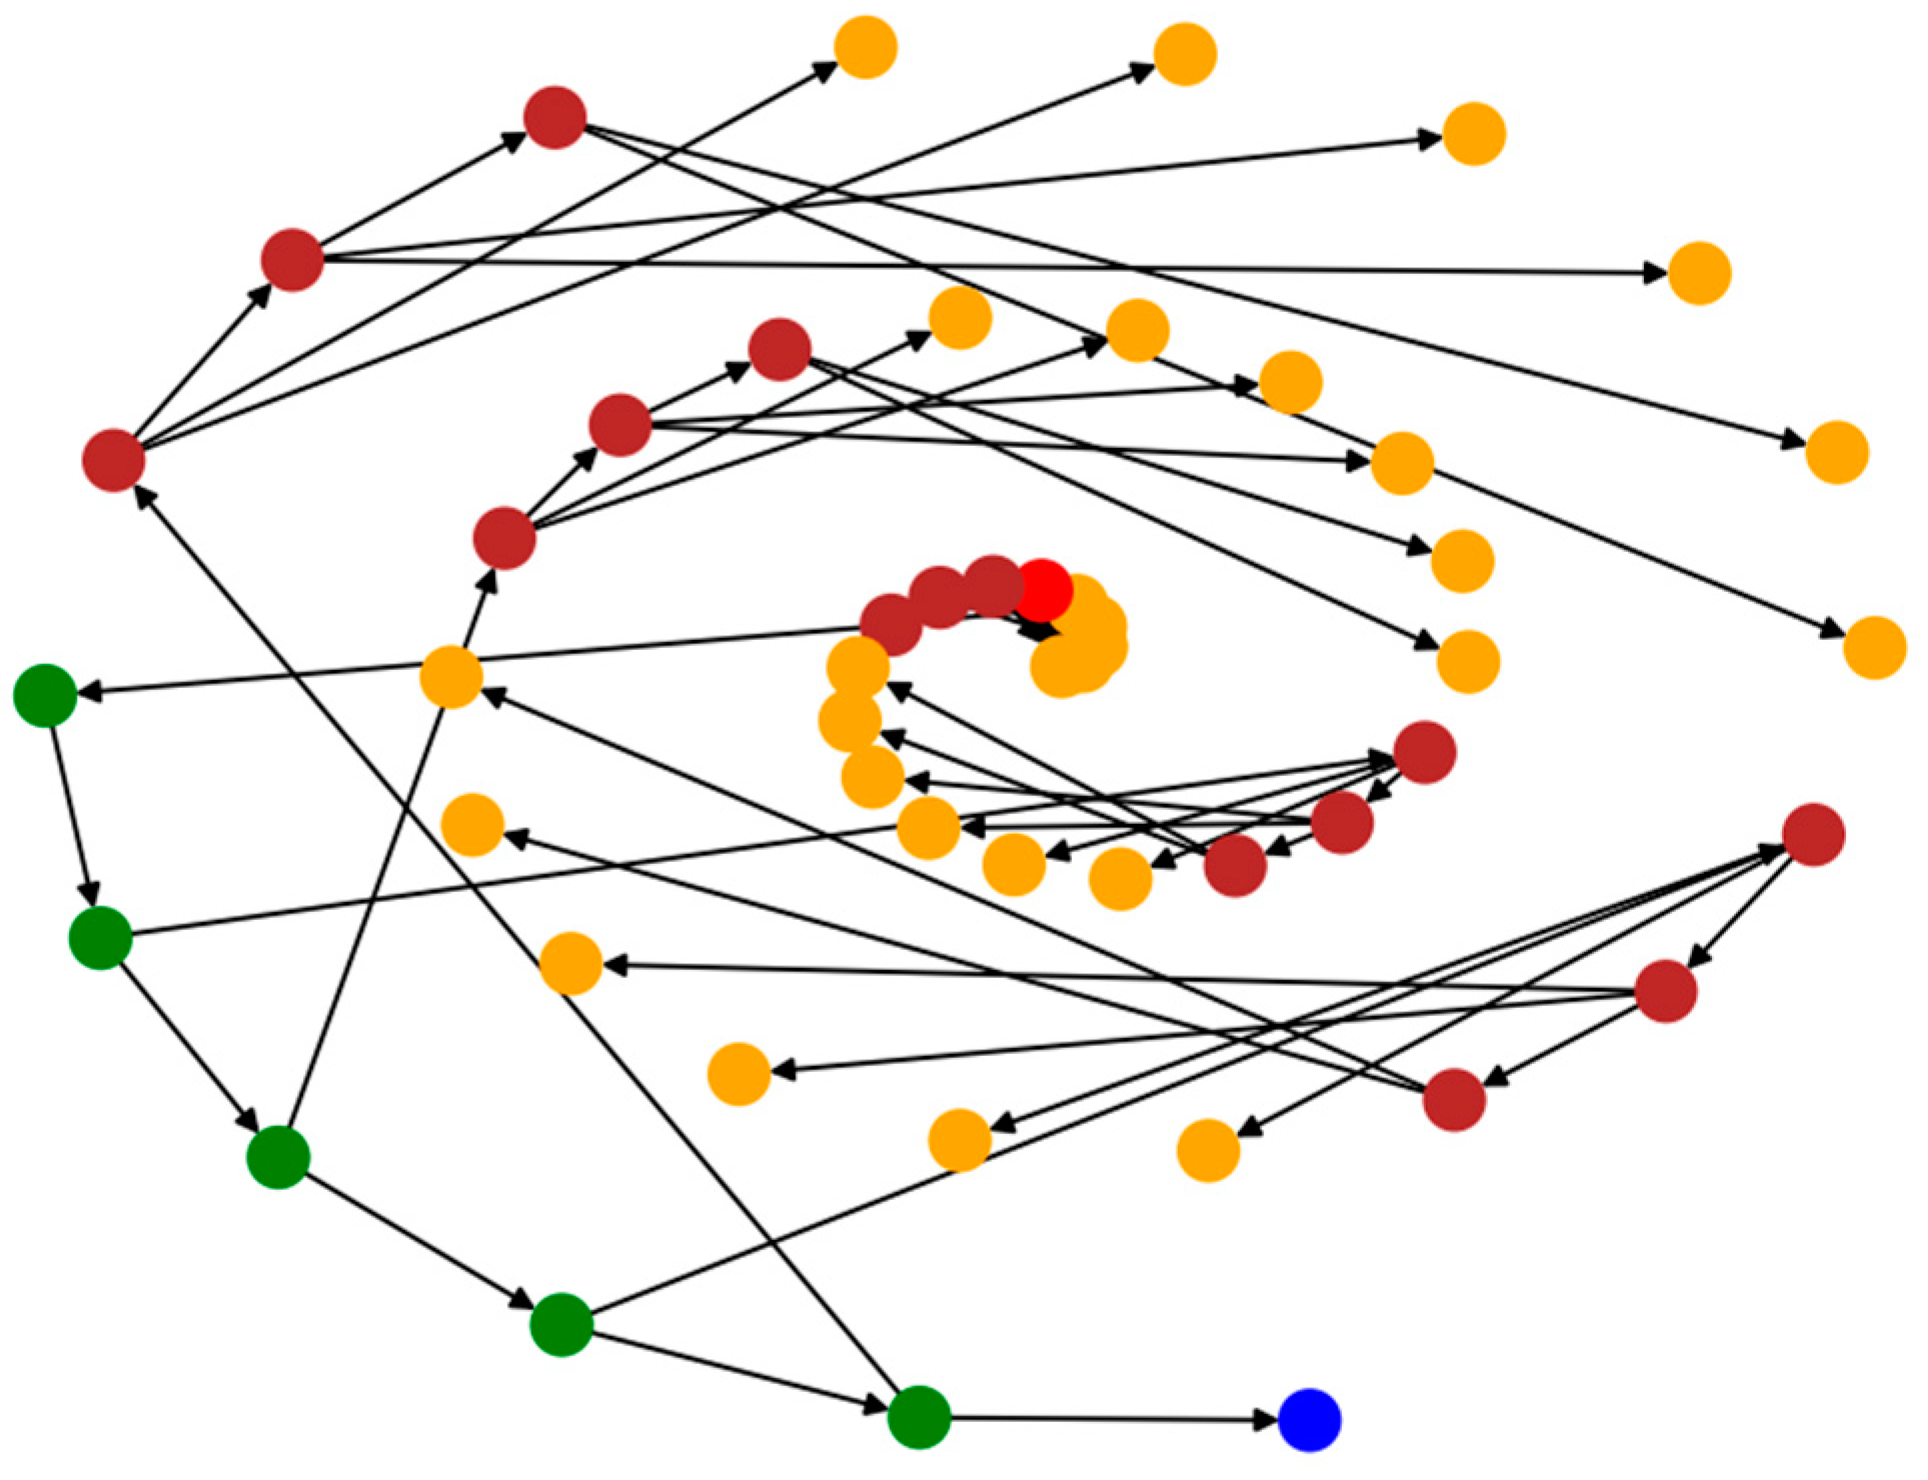
To visualize the results of the DAG model, we utilized the Networkx and Matplotlib packages to implement the overall framework and corresponding logic of the code, as demonstrated in the example visualization shown in
Figure 10 [
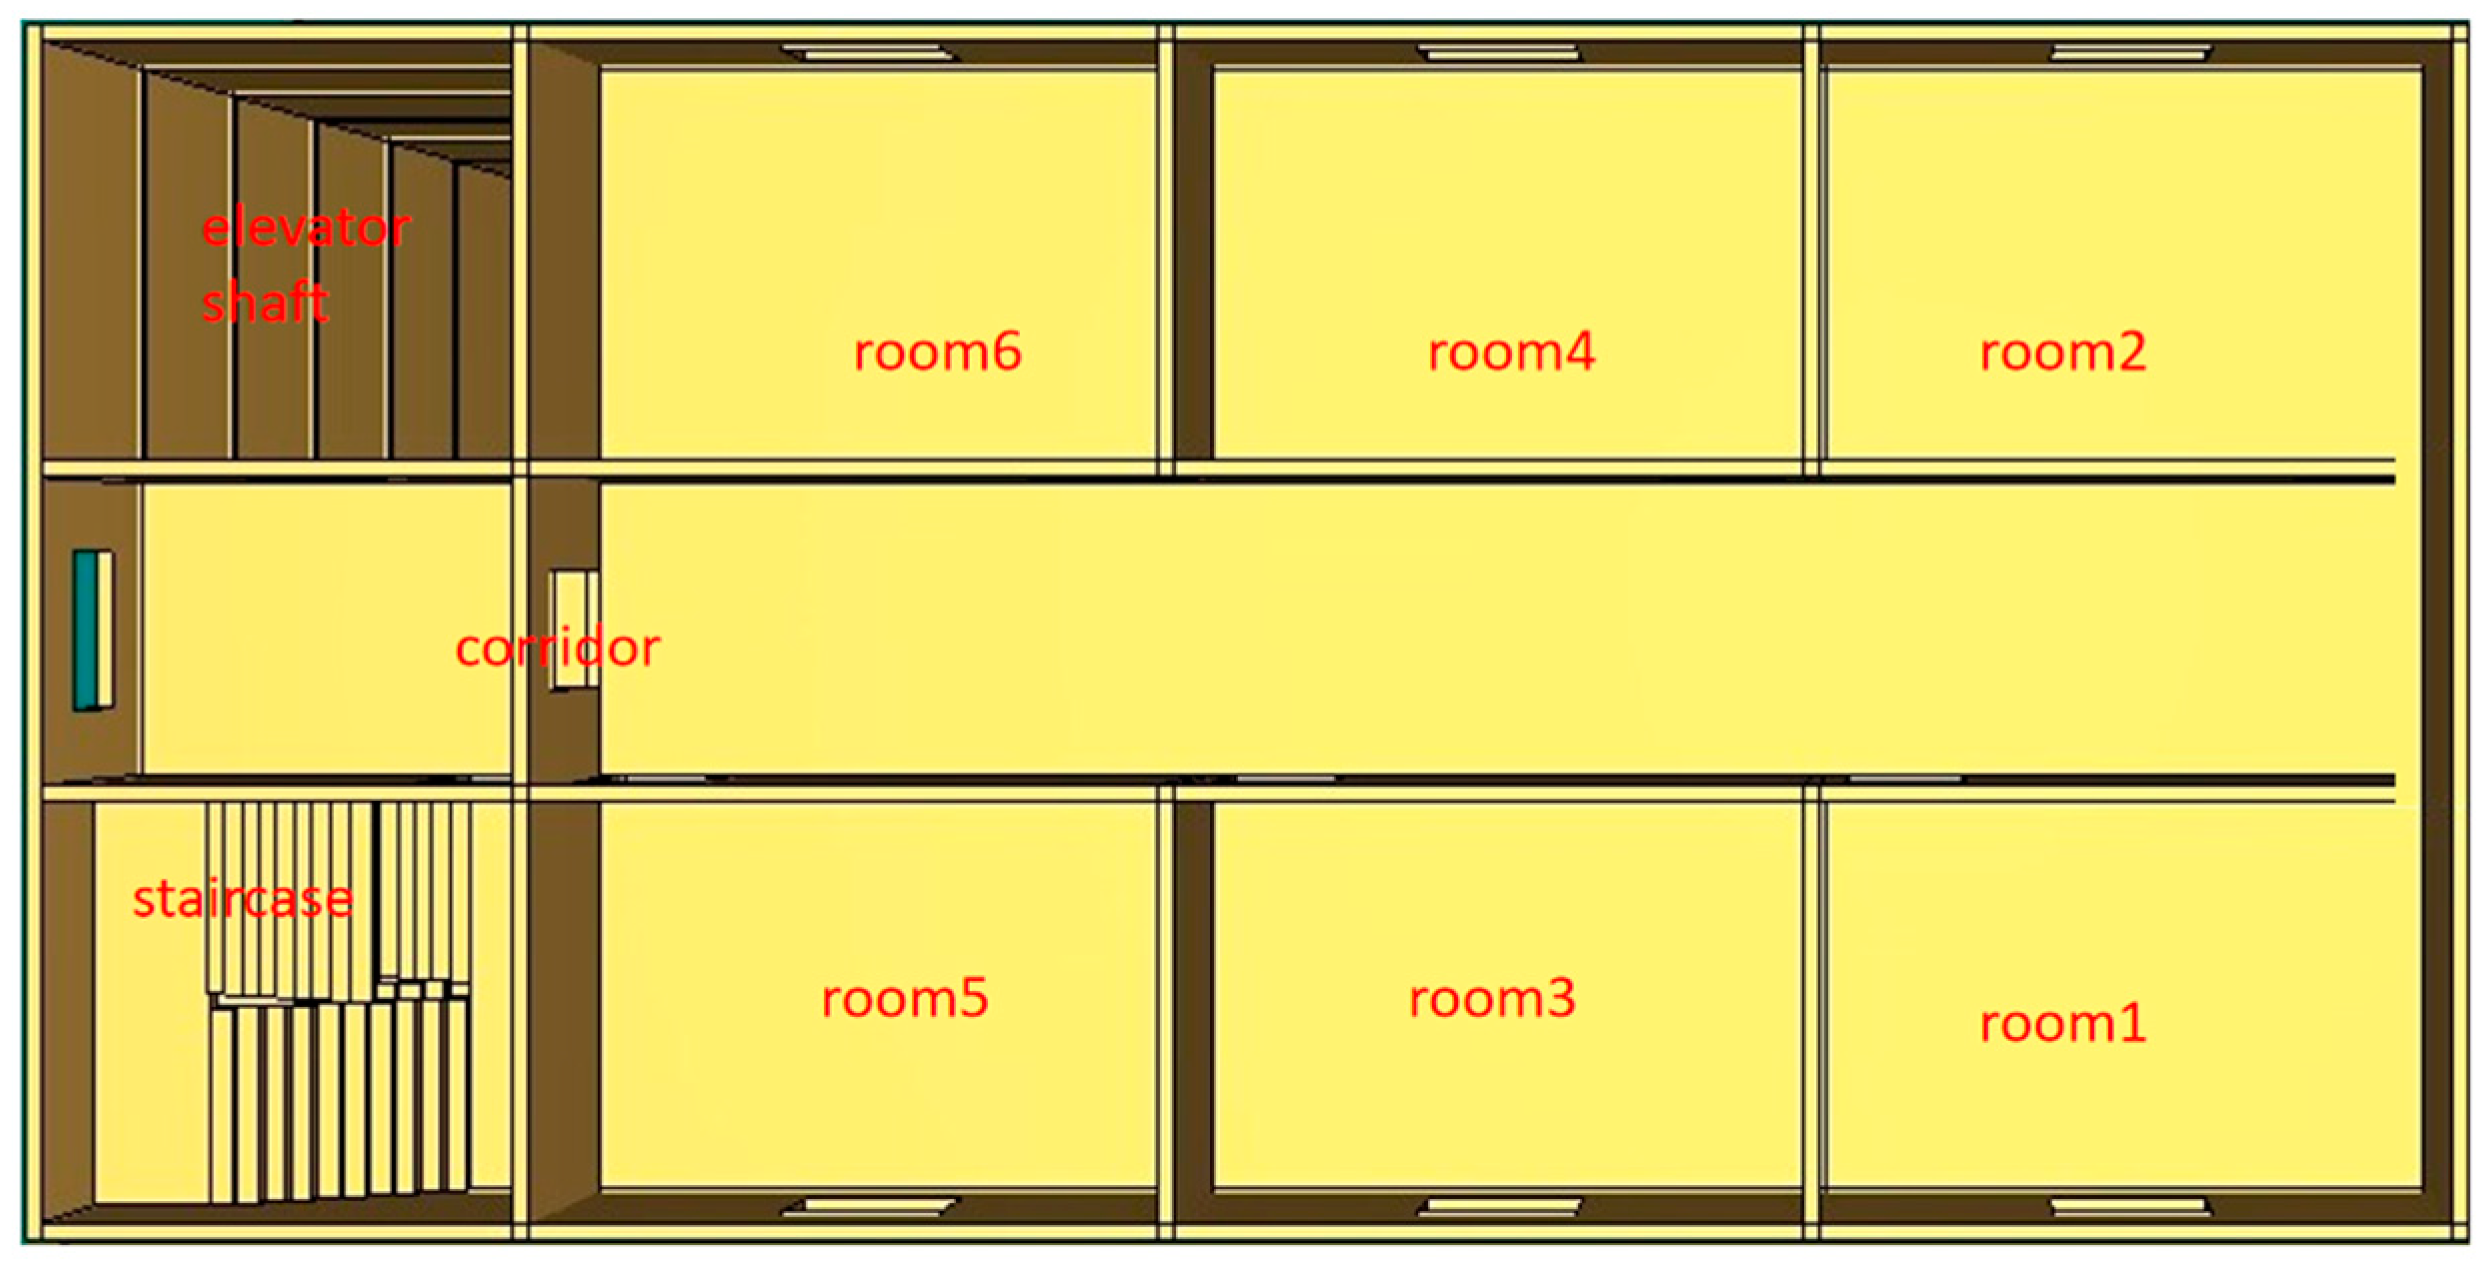
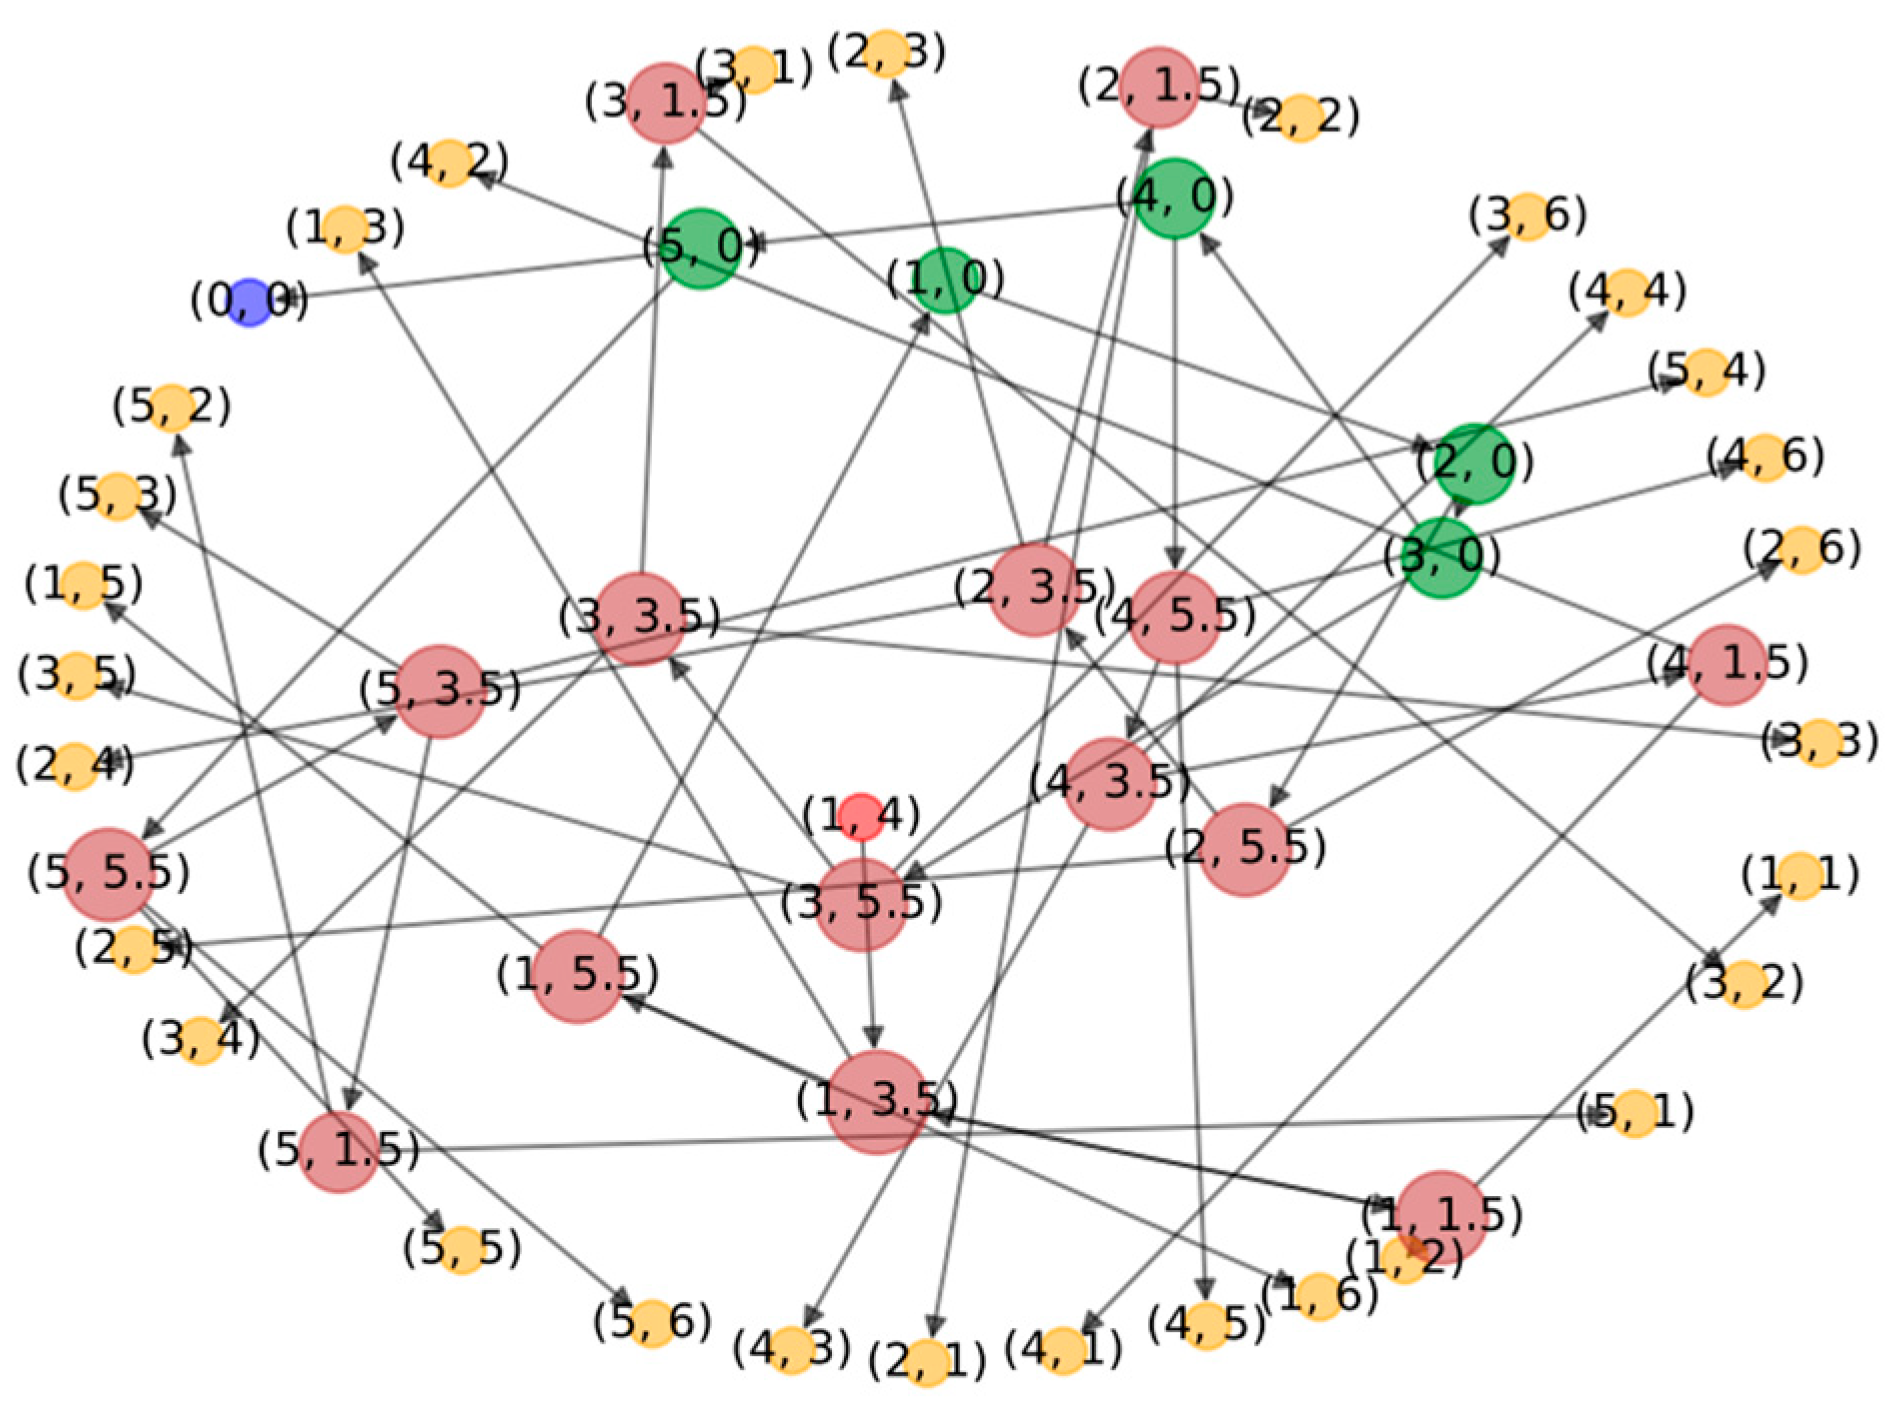
23]. In the figure, red nodes represent ignition nodes, dark red nodes represent horizontal passage nodes, mainly used for corridors, blue nodes represent atmospheric environment nodes, green nodes represent vertical passage nodes, and yellow nodes represent conventional room nodes. In actual high-rise buildings, there may be an extensive network of nodes, which can make the visualization results challenging to distinguish. Therefore, only the first five layers are displayed for ease of presentation. To simulate the fire scenario, we selected Room (1, 4) as the ignition room, with only six room nodes per floor. The simulation results are presented in
Figure 11.
After conducting the simulation, the flue gas content data for each node was analyzed. The fire smoke conditions of case 1, case 2, and case 3 are presented in
Table 4,
Table 5 and
Table 6, respectively. Since the smoke content at each node did not reach its maximum value during the simulation process, the smoke entry speed into each node was roughly the same. The size of the smoke content at each node in
Table 4,
Table 5 and
Table 6 reflects the degree of susceptibility to smoke propagation between nodes. Therefore, the smoke content can be regarded as an indicator of smoke flow rate, where higher smoke content indicates faster smoke flow rate at that node, indicating that smoke is more likely to reach that node first.
The smoke content on the first floor can be ranked in descending order from the data of the three tables as follows: room (1, 4), room (1, 3.5), room (1, 3), room (1, 1.5), room (1, 5.5), room (1, 1), room (1, 2), room (1, 5), room (1, 6), and (1, 0). The room on fire has the highest smoke content, followed by the adjacent corridor, then adjacent rooms and corridors, other rooms, and finally the stairwell. However, the second floor has a different pattern, where the smoke content decreases in order from (2, 0) to (2, 1), with the stairwell having the highest smoke content, followed by the rooms near the stairwell, the rooms in the middle of the corridor and near the stairwell, the rooms far from the stairwell in the middle of the corridor, and finally the rooms far from the stairwell. The smoke distribution on other floors is similar, with the smoke content arranged in order from high to low for the stairwell, rooms near the stairwell, rooms in the middle of the corridor and near the stairwell, rooms far from the stairwell in the middle of the corridor, and finally the rooms far from the stairwell.
The conditions on the fourth and fifth floors were similar in all three cases. In Case 2, a coefficient of 0.5 was set for smoke to travel from (3.0) to (3.3.5), while in Case 1, smoke could directly enter the third-floor corridor from the stairwell, reaching the third-floor rooms the fastest. However, smoke was obstructed when it reached the third-floor corridor from the stairwell in Case 2, and its entry into the third-floor rooms was significantly slower. Furthermore, the smoke reached the fourth and fifth floors faster in Case 2 than in Case 1, while it reached the fourth and fifth floors even faster in Case 3 than in Case 2 because, in Case 3, the coefficient for smoke to travel from the stairwell to the third-floor corridor was set to 0.
This study found that the smoke content at different nodes can help determine the path of smoke propagation. On the fire floor, smoke enters the corridor from the ignition room and then spreads to other rooms and vertical passages from the corridor, mainly discharging outdoors or spreading to other floors via vertical passages. On non-fire floors, smoke enters the corridor from the vertical passage and then enters different rooms based on their distance from the vertical passage. Based on the degree of fire spreading, it is possible to analyze the areas most susceptible to fire propagation in high-rise buildings, which are the nodes that should be given priority consideration in pre-response control strategies.
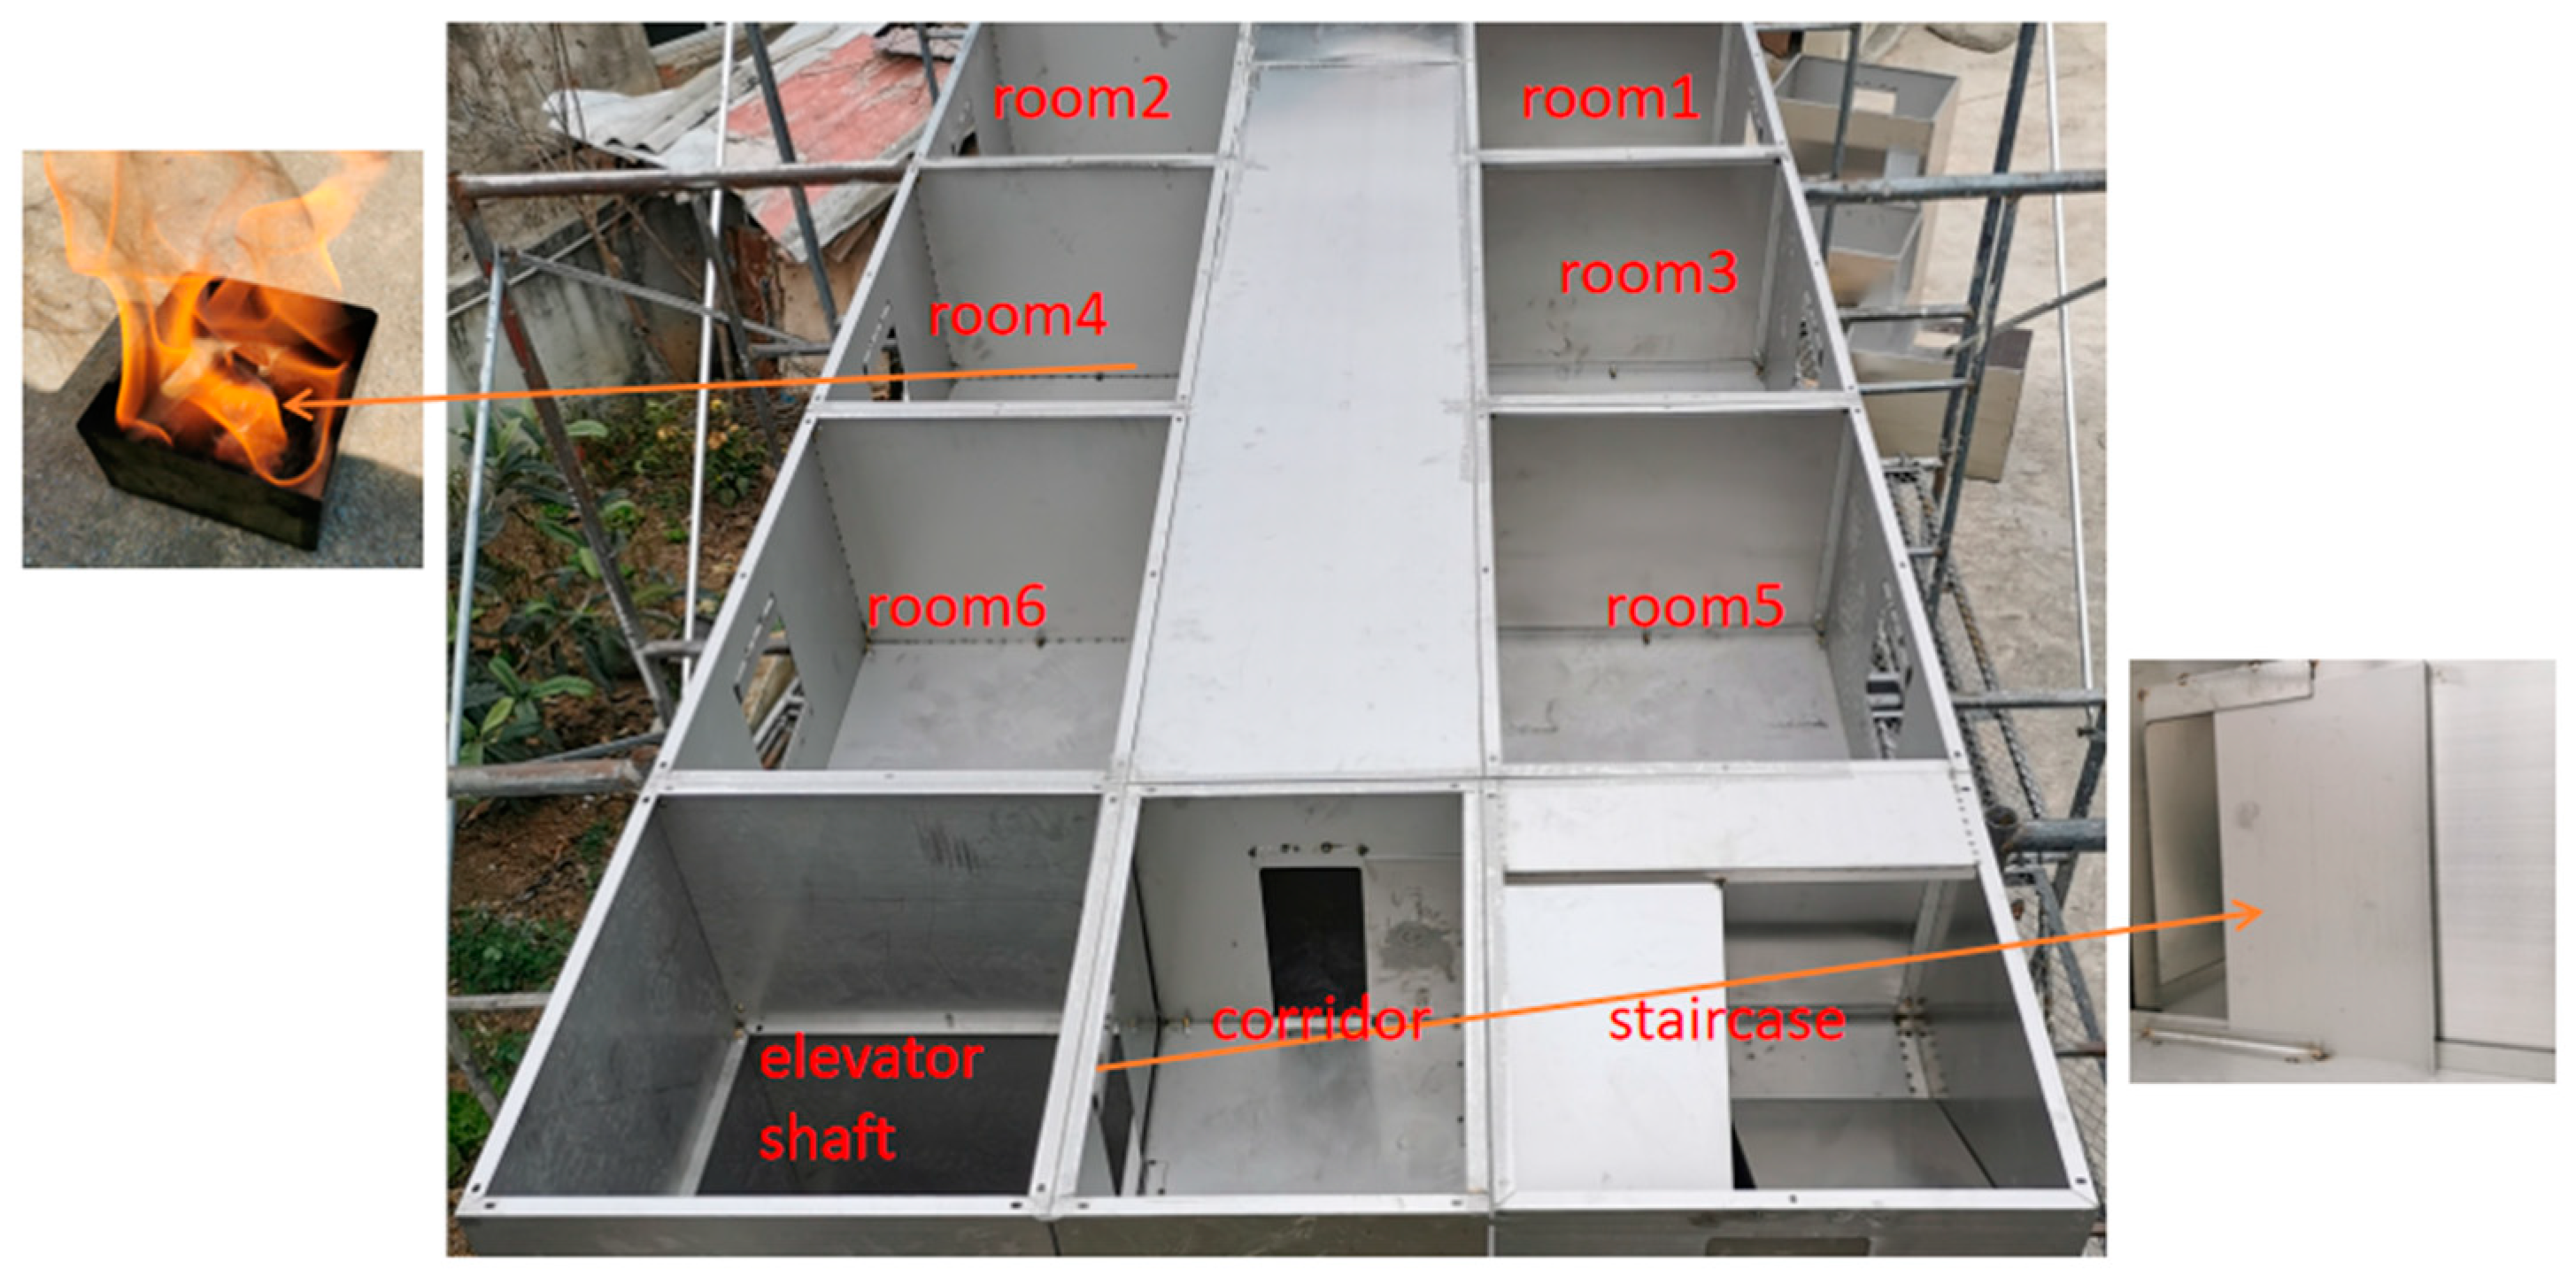
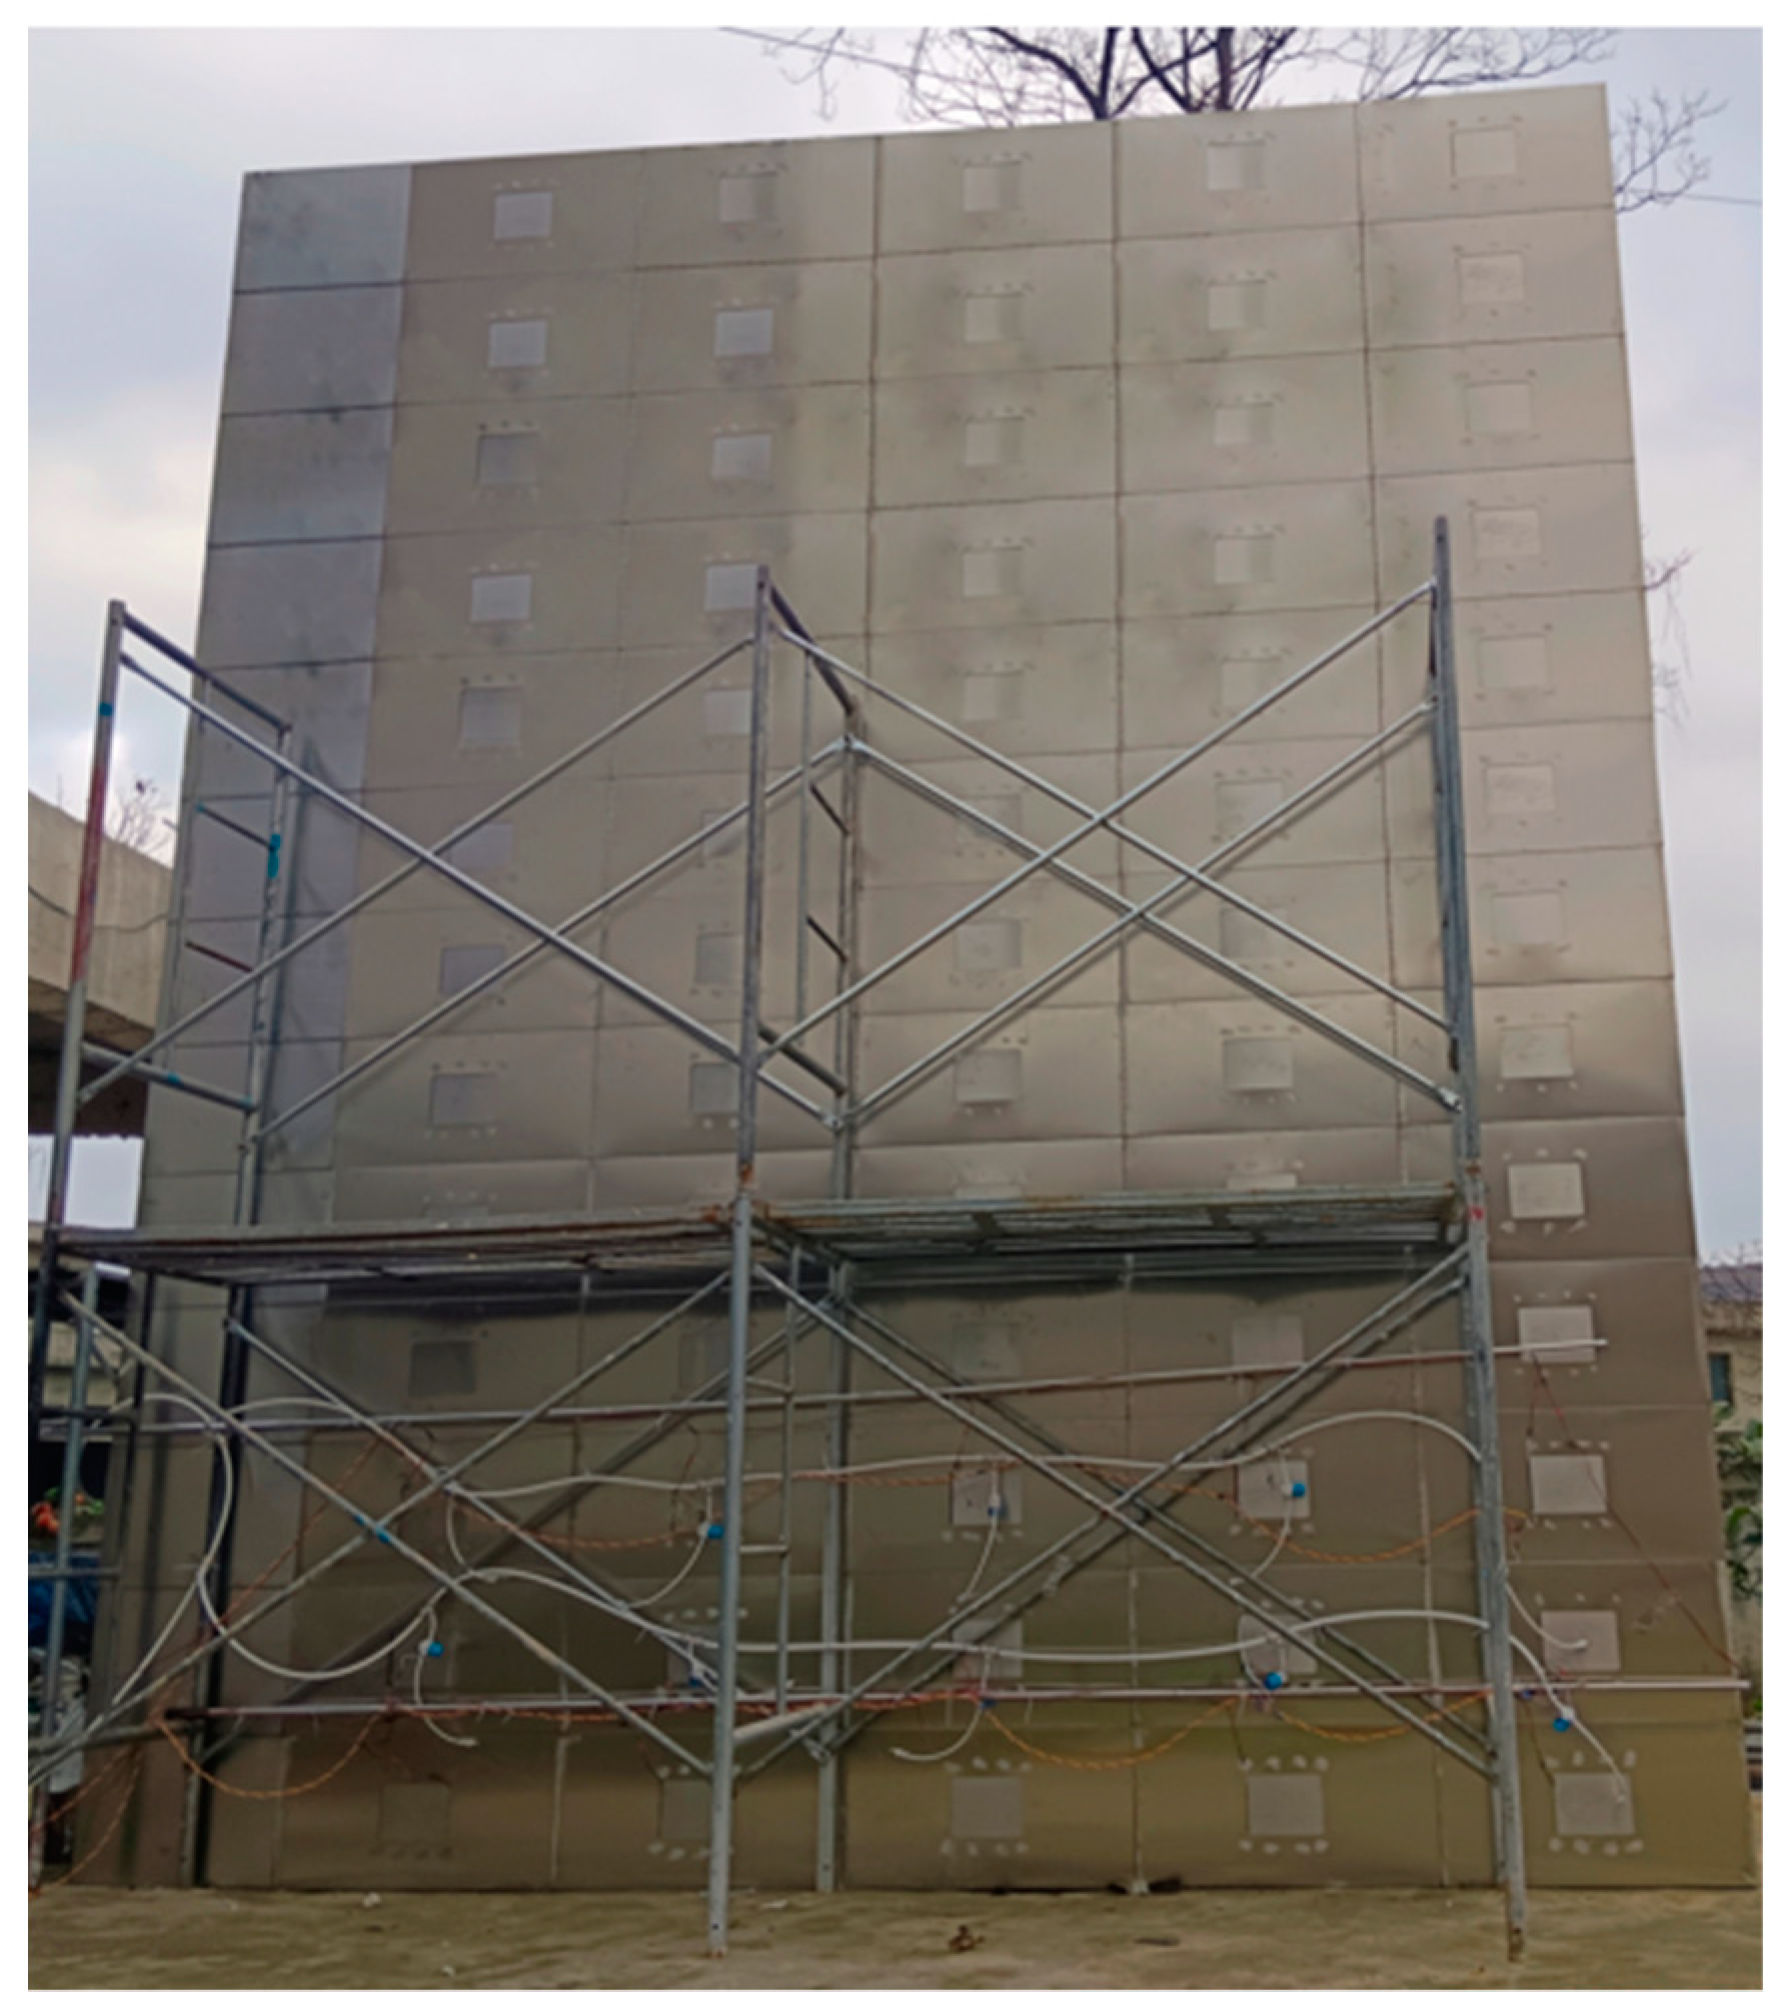
3.3. Result Validation
In this study, we validated the simulation results of the graph theory method using a small-scale simulating platform. Through this experiment, we obtained data on the arrival time of smoke at each node. The results for all three cases are presented in
Table 7,
Table 8 and
Table 9.
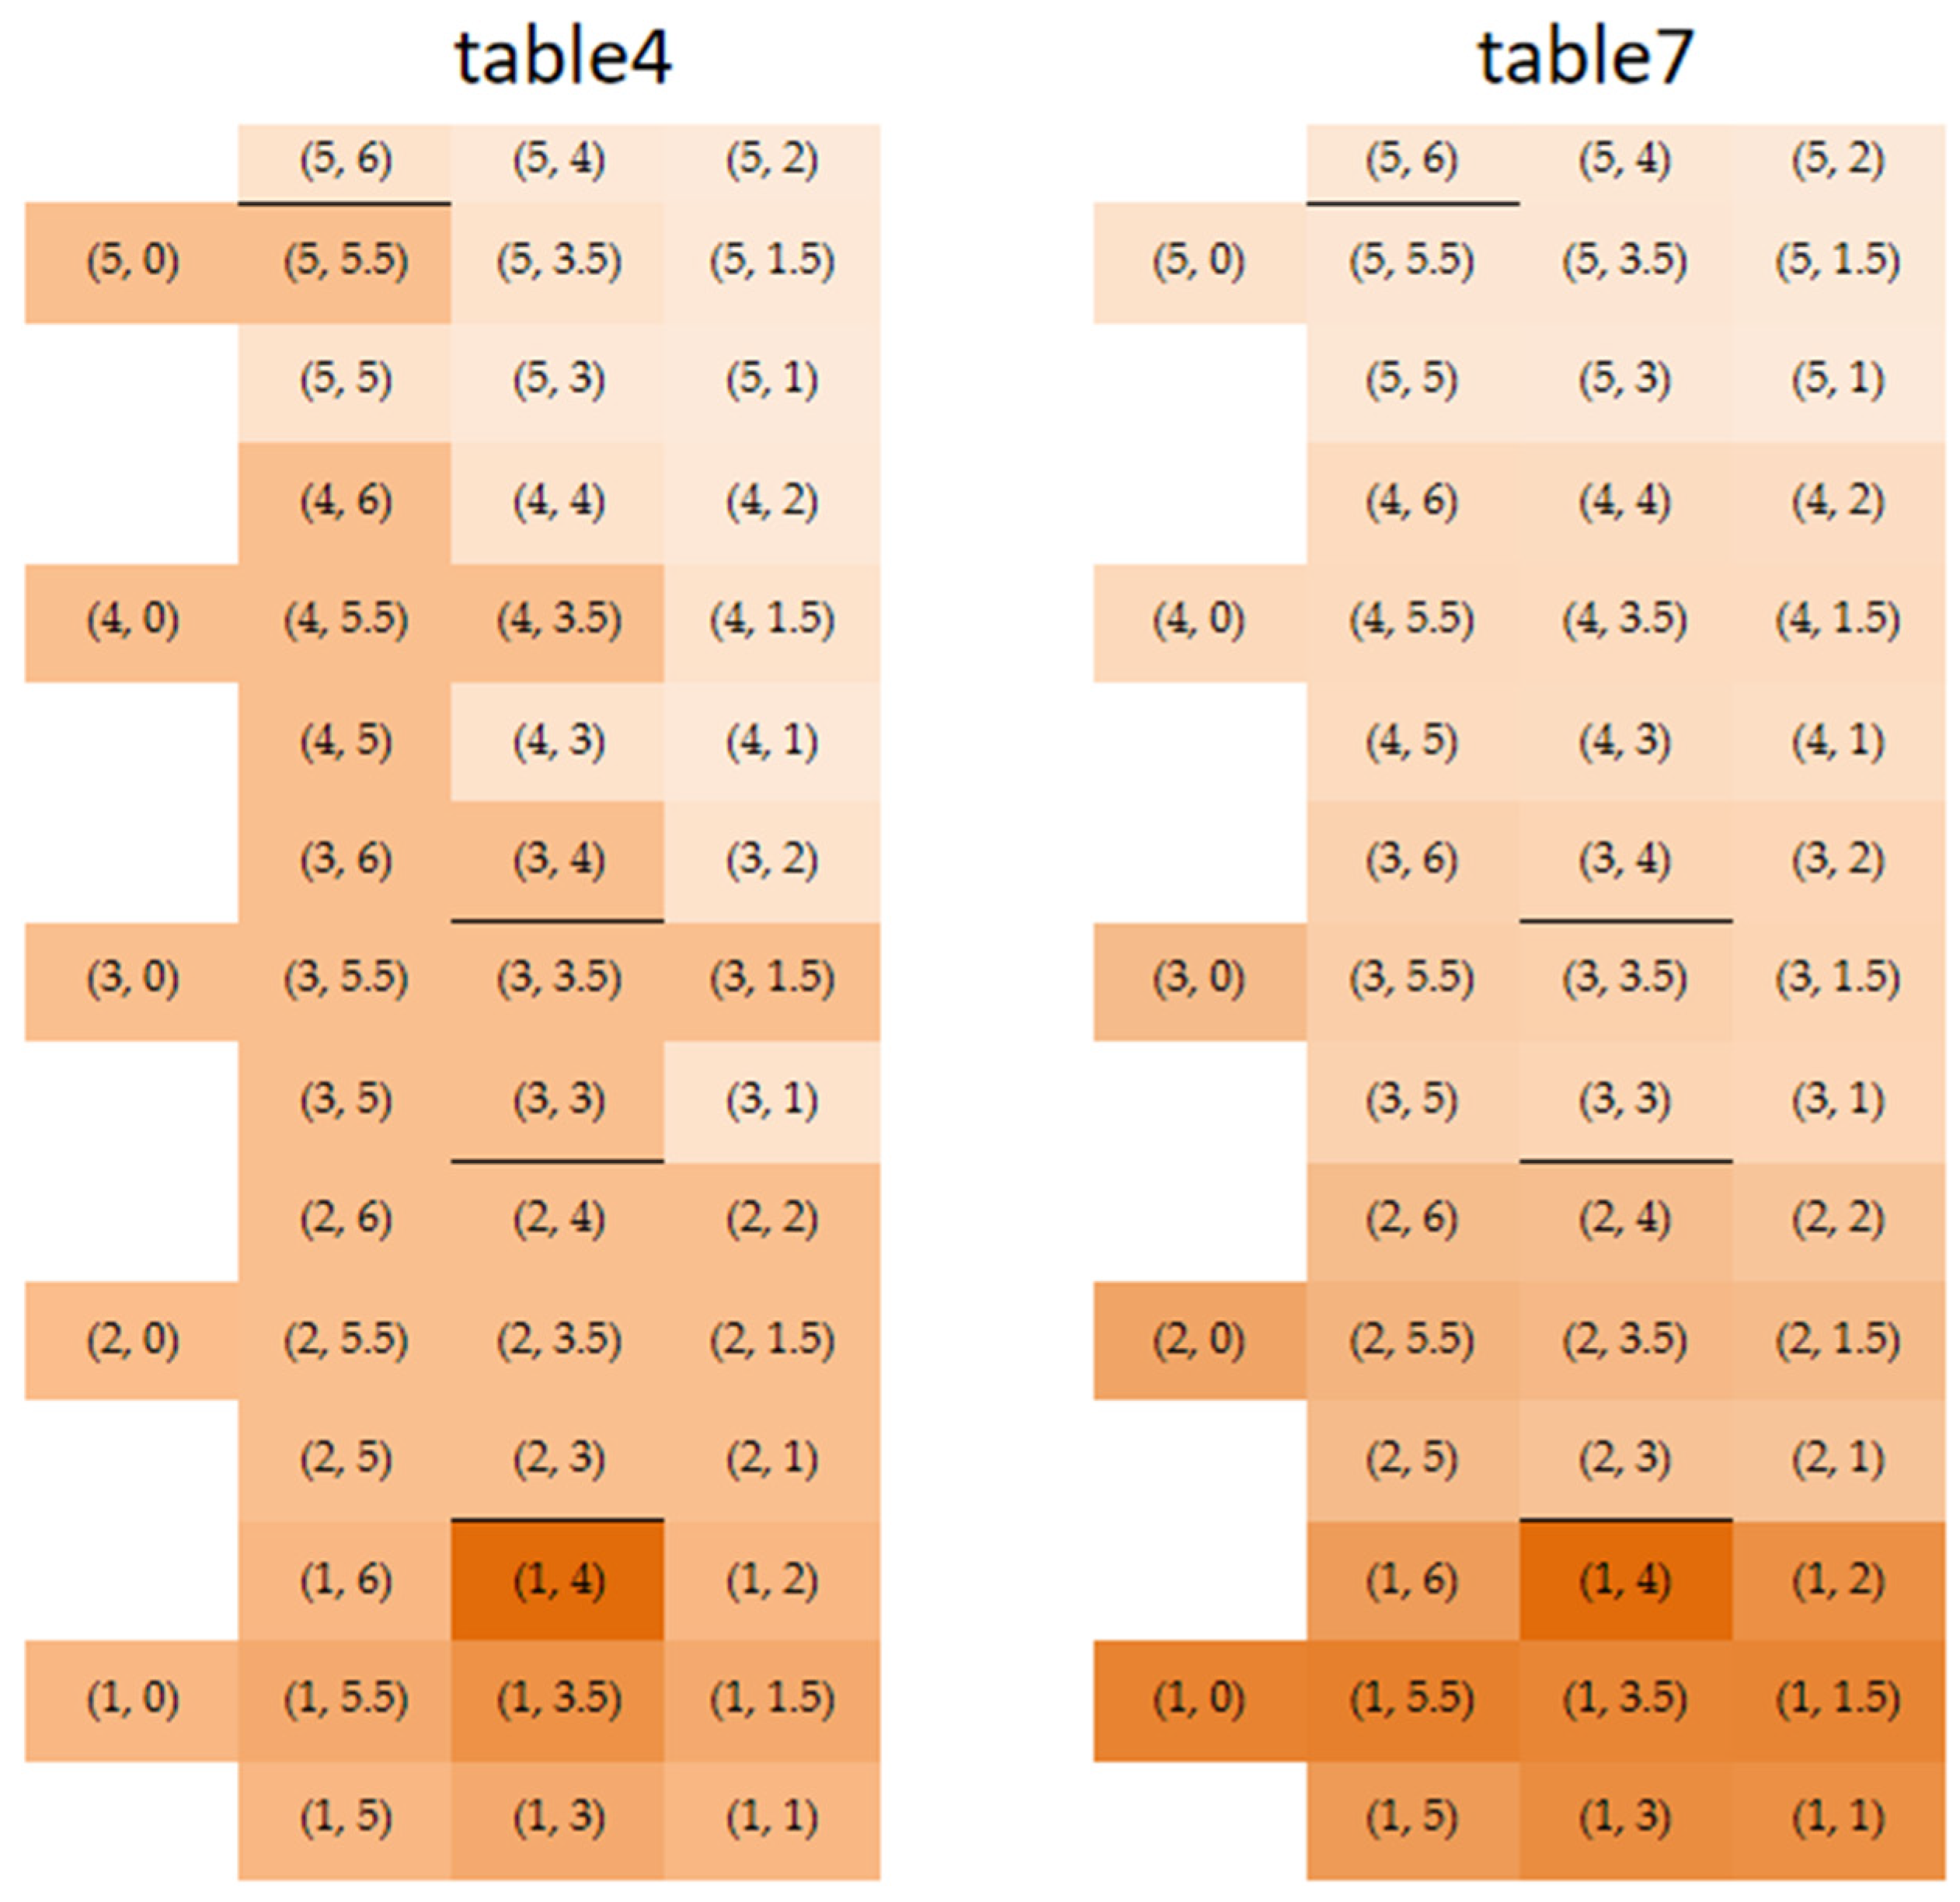
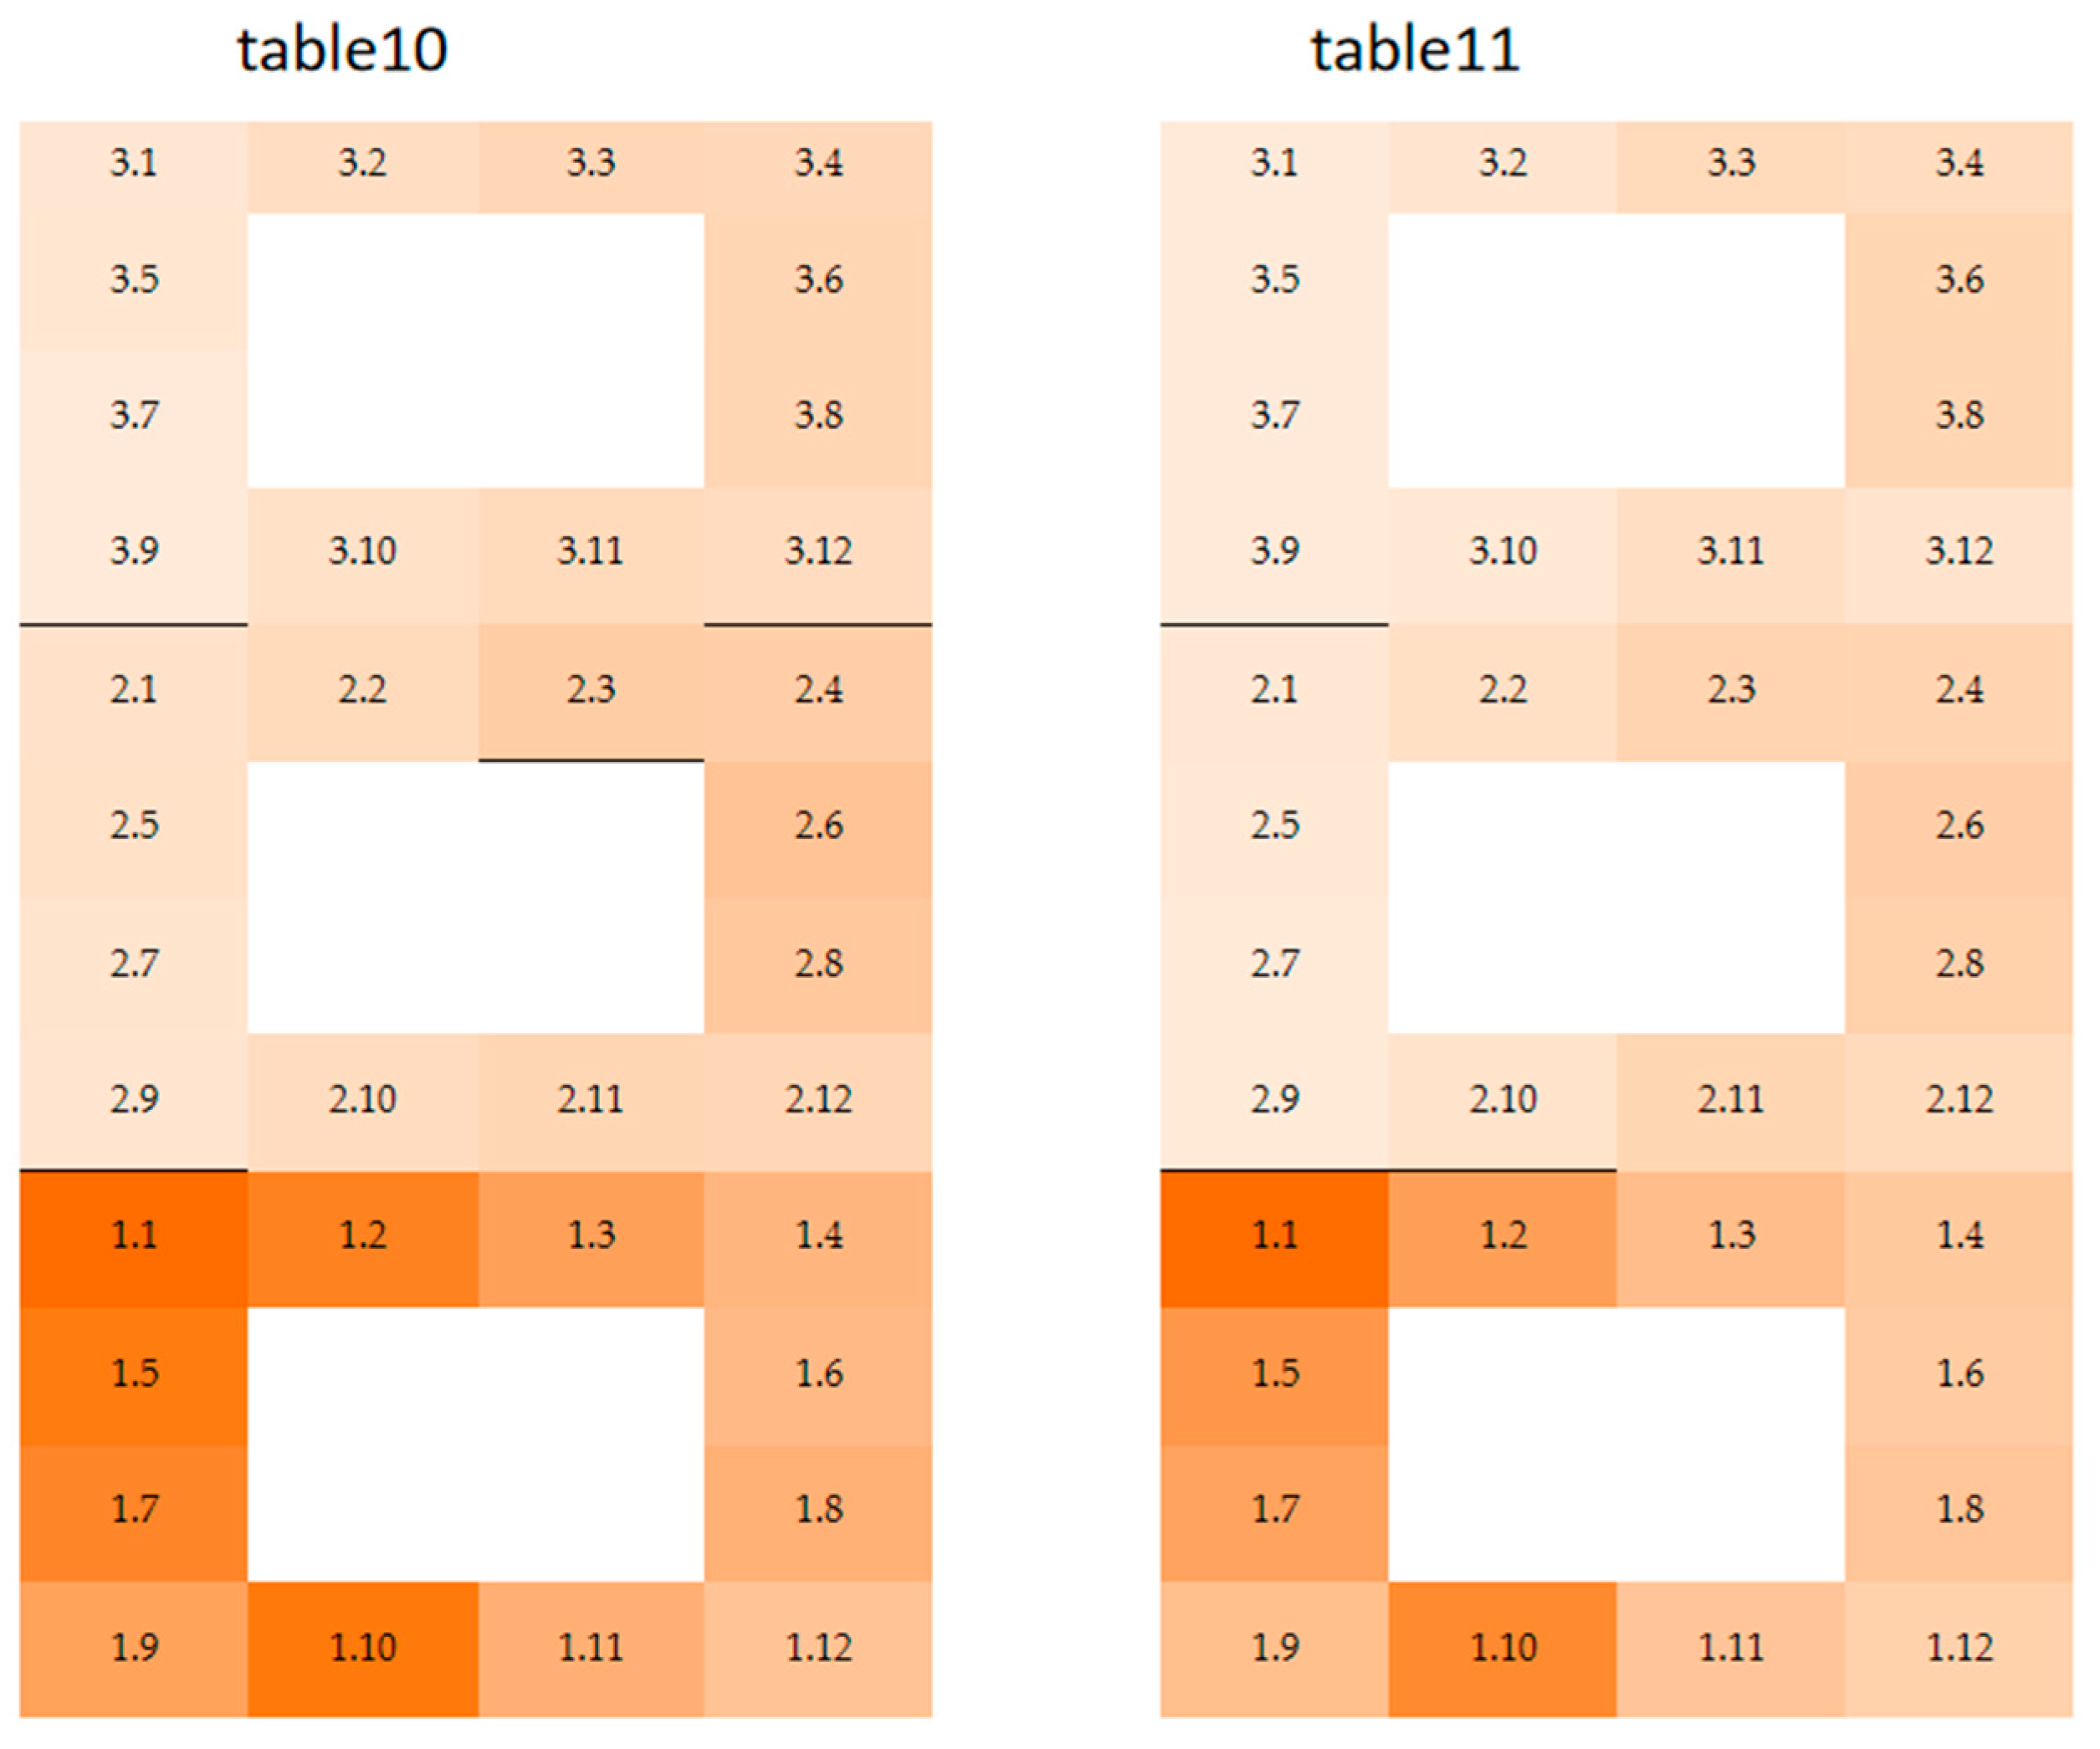
Table 4 and
Table 7 were compared, and the results are shown in
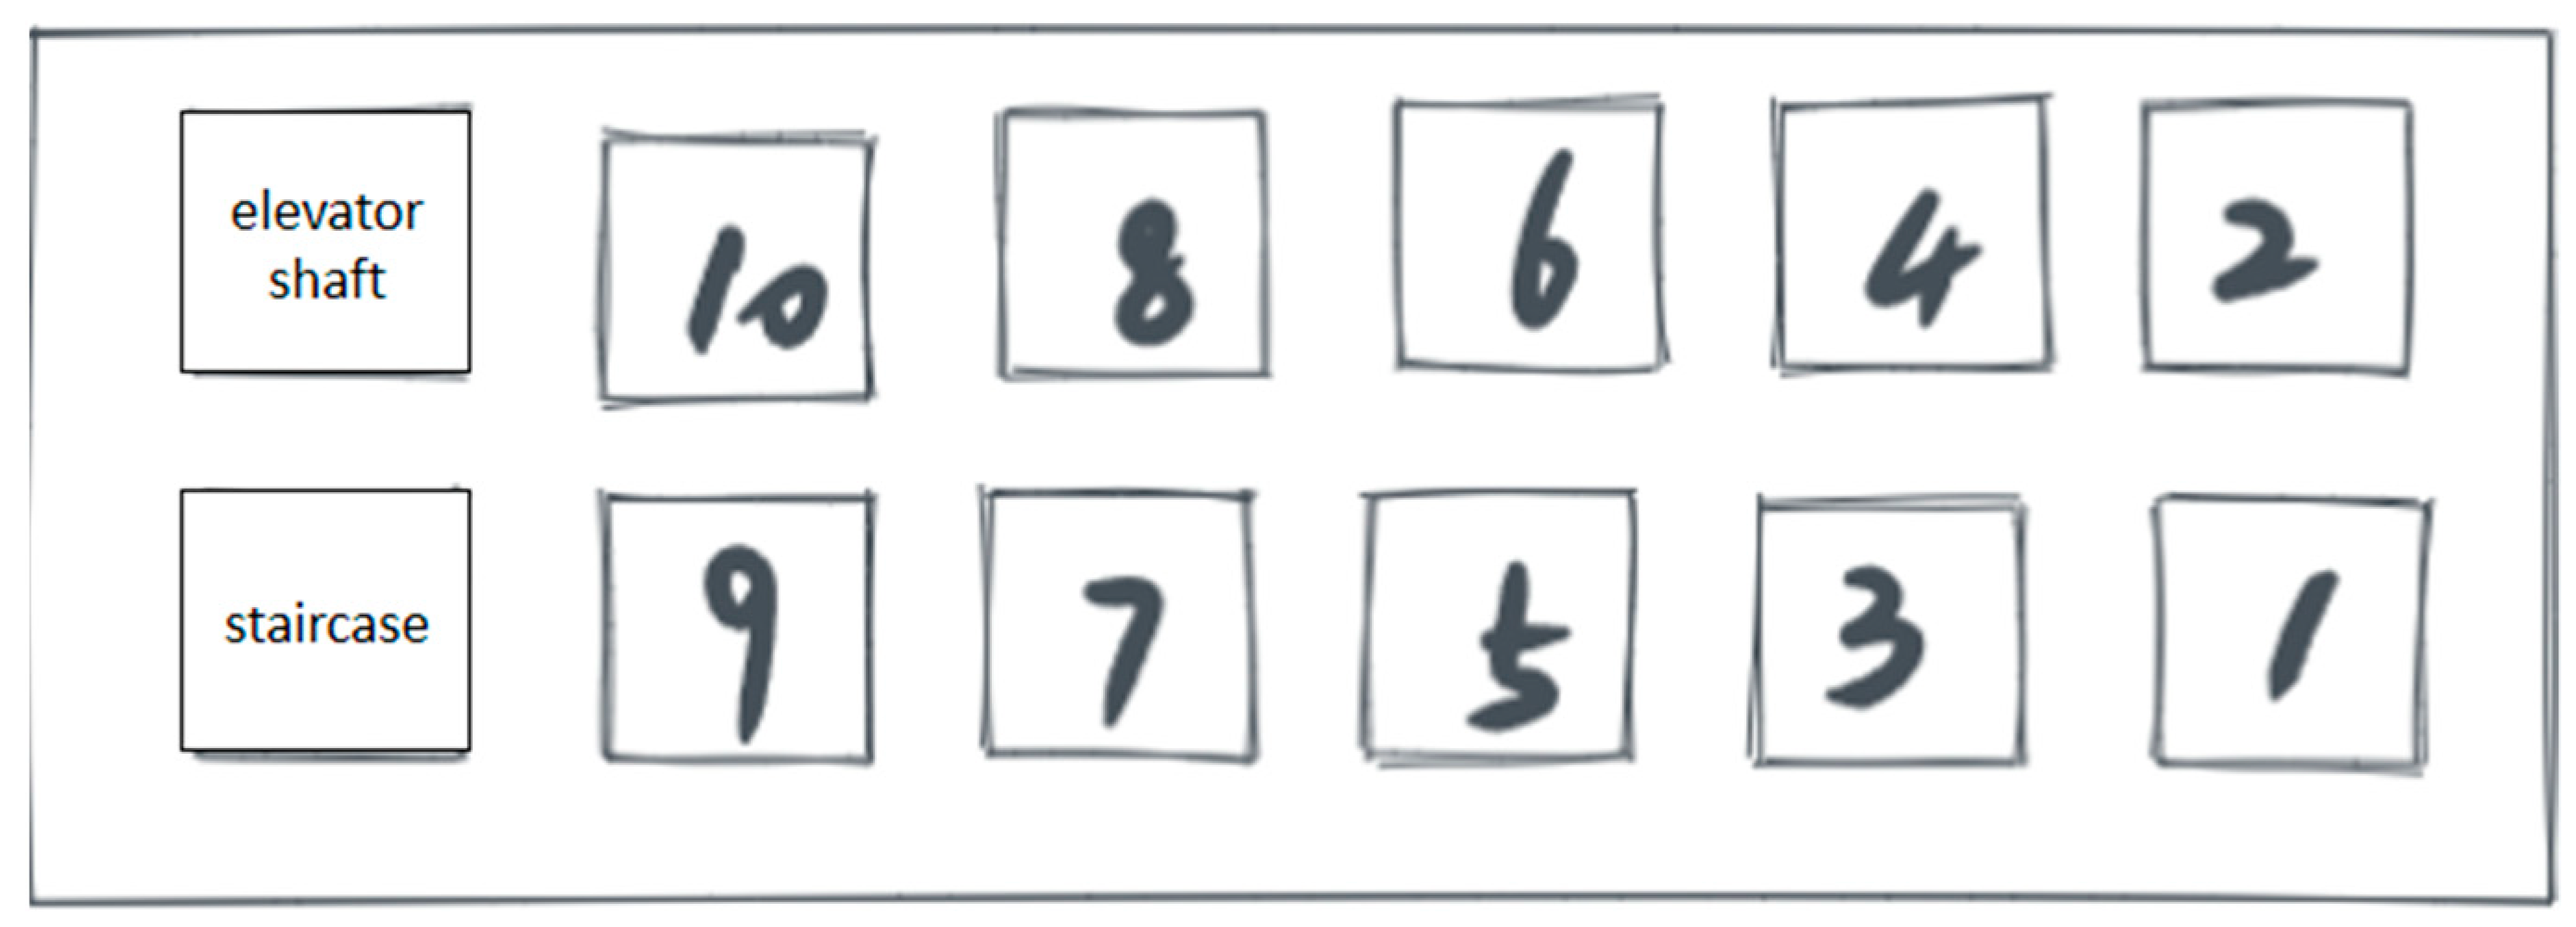
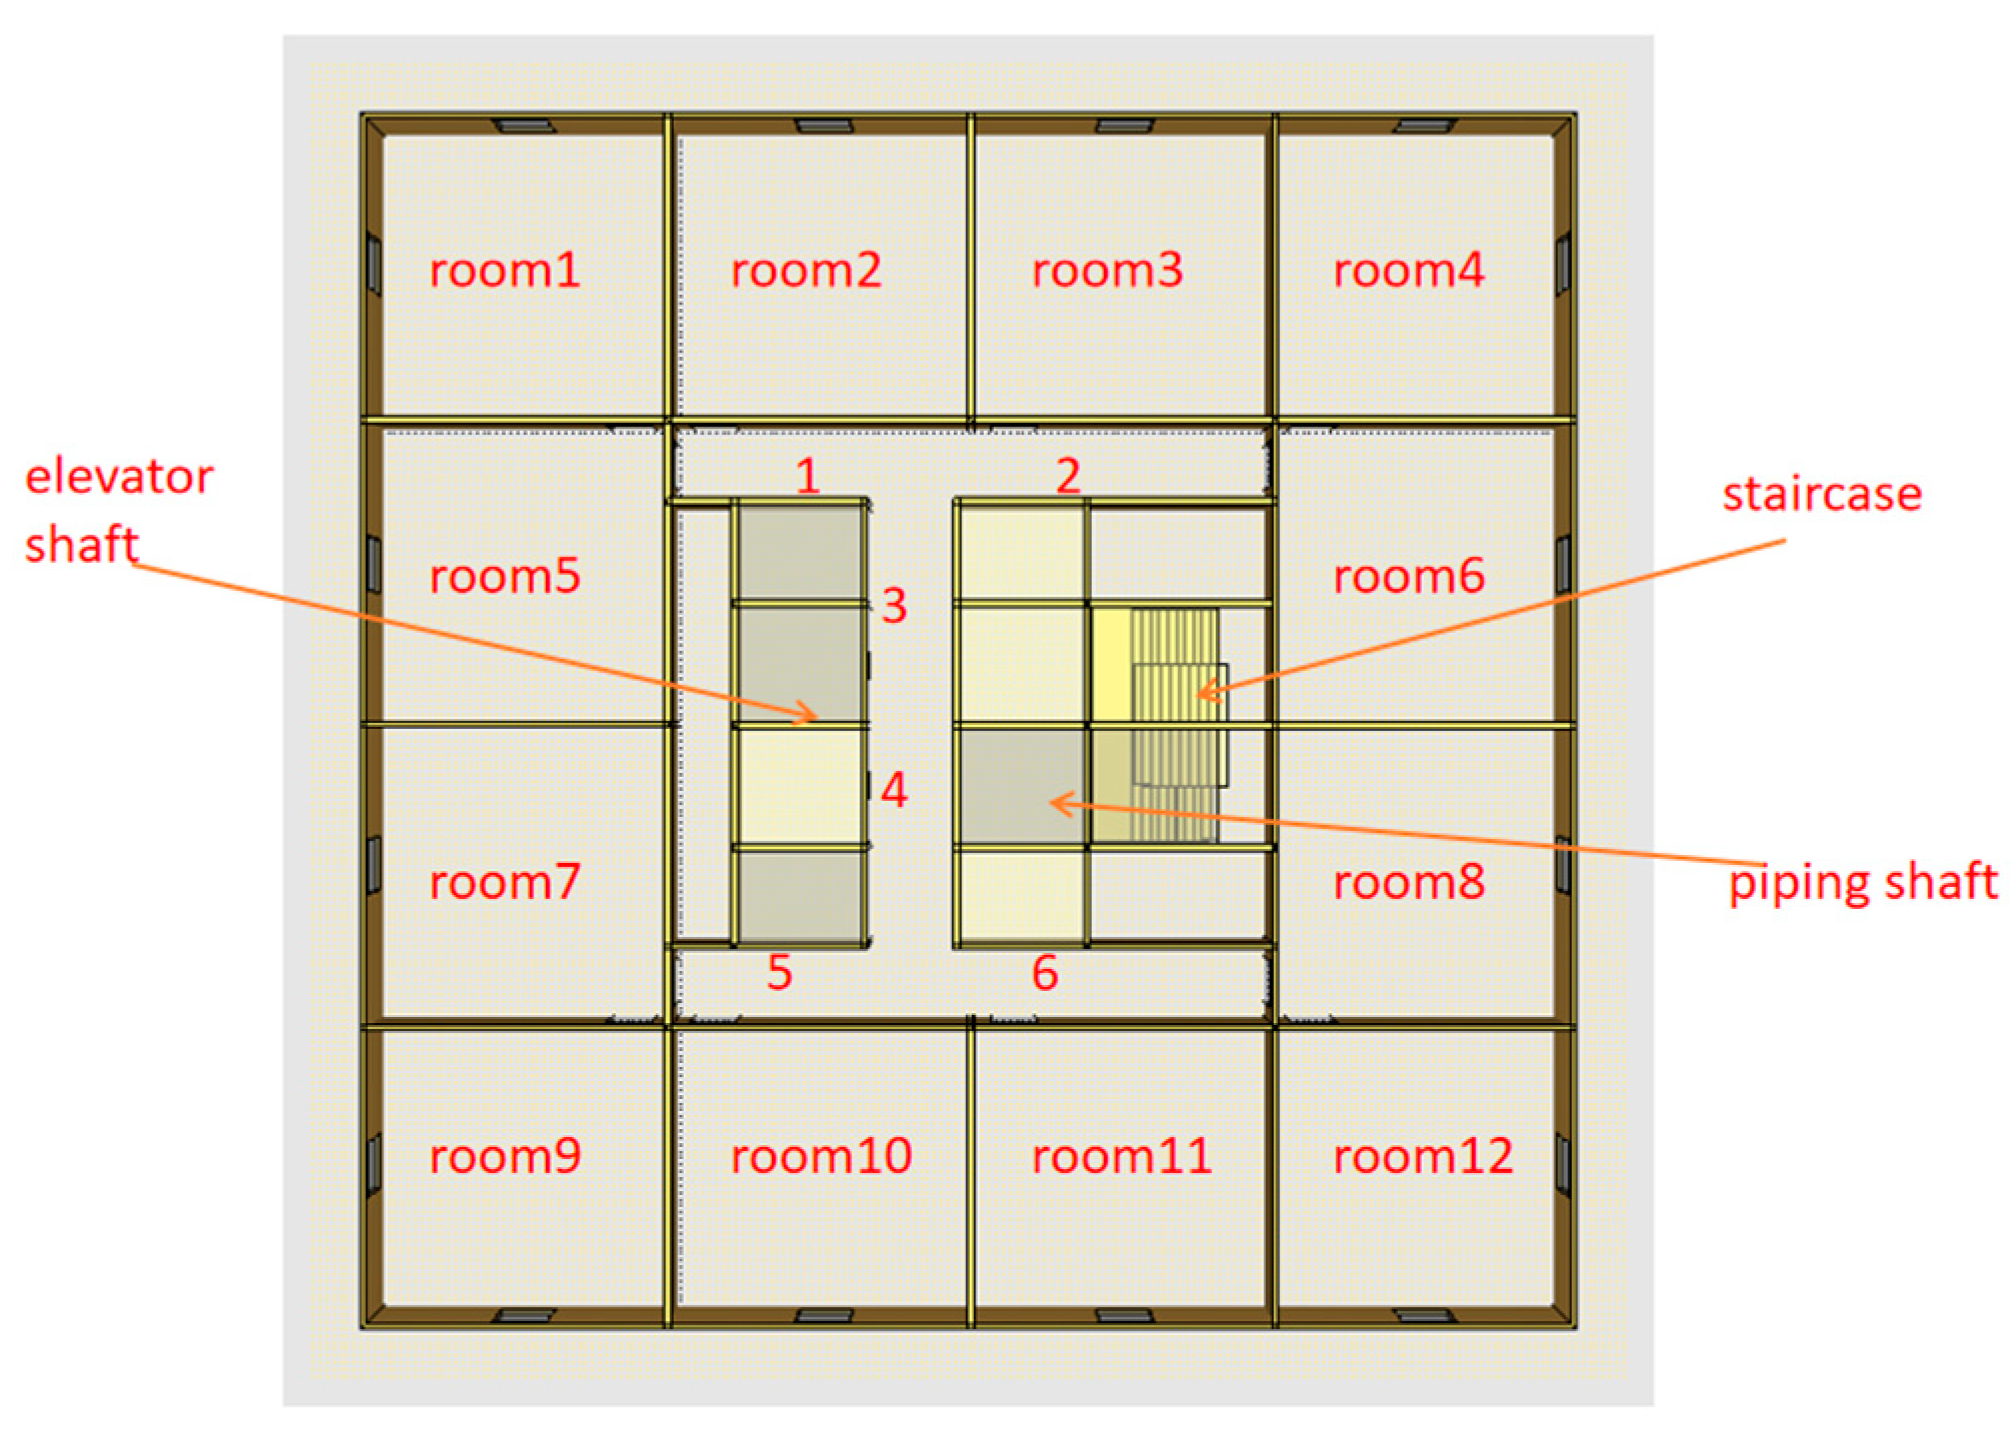
Figure 12. The spatial arrangement of the rooms is also illustrated in the figure. The darker color of the rooms or corridors in the figure indicates an earlier arrival time of the smoke. From
Figure 12, it can be seen that the predicted smoke path of this model under the same conditions is largely consistent with the experimental smoke path. However, since this model can only predict the transmission path of smoke and cannot provide specific time information, there are some differences in the color differentiation. The comparison between
Table 5 and
Table 8, as well as between
Table 6 and
Table 9, shows a similar situation. The table and figure show that smoke from the fire room flowed into other rooms on the fire floor through corridors, and smoke from the corridor entered the stairwell and then entered rooms on other floors after rising. These results were consistent with those obtained from the graph theory simulation, even when the flue gas flow channel was closed or restricted. However, the experiment revealed that the speed at which smoke from the fire floor entered the stairwell through the corridor was faster than the speed at which it entered the room. In addition, the speed at which smoke from non-fire floors entered the room through the corridor was slower than the speed at which it entered other positions in the corridor. Moreover, the speed of smoke propagation in the vertical channel was slower in the experiment than in the simulation. Although the speed difference was small, it was inconsistent with the results of the graph theory simulation. Upon analysis, we found that this was because the experiment involved doors as an obstacle, which did not impede the spread of smoke in the horizontal channels such as the corridor. In contrast, the vertical propagation of smoke in the stairwell was affected by the chimney effect. In the simulation, the nodes were considered uniform and identical, without considering the influence of the chimney effect. Although the graph theory simulation cannot fully simulate the spread of smoke, it is close to the actual situation and can be used as a tool to analyze the path of smoke spread, especially in complex calculations.


